
Debye Temperature Evaluation for Secondary Battery Cathode of α-SnxFe1−xOOH Nanoparticles Derived from the 57Fe- and 119Sn-Mössbauer Spectra

 ,
,  , ,
, ,  , and
, and
Abstract
1. Introduction
2. Results and Discussion
3. Materials and Methods
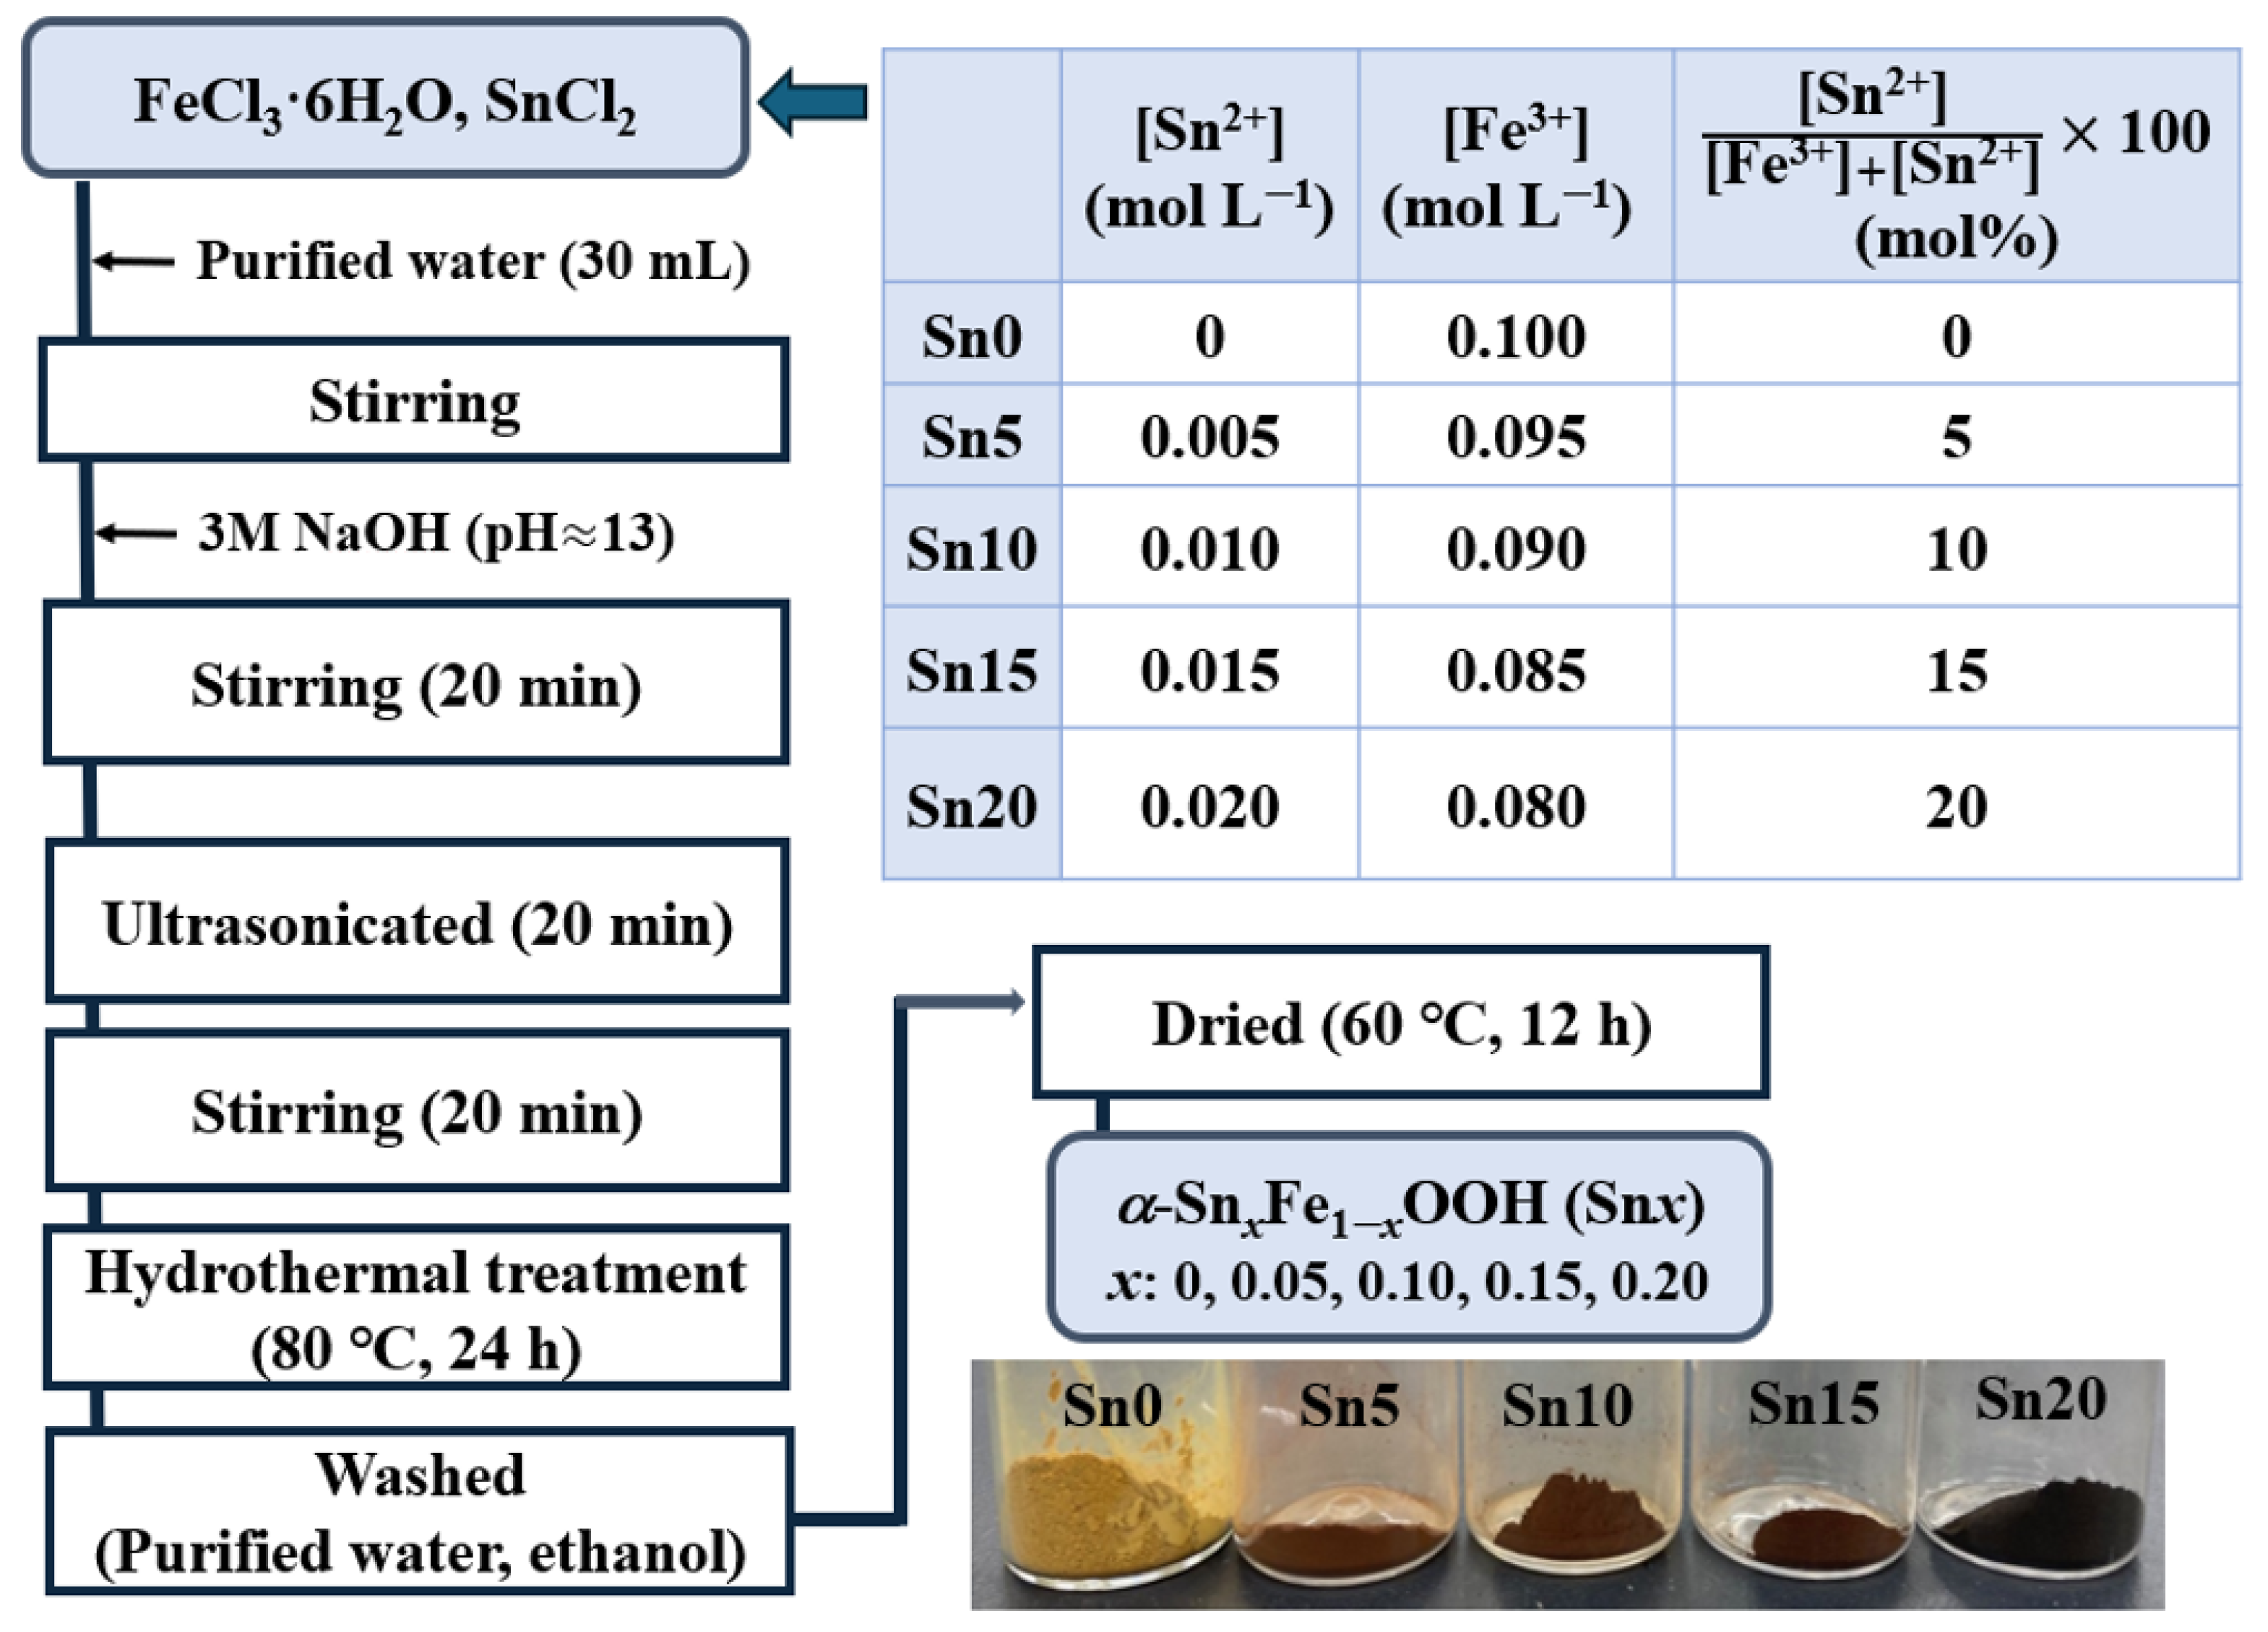
3.1. Preparation
3.1.1. α-SnxFe1-xOOH NPs
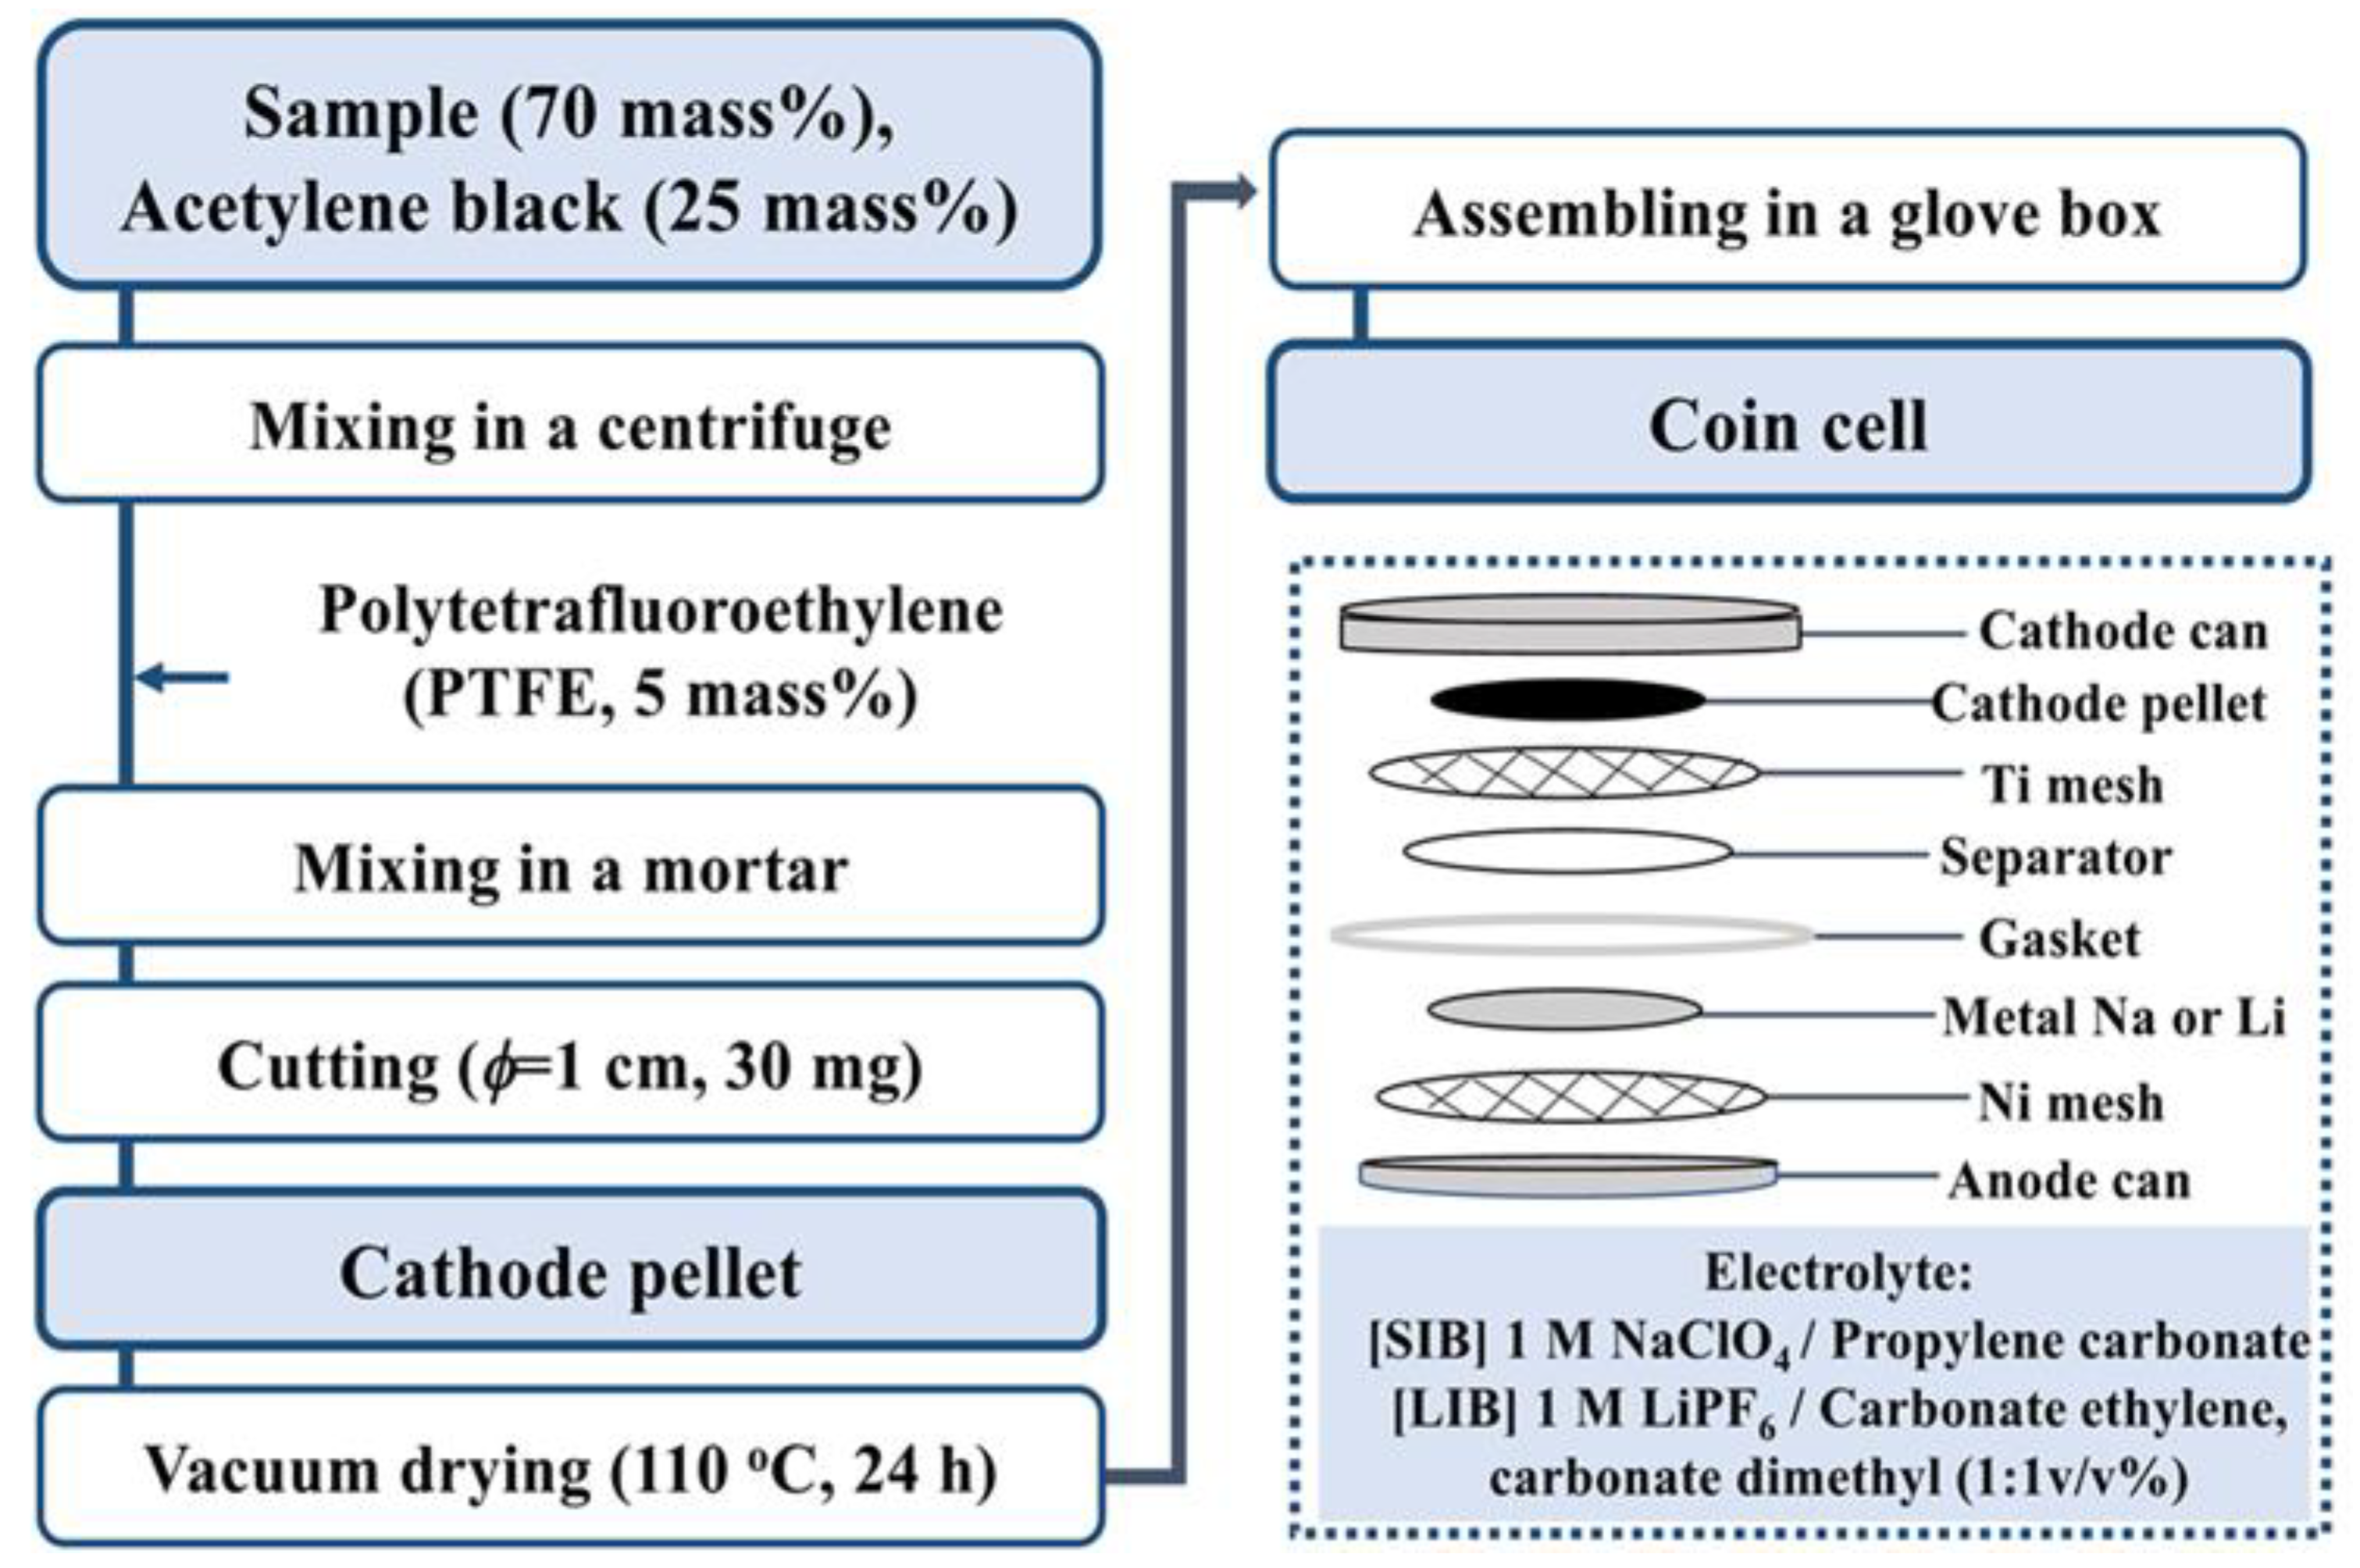
3.1.2. Li- and Na-Ion Battery Containing α-SnxFe1−xOOH NPs Cathode
3.2. Characterization
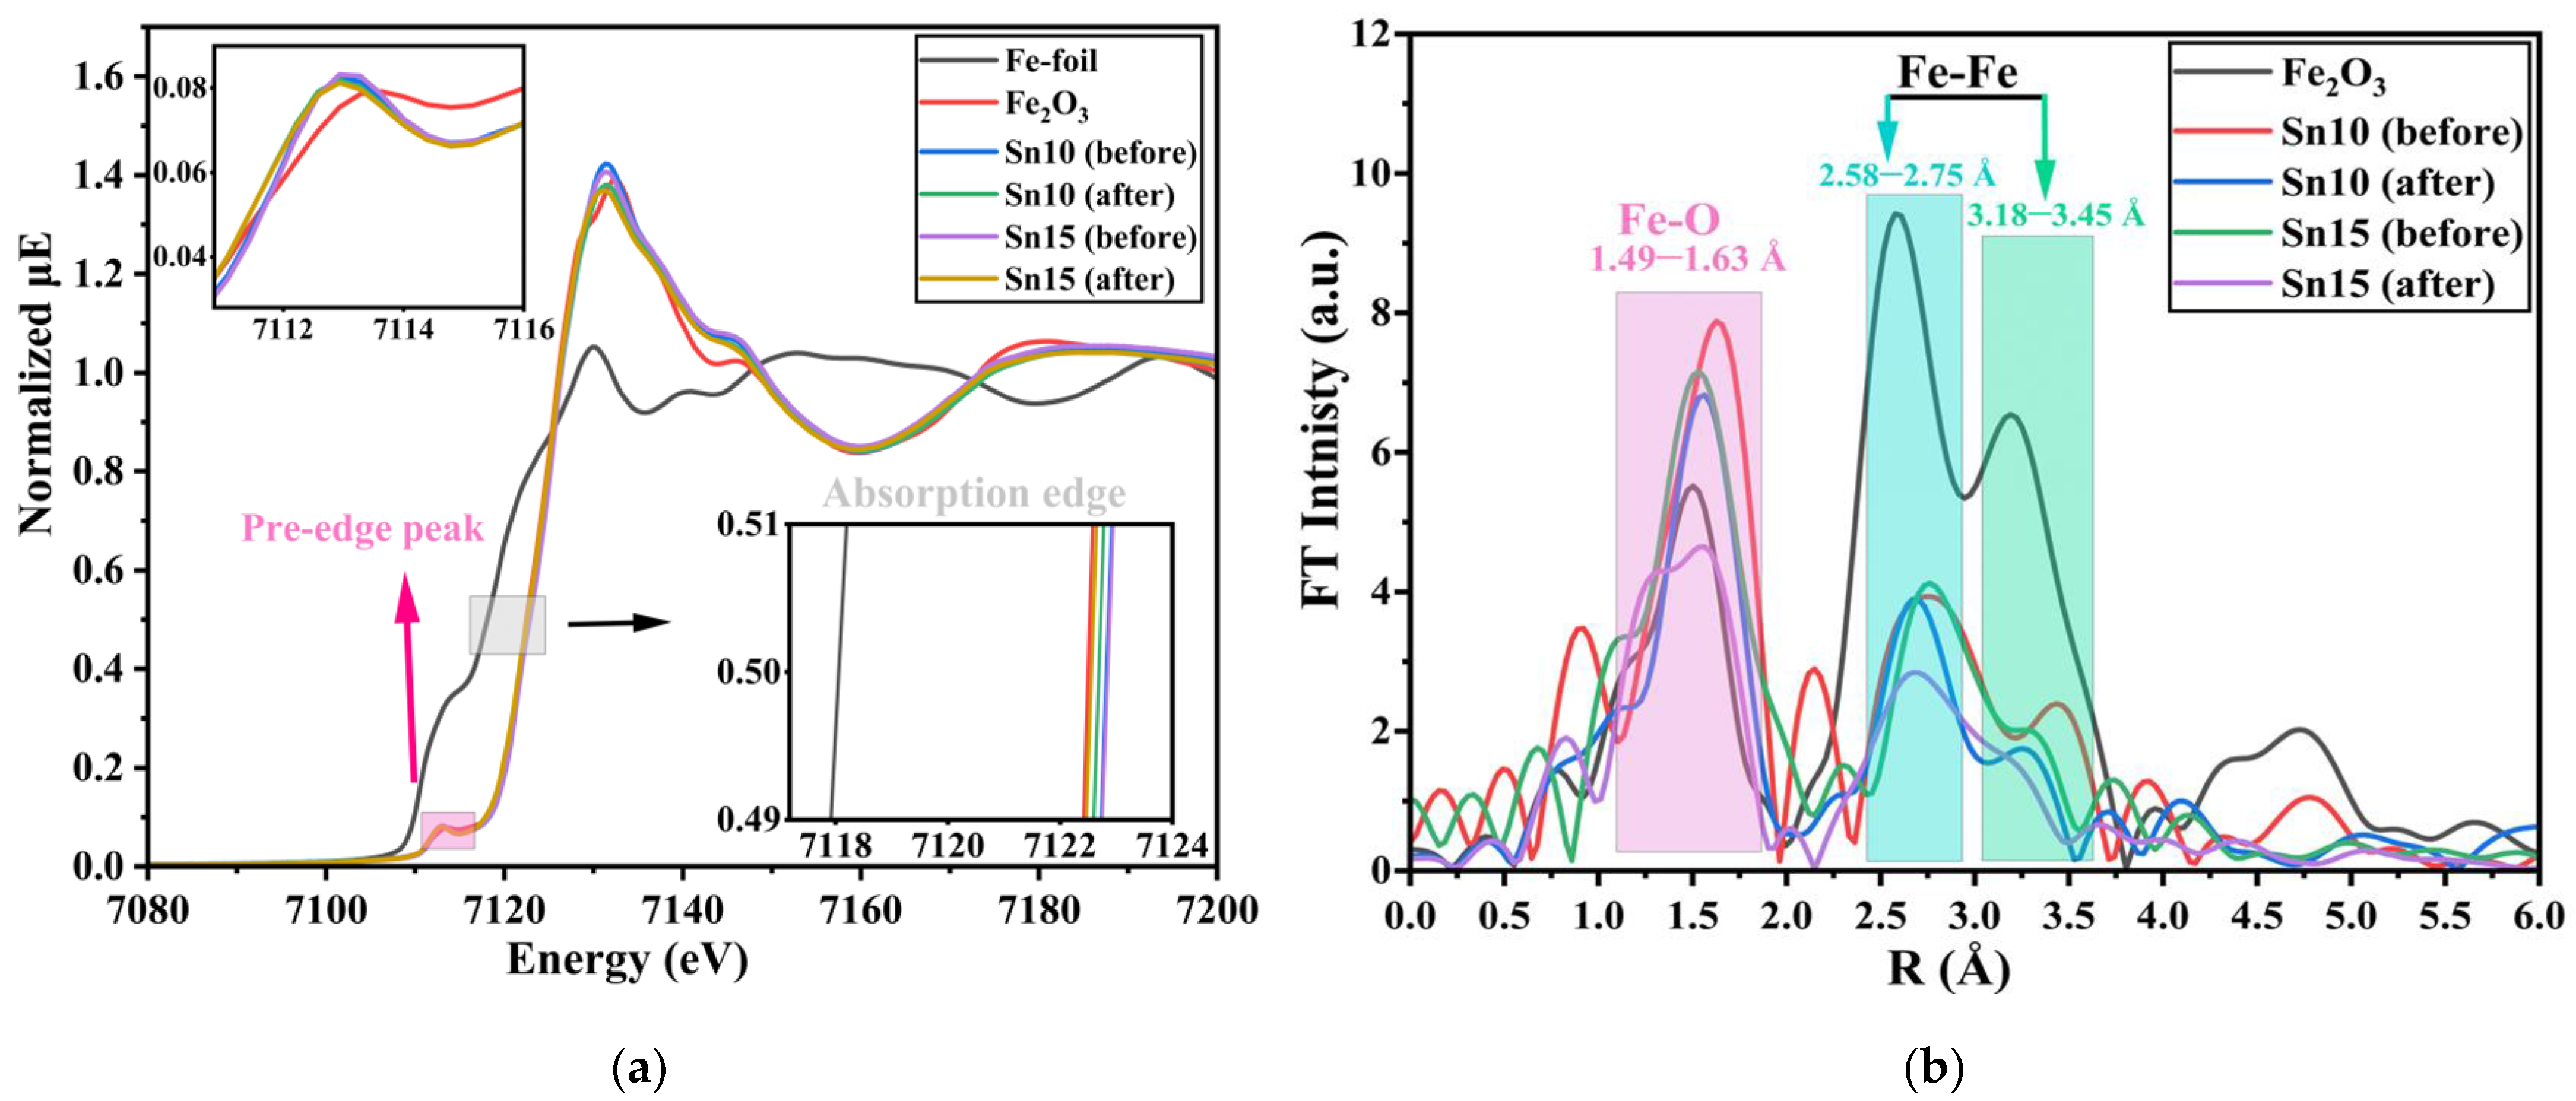
3.2.1. XAFS Spectroscopy
3.2.2. Mössbauer Spectroscopy
3.2.3. BET Surface Area Analysis
3.2.4. Electrical Impedance Spectroscopy
3.2.5. Li- and Na-Ion Battery Performances
4. Conclusions
Supplementary Materials
Author Contributions
Funding
Institutional Review Board Statement
Informed Consent Statement
Data Availability Statement
Acknowledgments
Conflicts of Interest
References
- Mukai, K.; Yamada, I. ϵ-FeOOH: A Novel Negative Electrode Material for Li- and Na-Ion Batteries. ACS Omega 2020, 5, 10115–10122. [Google Scholar] [CrossRef]
- Sudapalli, A.M.; Shimpi, N.G. Hydrothermal synthesis of α-FeOOH (1D) nanorods and their transition to α-Fe2O3 (0D): An efficient photocatalyst in neutralizing hazardous organic dyes. New J. Chem. 2023, 47, 14323–14334. [Google Scholar] [CrossRef]
- Guo, Y.; Li, C.; Gong, Z.; Guo, Y.; Wang, X.; Gao, B.; Qin, W.; Wang, G. Photocatalytic decontamination of tetracycline and Cr(VI) by a novel α-FeOOH/FeS2 photocatalyst: One-pot hydrothermal synthesis and Z-scheme reaction mechanism insight. J. Hazard. Mater. 2020, 397, 122580. [Google Scholar] [CrossRef] [PubMed]
- Li, R.; Hong, S.; Li, X.; Zhang, B.; Tian, H.; Huang, Y. Optimization of photocatalytic degradation of Cefradine using a “green” goethite/H2O2 system. J. Ind. Eng. Chem. 2019, 78, 90–96. [Google Scholar] [CrossRef]
- Walsh, D.; Zhang, J.; Regue, M.; Dassanayake, R.; Eslava, S. Simultaneous Formation of FeOx Electrocatalyst Coating within Hematite Photoanodes for Solar Water Splitting. Appl. Energy Mater. 2019, 2, 2043–2052. [Google Scholar] [CrossRef]
- Wang, L.; Nhat, T.N.; Zhang, Y.; Bi, Y.; Schmuki, P. Enhanced Solar Water Splitting by Swift Charge Separation in Au/FeOOH Sandwiched Single-Crystalline Fe2O3 Nanoflake Photoelectrodes. ChemSusChem 2017, 10, 2720–2727. [Google Scholar] [CrossRef] [PubMed]
- Sewu, D.D.; Woo, S.H.; Lee, D.S. Biochar from the co-pyrolysis of Saccharina japonica and goethite as an adsorbent for basic blue 41 removal from aqueous solution. Sci. Total Environ. 2021, 797, 149160. [Google Scholar] [CrossRef]
- Doyle, S.; Meade, E.; Gao, J.; Hagan, O.; Callan, J.F.; Garvey, M.; Fowley, C. A rapid antimicrobial photodynamic water treatment strategy utilizing a xanthene dye with subsequent removal by Goethite Nanoparticles. Chemosphere 2021, 280, 130764. [Google Scholar] [CrossRef] [PubMed]
- Godwin, J.; Abdus-Salam, N.; Haleemat, A.I.; Panda, P.K.; Panda, J.; Tripathy, B.C. Facile synthesis of rod-like α-FeOOH nanoparticles adsorbent and its mechanism of sorption of Pb(II) and indigo carmine in batch operation. Inorg. Chem. Commun. 2022, 140, 109346. [Google Scholar] [CrossRef]
- Michaud, M.; Peukert, W.; Distaso, M. An in situ study to shed light on the formation of goethite spindles by pseudomorphic transformation of intermediate phases. Powder Technol. 2023, 427, 118677. [Google Scholar] [CrossRef]
- Liu, H.; Zou, J.; Ding, Y.; Liu, B.; Wang, Y. Novel α-FeOOH corner-truncated tetragonal prisms: Crystal structure, growth mechanism and lithium storage properties. J. Appl. Electrochem. 2019, 49, 657–669. [Google Scholar] [CrossRef]
- Huang, Y.; Xie, M.; Wang, Z.; Jiang, Y.; Huang, Q.; Bai, X.; Li, L.; Wu, F.; Chen, R. All-iron sodium-ion full-cells assembled via stable porous goethite nanorods with low strain and fast kinetics. Nano Energy 2019, 60, 294–304. [Google Scholar] [CrossRef]
- Lou, X.; Wu, X.; Zhang, Y. Goethite nanorods as anode electrode materials for rechargeable Li-ion batteries. Electrochem. Commun. 2009, 11, 1696–1699. [Google Scholar] [CrossRef]
- Zhai, Y.; Ma, X.; Mao, H.; Shao, W.; Xu, L.; He, Y.; Qian, Y. Mn-Doped α-FeOOH Nanorods and α-Fe2O3 Mesoporous Nanorods: Facile Synthesis and Applications as High Performance Anodes for LIBs. Adv. Electron. Mater. 2015, 1, 1400057. [Google Scholar] [CrossRef]
- Zhai, Y.; Xu, L.; Qian, Y. Ce-doped α-FeOOH nanorods as high-performance anode material for energy storage. J. Power Sources 2016, 327, 423–431. [Google Scholar] [CrossRef]
- Zhang, B.; Khan, I.; Nagase, Y.; Ali, A.S.; Krehula, S.; Ristić, M.; Musić, S.; Kubuki, S. Highly covalent FeIII-O bonding in photo-Fenton active Sn-doped goethite nanoparticles. Mater. Chem. Phys. 2022, 287, 126247. [Google Scholar] [CrossRef]
- Ibrahim, A.; Shiraishi, M.; Homonnay, Z.; Krehula, S.; Marciuš, M.; Bafti, A.; Pavić, L.; Kubuki, S. Photocatalytic and Cathode Active Abilities of Ni-Substituted α-FeOOH Nanoparticles. Int. J. Mol. Sci. 2023, 24, 14300. [Google Scholar] [CrossRef] [PubMed]
- Guskos, N.; Papadopoulos, G.J.; Likodimos, V.; Patapis, S.; Yarmis, D.; Przepiera, A.; Przepiera, K.; Majszczyk, J.; Typek, J.; Wabia, M.; et al. Photoacoustic, EPR and electrical conductivity investigations of three synthetic mineral pigments: Hematite, goethite and magnetite. Mater. Res. Bull. 2002, 37, 1051–1061. [Google Scholar] [CrossRef]
- Bylaska, E.J.; Song, D.; Rosso, K.M. Electron transfer calculations between edge sharing octahedra in hematite, goethite, and annite. Geochim. Cosmochim. Acta 2020, 291, 79–91. [Google Scholar] [CrossRef]
- Porter, I.J.; Cushing, S.K.; Carneiro, L.M.; Lee, A.; Ondry, J.C.; Dahl, J.C.; Chang, H.T.; Alivisatos, A.P.; Leone, S.R. Photoexcited small polaron formation in goethite (α-FeOOH) nanorods probed by transient extreme ultraviolet spectroscopy. J. Phys. Chem. Lett. 2018, 9, 4120–4124. [Google Scholar] [CrossRef] [PubMed]
- Alexandrov, V.; Rosso, K.M. Electron transport in pure and substituted iron oxyhydroxides by small-polaron migration. J. Chem. Phys. 2014, 140, 234701. [Google Scholar] [CrossRef]
- Patil, M.R.; Keche, A.P.; Khirade, P.P.; Raut, A.V.; Pandit, A.A.; Jadhav, K.M. Structural, morphological, and electrical investigation of 50 Mrad γ-radiated Ni1−xCdxFe2O4 nanoparticles. Mater. Today Proc. 2022, 67, 85–91. [Google Scholar] [CrossRef]
- Liu, X.; Zhao, S.; Meng, Y. Mössbauer Spectroscopy of Iron Carbides: From Prediction to Experimental Confirmation. Sci. Rep. 2016, 6, 26184. [Google Scholar] [CrossRef]
- Shinoda, K.; Kobayashi, Y. An Intensity Tensor and Electric Field Gradient Tensor for Fe3+ at M1 Sites of Aegirine–Augite Using Single-Crystal Mössbauer Spectroscopy. Minerals 2023, 13, 1452. [Google Scholar] [CrossRef]
- Scrimshire, A.; Lobera, A.; Bell AM, T.; Jones, A.H.; Sterianou, I.; Folder, S.D.; Bingham, P.A. Determination of Debye temperatures and Lamb-Mossbauer factors of LnFeO3 ortho ferrite perovskites. J. Phys. Cond. Matt. 2018, 30, 105704. [Google Scholar] [CrossRef]
- Zhang, H.L. Advances of ferrous and ferric Mössbauer recoilless fractions in minerals and glasses. Geoscence. Front. 2022, 13, 101316. [Google Scholar] [CrossRef]
- Spitsyna, N.G.; Ovanesyan, N.S.; Blagov, M.A. A Comparative Study of Nitrate and Iodide of the Spin-Variable Iron(III) Cation with the N4O2 Coordination Sphere by Mössbauer Spectroscopy. Russ. J. Phys. Chem. B 2022, 16, 565–571. [Google Scholar] [CrossRef]
- Nishida, T. 57Fe-Mössbauer effect and 119Sn-Mössbauer effect of Oxide Glasses. J. Radioanal. Nucl. Chem. 1994, 182, 451. [Google Scholar] [CrossRef]
- El-Ghazzawy, E.H.; Zakaly, H.M.H.; Alrowaily, A.W.; Saafan, S.A.; Ene, A.; Abo-aita, N.M.; Darwish, M.A.; Zhou, D.; Atlam, A.S. Delving into the properties of nanostructured Mg ferrite and PEG composites: A comparative study on structure, electrical conductivity, and dielectric relaxation. Heliyon 2023, 9, e19745. [Google Scholar] [CrossRef]
- Özer, T. Investigation of pressure dependence of anisotropy and elastic modulus of SbSI compound in ferroelectric phase by Ab initio method. Mater. Sci. Eng. B 2023, 297, 116787. [Google Scholar] [CrossRef]
- Mourdikoudis, S.; Pallares, R.M.; Thanh, N.T.K. Characterization techniques for nanoparticles: Comparison and complementarity upon studying nanoparticle properties. Nanoscale 2018, 10, 12871–12934. [Google Scholar] [CrossRef]
- Khan, I.; Saeed, K.; Khan, I. Nanoparticles: Properties, applications and toxicities. Arab. J. Sci. Eng. 2019, 12, 908–931. [Google Scholar] [CrossRef]
- Vilà, G.C.; Salvador, P. Accurate 57Fe Mössbauer Parameters from General Gaussian Basis Sets. J. Chem. Theory Comput. 2021, 17, 7724–7773. [Google Scholar] [CrossRef]
- Gütlich, P. Fifty Years of Mössbauer Spectroscopy in Solid State Research—Remarkable Achievements, Future Perspectives. Chem. 2012, 638, 15–43. [Google Scholar] [CrossRef]
- Liu, K.; Rykov, A.I.; Wang, J.; Zhang, T. Chapter One-Recent Advances in the Application of Mössbauer Spectroscopy in Heterogeneous Catalysis. Adv. Catal. 2015, 58, 1–142. [Google Scholar] [CrossRef]
- Pankhurst, Q.A.; Johnson, C.E.; Thomas, M.F. A Mossbauer study of magnetic phase transitions in alpha-Fe2O3 crystals. J. Phys. C Solid State Phys. 1986, 19, 7081. [Google Scholar] [CrossRef]
- Genuzio, F.; Sala, A.; Schmidt, T.; Menzel, D.; Freund, H.J. Interconversion of α-Fe2O3 and Fe3O4 Thin Films: Mechanisms, Morphology, and Evidence for Unexpected Substrate Participation. J. Phys. Chem. C 2014, 118, 29068–29076. [Google Scholar] [CrossRef]
- Naveas, N.; Pulido, R.; Marini, C.; Gargiani, P.; Montelongo, J.H.; Brito, I.; Silván, M.M. First-Principles Calculations of Magnetite (Fe3O4) above the Verwey Temperature by Using Self-Consistent DFT + U + V. J. Chem. Theory Comput. 2023, 19, 8610–8623. [Google Scholar] [CrossRef] [PubMed]
- Ibrahim, A.; Arita, Y.; Ali, A.S.; Khan, I.; Zhang, B.; Razum, M.; Pavić, L.; Santić, A.; Homonnay, Z.; Kuzmann, E.; et al. Impact of adding Fe ions on the local structure and electrochemical performance of P2O5–V2O5 glass and glass ceramics used as a cathode in LIBs. J. Phys. Chem. Solids 2023, 179, 111391. [Google Scholar] [CrossRef]
- Zhang, Y.; Bakenov, Z.; Tan, T.; Huang, J. Synthesis of Core-Shell Carbon Encapsulated Fe2O3 Composite through a Facile Hydrothermal Approach and Their Application as Anode Materials for Sodium-Ion Batteries. Metals 2018, 8, 461. [Google Scholar] [CrossRef]
- Wu, H.; Wang, C.; Kwon, J.; Huang, J.; Choi, Y.; Lee, J. Synthesis of 2D and 3D hierarchical β-FeOOH nanoparticles consisted of ultrathin nanowires for efficient hexavalent chromium removal. Appl. Surf. Sci. 2021, 543, 148823. [Google Scholar] [CrossRef]
- Barsotti, E.; Tan, S.P.; Piri, M.; Chen, J.H. Capillary-condensation hysteresis in naturally occurring nanoporous media. Fuel 2020, 263, 116441. [Google Scholar] [CrossRef]
- Luo, F.; Roy, A.; Silvioli, L.; Cullen, D.A.; Zitolo, A.; Sougrati, M.T.; Oguz, I.C.; Mineva, T.; Teschner, D.; Wagner, S.; et al. P-block single-metal-site tin/nitrogen-doped carbon fuel cell cathode catalyst for oxygen reduction reaction. Nat. Mater. 2020, 19, 1215–1223. [Google Scholar] [CrossRef]
- Willgeorth, S.; Ulrich, H.; Hesse, J. Search for 2 States in FCC Iron Alloys by Investigation of the 57-Fe Isomer Shift in the Paramagnetic State. J. Phys. F Met. Phys. 1984, 14, 387–397. [Google Scholar] [CrossRef]
- Shrivastava, K.N. Temperature Dependence of the Isomer Shift. Hyperfine Interact. 1985, 24–26, 817–845. [Google Scholar] [CrossRef]
- Steudel, F.; Johnson, J.A.; Johnson, C.E.; Schweizer, S. Characterization of Luminescent Materials with 151Eu Mössbauer Spectroscopy. Materials 2018, 11, 828. [Google Scholar] [CrossRef]
- Pereira, A.G.; Porto, A.O.; de Lima, G.M.; Siebald, H.G.L.; Ardisson, J.D. 119Sn Mössbauer spectroscopic study of nanometric tin dioxide powders prepared by pyrolysis of organotin oxides. Solid State Commun. 2003, 127, 223–227. [Google Scholar] [CrossRef]
- Zhang, X.; Li, W.; Wu, D.; Xu, H.; Deng, Y. The size-shape dependent Debye temperature, melting entropy and melting enthalpy theoretical models for metallic nanomaterial. Mater. Sci. Eng. B 2023, 297, 116777. [Google Scholar] [CrossRef]
- Pavić, L.; Skoko, Ž.; Gajović, A.; Su, D.; Milanković, A.M. Electrical transport in iron phosphate glass-ceramics. J. Non-Cryst. Solids. 2018, 502, 44–53. [Google Scholar] [CrossRef]
- Milanković, A.M.; Pavić, L.; Ertap, H.; Karabulut, M. Polaronic mobility in boron doped iron phosphate glasses: Influence of structural disorder on summerfield scaling. J. Am. Ceram. Soc. 2012, 95, 2007–2014. [Google Scholar] [CrossRef]
- Su, N.; Sun, M.; Wang, Q.; Jin, J.; Sui, J.; Liu, C.; Gao, C. Pressure-induced mixed protonic-electronic to pure electronic conduction transition in goethite. J. Phys. Chem. C 2021, 125, 2713–2718. [Google Scholar] [CrossRef]
- Aroutiounian, V.M.; Arakelyan, V.M.; Shahnazaryan, G.E.; Hovhannisyan, H.R.; Wang, H.; Turner, J.A. Photoelectrochemistry of tin-doped iron oxide electrodes. Solar Energy 2007, 81, 1369–1376. [Google Scholar] [CrossRef]
- Zhao, Z.; Su, H.; Li, S.; Li, C.; Liu, Z.; Li, D. Ball-in-ball structured SnO2@FeOOH@C nanospheres toward advanced anode material for sodium ion batteries. J. Alloys Compd. 2020, 838, 155394. [Google Scholar] [CrossRef]
- Ibrahim, A.; Watanabe, S.; Razum, M.; Pavić, L.; Homonnay, Z.; Kuzmann, E.; Hassaan, M.Y.; Kubuki, S. Structural, Electrical, and Electrochemical Properties of a Na2O-V2O5 Ceramic Nanocomposite as an Active Cathode Material for a Na-Ion Battery. Crystals 2023, 13, 1521. [Google Scholar] [CrossRef]
- Moustafa, M.G.; Aboraia, A.M.; Butova, V.V.; Elmasry, F.; Guda, A.A. Facile synthesis of ZnNC derived from a ZIF-8 metal-organic framework by the microwave-assisted solvothermal technique as an anode material for lithium-ion batteries. New J. Chem. 2022, 46, 9138–9145. [Google Scholar] [CrossRef]
- Abbasi, A.; Mirhabibi, A.; Arabi, H.; Golmohammad, M.; Brydson, R. Synthesis, characterization and electrochemical performances of γ-Fe2O3 cathode material for Li-ion batteries. J. Mater. Sci. Mater. Electron. 2016, 27, 7953–7961. [Google Scholar] [CrossRef]
- Ibrahim, A.; Kubo, K.; Watanabe, S.; Shiba, S.; Khan, I.; Zhang, B.; Homonnay, Z.; Kuzmann, E.; Pavić, L.; Santić, A.; et al. Enhancement of electrical conductivity and thermal stability of Iron- or Tin- substituted vanadate glass and glass-ceramics nanocomposite to be applied as a high-performance cathode active material in sodium-ion batteries. J. Alloys Compd. 2023, 930, 167366. [Google Scholar] [CrossRef]
- Golmohammad, M.; Mirhabibi, A.; Golestanifard, F.; Kelder, E.M. Optimizing Synthesis of Maghemite Nanoparticles as an Anode for Li-Ion Batteries by Exploiting Design of Experiment. J. Electron. Mater. 2016, 45, 426–434. [Google Scholar] [CrossRef]
- Aboraia, A.M.; Moustafa, M.G.; Shapovalov, V.V.; Guda, A.A.; Elmasry, F.; Soldatov, A. Enhancement of the electrochemical performance of LiCoPO4 by Fe doping. Ceram. Int. 2021, 47, 31826–31833. [Google Scholar] [CrossRef]


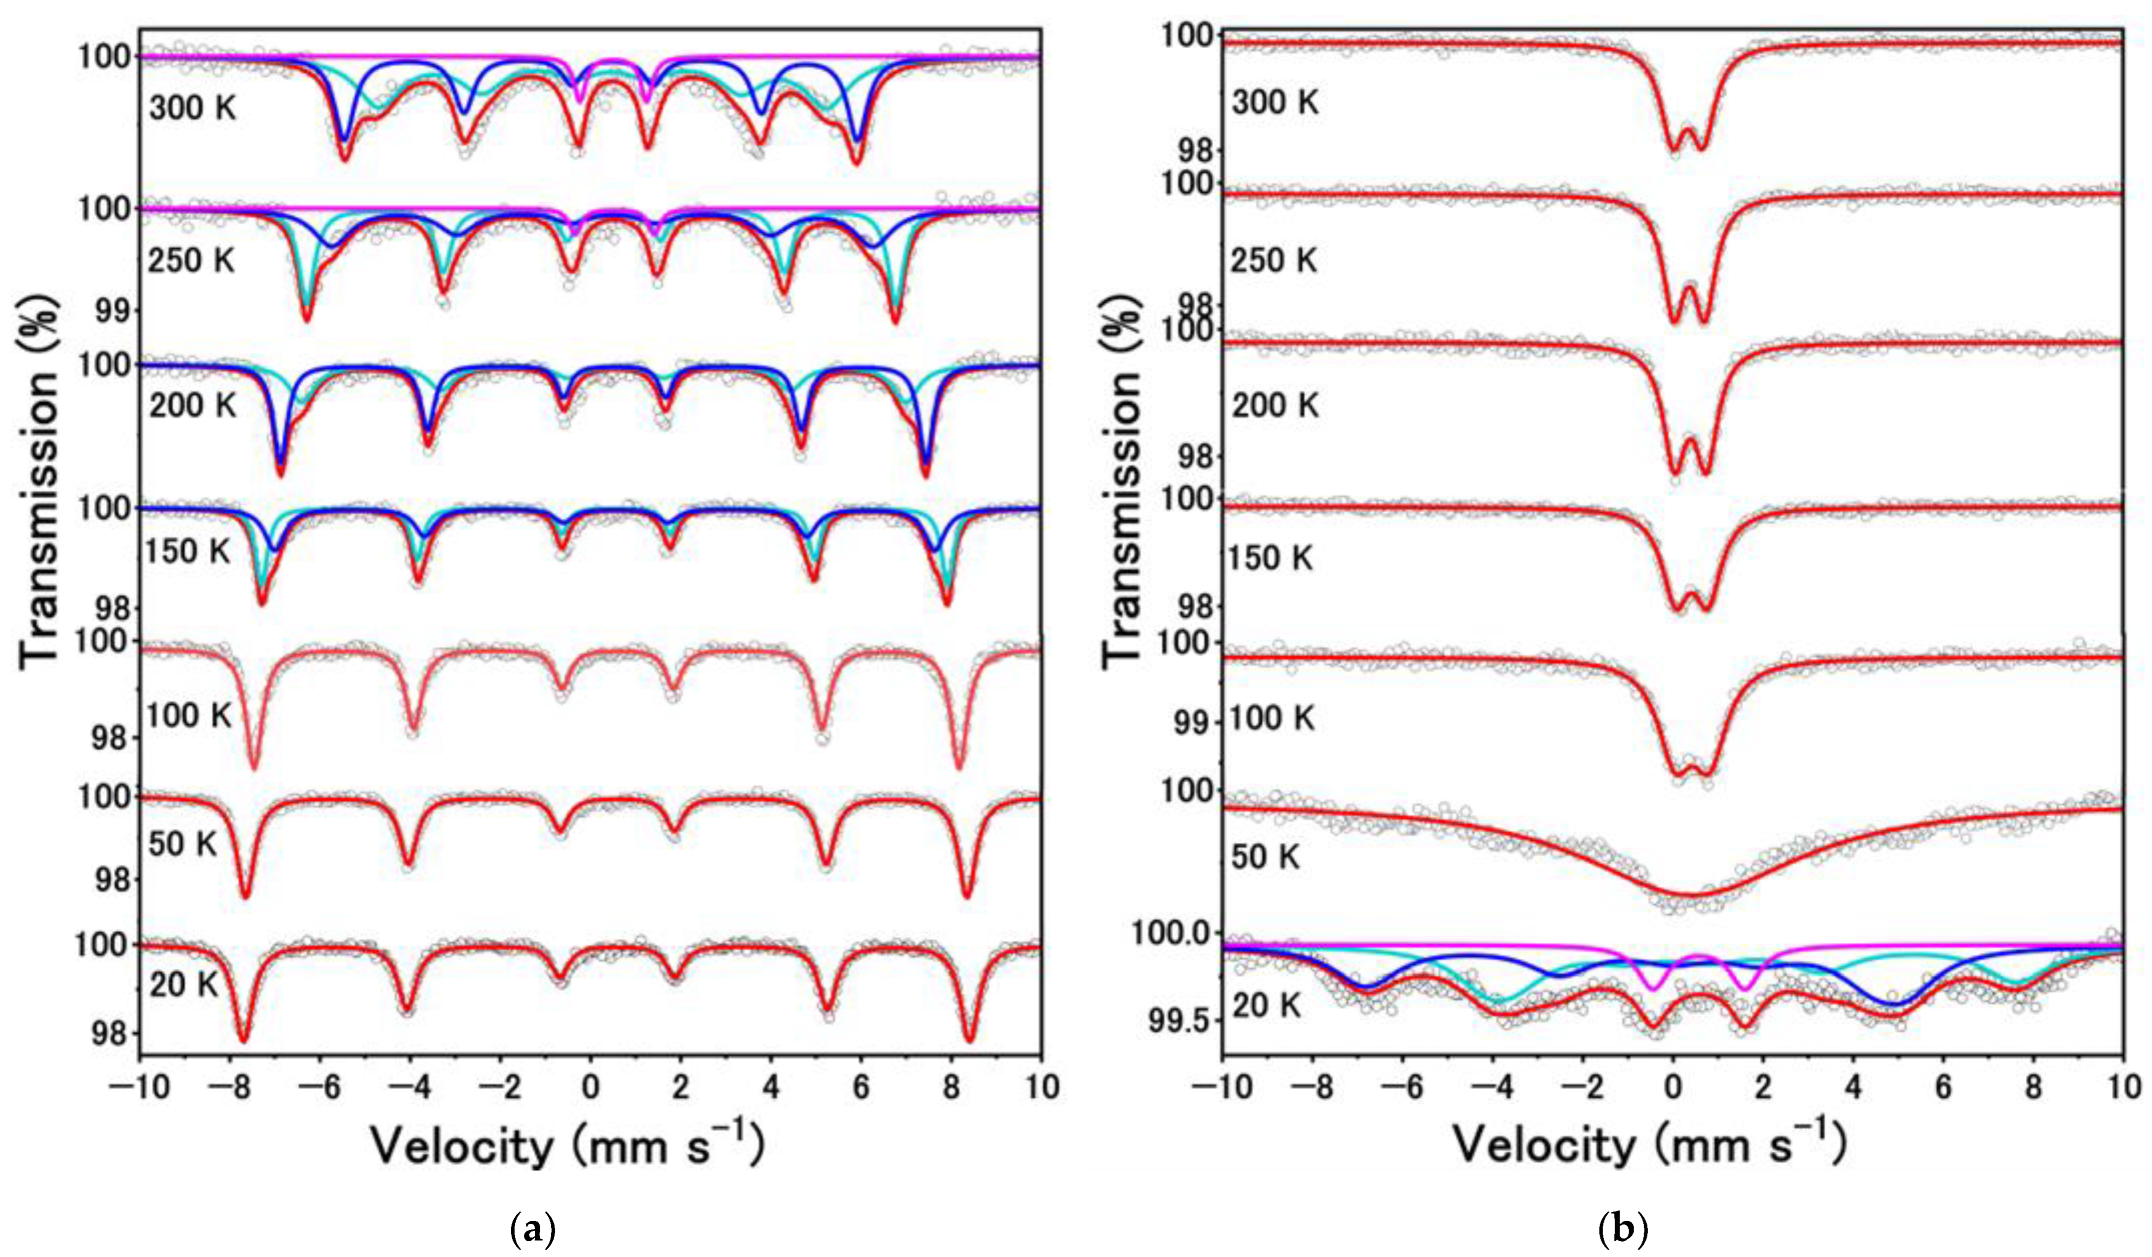
| T (K) | A (%) | δ (mm s−1) | ∆ (mm s−1) | Hint (T) | Г (mm s−1) | Phase |
|---|---|---|---|---|---|---|
| 300 | 55.6 | 0.38±0.03 | −0.19±0.04 | 31.0±0.32 | 1.26±0.08 | Goethite |
| 38.2 | 0.37±0.01 | −0.26±0.02 | 35.4±0.07 | 0.53±0.04 | Goethite | |
| 6.3 | 0.49±0.01 | 1.47±0.02 | - | 0.27±0.03 | Superparamagnetic | |
| 250 | 49.5 | 0.38±0.01 | −0.28±0.01 | 40.7±0.04 | 0.42±0.02 | Goethite |
| 45.3 | 0.39±0.02 | −0.25±0.04 | 37.3±0.28 | 0.99±0.07 | Goethite | |
| 5.2 | 0.54±0.02 | 1.75±0.04 | - | 0.32±0.05 | Superparamagnetic | |
| 200 | 41.9 | 0.43±0.01 | −0.26±0.02 | 41.7±0.13 | 0.70±0.04 | Goethite |
| 58.1 | 0.41±0.01 | −0.25±0.01 | 44.5±0.03 | 0.37±0.01 | Goethite | |
| 150 | 51.8 | 0.44±0.01 | −0.25±0.01 | 47.3±0.08 | 0.31±0.01 | Goethite |
| 48.2 | 0.44±0.01 | −0.24±0.01 | 45.5±0.10 | 0.53±0.02 | Goethite | |
| 100 | 100 | 0.46±0.01 | −0.25±0.01 | 48.7±0.01 | 0.43±0.01 | Goethite |
| 50 | 100 | 0.47±0.01 | −0.24±0.01 | 49.7±0.01 | 0.46±0.01 | Goethite |
| 20 | 100 | 0.47±0.01 | −0.24±0.01 | 50.0±0.01 | 0.48±0.01 | Goethite |
| T (K) | A (%) | δ (mm s−1) | ∆ (mm s−1) | Hint (T) | Г (mm s−1) | Phase |
|---|---|---|---|---|---|---|
| 300 | 100 | 0.33±0.00 | −0.67±0.01 | - | 0.65±0.01 | Superparamagnetic |
| 250 | 100 | 0.37±0.00 | 0.69±0.01 | - | 0.58±0.01 | Superparamagnetic |
| 200 | 100 | 0.39±0.00 | 0.71±0.01 | - | 0.61±0.01 | Superparamagnetic |
| 150 | 100 | 0.42±0.00 | 0.72±0.01 | - | 0.73±0.01 | Superparamagnetic |
| 100 | 100 | 0.43±0.01 | −0.76±0.01 | - | 0.93±0.02 | Superparamagnetic |
| ** 50 | 100 | 0.41±0.02 | 0.00±158 | - | 5.93±0.41 | - |
| 20 | 42.3 | 0.84±0.04 | 1.86±0.10 | 36.4±0.23 | 1.81±0.12 | Unknown |
| 46.4 | 0.05±0.04 | −1.78±0.08 | 37.2±0.20 | 1.76±0.11 | Unknown | |
| 11.3 | 0.57±0.02 | 2.04±0.04 | 0.80±0.06 | Superparamagnetic |
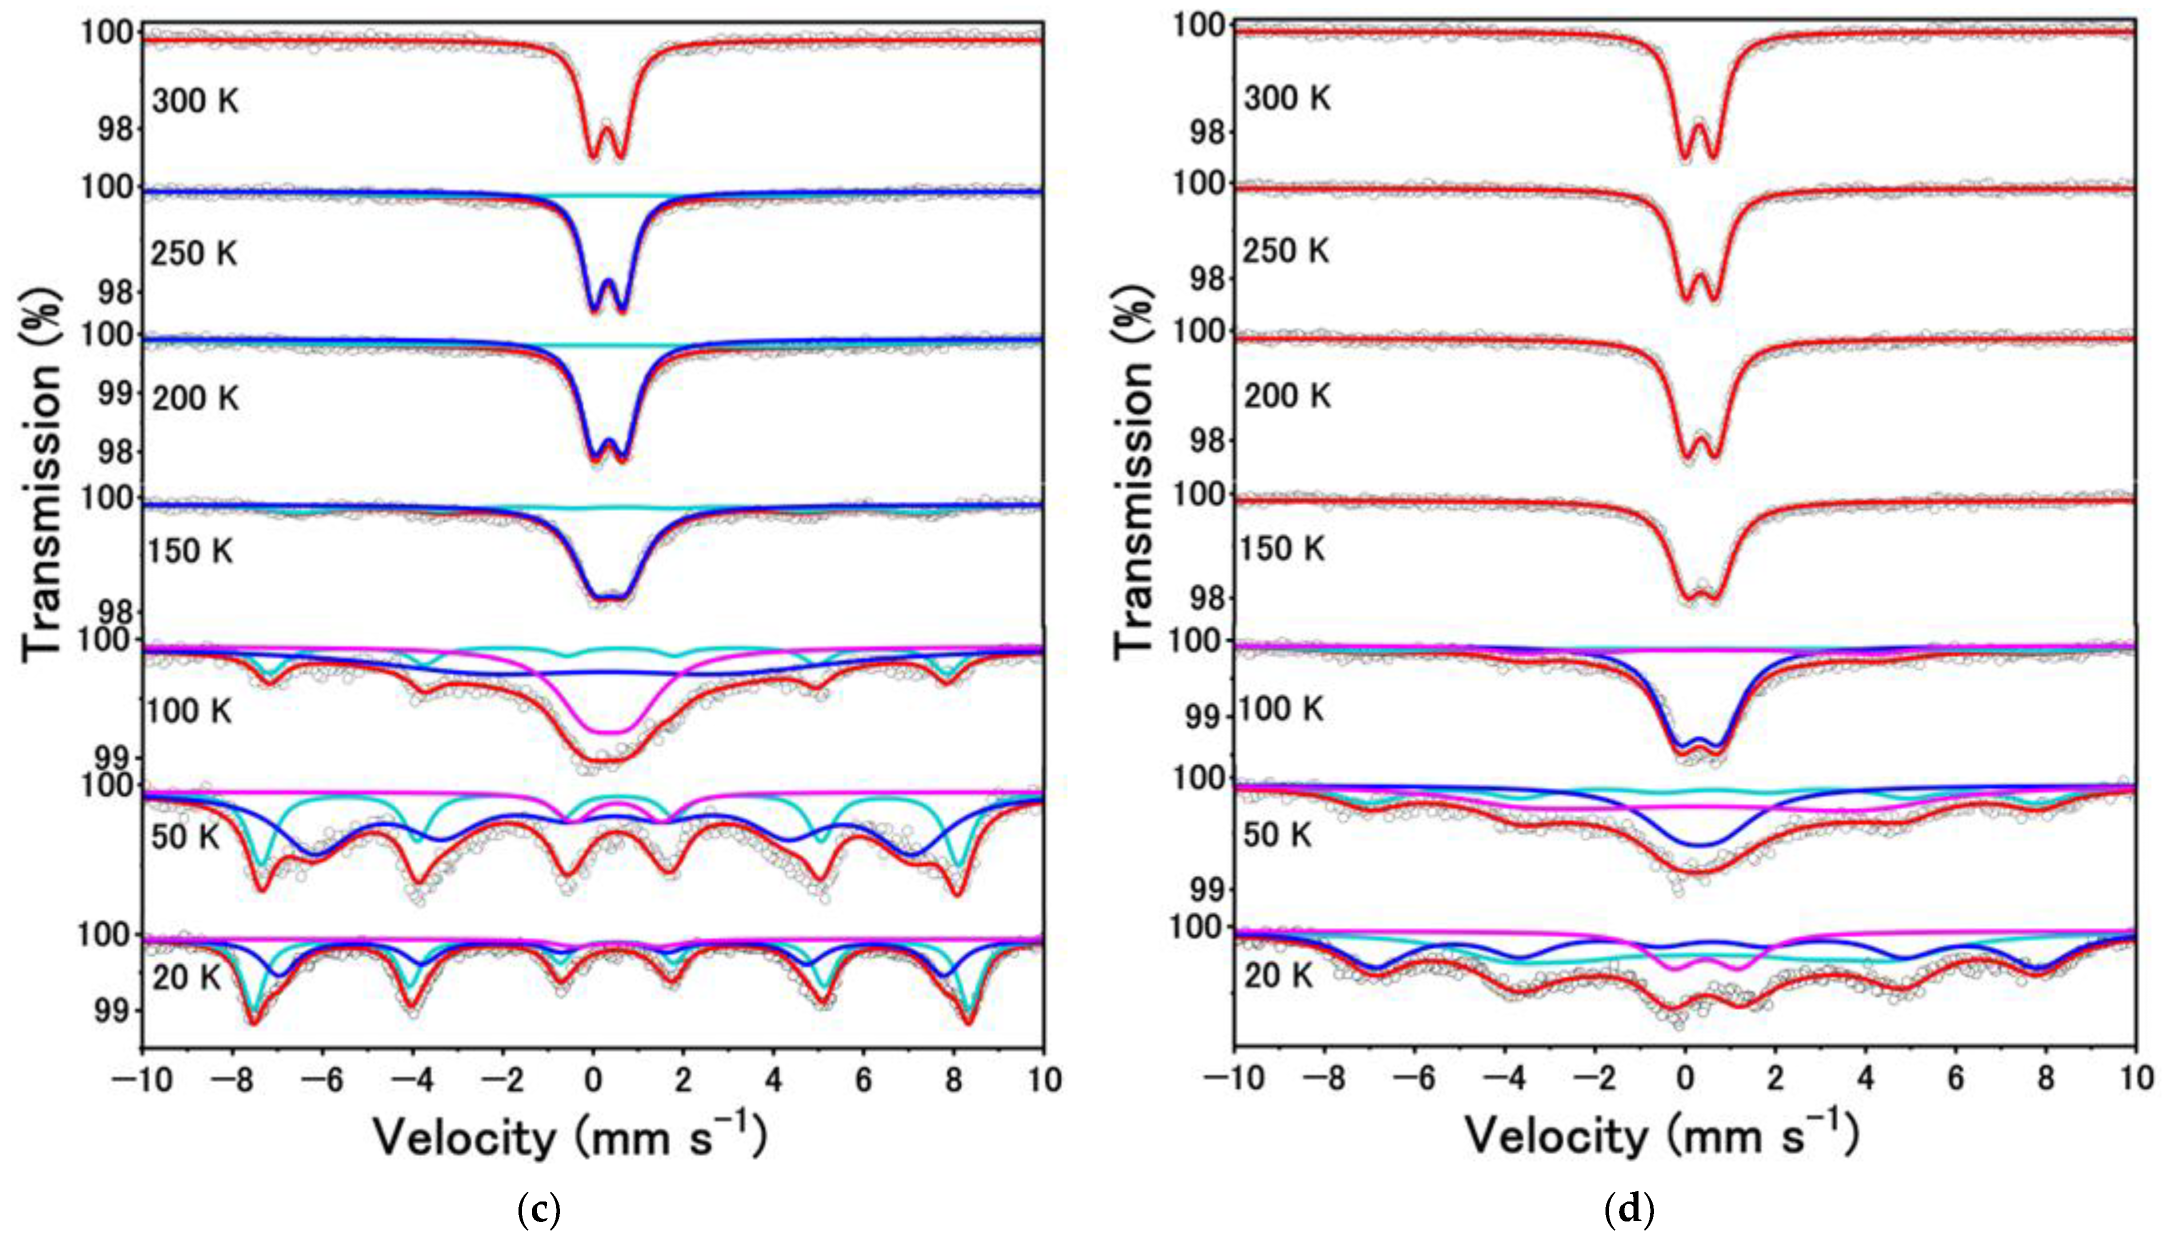
| T (K) | A (%) | δ (mm s−1) | ∆ (mm s−1) | Hint (T) | Г (mm s−1) | Phase |
|---|---|---|---|---|---|---|
| 300 | 100 | 0.31±0.01 | 0.64±0.01 | - | 0.56±0.01 | Superparamagnetic |
| 250 | 26.5 | 0.23±0.01 | −0.13±0.30 | 25.4±1.20 | 3.54±0.79 | Unknown |
| 73.5 | 0.34±0.01 | 0.66±0.01 | - | 0.59±0.01 | Superparamagnetic | |
| 200 | 38.1 | 0.39±0.01 | −0.86±0.37 | 32.4±1.52 | 5.72±1.15 | Goethite |
| 61.9 | 0.36±0.01 | 0.67±0.01 | - | 0.71±0.01 | Superparamagnetic | |
| 150 | 27.0 | 0.51±0.05 | −0.31±0.08 | 42.9±0.30 | 1.61±0.13 | Goethite |
| 73.0 | 0.38±0.01 | 0.71±0.01 | - | 1.08±0.02 | Superparamagnetic | |
| 100 | 15.1 | 0.48±0.02 | −0.27±0.04 | 46.6±0.12 | 0.77±0.07 | Goethite |
| 34.2 | 0.36±0.01 | 0.94±0.04 | - | 1.63±0.17 | Superparamagnetic | |
| 50.6 | 0.29±0.08 | −5.35±0.74 | - | 6.3±0.94 | Superparamagnetic | |
| 50 | 28.9 | 0.47±0.01 | −0.20±0.02 | 48.1±0.07 | 0.70±0.04 | Goethite |
| 63.1 | 0.47±0.02 | −0.03±0.04 | 41.2±0.26 | 1.92±0.08 | Goethite | |
| 8.0 | 0.54±0.03 | 1.97±0.06 | - | 0.97±0.09 | Superparamagnetic | |
| 20 | 52.1 | 0.46±0.00 | −0.12±0.01 | 49.4±0.04 | 0.58±0.02 | Goethite |
| 42.8 | 0.44±0.01 | −0.06±0.02 | 45.8±0.16 | 0.93±0.04 | Goethite | |
| 5.2 | 0.54±0.07 | 1.86±0.12 | - | 1.15±0.19 | Superparamagnetic |
| T (K) | A (%) | δ (mm s−1) | ∆ (mm s−1) | Hint (T) | Г (mm s−1) | Phase |
|---|---|---|---|---|---|---|
| 300 | 100 | 0.32±0.01 | 0.66±0.01 | - | 0.57±0.01 | Superparamagnetic |
| 250 | 100 | 0.34±0.01 | 0.66±0.01 | - | 0.61±0.01 | Superparamagnetic |
| 200 | 100 | 0.36±0.01 | 0.68±0.03 | - | 0.69±0.01 | Superparamagnetic |
| 150 | 100 | 0.37±0.01 | 0.70±0.01 | - | 0.86±0.01 | Superparamagnetic |
| 100 | 22.0 | 0.52±0.26 | −0.22±0.31 | 46.1±0.96 | 2.81±0.70 | Goethite |
| 16.7 | 0.42±0.11 | −0.20±0.17 | 24.5±0.62 | 1.74±0.32 | Goethite | |
| 61.3 | 0.32±0.01 | 0.92±0.01 | - | 1.13±0.03 | Superparamagnetic | |
| 50 | 24.0 | 0.52±0.06 | −0.22±0.12 | 46.1±0.30 | 1.62±0.23 | Goethite |
| 45.1 | 0.42±0.08 | −0.20±0.16 | 24.5±1.22 | 3.58±0.95 | Goethite | |
| 30.9 | 0.32±0.02 | 0.92±0.10 | - | 1.99±0.30 | Superparamagnetic | |
| 20 | 41 | 0.53±0.03 | −0.14±0.06 | 45.7±0.17 | 1.72±0.12 | Goethite |
| 44.3 | 0.27±0.07 | 0.15±0.11 | 26.7±0.42 | 2.97±0.42 | Unknown | |
| 14.7 | 0.46±0.03 | 1.48±0.05 | - | 1.32±0.10 | Superparamagnetic |
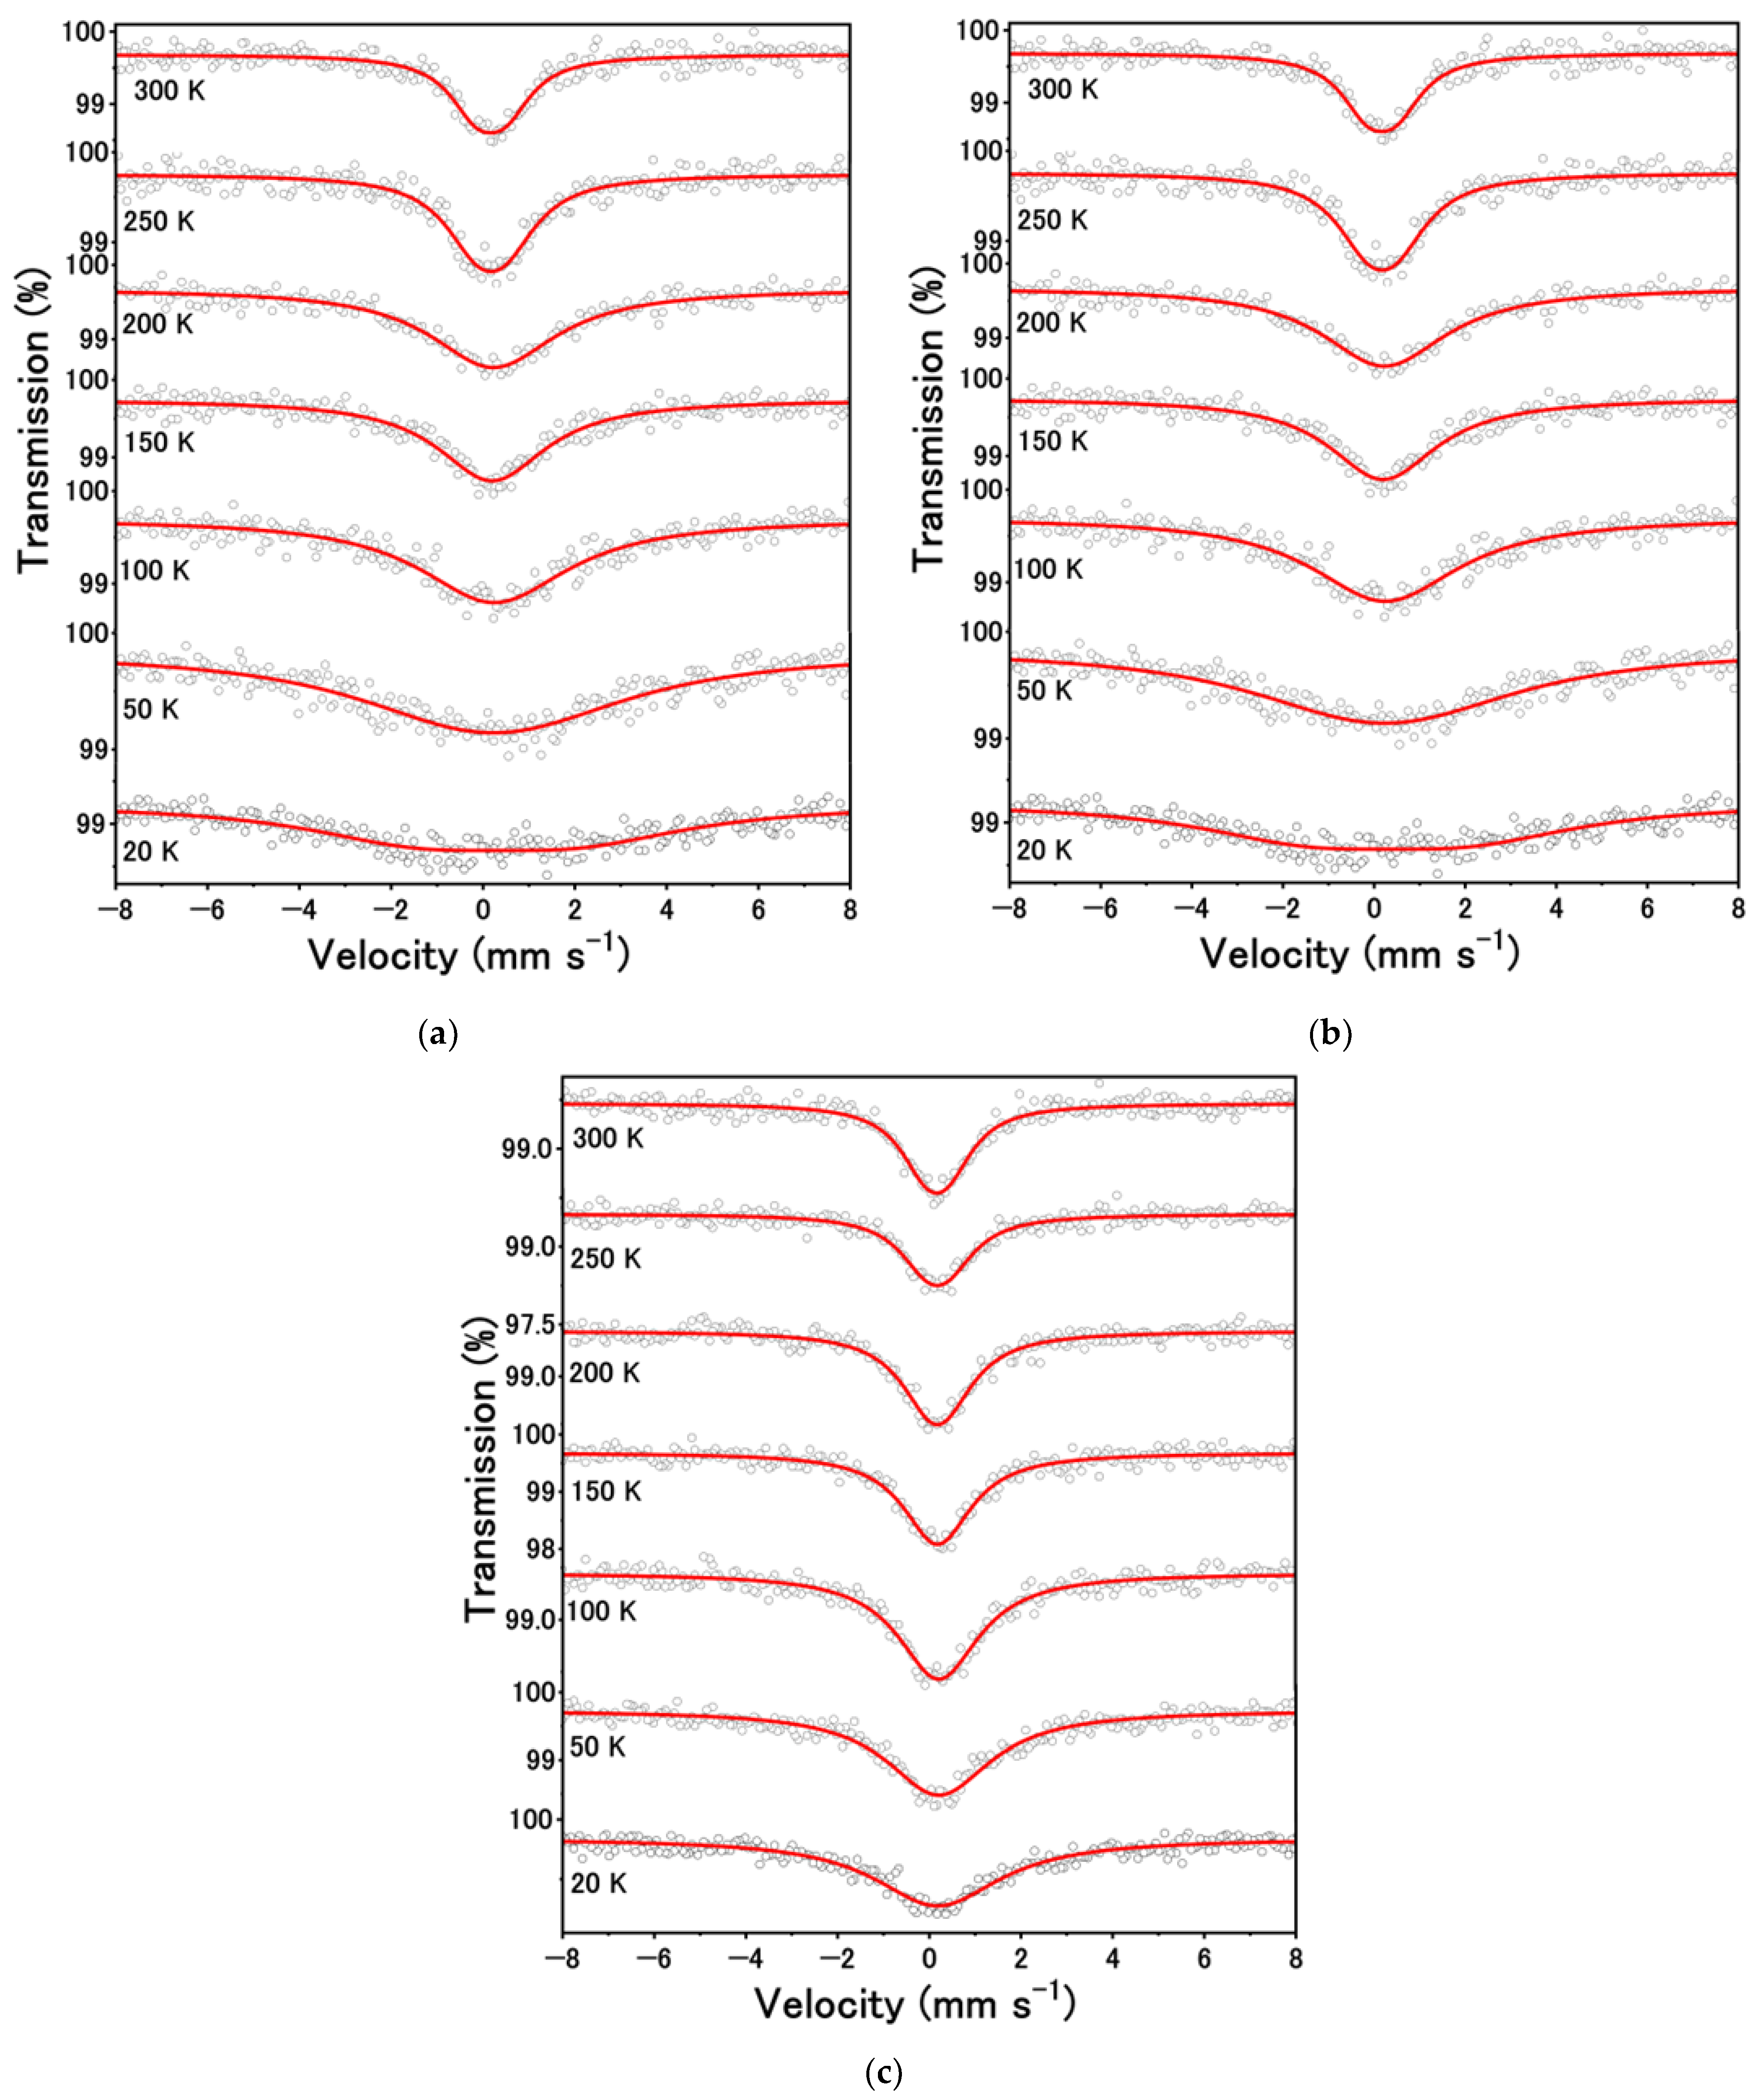
| T (K) | A (%) | δ (mm s−1) | ∆ (mm s−1) | Г (mm s−1) |
|---|---|---|---|---|
| 300 | 100 | 0.08±0.01 | 0.49±0.04 | 0.96±0.08 |
| 250 | 100 | 0.09±0.01 | 0.50±0.02 | 0.89±0.03 |
| 200 | 100 | 0.09±0.01 | 0.47±0.03 | 1.06±0.04 |
| 150 | 100 | 0.08±0.01 | 0.23±0. 14 | 1.37±0.06 |
| 100 | 100 | 0.10±0.01 | 0.00±8.85 | 1.64±0.07 |
| 50 | 100 | 0.10±0.01 | 0.00±27.3 | 2.66±0.13 |
| 20 | 100 | 0.08±0.02 | 0.00±6.23 | 3.78±0.23 |
| T (K) | A (%) | δ (mm s−1) | ∆ (mm s−1) | Г (mm s−1) |
|---|---|---|---|---|
| 300 | 100 | 0.09±0.03 | 0.64±0.11 | 1.42±0.13 |
| 250 | 100 | 0.10±0.03 | 0.63±0.17 | 1.75±0.16 |
| 200 | 100 | 0.09±0.03 | 0.00±5.29 | 2.51±0.26 |
| 150 | 100 | 0.12±0.04 | 0.00±67.9 | 2.89±0.29 |
| 100 | 100 | 0.17±0.05 | 0.00±13.7 | 3.98±0.45 |
| 50 | 100 | 0.13±0.03 | 1.28±1.24 | 2.78±0.22 |
| 20 | 100 | 0.24±0.11 | 3.52±0.30 | 6.06±0.62 |
| T (K) | A (%) | δ (mm s−1) | ∆ (mm s−1) | Г (mm s−1) |
|---|---|---|---|---|
| 300 | 100 | 0.09±0.02 | 0.48±0.13 | 1.41±0.11 |
| 250 | 100 | 0.10±0.02 | 0.46±0.15 | 1.52±0.12 |
| 200 | 100 | 0.10±0.02 | 0.31±0.27 | 1.68±0.13 |
| 150 | 100 | 0.10±0.02 | 0.08±1.28 | 1.81±0.13 |
| 100 | 100 | 0.13±0.02 | 0.00±27.2 | 2.16±0.15 |
| 50 | 100 | 0.13±0.03 | 0.00±50.0 | 2.78±0.22 |
| 20 | 100 | 0.10±0.03 | 0.00±76.7 | 3.37±0.29 |
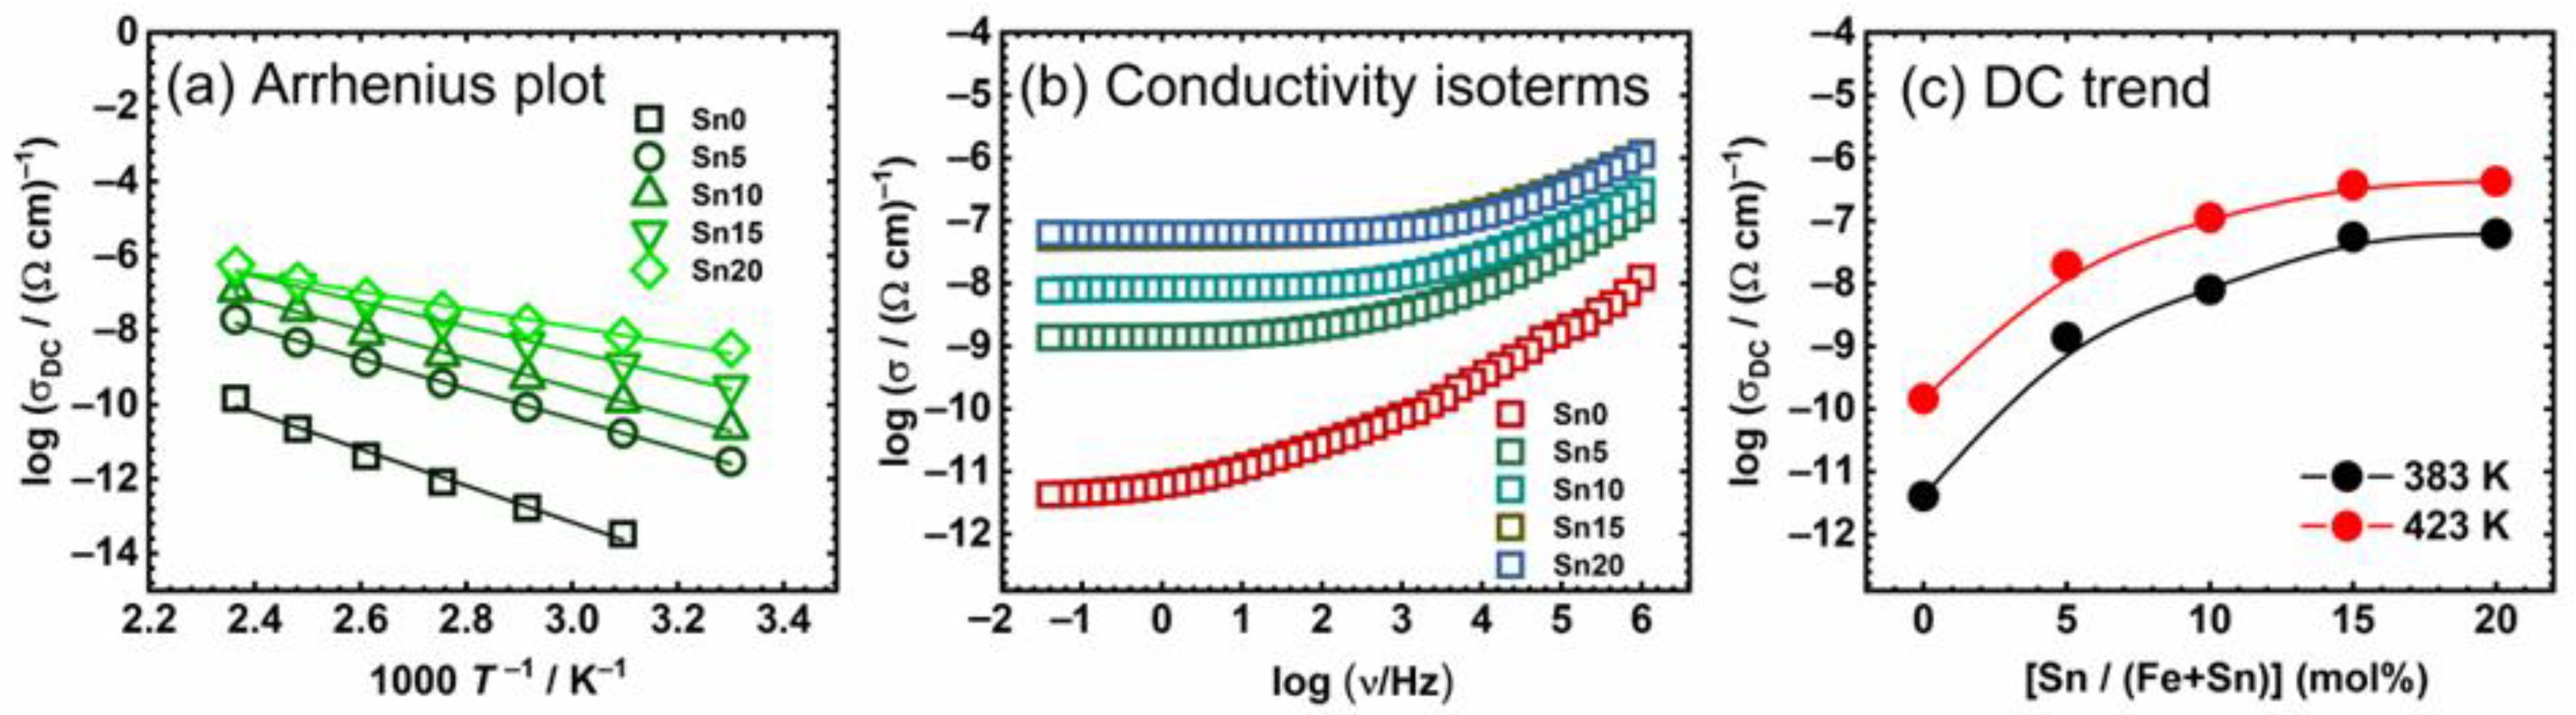
| Sample | σDC @423 K (Ω−1 cm−1) | EDC (kJ mol−1) | (Ω−1 cm−1) |
|---|---|---|---|
| Sn0 | 1.45 × 10⁻¹⁰ | 93.9 | 1.56 |
| Sn5 | 1.95 × 10⁻⁸ | 77.1 | 1.70 |
| Sn10 | 1.12 × 10⁻⁷ | 74.9 | 2.20 |
| Sn15 | 3.69 × 10⁻⁷ | 64.3 | 1.50 |
| Sn20 | 4.27 × 10⁻⁷ | 45.5 | −0.79 |
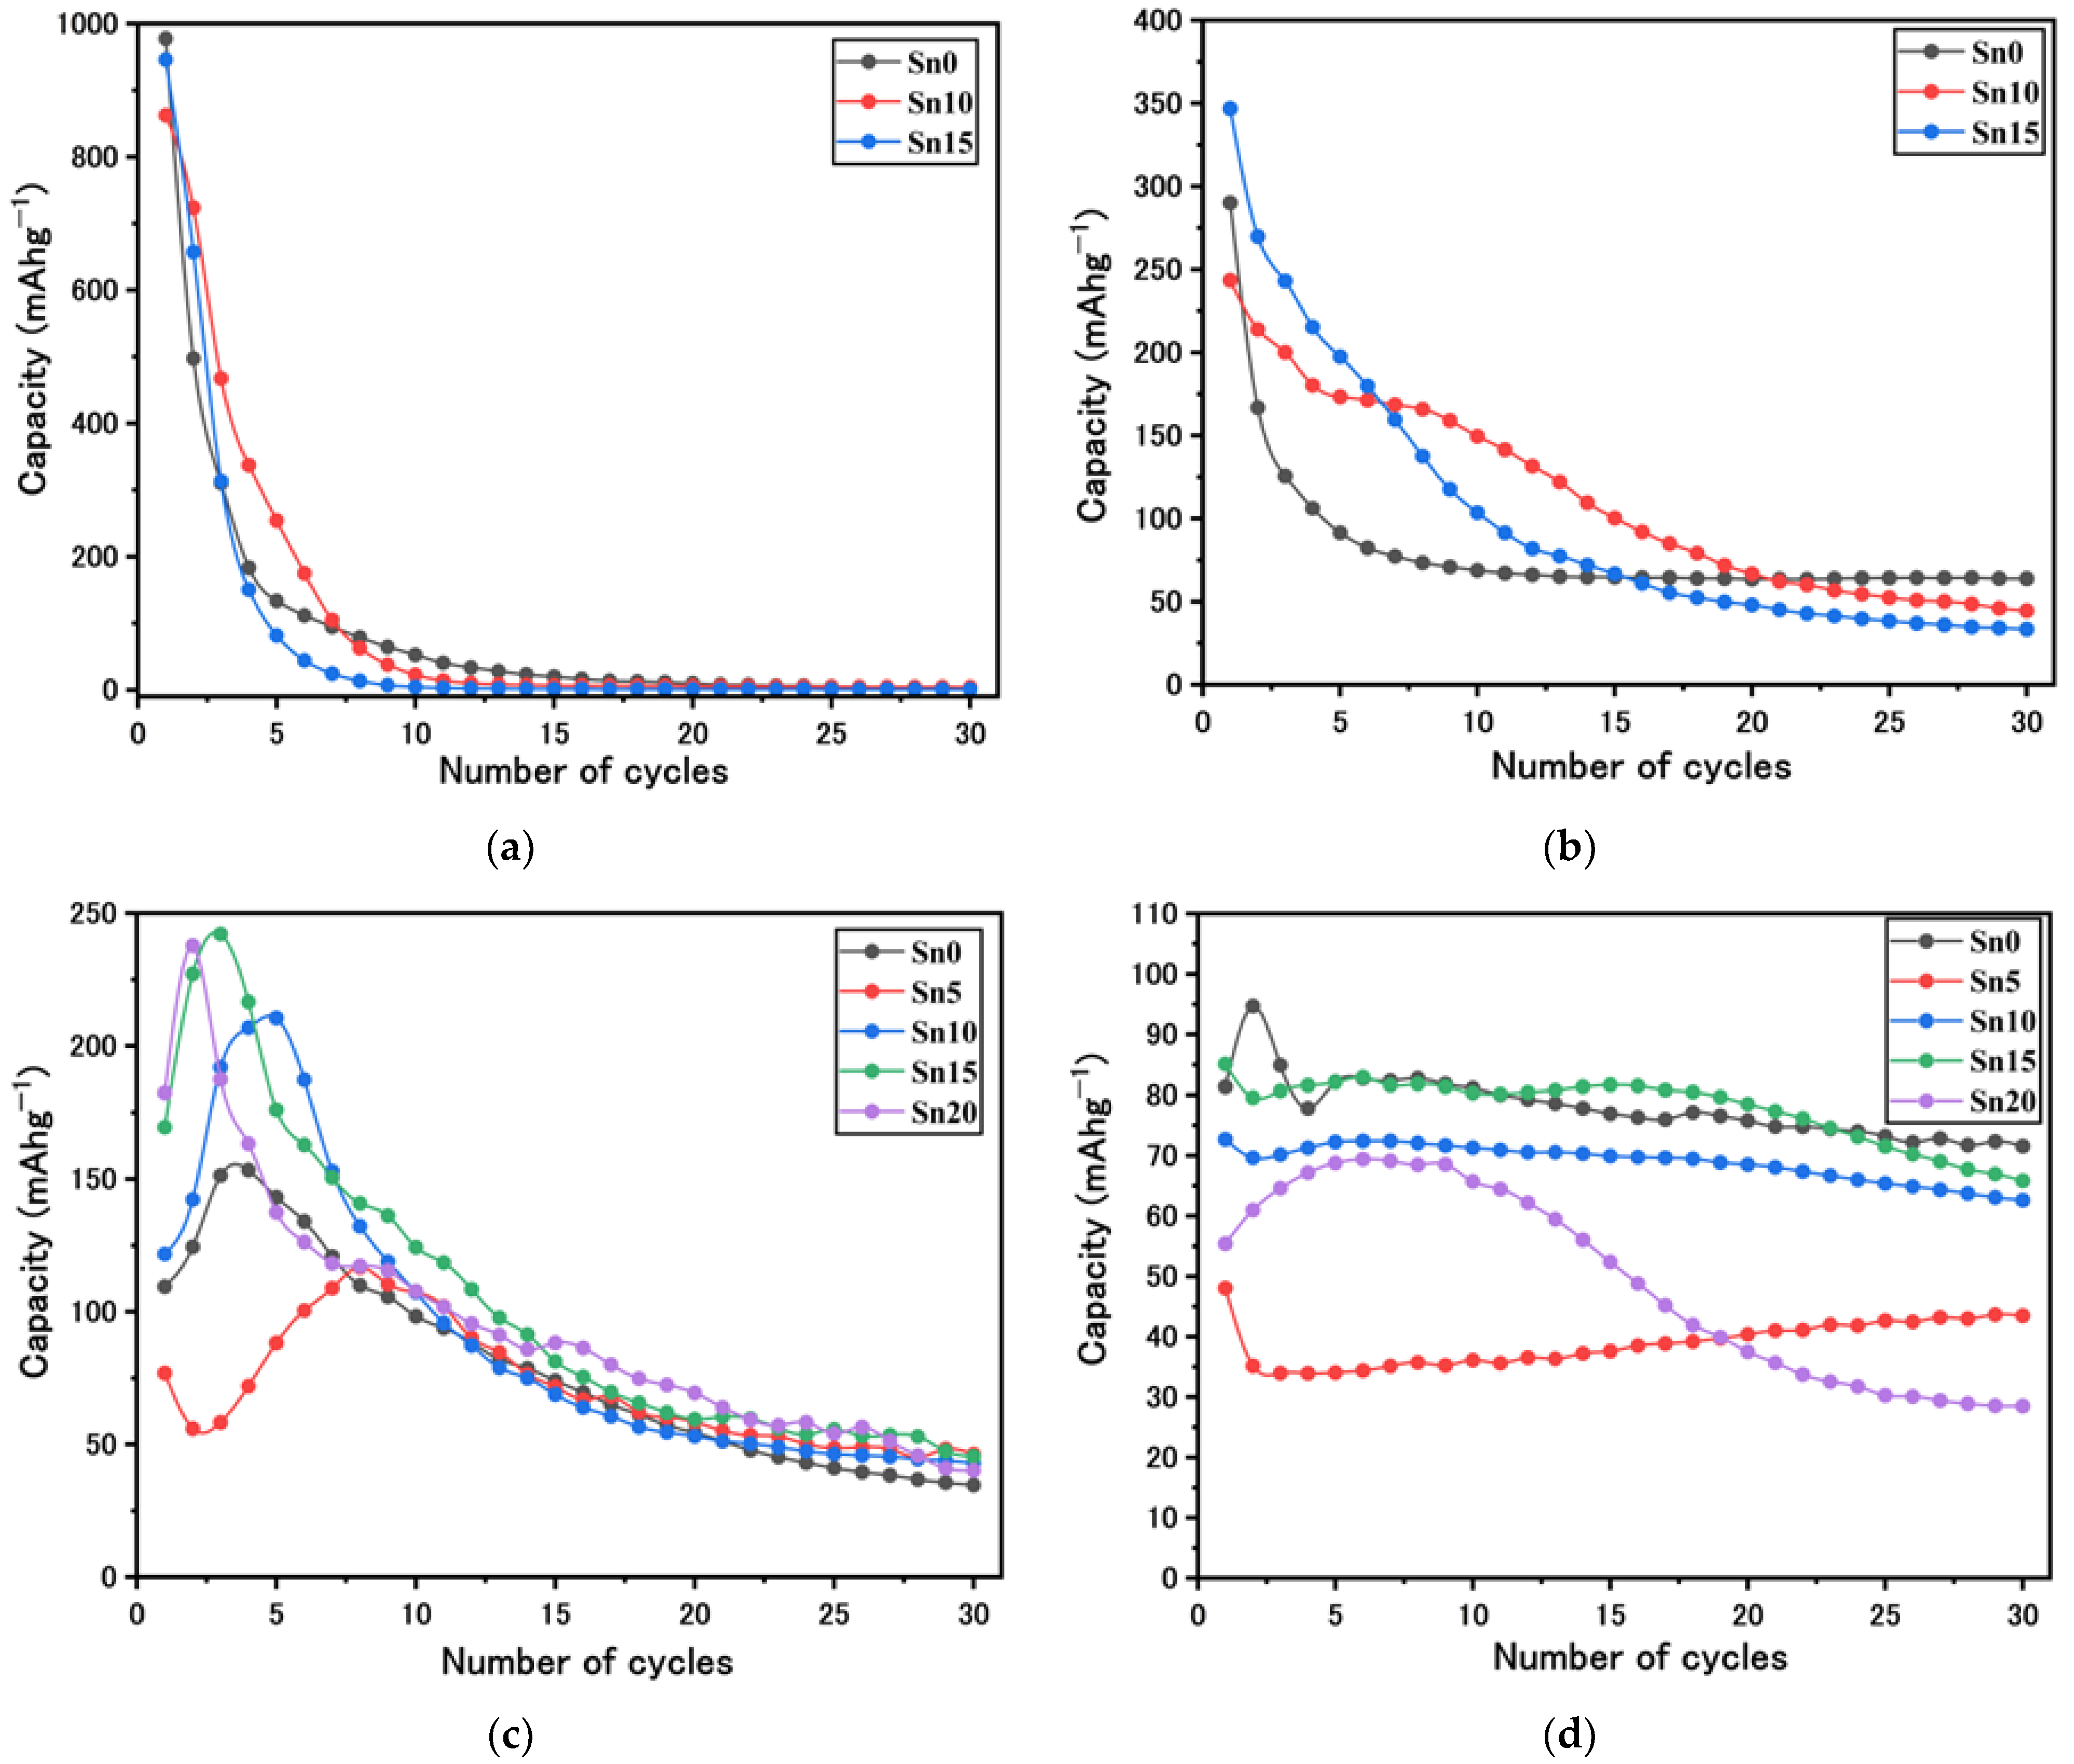
| Sample Code | Initial Discharge Capacity (mAh g−1) | Capacity Retention (30 Cycles) (%) | ||||||
|---|---|---|---|---|---|---|---|---|
| 5 mA g−1 | 50 mA g−1 | 5 mA g−1 | 50 mA g−1 | |||||
| SIB | LIB | SIB | LIB | SIB | LIB | SIB | LIB | |
| Sn0 | 110 | 977 | 81 | 290 | 32 | 0.4 | 88 | 22 |
| Sn5 | 77 | - | 43 | - | 60 | - | 90 | - |
| Sn10 | 122 | 862 | 73 | 243 | 35 | 0.5 | 86 | 18 |
| Sn15 | 170 | 946 | 85 | 347 | 27 | 0.1 | 77 | 9.6 |
| Sn20 | 182 | - | 55 | - | 22 | - | 51 | - |
Disclaimer/Publisher’s Note: The statements, opinions and data contained in all publications are solely those of the individual author(s) and contributor(s) and not of MDPI and/or the editor(s). MDPI and/or the editor(s) disclaim responsibility for any injury to people or property resulting from any ideas, methods, instructions or products referred to in the content. |
© 2024 by the authors. Licensee MDPI, Basel, Switzerland. This article is an open access article distributed under the terms and conditions of the Creative Commons Attribution (CC BY) license (https://creativecommons.org/licenses/by/4.0/).
Share and Cite
Ibrahim, A.; Tani, K.; Hashi, K.; Zhang, B.; Homonnay, Z.; Kuzmann, E.; Bafti, A.; Pavić, L.; Krehula, S.; Marciuš, M.; et al. Debye Temperature Evaluation for Secondary Battery Cathode of α-SnxFe1−xOOH Nanoparticles Derived from the 57Fe- and 119Sn-Mössbauer Spectra. Int. J. Mol. Sci. 2024, 25, 2488. https://doi.org/10.3390/ijms25052488
Ibrahim A, Tani K, Hashi K, Zhang B, Homonnay Z, Kuzmann E, Bafti A, Pavić L, Krehula S, Marciuš M, et al. Debye Temperature Evaluation for Secondary Battery Cathode of α-SnxFe1−xOOH Nanoparticles Derived from the 57Fe- and 119Sn-Mössbauer Spectra. International Journal of Molecular Sciences. 2024; 25(5):2488. https://doi.org/10.3390/ijms25052488
Chicago/Turabian StyleIbrahim, Ahmed, Kaoru Tani, Kanae Hashi, Bofan Zhang, Zoltán Homonnay, Ernő Kuzmann, Arijeta Bafti, Luka Pavić, Stjepko Krehula, Marijan Marciuš, and et al. 2024. "Debye Temperature Evaluation for Secondary Battery Cathode of α-SnxFe1−xOOH Nanoparticles Derived from the 57Fe- and 119Sn-Mössbauer Spectra" International Journal of Molecular Sciences 25, no. 5: 2488. https://doi.org/10.3390/ijms25052488
APA StyleIbrahim, A., Tani, K., Hashi, K., Zhang, B., Homonnay, Z., Kuzmann, E., Bafti, A., Pavić, L., Krehula, S., Marciuš, M., & Kubuki, S. (2024). Debye Temperature Evaluation for Secondary Battery Cathode of α-SnxFe1−xOOH Nanoparticles Derived from the 57Fe- and 119Sn-Mössbauer Spectra. International Journal of Molecular Sciences, 25(5), 2488. https://doi.org/10.3390/ijms25052488