Article

Reduced Glycolysis and Cytotoxicity in Staphylococcus aureus Isolates from Chronic Rhinosinusitis as Strategies for Host Adaptation

1
Institute of Medical Microbiology, Jena University Hospital, 07747 Jena, Germany
2
Systems Biology and Bioinformatics Unit, Leibniz Institute for Natural Product Research and Infection Biology-Hans Knöll Institute, 07745 Jena, Germany
3
Department of Otorhinolaryngology, Jena University Hospital, 07747 Jena, Germany
4
Leibniz Institute of Photonic Technology (IPHT), 07745 Jena, Germany
5
InfectoGnostics Research Campus, 07743 Jena, Germany
6
Institute of Immunology, University Hospital Jena, 07743 Jena, Germany
7
Institute of Physical Chemistry, Friedrich-Schiller University, 07743 Jena, Germany
*
Author to whom correspondence should be addressed.
Int. J. Mol. Sci. 2024, 25(4), 2229; https://doi.org/10.3390/ijms25042229
Submission received: 22 January 2024 / Revised: 7 February 2024 / Accepted: 10 February 2024 / Published: 13 February 2024
(This article belongs to the Special Issue Host-Pathogen Interactions during Persistent Bacterial Infections)

Abstract

:
Chronic rhinosinusitis (CRS) is a multifactorial infection of the nasal cavity and sinuses. In this study, nasal swabs from control donors (N = 128) and patients with CRS (N = 246) were analysed. Culture methods and metagenomics revealed no obvious differences in the composition of the bacterial communities between the two groups. However, at the functional level, several metabolic pathways were significantly enriched in the CRS group compared to the control group. Pathways such as carbohydrate transport metabolism, ATP synthesis, cofactors and vitamins, photosynthesis and transcription were highly enriched in CRS. In contrast, pathways related to lipid metabolism were more representative in the control microbiome. As S. aureus is one of the main species found in the nasal cavity, staphylococcal isolates from control and CRS samples were analysed by microarray and functional assays. Although no significant genetic differences were detected by microarray, S. aureus from CRS induced less cytotoxicity to lung cells and lower rates of glycolysis in host cells than control isolates. These results suggest the differential modulation of staphylococcal virulence by the environment created by other microorganisms and their interactions with host cells in control and CRS samples. These changes were reflected in the differential expression of cytokines and in the expression of Agr, the most important quorum-sensing regulator of virulence in S. aureus. In addition, the CRS isolates remained stable in their cytotoxicity, whereas the cytotoxic activity of S. aureus isolated from control subjects decreased over time during in vitro passage. These results suggest that host factors influence the virulence of S. aureus and promote its adaptation to the nasal environment during CRS.

1. Introduction

Chronic rhinosinusitis (CRS) is a long-lasting inflammation of the respiratory tract that persists for more than 12 weeks [1,2,3]. Clinically, CRS can be divided into CRS without nasal polyposis (CRSsNP) and CRS with nasal polyposis (CRSwNP). Symptoms of CRS include nasal congestion, nasal discharge, facial pain and a decreased sense of smell [4]. Despite research, the cause of CRS remains uncertain. It affects up to 10% of the world’s population during their lifetime.
Numerous risk factors contribute to the development of CRS, including obstruction, mucociliary clearance problems, osteitis, microbes, biofilms, superantigens, immune dysfunction, genetic factors and inhaled irritants [4,5,6]. The EPOS guidelines rely on symptoms and endoscopic/radiographic findings for the primary evaluation and management of CRS. Recent studies highlight the regional diversity of CRS patients from Europe, Asia and Oceania based on cytokine profiles, eosinophilic/neutrophilic patterns and Staphylococcus aureus enterotoxin-specific IgE expression [5]. Eosinophilia and obstruction of the lower respiratory tract are associated with the impaired production of IL-10 in response to staphylococcal enterotoxin B and alpha toxin [7,8].
The relationship between CRS and the microbiome composition has been extensively studied. Research is investigating this link by examining the microbiome composition in both controls and individuals with CRS, focusing on host–pathogen interactions [9,10]. However, nasal microbiome analysis is complex and controversial. Discrepancies often arise from different sampling techniques, sample types and locations. Notably, one study identified Corynebacterium sp., Staphylococcus aureus, Moraxella sp., Streptococcus sp. and Haemophilus sp. as prominent genera in CRS patients and control donors across countries [11]. In addition, several studies have found differences in the abundance of bacterial genera between controls and CRS patients [12]. The composition, stability and resilience of the sinonasal microbiota depend on demographics, geography, clinical aspects and previous therapies [10].
S. aureus colonizes anterior nares in 20% to 80% of healthy individuals [13] and is a relevant prevalent species in the nostrils of 25% to 50% of patients with CRS [14,15]. This colonization can lead to invasive infections in other tissues [16]. Serum studies of CRS patients have shown high levels of antibodies to toxic shock syndrome toxin 1 (TSST-1) and Panton–Valentine leukocidin (PVL). However, genes for staphylococcal antigens showed no correlation with corresponding serum anti-staphylococcal IgG [17]
As S. aureus is a significant colonizer in the nasal areas and a common CRS pathogen, it is unclear which nasal factors lead to its shift from colonizer to pathogen [6,18,19,20].
The interaction between S. aureus and epithelial cells is a critical aspect of the host–pathogen interaction and plays a significant role in the initiation and progression of infections. One important aspect of this interaction is the role of glycolysis in the host defence against S. aureus. Glycolysis is a metabolic pathway that converts glucose into energy for various immune functions, such as phagocytosis, cytokine production and pathogen clearance [21,22,23].
In our study, 374 samples (128 controls, 246 CRS patients) were examined using both culture and culture-independent methods, in addition to metagenomics, to identify potential pathways involved in CRS. While the S. aureus genetic profiles were largely comparable between control and CRS donors, CRS strains showed a significant reduction in their ability to induce cytotoxicity and glycolysis in lung cells. Interestingly, subcultivation experiments showed a decrease in virulence in control S. aureus isolates, a phenomenon not observed in isolates from CRS patients. While our study was a local study, the insights gained provide a valuable understanding of the role of microbes, specifically S. aureus, in the intricate pathogenesis of CRS.

2. Results

2.1. Control Subjects’ and CRS Patients’ Characteristics

The characteristics of the control subjects and patients with CRS are described in Table 1. There were slightly more male participants (62%) than female participants (48%). The gender distribution was similar in the control and CRS groups. Smokers were more frequent in the control group (Pearson’s chi-square test p = 0.029). Forty-three percent of participants had allergies, but there was no difference between the groups. Non-steroidal anti-inflammatory drug (NSAID)-exacerbated respiratory disease was seen only in the CRS group (7.3%) (Pearson’s chi-square test p = 0.002). Asthma was more common in CRS patients (18.7%) than in controls (5.4%) (Pearson’s chi-square test p = 0.003), while diabetes was more common in controls (12.5%) than in patients (3.7%). One third of the CRS patients had nasal polyps (CRSwNP; 32.5%) and two thirds had no polyps (CRSsNP; 67.5%). In addition, the characteristics are presented separately for women (Table S1A) and men (Table S1B). The analysis by gender showed that the different frequency of smokers between both groups was related to the male study participants. There were more male smokers in the control group (36.8%) than in the CRS group (14.4%; Pearson’s chi-square test p = 0.016). Otherwise, there were no gender differences between the female and male participants with regard to the characteristics of the patients.

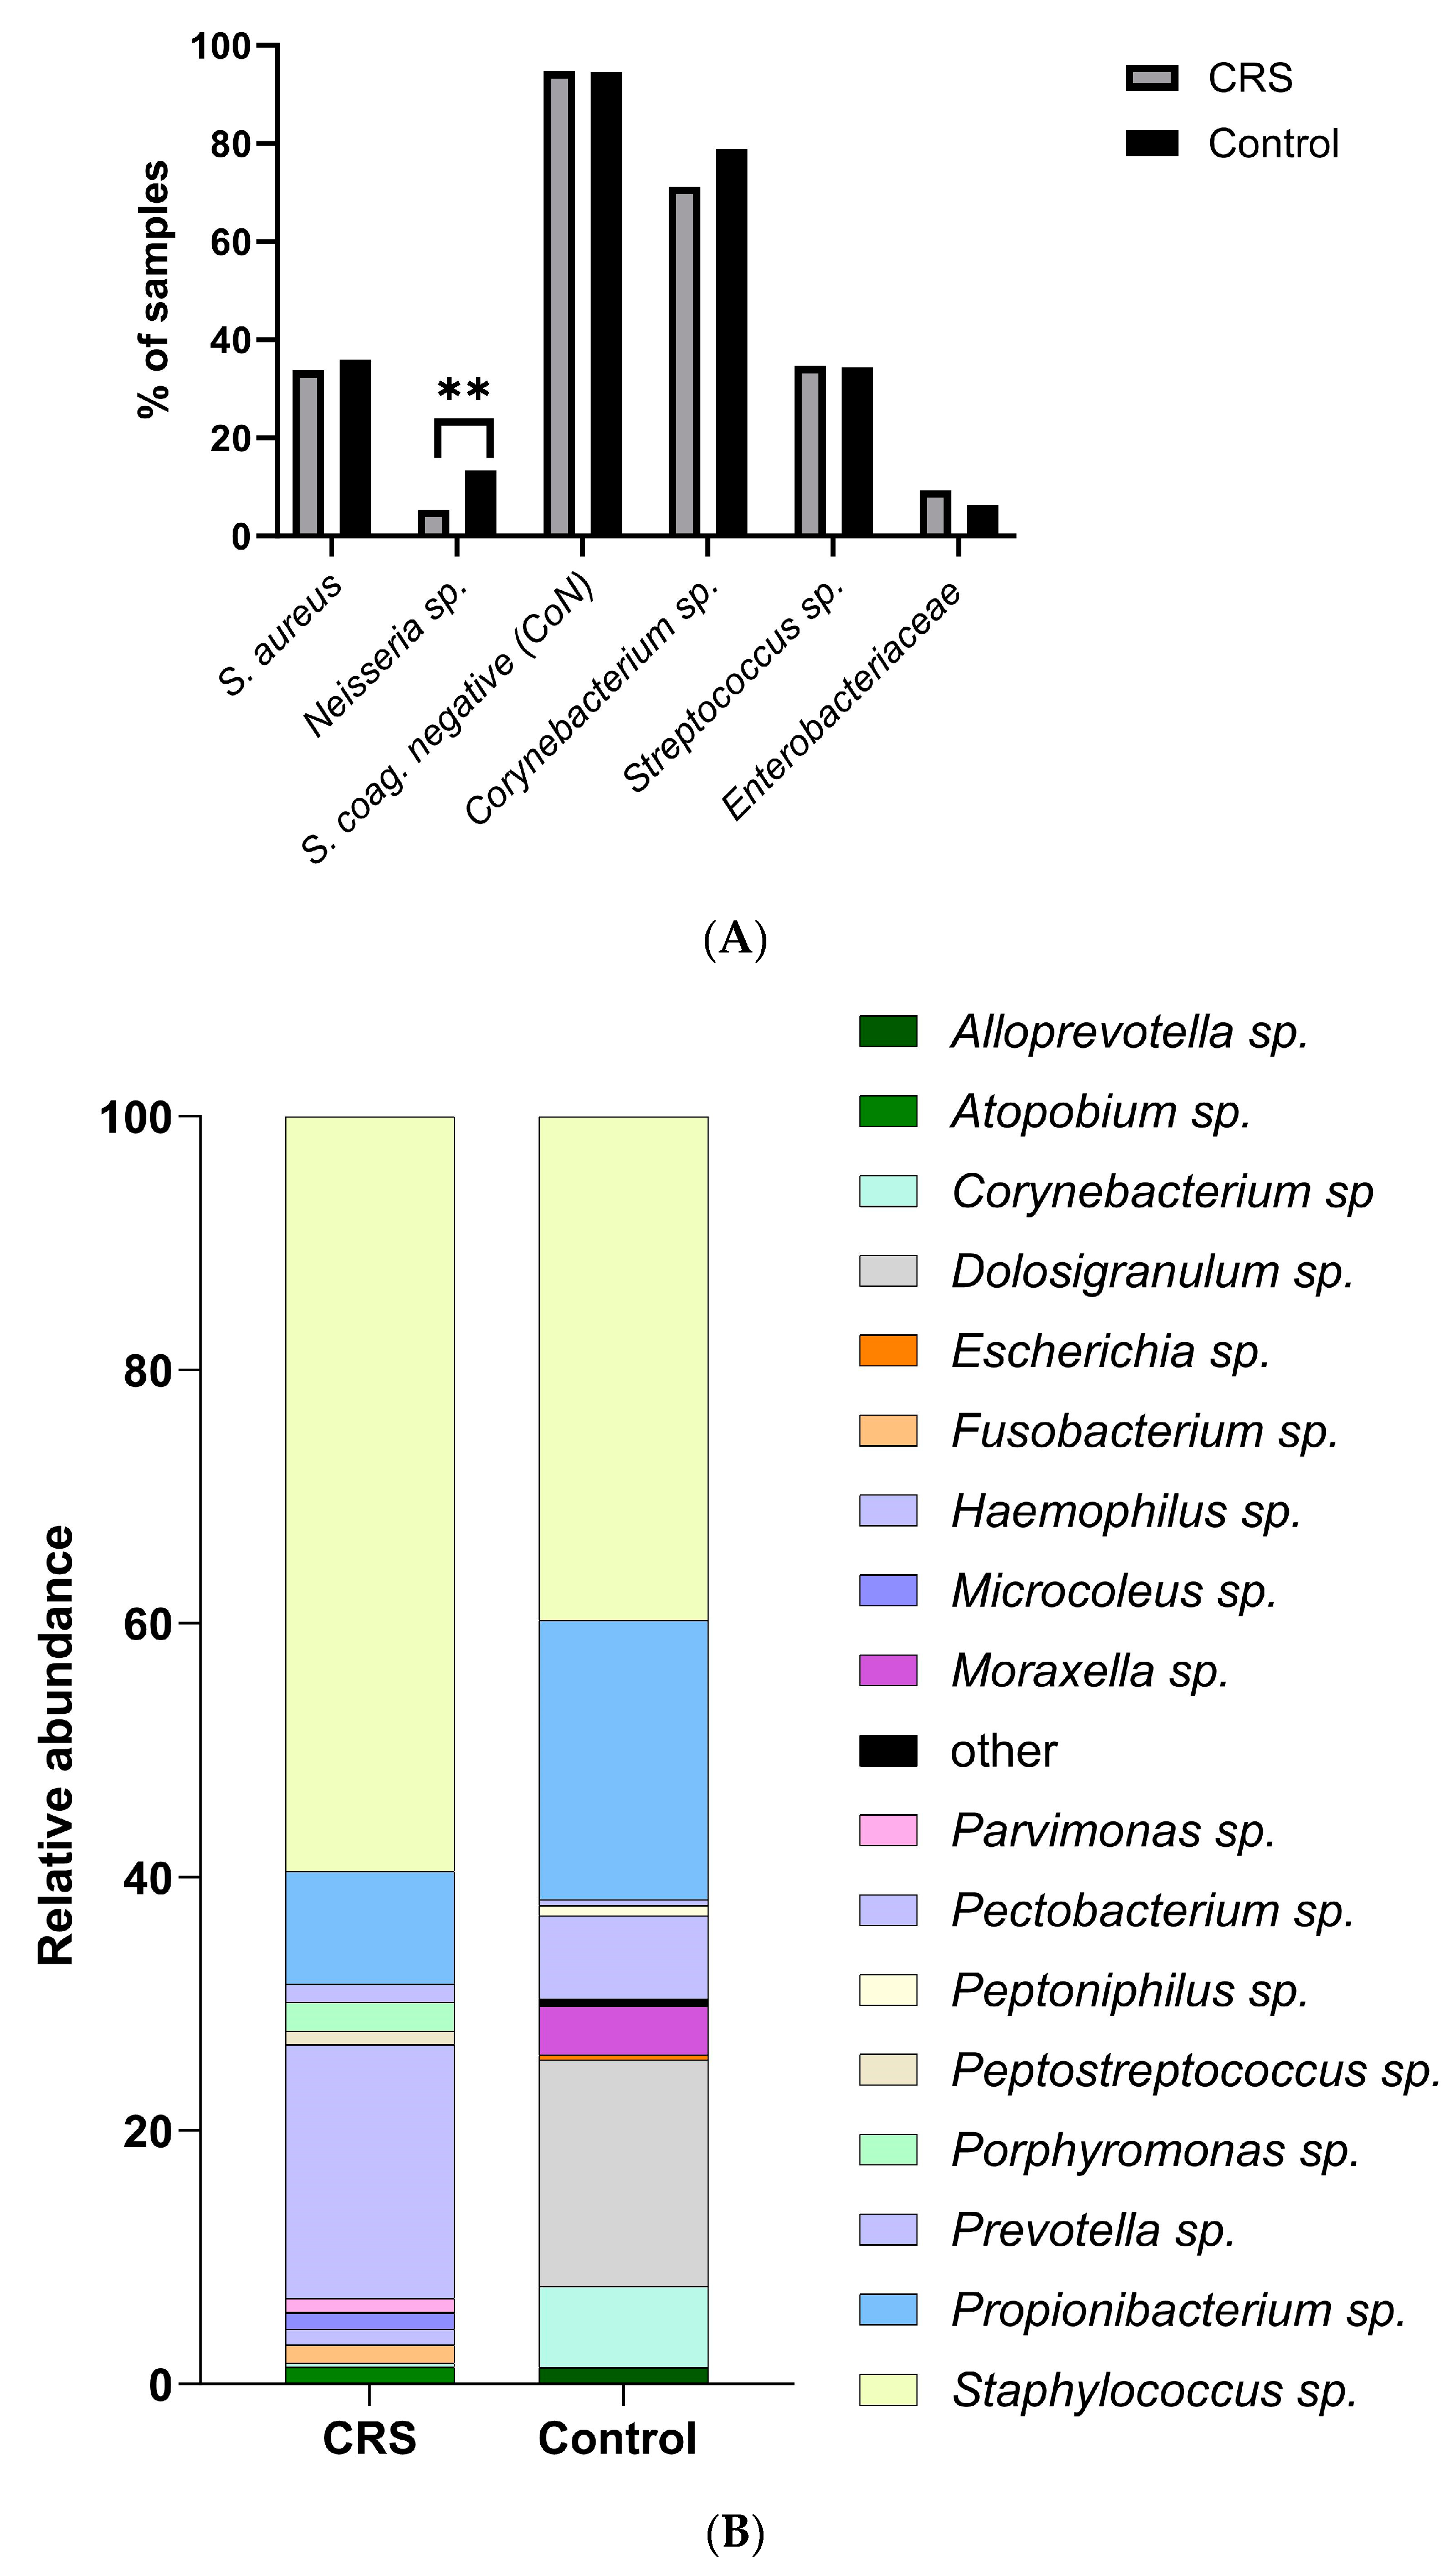
2.2. CRS and Control Donors Had Similar Nasal Microbiomes

To characterise the microbiomes of all samples, 128 swabs from control donors and 246 swabs from patients with CRS were collected. Conventional culture and shotgun metagenomic sequencing were used to identify microbial species. No systematic differences in cultured species were found between samples isolated from control and CRS donors (Figure 1A; Table S2, Fisher test). Only the presence of Neisseria sp. was significantly associated with the control group (Figure 1A, Table S2). Neisseria sp.’s antibiotic susceptibility might explain its low presence in CRS due to prior treatment [11,24]. We examined CRS samples with and without antibiotics. Few CRS patients (4.9%) received antibiotics (Table 1). Neisseria sp. was absent in antibiotic-treated CRS samples, but, due to the sample size, no significant association was confirmed (Fisher test p > 0.99; Table S2B).
Next, we investigated all samples from control carriers and CRS that contained S. aureus. The presence of S. aureus was significantly reduced in swabs simultaneously containing Streptococcus sp. (p = 0.003; Fisher test) and Corynebacterium sp. (p = 0.0009; Fisher test) and almost significantly with coagulase negative staphylococci (p = 0.055, Fisher test) (Table 2). These results suggest that these species interfere with S. aureus regardless of the origin of the sample. These interactions have already been described in other works summarized by Nair et al. [17].
In addition, 10 and 24 swabs, obtained from CRS and control donors, respectively, were analysed by shotgun metagenomic sequencing (Figure 1B).
We used MetaPhlan2 for taxonomic profiling, and although the relative abundance of the different species appeared to change between the two groups, no significant differences were found due to variations between samples (Figure 1B; Table S2; Figure S1, indicator value, IndVal). Interestingly, at the genus level, Staphylococcus sp. dominated the disease sample (Figure 1B; 60% relative abundance, RA) compared to controls (40% RA). On the other hand, genera such as Propionibacterium sp. (22%) and Corynebacterium sp. (7%) were highly abundant in control samples but not in patients (Figure 1B). No differences were found between the two groups with respect to obligate anaerobic species.
Subsequently, we measured alpha diversity indices such as Shannon, Simpson and evenness at the genus level and found no significant difference between control and disease samples (Wilcoxon rank sum test, Figure S2). We also measured beta diversity at the genus level (PERMANOVA, p = 0.2, Figure S3) based on the Bray–Curtis similarity. However, this test showed no significant differences between control and disease samples.

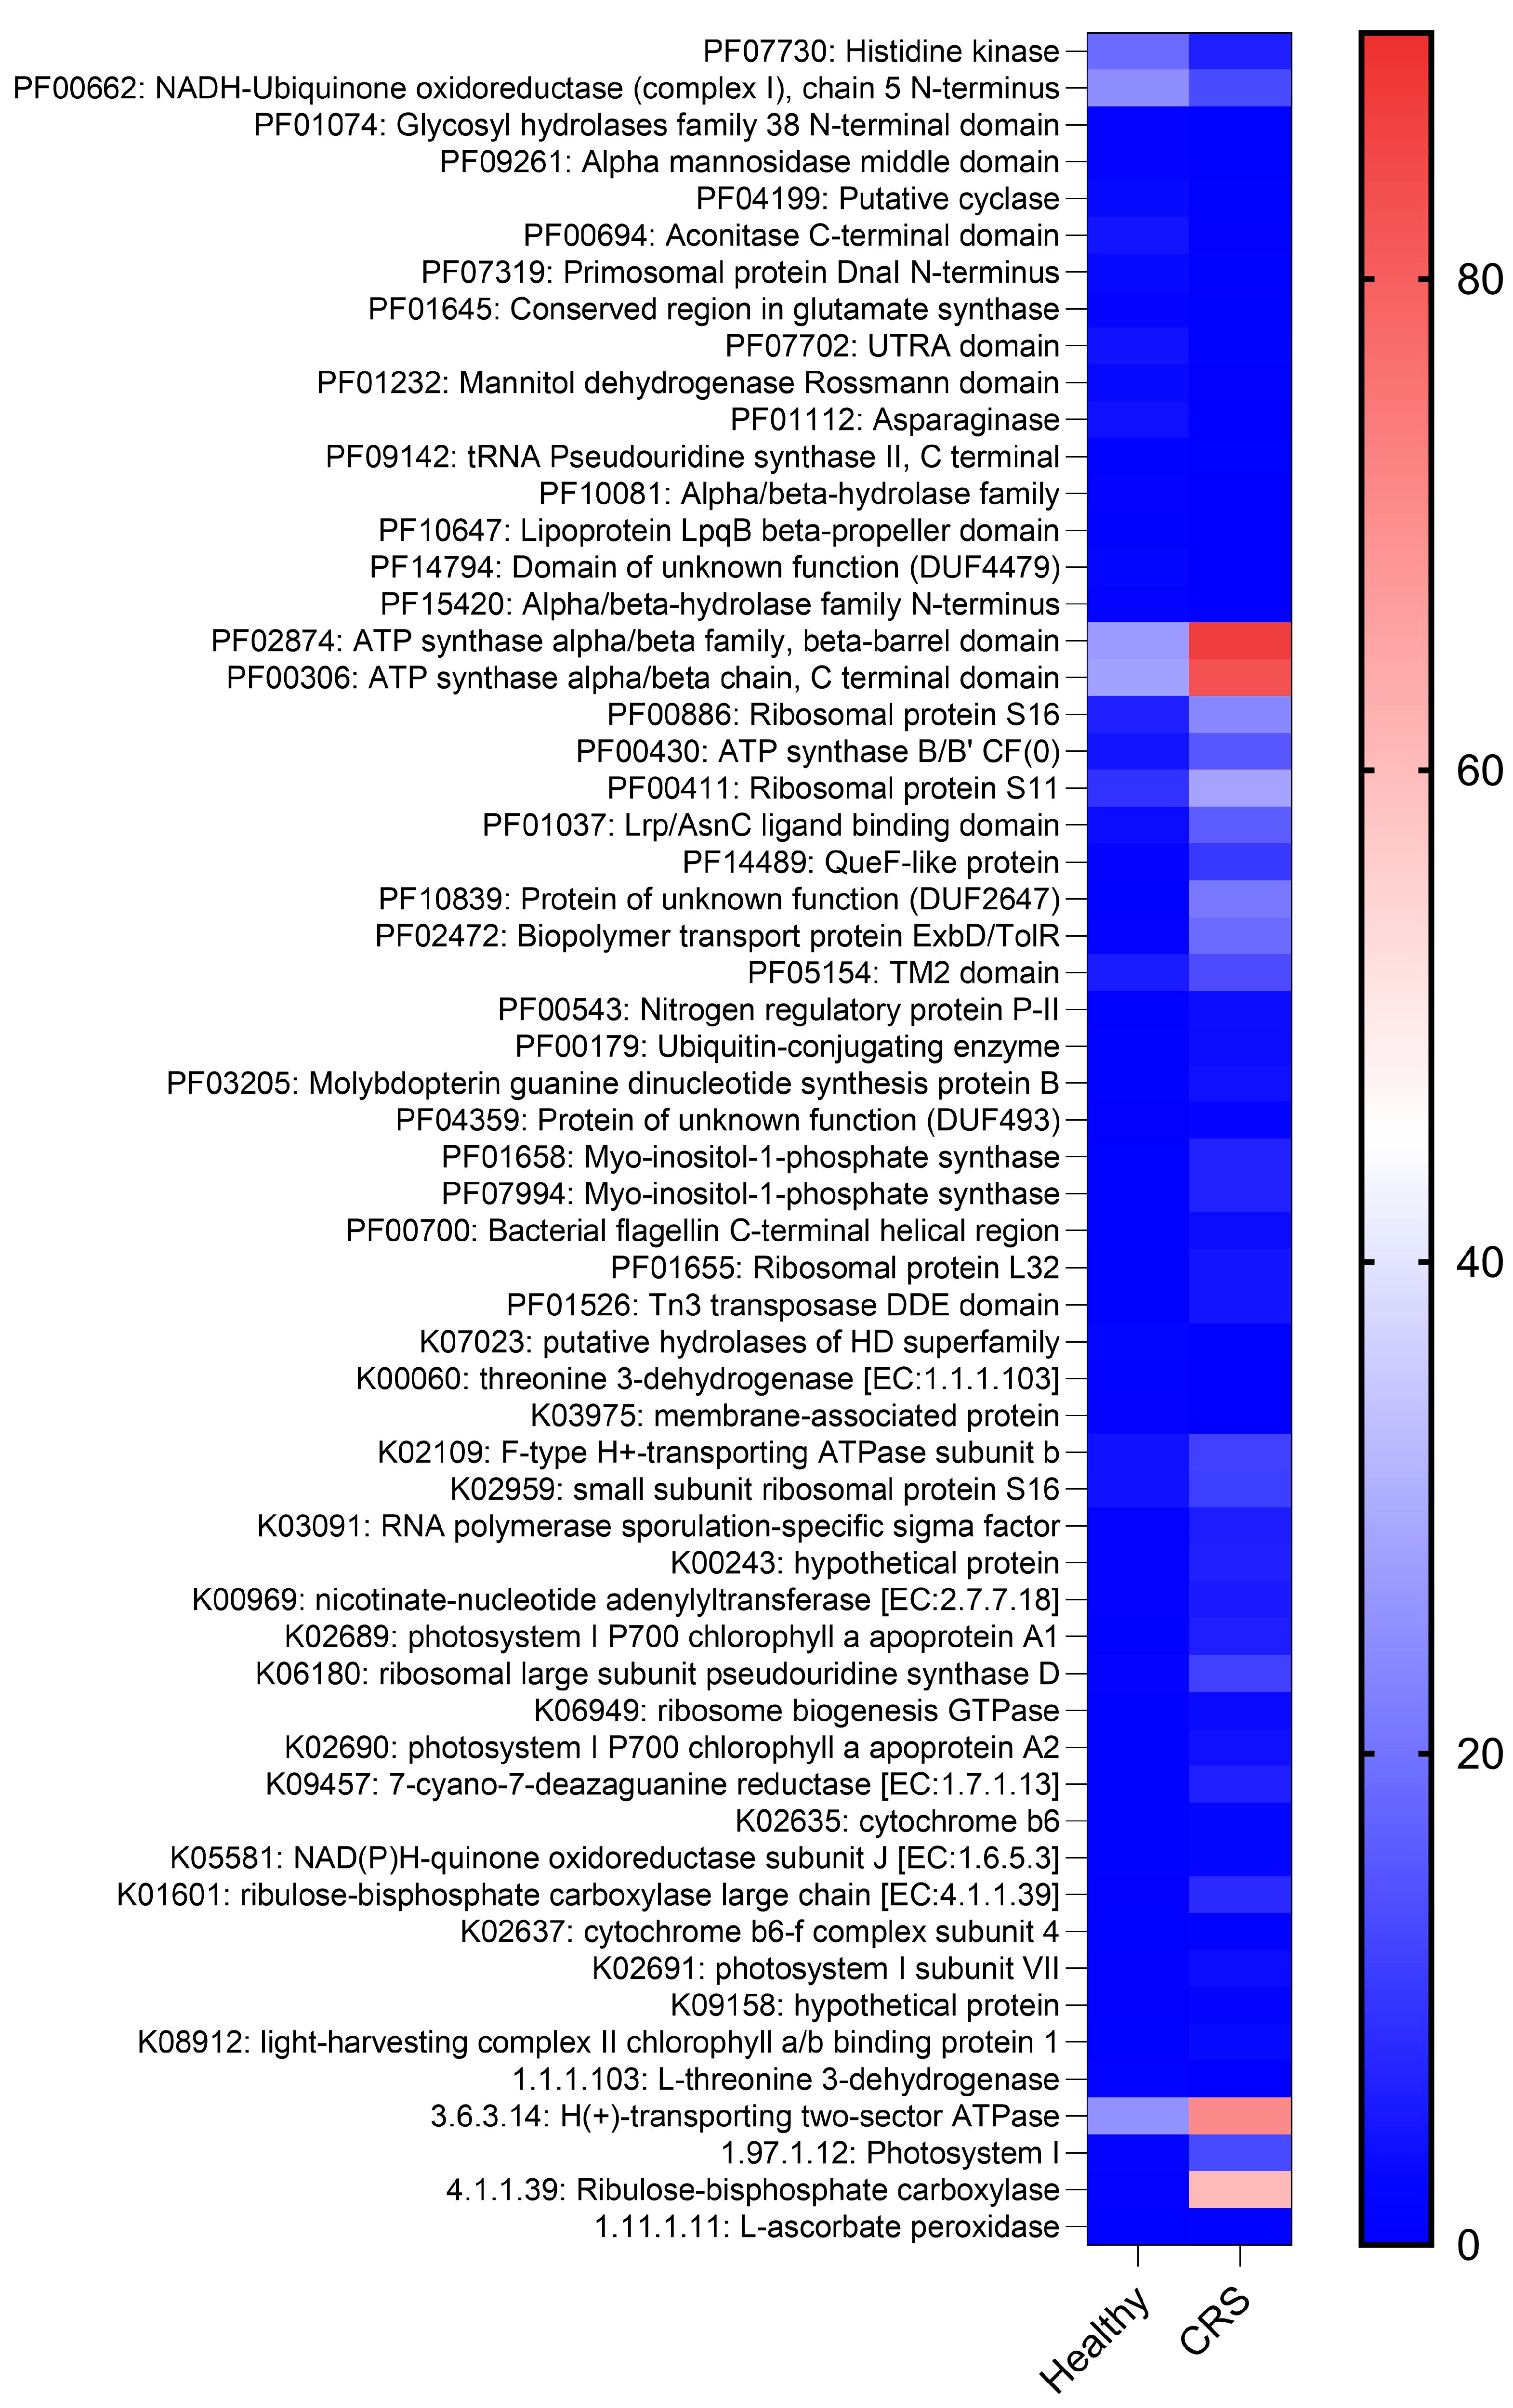
2.3. CRS and Control Microenvironments Were Distinguished by Metabolic Pathways

We then used HUMAnN2 for the functional profiling of the microbial communities. At the genus level, we observed no significant difference in alpha or beta diversity between control and diseased samples. Interestingly, at the functional level, 61 pathways were significantly different between control and CRS samples (Figure 2, heat map, IndVal). Pathways such as carbohydrate transport metabolism, ATP synthesis, cofactors and vitamins, photosynthesis and transcription were highly enriched in CRS. In contrast, pathways related to lipid metabolism were more representative in the control microbiome (Figure 2, heat map, IndVal).

2.4. S. aureus Populations of Patients and Controls Did Not Differ

S. aureus is the major microorganism colonizing the nasal sinuses and one of the primary pathogens in CRS. To characterise S. aureus isolates from control and CRS donors, a microarray was performed to detect specific genes and to assign isolates to clonal complexes (CCs) (Table 3, Table 4 and Table 5). One hundred S. aureus isolates (49 control and 51 CRS) were studied. The isolates belonged to a total of 14 different CCs. The distribution of CCs among control and CRS isolates was very diverse, and the main CCs were CC7, CC30 and CC45. Interestingly, CC15 was present in the CRS group. However, no significant differences were observed with regard to the origin of the sample (Table 5).

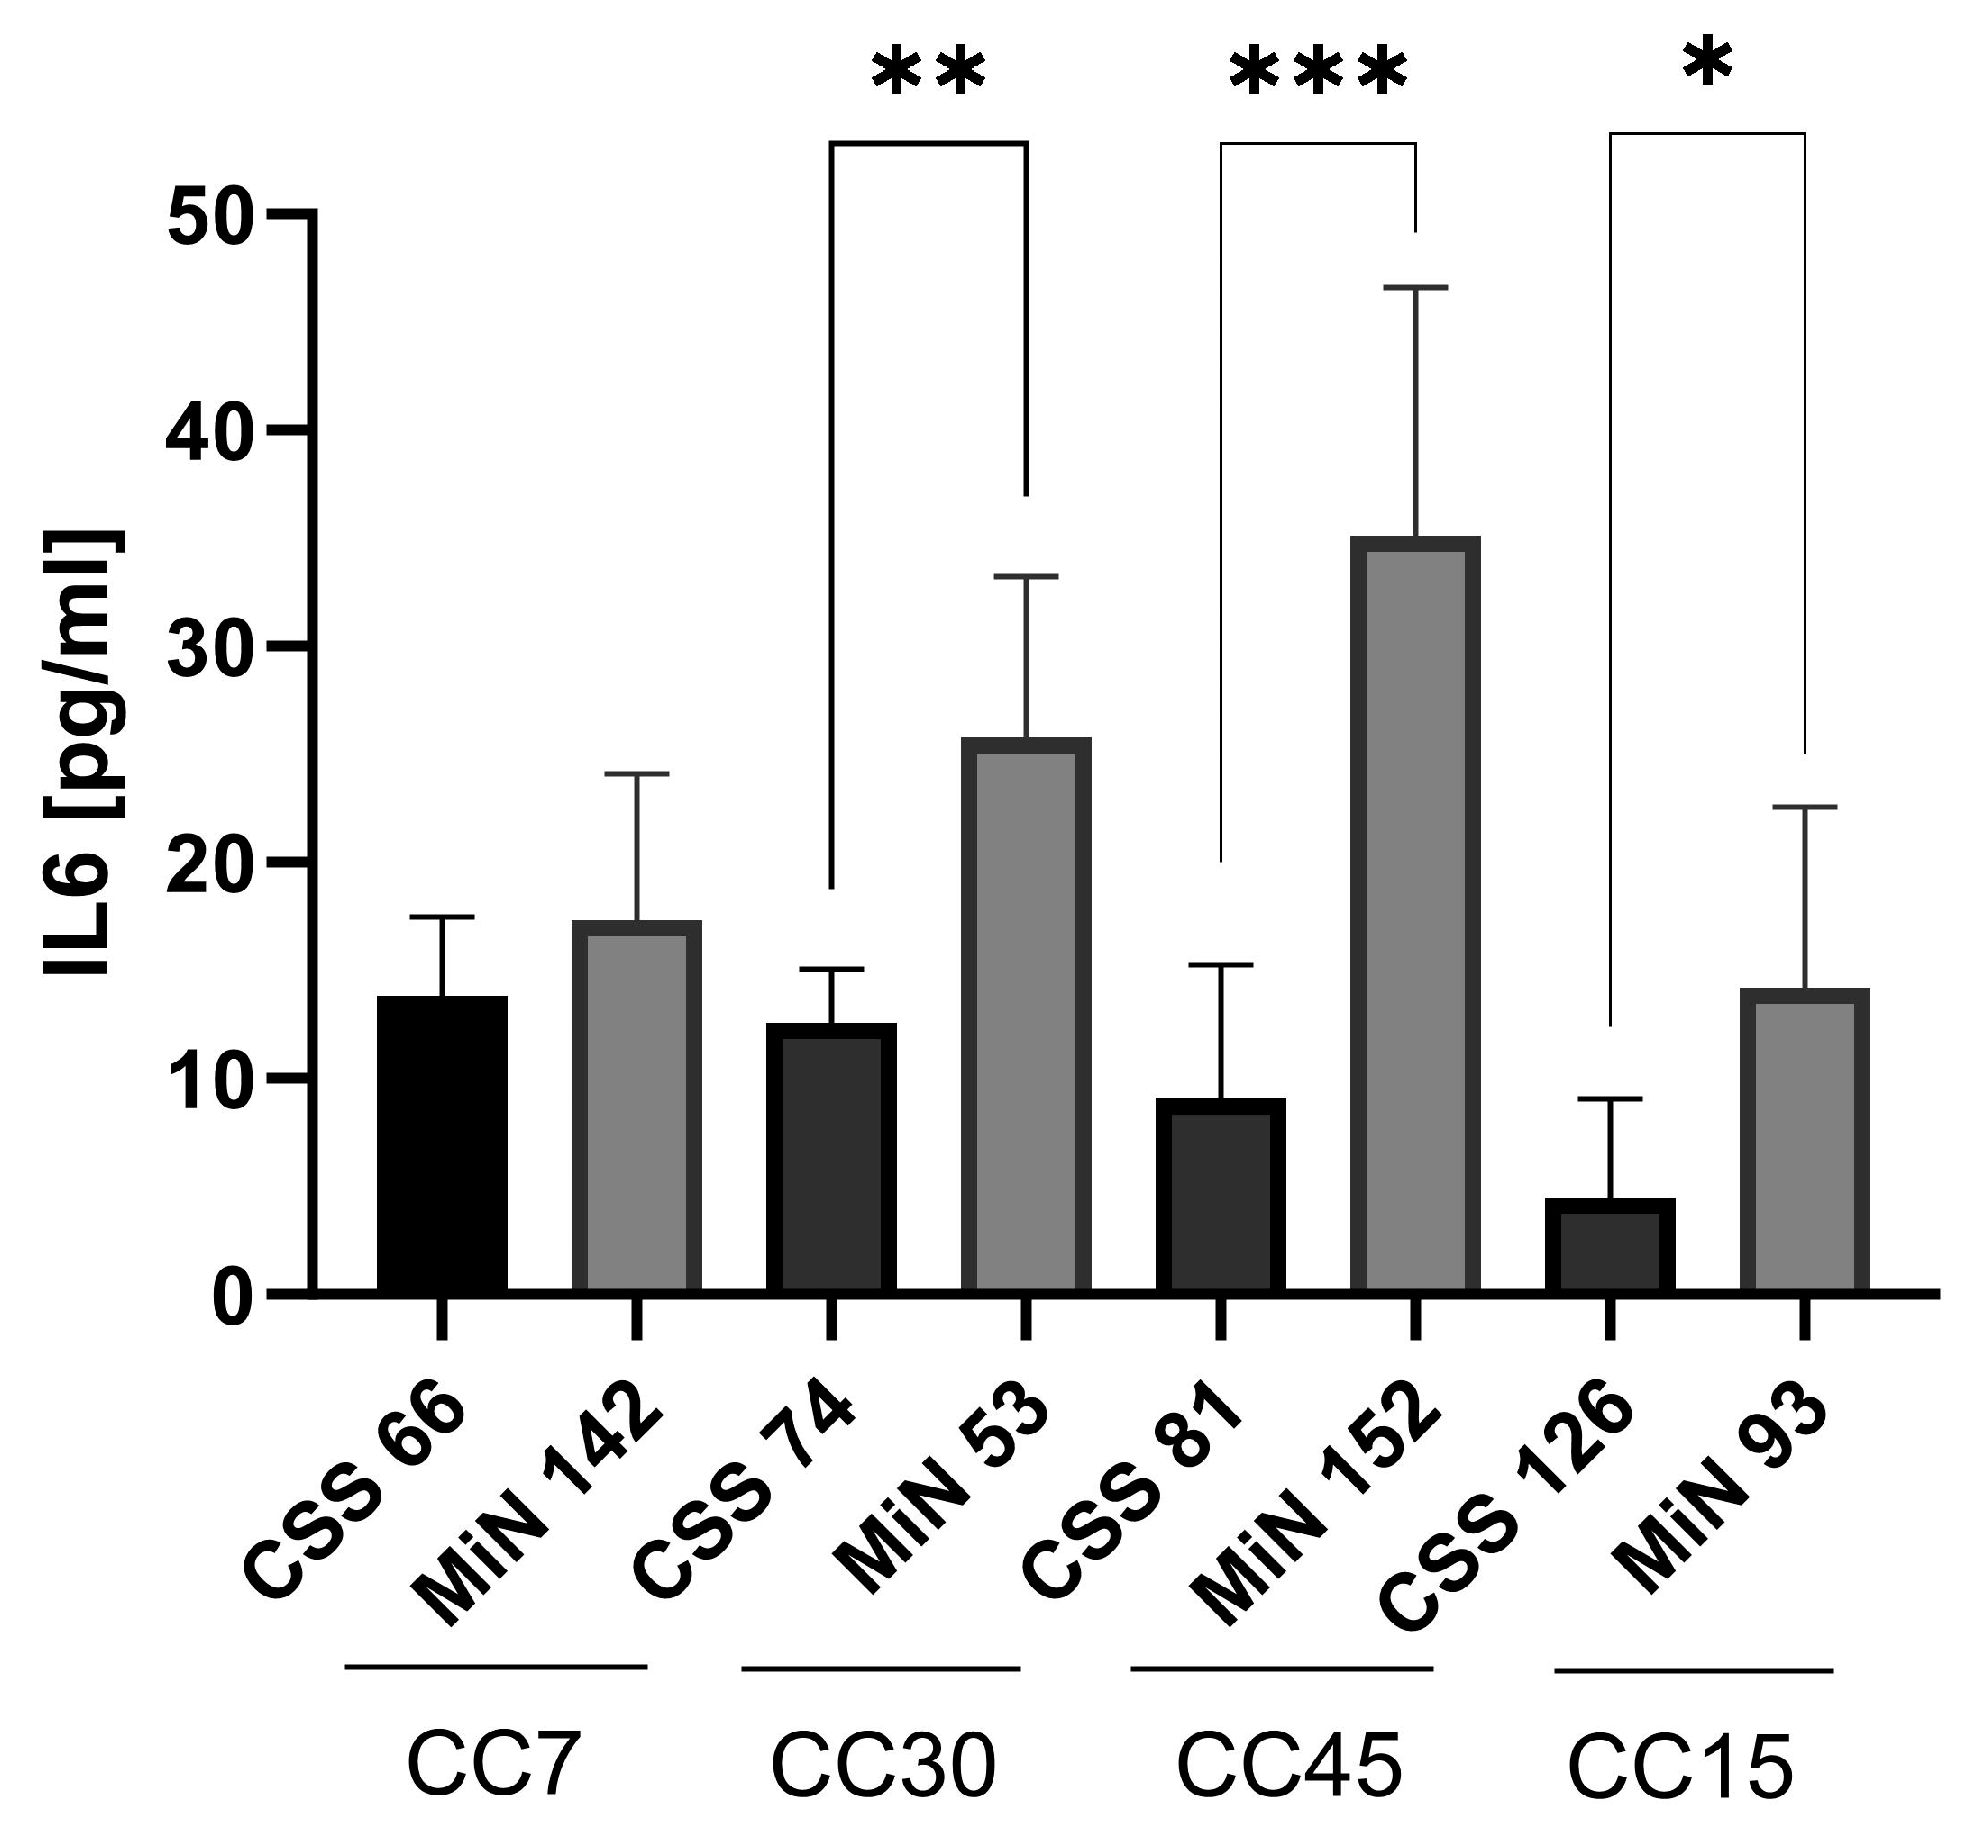
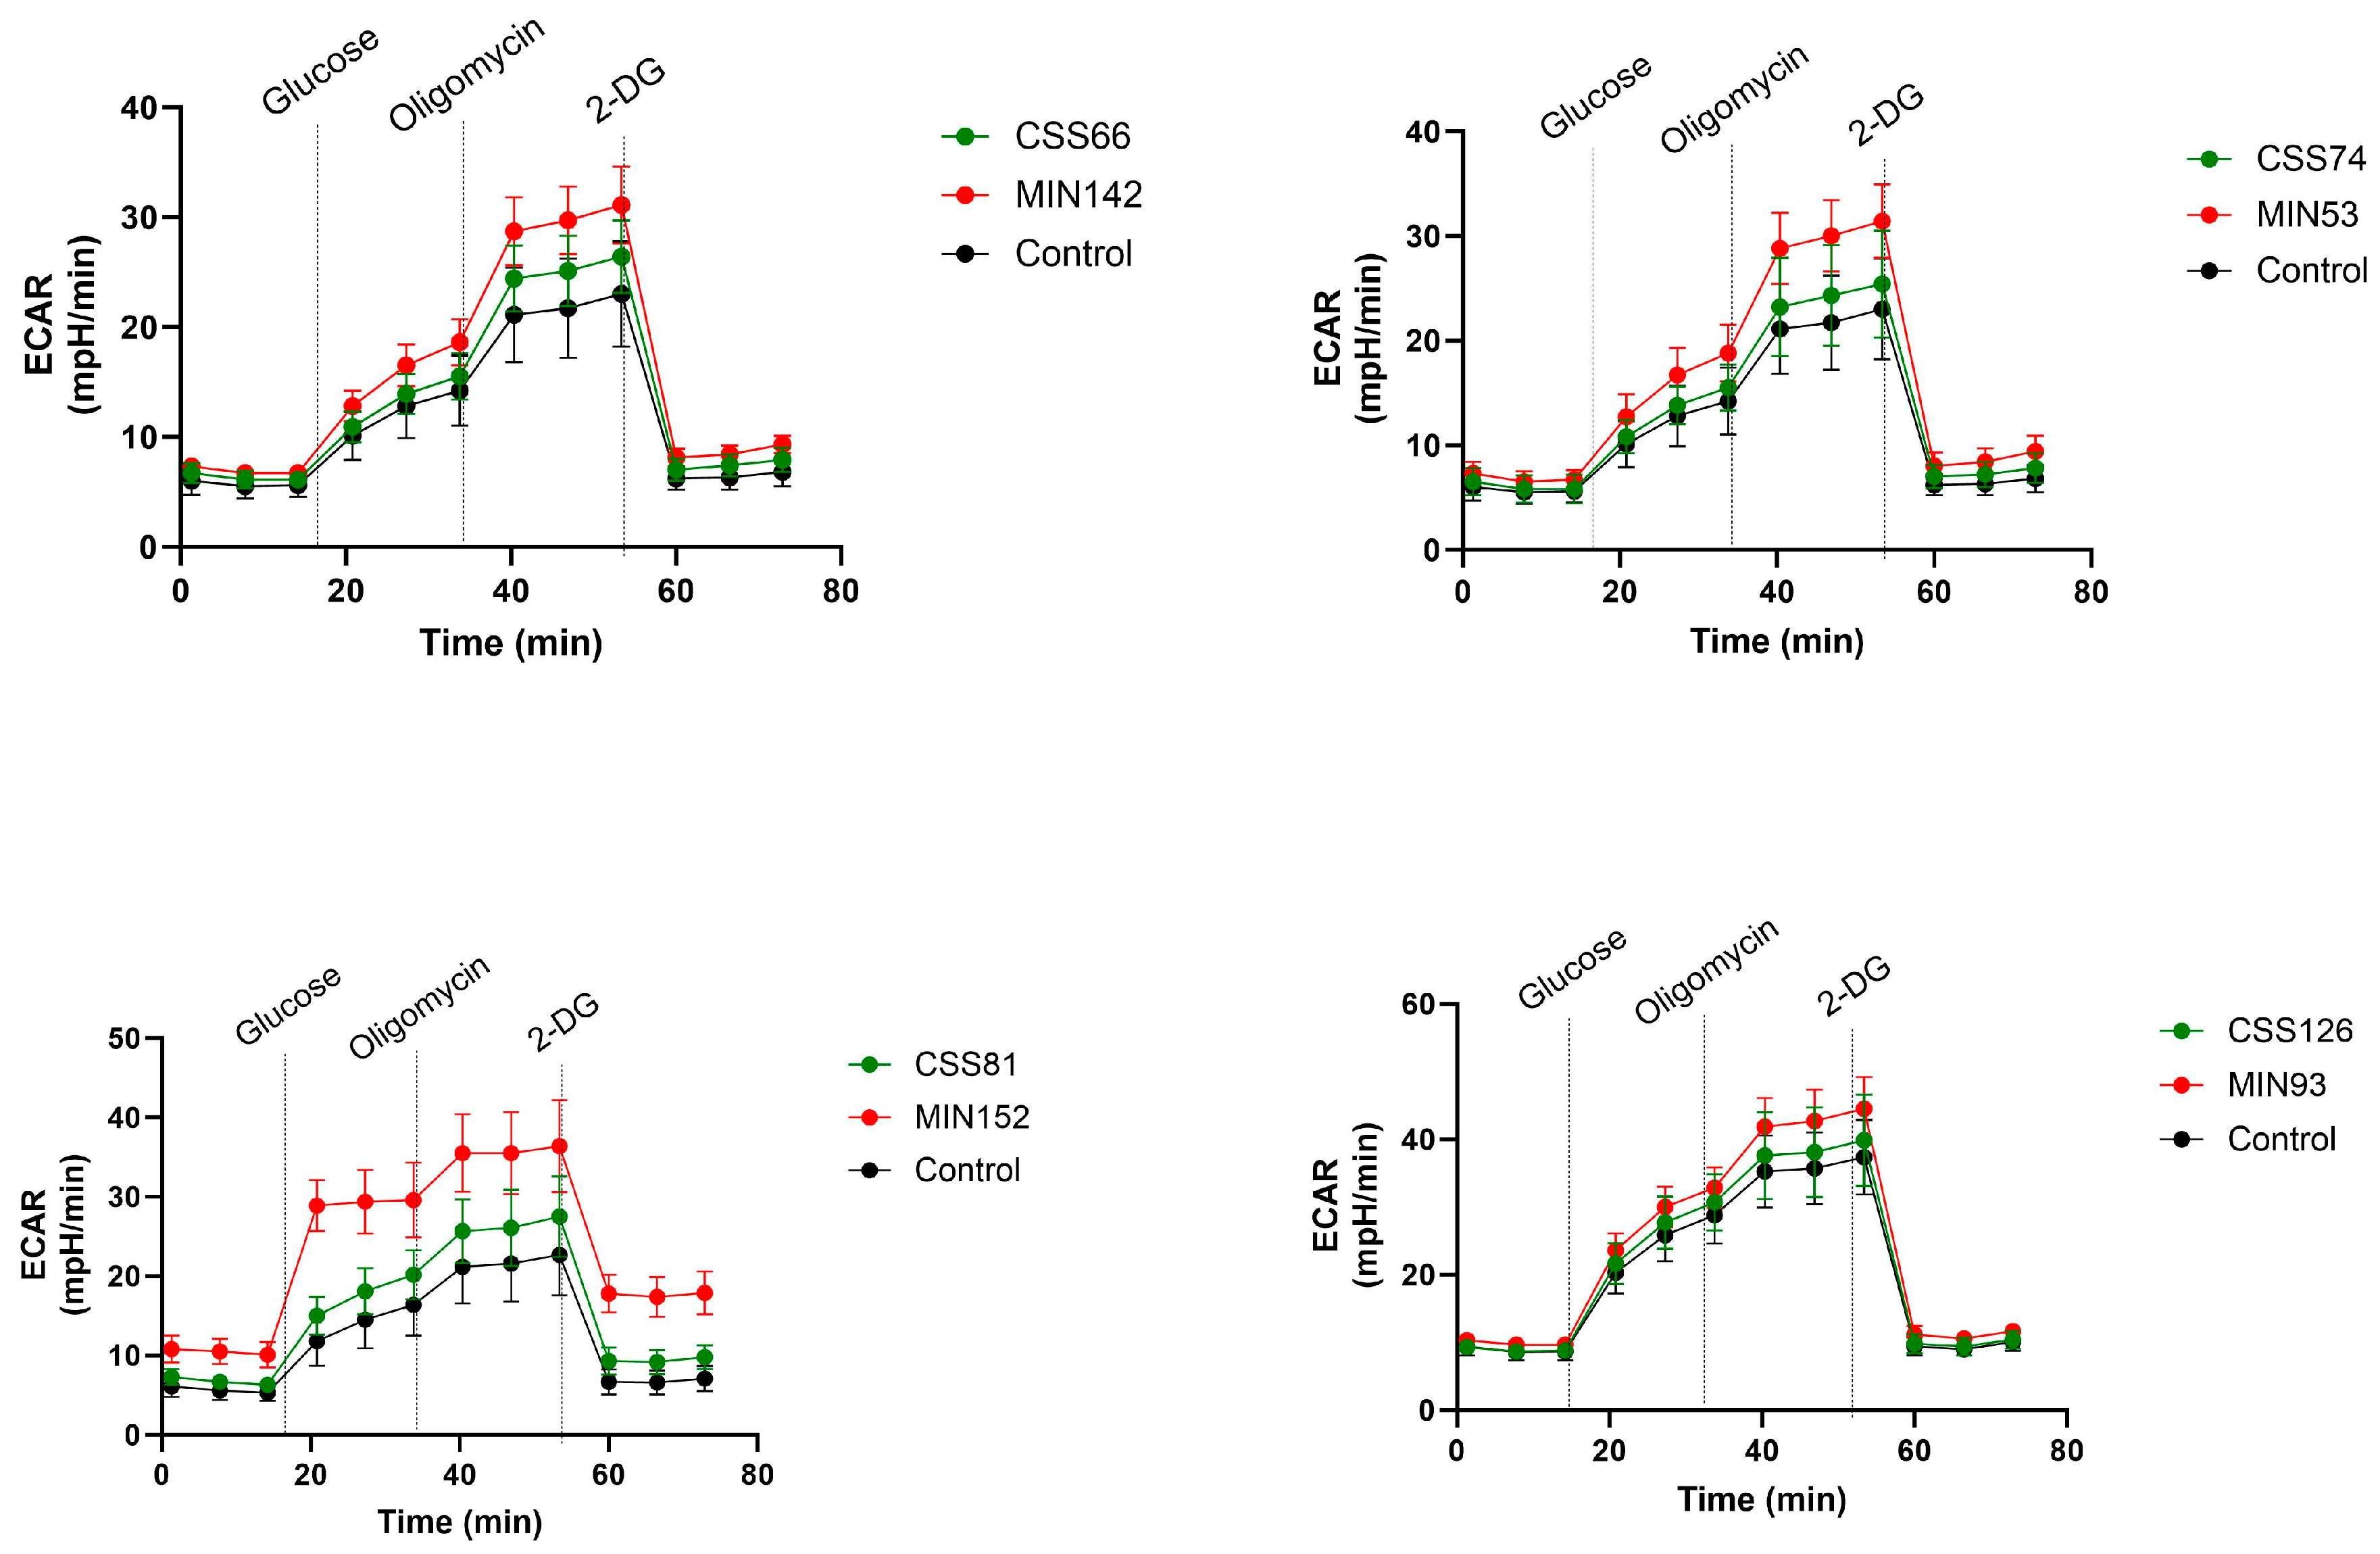
2.5. S. aureus Isolated from CRS Donors Induced Less Cytotoxicity and Glycolysis in Host Cells than Control Strains

Using functional metagenomics data, we investigated whether S. aureus, the primary CRS pathogen, responded differently to the nasal environment in CRS compared to controls. We tested whether staphylococcal isolates from both groups differed in virulence. Four isolates each from control (MiN) and CRS (CSS) patients were selected: CC7 (MIN 142 and CSS60), CC30 (MIN 53 and CSS74), CC45 (MIN 152 and CSS81) and CC15 (MIN 93 and CSS126) (Figure 3). The quantification of cell death showed higher cytotoxicity induced by control isolates compared to CRS strains within each CC, although not all differences were significant due to measurement variability (Figure 3A,B). In addition, the functionality of Agr, the major quorum-sensing regulator of staphylococcal virulence, was investigated using the CAMP test (Figure S4) [25,26]. IL-6 release, the main marker of the inflammatory response in S. aureus infection, was measured by ELISA after 24 h (Figure 4) [27]. A correlation was found between the induction of cell death and the expression of Agr. Control strains showed higher IL-6 and Agr induction than CRS strains (Figure 4 and Figure S4).
The activation of cell death has been linked to the induction of glycolysis [22]. Therefore, we assessed the metabolic response of A549 cells under different conditions using a Seahorse analyser. Glucose was added to stimulate metabolism, oligomycin suppressed oxidative phosphorylation and deoxyglucose (2-DG) inhibited glycolysis. Notably, differences in metabolic activity were observed between the strains, suggesting different effects on cell metabolism (Table S4A). Additionally, differences between control (MIN) and CRS strains were analysed for each pair. Significant differences in glycolysis induction were observed for all pairs, with control strains inducing higher glycolytic responses compared to CRS strains (Figure 5; Table S4B). Furthermore, no changes in ECAR were observed with bacteria alone (Figure S5), suggesting that the metabolic changes were mainly related to infection with A549.
Taken together, the cytotoxicity and glycolysis analyses suggested that CRS isolates were more adapted to host cells than control strains. This adaptation may be an important aspect in the pathogenesis of CRS.

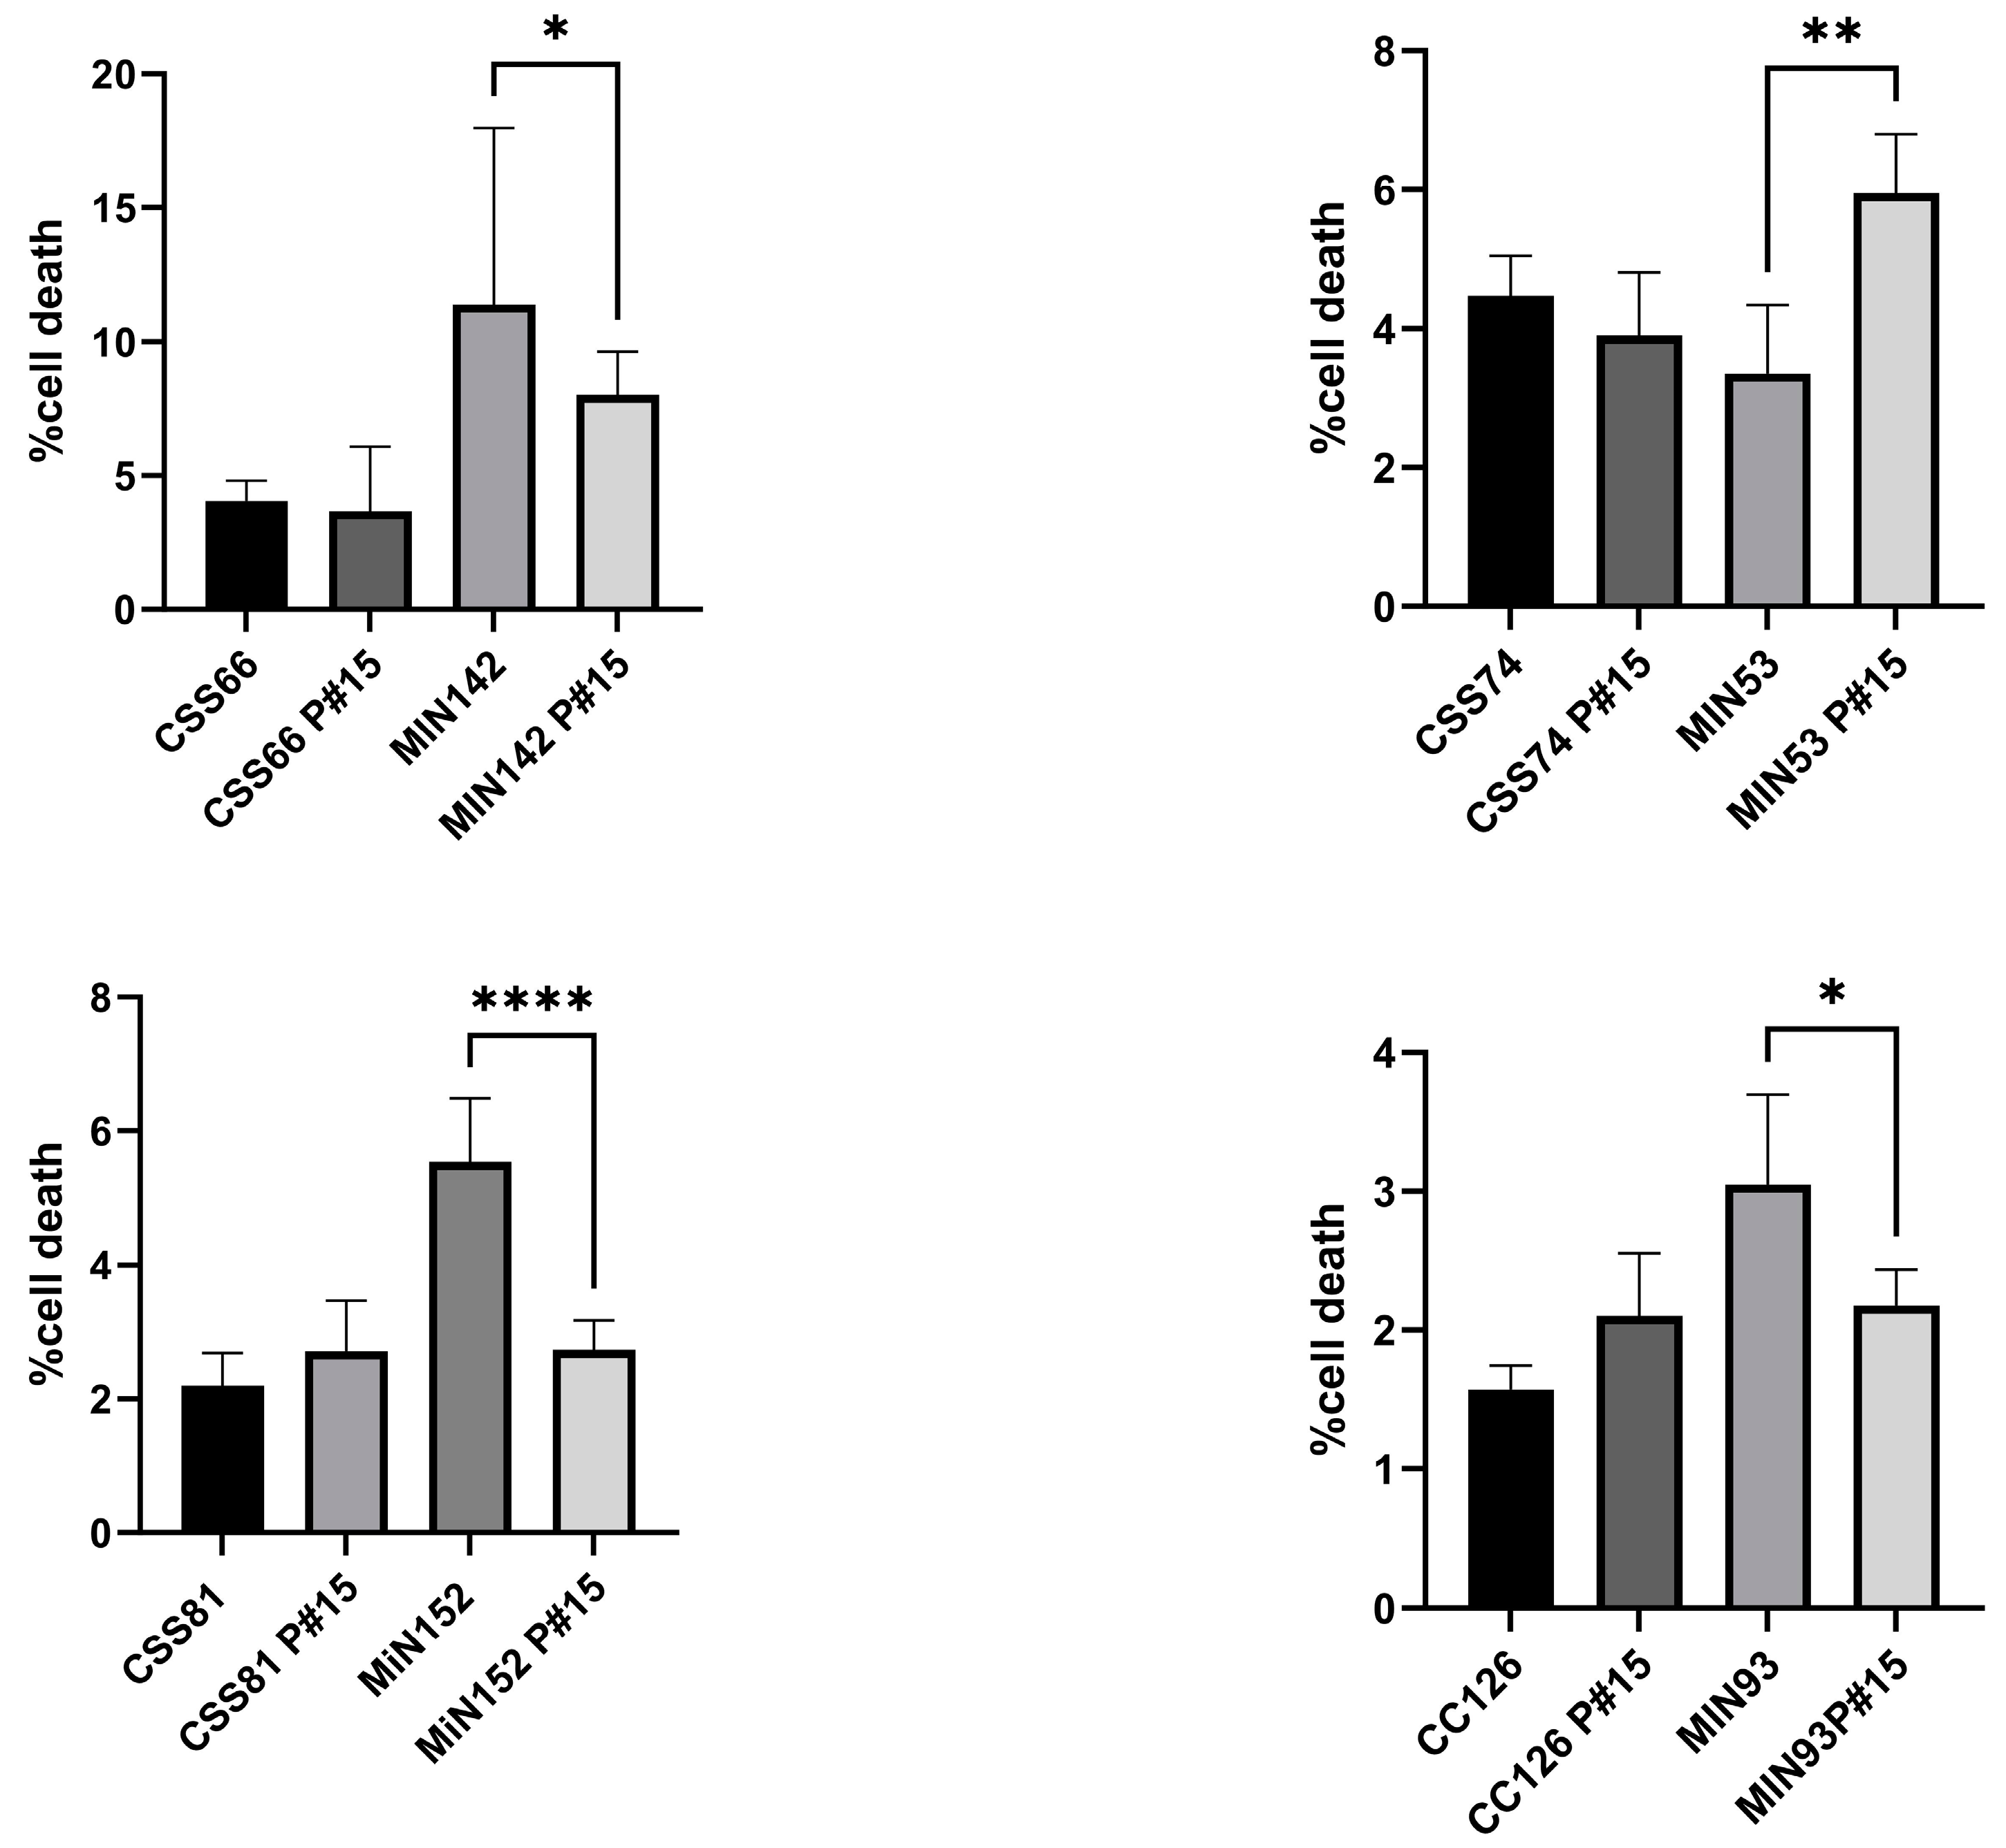
2.6. Cyotoxicity Induced on Host Cells by Control Strains Changed with Serial Passages

We then investigated the effect of in vitro passages on pathogenicity in terms of cell death. We performed daily passages of S. aureus strains from CRS (CSS66, CSS74, CSS81 and CSS126) and control donors (MIN142, MIN53, MiN152 and MIN93) in fresh TSB media for 15 days (passages 1 to 15). Compared to the ancestral isolates, the cytotoxicity induced by the control strains decreased significantly after 15 passages. However, the respective cytotoxic properties were similar for both the ancestral and 15-passage isolates of the CRS strains (Figure 6).

3. Discussion

CRS is a multifactorial disease, which complicates its diagnosis [2]. Dysbiosis in the nasal microbiome has been associated with the development of CRS [28]. In our study, we compared nasal swabs from CRS patients and controls. The nasal microbiota was assessed by conventional culture methods on aerobic and anaerobic agar. As in previous studies, bacterial species showed no significant differences between the CRS and control groups [29]. However, Neisseria sp. was notably more abundant in the control group. Its susceptibility to antibiotics [24] raised questions about its reduced presence in CRS samples. Due to the limited antibiotic samples, no significant association was found between pre-/perioperative antibiotic treatment and the absence of Neisseria sp.
Regardless of the origin of the samples, we observed a negative correlation between the presence of S. aureus and other bacteria, such as Streptococcus sp., Corynebacterium sp. and coagulase-negative Staphylococcus sp. These results are consistent with previous studies [30], where a competitive interaction between these microorganisms was observed.
CRS and control samples were subjected to whole-genome shotgun metagenomics to uncover non-cultivable sinus bacteria [31]. While there were no significant taxonomic differences between the groups (CRS vs. control), the relative abundance of species appeared to change. In contrast, Propionibacterium sp. (22%) and Corynebacterium sp. (7%) were significantly present in control but not CRS samples, consistent with other nasal microbiome studies [10]. In addition, we did not find significant differences in the alpha and beta diversity indices between the two groups, which may have been due to the small cohort size or the sampling techniques.
Although the diversity of the bacterial community appeared to be low, interestingly, functional profiling revealed significant differences between CRS and control samples. Sixty-one pathways showed notable differences. The carbohydrate transport metabolism, ATP synthesis, cofactors and vitamins, photosynthesis and transcription pathways were abundant in CRS. Despite the presence of photosynthetic pathways, Cyanobacteria sp. was not detected [32], suggesting that other non-cultivable species could produce these metabolites. Conversely, lipid metabolic pathways were more prominent in the control microbiome. This suggests that while the bacterial communities may be taxonomically similar, the nasal microenvironments differ in metabolites, which may contribute to greater inflammation in CRS compared to controls [5].
S. aureus, a prominent member of the nasal microbiota and a major pathogen associated with CRS, is strongly associated with invasive disease [16]. However, studies have not directly gauged the invasive S. aureus infection risk from CRS. Some suggest that CRS patients have higher nasal S. aureus colonization, which may increase the risk of invasive disease [33]. In addition, CRS patients often have a significant staphylococcal biofilm prevalence, which may increase the risk of invasive S. aureus infection [34,35]. However, the relationship between S. aureus colonization and invasive disease is complex and influenced by factors such as the host immune response, comorbidities and bacterial virulence [36,37,38].
According to the shotgun metagenomics data, the microenvironment of the nasal cavity was different in the control group and in CRS. Therefore, this environment could be responsible for S. aureus being colonized in one case and pathogenic in the other. The microbiome in control samples showed an increase in lipid metabolism pathways. S. aureus can use the long-chain fatty acids (AFAs) present on the skin and mucosal surfaces as a nutrient source and for outer membrane synthesis [39]. Furthermore, S. aureus is able to evade the antimicrobial properties of AFAs by sequestering host-specific AFAs in membrane vesicles (MVs). This allows S. aureus to colonise the nose [40,41]. In contrast, the microbiome in CRS patients was characterised by the activation of carbohydrate transport metabolism, the synthesis of ATP and cofactors and vitamins. Competition for glucose among all microorganisms is suggested by the activation of carbohydrate transport metabolism. Glucose plays an important role in the regulation of the Agr system, the main quorum-sensing regulator of virulence factors in S. aureus. Several studies have shown that the presence of excess glucose in hyperglycaemic abscesses increases the virulence potential of S. aureus, leading to poorer infection outcomes [42]. The uptake of glucose by S. aureus is influenced by CcpA, a regulator of central carbon metabolism. Assays with ΔccpA mutants have shown reduced Agr activity, suggesting that low glucose availability affects Agr system activity and subsequently virulence factor production in S. aureus through CcpA and ATP levels [42,43]. Therefore, CRS may cause S. aureus to down-regulate virulence factors, thereby promoting its persistence [44,45].
During the course of infection, dynamic metabolic shifts occur in both the host and staphylococci that influence the clearance process. S. aureus orchestrates these shifts by adjusting toxin expression via key regulatory genes such as agr, sarA and sigB, particularly during the transition from acute to chronic infection [21,44,46,47,48,49]. This transition transforms the host–S. aureus interaction into a form of nutrient competition that shapes the pathogen’s survival strategies within the host environment. S. aureus has the ability to induce different forms of cell death, including apoptosis, regulated necrosis (necroptosis) and pyroptosis [50]. While apoptosis exposes the pathogen to extracellular immune defences without causing inflammation, necroptosis and pyroptosis induce robust inflammatory responses that affect immune cell trafficking. In particular, pyroptosis has been shown to be effective in pathogen clearance, in contrast to necroptosis [21,50,51]. Our functional analysis revealed the pronounced induction of cytotoxicity in control isolates co-cultured with lung cells compared to CRS isolates. Given the link between cell death and host glycolysis [36,46,50], we used the Seahorse assay to assess the metabolic activity induced by S. aureus isolates on A549 cells. While all strains induced glycolysis, control-strain-infected cells showed significantly higher lactate production than CRS-infected cells. Host glycolysis is closely linked to pyroptosis and triggers a potent inflammatory response, together with the increased production of reactive oxygen species (ROS), which are critical for the immune response and cell death [21,50]. This mechanism predominates in the acute phase and facilitates the dissemination of S. aureus to other tissues [36], which may be similar to the behaviour of control strains. Conversely, CRS strains exhibit a distinct metabolic profile characterized by reduced glycolysis and increased oxidative phosphorylation. This reduction in glycolysis may deprive host cells of energy and prevent effective defence against S. aureus. In chronic infections associated with staphylococcal biofilms, S. aureus promotes an anti-inflammatory phenotype in macrophages, possibly through lactate transport into immune cells and the subsequent modulation of gene expression, thereby facilitating bacterial persistence [52]. This mechanism may occur in CRS and allow S. aureus to persist in the nose. In addition, S. aureus from CRS strains may induce necroptosis, a caspase-independent cell death mechanism that does not eradicate the pathogen [50]. However, further studies are warranted to elucidate the host modulation in control and CRS staphylococcal isolates.
These findings highlight the contrasting capabilities of control and CRS S. aureus strains: while control strains excel at killing host cells, CRS strains prioritise maintaining cell integrity and promoting bacterial persistence by modulating glycolysis and cell death pathways.
Subculture experiments were used to investigate the phenotypic flexibility of the isolates. Four isolates from each group were subcultured 15 times in fresh TSB. We then analysed the cytotoxicity of each isolate (ancestral and subcultured). Interestingly, ancestral isolates from control donors induced higher cytotoxicity than 15-passaged derivatives. However, the cytotoxicity of the ancestral isolate from CRS patients and its serially passaged forms showed no differences. This may have been due to the more challenging local environment in healthy controls, promoting reversible virulence up-regulation by immune cells and competing bacteria. If this were the cause, the pathogenesis of CRS would be determined by a host factor (or lack thereof) that allows the pathogen to cause relatively unchecked damage.
Infections position the nose as the starting point for S. aureus, leading to potentially life-threatening infections in multiple tissues [16]. The transition of S. aureus from a coloniser/commensal to a pathogen is controlled by host factors. Within the patient, mutation-driven evolution occurs, providing this pathogen with enhanced dissemination and colonisation capabilities for new infections [53]. This occurs mainly during acute infection. However, constant toxin expression requires energy and activates host immune responses to eliminate invaders [54]. To survive, S. aureus modifies virulence factors for host cell entry and evasion, a common scenario in chronic infections such as CRS [55].
Our study had limitations that necessitate the cautious interpretation of the data. The metagenomics quality control excluded many samples, leaving 34 out of 100 for analysis. This limitation may have confounded the detection of species/pathways or differences between CRS and controls. Furthermore, there may have been insufficient representation of the microbial diversity within the ecosystem being studied. As a result, the analysis may have failed to detect subtle taxonomic differences or associations that existed within the population, and it might have exaggerated individual or random properties of the samples considered. In addition, participants did not have known immunodeficiencies or use immunosuppressive medications. However, the limited assessment of the control and CRS groups (particularly in terms of allergies and allergy-related diseases, as shown in Table 1) may have missed or overlooked some immunological conditions and underestimated the inherent variability. In addition, all assays were performed using A549 cells. While A549 cells provide an established in vitro model [56,57,58,59], further work with sinonasal epithelial cells is needed to closely mimic the in vivo scenario.
Although this was a single-centre study with a small metagenomic cohort, it highlighted that the differences between the CRS and control groups were not primarily related to differences in the bacterial microbiome of the nasal sinuses. Instead, they appeared to be rooted in microenvironmental shifts due to the differential metabolite expression by nasal sinus bacteria. These metabolic shifts may influence the immune response and the expression of virulence factors of S. aureus promoting host adaptation. In essence, CRS is a complex condition in which the microbiome plays a critical role, not necessarily in microbial dysbiosis but in alterations of the micronasal environment. Host-induced metabolic changes by colonisation and CRS strains drive different levels of glycolysis activation, enabling S. aureus to disseminate or persist intracellularly, thereby promoting the development of CRS.

4. Materials and Methods

4.1. Study Design and Patient Enrollment

This was a prospective observational study approved by the Ethics Committee of the University Hospital Jena (no. 2018-1175-Material). Participants gave informed consent before participation. Adult controls without nasal/paranasal disease, who had undergone unrelated head and neck surgery, were included. Adult CRS patients were recruited from those requiring endoscopic sinus surgery according to the German guidelines [60]. Briefly, surgery for CRS was indicated (1) in the case of a lack of symptom improvement following a sufficient drug therapy with a sufficiently probable correlate of the symptoms in endoscopy and/or imaging; or (2) if a conservative treatment attempt was not promising, (3) not possible or (4) not desired. CRSwNP patients were graded using the Malm score [61]. Treatment was not influenced by the study. Exclusion criteria were pregnancy, lactation, tumours, immunodeficiency, cystic fibrosis, uncontrolled diabetes, recent antibiotics and the acute bacterial exacerbation of CRS.

4.2. Sample Collection

Participants were orally intubated. Nasal swabs were taken before surgery, stored at −80 °C and analysed for bacteria at the Institute of Medical Microbiology. A total of 374 samples were processed, while 50 underwent shotgun metagenomic sequencing at BGI Tech Solutions.

4.3. Metagenomic Sequencing:

Fifty samples from each group underwent shotgun metagenomic sequencing at BGI Tech Solutions (Hong Kong, China). Only 10 CRS patient swabs and 24 control swabs passed quality control for further analysis. Exclusion criteria included insufficient quantities, degradation, contamination affecting library construction and RNA interference.
Metagenomic sequencing was performed at BGI Tech Solutions (Hong Kong, China) as described in Qin et al. [62]. DNA from all swabs was extracted using a QIAamp PowerFecal Pro DNA Kit (Qiagen, Hilden, Germany). Then, library construction was performed at BGI using the KAPA kit (Roche, Shangai, China) following a series of steps: fragment genomic DNA, end reparation, the addition of A-tailing to the 3′ end, adapter ligation, fragment selection, PCR amplification and product purification and QC. Sequencing was performed on the Illumina XTen for PE150 (Illumnina, San Diego, CA, USA).

4.4. Metagenomics Analysis/Data Processing

Quality control of sequence data: Quality control to remove low-quality reads was performed as described previously [63]. Briefly, all Illumina primer/adapter/linker sequences were removed. Subsequently, low-quality regions (consecutive regions with Phred quality < 20) were trimmed. Finally, all reads were mapped to the human genome with BWA version 0.7.4 [64], and reads with >95% identity and 90% coverage were removed as human DNA contamination.
Taxonomic profiling: Taxonomic annotation of the high-quality reads was performed using MetaPhlAn2 version 2.7.7 [65] with default settings, generating taxonomic relative abundances. Bacterial community profiles were constructed at the phylum, genus and species levels for further analyses.
Functional annotation: The HUMAnN2 pipeline [66] version 0.11.2 was used for the functional annotation of the high-quality reads after quality control. The quantified pathway and gene family abundances in the unit of reads per kilobase (RPK) were then normalised to copies per million (CPM) units by the provided HUMAnN2 script, resulting in transcript-per-million-like (TPM) normalisation. Gene families were then regrouped to Pfam domains for further analyses.

4.5. Cells

All assays in this study were performed using A549. The alveolar epithelial cell line (A549; ATCC CCL-185) is a standardised, consistent cell line that can be cultured under controlled conditions. This cell line is well established in rhinosinusitis and S. aureus studies [56,57,58,59]. The advantages of using this cell line instead of primary nasal cells include the ease of culturing and maintenance and increased proliferative capacity, homogeneity and genetic stability compared to primary nasal cells.

4.6. Cell Death Induction

Four S. aureus isolates from control (MiN) and four from CRS (CSS) patients were selected from the main cluster complex (CC): CC7 (MIN 142 and CSS60), CC30 (MIN 53 and CSS74), CC45 (MIN 152 and CSS81) and CC15 (MIN 93 and CSS126).
The staphylococcal isolates were cultured in tryptic soy broth (TSB) at 37 °C, diluted and cultivated for 3 h. Bacteria were pelleted, washed and suspended in PBS (OD = 1 at 578 nm) and stored at −80 °C. Viable bacteria were confirmed by blood agar plating. A549 lung cells (ATCC: CCL-185) were seeded and infected with S. aureus (MOI, multiplicity of infection = 100) for 90 min; extracellular bacteria were killed with lysostaphin; and the cells were cultured for 24 h. After 24 h, the cells were detached and stained with 10 μg/mL PI, and flow cytometry was used for PI analysis (BD Accuri™ C6, Becton Dickinson GmbH, Heidelberg, Germany).
The MOI = 100 was chosen after preliminary experiments in our group where we tested different MOIs. Cells infected at MOI = 100 were able to internalise the maximum amount of bacteria with a weak cytotoxic effect. In addition, this MOI was suggested by other studies [67,68].

4.7. Measurement of IL-6 by ELISA

Cells were infected as described above, and, 24 h post-infection, the supernatants were collected and centrifuged at 1000 rpm for 5 min to exclude cellular derivatives. The ELISA for IL-6 (DuoSet ELISA, 5 Plates from R&D Systems, Bio-Techne GmbH, Wiesbaden-Nordenstadt, Germany) was performed following the manufacturer’s instructions. IL-6 secretion was measured by a microplate reader at 450 and 570 nm (TECAN Infinite® 200 PRO).

4.8. CAMP Test: Assessment of Agr Activity on Sheep Blood Agar Plates

The CAMP test was used to assess the Agr activity of S. aureus by streaking test samples perpendicularly to an S. aureus strain that produced only β haemolysin and analysing the resulting patterns of haemolysis for the distinct pattern of Agr-controlled δ haemolysin [26]. The S. aureus strains in this study, along with RN4220, were cultivated in 10 mL of TSB for 17–20 h at 37 °C with agitation. For RN4220, an overnight culture (ONC) was streaked in the centre of a blood agar plate and then incubated for 5 h at 37 °C. For the strains, ONCs were streaked vertically to RN4220, and the plate was subsequently incubated for an additional 24 h at 37 °C. After a total of 24 h of incubation, the plates were placed in a 4 °C environment for 1–2 h. Following this cooling period, haemolysis was visually inspected.

4.9. Extracellular Flux Analysis

A549 cells (15,000 per well) were seeded in Seahorse XF96 microplates (Agilent Technologies, Waldbronn, Germany) in DMEM (10% FCS, 1% penicillin/streptomycin; SIGMA, Taufkirchen, Germany) and incubated overnight (37 °C, 5% CO2). The sensor cartridge was calibrated overnight (37 °C).
On the infection day, cells were washed with XF base medium (2 mM glutamine), infected with S. aureus strains (MOI 100) and incubated for 3 h (37 °C, no CO2). Gentamicin (200 µg/mL) eliminated extracellular bacteria, and cells were incubated for 60 min (37 °C, no CO2). A549 cells were washed twice with XF base medium (2 mM glutamine). The extracellular acidification rate (ECAR) was measured with an XF96e analyser using the Glycolysis Stress Test Kit (Agilent Technologies, Waldbronn, Germany). Measurement cycle: 3 min mixing, 3 min data acquisition (12 points).

4.10. Serial Bacterial Cultivation

Four S. aureus strains from control (MiN) and four from CRS (CSS) patients were selected that belonged to the most common CCs: CC7 (MIN 142 and CSS60), CC30 (MIN 53 and CSS74), CC45 (MIN 152 and CSS81) and CC15 (MIN 93 and CSS126). Isolates were grown on blood agar plates; 1 was colony picked, dissolved in 50 mL TSB and incubated for 17 h (160 rpm, 37 °C). Fresh medium was applied every 17 h (1:100 dilution), with 15 culture–transfer cycles for all strains.

4.11. Microarray-Based Characterisation of S. aureus Isolates

S. aureus isolates were genotyped via microarray (FZMB, Bad Langensalza, Germany). The array covered 333 targets from around 170 genes, detecting virulence, resistance, typing markers and strain/clonal complex assignment. Protocols and sequences were previously described [69,70]. S. aureus was cultivated on blood agar, DNA was prepared and linear amplification with specific primers was performed, followed by biotin-16-dUTP incorporation. Hybridisation with array probes was then performed, followed by streptavidin horseradish peroxidase incubation and dye addition, causing local precipitation. Microarrays were photographed and analysed using an InterVision reading device (InterVision, Bad Langensalza, Germany). The selection of the S. aureus isolates was performed at random, with 49 control strains and 51 CRS strains being selected.

4.12. Statistical Analysis

Statistical analysis utilised IBM SPSS Statistics 19, R version 4.0.2 (SPSS Inc, Chicago, USA) and GraphPad Prism version 10.0.0 for Windows (GraphPad Software, Boston, MA USA, www.graphpad.com accessed on 9 February 2024) Demographics and baseline differences were assessed with Pearson’s chi-square and Mann–Whitney U-tests for age. Bacterial presence, co-isolation, clonal complexes and gene frequency were analysed with Fisher’s exact test.
Alpha diversity (Shannon, Simpson) was calculated with the R package vegan [71]; differences were tested with the Wilcoxon rank sum test. To estimate community dissimilarities, Bray–Curtis distances were calculated using the R package vegan based on the relative genus abundance. Abundance comparisons used the indicator value (IndVal) labdsv package [72] for genera, pathways and Pfams with ≥10% prevalence. Additional tests were performed, including unpaired t tests, two-way ANOVA and Tukey’s post hoc test.

5. Conclusions

To summarise, this pioneering study, although conducted in a single centre with a limited metagenomic cohort, sheds important light on chronic rhinosinusitis (CRS). Contrary to the conventional understanding, the differences between the CRS and control groups were not primarily due to variations in the nasal sinus bacterial microbiome. Instead, the study revealed a compelling sequence of microenvironmental changes driven by the distinct metabolite expression of nasal sinus bacteria.
These metabolic nuances, in turn, exert a significant influence on the immune response and the expression of virulence factors in S. aureus, fostering an environment conducive to host adaptation. In essence, CRS emerges as a complex interplay in which the microbiome plays a critical role, not in microbial dysbiosis per se but in orchestrating subtle changes in the micronasal environment.
The host-induced metabolic changes, orchestrated by both colonising and CRS strains, set the stage for different levels of glycolysis activation. This activation, intriguingly, enables S. aureus to either disseminate or persist intracellularly, ultimately contributing to the complex development of CRS. This study invites us to reconsider our understanding of CRS as a dynamic and multifaceted condition in which the microbiome, rather than causing dysregulation, plays a pivotal role in shaping the micronasal landscape.

Supplementary Materials

The following supporting information can be downloaded at: https://www.mdpi.com/article/10.3390/ijms25042229/s1.

Author Contributions

Conceptualisation: L.T., S.M. (Stefan Monecke), R.E. and O.G.-L.; methodology: S.W., R.S., J.P., A.R., E.M., R.A. and S.M. (Sylvia Müller); software: R.S. and S.M. (Stefan Monecke); validation and formal analysis: L.T., S.M. (Stefan Monecke), R.E. and O.G.-L.; investigation: L.T., S.M. (Stefan Monecke), R.E., B.L. and O.G.-L.; resources and funding acquisition: S.M. (Stefan Monecke), R.E., B.L. and O.G.-L. and L.T.; writing—original draft: L.T.; writing—review and editing: S.M. (Stefan Monecke), R.E., O.G.-L. and L.T.; discussion of results: S.M. (Stefan Monecke), R.E., B.L., O.G.-L. and L.T. All authors have read and agreed to the published version of the manuscript.

Funding

This study was partly supported by the Integrated Research and Treatment Center—Center for Sepsis Control and Care (BMBF; 01EO1502, StaphMicroNose, CSCC), JPIAMR2022-070 (BMBF, 01K12306 StophStaphGrowth)—Optimisation of bi-therapy inhibition of Staphylococcus aureus in persistent and bacteremic infections; the ADA (BMBF, 13GW0456C)—Adaptable decentralised diagnostics for veterinary and human medicine; and Mesinflame (BMBF, 01EC1901B) and ResiCheck (DFG, 13GW0422C)—Development of innovative immunological laboratory and point-of-care tests for the detection of modified penicillin binding proteins in clinical isolates of S. aureus/MRSA. In addition, we received support from the Balance of the Microverse (DFG; EXC 2051—Project-ID 390713860).

Institutional Review Board Statement

The study was conducted in accordance with the Declaration of Helsinki and approved by the Ethics Committee of the University Hospital Jena (no. 2018-1175-Material).

Informed Consent Statement

Written informed consent was obtained from all subjects involved in the study.

Data Availability Statement

The original contributions presented in the study are included in the article and Supplementary Material, further inquiries can be directed to the corresponding author.

Acknowledgments

We would like to thank Andreas Mueller from the ENT Department, Waldklinikum Gera, Germany, and Katja Otto and Katja Scherf from the ENT Department, Jena University Hospital, Germany, for the biopsy logistics. Furthermore, we thank Gianni Panagiotou for his help with the bioinformatics.

Conflicts of Interest

The authors declare no conflicts of interest.

References

  1. Dietz de Loos, D.; Lourijsen, E.S.; Wildeman, M.A.M.; Freling, N.J.M.; Wolvers, M.D.J.; Reitsma, S.; Fokkens, W.J. Prevalence of chronic rhinosinusitis in the general population based on sinus radiology and symptomatology. J. Allergy Clin. Immunol. 2019, 143, 1207–1214. [Google Scholar] [CrossRef] [PubMed]
  2. Hellings, P.W. SWOT Analysis of Chronic Rhinosinusitis Care Anno 2022. J. Allergy Clin. Immunol. Pract. 2022, 10, 1468–1471. [Google Scholar] [CrossRef]
  3. Bachert, C.; Pawankar, R.; Zhang, L.; Bunnag, C.; Fokkens, W.J.; Hamilos, D.L.; Jirapongsananuruk, O.; Kern, R.; Meltzer, E.O.; Mullol, J.; et al. ICON: Chronic rhinosinusitis. World Allergy Organ. J. 2014, 7, 25. [Google Scholar] [CrossRef]
  4. Min, J.Y.; Tan, B.K. Risk factors for chronic rhinosinusitis. Curr. Opin. Allergy Clin. Immunol. 2015, 15, 1–13. [Google Scholar] [CrossRef] [PubMed]
  5. Sedaghat, A.R.; Kuan, E.C.; Scadding, G.K. Epidemiology of Chronic Rhinosinusitis: Prevalence and Risk Factors. J. Allergy Clin. Immunol. Pract. 2022, 10, 1395–1403. [Google Scholar] [CrossRef]
  6. Bachert, C.; Marple, B.; Schlosser, R.J.; Hopkins, C.; Schleimer, R.P.; Lambrecht, B.N.; Bröker, B.M.; Laidlaw, T.; Song, W.J. Adult chronic rhinosinusitis. Nat. Rev. Dis. Primers 2020, 6, 86. [Google Scholar] [CrossRef] [PubMed]
  7. Okano, M.; Fujiwara, T.; Kariya, S.; Higaki, T.; Haruna, T.; Matsushita, O.; Noda, Y.; Makihara, S.; Kanai, K.; Noyama, Y.; et al. Cellular responses to Staphylococcus aureus alpha-toxin in chronic rhinosinusitis with nasal polyps. Allergol. Int. 2014, 63, 563–573. [Google Scholar] [CrossRef]
  8. Haruna, T.; Kariya, S.; Fujiwara, T.; Higaki, T.; Makihara, S.; Kanai, K.; Fujiwara, R.; Iwasaki, S.; Noguchi, Y.; Nishizaki, K.; et al. Association between impaired IL-10 production following exposure to Staphylococcus aureus enterotoxin B and disease severity in eosinophilic chronic rhinosinusitis. Allergol. Int. 2018, 67, 392–398. [Google Scholar] [CrossRef]
  9. Cho, S.W.; Kim, D.Y.; Choi, S.; Won, S.; Kang, H.R.; Yi, H. Microbiome profiling of uncinate tissue and nasal polyps in patients with chronic rhinosinusitis using swab and tissue biopsy. PLoS ONE 2021, 16, e0249688. [Google Scholar] [CrossRef]
  10. Psaltis, A.J.; Mackenzie, B.W.; Cope, E.K.; Ramakrishnan, V.R. Unraveling the role of the microbiome in chronic rhinosinusitis. J. Allergy Clin. Immunol. 2022, 149, 1513–1521. [Google Scholar] [CrossRef]
  11. Paramasivan, S.; Bassiouni, A.; Shiffer, A.; Dillon, M.R.; Cope, E.K.; Cooksley, C.; Ramezanpour, M.; Moraitis, S.; Ali, M.J.; Bleier, B.; et al. The international sinonasal microbiome study: A multicentre, multinational characterization of sinonasal bacterial ecology. Allergy 2020, 75, 2037–2049. [Google Scholar] [CrossRef]
  12. Chegini, Z.; Shariati, A.; Asghari, A.; Rajaeih, S.; Ghorbani, M.; Jalessi, M.; Mirshekar, M.; Razavi, S. Molecular analysis of dominant paranasal sinus bacteria in patients with and without chronic rhinosinusitis. Arch. Microbiol. 2022, 204, 327. [Google Scholar] [CrossRef] [PubMed]
  13. Brown, A.F.; Leech, J.M.; Rogers, T.R.; McLoughlin, R.M. Staphylococcus aureus Colonization: Modulation of Host Immune Response and Impact on Human Vaccine Design. Front. Immunol. 2014, 4, 507. [Google Scholar] [CrossRef] [PubMed]
  14. Thunberg, U.; Söderquist, B.; Hugosson, S. Bacterial findings in optimised sampling and characterisation of S. aureus in chronic rhinosinusitis. Eur. Arch. Otorhinolaryngol. 2017, 274, 311–319. [Google Scholar] [CrossRef] [PubMed]
  15. Ramakrishnan, V.R.; Feazel, L.M.; Abrass, L.J.; Frank, D.N. Prevalence and abundance of Staphylococcus aureus in the middle meatus of patients with chronic rhinosinusitis, nasal polyps, and asthma. Int. Forum Allergy Rhinol. 2013, 3, 267–271. [Google Scholar] [CrossRef] [PubMed]
  16. von Eiff, C.; Becker, K.; Machka, K.; Stammer, H.; Peters, G. Nasal carriage as a source of Staphylococcus aureus bacteremia. Study Group. N. Engl. J. Med. 2001, 344, 11–16. [Google Scholar] [CrossRef] [PubMed]
  17. Thunberg, U.; Hugosson, S.; Ehricht, R.; Monecke, S.; Müller, E.; Cao, Y.; Stegger, M.; Söderquist, B. Long-Term Sinonasal Carriage of Staphylococcus aureus and Anti-Staphylococcal Humoral Immune Response in Patients with Chronic Rhinosinusitis. Microorganisms 2021, 9, 256. [Google Scholar] [CrossRef] [PubMed]
  18. Sakr, A.; Brégeon, F.; Mège, J.L.; Rolain, J.M.; Blin, O. Staphylococcus aureus Nasal Colonization: An Update on Mechanisms, Epidemiology, Risk Factors, and Subsequent Infections. Front. Microbiol. 2018, 9, 2419. [Google Scholar] [CrossRef] [PubMed]
  19. Song, W.J.; Lee, J.H.; Won, H.K.; Bachert, C. Chronic Rhinosinusitis with Nasal Polyps in Older Adults: Clinical Presentation, Pathophysiology, and Comorbidity. Curr. Allergy Asthma Rep. 2019, 19, 46. [Google Scholar] [CrossRef]
  20. Xu, Z.; Yan, J.; Wen, W.; Zhang, N.; Bachert, C. Pathophysiology and management of Staphylococcus aureus in nasal polyp disease. Expert. Rev. Clin. Immunol. 2023, 19, 981–992. [Google Scholar] [CrossRef]
  21. Prince, A.; Wong Fok Lung, T. Consequences of Metabolic Interactions during Staphylococcus aureus Infection. Toxins 2020, 12, 581. [Google Scholar] [CrossRef]
  22. Wickersham, M.; Wachtel, S.; Wong Fok Lung, T.; Soong, G.; Jacquet, R.; Richardson, A.; Parker, D.; Prince, A. Metabolic Stress Drives Keratinocyte Defenses against Staphylococcus aureus Infection. Cell Rep. 2017, 18, 2742–2751. [Google Scholar] [CrossRef]
  23. Wong Fok Lung, T.; Chan, L.C.; Prince, A.; Yeaman, M.R.; Archer, N.K.; Aman, M.J.; Proctor, R.A. Staphylococcus aureus adaptive evolution: Recent insights on how immune evasion, immunometabolic subversion and host genetics impact vaccine development. Front. Cell Infect. Microbiol. 2022, 12, 1060810. [Google Scholar] [CrossRef]
  24. Murray, P.R.; Baron, E.J.; Jorgensen, J.H.; Landry, M.L.; Pfaller, M.A. Manual of Clinical Microbiology, 9th ed.; ASM Press: Washington, DC, USA, 2007. [Google Scholar]
  25. Novick, R.P.; Geisinger, E. Quorum sensing in staphylococci. Annu. Rev. Genet. 2008, 42, 541–564. [Google Scholar] [CrossRef] [PubMed]
  26. Traber, K.E.; Lee, E.; Benson, S.; Corrigan, R.; Cantera, M.; Shopsin, B.; Novick, R.P. Agr function in clinical Staphylococcus aureus isolates. Microbiol. (Read.) 2008, 154, 2265–2274. [Google Scholar] [CrossRef] [PubMed]
  27. Rammal, A.; Tewfik, M.; Rousseau, S. Differences in RANTES and IL-6 levels among chronic rhinosinusitis patients with predominant gram-negative and gram-positive infection. J. Otolaryngol. Head. Neck Surg. 2017, 46, 7. [Google Scholar] [CrossRef] [PubMed]
  28. Cope, E.K.; Goldberg, A.N.; Pletcher, S.D.; Lynch, S.V. Compositionally and functionally distinct sinus microbiota in chronic rhinosinusitis patients have immunological and clinically divergent consequences. Microbiome 2017, 5, 53. [Google Scholar] [CrossRef] [PubMed]
  29. Niederfuhr, A.; Kirsche, H.; Riechelmann, H.; Wellinghausen, N. The bacteriology of chronic rhinosinusitis with and without nasal polyps. Arch. Otolaryngol. Head. Neck Surg. 2009, 135, 131–136. [Google Scholar] [CrossRef] [PubMed]
  30. Nair, N.; Biswas, R.; Götz, F.; Biswas, L. Impact of Staphylococcus aureus on pathogenesis in polymicrobial infections. Infect. Immun. 2014, 82, 2162–2169. [Google Scholar] [CrossRef] [PubMed]
  31. Quince, C.; Walker, A.W.; Simpson, J.T.; Loman, N.J.; Segata, N. Shotgun metagenomics, from sampling to analysis. Nat. Biotechnol. 2017, 35, 833–844. [Google Scholar] [CrossRef]
  32. Kim, A.S.; Willis, A.L.; Laubitz, D.; Sharma, S.; Song, B.H.; Chiu, A.G.; Le, C.H.; Chang, E.H. The effect of maxillary sinus antrostomy size on the sinus microbiome. Int. Forum Allergy Rhinol. 2019, 9, 30–38. [Google Scholar] [CrossRef] [PubMed]
  33. Laudien, M.; Gadola, S.D.; Podschun, R.; Hedderich, J.; Paulsen, J.; Reinhold-Keller, E.; Csernok, E.; Ambrosch, P.; Hellmich, B.; Moosig, F.; et al. Nasal carriage of Staphylococcus aureus and endonasal activity in Wegener s granulomatosis as compared to rheumatoid arthritis and chronic Rhinosinusitis with nasal polyps. Clin. Exp. Rheumatol. 2010, 28, 51–55. [Google Scholar] [PubMed]
  34. Shaghayegh, G.; Cooksley, C.; Ramezanpour, M.; Wormald, P.J.; Psaltis, A.J.; Vreugde, S. Chronic Rhinosinusitis, S. aureus Biofilm and Secreted Products, Inflammatory Responses, and Disease Severity. Biomedicines 2022, 10, 1362. [Google Scholar] [CrossRef] [PubMed]
  35. Foreman, A.; Jervis-Bardy, J.; Boase, S.J.; Tan, L.; Wormald, P.J. Noninvasive Staphylococcus aureus biofilm determination in chronic rhinosinusitis by detecting the exopolysaccharide matrix component poly-N-acetylglucosamine. Int. Forum Allergy Rhinol. 2013, 3, 83–88. [Google Scholar] [CrossRef] [PubMed]
  36. Howden, B.P.; Giulieri, S.G.; Wong Fok Lung, T.; Baines, S.L.; Sharkey, L.K.; Lee, J.Y.H.; Hachani, A.; Monk, I.R.; Stinear, T.P. Staphylococcus aureus host interactions and adaptation. Nat. Rev. Microbiol. 2023, 21, 380–395. [Google Scholar] [CrossRef] [PubMed]
  37. Otto, M. Critical Assessment of the Prospects of Quorum-Quenching Therapy for Staphylococcus aureus Infection. Int. J. Mol. Sci. 2023, 24, 25. [Google Scholar] [CrossRef]
  38. Sharara, S.L.; Maragakis, L.L.; Cosgrove, S.E. Decolonization of Staphylococcus aureus. Infect. Dis. Clin. N. Am. 2021, 35, 107–133. [Google Scholar] [CrossRef]
  39. Frank, M.W.; Yao, J.; Batte, J.L.; Gullett, J.M.; Subramanian, C.; Rosch, J.W.; Rock, C.O. Host Fatty Acid Utilization by Staphylococcus aureus at the Infection Site. mBio 2020, 11. [Google Scholar] [CrossRef]
  40. Kengmo Tchoupa, A.; Peschel, A. Staphylococcus aureus Releases Proinflammatory Membrane Vesicles To Resist Antimicrobial Fatty Acids. mSphere 2020, 5, e00804–e00820. [Google Scholar] [CrossRef]
  41. Nguyen, M.T.; Hanzelmann, D.; Härtner, T.; Peschel, A.; Götz, F. Skin-Specific Unsaturated Fatty Acids Boost the Staphylococcus aureus Innate Immune Response. Infect. Immun. 2016, 84, 205–215. [Google Scholar] [CrossRef]
  42. Stephens, A.C.; Thurlow, L.R.; Richardson, A.R. Mechanisms Behind the Indirect Impact of Metabolic Regulators on Virulence Factor Production in Staphylococcus aureus. Microbiol. Spectr. 2022, 10, e0206322. [Google Scholar] [CrossRef]
  43. Rudra, P.; Boyd, J.M. Metabolic control of virulence factor production in Staphylococcus aureus. Curr. Opin. Microbiol. 2020, 55, 81–87. [Google Scholar] [CrossRef] [PubMed]
  44. Tuchscherr, L.; Bischoff, M.; Lattar, S.M.; Noto Llana, M.; Pfortner, H.; Niemann, S.; Geraci, J.; Van de Vyver, H.; Fraunholz, M.J.; Cheung, A.L.; et al. Sigma Factor SigB Is Crucial to Mediate Staphylococcus aureus Adaptation during Chronic Infections. PLoS Pathog. 2015, 11, e1004870. [Google Scholar] [CrossRef] [PubMed]
  45. Siegmund, A.; Afzal, M.A.; Tetzlaff, F.; Keinhorster, D.; Gratani, F.; Paprotka, K.; Westermann, M.; Nietzsche, S.; Wolz, C.; Fraunholz, M.; et al. Intracellular persistence of Staphylococcus aureus in endothelial cells is promoted by the absence of phenol-soluble modulins. Virulence 2021, 12, 1186–1198. [Google Scholar] [CrossRef] [PubMed]
  46. Wong Fok Lung, T.; Monk, I.R.; Acker, K.P.; Mu, A.; Wang, N.; Riquelme, S.A.; Pires, S.; Noguera, L.P.; Dach, F.; Gabryszewski, S.J.; et al. Staphylococcus aureus small colony variants impair host immunity by activating host cell glycolysis and inducing necroptosis. Nat. Microbiol. 2020, 5, 141–153. [Google Scholar] [CrossRef] [PubMed]
  47. Riquelme, S.A.; Wong Fok Lung, T.; Prince, A. Pulmonary Pathogens Adapt to Immune Signaling Metabolites in the Airway. Front. Immunol. 2020, 11, 385. [Google Scholar] [CrossRef] [PubMed]
  48. Tomlinson, K.L.; Prince, A.S.; Wong Fok Lung, T. Immunometabolites Drive Bacterial Adaptation to the Airway. Front. Immunol. 2021, 12, 790574. [Google Scholar] [CrossRef] [PubMed]
  49. Tuchscherr, L.; Pöllath, C.; Siegmund, A.; Deinhardt-Emmer, S.; Hoerr, V.; Svensson, C.M.; Thilo Figge, M.; Monecke, S.; Löffler, B. Clinical S. aureus Isolates Vary in Their Virulence to Promote Adaptation to the Host. Toxins 2019, 11, 135. [Google Scholar] [CrossRef] [PubMed]
  50. Missiakas, D.; Winstel, V. Selective Host Cell Death by Staphylococcus aureus: A Strategy for Bacterial Persistence. Front. Immunol. 2020, 11, 621733. [Google Scholar] [CrossRef]
  51. Horn, C.M.; Kielian, T. Crosstalk Between Staphylococcus aureus and Innate Immunity: Focus on Immunometabolism. Front. Immunol. 2020, 11, 621750. [Google Scholar] [CrossRef]
  52. Yamada, K.J.; Heim, C.E.; Xi, X.; Attri, K.S.; Wang, D.; Zhang, W.; Singh, P.K.; Bronich, T.K.; Kielian, T. Monocyte metabolic reprogramming promotes pro-inflammatory activity and Staphylococcus aureus biofilm clearance. PLoS Pathog. 2020, 16, e1008354. [Google Scholar] [CrossRef] [PubMed]
  53. Young, B.C.; Wu, C.H.; Gordon, N.C.; Cole, K.; Price, J.R.; Liu, E.; Sheppard, A.E.; Perera, S.; Charlesworth, J.; Golubchik, T.; et al. Severe infections emerge from commensal bacteria by adaptive evolution. Elife 2017, 6, 30637. [Google Scholar] [CrossRef] [PubMed]
  54. Joo, H.S.; Chatterjee, S.S.; Villaruz, A.E.; Dickey, S.W.; Tan, V.Y.; Chen, Y.; Sturdevant, D.E.; Ricklefs, S.M.; Otto, M. Mechanism of Gene Regulation by a Staphylococcus aureus Toxin. mBio 2016, 7, e01579-16. [Google Scholar] [CrossRef] [PubMed]
  55. Tuchscherr, L.; Medina, E.; Hussain, M.; Volker, W.; Heitmann, V.; Niemann, S.; Holzinger, D.; Roth, J.; Proctor, R.A.; Becker, K.; et al. Staphylococcus aureus phenotype switching: An effective bacterial strategy to escape host immune response and establish a chronic infection. EMBO Mol. Med. 2011, 3, 129–141. [Google Scholar] [CrossRef] [PubMed]
  56. Winstel, V.; Kühner, P.; Salomon, F.; Larsen, J.; Skov, R.; Hoffmann, W.; Peschel, A.; Weidenmaier, C. Wall Teichoic Acid Glycosylation Governs Staphylococcus aureus Nasal Colonization. mBio 2015, 6, e00632. [Google Scholar] [CrossRef] [PubMed]
  57. Shi, L.; Wu, Y.; Yang, C.; Ma, Y.; Zhang, Q.Z.; Huang, W.; Zhu, X.Y.; Yan, Y.J.; Wang, J.X.; Zhu, T.; et al. Effect of nicotine on Staphylococcus aureus biofilm formation and virulence factors. Sci. Rep. 2019, 9, 20243. [Google Scholar] [CrossRef]
  58. Sachse, F.; von Eiff, C.; Stoll, W.; Becker, K.; Rudack, C. Induction of CXC chemokines in A549 airway epithelial cells by trypsin and staphylococcal proteases—A possible route for neutrophilic inflammation in chronic rhinosinusitis. Clin. Exp. Immunol. 2006, 144, 534–542. [Google Scholar] [CrossRef]
  59. Sachse, F.; von Eiff, C.; Becker, K.; Steinhoff, M.; Rudack, C. Proinflammatory impact of Staphylococcus epidermidis on the nasal epithelium quantified by IL-8 and GRO-alpha responses in primary human nasal epithelial cells. Int. Arch. Allergy Immunol. 2008, 145, 24–32. [Google Scholar] [CrossRef]
  60. Stuck, B.A.; Beule, A.; Jobst, D.; Klimek, L.; Laudien, M.; Lell, M.; Vogl, T.J.; Popert, U. Guideline for “rhinosinusitis”-long version: S2k guideline of the German College of General Practitioners and Family Physicians and the German Society for Oto-Rhino-Laryngology, Head and Neck Surgery. Hno 2018, 66, 38–74. [Google Scholar] [CrossRef] [PubMed]
  61. Malm, L. Assessment and staging of nasal polyposis. Acta Otolaryngol. 1997, 117, 465–467. [Google Scholar] [CrossRef] [PubMed]
  62. Qin, J.; Li, Y.; Cai, Z.; Li, S.; Zhu, J.; Zhang, F.; Liang, S.; Zhang, W.; Guan, Y.; Shen, D.; et al. A metagenome-wide association study of gut microbiota in type 2 diabetes. Nature 2012, 490, 55–60. [Google Scholar] [CrossRef]
  63. Li, J.; Sung, C.Y.; Lee, N.; Ni, Y.; Pihlajamäki, J.; Panagiotou, G.; El-Nezami, H. Probiotics modulated gut microbiota suppresses hepatocellular carcinoma growth in mice. Proc. Natl. Acad. Sci. USA 2016, 113, E1306–E1315. [Google Scholar] [CrossRef] [PubMed]
  64. Li, H. Aligning sequence reads, clone sequences and assembly contigs with BWA-MEM. arXiv 2013, arXiv:1303.3997. [Google Scholar]
  65. Truong, D.T.; Franzosa, E.A.; Tickle, T.L.; Scholz, M.; Weingart, G.; Pasolli, E.; Tett, A.; Huttenhower, C.; Segata, N. MetaPhlAn2 for enhanced metagenomic taxonomic profiling. Nat. Methods 2015, 12, 902–903. [Google Scholar] [CrossRef] [PubMed]
  66. Franzosa, E.A.; McIver, L.J.; Rahnavard, G.; Thompson, L.R.; Schirmer, M.; Weingart, G.; Lipson, K.S.; Knight, R.; Caporaso, J.G.; Segata, N.; et al. Species-level functional profiling of metagenomes and metatranscriptomes. Nat. Methods 2018, 15, 962–968. [Google Scholar] [CrossRef]
  67. Chaumond, E.; Peron, S.; Daniel, N.; Le Gouar, Y.; Guédon, É.; Williams, D.L.; Le Loir, Y.; Jan, G.; Berkova, N. Development of innate immune memory by non-immune cells during Staphylococcus aureus infection depends on reactive oxygen species. Front. Immunol. 2023, 14, 1138539. [Google Scholar] [CrossRef]
  68. Purves, J.; Hussey, S.J.K.; Corscadden, L.; Purser, L.; Hall, A.; Misra, R.; Selley, L.; Monks, P.S.; Ketley, J.M.; Andrew, P.W.; et al. Air pollution induces Staphylococcus aureus USA300 respiratory tract colonization mediated by specific bacterial genetic responses involving the global virulence gene regulators Agr and Sae. Environ. Microbiol. 2022, 24, 4449–4465. [Google Scholar] [CrossRef]
  69. Monecke, S.; Slickers, P.; Ehricht, R. Assignment of Staphylococcus aureus isolates to clonal complexes based on microarray analysis and pattern recognition. FEMS Immunol. Med. Microbiol. 2008, 53, 237–251. [Google Scholar] [CrossRef]
  70. Monecke, S.; Coombs, G.; Shore, A.C.; Coleman, D.C.; Akpaka, P.; Borg, M.; Chow, H.; Ip, M.; Jatzwauk, L.; Jonas, D.; et al. A field guide to pandemic, epidemic and sporadic clones of methicillin-resistant Staphylococcus aureus. PLoS ONE 2011, 6, e17936. [Google Scholar] [CrossRef] [PubMed]
  71. Dixon, P. VEGAN, a package of R functions for community ecology. J. Veg. Sci. 2003, 14, 927–930. [Google Scholar] [CrossRef]
  72. Roberts, D.W. Package “Labdsv” Title Ordination and Multivariate Analysis for Ecology. Available online: https://cran.r-project.org/web/packages/labdsv/labdsv.pdf (accessed on 9 February 2024).
Figure 1. Distribution of the bacterial community in control and CRS samples. (A) Bacterial community composition at the species level of the nasal cavities of control and CRS patients was analysed by conventional culture-dependent techniques. Differences in the proportions between both groups were compared using Fisher’s exact test (** p < 0.01). (B) Sinonasal microbial composition of control and CRS samples was analysed by metagenomics. The composition of the bacterial community at the genus level is shown.
Ijms 25 02229 g001
Figure 2. Metabolic profiles from control and CRS samples. The heatmap depicts metagenomic bacterial community functional annotation based on PFAM, KEGG orthologs and enzyme commission (EC) abundance for both groups. The heatmap’s colour gradient is based on the pathway enrichment in each group (high enrichment in red to low enrichment in blue) and the unit is transcripts per million (TPM).
Ijms 25 02229 g002
Figure 3. Cell death induction by S. aureus isolates from control (MIN) and CRS (CSS) donors. (A) Staphylococcal isolates from control and CRS donors from the main clonal complexes (CC7, CC30, CC45 and CC15) were selected. Human epithelial lung A549 cells (ATCC: CCL-185) were infected, and cell death induction was measured by staining the cells with propidium iodide after 24 h. (B) Proportions of dead cells obtained for staphylococcal isolates from the control and CRS groups. Differences between the proportions of dead cells infected with isolates from both groups were analysed by unpaired t tests (* p < 0.05, ** p < 0.01 and *** p < 0.001). Data are presented as the average of triplicate determinations, and error bars represent the standard deviation.
Ijms 25 02229 g003
Figure 4. IL-6 induced by S. aureus-infected cells. Staphylococcal isolates from control and CRS donors were selected from the major clonal complexes (CC7, CC30, CC45 and CC15). Human lung epithelial A549 cells (ATCC: CCL-185) were infected and the supernatant was analysed by ELISA at 24 h post-infection. Differences in IL-6 release between the isolates from each pair infected were analysed by unpaired t tests (* p < 0.05, ** p < 0.01, *** p < 0.01). Data are presented as the mean of triplicate determinations, and error bars represent the standard deviation.
Ijms 25 02229 g004
Figure 5. S. aureus isolates from the control and CRS groups induced glycolysis in different manners in A549 cells. Metabolic activity of A549 cells was monitored by measuring the extracellular acidification rate (ECAR) of uninfected and infected cells by Seahorse. A549 cells were infected with four different control and CRS S. aureus strains. The additions of glucose, oligomycin and 2-DG (deoxyglucosoe) are indicated. Statistical significance in the assay was compared to PBS alone and between the strains by two-way ANOVA (Table S4A,B).
Ijms 25 02229 g005
Figure 6. Differential cytotoxicity induced by S. aureus isolates and their serially passaged strains. Cytotoxicity induction of S. aureus isolates and serially passaged strains from staphylococcal isolates from the control and CRS groups on human epithelial lung A549 cells. Data are presented as the average of triplicate determinations, and error bars represent the standard deviation. Differences in cell death between the original and serially passed isolates from each pair were analysed by unpaired t tests (* p < 0.05, ** p < 0.01, **** p < 0.01).
Ijms 25 02229 g006
Table 1. Volunteers/probands’ and patients’ characteristics.
Control Volunteers
(N = 128)
Patients with CRS
(N = 246)
ParameterN%N%p *
Gender 0.595
Female5240.69337.8
Male7659.415362.2
Smoking 0.029
Yes3930.53715.0
No8969.520985.0
Allergy 0.812
Yes5341.410743.5
No7558.613956.5
N-ERD 0.002
Yes00187.3
No12810022892.7
Asthma 0.003
Yes75.44618.7
No12194.620081.3
Diabetes 0.074
Yes1612.593.7
No11287.523796.3
CRS type NA
CRSsNPNANA16667.5
CRSwNPNANA8032.5
Pre- or perioperative antibiotic treatment 0.358
Yes2318.05924.0
No10582.018776.0
Mean ± SDMedian, RangeMean ± SDMedian, Rangep **
Age, years53.1 ± 17.255, 18–8949.7 ± 16.250, 18–830.108
MALM scoreNANA1.4 ± 1.12, 0–3NA
* Pearson’s chi-square test; ** Mann–Whitney U-test; N-ERD = NSAID-exacerbated respiratory disease; NA = not applicable.
Table 2. Fisher test of co-isolation of S. aureus with other bacterial species (** p < 0.01; *** p < 0.001).
Bacterial SpeciesFisher Test
Corynebacterium sp.p = 0.003 **
Staphylococcus coag. negativep = 0.055
Streptococcus sp.p = 0.0009 ***
Enterobacteriaceaep > 0.99
Neisseria sp.p = 0.42
Table 3. Virulence-associated markers of S. aureus from CRS cases and controls.
CRS Patient Isolates, NumberCRS Isolates, PercentControl Isolates, NumberControl Isolates, Percent
Species markers (gapA, katA, coA, nuc, spa, sbi)51100.049100.0
agr-group I 3364.73265.3
agr-group II 815.7612.2
agr-group III 917.61122.4
agr-group IV 12.012.0
hld51100.049100.0
tst1713.71224.5
sea47.824.1
sea (N315) = sep815.7714.3
seb12.012.0
sec, sel713.748.2
sed12.000.0
see00.000.0
seh23.9510.2
sej12.000.0
sek, seq00.000.0
ser12.000.0
egc genes (seg, sei, selm, seln, selo, selu)2752.92755.1
ORF CM1400.012.0
lukF/S-hlg51100.049100.0
lukF/S-PV00.000.0
lukF-PV (P83)/lukM12.000.0
lukD2345.12346.9
lukE2447.12244.9
lukX/Y51100.049100.0
hla5098.049100.0
sak3976.53571.4
chp3262.72857.1
scn4996.14387.8
etA12.000.0
etB00.000.0
etD00.036.1
edinA, edinC00.000.0
edinB00.036.1
ACME 00.000.0
Capsule type 51121.61836.7
Capsule type 84078.43163.3
cna2956.92244.9
sasG1529.41530.6
Table 4. Resistance-associated markers of S. aureus from CRS cases and controls.
CRS Patient Isolates, NumberCRS Isolates, PercentControl Isolates, NumberControl Isolates, Percent
mecA *00.012.0
SCCmec Iva *00.012.0
mecC00.000.0
blaZ2956.93775.5
erm(A)35.936.1
erm(B), erm(C), lnu(A), msrA00.000.0
aacA-aphD00.012.0
aadD, aphA3, sat00.000.0
fusC, far100.000.0
tet(K)00.036.1
dfrA, mupR, tet(M), cat, cfr, fexA, van genes 00.000.0
qacC12.000.0
* in a CC30-MRSA-IV (PVL-/tst1-).
Table 5. Clonal complex affiliations of S. aureus from CSS cases and controls.
CRS Patient Isolates. NumberCRS Isolates. PercentControl Isolates. NumberControl Isolates. Percent
CC512.012.0
CC7713.7714.3
CC835.948.2
CC15713.748.2
CC2012.000.0
CC2223.924.1
CC2500.036.1
CC308 *15.7714.3
CC3412.048.2
CC451223.5816.3
CC5012.000.0
CC9700.036.1
CC10123.900.0
CC18212.012.0
CC18823.912.0
CC39835.936.1
ST84800.012.0
TOTAL51100.049100.0
* including one CC30-MRSA-IVa (PVL-/tst1-).
Disclaimer/Publisher’s Note: The statements, opinions and data contained in all publications are solely those of the individual author(s) and contributor(s) and not of MDPI and/or the editor(s). MDPI and/or the editor(s) disclaim responsibility for any injury to people or property resulting from any ideas, methods, instructions or products referred to in the content.

