

Enhancing Vitamin D3 Efficacy: Insights from Complexation with Cyclodextrin Nanosponges and Its Impact on Gut–Brain Axes in Physiology and IBS Syndrome

 ,
, 

 ,
,  and
and 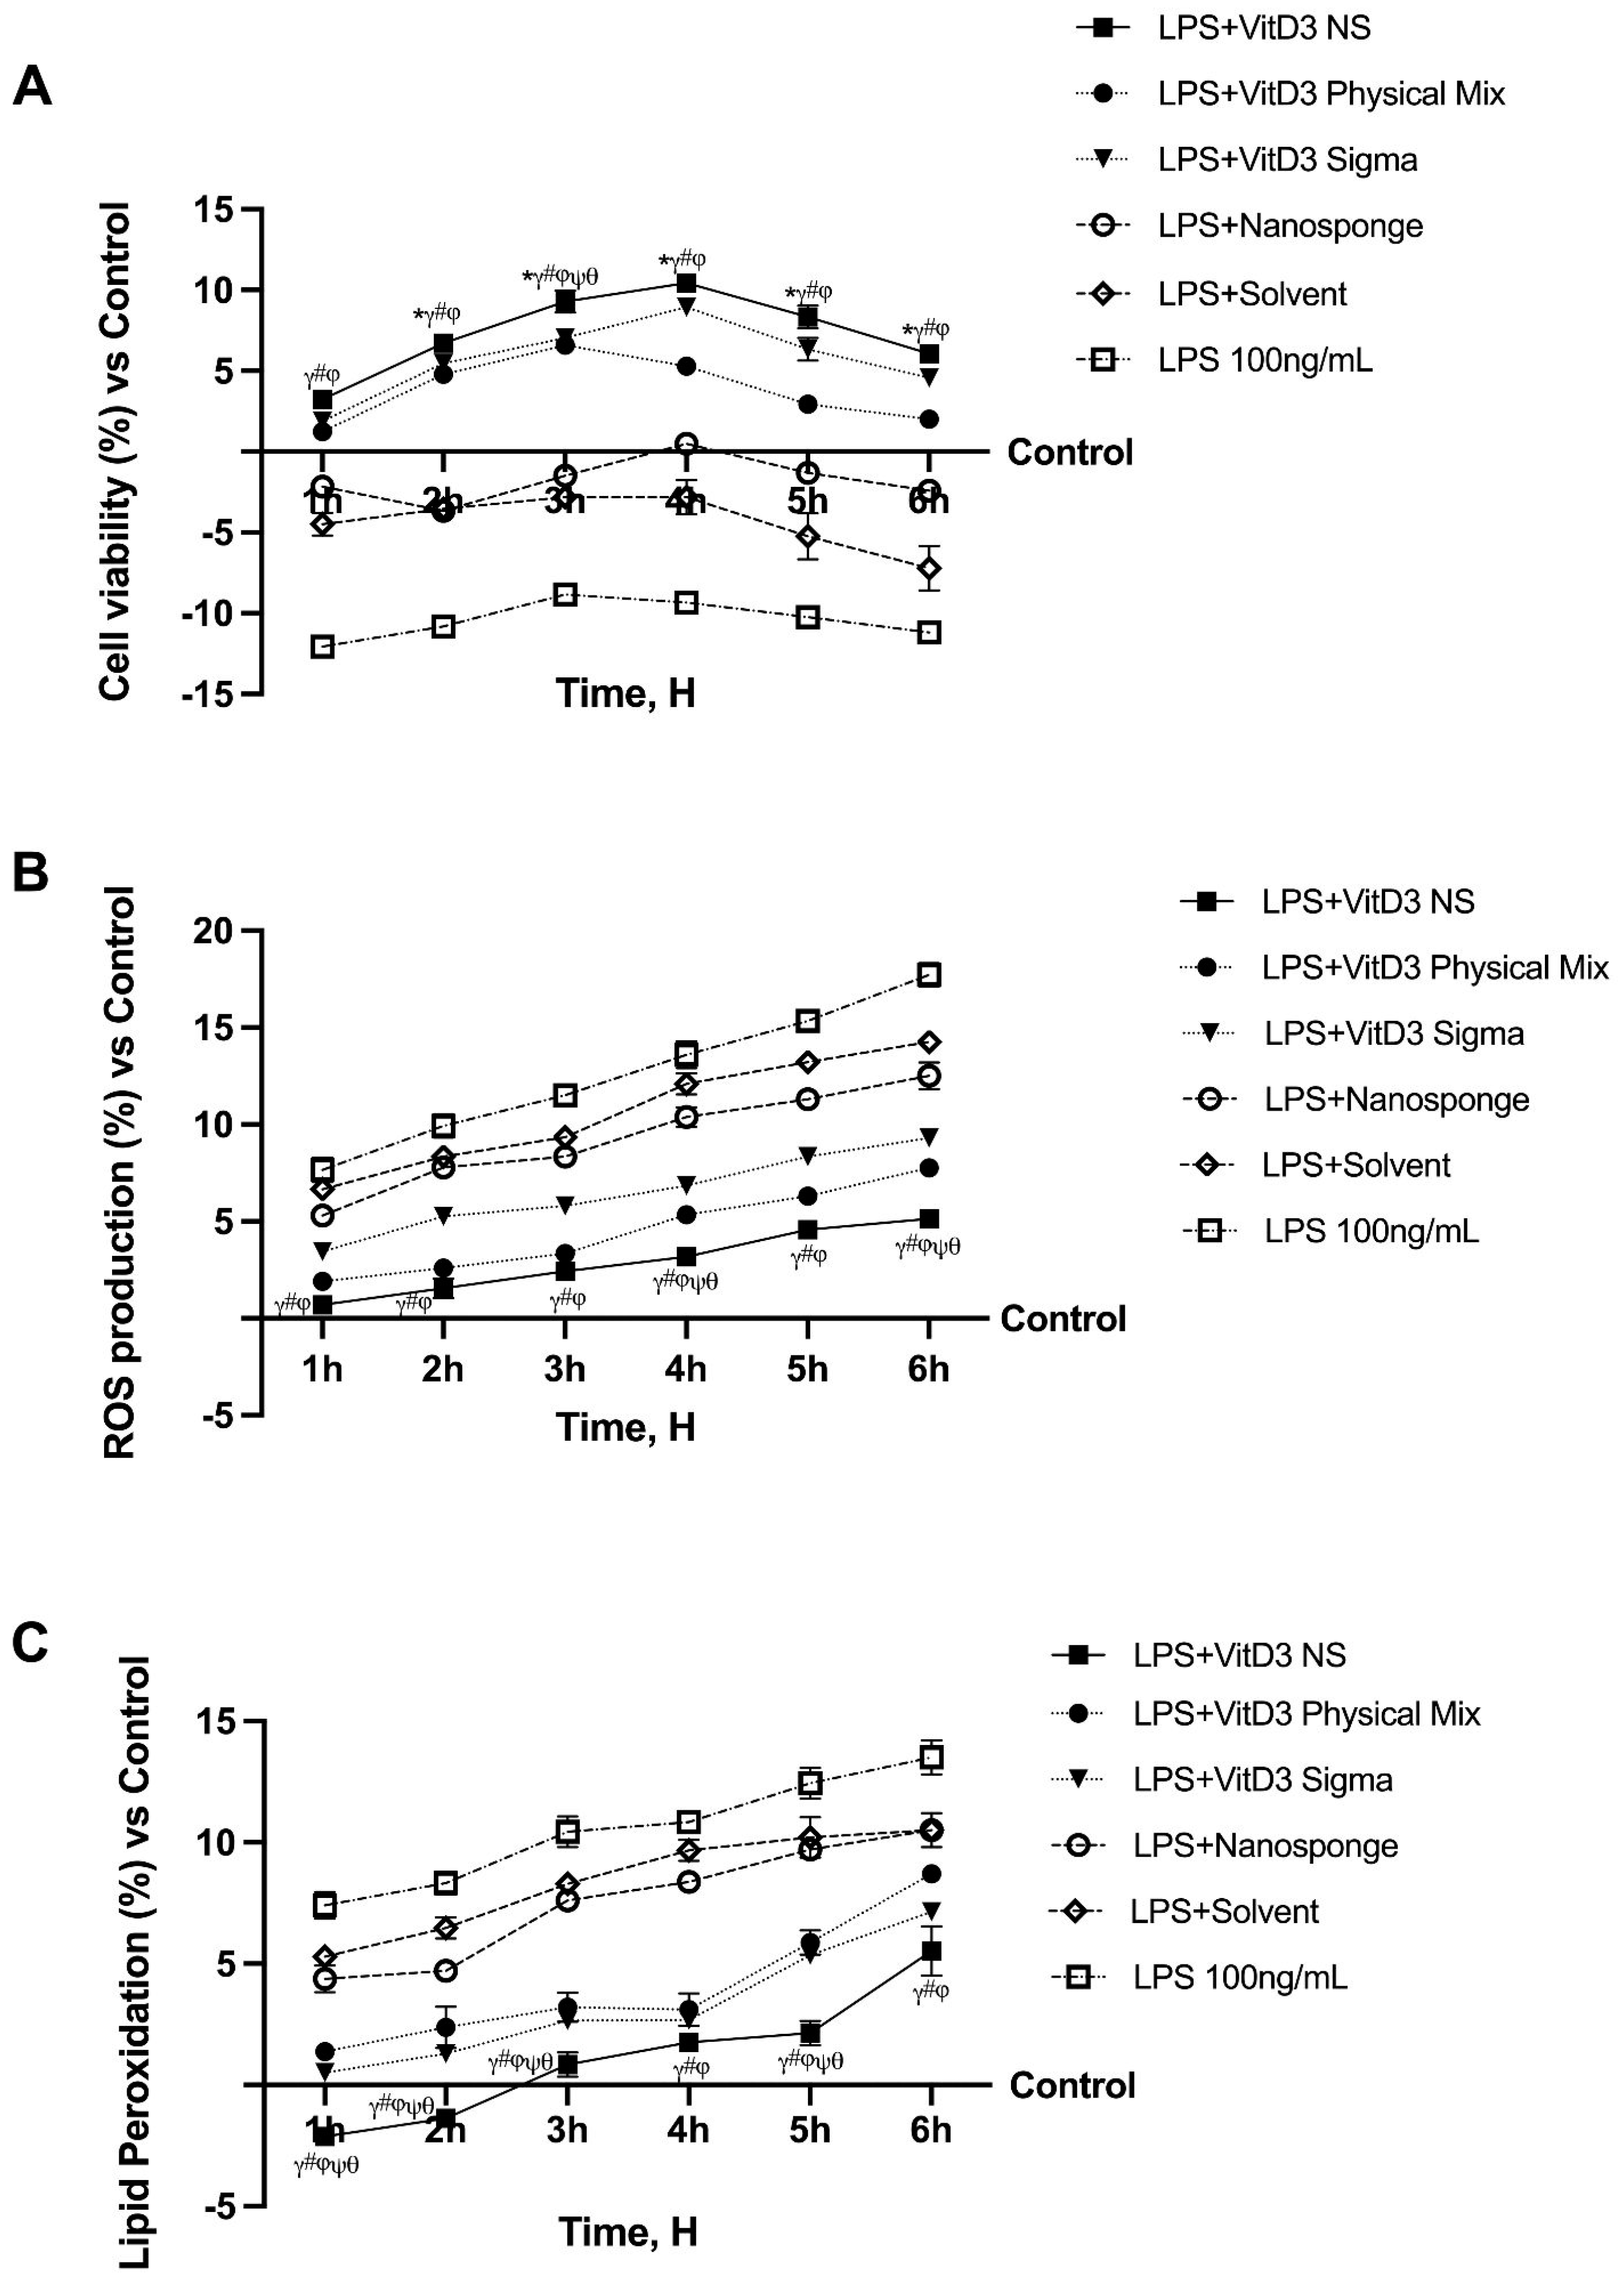
Abstract
1. Introduction
2. Results
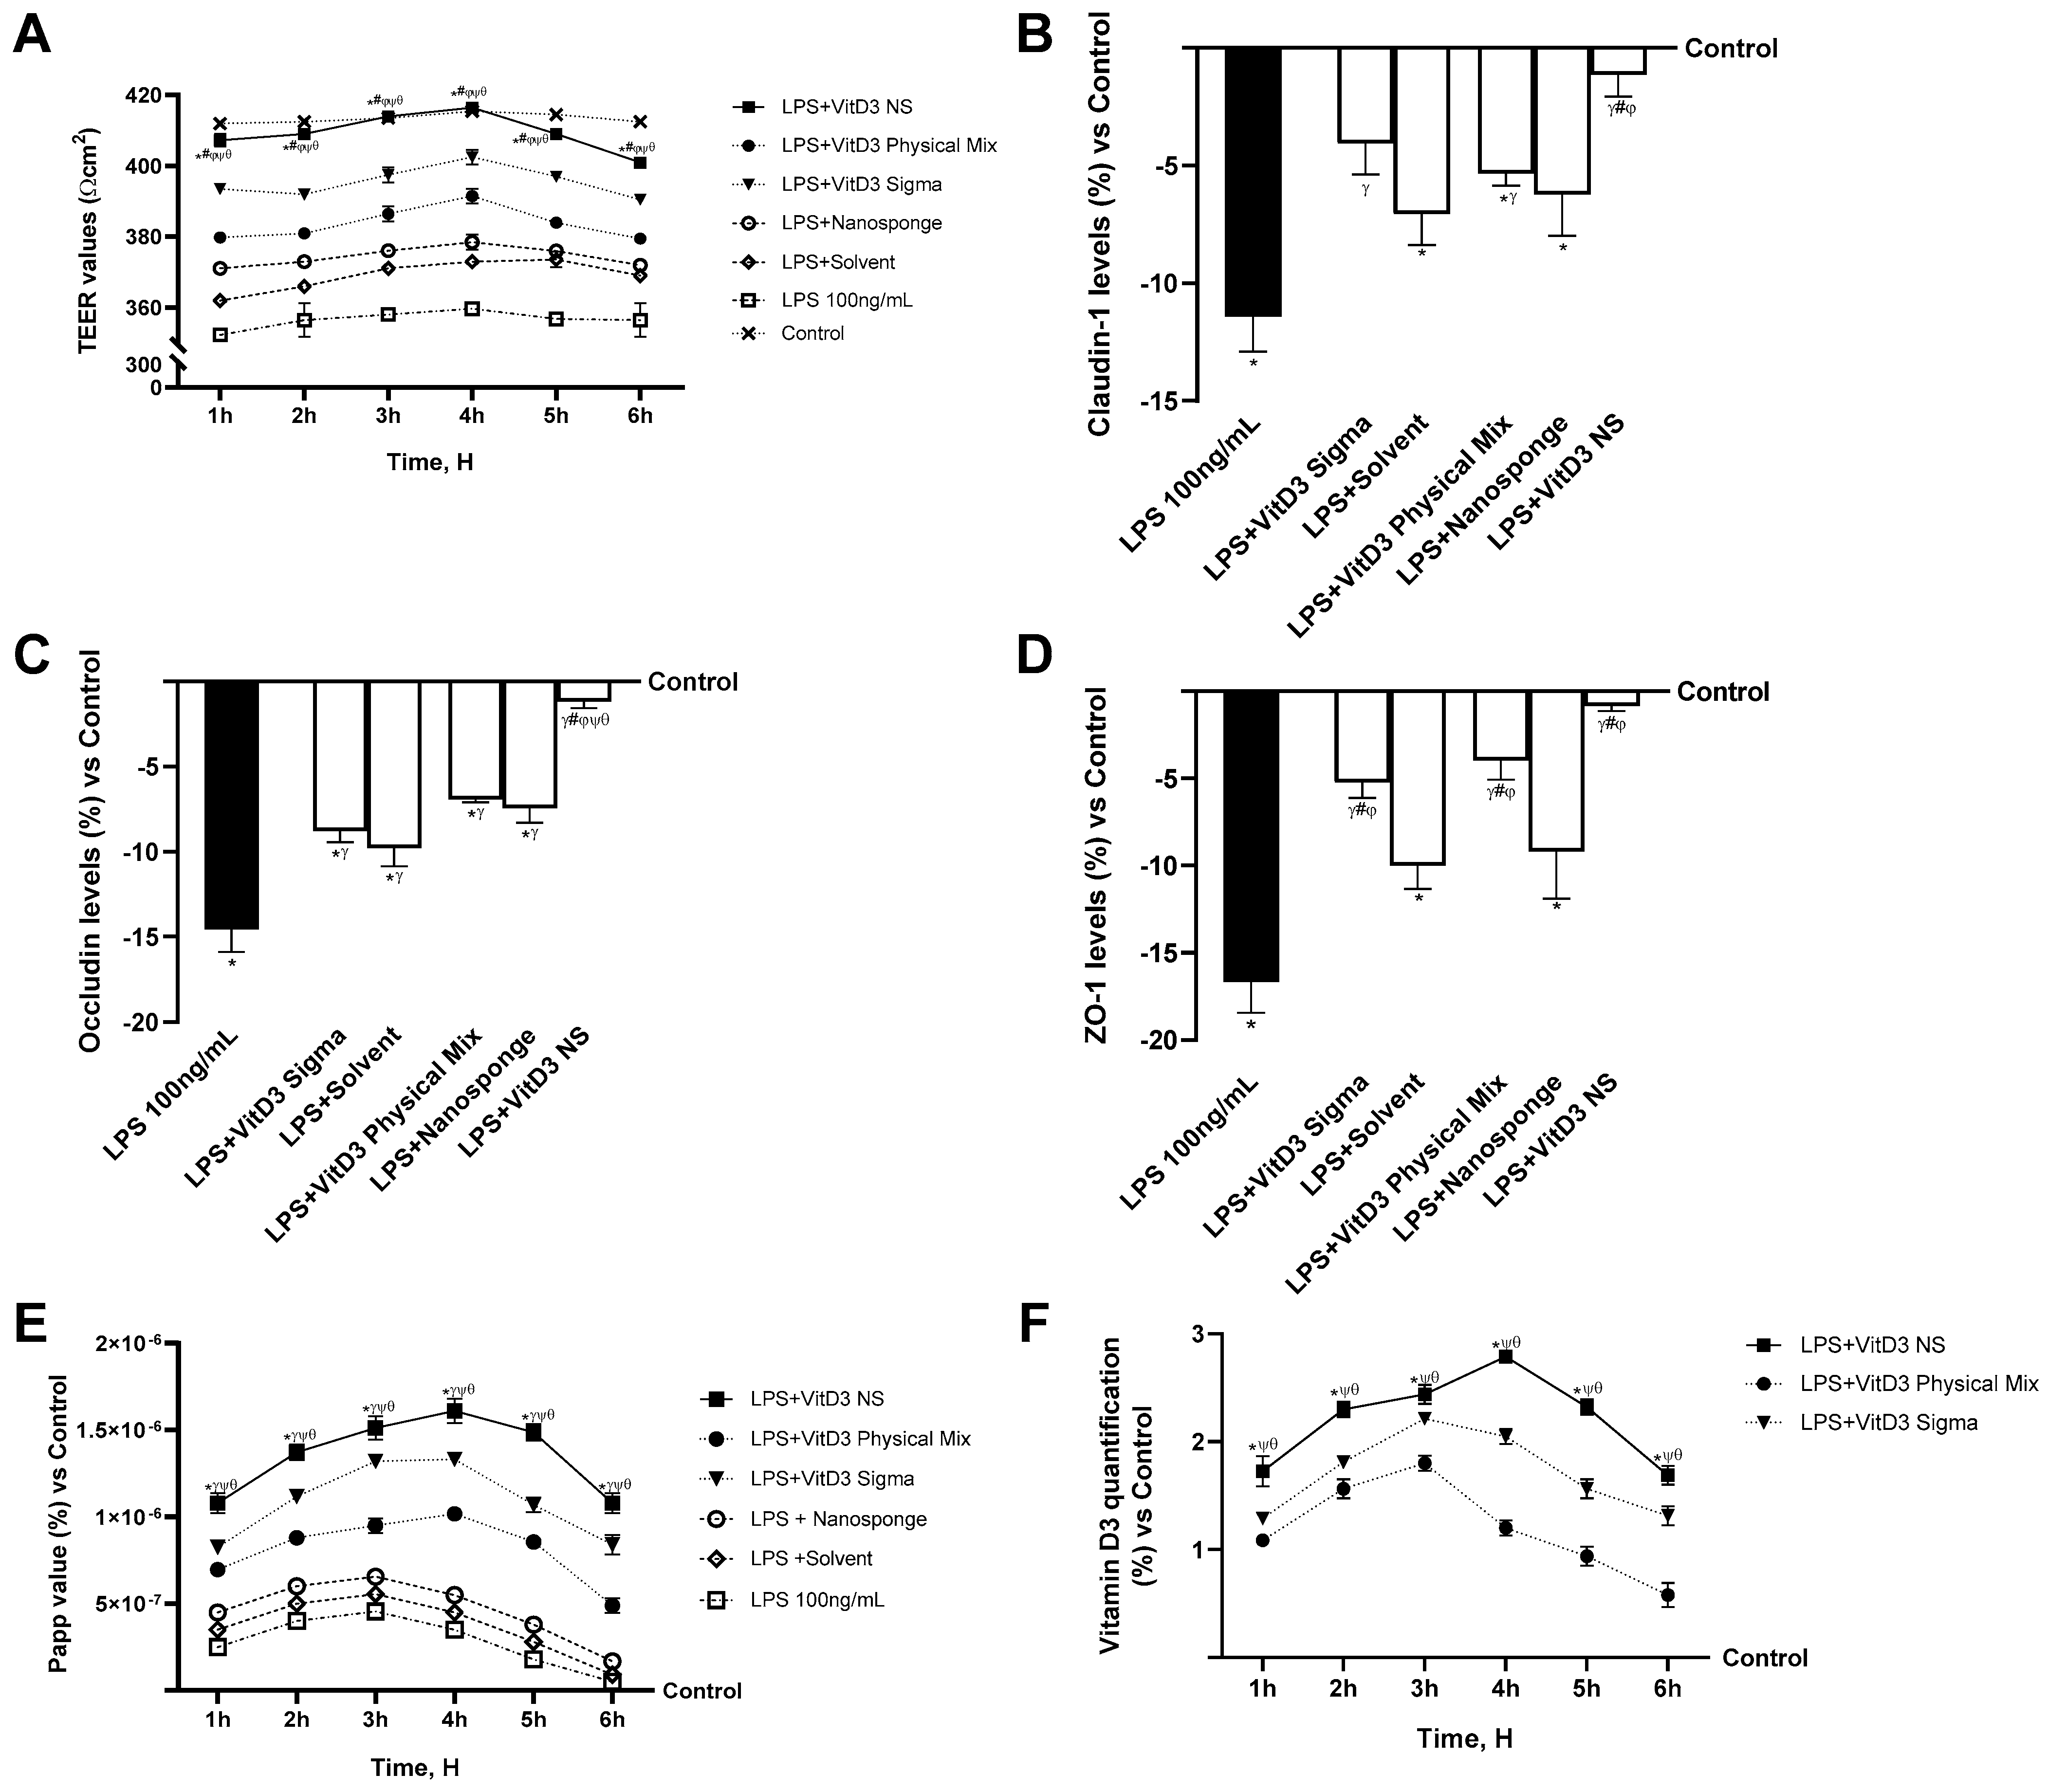
2.1. Time-Course Study on the Effect of Vitamin D Forms on CaCo-2 Cells Subjected to IBS Conditions
2.2. Permeability Analysis of the Effects of Different Vitamin D3 Forms in an In Vitro Intestinal Barrier under IBS Conditions
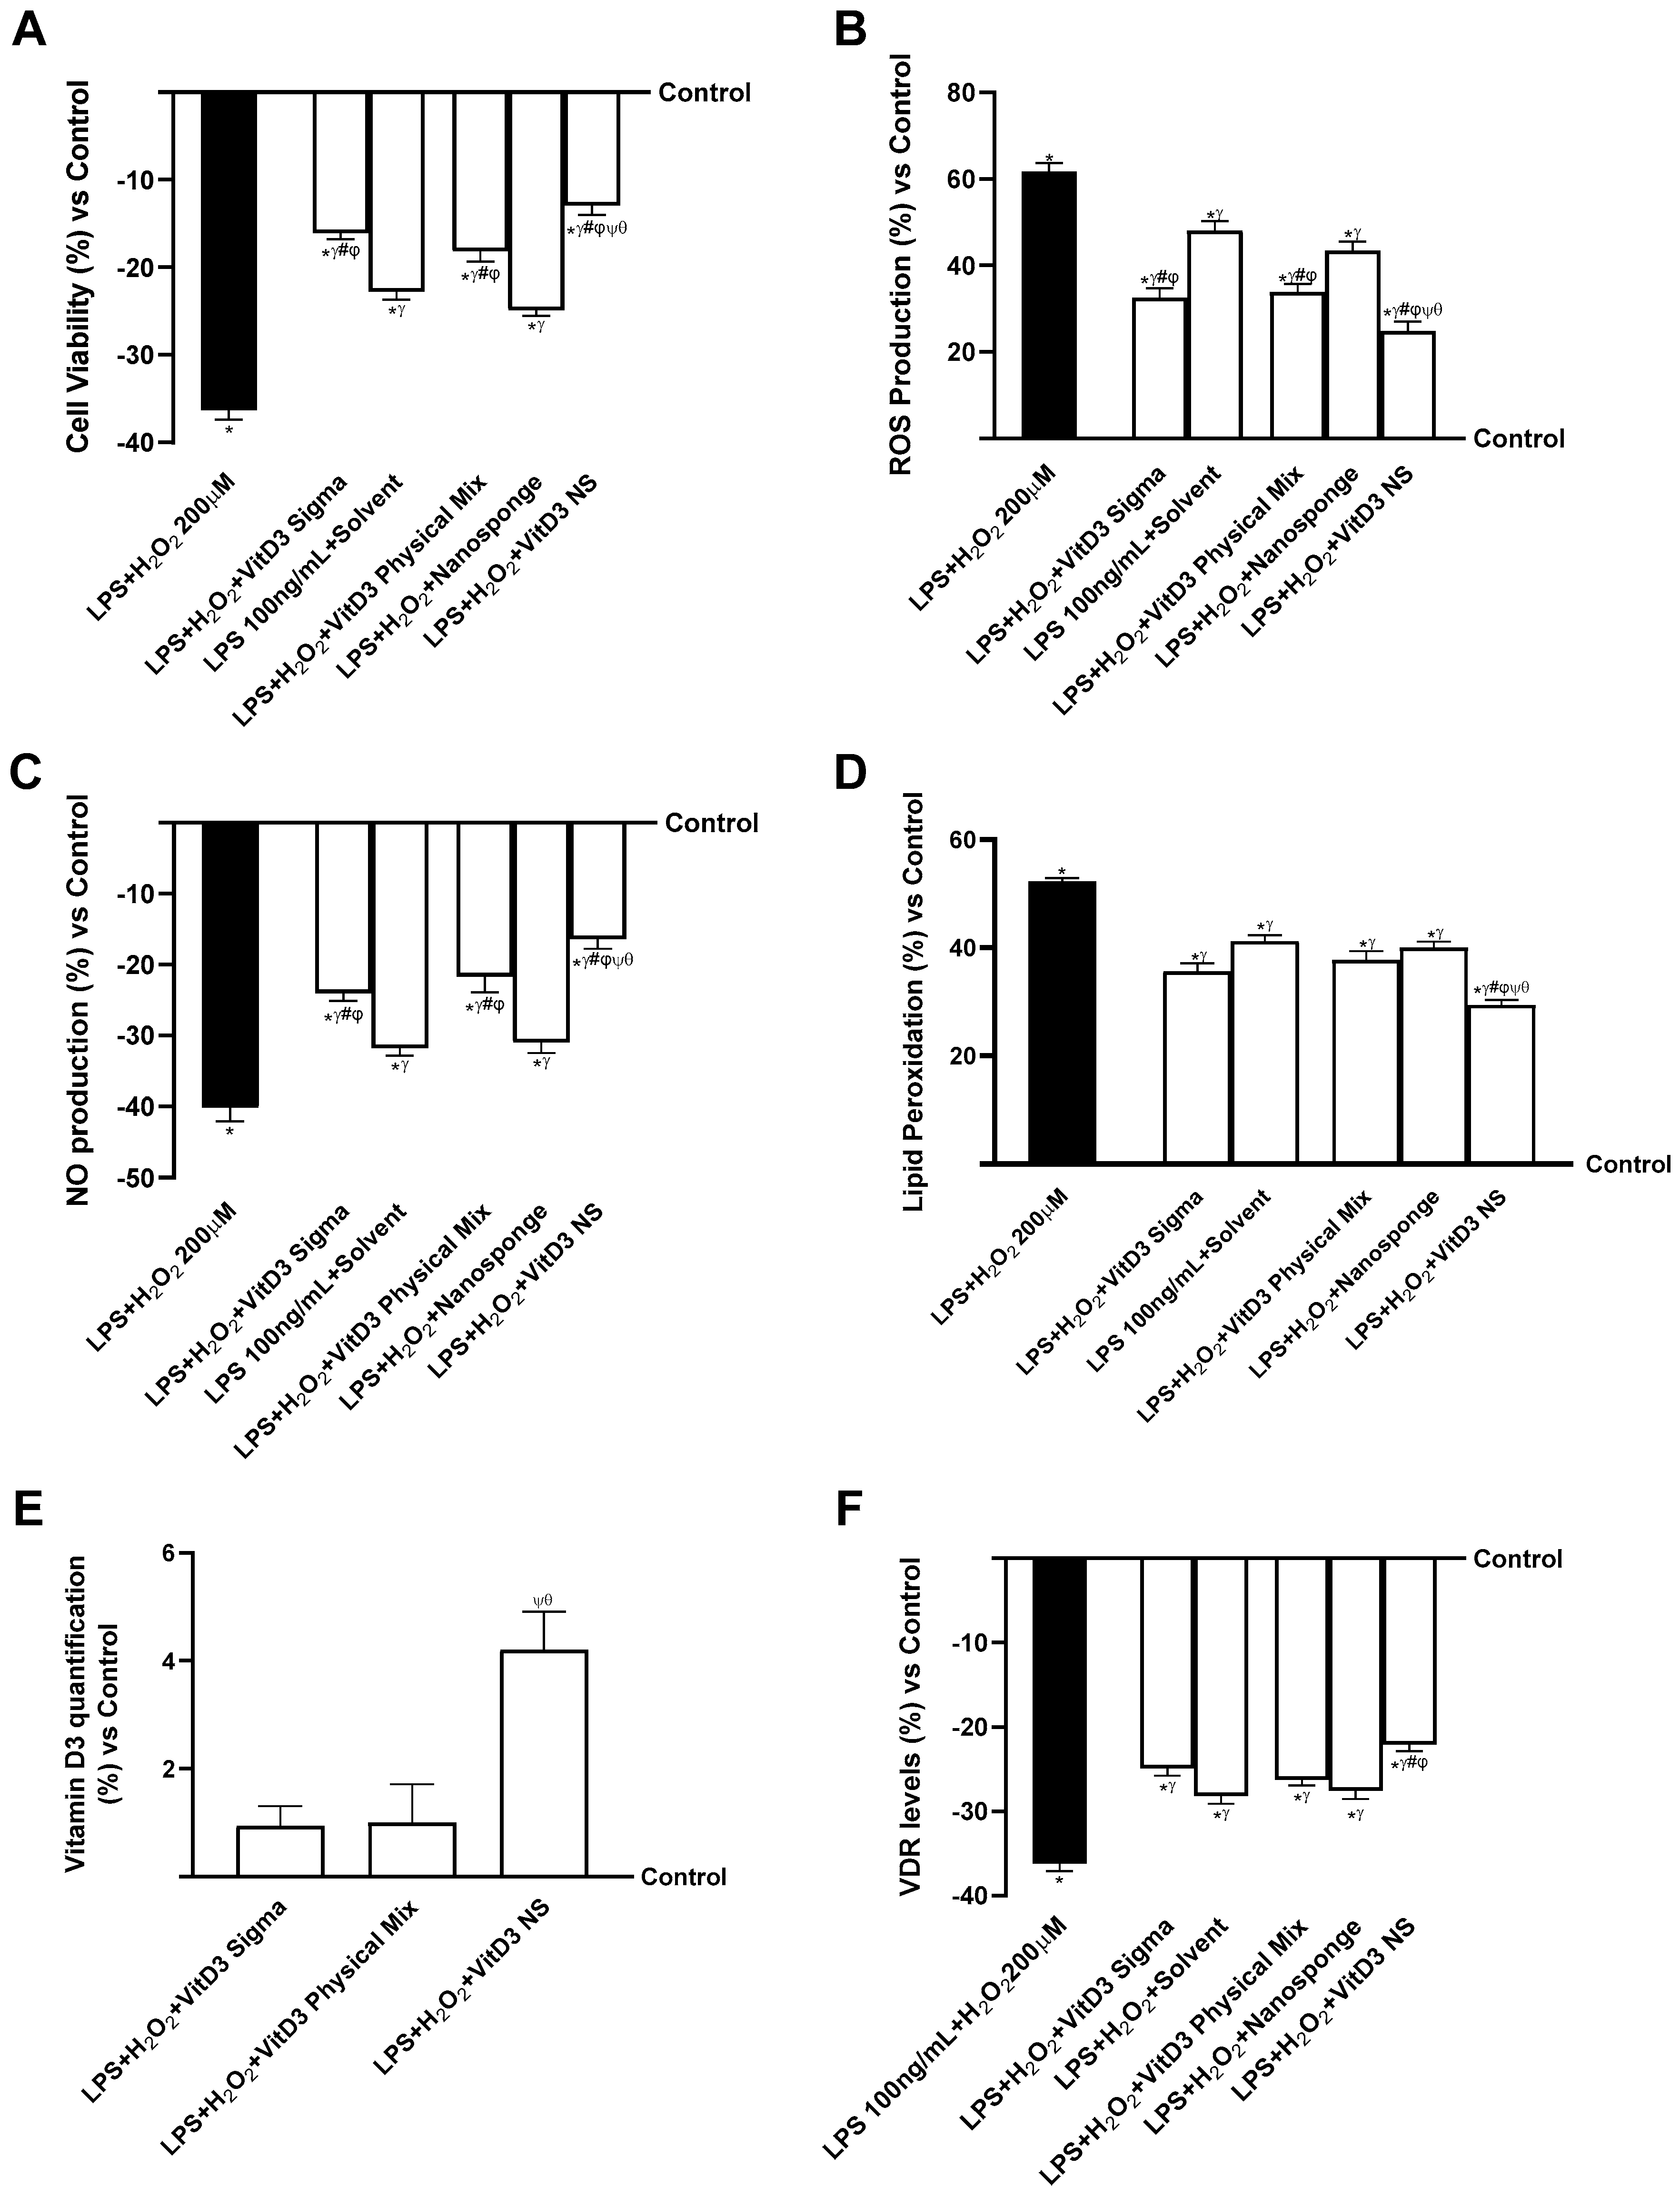
2.3. The Effects of VitD3 NS on the Gut–Brain Axis Degeneration Model
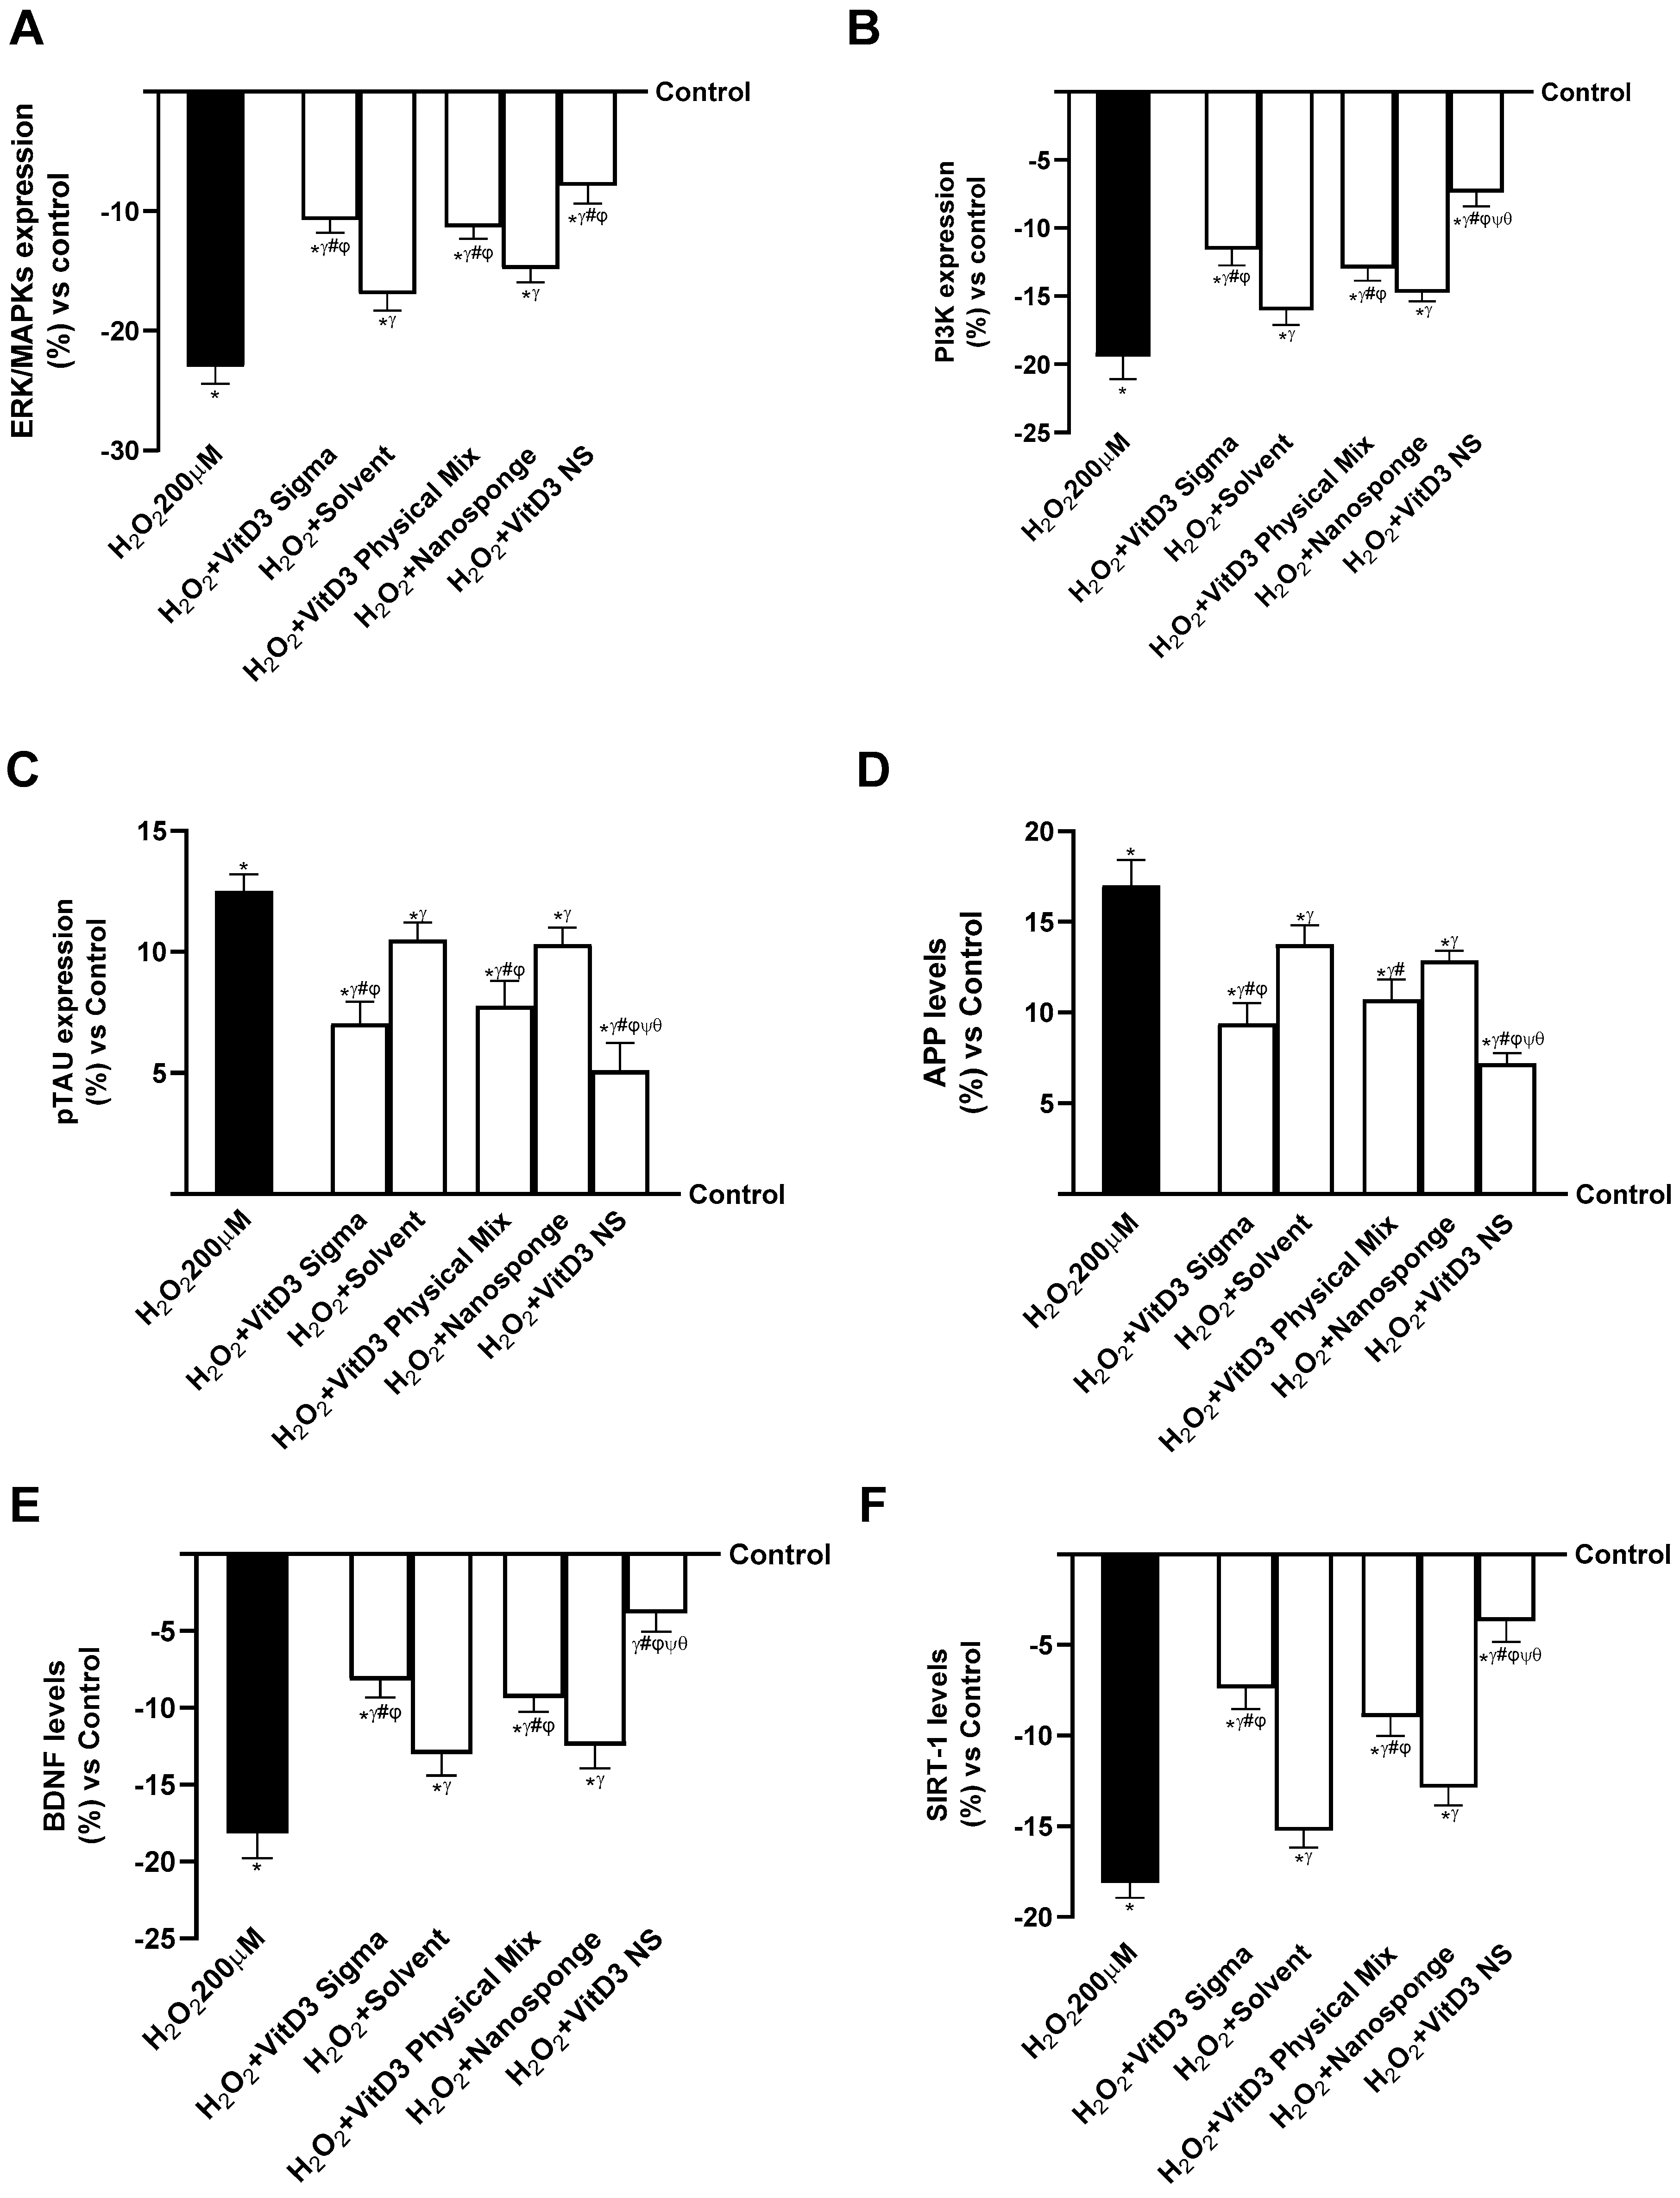
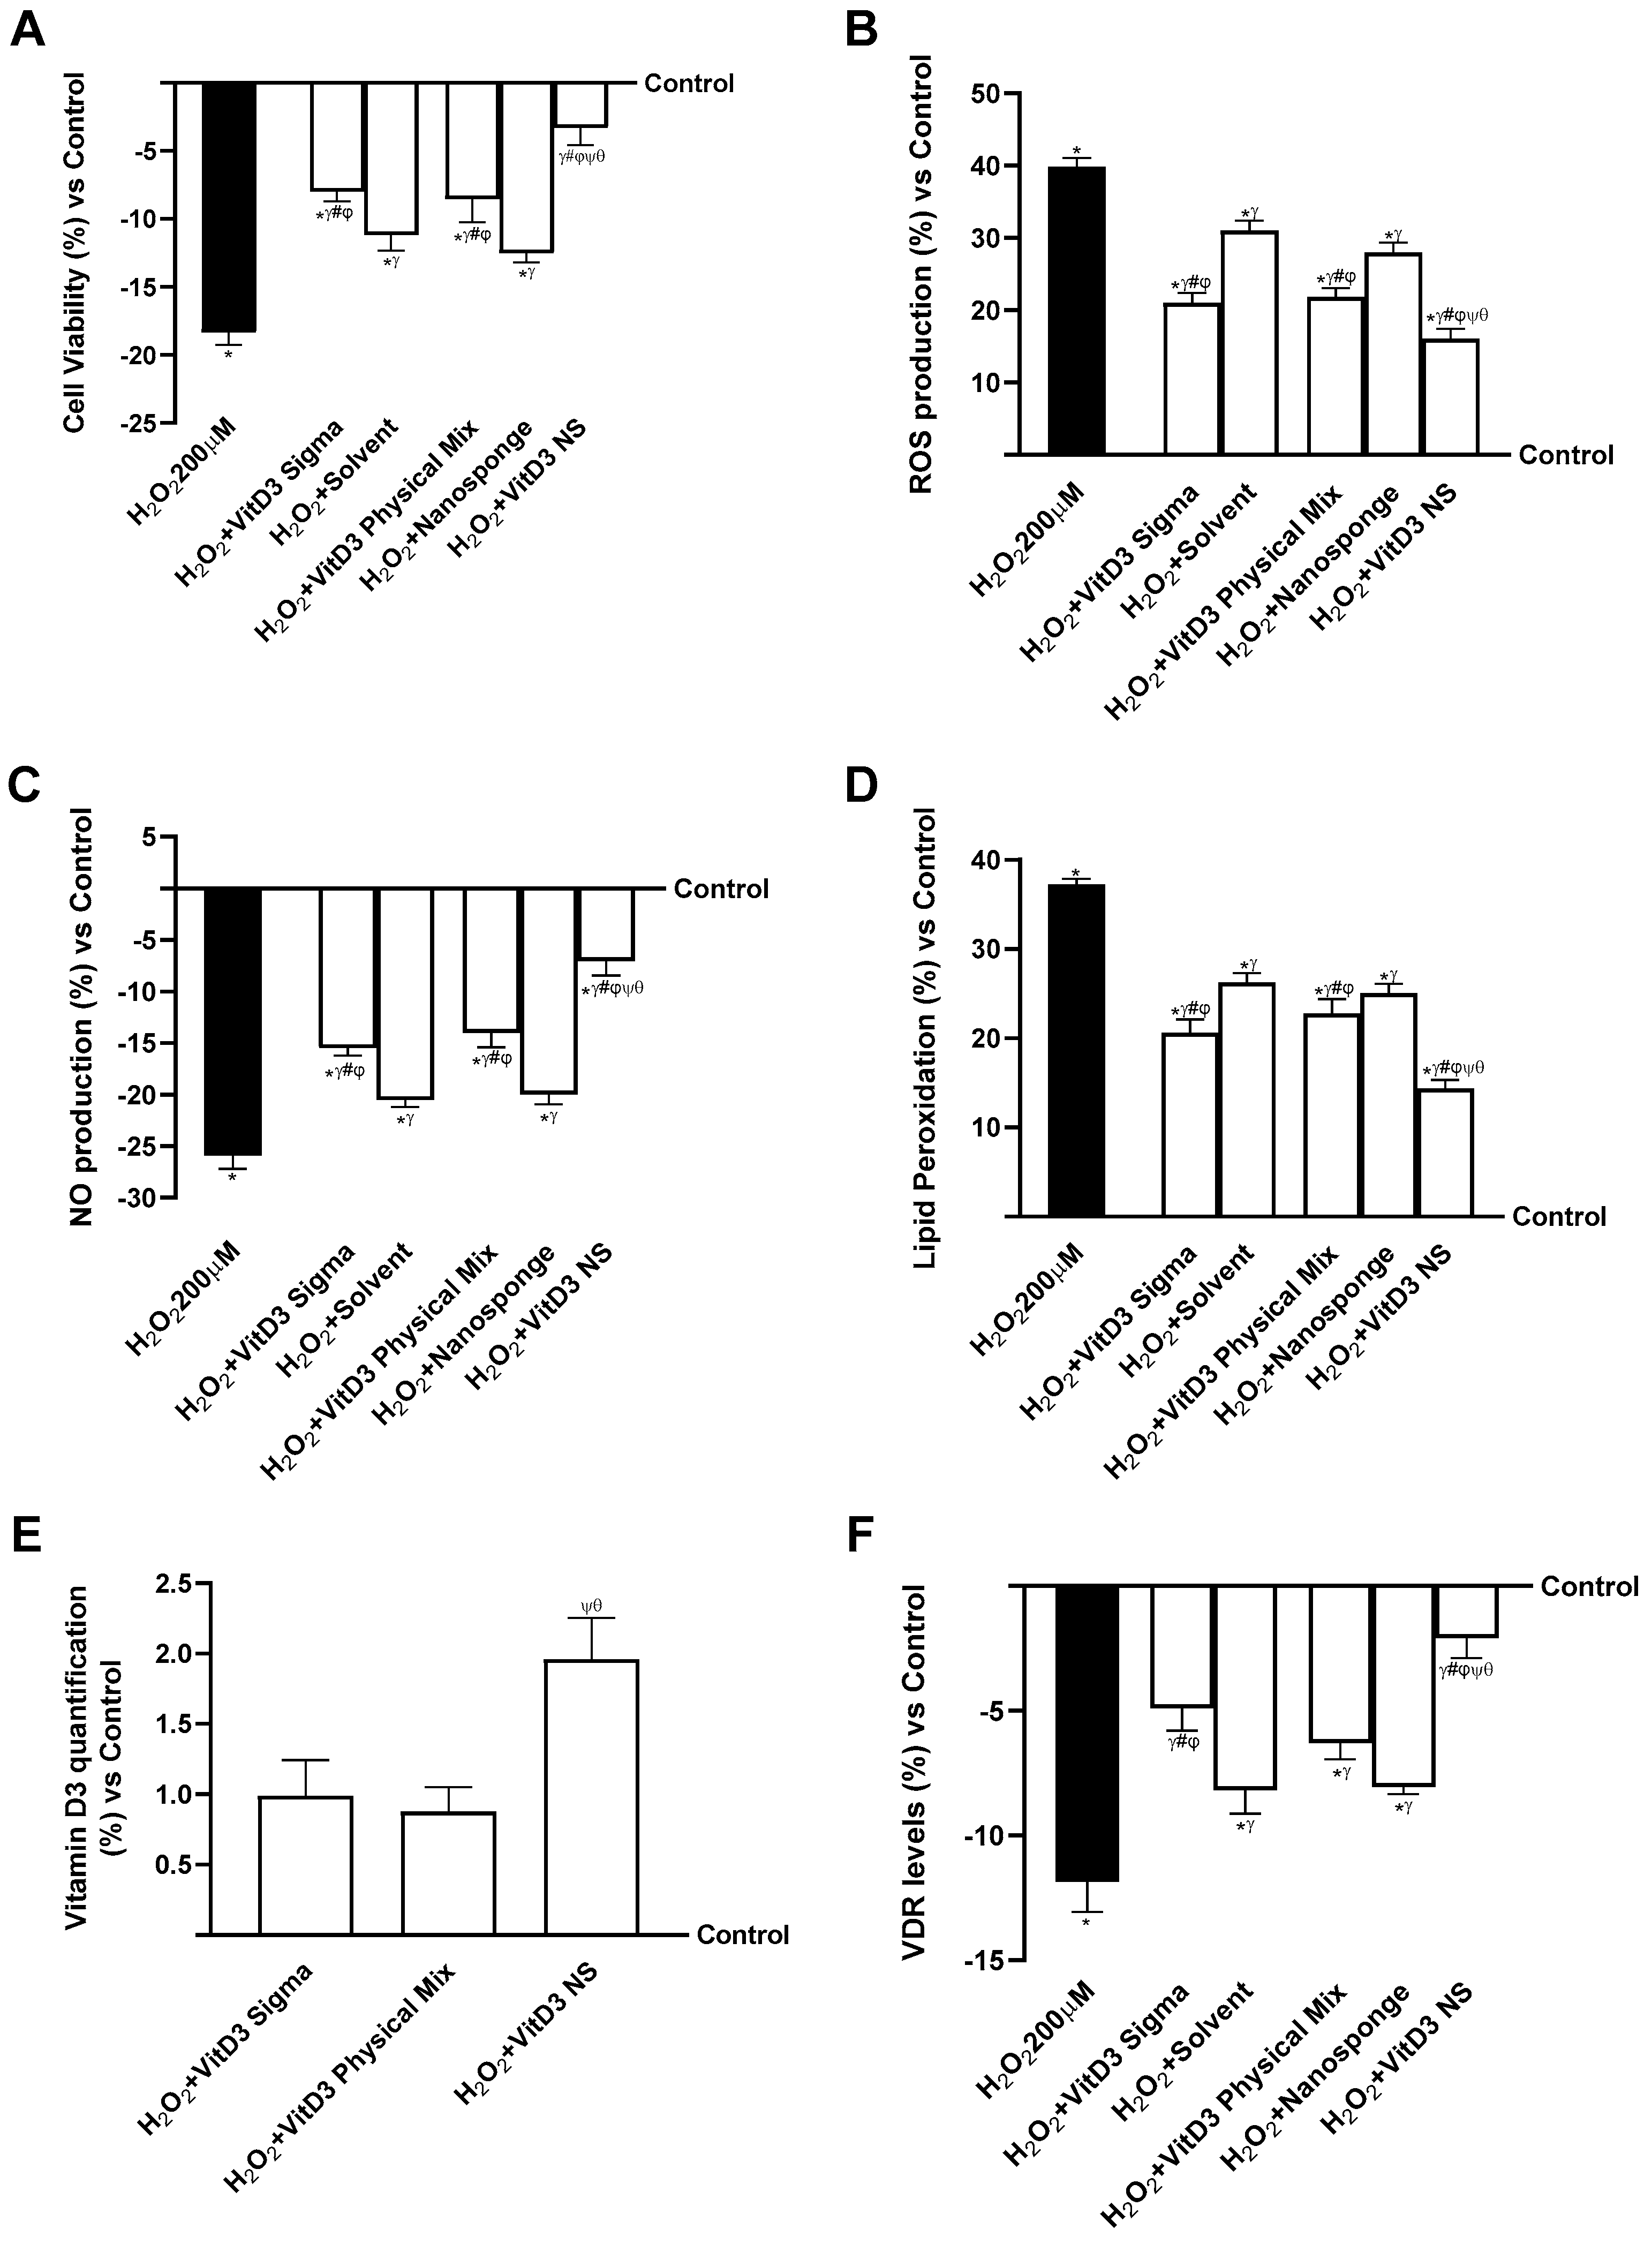
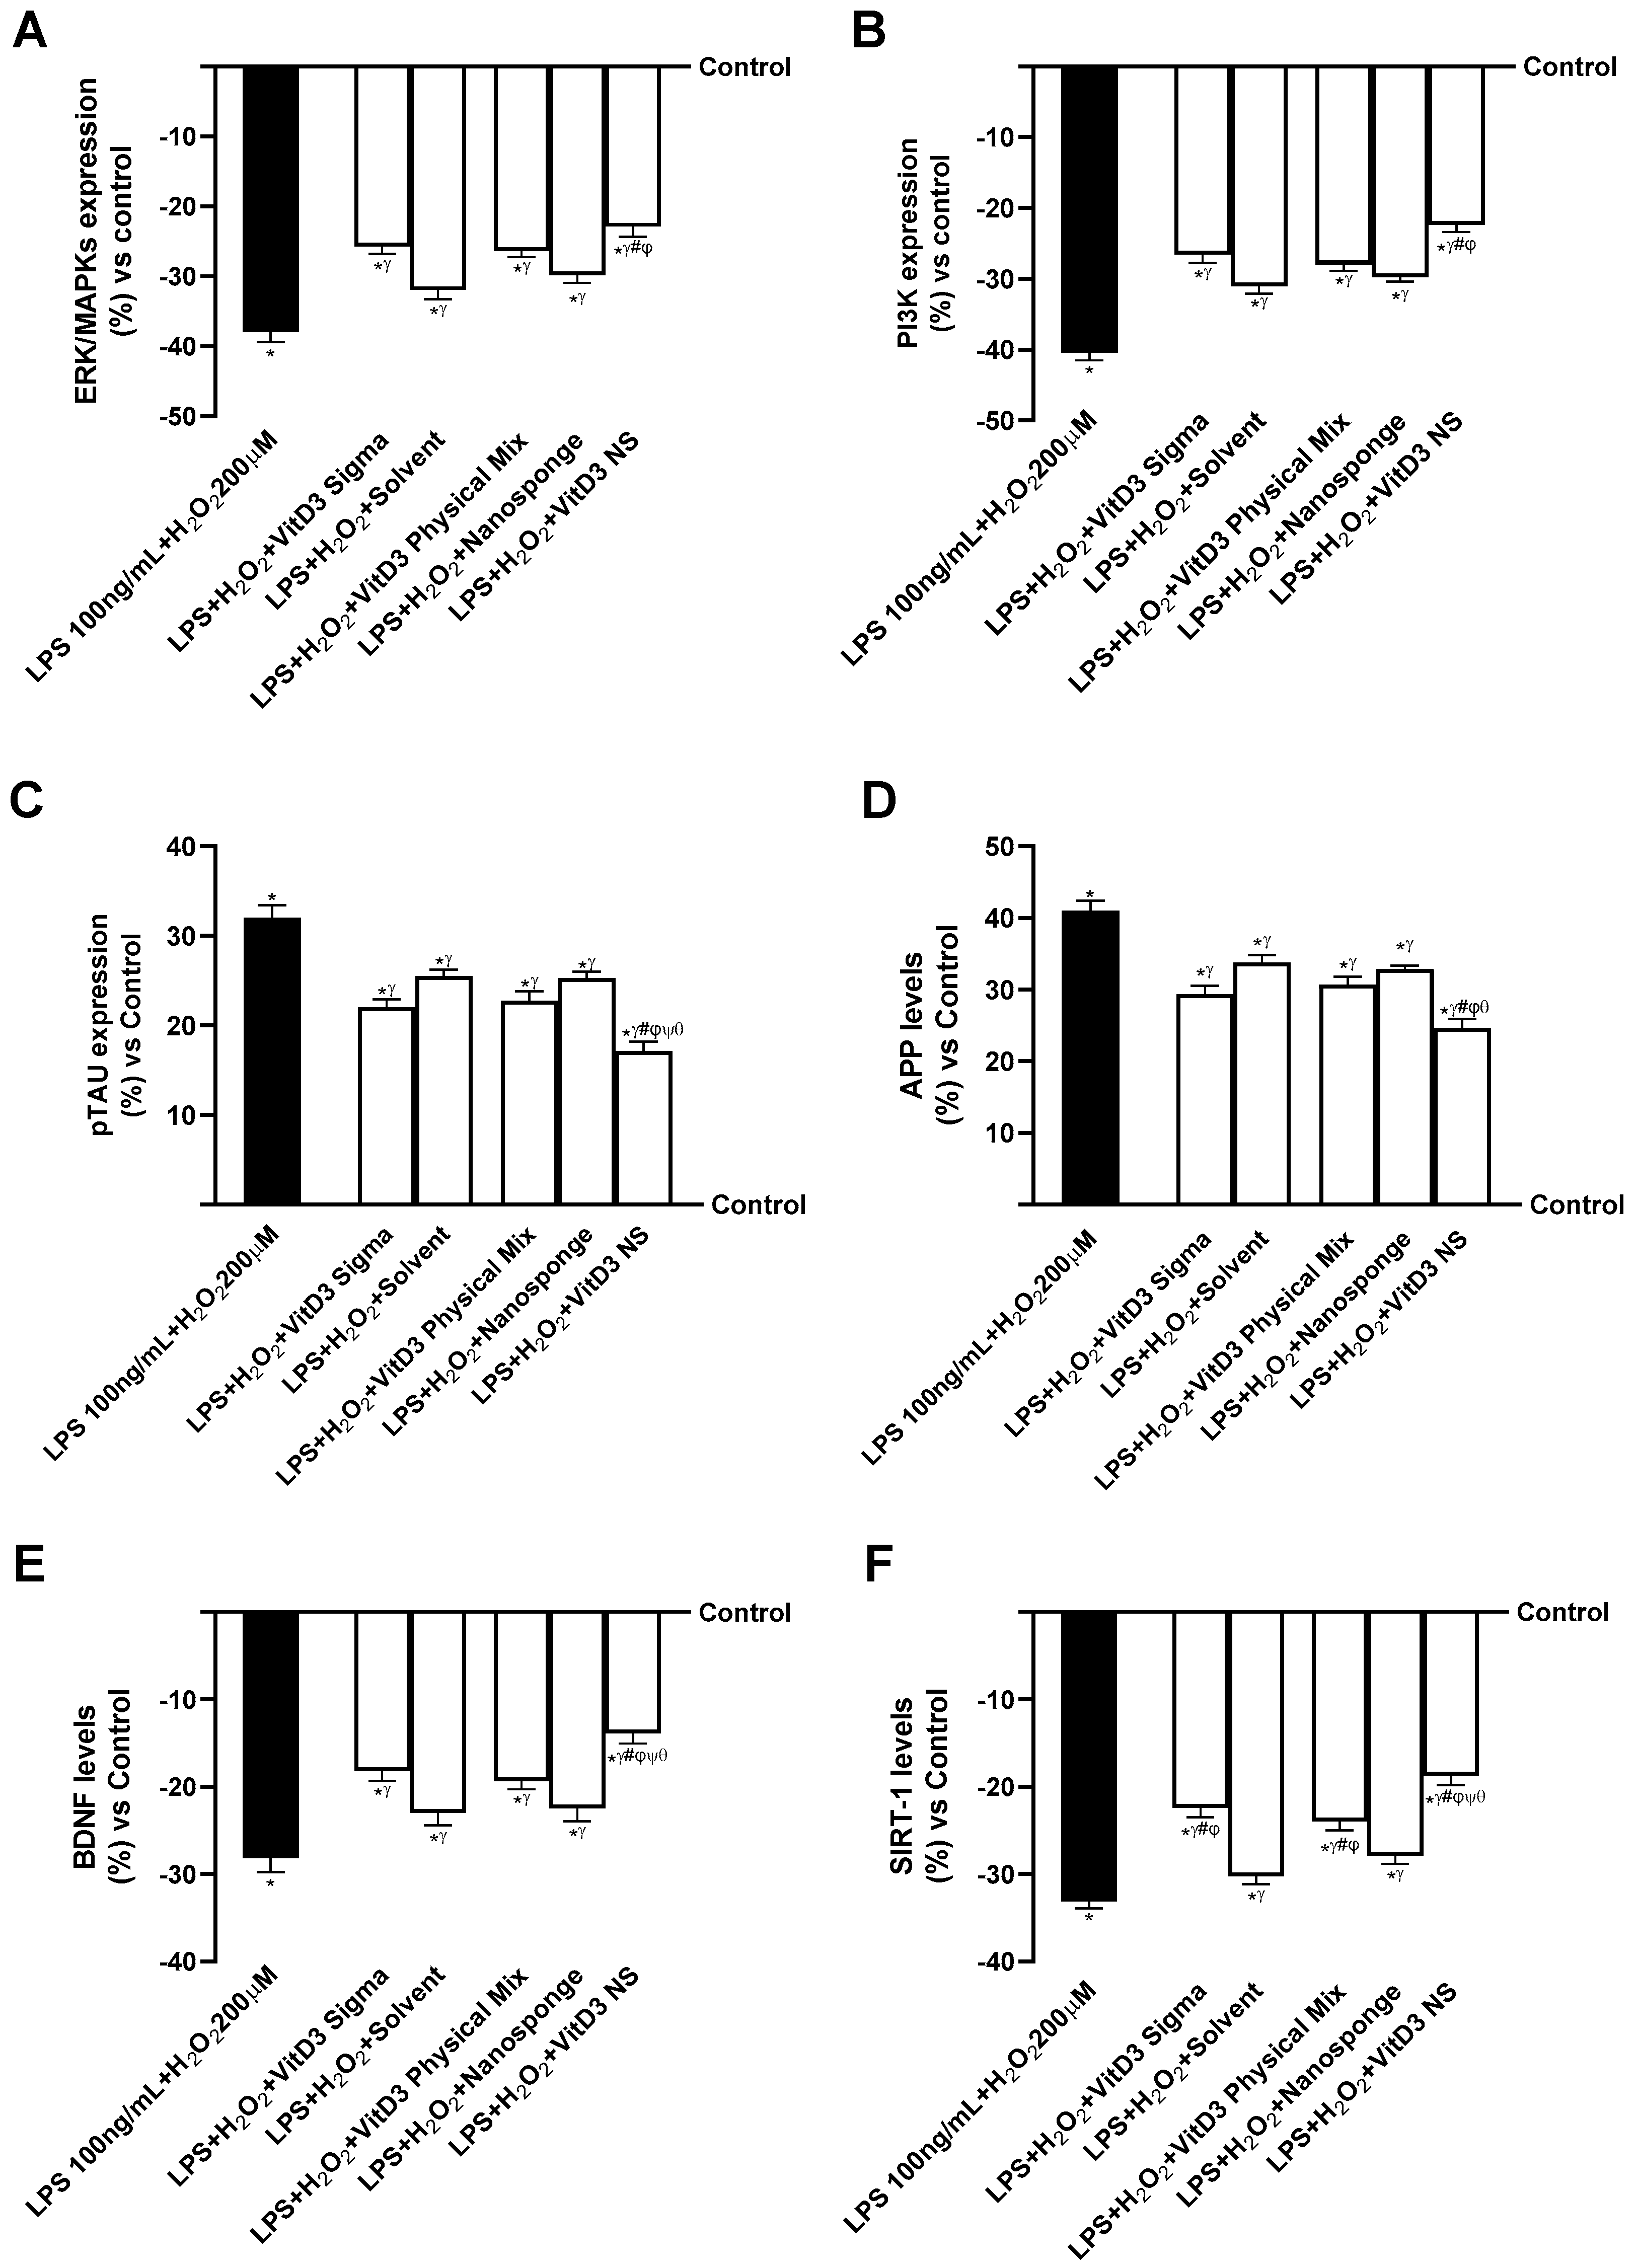
2.4. Analysis of the Mechanisms Underlying Cognitive Decline on SHSY-5Y Cells in Damaged Conditions
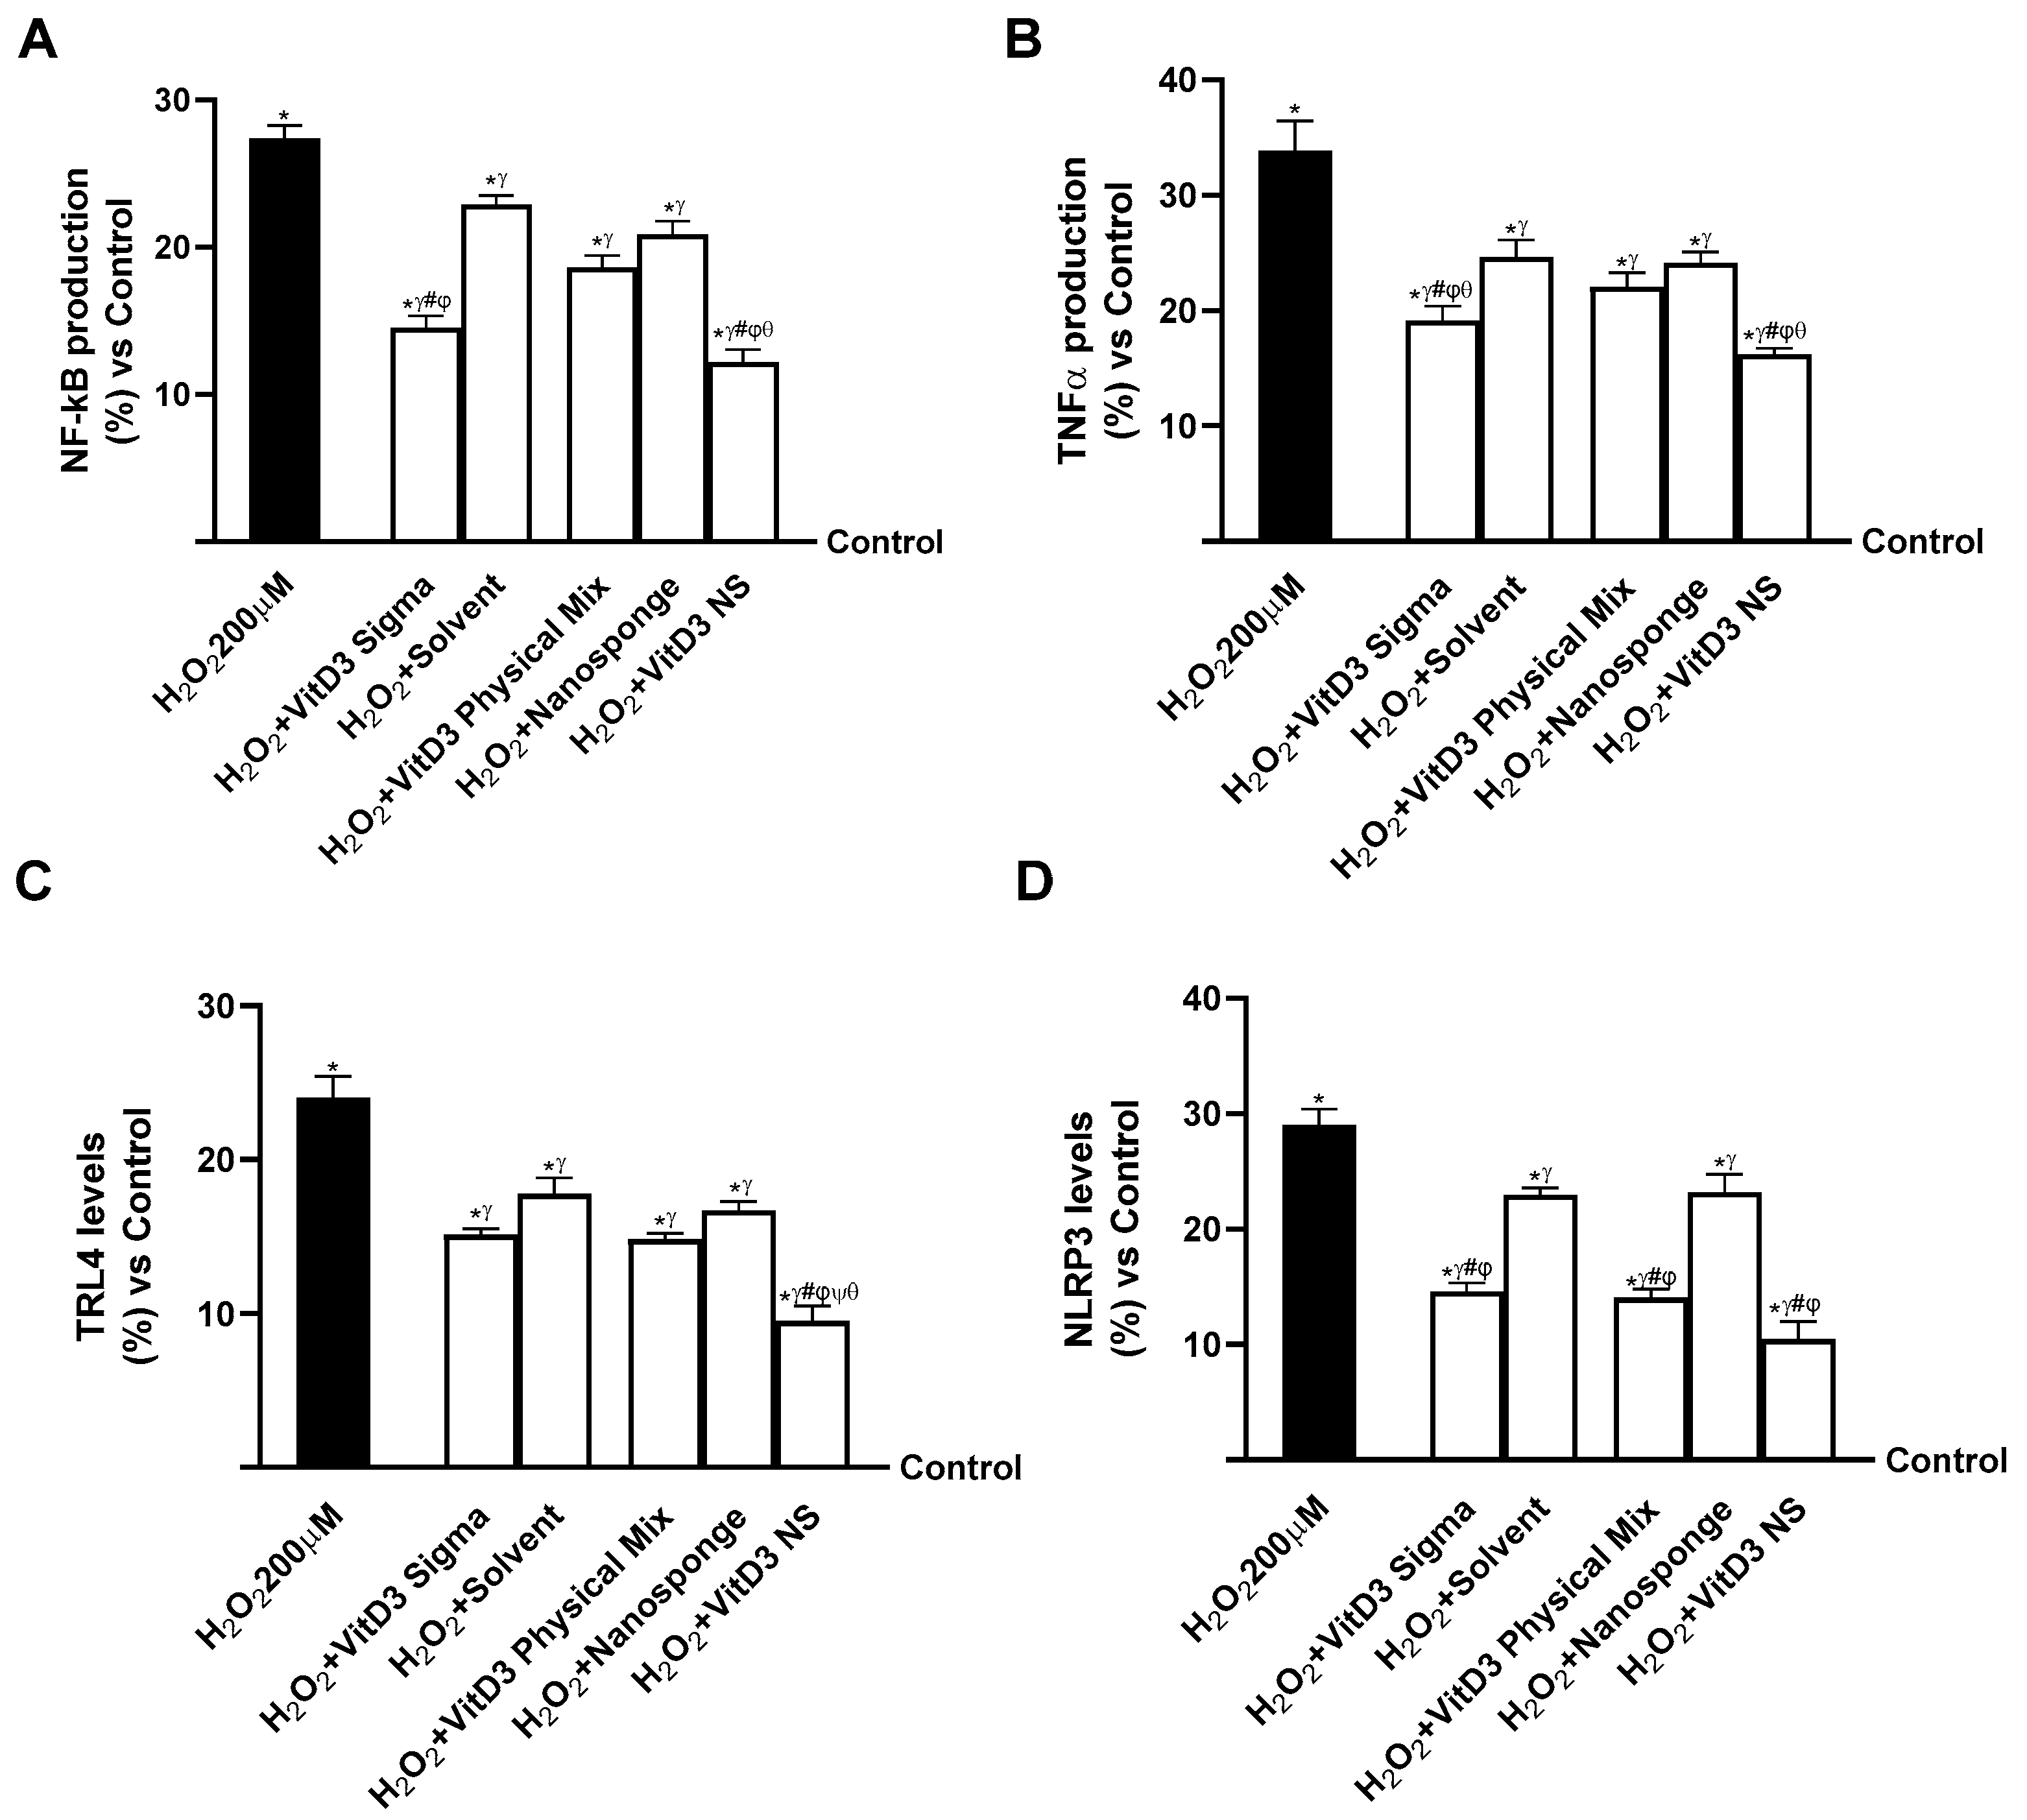
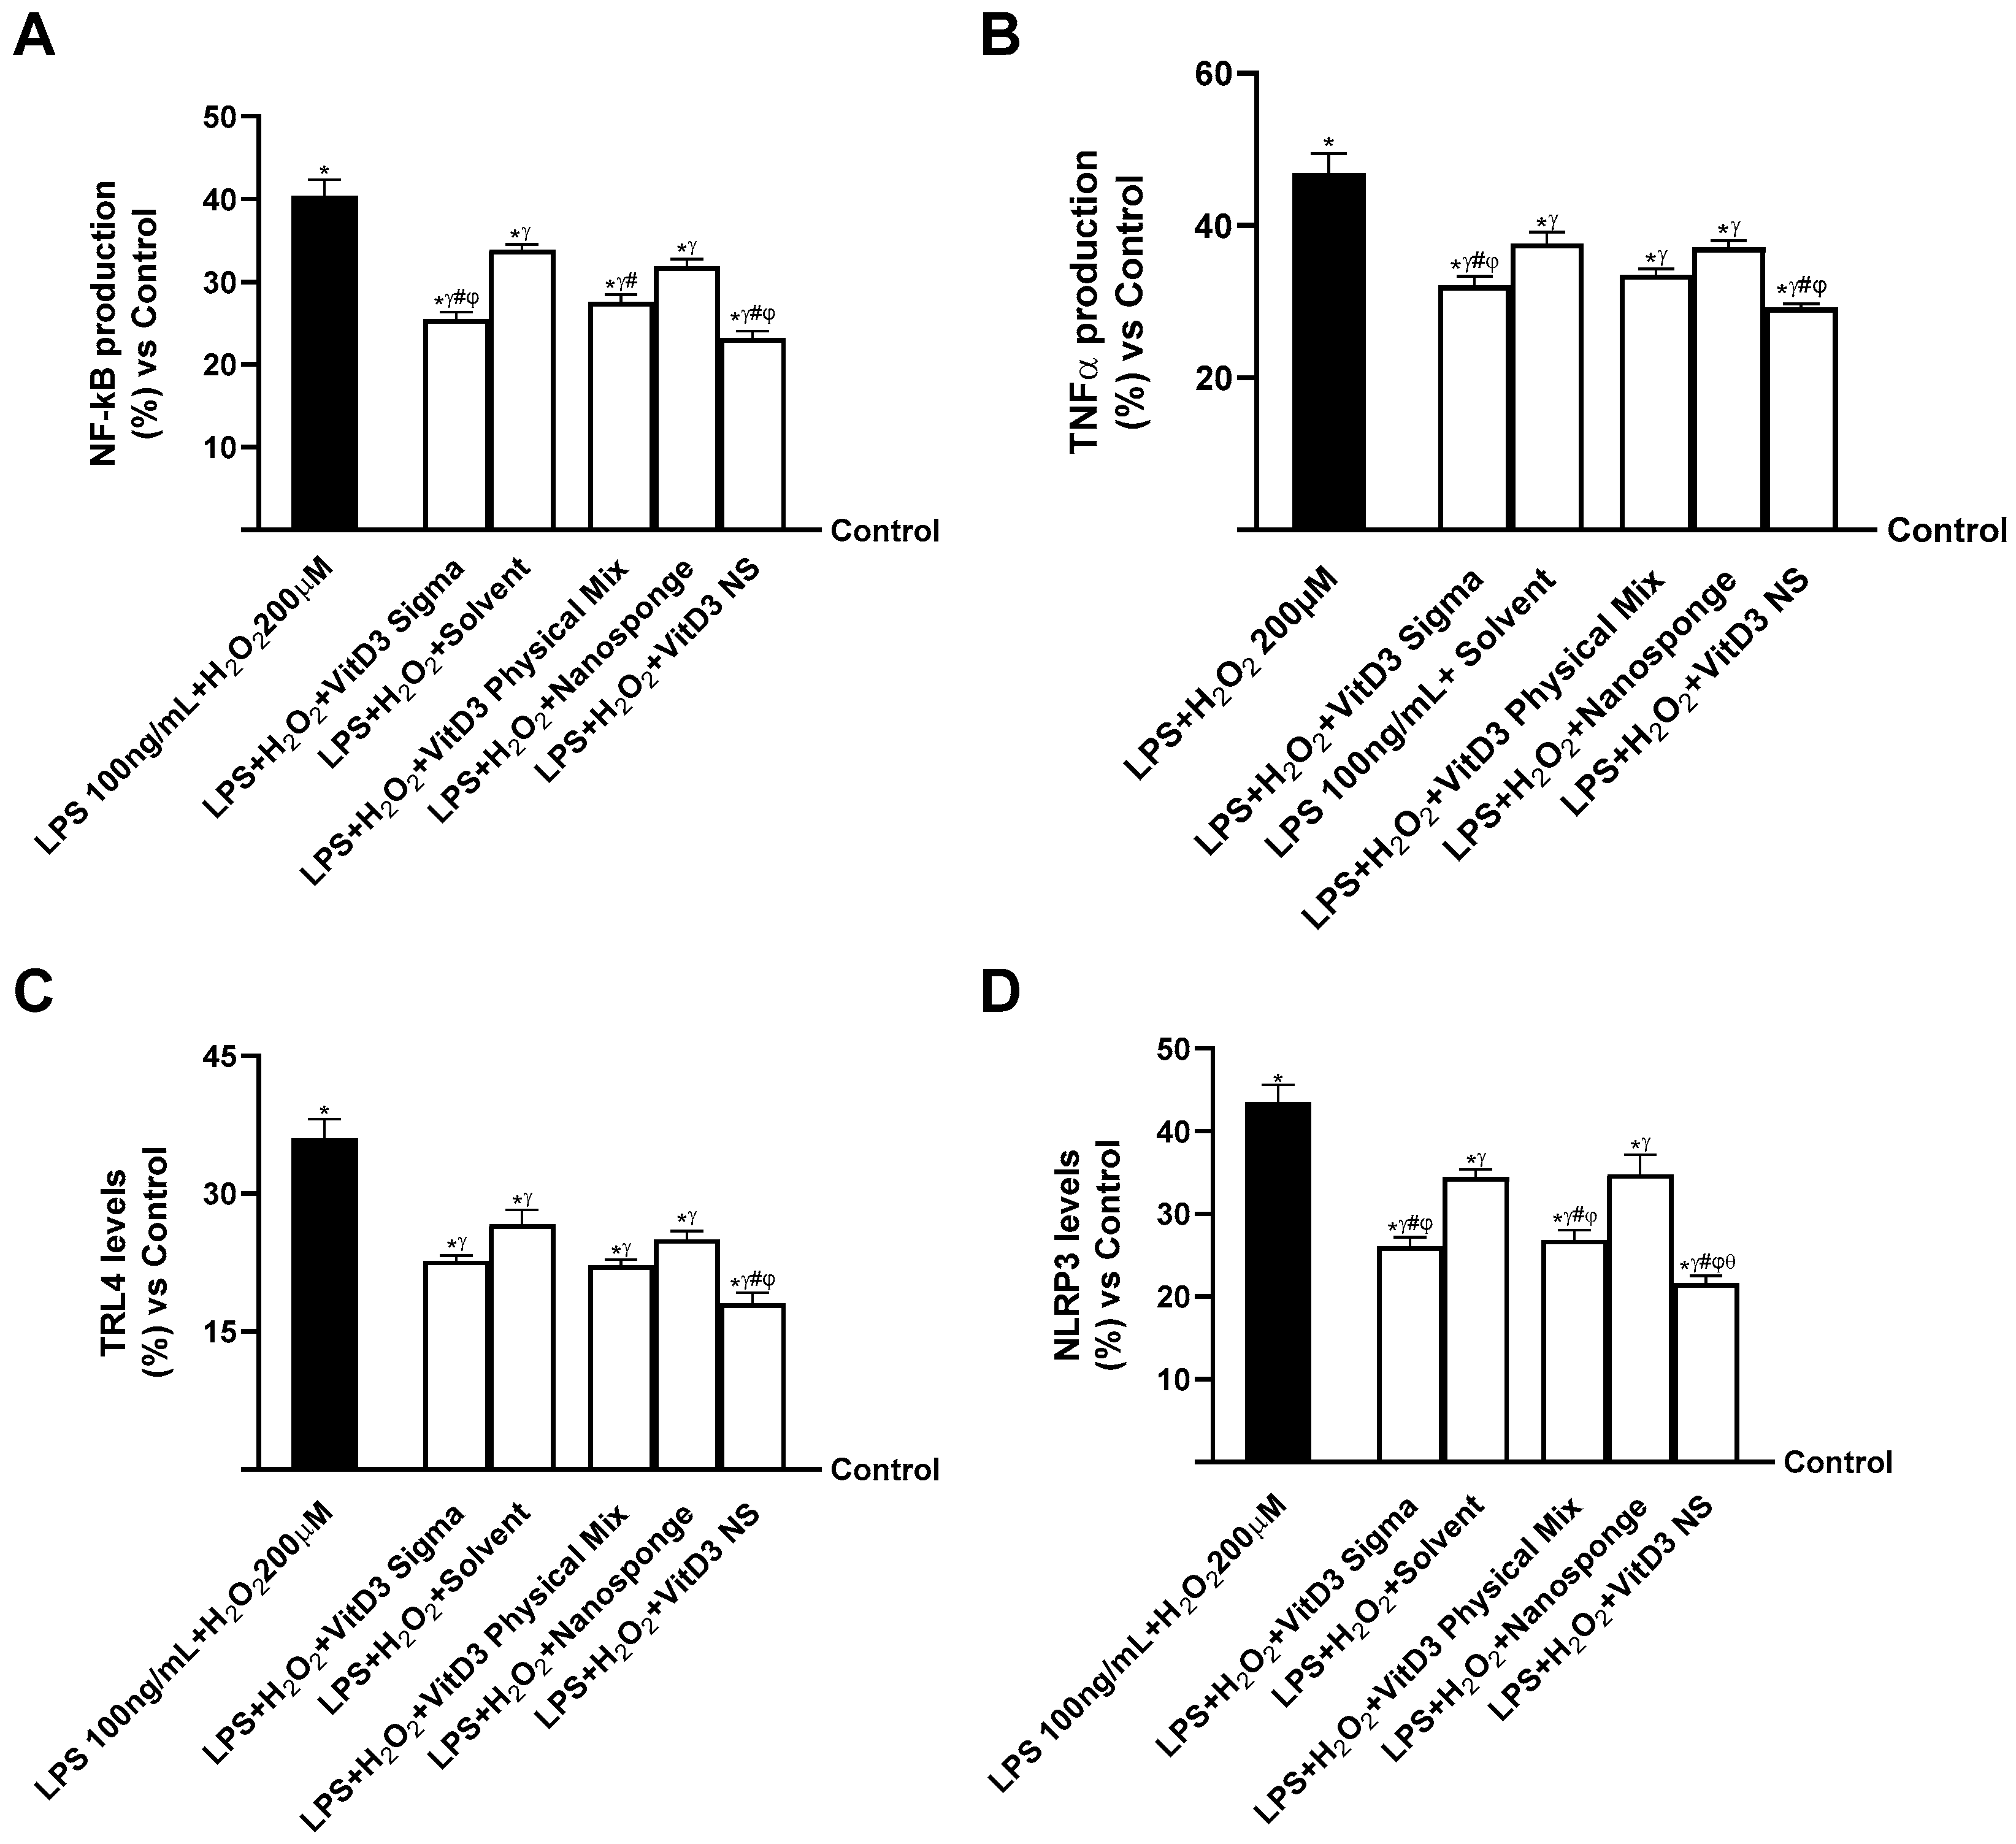
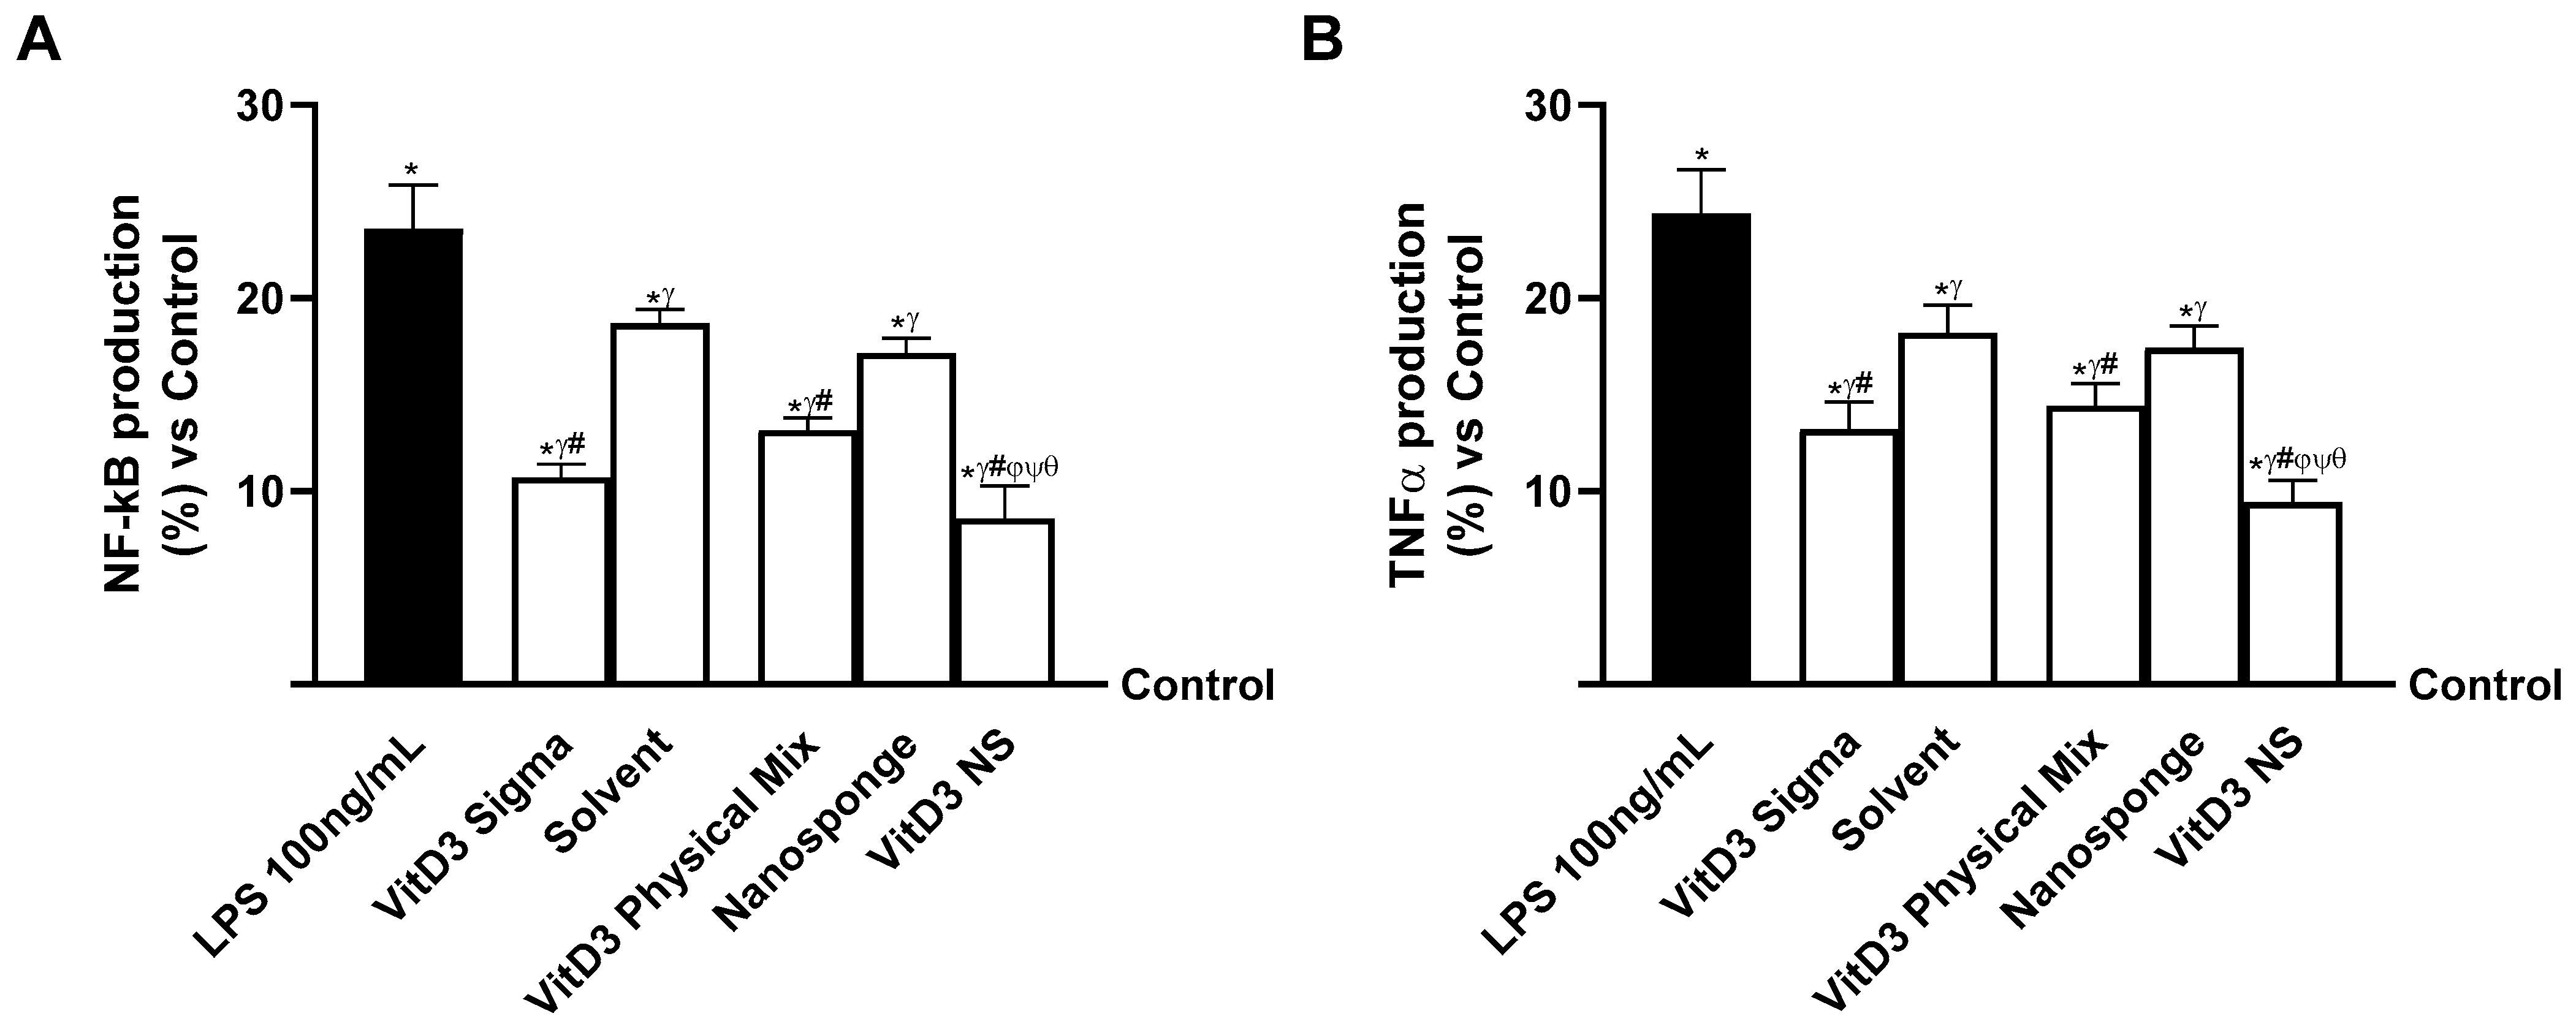
2.5. Evaluation of the Ability of VitD3 NS to Modulate Inflammation
3. Discussion
3.1. Introducing the Connection between Gut–Brain Axis and Neurosteroid Dynamics of VitD3
3.2. Enhancing VitD3 Bioavailability and Efficacy Using VitD3-NS as a Novel Formulation
3.3. VitD3-NS and the Gut–Brain Axis: Implications for Minimal Cognitive Function and Neuroprotection
4. Materials and Methods
4.1. Agent Preparation
4.2. Cell Culture
4.3. Experimental Protocol
4.4. Cell Viability
4.5. In Vitro Intestinal Barrier
- dQ: amount of substance transported (nmol or μg);
- dt: incubation time (sec);
- m0: amount of substrate applied to donor compartment (nmol or μg);
- A: surface area of Transwell membrane (cm2);
- VDonor: volume of the donor compartment (cm3).
4.6. TJs Analysis
4.7. Vitamin D Quantification
4.8. VDR Assay Kit
4.9. ROS Production
4.10. NO Production
4.11. Lipid Peroxidation Assay
4.12. ERK/MAPKS ELISA Kit
4.13. Human Phosphotylinosital 3 Kinase (PI3K) ELISA Kit
4.14. BDNF Quantification ELISA Kit
4.15. SIRT-1 Assay Kit
4.16. Amyloid Precursor Protein (APP) Assay Kit
4.17. Human Tau (Pospho) Protein Assay Kit
4.18. NF-kB Analysis
4.19. TNFα Assay Kit
4.20. Human TRL-4 ELISA Kit
4.21. Human NLRP3 ELISA Kit
4.22. Statistical Analysis
5. Conclusions
Author Contributions
Funding
Institutional Review Board Statement
Informed Consent Statement
Data Availability Statement
Acknowledgments
Conflicts of Interest
Abbreviations
| Adv DMEM | Advance Dulbecco’s Modified Eagle’s Medium |
| Adv DMEM/F12 | Advanced Dulbecco’s Modified Eagle Medium F12 |
| ANOVA | Analysis of Variance |
| APP | β-amyloid |
| ATCC | American Type Culture Collection |
| CDs | Cyclodextrins |
| FBS | fetal bovine serum |
| GBA | Gut–Brain Axis |
| IBS | inflammatory bowel syndrome |
| LPS | lipopolysaccharide |
| MTT | 3-(4,5-Dimethylthiazol-2-yl)-2,5-diphenyltetrazolium bromide |
| NS | Nanosponge |
| OCLN | Occludin |
| Papp | Apparent permeability coefficient |
| PBS | Phosphate Buffered Saline |
| ROS | Radical oxygen species |
| SD | standard deviation |
| SDS | Sodium dodecyl sulfate |
| SOD | Superoxide Dismutase |
| TBARS | Thiobarbituric acid reactive substances |
| TEER | Transepithelial electrical resistance values |
| TGA | Thermal gravimetric analysis |
| TJ | Tight Junction |
| TJP1 | Human Tight Junction Protein 1 |
| TRL-4 | Toll-like receptor-4 TRL-4 |
| VDR3 | Vitamin D Receptor |
| VitD3 | Vitamin D3 |
| VitD3 NS | Vitamin D3-BCDI 1:4 nanosponge |
| ZO-1 | Zona occludens 1 |
References
- Chen, S.; Law, C.S.; Grigsby, C.L.; Olsen, K.; Hong, T.T.; Zhang, Y.; Yeghiazarians, Y.; Gardner, D.G. Cardiomyocyte-specific deletion of the vitamin D receptor gene results in cardiac hypertrophy. Circulation 2011, 124, 1838–1847. [Google Scholar] [CrossRef]
- Gardner, D.G.; Chen, S.; Glenn, D.J. Vitamin D and the heart. Am. J. Physiol. Regul. Integr. Comp. Physiol. 2013, 305, R969–R977. [Google Scholar] [CrossRef] [PubMed]
- Szeto, F.L.; Reardon, C.A.; Yoon, D.; Wang, Y.; Wong, K.E.; Chen, Y.; Kong, J.; Liu, S.Q.; Thadhani, R.; Getz, G.S.; et al. Vitamin D receptor signaling inhibits atherosclerosis in mice. Mol. Endocrinol. 2012, 26, 1091–1101. [Google Scholar] [CrossRef] [PubMed]
- Bikle, D.D. Vitamin D metabolism, mechanism of action, and clinical applications. Chem. Biol. 2014, 21, 319–329. [Google Scholar] [CrossRef]
- Uberti, F.; Trotta, F.; Pagliaro, P.; Bisericaru, D.M.; Cavalli, R.; Ferrari, S.; Penna, C.; Matencio, A. Developing New Cyclodextrin-Based Nanosponges Complexes to Improve Vitamin D Absorption in an In Vitro Study. Int. J. Mol. Sci. 2023, 24, 5322. [Google Scholar] [CrossRef]
- Kurkov, S.V.; Loftsson, T. Cyclodextrins. Int. J. Pharm. 2013, 453, 167–180. [Google Scholar] [CrossRef]
- Mayer, E.A.; Nance, K.; Chen, S. The Gut-Brain Axis. Annu. Rev. Med. 2022, 73, 439–453. [Google Scholar] [CrossRef] [PubMed]
- Balmus, I.M.; Lefter, R.; Ciobica, A.; Cojocaru, S.; Guenne, S.; Timofte, D.; Stanciu, C.; Trifan, A.; Hritcu, L. Preliminary BiochemicalDescription of Brain Oxidative Stress Status in Irritable Bowel Syndrome Contention-Stress Rat Model. Medicina 2019, 55, 776. [Google Scholar] [CrossRef]
- Zhou, S.Y.; Gillilland, M., 3rd; Wu, X.; Leelasinjaroen, P.; Zhang, G.; Zhou, H.; Ye, B.; Lu, Y.; Owyang, C. FODMAP diet modulates visceral nociception by lipopolysaccharide-mediated intestinal inflammation and barrier dysfunction. J. Clin. Investig. 2018, 128, 267–280. [Google Scholar] [CrossRef]
- Dlugosz, A.; Nowak, P.; D’Amato, M.; Mohammadian Kermani, G.; Nyström, J.; Abdurahman, S.; Lindberg, G. Increased serum levels of lipopolysaccharide and antiflagellin antibodies in patients with diarrhea-predominant irritable bowel syndrome. Neurogastroenterol. Motil. 2015, 27, 1747–1754. [Google Scholar] [CrossRef]
- Veraza, D.I.; Calderon, G.; Jansson-Knodell, C.; Aljaras, R.; Foster, E.D.; Xu, H.; Biruete, A.; Shin, A. A systematic review and meta-analysis of diet and nutrient intake in adults with irritable bowel syndrome. Neurogastroenterol. Motil. 2023, 36, e14698. [Google Scholar] [CrossRef] [PubMed]
- Matthews, S.W.; Heitkemper, M.M.; Kamp, K. Early Evidence Indicates Vitamin D Improves Symptoms of Irritable Bowel Syndrome: Nursing Implications and Future Research Opportunities. Gastroenterol. Nurs. 2021, 44, 426–436. [Google Scholar] [CrossRef] [PubMed]
- Dussik, C.M.; Hockley, M.; Grozić, A.; Kaneko, I.; Zhang, L.; Sabir, M.S.; Park, J.; Wang, J.; Nickerson, C.A.; Yale, S.H.; et al. Gene Expression Profiling and Assessment of Vitamin D and Serotonin Pathway Variations in Patients With Irritable Bowel Syndrome. J. Neurogastroenterol. Motil. 2018, 24, 96–106. [Google Scholar] [CrossRef] [PubMed]
- Yang, J.; Wise, L.; Fukuchi, K.I.; Yang, J.; Wise, L.; Fukuchi, K.I. TLR4 Cross-Talk With NLRP3 Inflammasome and Complement Signaling Pathways in Alzheimer’s Disease. Front. Immunol. 2020, 11, 724. [Google Scholar] [CrossRef] [PubMed]
- Bercik, P. The Brain-Gut-Microbiome Axis and Irritable Bowel Syndrome. Gastroenterol. Hepatol. 2020, 16, 322–324. [Google Scholar]
- Mayer, E.A.; Ryu, H.J.; Bhatt, R.R. The neurobiology of irritable bowel syndrome. Mol. Psychiatry 2023, 28, 1451–1465. [Google Scholar] [CrossRef]
- Fernandes de Abreu, D.A.; Eyles, D.; Féron, F. Vitamin D, a neuro-immunomodulator: Implications for neurodegenerative and autoimmune diseases. Psychoneuroendocrinology 2009, 34 (Suppl. S1), S265–S277. [Google Scholar] [CrossRef]
- Garcion, E.; Wion-Barbot, N.; Montero-Menei, C.N.; Berger, F.; Wion, D. New clues about vitamin D functions in the nervous system. Trends Endocrinol. Metab. 2002, 13, 100–105. [Google Scholar] [CrossRef]
- Groves, N.J.; McGrath, J.J.; Burne, T.H. Vitamin D as a neurosteroid affecting the developing and adult brain. Annu. Rev. Nutr. 2014, 34, 117–141. [Google Scholar] [CrossRef]
- Šimoliūnas, E.; Rinkūnaitė, I.; Bukelskienė, Ž.; Bukelskienė, V. Bioavailability of Different Vitamin D Oral Supplements in Laboratory Animal Model. Medicina 2019, 55, 265. [Google Scholar] [CrossRef]
- Keijzer, F.A. Evolutionary convergence and biologically embodied cognition. Interface Focus 2017, 7, 20160123. [Google Scholar] [CrossRef] [PubMed]
- Qin, C.; Zhang, S.; Yuan, Q.; Liu, M.; Jiang, N.; Zhuang, L.; Huang, L.; Wang, P. A Cell Co-Culture Taste Sensor Using Different Proportions of Caco-2 and SH-SY5Y Cells for Bitterness Detection. Chemosensors 2022, 10, 173. [Google Scholar] [CrossRef]
- Rubin Pedrazzo, A.; Caldera, F.; Zanetti, M.; Appleton, S.L.; Dhakar, N.K.; Trotta, F. Mechanochemical green synthesis of hyper-crosslinked cyclodextrin polymers. Beilstein J. Org Chem. 2020, 16, 1554–1563. [Google Scholar] [CrossRef] [PubMed]
- Langerak, N.; Ahmed, H.M.M.; Li, Y.; Middel, I.R.; Eslami Amirabadi, H.; Malda, J.; Masereeuw, R.; van Roij, R. A Theoretical and Experimental Study to Optimize Cell Differentiation in a Novel Intestinal Chip. Front. Bioeng. Biotechnol. 2020, 8, 763. [Google Scholar] [CrossRef] [PubMed]
- Girgis, C.M.; Clifton-Bligh, R.J.; Mokbel, N.; Cheng, K.; Gunton, J.E. Vitamin D signaling regulates proliferation, differentiation, and myotube size in C2C12 skeletal muscle cells. Endocrinology 2014, 155, 347–357. [Google Scholar] [CrossRef] [PubMed]
- Uberti, F.; Bardelli, C.; Morsanuto, V.; Ghirlanda, S.; Molinari, C. Role of vitamin D3 combined to alginates in preventing acid and oxidative injury in cultured gastric epithelial cells. BMC Gastroenterol. 2016, 16, 127. [Google Scholar] [CrossRef]
- Gidwani, B.; Vyas, A. A comprehensive review on cyclodextrin-based carriers for delivery of chemotherapeutic cytotoxic anticancer drugs. Biomed. Res. Int. 2015, 2015, 198268. [Google Scholar] [CrossRef]
- Waris, K.H.; Lee, V.S.; Mohamad, S. Pesticide remediation with cyclodextrins: A review. Environ. Sci. Pollut. Res. Int. 2021, 28, 47785–47799. [Google Scholar] [CrossRef]
- Molinari, C.; Morsanuto, V.; Ghirlanda, S.; Ruga, S.; Notte, F.; Gaetano, L.; Uberti, F. Role of Combined Lipoic Acid and Vitamin D3 on Astrocytes as a Way to Prevent Brain Ageing by Induced Oxidative Stress and Iron Accumulation. Oxid. Med. Cell. Longev. 2019, 2019, 2843121. [Google Scholar] [CrossRef]
- Galla, R.; Ruga, S.; Aprile, S.; Ferrari, S.; Brovero, A.; Grosa, G.; Molinari, C.; Uberti, F. New Hyaluronic Acid from Plant Origin to Improve Joint Protection-An In Vitro Study. Int. J. Mol. Sci. 2022, 23, 8114. [Google Scholar] [CrossRef]
- Ceriotti, L.; Meloni, M. La valutazione dell’assorbimento intestinale in vitro. L’integratore Nutr. 2014, 17, 62–65. [Google Scholar]
- Hubatsch, I.; Ragnarsson, E.G.; Artursson, P. Determination of drug permeability and prediction of drug absorption in Caco-2 monolayers. Nat. Protoc. 2007, 2, 2111–2119. [Google Scholar] [CrossRef]
- Christides, T.; Wray, D.; McBride, R.; Fairweather, R.; Sharp, P. Iron bioavailability from commercially available iron supplements. Eur. J. Nutr. 2015, 54, 1345–1352. [Google Scholar] [CrossRef]
- Fda.Gov. Available online: https://www.fda.gov/media/117974/download (accessed on 12 May 2023).
- Ema.Eu. Available online: https://www.ema.europa.eu/en/documents/scientific-guideline/ich-m9-biopharmaceutics-classification-system-based-biowaivers-step-2b-first-version_en.pdf (accessed on 6 August 2023).
- Kämpfer, A.A.M.; Urbán, P.; Gioria, S.; Kanase, N.; Stone, V.; Kinsner-Ovaskainen, A. Development of an in vitro co-culture model to mimic the human intestine in healthy and diseased state. Toxicol. Vitr. 2017, 45, 31–43. [Google Scholar] [CrossRef]
- Wu, H.C.; Hu, Q.L.; Zhang, S.J.; Wang, Y.M.; Jin, Z.K.; Lv, L.F.; Zhang, S.; Liu, Z.L.; Wu, H.L.; Cheng, O.M. Neuroprotective effects of genistein on SH-SY5Y cells overexpressing A53T mutant α-synuclein. Neural. Regen. Res. 2018, 13, 1375–1383. [Google Scholar] [CrossRef] [PubMed]
- Zhao, X.; Xu, X.X.; Liu, Y.; Xi, E.Z.; An, J.J.; Tabys, D.; Liu, N. The in vitro protective role of bovine lactoferrin on intestinal epithelial barrier. Molecules 2019, 24, 148. [Google Scholar] [CrossRef] [PubMed]
- Querobino, S.M.; Ribeiro, C.A.J.; Alberto-Silva, C. Bradykinin-potentiating PEPTIDE-10C, an argininosuccinate synthetase activator, protects against H2O2-induced oxidative stress in SH-SY5Y neuroblastoma cells. Peptides. 2018, 103, 90–97. [Google Scholar] [CrossRef] [PubMed]
- Han, F.; Li, S.; Yang, Y.; Bai, Z. Interleukin-6 promotes ferroptosis in bronchial epithelial cells by inducing reactive oxygen species-dependent lipid peroxidation and disrupting iron homeostasis. Bioengineered 2021, 12, 5279–5288. [Google Scholar] [CrossRef] [PubMed]
- Ferrari, S.; Galla, R.; Mulè, S.; Rosso, G.; Brovero, A.; Macchi, V.; Ruga, S.; Uberti, F. The Role of Bifidobacterium bifidum novaBBF7, Bifidobacterium longum novaBLG2 and Lactobacillus paracasei TJB8 to Improve Mechanisms Linked to Neuronal Cells Protection against Oxidative Condition in a Gut-Brain Axis Model. Int. J. Mol. Sci. 2023, 24, 12281. [Google Scholar] [CrossRef] [PubMed]
- Liu, W.; Wang, G.; Cao, X.; Luo, X.; Li, Z.; Deng, Y.; Li, X.; Wang, S.; Liu, M.; Hu, J.; et al. Down-regulation of p110β expression increases chemosensitivity of colon cancer cell lines to oxaliplatin. J. Huazhong Univ. Sci. Technolog. Med. Sci 2012, 32, 280–286. [Google Scholar] [CrossRef] [PubMed]
- Spampinato, S.F.; Merlo, S.; Fagone, E.; Fruciano, M.; Sano, Y.; Kanda, T.; Sortino, M.A. Reciprocal Interplay Between Astrocytes and CD4+ Cells Affects Blood-Brain Barrier and Neuronal Function in Response to β Amyloid. Front. Mol. Neurosci. 2020, 13, 120. [Google Scholar] [CrossRef] [PubMed]
- Flores, C.; Adhami, N.; Martins-Green, M. THS Toxins Induce Hepatic Steatosis by Altering Oxidative Stress and SIRT1 Levels. J. Clin. Toxicol. 2016, 6, 318. [Google Scholar] [CrossRef]
- Petroni, D.; Tsai, J.; Agrawal, K.; Mondal, D.; George, W. Low-dose methylmercury-induced oxidative stress, cytotoxicity, and tau-hyperphosphorylation in human neuroblastoma (SH-SY5Y) cells. Environ. Toxicol. 2012, 27, 549–555. [Google Scholar] [CrossRef] [PubMed]


Disclaimer/Publisher’s Note: The statements, opinions and data contained in all publications are solely those of the individual author(s) and contributor(s) and not of MDPI and/or the editor(s). MDPI and/or the editor(s) disclaim responsibility for any injury to people or property resulting from any ideas, methods, instructions or products referred to in the content. |
© 2024 by the authors. Licensee MDPI, Basel, Switzerland. This article is an open access article distributed under the terms and conditions of the Creative Commons Attribution (CC BY) license (https://creativecommons.org/licenses/by/4.0/).
Share and Cite
Uberti, F.; Trotta, F.; Cavalli, R.; Galla, R.; Caldera, F.; Ferrari, S.; Mulè, S.; Brovero, A.; Molinari, C.; Pagliaro, P.; et al. Enhancing Vitamin D3 Efficacy: Insights from Complexation with Cyclodextrin Nanosponges and Its Impact on Gut–Brain Axes in Physiology and IBS Syndrome. Int. J. Mol. Sci. 2024, 25, 2189. https://doi.org/10.3390/ijms25042189
Uberti F, Trotta F, Cavalli R, Galla R, Caldera F, Ferrari S, Mulè S, Brovero A, Molinari C, Pagliaro P, et al. Enhancing Vitamin D3 Efficacy: Insights from Complexation with Cyclodextrin Nanosponges and Its Impact on Gut–Brain Axes in Physiology and IBS Syndrome. International Journal of Molecular Sciences. 2024; 25(4):2189. https://doi.org/10.3390/ijms25042189
Chicago/Turabian StyleUberti, Francesca, Francesco Trotta, Roberta Cavalli, Rebecca Galla, Fabrizio Caldera, Sara Ferrari, Simone Mulè, Arianna Brovero, Claudio Molinari, Pasquale Pagliaro, and et al. 2024. "Enhancing Vitamin D3 Efficacy: Insights from Complexation with Cyclodextrin Nanosponges and Its Impact on Gut–Brain Axes in Physiology and IBS Syndrome" International Journal of Molecular Sciences 25, no. 4: 2189. https://doi.org/10.3390/ijms25042189
APA StyleUberti, F., Trotta, F., Cavalli, R., Galla, R., Caldera, F., Ferrari, S., Mulè, S., Brovero, A., Molinari, C., Pagliaro, P., & Penna, C. (2024). Enhancing Vitamin D3 Efficacy: Insights from Complexation with Cyclodextrin Nanosponges and Its Impact on Gut–Brain Axes in Physiology and IBS Syndrome. International Journal of Molecular Sciences, 25(4), 2189. https://doi.org/10.3390/ijms25042189