Article

Regulation of Follicular Development in Chickens: WIF1 Modulates Granulosa Cell Proliferation and Progesterone Synthesis via Wnt/β-Catenin Signaling Pathway

State Key Laboratory of Animal Biotech Breeding, Beijing Key Laboratory for Animal Genetic Improvement, College of Animal Science and Technology, China Agricultural University, Beijing 100193, China
*
Authors to whom correspondence should be addressed.
Int. J. Mol. Sci. 2024, 25(3), 1788; https://doi.org/10.3390/ijms25031788
Submission received: 20 December 2023 / Revised: 26 January 2024 / Accepted: 30 January 2024 / Published: 1 February 2024
(This article belongs to the Section Molecular Genetics and Genomics)

Abstract

:
Proliferation, apoptosis, and steroid hormone secretion by granulosa cells (GCs) and theca cells (TCs) are essential for maintaining the fate of chicken follicles. Our previous study showed that the Wnt inhibitor factor 1 (WIF1) plays a role in follicle selection. However, the significance of WIF1 in GC- and TC-associated follicular development was not explicitly investigated. This study found that WIF1 expression was strongly downregulated during follicle selection (p < 0.05) and was significantly higher in GCs than in TCs (p < 0.05). WIF1 inhibits proliferation and promotes apoptosis in GCs. Additionally, it promotes progesterone secretion in prehierarchal GCs (pre-GCs, 1.16 ± 0.05 ng/mg vs. 1.58 ng/mg ± 0.12, p < 0.05) and hierarchal GCs (hie-GCs, 395.00 ng/mg ± 34.73 vs. 527.77 ng/mg ± 27.19, p < 0.05) with the participation of the follicle-stimulating hormone (FSH). WIF1 affected canonical Wnt pathways and phosphorylated β-catenin expression in GCs. Furthermore, 604 upregulated differentially expressed genes (DEGs) and 360 downregulated DEGs in WIF1-overexpressed GCs were found through RNA-seq analysis (criteria: | log 2 ( F o l d C h a n g e ) | > 1 and p_adj < 0.05). Cytokine–cytokine receptor interaction and the steroid hormone biosynthesis pathway were identified. In addition, the transcript of estrogen receptor 2 (ESR2) increased significantly ( log 2 ( F o l d C h a n g e ) = 1.27, p_adj < 0.05). Furthermore, we found that WIF1 regulated progesterone synthesis by upregulating ESR2 expression in GCs. Additionally, WIF1 suppressed proliferation and promoted apoptosis in TCs. Taken together, these results reveal that WIF1 stimulates follicle development by promoting GC differentiation and progesterone synthesis, which provides an insight into the molecular mechanism of follicle selection and egg-laying performance in poultry.

1. Introduction

The avian ovary is an important reproductive organ responsible for regulating the development and maturation of follicles and hormone secretion and, ultimately, influencing reproductive performance [1]. The follicle is the fundamental development unit of the ovary, where each oocyte is covered by the surrounding somatic granulosa cell (GC) layer and theca cell (TC) layer. Chicken ovary follicles can be categorized as follows: quiescent primordial follicles, slowly growing but easily atresic prehierarchal follicles, and well-ordered hierarchal follicles [2,3]. The process of recruiting into the cohort of hierarchal follicles in the ovaries typically observed in small yellow follicles (SYFs, 6–8 mm in diameter) is referred to as follicle selection [4]. The normal process of follicle selection is crucial for hens to achieve regular ovulation and sustain a high level of egg-laying performance.
Follicle selection is a precisely orchestrated process controlled by many regulatory molecules. The growth differentiation factor 9 (GDF9) and bone morphogenetic protein 15 (BMP15) genes from the TGF-β family are specifically expressed in oocytes and play a key role in the female fertility of birds [5]. The peptide growth factors, including the epidermal growth factor (EGF), likely act as a paracrine signal to regulate the proliferation of GCs during ovarian follicle development [6]. The excessive GC apoptosis and degeneration may result in follicular atresia [7]. The follicle-stimulating hormone (FSH), secreted by the pituitary gland, also participates in the regulation of follicle selection [8]. The accumulation of cyclic adenosine monophosphate (cAMP) induced by the FSH receptor (FSHR) is involved in the differentiation of GCs from undifferentiation status in prehierarchal follicles [1]. One of the most notable changes in differentiated GCs is the increased ability to synthesize steroid hormones, and the key enzymes involved in steroidogenesis are the steroidogenic acute regulatory protein (STAR), the cytochrome P450 family 11 subfamily A member 1 (CYP11A1), and 3 β-hydroxysteroid dehydrogenases (3β-HSDs) [9,10]. These observations suggest that cell proliferation, apoptosis, and steroid hormone synthesis and secretion can influence the fate of follicles. Although there are significant differences in GCs before and after follicle selection, the key regulatory factors that modulate GC differentiation from prehierarchal to hierarchal follicles have been uncovered. Additionally, the effects of TCs on follicular development have not been sufficiently investigated as the main membrane component of follicles.
Our previous study showed the mRNA expression profile of chicken follicles during selective development [11], and we identified the Wnt inhibitory factor 1 (WIF1) to be involved in follicle selection. The WIF1 gene was originally identified in the human retina as a blocker of the Wnt signaling pathway [12]. This is well known for regulating human diseases, such as cancers of the prostate, breast, lung, and bladder [13,14]. Hypermethylation of the WIF1 promoter is associated with various types of cancer, such as lung cancer and psoriasis [15,16]. However, the functions of WIF1 in follicle development (especially in agricultural animals) remain unclear.
This study explored WIF1 expression characteristics and biological functions, including proliferation, apoptosis, and steroid hormone secretion in chicken GCs and TCs, and the regulatory mechanisms of WIF1 in GCs. To the best of our knowledge, this is the first study to elucidate the function and regulatory mechanism of WIF1 during follicle selection in chickens, providing novel insights into the regulatory mechanism of follicle development and egg production in poultry.

2. Results

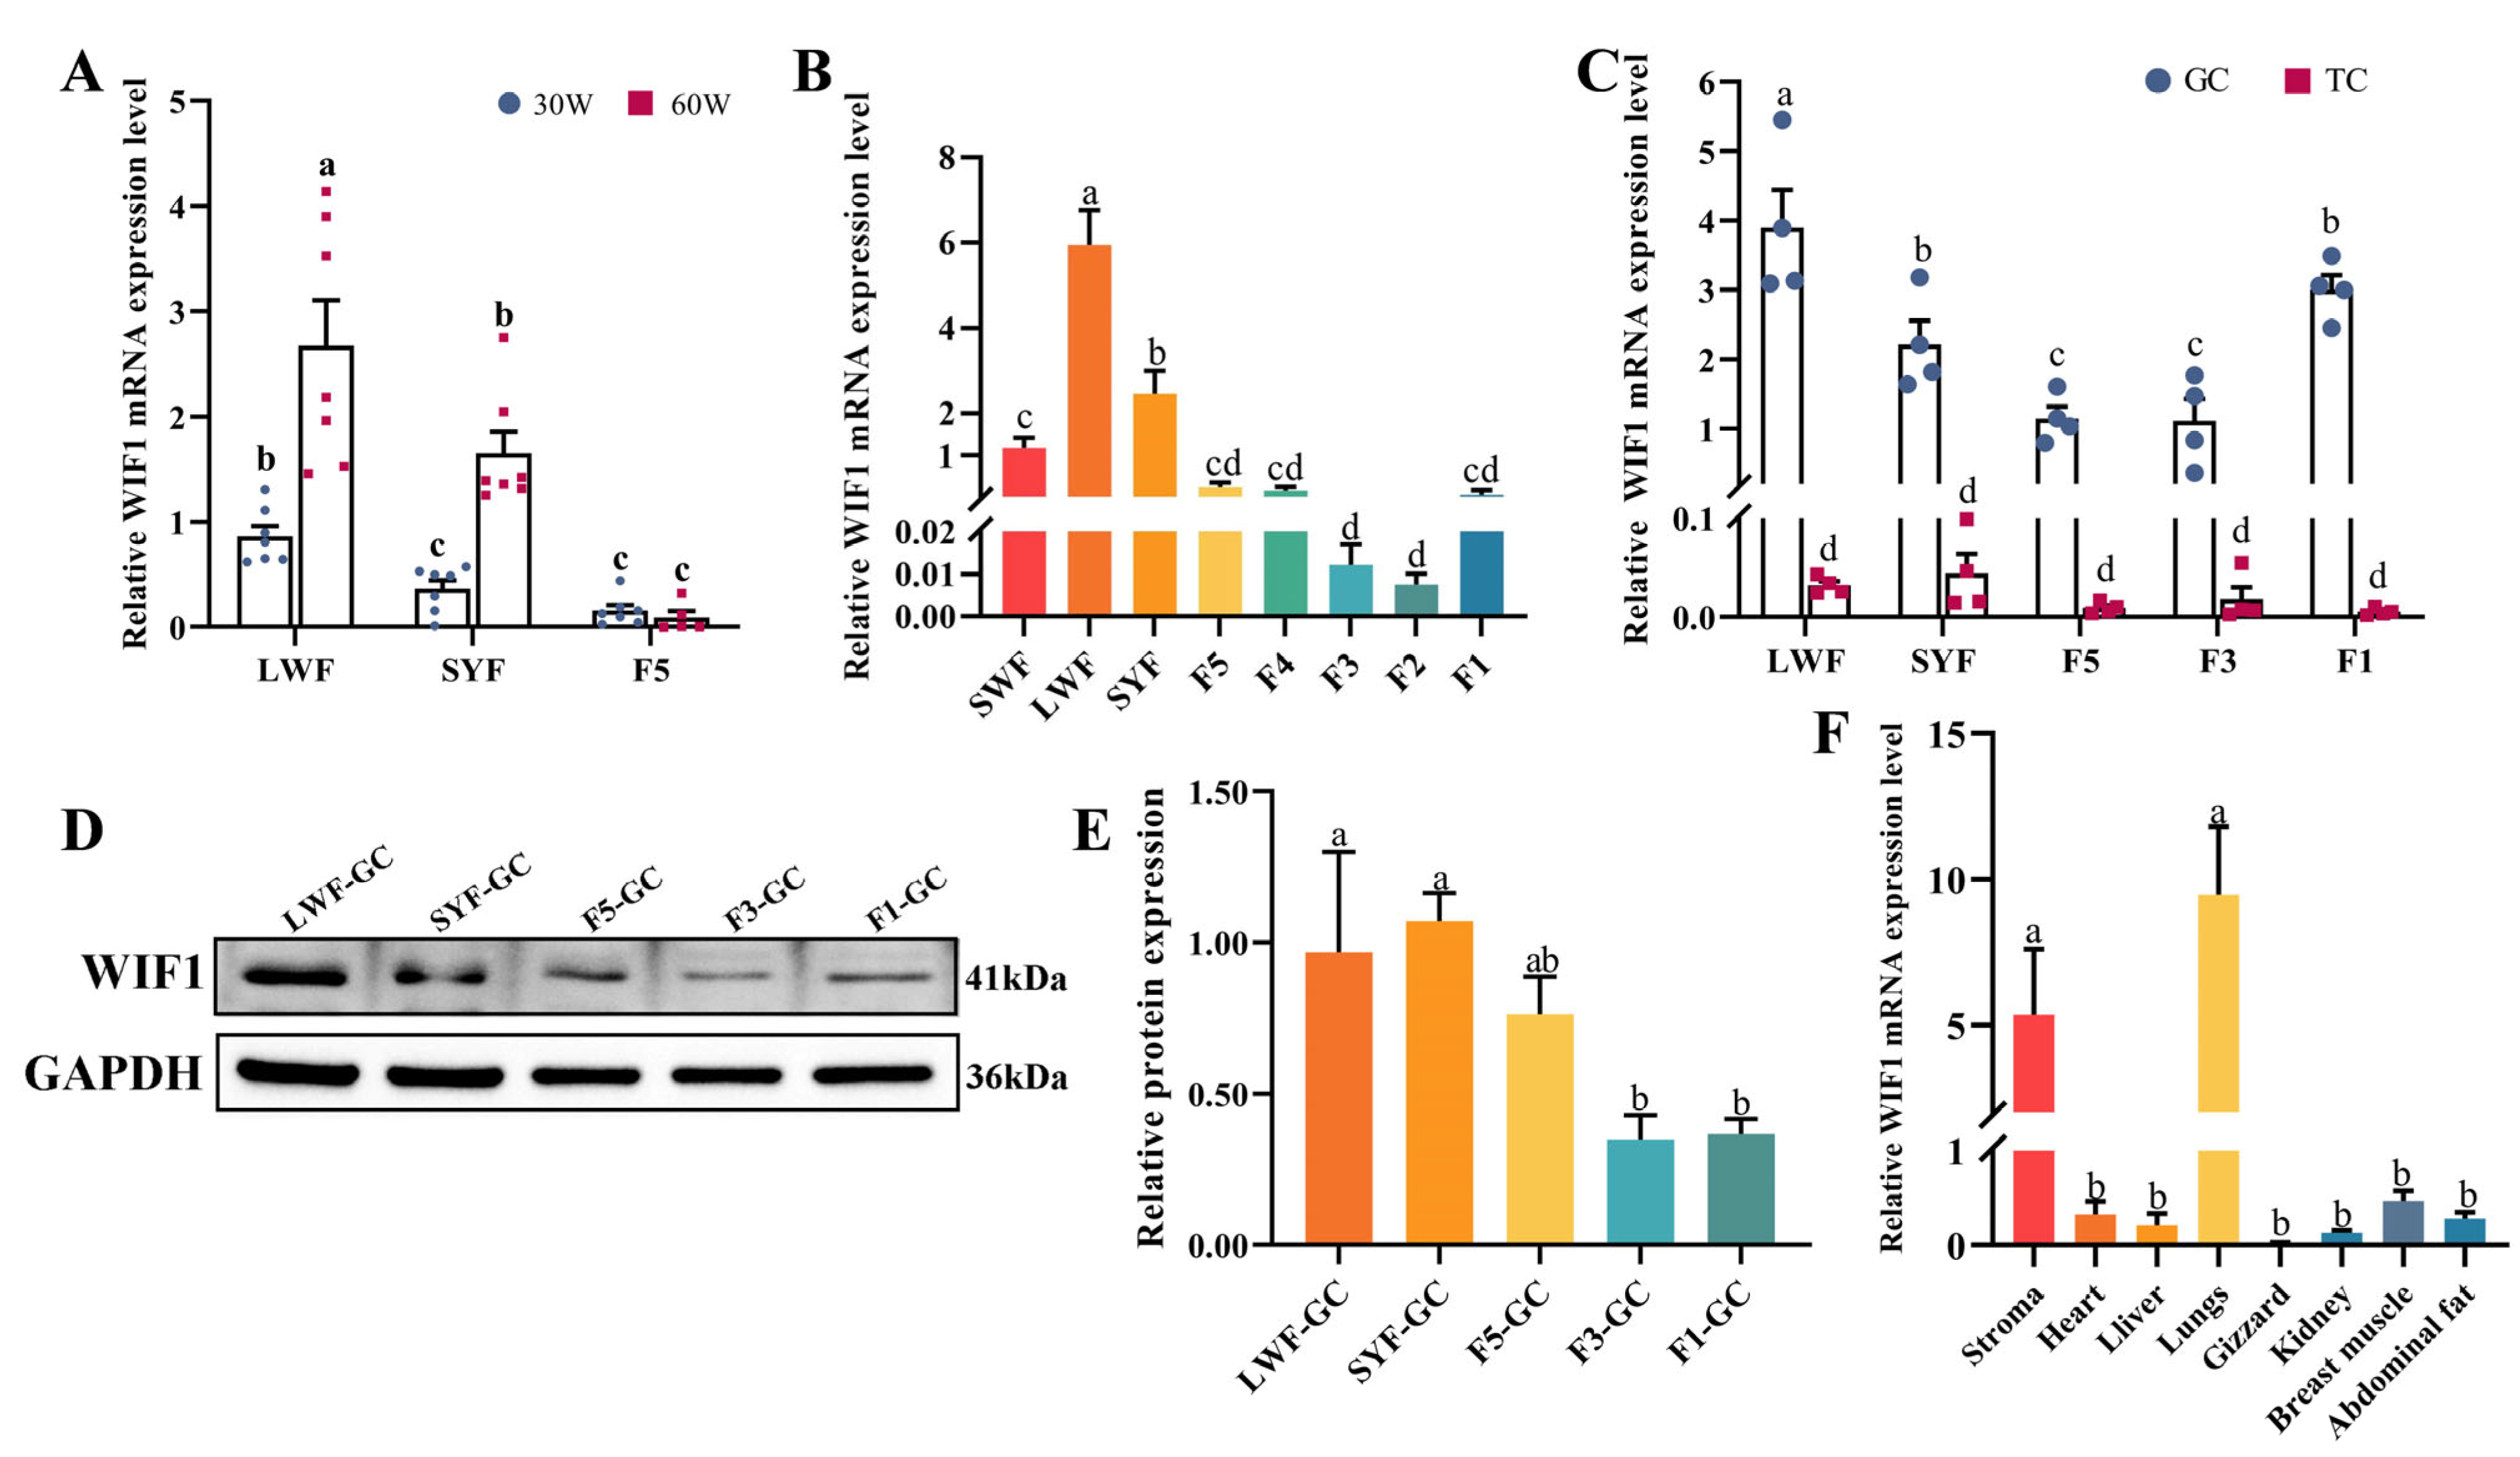
2.1. Expression Characteristics of WIF1 in Chickens

The expression of WIF1 in prehierarchal follicles (large white follicle, LWFs or SYFs) was significantly higher than that in hierarchical follicles (F5s) (p < 0.05), which was consistent with our previous transcriptomic results (Figure 1A) [11]. Additionally, WIF1 expression was significantly lower in LWFs and SYFs at the peak period (30 weeks old) of the laying cycle than at the late period (60 weeks old) (p < 0.05), but not statistically significant in F5s (p > 0.05, Figure 1A). WIF1 expression showed dynamic changes in follicles during different developmental stages in chicken ovaries, and the WIF1 expression level was highest in LWFs, gradually declined until F2s, and slightly increased in F1s (Figure 1B). The WIF1 levels were significantly higher in GCs than in TCs throughout the follicle development process (p < 0.05, Figure 1C). Additionally, the mRNA and protein levels of WIF1 in GCs were consistent with those in follicle tissues (p < 0.05, Figure 1C–E). WIF1 was predominantly expressed in the ovarian stroma and lungs (p < 0.05; Figure 1F). These results suggest that WIF1 plays a regulatory role in follicle development, specifically through its involvement in GCs.

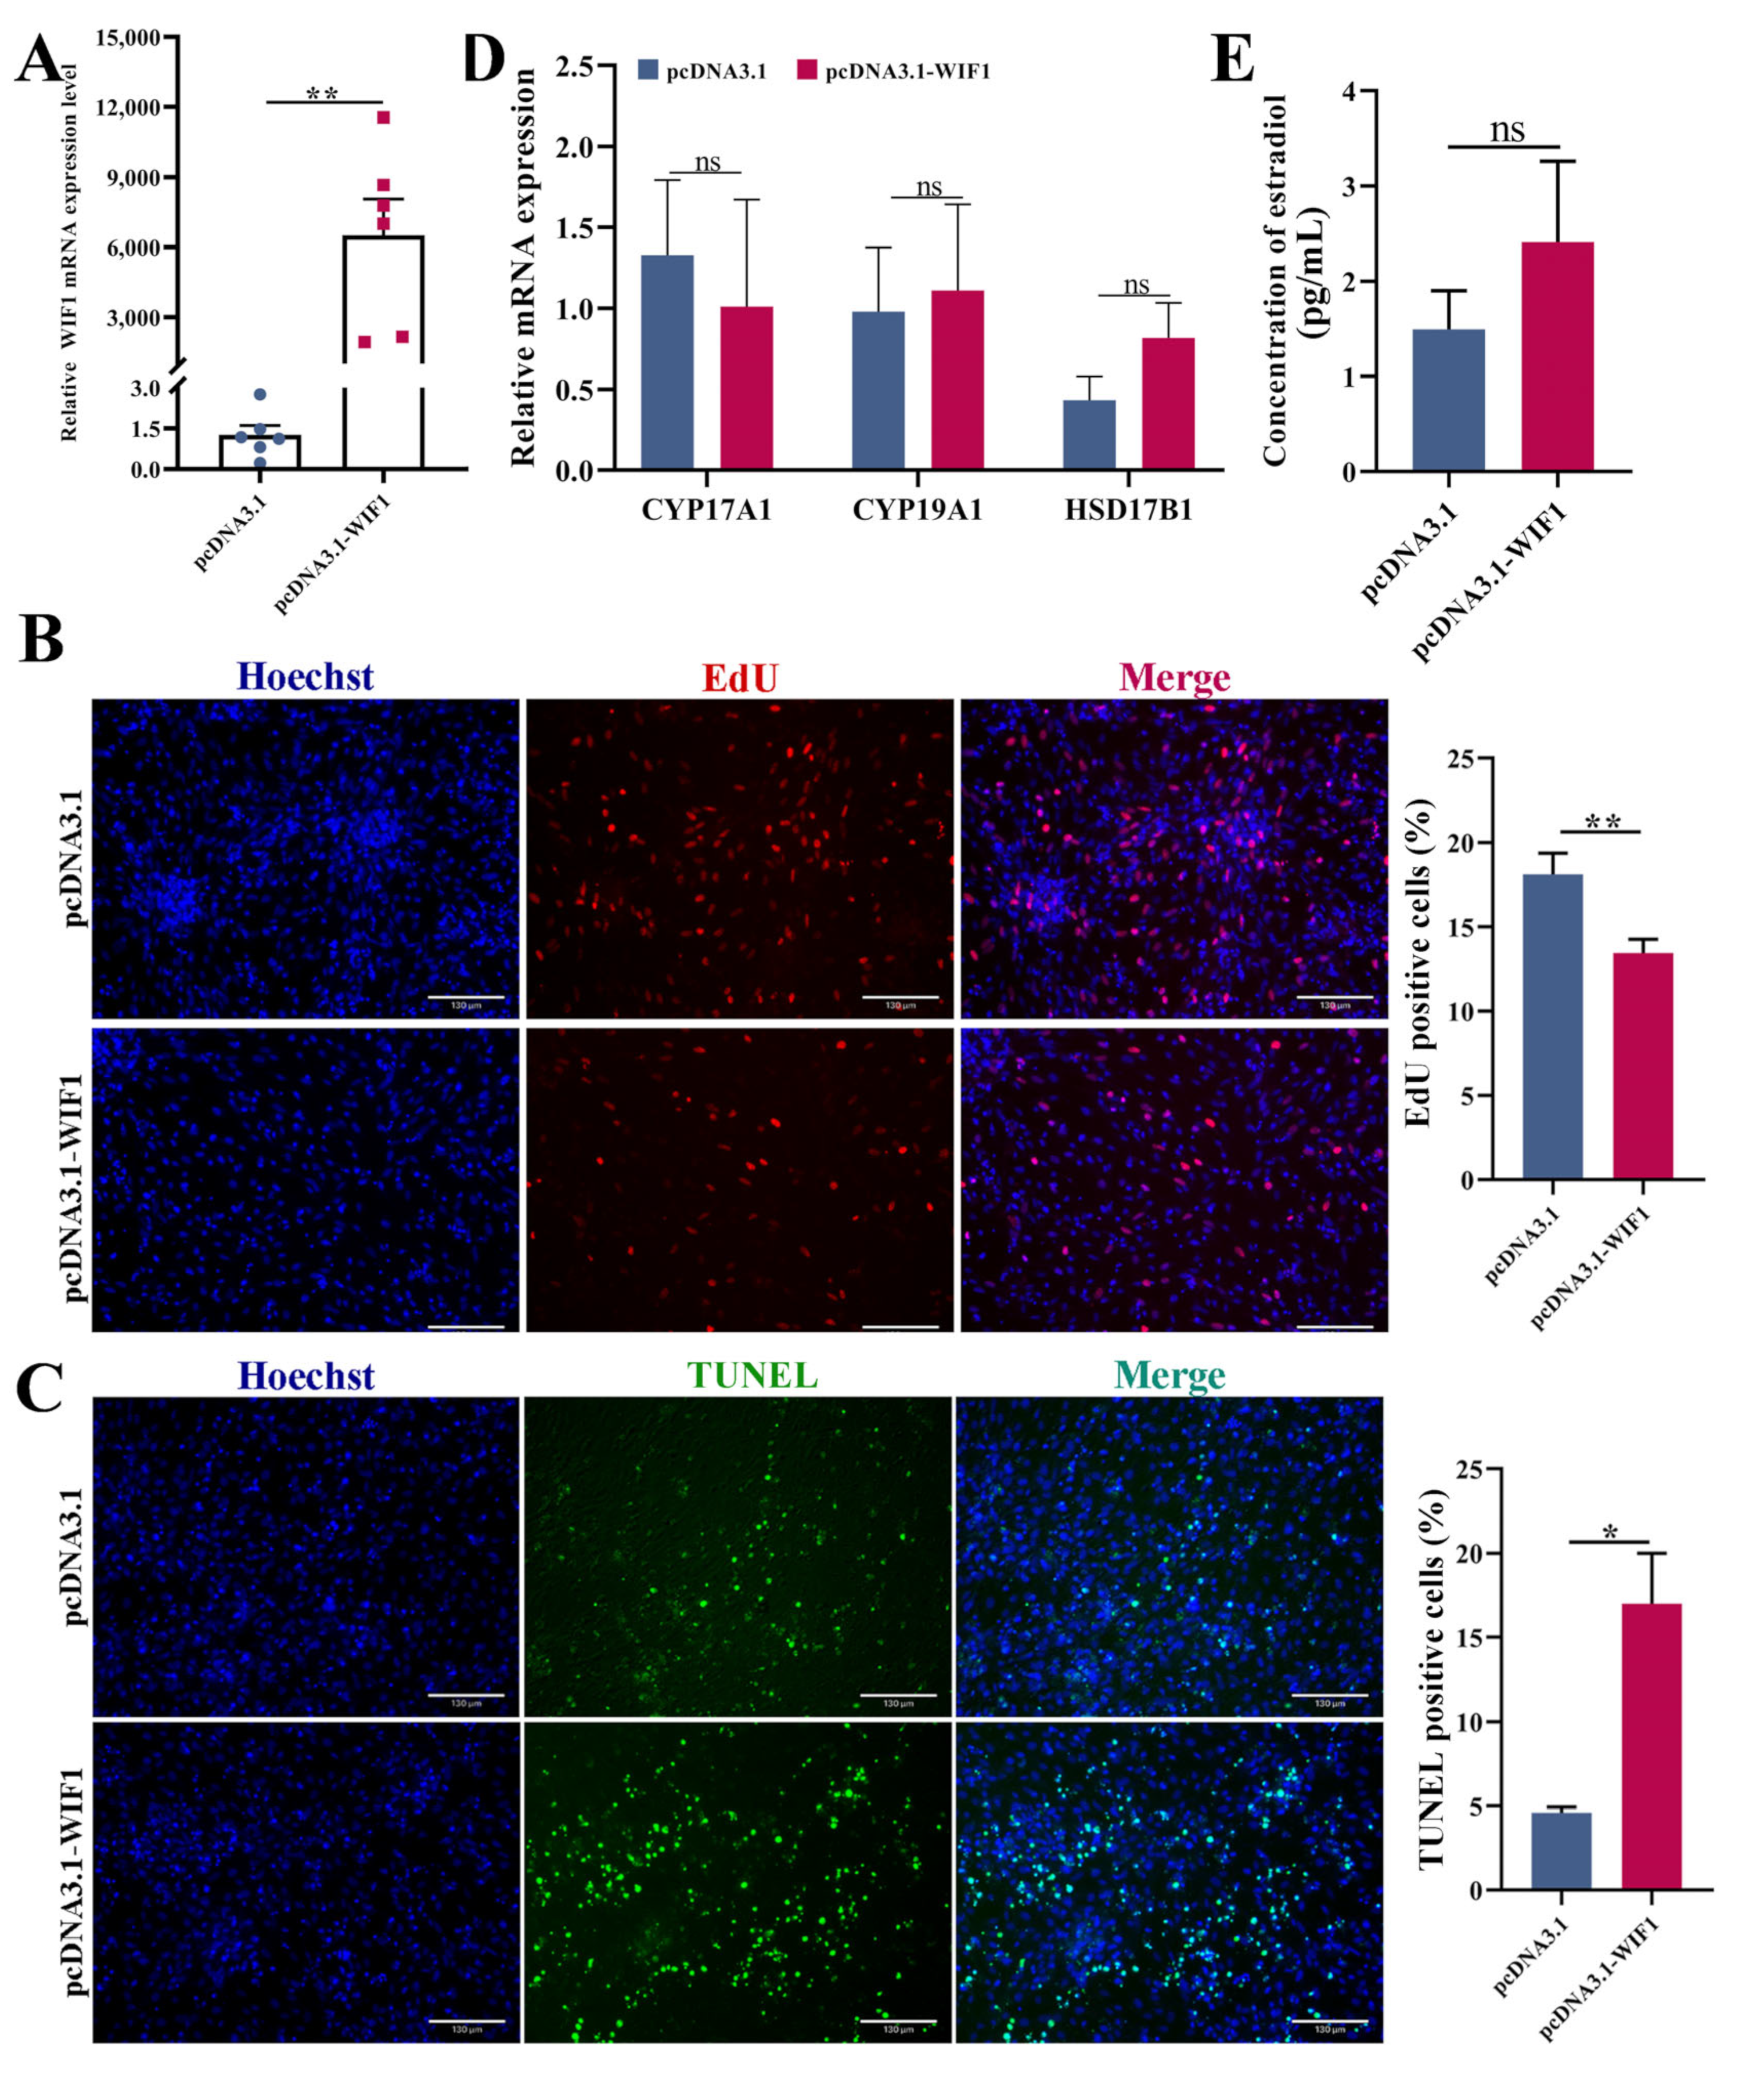
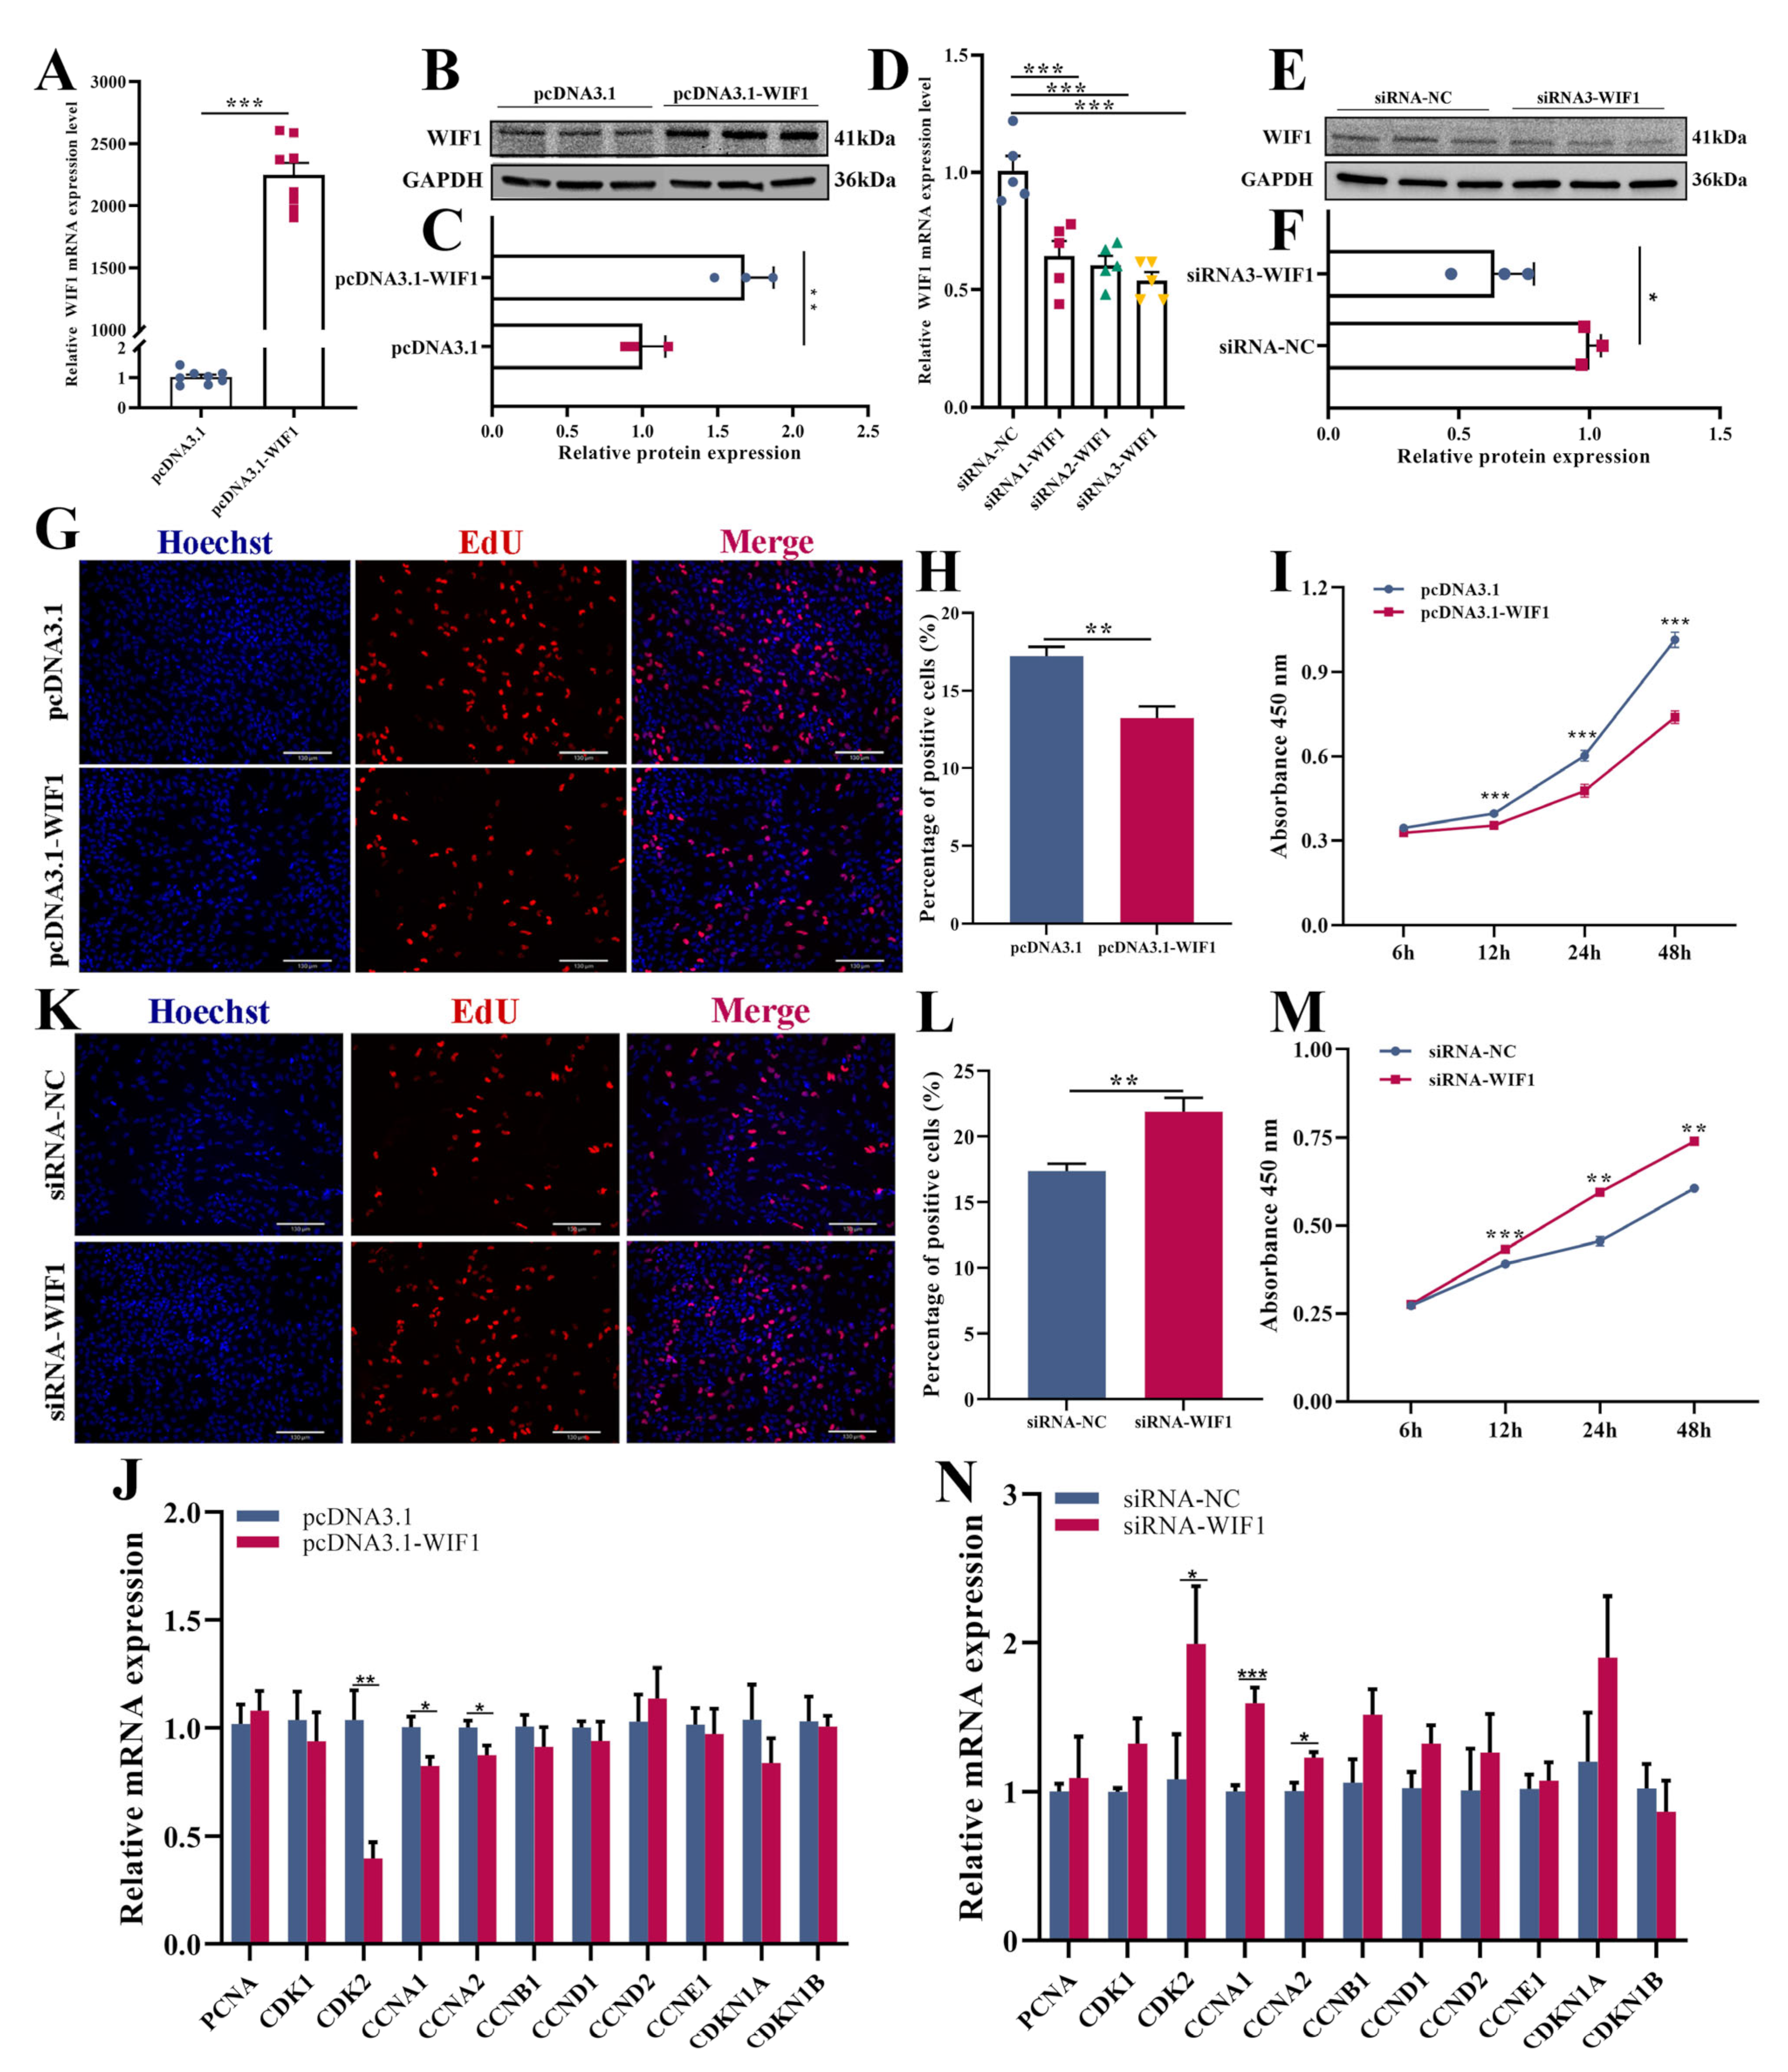
2.2. WIF1 Inhibits Proliferation of Chicken GCs from Prehierarchal Follicles

The WIF1 overexpression vector (pcDNA3.1-WIF1) or siRNA (siRNA-WIF1) was transfected into GCs to investigate the effect of WIF1 on proliferation. Overexpression and knockdown efficiencies were detected using quantitative real-time PCR (qRT-PCR) and Western blotting. The mRNA and protein expression levels of WIF1 in GCs significantly increased after transfection with pcDNA3.1-WIF1 (p < 0.001 and p < 0.01, respectively; Figure 2A–C). Three siRNA fragments were synthesized and transfected into GCs for knockdown; siRNA3-WIF1 significantly reduced the mRNA and protein expression levels of WIF1 (p < 0.001 or p < 0.05, Figure 2D–F) and was selected for subsequent experiments. 5-Ethynyl-2′-deoxyuridine (EdU) staining demonstrated that the proliferation rate of WIF1 overexpression in GCs was significantly lower than that of control cells (p < 0.01, Figure 2G,H). WIF1 overexpression markedly reduced the absorbance of GCs after cell counting kit-8 (CCK-8) treatment (p < 0.001; Figure 2I). Moreover, qRT-PCR showed that WIF1 overexpression significantly inhibited the mRNA expression of cell cycle-related genes, such as cyclin-dependent kinase 2 (CDK2), cyclin A1 (CCNA1), and cyclin A2 (CCNA2) (p < 0.05, Figure 2J). Conversely, WIF1 silencing significantly increased the number of EdU-positive cells (p < 0.01, Figure 2K,L) and the absorbance values (p < 0.01, Figure 2M). WIF1 knockdown significantly enhanced the expression of CDK2, CCNA1, and CCNA2 (p < 0.05; Figure 2N). Taken together, these results suggest that WIF1 inhibits the proliferation of chicken GCs.

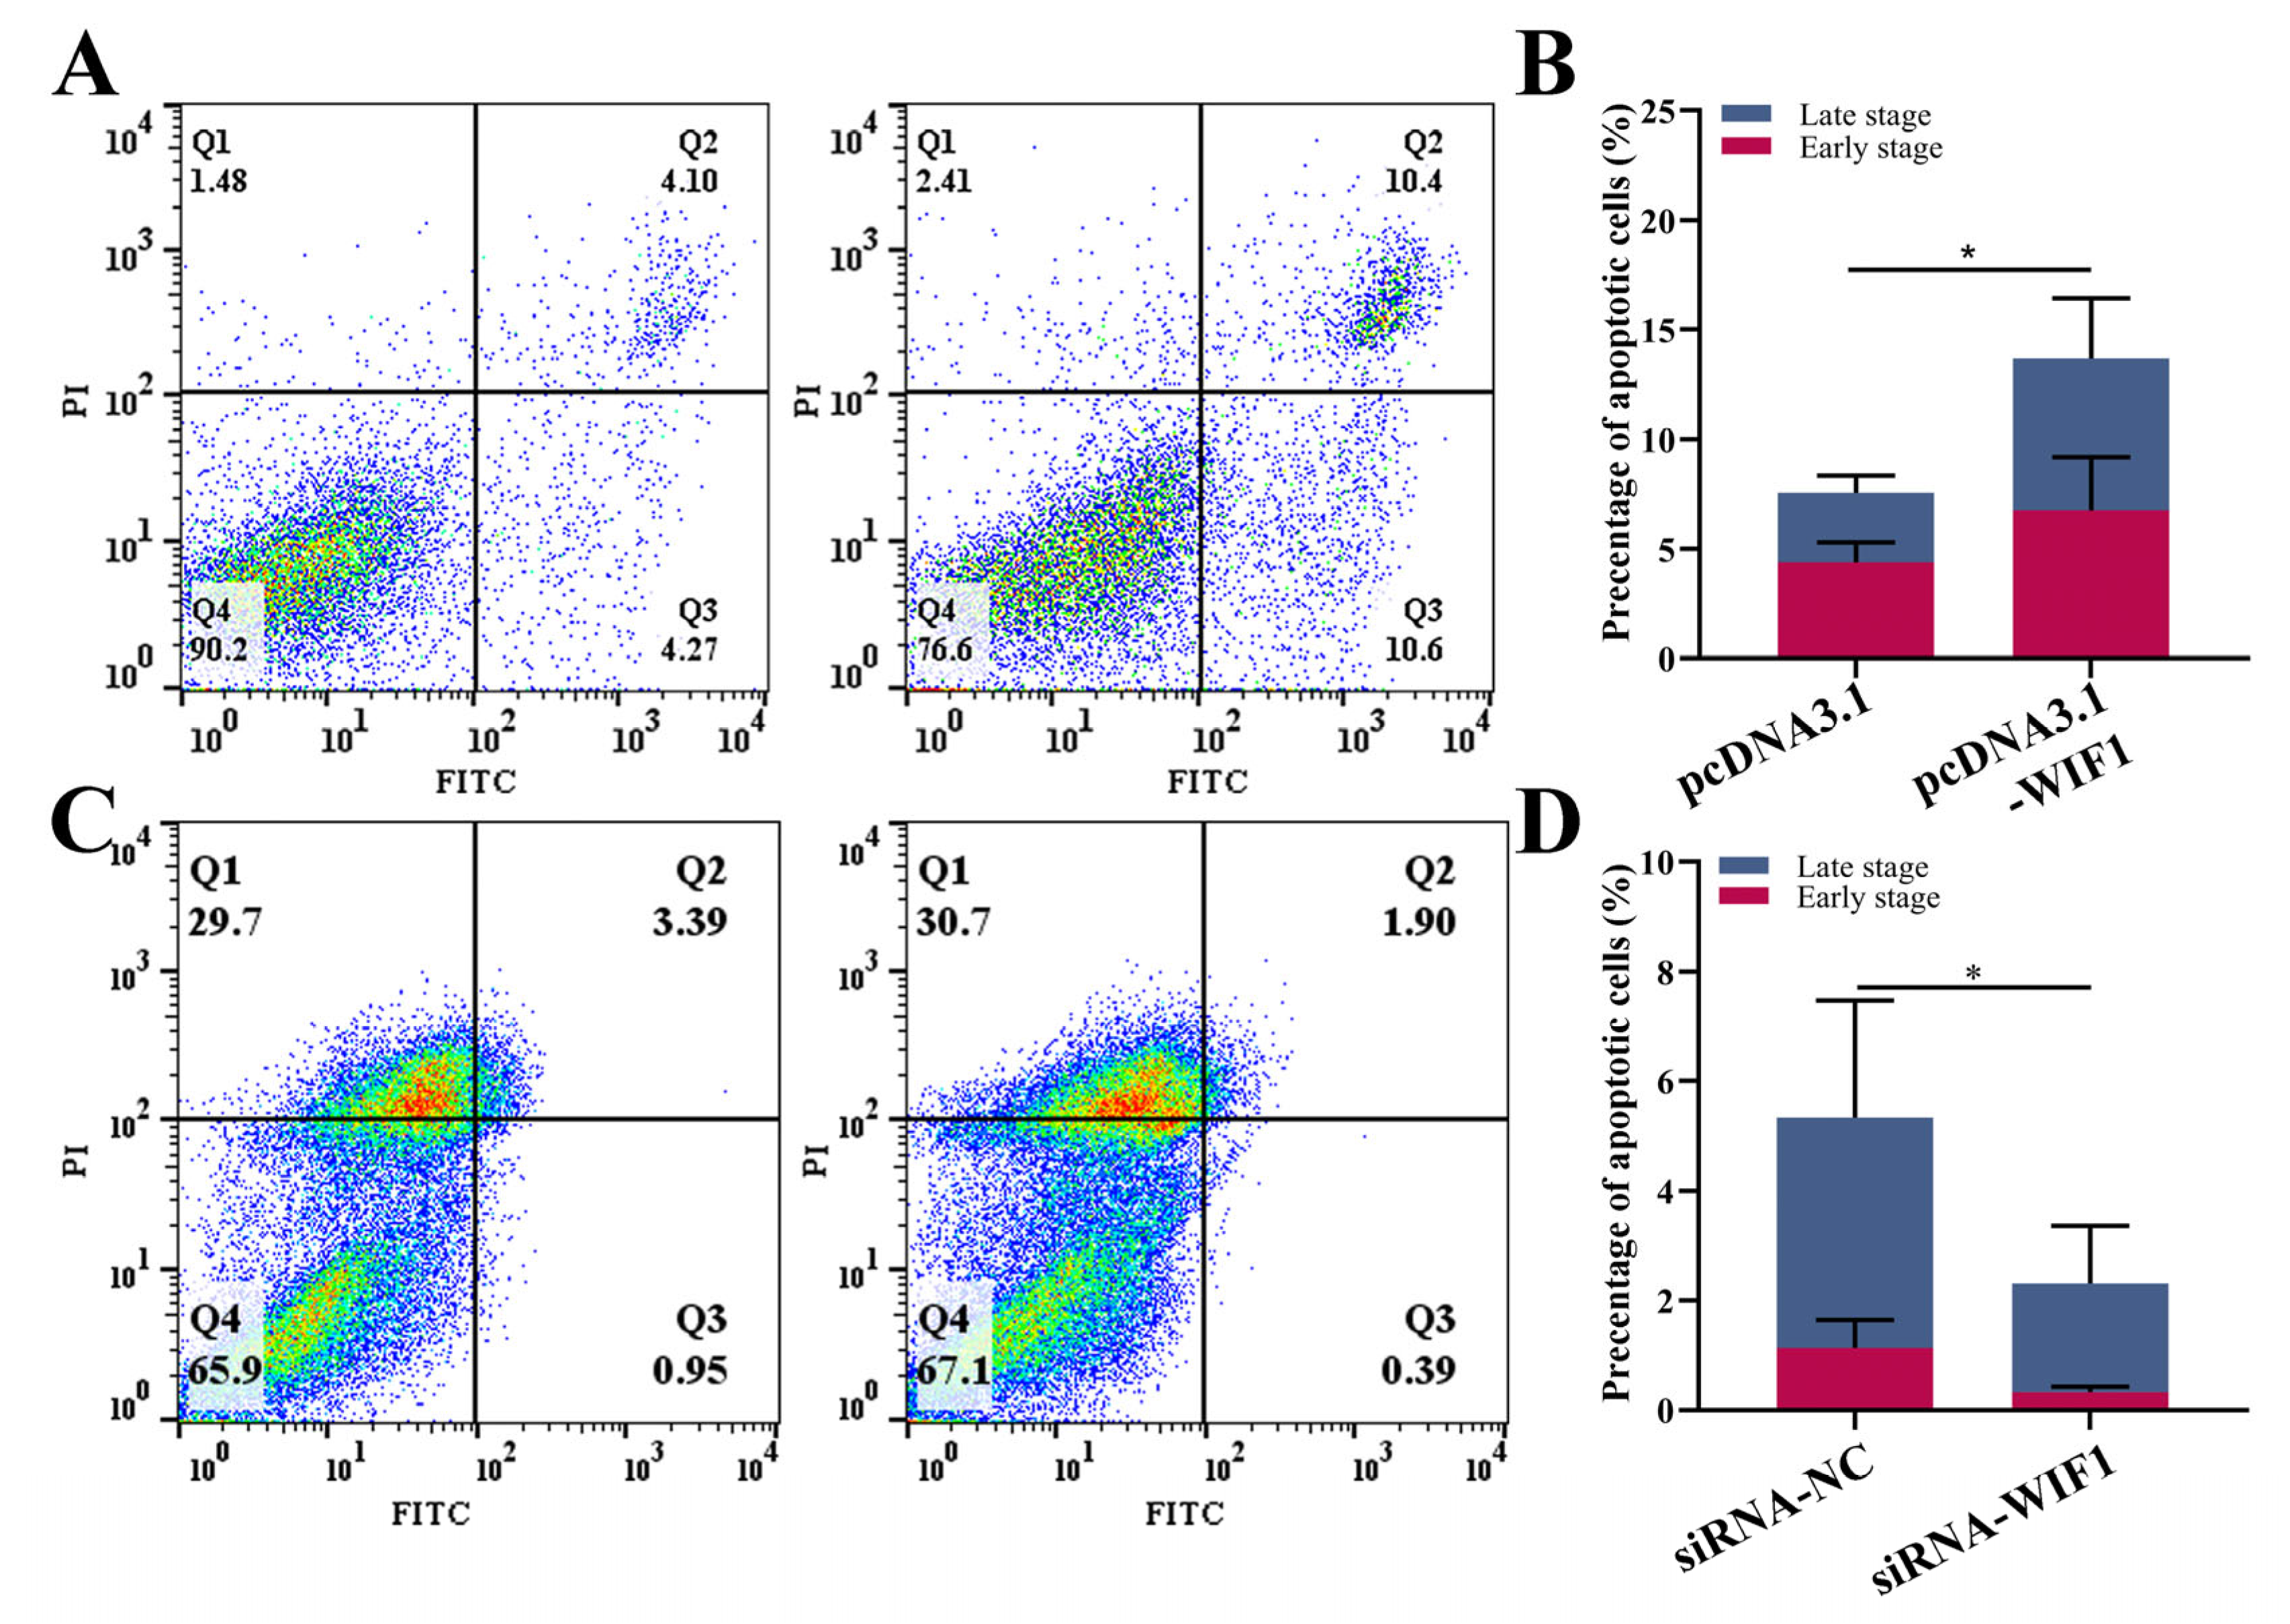
2.3. WIF1 Promotes the Apoptosis of Chicken Prehierarchal GCs

We measured the rate of apoptosis using flow cytometry to determine the effect of WIF1 on GC apoptosis. GCs positively stained with Annexin V-FITC and PI are considered apoptotic. The overexpression of WIF1 significantly promoted the apoptosis of GCs (p < 0.05; Figure 3A,B). WIF1 knockdown significantly decreased the rate of apoptosis (p < 0.05; Figure 3C,D). Taken together, these data suggest that WIF1 promotes apoptosis in chicken ovarian GCs.

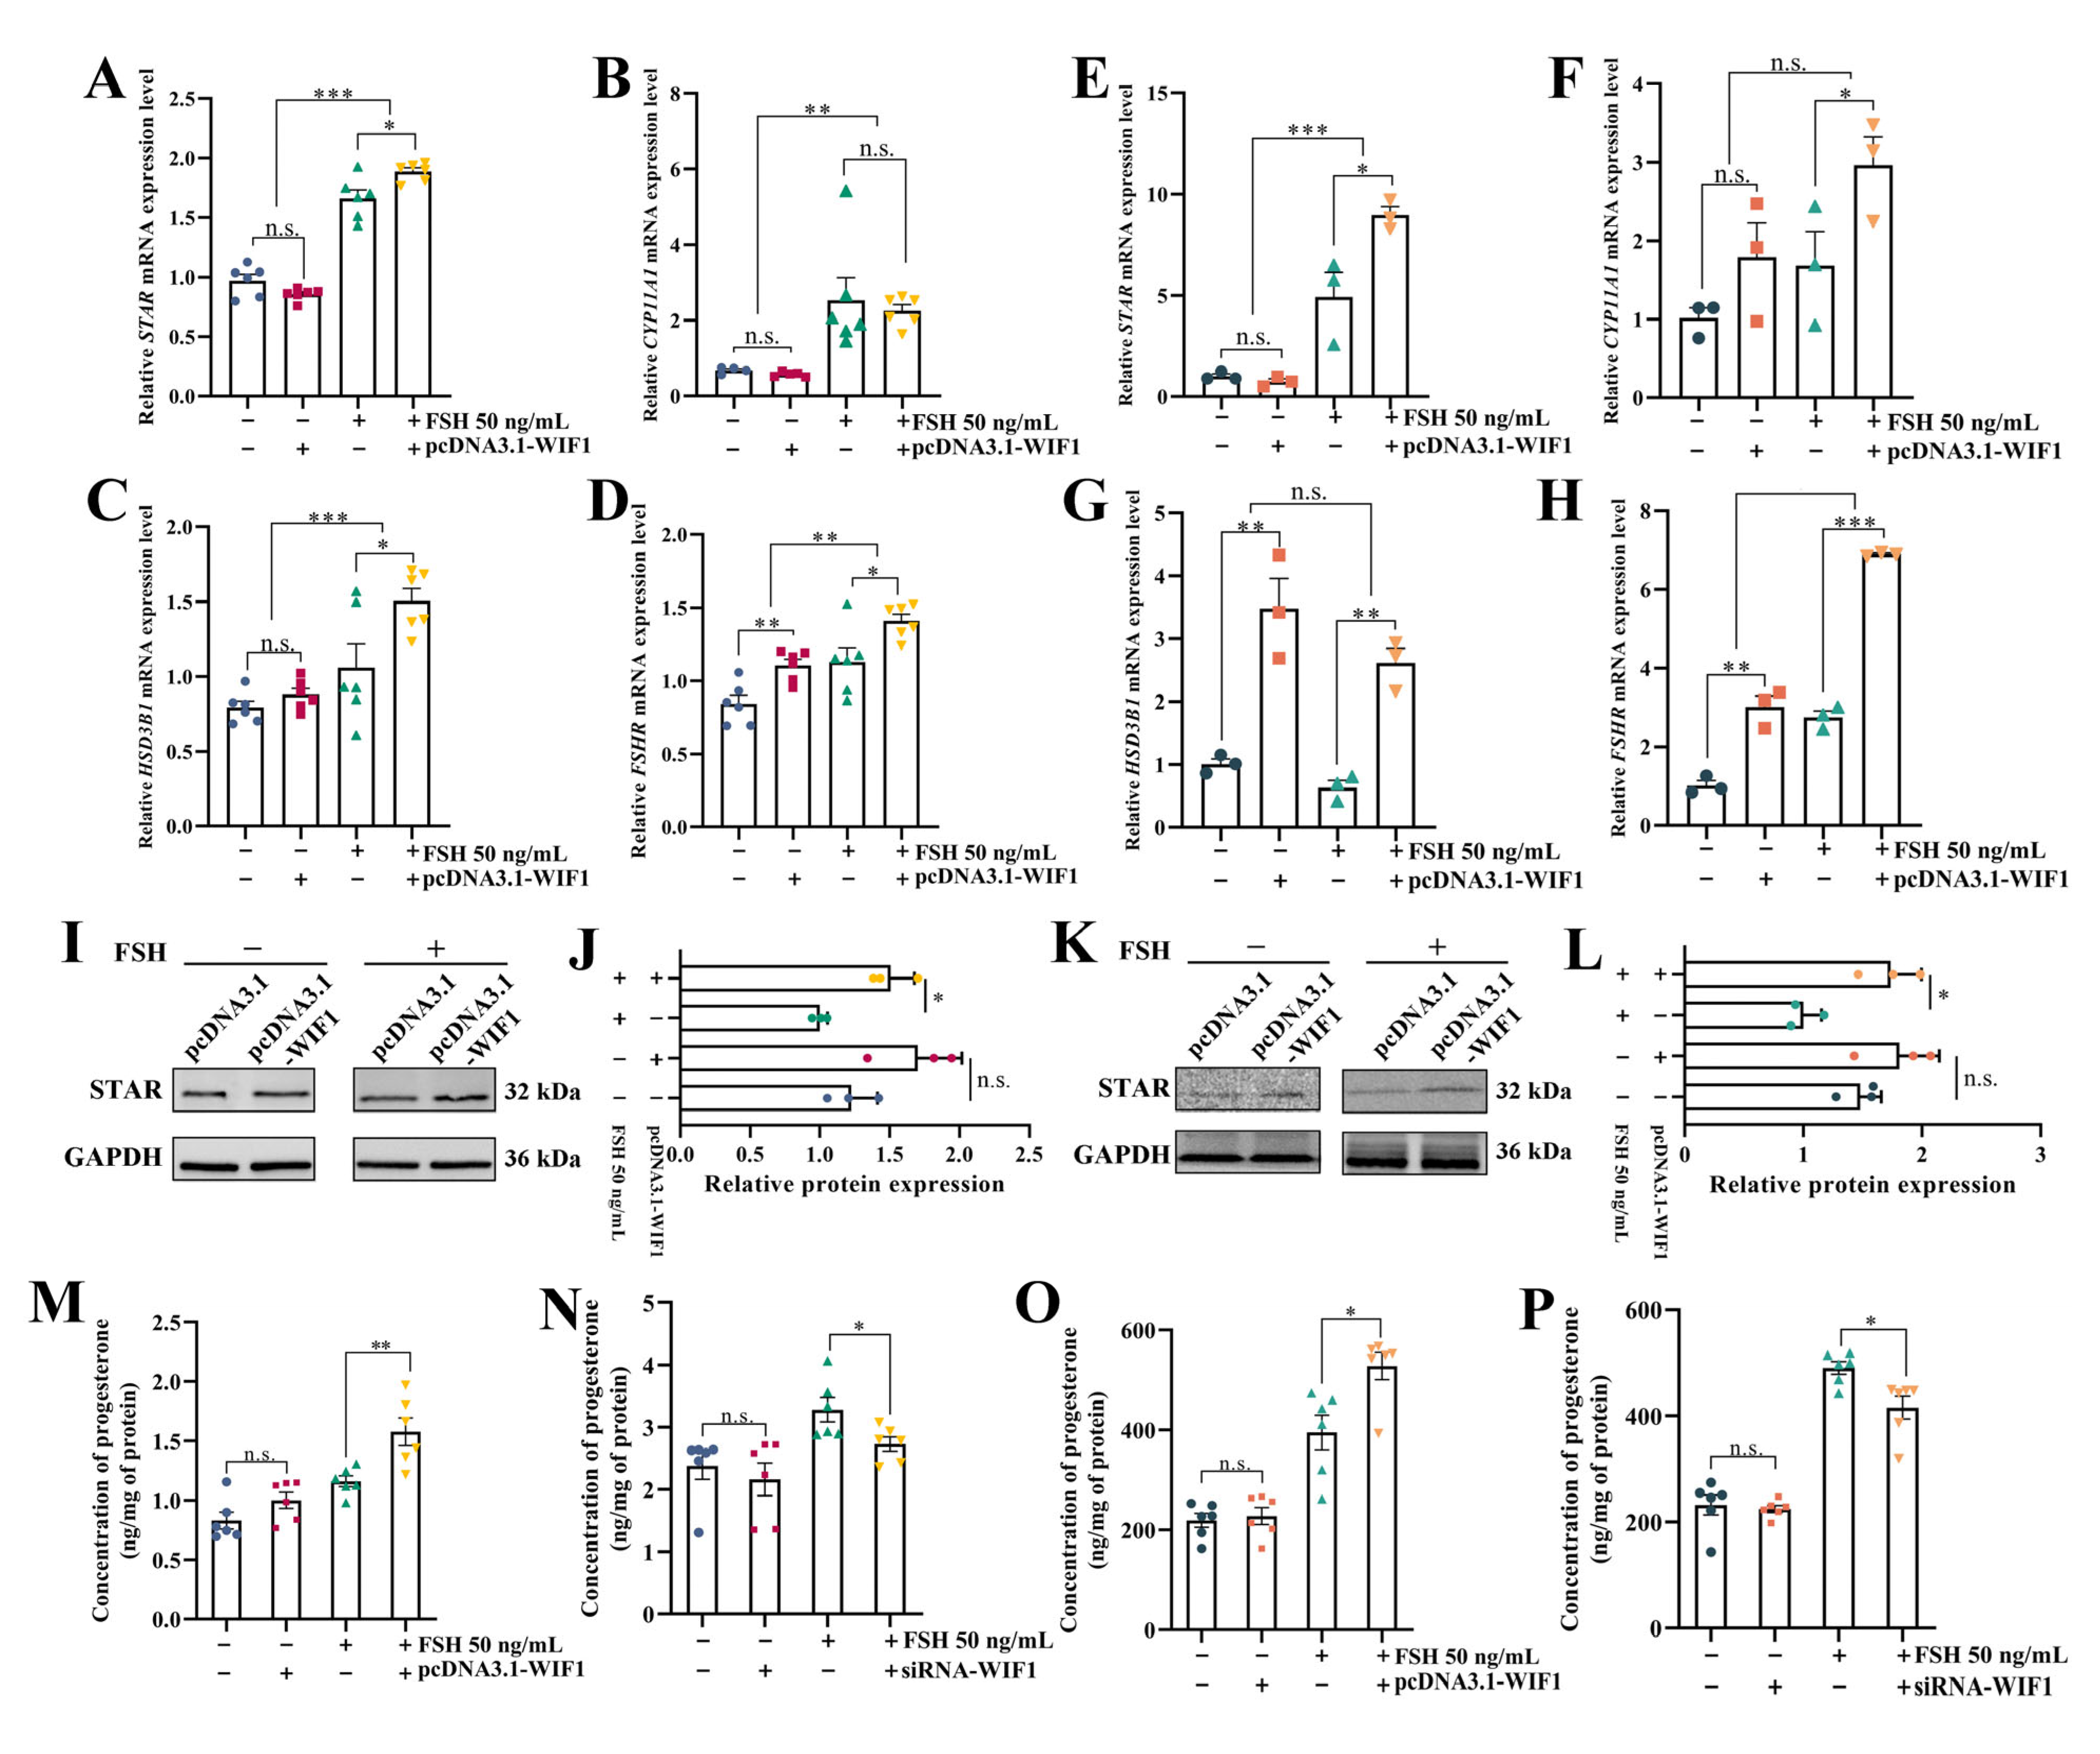
2.4. WIF1 Promotes the Secretion of Progesterone with the Participation of FSH in Chicken GCs

Chicken GCs respond to FSH and produce progesterone, which is a marker of GC differentiation [2]. Granulosa cells from prehierarchal follicles (pre-GCs) and hierarchal follicles (hie-GCs) were treated with different FSH concentrations (0, 10, 50, and 100 ng/mL) for 3 h or 24 h. Progesterone concentrations in the medium of pre-GCs did not show a significant increase (p > 0.05) after a 3 h treatment with FSH, whereas there was a significant dose-dependent increase in progesterone concentration in hie-GCs (p < 0.001, Figure S1). After 24 h, treatment with 50 and 100 ng/mL FSH resulted in a significant increase in the progesterone concentration in the medium of pre-GCs (p < 0.05, Figure S2). Moreover, the concentration of progesterone continued to increase with increasing concentrations of FSH in hie-GCs (p < 0.001, Figure S2). Based on these results, a significant increase in progesterone concentration was observed in pre-GCs and hie-GCs after 24 h of treatment with 50 ng/mL FSH; this concentration and duration were chosen for further experiments.
When FSH was not supplemented, the qRT-PCR results in pre-GCs indicated that WIF1 overexpression did not have a significant stimulatory effect on the expression of progesterone synthesis-related genes, including STAR, CYP11A1, and HSD3B1 (p > 0.05), whereas it significantly promoted the mRNA expression of FSHR (p < 0.01, Figure 4A–D). There was a significant increase in the expression levels of STAR, HSD3B1, and FSHR when pre-GCs were treated with a combination of FSH and WIF1 (p < 0.05, Figure 4A–D). However, WIF1 knockdown did not significantly affect the expression of genes involved in progesterone synthesis (p > 0.05; Figure S3). In hie-GCs (without FSH supplementation), qRT-PCR results demonstrated that WIF1 overexpression significantly promoted the mRNA expression levels of HSD3B1 and FSHR (p < 0.01, Figure 4E–H). Furthermore, there was a significant increase in the expression levels of STAR, CYP11A1, HSD3B1, and FSHR when hie-GCs were treated with a combination of FSH and WIF1 (p < 0.05, Figure 4E–H). In contrast, WIF1 silencing significantly inhibited the mRNA expression of STAR (p < 0.05; Figure S4).
The Western blotting results indicate that WIF1 overexpression significantly promoted STAR protein expression in pre-GCs in the presence of FSH (p < 0.05, Figure 4I,J) and hie-GCs (p < 0.05, Figure 4K,L). Simultaneous treatment with FSH and WIF1 overexpression significantly promoted progesterone production in the pre-GC and hie-GC media (p < 0.05; Figure 4M,O). Conversely, progesterone production was significantly inhibited after WIF1 knockdown (p < 0.05; Figure 4N,P). In summary, WIF1 potentiated the FSH-mediated induction of progesterone synthesis in chicken GCs.

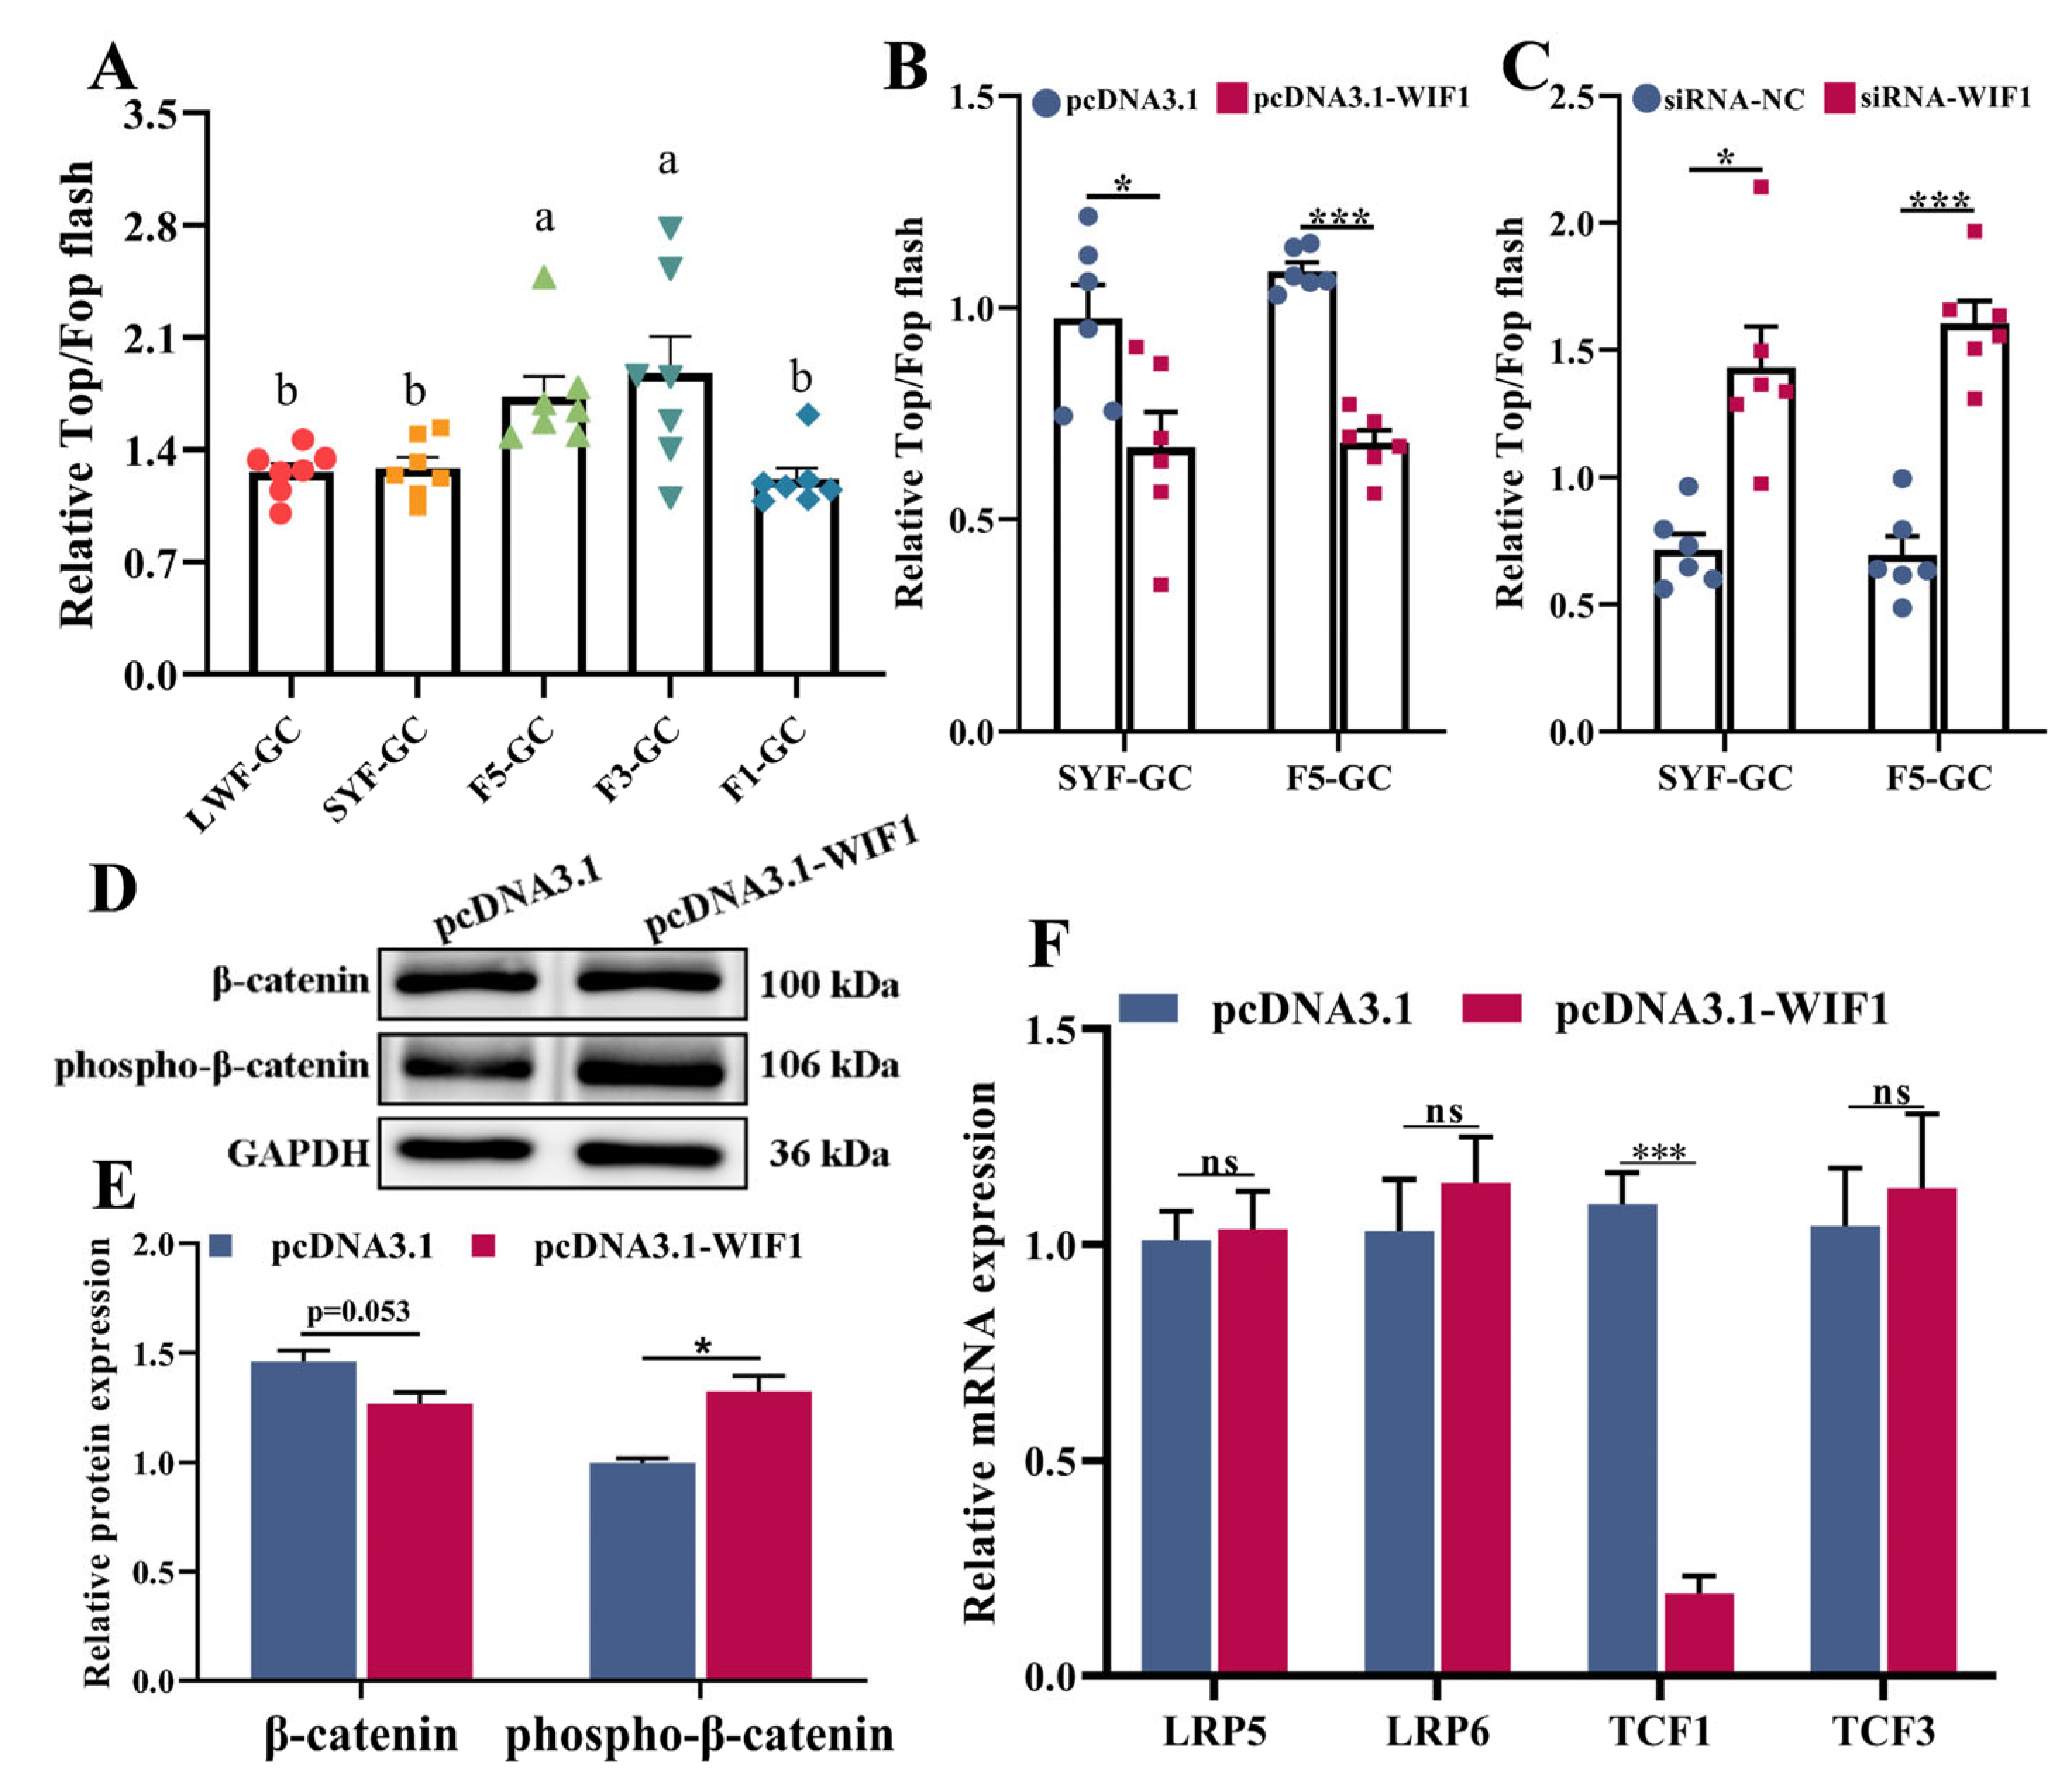
2.5. WIF1 Inhibits Wnt Signaling Activity in Chicken GCs

Top/Fop flash luciferase reporter assays revealed that Wnt signaling activity in GCs gradually increased with development and significantly decreased in preovulation follicles (F1s) (p < 0.05, Figure 5A). WIF1 overexpression markedly attenuated the transcriptional activation of TCFs/LEFs in SYF-GCs and F5-GCs (p < 0.05; Figure 5B), whereas WIF1 knockdown increased transcriptional activation (p < 0.05; Figure 5C). Western blot assays showed that WIF1 overexpression had no effect on β-catenin (p > 0.05) but upregulated the phosphorylation level of β-catenin in GCs (p < 0.05, Figure 5D,E). Meanwhile, the mRNA levels of TCF1, which is an element of Wnt/β-catenin signaling, were decreased after WIF1 overexpression (p < 0.001, Figure 5F). Collectively, these data suggest that WIF1 overexpression inhibits the Wnt/β-catenin signaling pathway in GCs.

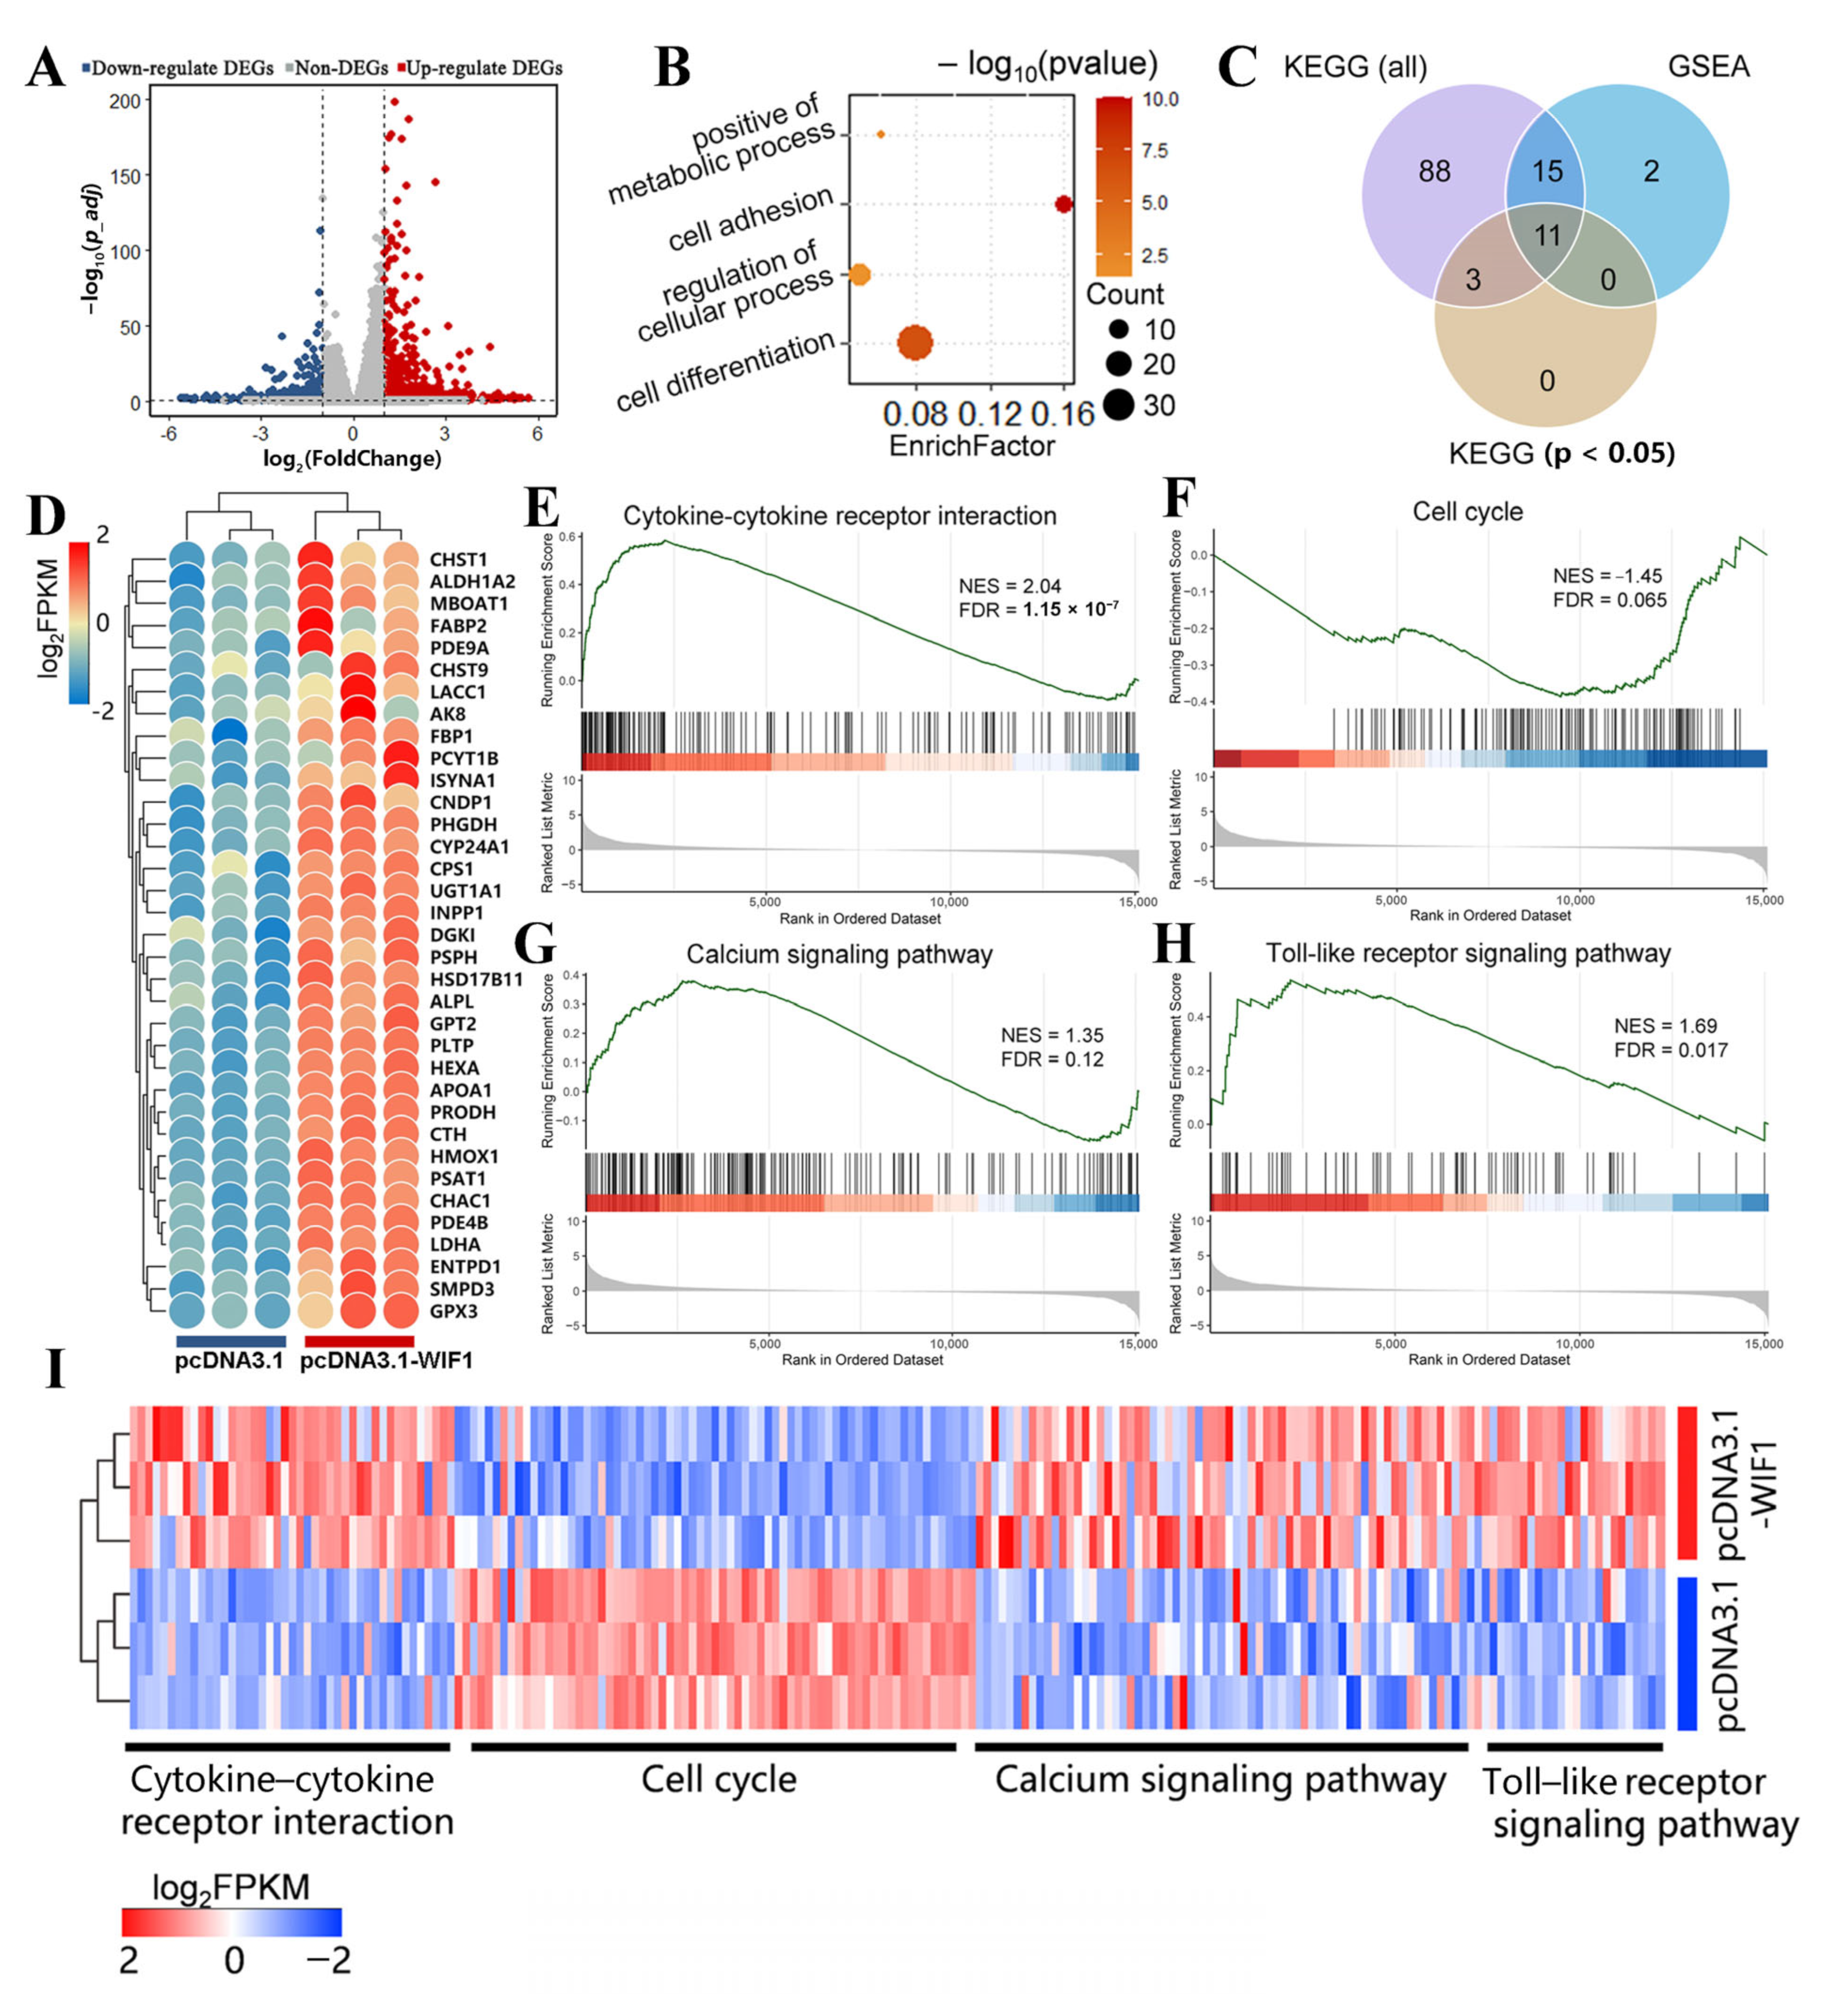
2.6. WIF1 Stimulates Metabolic Activity of Chicken Prehierarchal GCs

Global transcriptomic analysis was performed using RNA-seq with WIF1-overexpressed and control pre-GCs to explore the regulatory mechanism of WIF1 in GCs. The quality control and the analysis information for the raw data are provided in Tables S2 and S3; the differentially expressed genes (DEGs) include 604 upregulated and 360 downregulated genes (criteria: | log 2 ( F o l d C h a n g e ) | > 1 and p_adj < 0.05; Figure 6A). The DEGs were mainly involved in cell differentiation, regulation of cellular processes, and positive metabolic processes compared to the control group (pcDNA3.1) by GO enrichment analysis (Figure 6B, Table S4). Kyoto Encyclopedia of Genes and Genomes (KEGG) enrichment analyses of DEGs and gene set enrichment analysis (GSEA) were performed for all genes (Figure 6C, Table S5); KEGG analysis identified several significantly associated metabolic pathways, including glycine, serine, and threonine metabolism (p = 0.012); cysteine and methionine metabolism (p = 0.007); and amino acid biosynthesis (p = 0.007) (Table S5). Additionally, the genes enriched in these metabolism-related pathways were upregulated in the WIF1-overexpressed group (pcDNA3.1-WIF1) (Figure 6D).
Eleven pathways were present in the KEGG (p < 0.05) and GSEA analyses, and some of these pathways aligned with the GC phenotypes mentioned earlier (Figure 6C). Among these 11 pathways, the cytokine–cytokine receptor interaction pathway (Figure 6E) and the cell cycle pathway were significant (Figure 6F), since most genes in these two pathways exhibited upregulation and downregulation patterns (Figure 6I). This indicates that these pathways were potentially relevant to the observed cellular characteristics. The calcium signaling pathway (Figure 6G) and the toll–like receptor signaling pathway (Figure 6H) were identified using KEGG and GSEA, and the genes enriched in these pathways were highly expressed in the WIF1 overexpression group (Figure 6I). Accordingly, metabolism-related pathways and cytokine–cytokine receptor interaction pathways may be involved in enhanced progesterone synthesis induced by WIF1 overexpression. We hypothesized that WIF1 may affect the calcium and toll–like receptor signaling pathways that regulate chicken GCs.

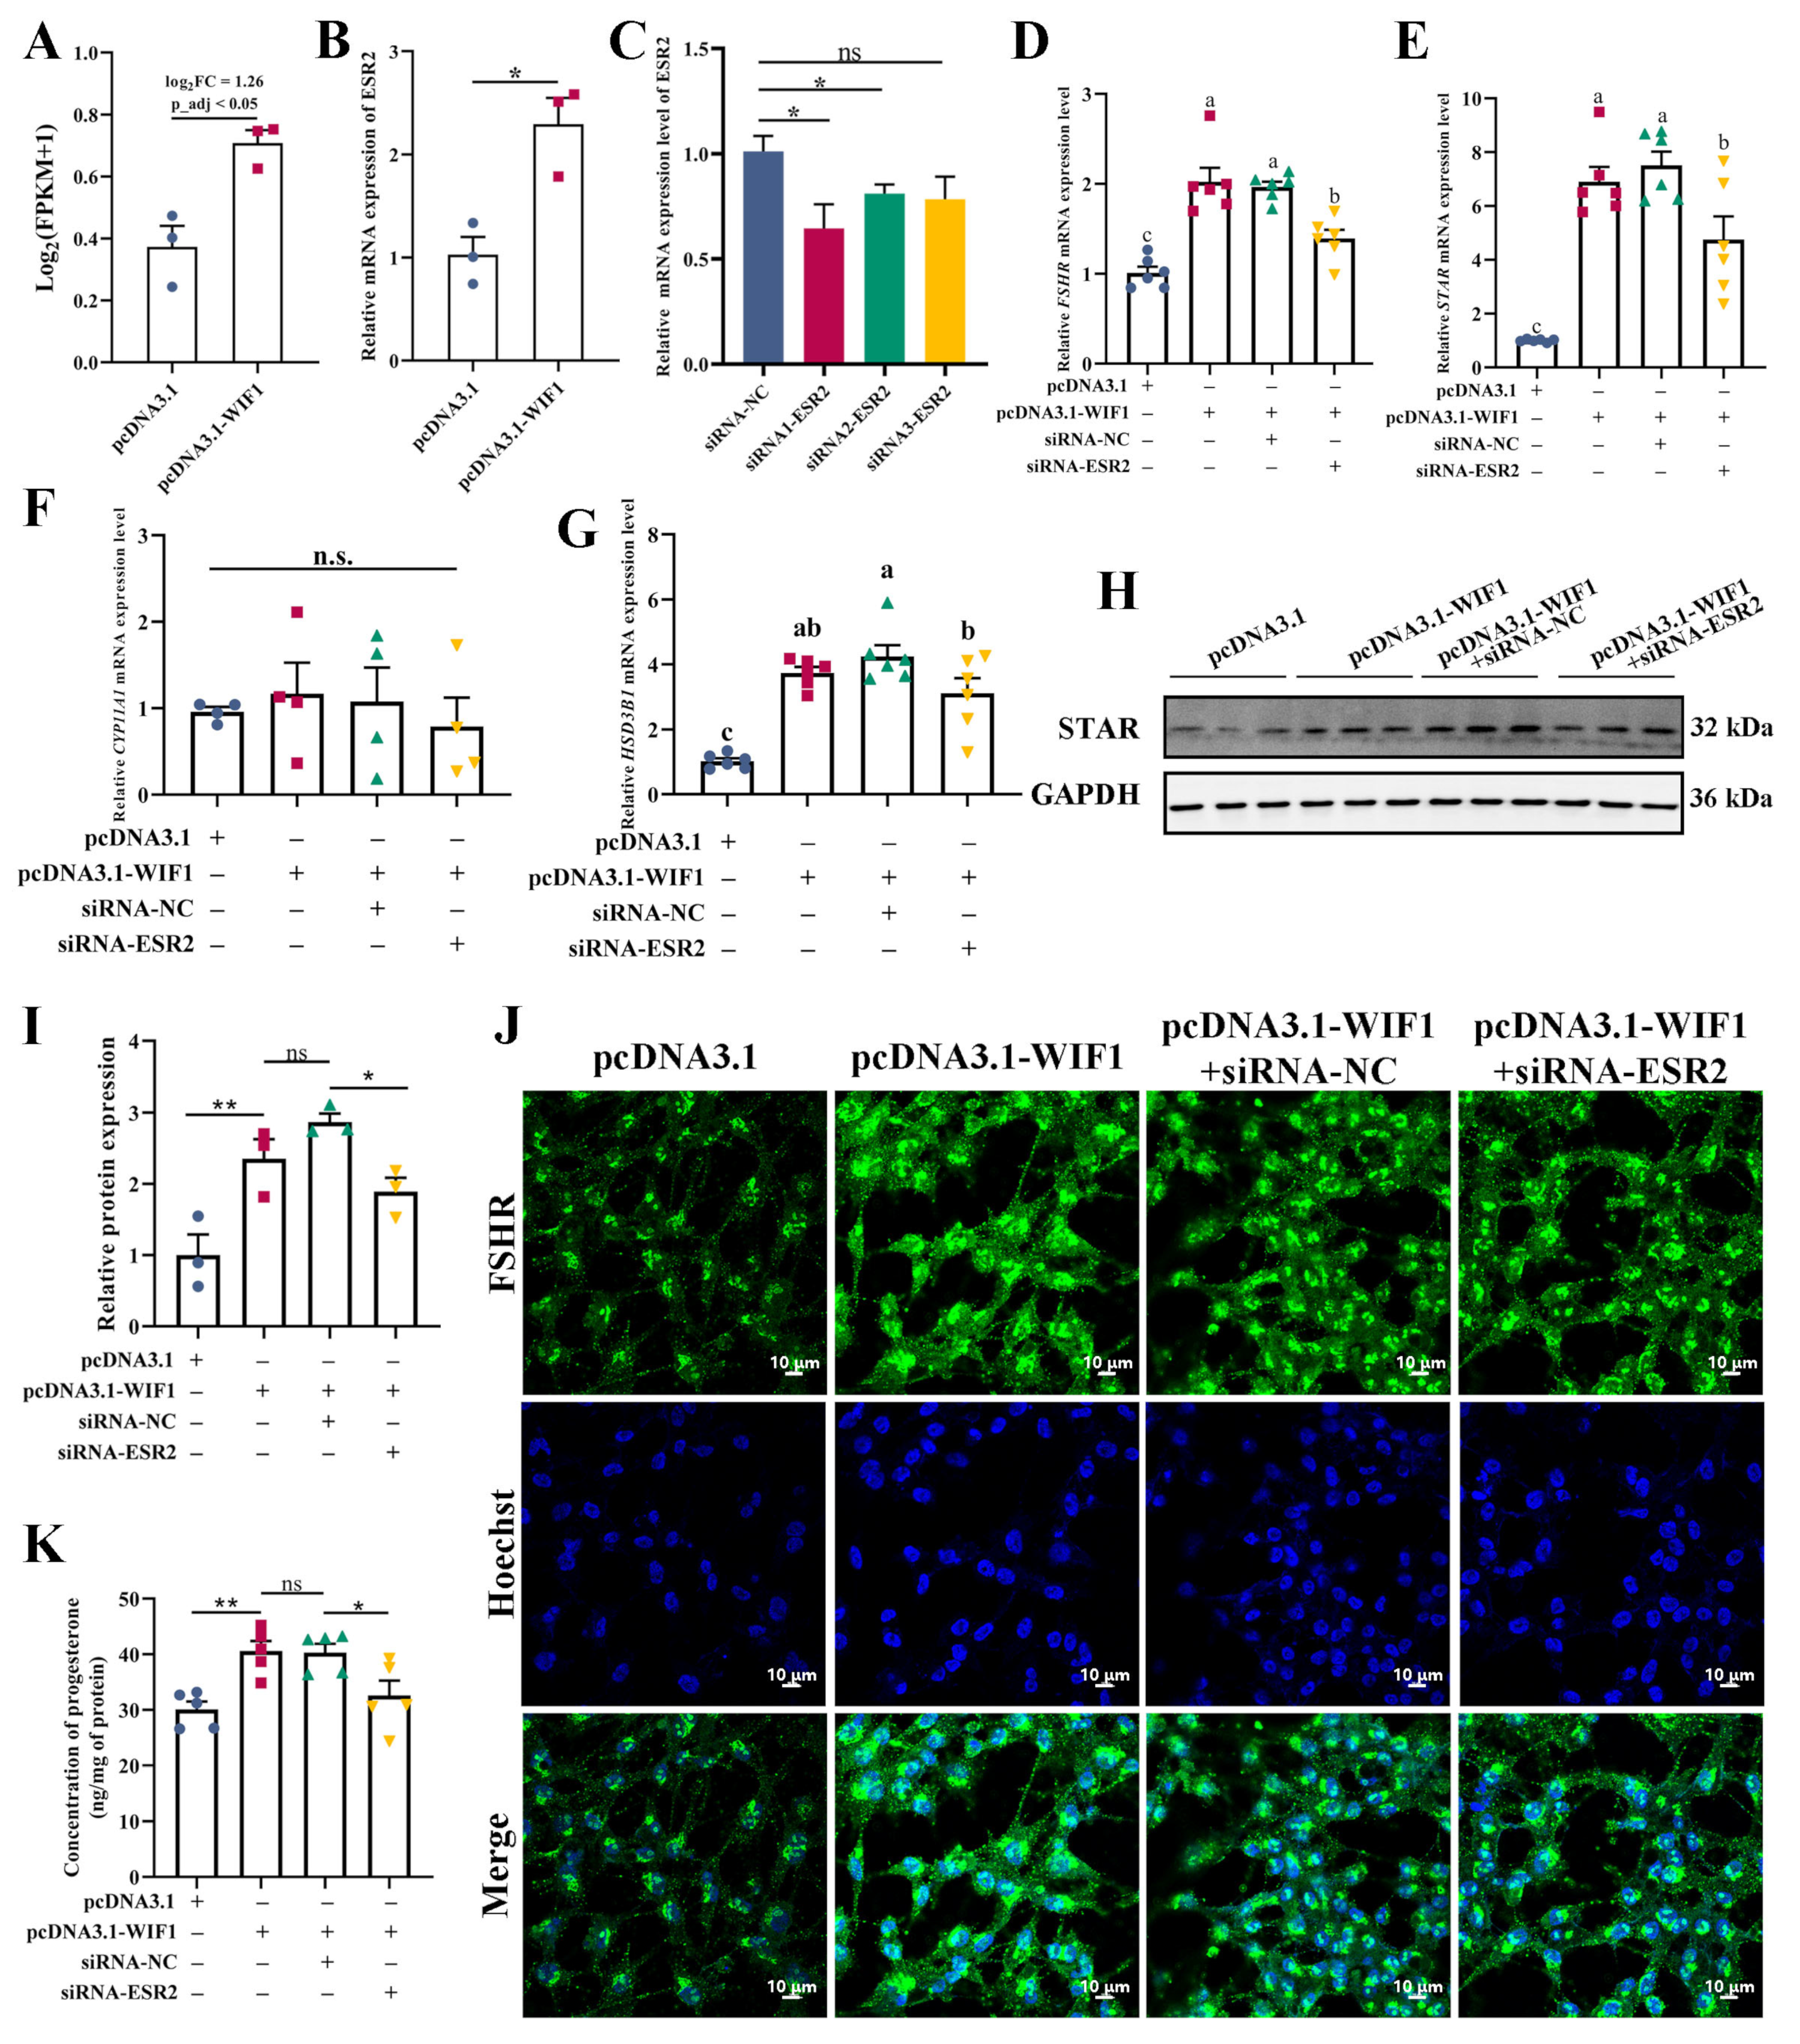
2.7. WIF1 Promotes Progesterone Synthesis through Upregulation of ESR2 in GCs

Estrogen receptor 2 (ESR2) was significantly upregulated among DEGs that responded to WIF1 overexpression (Figure 7A). ESR2 is an estrogen receptor that plays a critical role in folliculogenesis [17]. The depletion of both estrogen receptors results in infertility in mice [18]. Accordingly, we hypothesized that WIF1 may regulate progesterone synthesis through ESR2 in GCs. The qRT-PCR results show that ESR2 expression was remarkably promoted after WIF1 overexpression (Figure 7B). siRNA1-ESR2 significantly reduced the mRNA expression levels of ESR2 (p < 0.05, Figure 7C) and was selected for subsequent experiments. To test our hypothesis, GCs were co-transfected with pcDNA3.1-WIF1, siRNA-NC, or siRNA-ESR2. siRNA1-ESR2 inhibited the increase in FSHR, STAR, and HSD3B1 induced by WIF1, but not CYP11A1 (p < 0.05, Figure 7D–G). The protein abundance of STAR declined by siRNA1-ESR2 on the basis of being increased by WIF1 (p < 0.05, Figure 7H,I). Subsequently, the fluorescence signal of FSHR was enhanced in GCs transfected with pcDNA3.1-WIF1 and slightly diminished after co-transfection with pcDNA3.1-WIF1 and siRNA1-ESR2 (Figure 7J). Moreover, progesterone concentration in the GC medium declined after co-transfection with pcDNA3.1-WIF1 and siRNA1-ESR2 (Figure 7K). In summary, these results indicate that WIF1 regulates steroidogenesis-related genes by upregulating ESR2 and promoting progesterone synthesis in GCs.

2.8. WIF1 Suppresses TC Proliferation and Promotes Apoptosis

Quantitative RT-PCR analysis showed that WIF1 expression increased by approximately 6,000 in TCs 24 h after transfection with the WIF1 overexpression vector (p < 0.001; Figure 8A). EdU staining demonstrated that the proliferation rate of WIF1-overexpressed cells was significantly lower than that of the control cells (p < 0.01; Figure 8B). In addition, the TUNEL assay showed a significant increase in TC apoptosis after WIF1 overexpression (p < 0.05; Figure 8C). However, there was no significant difference in the mRNA expression of CYP17A1, CYP19A1, HSD17B1, or the secretion of estradiol in TCs after WIF1 overexpression (p > 0.05, Figure 8D,E).

3. Discussion

The regulation of follicular development is a complex and multicellular process in all vertebrates. WIF1 is a secreted Wnt signaling antagonist that is highly expressed and largely conserved from teleosts to humans [19]. In mice, WIF1 expression is retained in the heart and lung and is expressed in the brain and eye [12]. Mammalian WIF1 is associated with lung development [20]. WIF1 interacts with the Olfactomedin protein to regulate the intraocular pressure of the eye [21,22,23]. In chickens, Chen et al. have identified WIF1 as significantly downregulated in F6 follicles compared with its expression in SYFs at both the mRNA and protein levels [24]. However, there is a lack of functional studies of the WIF1 gene in agricultural animals, especially those related to follicular development. To the best of our knowledge, this is the first study demonstrating that WIF1 expression declined during chicken follicle selection and shows a slight increase in F1s at the mRNA and protein levels. Notably, WIF1 is mainly expressed in GCs rather than in TCs. Based on these expression characteristics in chicken follicles, WIF1 may play an important role in follicle development through GCs, especially follicle selection.
Our in vitro studies demonstrated that WIF1 overexpression decreased cell viability (detected by the CCK8 assay) and the EdU-positive cell rate, thereby inhibiting follicular GC proliferation. CDK2, CCNA1, and CCNA2 are proliferation markers that promote proliferation or follicular development [25,26,27]. Furthermore, we detected the expression levels of several key genes associated with proliferation. The qRT-PCR results show that the expression levels of the CDK2, CCNA1, and CCNA2 proliferation markers significantly decreased with WIF1 overexpression (Figure 2J), and these were significantly increased by WIF1 knockdown (Figure 2N). This inhibition of cell proliferation is consistent with previous research on cancer cell lines, such as glioblastoma cell lines, cervical cancer cells, and basal cell carcinoma-related keratinocytes [14,28,29]. Granulosa cell apoptosis can impact follicular development in mammals [30]. In chickens, follicular atresia is caused by GC apoptosis, which occurs at any stage of follicle development, especially in the prehierarchal follicles [31]. Through flow cytometry, we found that WIF1 promoted apoptosis of chicken GCs (Figure 3). In contrast, WIF1 upregulation suppresses apoptosis in osteoarthritic chondrocytes [32]. Consistent with our in vitro results, WIF1 gene transfer induced significant apoptosis in cervical cancer cells in vitro [29].
Progesterone is a member of the steroid hormone family, and steroidogenesis is the process wherein cholesterol is transformed into biologically active steroid hormones under the control of multiple enzymes [33]. In ovarian follicles, steroidogenesis is mainly confined to GCs and TCs, with the regulation of FSH and luteinizing hormone (LH) via the cAMP signaling pathway [34]. In chicken GCs, steroidogenic capacity is directly associated with the transition of prehierarchal follicles to hierarchal follicles (follicle selection), which leads to follicle growth and maturation. In particular, cholesterol in GCs is transported to the mitochondria mediated by STAR and is subsequently converted into progesterone through the sequential catalysis of CYP11A1 and HSD3B1 [10]. In our study, the mRNA levels of STAR, CYP11A1, and HSD3B1 were significantly increased by pcDNA3.1-WIF1, and the protein level of STAR was upregulated after WIF1 overexpression in hie-GCs treated with a combination of FSH (Figure 4). However, these results are uncommon. Other studies show that the proliferation and progesterone-synthesizing capacity of GCs showed the same trend; that is, an increased proliferative capacity was often accompanied by an increased progesterone-synthesizing capacity. Wnt4 stimulated the proliferation of follicular GCs and increased the expression of STAR and CYP11A1 mRNA in prehierarchal and hierarchal follicles in chickens [4]. LncRNA is an inhibitory factor of follicular development (IFFD) that arrests follicle development by inhibiting the proliferation and estrogen secretion of GCs [35]. Meanwhile, isorhamnetin can inhibit the secretion of progesterone and promote the proliferation of GCs via the PI3K/Akt signaling pathway in porcine [36]. In summary, we believe that follicular development is a dynamic, balanced process regulated by multiple factors. High WIF1 expression in prehierarchical follicles can prevent premature development by inhibiting proliferation and promoting the apoptosis of GCs. After follicular GCs receive FSH signaling, WIF1 promotes FSHR expression (Figure 4D) in GCs to synthesize large amounts of progesterone, which is converted to differentiated hierarchical follicles. After follicle selection, even a small amount of WIF1 can sustain the requirement for large amounts of progesterone synthesis because GCs are already in a differentiated state.
The Wnt/β-catenin signaling pathway (also named the canonical Wnt pathway) is vital to follicular development [37,38]. As a secreted Wnt antagonist, WIF1 can directly bind to Wnt molecules to prevent the Wnt/β-catenin signaling pathway [19]. This prevention also influences the downstream target genes of c-Myc and Cyclin D1 of the Wnt/β-catenin signaling pathway [39,40,41]. Interestingly, Top/Fop flash reporter assays showed that the Wnt/β-catenin signaling activity in GCs gradually increased during follicle development and significantly declined in F1s. Furthermore, WIF1 overexpression upregulated phosphorylated β-catenin in GCs, which was detected by Western blotting, and inhibited Wnt/β-catenin signaling activity (Figure 5). Our study suggested that WIF1 regulated chicken GC development by suppressing the Wnt/β-catenin signaling pathway.
Accumulating evidence indicates that follicle development is modulated by several molecules and signaling pathways [42,43]. To characterize the molecular features of WIF1’s regulatory role in GCs, RNA-seq was performed on GCs overexpressing WIF1. WIF1 overexpression promoted the expression of genes enriched in metabolic processes, including glycine, serine, threonine, cysteine, and methionine metabolism; amino acid biosynthesis; and steroid hormone biosynthesis (Table S5). These findings suggest that WIF1 promotes metabolic activity in GCs. Interestingly, previous research shows that WIF1 is necessary for achieving periportal zone-specific characteristics, such as the enhancement of gluconeogenesis capacities [44]. Vassallo et al. observed that the WIF1 expression vector downregulated intracellular Ca2+ in LN-229 cells [45]. Hence, these results suggest that WIF1 can alter the metabolic state of cells by regulating intracellular ion homeostasis. In this study, the calcium and toll-like receptor signaling pathways were identified by KEGG and GSEA enrichment, and the genes enriched in these pathways were highly expressed in the WIF1 overexpression group (Figure 6). Based on our experimental data, we propose that WIF1 influences intracellular metabolic activities through the calcium signaling pathway in chicken follicular GCs. This, in turn, promotes whole-follicle maturation.
In chickens, the oocyte is covered by surrounding somatic cells (GCs and TCs) to form the functional unit in female reproduction [46]. Also, GCs have been studied much more than TCs since they are major components of the ovarian follicle. Our data show that WIF1 overexpression decreased the proliferation rate and significantly increased the apoptosis of TCs (Figure 7), which was consistent with the phenotype of GCs. However, there was no significant difference in estradiol secretion by TCs following WIF1 overexpression (Figure 7). According to the classical three-cell model in avian species, progesterone is produced by GCs and is subsequently converted into estradiol by TCs [46]. This may be because culturing TCs alone leaves them without sufficient progesterone as a raw material for estradiol synthesis, ultimately resulting in no difference in estradiol concentration. In summary, these results demonstrate that WIF1 plays an important role in follicular development by promoting progesterone synthesis of GCs, which may provide an insight into the regulatory mechanisms of follicle selection and egg-laying performance in poultry.

4. Materials and Methods

4.1. Ethics Statement and Experimental Animals

All animal experimental protocols conducted in this study were approved by the Animal Care and Use Committee of China Agricultural University and performed in compliance with the National Research Council’s Guide for the Care and Use of Laboratory Animals (AW80203202-1-1). All animal experiments were approved by the Experimental Chicken Farm of China Agricultural University (Beijing, China).
Yellow-bearded chickens were housed in separate cages with the same environmental conditions and a daily light period of 14 h. All chickens had free access to water and feed. After euthanizing the chickens (at the age of 30 weeks), stroma, heart, liver, lung, gizzard, kidney, breast muscle, and abdominal fat were collected and preserved at −80 °C (n = 5). Follicles from laying chickens (during the egg-laying period, at the age of 30–50 weeks) were categorized into two groups: prehierarchal and hierarchal. The prehierarchal follicles were further classified into different categories based on their diameters: small white follicles (SWFs, diameter 1–3.9 mm), large white follicles (LWFs, 4–5.9 mm), and small yellow follicles (SYFs, diameter 6–8 mm). There are generally five hierarchal follicles in the hen ovary: the largest is F1, the second largest is F2, and so on.

4.2. Cell Isolation and Culture

Different stages of GCs were isolated from the ovary follicles of laying hens based on experimental requirements. After removing connective tissue from the follicle surface, the yolks of the follicles were carefully removed in phosphate-buffered saline (PBS). The GC (the layer adjacent to the egg yolk) and TC (outer-side layer of the GC) layers were isolated using a stereomicroscope (SZ2-ILST; Olympus, Shibuya, Japan). Subsequently, these were subjected to enzymatic digestion by collagenase type II (Sigma Aldrich, Inc., St. Louis, MO, USA) at 37 °C; the GC and TC layers were digested for 5 min and 30 min, respectively. The cell suspension containing the GC or TC layer was filtered using cell strainers (Biosharp, Hefei, China) with a pore size of 50 μm, and the filtration process was repeated 3 to 5 times. The cells were maintained in a basal medium consisting of Dulbecco’s modified Eagle medium (DMEM) (Gibco, Gaithersburg, MD, USA) with 10% fetal bovine serum (FBS) (Gibco) and 1% penicillin–streptomycin (Gibco) in a 37 °C, 5% CO2 humidified atmosphere incubator.

4.3. Plasmid Construction, RNA Oligonucleotide Synthesis, and Cell Transfection

To construct the WIF1 overexpression vector, the complete coding sequences of the WIF1 gene along with the EcoRI and BamHI restriction enzyme sites were cloned into a pcDNA3.1-3×flag vector with primers (forward primer: 5′-tagcgtttaaacttaagcttATGGCCGCGGCGGGGCGGCTGT-3′; reverse primer: 5′-gctggatatctgcagaattcCCAGATATAATTGGATTCAGGT-3′). This was performed using Q5® High-Fidelity 2X Master Mix (M0492S, New England Biolabs) and the Trelief™ SoSoo Cloning Kit (TSINGKE, Beijing, China). The modified vector was named pcDNA3.1-WIF1. Plasmid DNA was subsequently extracted and purified using an EndoFree Maxi Plasmid Kit (TIANGEN, Beijing, China) according to the manufacturer’s instructions.
Small interfering RNA (siRNA) oligonucleotides were designed and synthesized by GenePharma Co., Ltd. (Shanghai, China) to specifically knockdown the WIF1 gene, including siRNA1-WIF1 (sense: 5′-GCAUCCACGCCAUGAACUUTT-3′; antisense: 5′-AAGUUCAUGGCGUGGAUGCTT-3′), siRNA2-WIF1 (sense: 5′-GGCUGAUCCAACUGUAAAUTT-3′; antisense: 5′-AUUUACAGUUGGAUCAGCCTT-3′), and siRNA3-WIF1 (sense: 5′-GGGAUUCGAAGGAGACCAATT-3′; antisense: 5′-UUGGUCUCCUUCGAAUCCCTT-3′). siRNA3-WIF1 was selected for subsequent experiments with the highest knockdown efficiency.
Briefly, cell transfection experiments were performed using Lipofectamine® 3000 Transfection Reagent (Invitrogen, Carlsbad, CA, USA) and Opti-MEM medium (Gibco) according to the manufacturer’s instructions.

4.4. Quantitative Real-Time PCR (qRT-PCR)

qRT-PCR is a method of detecting the relative expression quantification of a gene. Tissues and cells were lysed using TRIzol reagent (TIANGEN) for total RNA extraction. For each sample, 2 μg of total RNA was reverse-transcribed to generate cDNA using a FastKing RT Kit (TIANGEN). qRT-PCR was performed in a 20 μL reaction volume containing 10 μL of 2×Universal SYBR Green Fast qPCR Mix (ABclonal, Wuhan, China), 8 μL of RNase-free water, 0.5 μL each of forward and reverse primers (10 μmol/L), and 1 μL of cDNA (approximately 300 ng). qRT-PCR was performed using a CFX96 Real-Time System (Bio-Rad, Hercules, CA, USA). The expression levels of the coding genes were normalized to those of β-actin. Primer sequences were designed using the Primer-BLAST tool in the National Center for Biotechnology Information (NCBI) database and are listed in Table S1.

4.5. Western Blotting

Total protein was extracted using RIPA lysis buffer with a protease inhibitor cocktail (Beyotime Biotechnology, Shanghai, China), and the concentration of each sample was determined using the bicinchoninic acid (BCA) Protein Assay Kit (Beyotime). A total of 15 microliters of protein was mixed with 5 μL of sodium dodecyl sulfate polyacrylamide gel electrophoresis (SDS-PAGE) loading buffer (Beijing Solarbio Science & Technology Co., Ltd., Beijing, China) and denatured at 95 °C for 5 min. The protein (20 μL) was separated by electrophoresis and transferred onto polyvinylidene fluoride (PVDF) membranes (Bio-Rad). The membranes were blocked in QuickBlock™ Blocking Buffer (Beyotime) for 20 min at 25 ± 2 °C and incubated with primary antibody (Table S1) and secondary antibody (Solarbio, diluted ratio at 1:5000) solutions in turn. The protein band was visualized using the Super ECL Prime Kit (US Everbright® Inc., Suzhou, China). GAPDH was used as the reference protein, and the grayscale value of the band was quantified using ImageJ v2.0 software [47].

4.6. 5-Ethynyl-2′-Deoxyuridine (EdU) Assay

The EdU assay could accurately reflect the proliferation of cells. The EdU assay was performed according to the instructions of the Cell-Light EdU Apollo567 In Vitro Kit (RiboBio, Guangzhou, China). Cells were seeded in 48-well plates and transfected with plasmids or siRNAs. The cells were stained with EdU reagent for 2 h, and the cell nuclei were labeled with Hoechst (Beyotime). The fields were observed and photographed using an Echo Revolve fluorescence microscope (Echo Laboratories, San Diego, CA, USA). EdU-positive and total cells were counted using ImageJ v2.0 software [47].

4.7. Cell Counting Kit-8 (CCK 8) Assay

A widely used method for detecting cell activity, the cell counting kit-8 (Beyotime), was used to analyze cell proliferation. Granulosa cells were seeded in 96-well plates and cultured in basal medium. The CCK-8 solution was added to the wells at 6, 12, 24, and 48 h after transfection and incubated for 1 h. The absorbance was measured at 450 nm using a SpectraMax® i3x Multi-Mode Microplate Reader (Molecular Devices Corporation, Sunnyvale, CA, USA).

4.8. Flow Cytometry

The apoptosis rate of GCs was evaluated using an Annexin V-FITC Apoptosis Detection Kit (Beyotime). Briefly, cells were cultured in 6-well plates and transfected for 24 h. The cells were collected and suspended in 1× buffer containing Annexin V-FITC and propidium iodide (PI). Cells were analyzed by flow cytometry using a BD FACSCalibur flow cytometer (BD Biosciences, San Diego, CA, USA), and the data were analyzed using FlowJo_v10.8.1 software. Flow cytometry was used to divide the cells into four quadrants: Q1 (mechanically injured cells), Q2 (late apoptotic cells), Q3 (early apoptotic cells), and Q4 (live cells).

4.9. Enzyme-Linked Immunosorbent Assay (ELISA)

The concentration of hormones in the supernatant of the cell culture medium was detected using a chicken progesterone/estradiol ELISA kit (Beijing SINO-UK Institute of Biological Technology, Beijing, China) according to the manufacturer’s instructions. The intracellular total protein content was assessed using a BCA Protein Quantification Kit (Beyotime) to normalize the progesterone hormone content.

4.10. Dual-Luciferase Reporter Assay

The luciferase reporter assay was performed with the Dual-Luciferase® Reporter Assay System Kit (Promega, WI, USA) following the manufacturer’s instructions. The Top/Fop flash luciferase reporter system was used to determine the activity of Wnt signaling at different developmental stages in GCs. The pRL-TK Renilla plasmid and the indicated plasmids (Top flash or Fop flash) were co-transfected. After 24 h, luciferase and Renilla signals were measured on a SpectraMax® i3x Multi-Mode Microplate Reader (Molecular Devices Corporation). Renilla luciferase activity was normalized to firefly luciferase activity.

4.11. RNA-seq and Bioinformatics Analysis

RNA-seq analysis for the WIF1-overexpressed GCs and controls was performed by Frasergen Information Co., Ltd. (Wuhan, China). Raw RNA-seq data were deposited in the National Center for Biotechnology Information (NCBI)’s Sequence Read Archive (SRA) database under the accession number PRJNA1025264. Clean reads were generated after removing adapters and low-quality reads from the raw data using fastp v0.20.1 [48]. The clean reads were aligned to the chicken reference genome (Gallus-gallus-7.0) using HISAT2 v2.2.1 [49]. The expression levels were normalized to fragments per kilobase of transcript per million mapped fragments (FPKMs) using the Cufflinks v2.2.1 software [50]. DEGs were identified using DESeq2 v1.32.0 [51]. Enrichment analyses, including Gene Ontology (GO), Kyoto Encyclopedia of Genes and Genomes (KEGG), and gene set enrichment analysis (GSEA) (criteria: |NES| > 1, p_value < 0.05, and false discovery rate (FDR) < 25%), were performed using R package clusterProfiler [52].

4.12. Co-Transfection of Plasmid DNA and Small Interfering RNA (siRNA)

The siRNAs of estrogen receptor 2 (ESR2) were designed and synthesized by GenePharma, including siRNA1-ESR2 (sense: 5′-GCAUUCUGCAGUCCUGCUATT-3′; antisense: 5′-UAGCAGGACUGCAGAAUGCTT-3′); siRNA2-ESR2 (sense: 5′-GUCAGUCAUCACUUCUGUATT-3′; antisense: 5′- UACAGAAGUGAUGACUGACTT-3′); and siRNA3-ESR2 (sense: 5′-GCUACGGAAAUGCUAUGAATT-3′; antisense: 5′-UUCAUAGCAUUUCCGUAGCTT-3′). siRNA1-ESR2 was selected for subsequent experiments with the highest knockdown efficiency. Co-transfection of plasmid and siRNA was performed using Lipofectamine® 2000 Reagent (Invitrogen) by adding ~0.6 μg of siRNA per 1 μg of DNA.

4.13. Immunofluorescence Staining

Chicken GCs were washed with PBS, fixed with 4% paraformaldehyde for 30 min, and permeabilized with 0.5% Triton X-100 for 15 min. The GCs were supplemented with diluted goat serum blocking buffer (Solarbio, Cat# SL038) for 1 h, incubated with FSHR Rabbit Polyclonal antibody (Proteintech, Chicago, IL, USA, 22665-1-AP, 1:500) at 4 °C overnight, and incubated with fluorescently labeled secondary antibody (Proteintech, Alexa Flour 488, 1:1000) for 1 h at room temperature. Nuclei were stained with Hoechst stain (Beyotime) for 30 min. Images were visualized using a laser scanning confocal microscope (Nikon A1R; Tokyo, Japan) with the same parameters.

4.14. TdT-Mediated dUTP Nick-End Labeling (TUNEL) Assay

Apoptosis of chicken TCs was examined using a One-Step TUNEL Apoptosis Assay Kit (Beyotime) according to the manufacturer’s protocol. Initially, TCs were seeded in 24-well plates and incubated in 4% paraformaldehyde (Beyotime), followed by 1% Triton X-100 (Sigma). The cells were subsequently treated with a freshly prepared TUNEL reaction mixture. The ratio of TUNEL-positive cells was calculated based on double staining with TUNEL (green) and Hoechst (blue).

4.15. Statistical Analysis and Data Visualization

Data are expressed as means ± standard error (SE). Statistical analyses were conducted using t-tests or one-way analysis of variance (ANOVA) using SPSS v25 (SPSS Inc., Chicago, IL, USA). Lowercase letters a, b, c, d, and e indicate the level of significance. * p < 0.05, ** p < 0.01, and *** p < 0.001. ns, non-significant differences (p ≥ 0.05). Graphical visualizations were created using GraphPad Prism version 8.0 (GraphPad Software, San Diego, CA, USA), ggplot2 [53], TBtools v0.6673 [54], EVenn [55], and GSEA plot [56]. A schematic diagram was generated using Figdraw (www.figdraw.com).

5. Conclusions

In conclusion, our study demonstrates that WIF1 is differently expressed during chicken follicle selection and regulates GC and TC functions such as cell proliferation, apoptosis, and hormone secretion through Wnt/β-catenin signaling pathways. To the best of our knowledge, this is the first study to report the function and regulatory mechanism of WIF1 in chicken granulosa cells. These results elucidate a new molecular regulatory mechanism for follicle selection in chickens, which provides a new insight into potential applications in assisted reproduction and breeding technologies in poultry.

Supplementary Materials

The following supporting information can be downloaded at: https://www.mdpi.com/article/10.3390/ijms25031788/s1.

Author Contributions

Conceptualization, H.Z. and C.W.; methodology, R.N.; software, H.T.; validation, R.N., W.Z. and H.T.; formal analysis, J.L.; investigation, H.T.; resources, Y.L.; data curation, Y.L.; writing—original draft preparation, R.N.; writing—review and editing, B.Z.; visualization, J.L.; supervision, Y.L.; project administration, H.Z.; funding acquisition, H.Z. All authors have read and agreed to the published version of the manuscript.

Funding

This research was funded by the National Key Research and Development Program of China (2022YFD1600902), the Key Research and Development Program of Shandong (2022LZGC013), and the China Agriculture Research System (CARS-40).

Institutional Review Board Statement

The animal study protocol was approved by the Animal Care and Use Committee of China Agricultural University and performed in compliance with the National Research Council’s Guide for the Care and Use of Laboratory Animals (AW80203202-1-1).

Informed Consent Statement

Not applicable.

Data Availability Statement

The data presented in this study are available on request from the corresponding author.

Acknowledgments

We would like to thank Junying Jia from the Institute of Biophysics, Chinese Academy of Sciences, for his support and help in the flow cytometry experiments.

Conflicts of Interest

The authors declare no conflicts of interest.

References

  1. Johnson, A.L. Ovarian Follicle Selection and Granulosa Cell Differentiation. Poult. Sci. 2015, 94, 781–785. [Google Scholar] [CrossRef] [PubMed]
  2. Lovell, T.M.; Gladwell, R.T.; Groome, N.P.; Knight, P.G. Ovarian Follicle Development in the Laying Hen Is Accompanied by Divergent Changes in Inhibin A, Inhibin B, Activin A and Follistatin Production in Granulosa and Theca Layers. J. Endocrinol. 2003, 177, 45–55. [Google Scholar] [CrossRef] [PubMed]
  3. Johnson, A.L. Intracellular Mechanisms Regulating Cell Survival in Ovarian Follicles. Anim. Reprod. Sci. 2003, 78, 185–201. [Google Scholar] [CrossRef] [PubMed]
  4. Wang, Y.; Chen, Q.; Liu, Z.; Guo, X.; Du, Y.; Yuan, Z.; Guo, M.; Kang, L.; Sun, Y.; Jiang, Y. Transcriptome Analysis on Single Small Yellow Follicles Reveals That Wnt4 Is Involved in Chicken Follicle Selection. Front. Endocrinol. 2017, 8, 317. [Google Scholar] [CrossRef] [PubMed]
  5. Elis, S.; Dupont, J.; Couty, I.; Persani, L.; Govoroun, M.; Blesbois, E.; Batellier, F.; Monget, P. Expression and Biological Effects of Bone Morphogenetic Protein-15 in the Hen Ovary. J. Endocrinol. 2007, 194, 485–497. [Google Scholar] [CrossRef]
  6. Wang, Y.; Li, J.; Wang, C.Y.; Kwok, A.H.Y.; Leung, F.C. Epidermal Growth Factor (EGF) Receptor Ligands in the Chicken Ovary: I. Evidence for Heparin-Binding EGF-Like Growth Factor (HB-EGF) as a Potential Oocyte-Derived Signal to Control Granulosa Cell Proliferation and HB-EGF and Kit Ligand Expression. Endocrinology 2007, 148, 3426–3440. [Google Scholar] [CrossRef]
  7. Yu, Y.S.; Sui, H.S.; Han, Z.B.; Li, W.; Luo, M.J.; Tan, J.H. Apoptosis in Granulosa Cells During Follicular Atresia: Relationship with Steroids and Insulin-Like Growth Factors. Cell Res. 2004, 14, 341–346. [Google Scholar] [CrossRef]
  8. Zhong, C.; Liu, Z.; Li, D.; Kang, L.; Jiang, Y. Long-Read Sequencing Reveals the Effect of Follicle-Stimulating Hormone on the mRNA Profile of Chicken Granulosa Cells from Prehierarchical Follicles. Poult. Sci. 2023, 102, 102600. [Google Scholar] [CrossRef]
  9. Samardzija, D.; Pogrmic-Majkic, K.; Fa, S.; Stanic, B.; Jasnic, J.; Andric, N. Bisphenol A Decreases Progesterone Synthesis by Disrupting Cholesterol Homeostasis in Rat Granulosa Cells. Mol. Cell. Endocrinol. 2018, 461, 55–63. [Google Scholar] [CrossRef]
  10. Miller, W.L. Steroidogenesis: Unanswered Questions. Trends Endocrinol. Metab. 2017, 28, 771–793. [Google Scholar] [CrossRef]
  11. Nie, R.; Zheng, X.; Zhang, W.; Zhang, B.; Ling, Y.; Zhang, H.; Wu, C. Morphological Characteristics and Transcriptome Landscapes of Chicken Follicles During Selective Development. Animals 2022, 12, 713. [Google Scholar] [CrossRef]
  12. Hsieh, J.C.; Kodjabachian, L.; Rebbert, M.L.; Rattner, A.; Smallwood, P.M.; Samos, C.H.; Nusse, R.; Dawid, I.B.; Nathans, J. A New Secreted Protein That Binds to Wnt Proteins and Inhibits Their Activities. Nature 1999, 398, 431–436. [Google Scholar] [CrossRef]
  13. Wissmann, C.; Wild, P.J.; Kaiser, S.; Roepcke, S.; Stoehr, R.; Woenckhaus, M.; Kristiansen, G.; Hsieh, J.C.; Hofstaedter, F.; Hartmann, A.; et al. WIF1, a Component of the Wnt Pathway, Is Down-Regulated in Prostate, Breast, Lung, and Bladder Cancer. J. Pathol. 2003, 201, 204–212. [Google Scholar] [CrossRef]
  14. Becker, M.; Bauer, J.; Pyczek, J.; König, S.; Müllen, A.; Rabe, H.; Schön, M.P.; Uhmann, A.; Hahn, H. WIF1 Suppresses the Generation of Suprabasal Cells in Acanthotic Skin and Growth of Basal Cell Carcinomas upon Forced Overexpression. J. Investig. Dermatol. 2020, 140, 1556–1565.e11. [Google Scholar] [CrossRef]
  15. Guo, H.; Zhou, S.; Tan, L.; Wu, X.; Wu, Z.; Ran, R. Clinicopathological Significance of WIF1 Hypermethylation in NSCLC, a Meta-analysis and Literature Review. Oncotarget 2017, 8, 2550–2557. [Google Scholar] [CrossRef]
  16. Liu, L.; Zhou, Y.; Luo, D.; Sun, X.; Li, H.; Lu, Y.; Wang, J.; Zhang, M.; Lin, N.; Yin, C.; et al. Aberrant Promoter Methylation of Wnt Inhibitory Factor-1 Gene Is a Potential Target for Treating Psoriasis. Clin. Immunol. 2023, 250, 109294. [Google Scholar] [CrossRef]
  17. Khristi, V.; Chakravarthi, V.P.; Singh, P.; Ghosh, S.; Pramanik, A.; Ratri, A.; Borosha, S.; Roby, K.F.; Wolfe, M.W.; Rumi, M.A.K. ESR2 Regulates Granulosa Cell Genes Essential for Follicle Maturation and Ovulation. Mol. Cell. Endocrinol. 2018, 474, 214–226. [Google Scholar] [CrossRef]
  18. Couse, J.F.; Hewitt, S.C.; Bunch, D.O.; Sar, M.; Walker, V.R.; Davis, B.J.; Korach, K.S. Postnatal Sex Reversal of the Ovaries in Mice Lacking Estrogen Receptors Alpha and Beta. Science 1999, 286, 2328–2331. [Google Scholar] [CrossRef] [PubMed]
  19. Poggi, L.; Casarosa, S.; Carl, M. An Eye on the Wnt Inhibitory Factor Wif1. Front. Cell Dev. Biol. 2018, 6, 167. [Google Scholar] [CrossRef] [PubMed]
  20. Xu, B.; Chen, C.; Chen, H.; Zheng, S.G.; Bringas, P.; Xu, M.; Zhou, X.H.; Chen, D.; Umans, L.; Zwijsen, A.; et al. Smad1 and Its Target Gene Wif1 Coordinate BMP and Wnt Signaling Activities to Regulate Fetal Lung Development. Development 2011, 138, 925–935. [Google Scholar] [CrossRef] [PubMed]
  21. Ortego, J.; Escribano, J.; Coca-Prados, M. Cloning and Characterization of Subtracted cDNAs from a Human Ciliary Body Library Encoding TIGR, a Protein Involved in Juvenile Open Angle Glaucoma with Homology to Myosin and Olfactomedin. FEBS Lett. 1997, 413, 349–353. [Google Scholar] [CrossRef]
  22. Kwon, H.S.; Lee, H.S.; Ji, Y.; Rubin, J.S.; Tomarev, S.I. Myocilin Is a Modulator of Wnt Signaling. Mol. Cell. Biol. 2009, 29, 2139–2154. [Google Scholar] [CrossRef]
  23. Menaa, F.; Braghini, C.A.; Vasconcellos, J.P.; Menaa, B.; Costa, V.P.; Figueiredo, E.S.; Melo, M.B. Keeping an Eye on Myocilin: A Complex Molecule Associated with Primary Open-Angle Glaucoma Susceptibility. Molecules 2011, 16, 5402–5421. [Google Scholar] [CrossRef] [PubMed]
  24. Chen, Q.Y.; Wang, Y.Y.; Liu, Z.M.; Guo, X.L.; Sun, Y.; Kang, L.; Jiang, Y.L. Transcriptomic and Proteomic Analyses of Ovarian Follicles Reveal the Role of VLDLR in Chicken Follicle Selection. BMC Genom. 2020, 21, 486. [Google Scholar] [CrossRef] [PubMed]
  25. Lee, J.G.; Jung, E.; Heur, M. Fibroblast Growth Factor 2 Induces Proliferation and Fibrosis via SNAI1-Mediated Activation of CDK2 and ZEB1 in Corneal Endothelium. J. Biol. Chem. 2018, 293, 3758–3769. [Google Scholar] [CrossRef] [PubMed]
  26. Chen, S.; Wang, F.; Liu, Z.; Zhao, Y.; Jiang, Y.; Chen, L.; Li, C.; Zhou, X. Brain-Derived Neurotrophic Factor Promotes Proliferation and Progesterone Synthesis in Bovine Granulosa Cells. J. Cell. Physiol. 2019, 234, 8776–8787. [Google Scholar] [CrossRef] [PubMed]
  27. Huo, Y.; Li, Q.; Yang, L.; Li, X.; Sun, C.; Liu, Y.; Liu, H.; Pan, Z.; Li, Q.; Du, X. SDNOR, a Novel Antioxidative lncRNA, Is Essential for Maintaining the Normal State and Function of Porcine Follicular Granulosa Cells. Antioxidants 2023, 12, 799. [Google Scholar] [CrossRef] [PubMed]
  28. Lambiv, W.L.; Vassallo, I.; Delorenzi, M.; Shay, T.; Diserens, A.C.; Misra, A.; Feuerstein, B.; Murat, A.; Migliavacca, E.; Hamou, M.F.; et al. The Wnt Inhibitory Factor 1 (WIF1) Is Targeted in Glioblastoma and Has a Tumor Suppressing Function Potentially by Induction of Senescence. Neuro Oncol. 2011, 13, 736–747. [Google Scholar] [CrossRef] [PubMed]
  29. Ramachandran, I.; Thavathiru, E.; Ramalingam, S.; Natarajan, G.; Mills, W.K.; Benbrook, D.M.; Zuna, R.; Lightfoot, S.; Reis, A.; Anant, S.; et al. Wnt Inhibitory Factor 1 Induces Apoptosis and Inhibits Cervical Cancer Growth, Invasion and Angiogenesis In Vivo. Oncogene 2012, 31, 2725–2737. [Google Scholar] [CrossRef] [PubMed]
  30. Yuan, F.; Wang, Z.; Sun, Y.; Wei, H.; Cui, Y.; Wu, Z.; Zhang, C.; Xie, K.P.; Wang, F.; Zhang, M. Sgpl1 Deletion Elevates S1P Levels, Contributing to NPR2 Inactivity and p21 Expression That Block Germ Cell Development. Cell Death Dis. 2021, 12, 574. [Google Scholar] [CrossRef]
  31. Han, S.; Wang, J.; Cui, C.; Yu, C.; Zhang, Y.; Li, D.; Ma, M.; Du, H.; Jiang, X.; Zhu, Q.; et al. Fibromodulin Is Involved in Autophagy and Apoptosis of Granulosa Cells Affecting the Follicular Atresia in Chicken. Poult. Sci. 2022, 101, 101524. [Google Scholar] [CrossRef] [PubMed]
  32. Zhu, Z.; Bai, X.; Wang, H.; Li, X.; Sun, G.; Zhang, P. A Study on the Mechanism of Wnt Inhibitory Factor 1 in Osteoarthritis. Arch. Med. Sci. 2020, 16, 898–906. [Google Scholar] [CrossRef] [PubMed]
  33. Stocco, D.M.; Wang, X.; Jo, Y.; Manna, P.R. Multiple Signaling Pathways Regulating Steroidogenesis and Steroidogenic Acute Regulatory Protein Expression: More Complicated than We Thought. Mol. Endocrinol. 2005, 19, 2647–2659. [Google Scholar] [CrossRef] [PubMed]
  34. Manna, P.R.; Dyson, M.T.; Eubank, D.W.; Clark, B.J.; Lalli, E.; Sassone-Corsi, P.; Zeleznik, A.J.; Stocco, D.M. Regulation of Steroidogenesis and the Steroidogenic Acute Regulatory Protein by a Member of the cAMP Response-Element Binding Protein Family. Mol. Endocrinol. 2002, 16, 184–199. [Google Scholar] [CrossRef]
  35. Zhou, X.; He, Y.; Pan, X.; Quan, H.; He, B.; Li, Y.; Bai, G.; Li, N.; Zhang, Z.; Zhang, H.; et al. DNMT1-Mediated lncRNA IFFD Controls the Follicular Development via Targeting GLI1 by Sponging miR-370. Cell Death Differ. 2023, 30, 576–588. [Google Scholar] [CrossRef]
  36. Li, X.; Chen, H.; Zhang, Z.; Xu, D.; Duan, J.; Li, X.; Yang, L.; Hua, R.; Cheng, J.; Li, Q. Isorhamnetin Promotes Estrogen Biosynthesis and Proliferation in Porcine Granulosa Cells via the PI3K/Akt Signaling Pathway. J. Agric. Food Chem. 2021, 69, 6535–6542. [Google Scholar] [CrossRef] [PubMed]
  37. Richards, J.S.; Pangas, S.A. The Ovary: Basic Biology and Clinical Implications. J. Clin. Investig. 2010, 120, 963–972. [Google Scholar] [CrossRef]
  38. Logan, C.Y.; Nusse, R. The Wnt Signaling Pathway in Development and Disease. Annu. Rev. Cell Dev. Biol. 2004, 20, 781–810. [Google Scholar] [CrossRef]
  39. Song, J.; Xie, C.; Jiang, L.; Wu, G.; Zhu, J.; Zhang, S.; Tang, M.; Song, L.; Li, J. Transcription Factor AP-4 Promotes Tumorigenic Capability and Activates the Wnt/β-Catenin Pathway in Hepatocellular Carcinoma. Theranostics 2018, 8, 3571–3583. [Google Scholar] [CrossRef]
  40. He, T.C.; Sparks, A.B.; Rago, C.; Hermeking, H.; Zawel, L.; da Costa, L.T.; Morin, P.J.; Vogelstein, B.; Kinzler, K.W. Identification of c-MYC as a Target of the APC Pathway. Science 1998, 281, 1509–1512. [Google Scholar] [CrossRef]
  41. Tetsu, O.; McCormick, F. Beta-Catenin Regulates Expression of Cyclin D1 in Colon Carcinoma Cells. Nature 1999, 398, 422–426. [Google Scholar] [CrossRef]
  42. Lin, Z.; Gong, Y.; Sun, H.; Yang, C.; Tang, Y.; Yin, L.; Zhang, D.; Wang, Y.; Yu, C.; Liu, Y. Lipid Deposition and Progesterone Synthesis Are Increased by miR-181b-5p Through RAP1B/ERK1/2 Pathway in Chicken Granulosa Cells. J. Agric. Food Chem. 2023, 71, 12910–12924. [Google Scholar] [CrossRef]
  43. Ning, Z.; Deng, X.; Li, L.; Feng, J.; Du, X.; Amevor, F.K.; Tian, Y.; Li, L.; Rao, Y.; Yi, Z.; et al. miR-128-3p Regulates Chicken Granulosa Cell Function via 14-3-3β/FoxO and PPAR-γ/LPL Signaling Pathways. Int. J. Biol. Macromol. 2023, 241, 124654. [Google Scholar] [CrossRef] [PubMed]
  44. Mitani, S.; Takayama, K.; Nagamoto, Y.; Imagawa, K.; Sakurai, F.; Tachibana, M.; Sumazaki, R.; Mizuguchi, H.; Human, E.S.C. Human ESC/iPSC-Derived Hepatocyte-Like Cells Achieve Zone-Specific Hepatic Properties by Modulation of WNT Signaling. Mol. Ther. 2017, 25, 1420–1433. [Google Scholar] [CrossRef] [PubMed]
  45. Vassallo, I.; Zinn, P.; Lai, M.; Rajakannu, P.; Hamou, M.F.; Hegi, M.E. WIF1 Re-expression in Glioblastoma Inhibits Migration Through Attenuation of Non-canonical WNT Signaling by Downregulating the lncRNA MALAT1. Oncogene 2016, 35, 12–21. [Google Scholar] [CrossRef] [PubMed]
  46. Porter, T.E.; Hargis, B.M.; Silsby, J.L.; el Halawani, M.E. Differential Steroid Production Between Theca Interna and Theca Externa Cells: A Three-Cell Model for Follicular Steroidogenesis in Avian Species. Endocrinology 1989, 125, 109–116. [Google Scholar] [CrossRef]
  47. Schneider, C.A.; Rasband, W.S.; Eliceiri, K.W. NIH Image to ImageJ: 25 Years of Image Analysis. Nat. Methods 2012, 9, 671–675. [Google Scholar] [CrossRef] [PubMed]
  48. Chen, S.; Zhou, Y.; Chen, Y.; Gu, J. Fastp: An Ultra-Fast All-in-One FASTQ Preprocessor. Bioinformatics 2018, 34, i884–i890. [Google Scholar] [CrossRef] [PubMed]
  49. Kim, D.; Langmead, B.; Salzberg, S.L. HISAT: A Fast Spliced Aligner with Low Memory Requirements. Nat. Methods 2015, 12, 357–360. [Google Scholar] [CrossRef] [PubMed]
  50. Trapnell, C.; Williams, B.A.; Pertea, G.; Mortazavi, A.; Kwan, G.; van Baren, M.J.; Salzberg, S.L.; Wold, B.J.; Pachter, L. Transcript Assembly and Quantification by RNA-Seq Reveals Unannotated Transcripts and Isoform Switching During Cell Differentiation. Nat. Biotechnol. 2010, 28, 511–515. [Google Scholar] [CrossRef]
  51. Love, M.I.; Huber, W.; Anders, S. Moderated Estimation of Fold Change and Dispersion for RNA-Seq Data with DESeq2. Genome Biol. 2014, 15, 550. [Google Scholar] [CrossRef]
  52. Yu, G.; Wang, L.G.; Han, Y.; He, Q.Y. clusterProfiler: An R Package for Comparing Biological Themes Among Gene Clusters. Omics 2012, 16, 284–287. [Google Scholar] [CrossRef]
  53. Ginestet, C. ggplot2: Elegant Graphics for Data Analysis. J. R. Stat. Soc. A 2011, 174, 245–246. [Google Scholar] [CrossRef]
  54. Chen, C.; Chen, H.; Zhang, Y.; Thomas, H.R.; Frank, M.H.; He, Y.; Xia, R. TBtools: An Integrative Toolkit Developed for Interactive Analyses of Big Biological Data. Mol. Plant 2020, 13, 1194–1202. [Google Scholar] [CrossRef] [PubMed]
  55. Chen, T.; Zhang, H.; Liu, Y.; Liu, Y.X.; Huang, L. EVenn: Easy to Create Repeatable and Editable Venn Diagrams and Venn Networks Online. J. Genet. Genom. 2021, 48, 863–866. [Google Scholar] [CrossRef] [PubMed]
  56. Innis, S.E.; Reinaltt, K.; Civelek, M.; Anderson, W.D. GSEAplot: A Package for Customizing Gene Set Enrichment Analysis in R. J. Comput. Biol. 2021, 28, 629–631. [Google Scholar] [CrossRef] [PubMed]
Figure 1. Expression characteristics of WIF1 in chickens. (A) mRNA expression level of WIF1 in chicken follicles was compared between the peak laying period (30 weeks old) and the late laying period (60 weeks old) (n = 7). (B) WIF1 expression pattern in follicles during different development stages on the chicken ovary at 30 weeks old (n = 5). SWF, small white follicle; LWF, large white follicle; SYF, small yellow follicle; F5–F1 represent hierarchal follicles, which are sorted from smallest to largest in diameter. (C) WIF1 expression level in granulosa cells (GCs) and theca cells (TCs) from several representative developmental stages (n = 4). (D,E) WIF1 protein expression level in GCs of several follicles detected by Western blotting (n = 3). The band intensities were measured by ImageJ and normalized to GAPDH. (F) mRNA expression level of WIF1 in 8 different tissues in chickens (n = 5). Results are shown as the mean ± SEM. Differences between groups were determined by ANOVA. Different lowercase letters are used to indicate the level of significance of differences (p < 0.05); the same lowercase letters indicate non-significant differences (p > 0.05).
Ijms 25 01788 g001
Figure 2. WIF1 inhibits the proliferation of chicken prehierarchal granulosa cells (GC). mRNA (A) (n = 8) and protein (B,C) (n = 3) expression levels of WIF1 after transfection with pcDNA3.1-WIF1 in GCs. mRNA (D) (n = 5) and protein (E,F) (n = 3) expression levels of WIF1 after transfection with siRNA-WIF1 in GCs. (G) Proliferation of chicken GCs determined by 5-ethynyl-2′-deoxyuridine (EdU) after 24 h of transfection with pcDNA3.1-WIF1, scale bar: 130 μm. (H) Histogram showing the proportion of EdU-positive cells using ImageJ (n = 3). (I) Cell counting kit-8 (CCK-8) assay of GCs transfected with pcDNA3.1-WIF1 at 6, 12, 24, and 48 h post-transfection (n = 10). (J) Expression levels of cell cycle-related genes in GCs with WIF1 overexpression (n = 6). (K) Proliferation of chicken GCs determined by 5-ethynyl-2′-deoxyuridine (EdU) after 24 h of transfection with siRNA3-WIF1, scale bar: 130 μm. (L) Histogram showing the proportion of EdU-positive cells using ImageJ (n = 3). (M) Cell counting kit-8 assay of GCs transfected with siRNA3-WIF1 at 6, 12, 24, and 48 h post-transfection (n = 10). (N) Expression levels of cell cycle-related genes in GCs with WIF1 knockdown (n = 6). Results are shown as the mean ± SEM. * p < 0.05, ** p < 0.01, and *** p < 0.001.
Ijms 25 01788 g002
Figure 3. WIF1 promotes the apoptosis of chicken prehierarchal GCs. (A,B) The apoptosis rates of GCs with WIF1 overexpression were assessed by flow cytometry (n = 5). (C,D) The apoptosis rates of GCs with WIF1 knockdown were assessed by flow cytometry (n = 5). * p < 0.05.
Ijms 25 01788 g003
Figure 4. WIF1 promotes the secretion of progesterone with the participation of FSH in chicken GCs. (AD) mRNA expression levels of STAR, CYP11A1, HSD3B1, and FSHR in pre-GCs with WIF1 overexpression (n = 6). (EH) mRNA expression levels of STAR, CYP11A1, HSD3B1, and FSHR in hie-GCs with WIF1 overexpression (n = 3). (I,J) Protein expression levels of STAR in pre-GCs with WIF1 overexpression (n = 3). (K,L) Protein expression levels of STAR in hie-GCs with WIF1 overexpression (n = 3). (M,N) Progesterone concentration in chicken pre-GCs with WIF1 overexpression and inhibition was assessed by ELISA (n = 6). (O,P) Progesterone concentration in chicken hie-GCs with WIF1 overexpression and inhibition was assessed by ELISA (n = 6). The intracellular total protein content was assessed to normalize the progesterone hormone content. Results are shown as the mean ± SEM. * p < 0.05, ** p < 0.01, *** p < 0.001, and n.s. p ≥ 0.05.
Ijms 25 01788 g004
Figure 5. WIF1 inhibits Wnt signaling activity in chicken GCs. (A) Luciferase reporter assays of Top/Fop transcriptional activity in GCs from different-development-stage follicles (n = 7). Different lowercase letters are used to indicate the level of significance of differences (p < 0.05); the same lowercase letters indicate non-significant differences (p > 0.05). (B) Luciferase reporter assays of Top/Fop transcriptional activity in GCs with WIF1 overexpression (n = 6). (C) Luciferase reporter assays of Top/Fop transcriptional activity in GCs with WIF1 inhibition (n = 6). (D,E) Western blotting analysis of β-catenin and phosphorylated β-catenin in GCs (n = 3). (F) Quantitative RT-PCR of the mRNA expression of some elements in Wnt/β-catenin signaling (n = 6). Results are shown as the mean ± SEM. * p < 0.05, *** p < 0.001, and ns p ≥ 0.05.
Ijms 25 01788 g005
Figure 6. WIF1 stimulates metabolic activity of chicken prehierarchal GCs (n = 3). (A) Volcano plot of differentially expressed genes (DEGs). The criteria for DEGs screening were | log 2 ( F o l d C h a n g e ) | > 1 and p_adj < 0.05. (B) Gene Ontology (GO) terms enriched for DEGs. (C) Venn diagram of Kyoto Encyclopedia of Genes and Genomes (KEGG) enrichment analyses of DEGs and gene set enrichment analysis (GSEA) of all genes. KEGG (all) represents all pathway terms of KEGG analysis. KEGG (p < 0.05) represents the result of all results of KEGG analysis filtered with p < 0.05. GSEA represents the results filtered by |NES|>1, p_value < 0.05, and FDR < 25%. (D) Heatmap of metabolism-related genes. GSEA of significant pathways in WIF1-overexpressed and control pre-GCs: cytokine–cytokine receptor interaction pathway (E), cell cycle (F), calcium signaling pathway (G), and toll–like receptor signaling pathway (H). (I) Heatmap of the genes involved in the GSEA analysis.
Ijms 25 01788 g006
Figure 7. WIF1 promotes progesterone synthesis through upregulation of ESR2 in GCs. (A) Bar plot of ESR2 in RNA-seq analysis (n = 3). (B) mRNA expression levels of ESR2 (n = 3). (C) mRNA expression levels of ESR2 after transfection with siRNA-ESR2 in GCs (n = 5). (DG) mRNA expression levels of FSHR (n = 6), STAR (n = 6), CYP11A1 (n = 4), and HSD3B1 (n = 6). (H,I) Protein expression levels of STAR in GCs (n = 3). (J) Immunofluorescence staining of FSHR in chicken GCs, scale bar: 10 μm. (K) Concentration of progesterone in chicken GCs assessed by ELISA (n = 5). The intracellular total protein content was assessed to normalize the progesterone hormone content. Results are shown as the mean ± SEM. Different lowercase letters are used to indicate the level of significance of differences (p < 0.05); the same lowercase letters indicate non-significant differences (p > 0.05). * p < 0.05, ** p < 0.01, and ns p ≥ 0.05.
Ijms 25 01788 g007
Figure 8. WIF1 suppresses TC proliferation and promotes apoptosis. (A) mRNA expression levels of WIF1 after transfection with pcDNA3.1-WIF1 in TCs (n = 6). (B) Proliferation of chicken TCs determined by 5-ethynyl-2′-deoxyuridine (EdU) after 24 h of transfection with pcDNA3.1-WIF1 (n = 7), scale bar: 130 μm. (C) The apoptosis of follicular TCs was detected by TdT-mediated dUTP Nick-End Labeling (TUNEL) after transfection with pcDNA3.1-WIF1 (n = 3), scale bar: 130 μm. (D) mRNA expression levels of CYP17A1, CYP19A1, and HSD17B1 in TCs with WIF1 overexpression (n = 3). (E) The concentration of estradiol in TCs with WIF1 overexpression was assessed by ELISA. Results are shown as the mean ± SEM. * p < 0.05, ** p < 0.01, and ns p ≥ 0.05.
Ijms 25 01788 g008
Disclaimer/Publisher’s Note: The statements, opinions and data contained in all publications are solely those of the individual author(s) and contributor(s) and not of MDPI and/or the editor(s). MDPI and/or the editor(s) disclaim responsibility for any injury to people or property resulting from any ideas, methods, instructions or products referred to in the content.

