
Functional and Morphological Differences of Muscle Mitochondria in Chronic Fatigue Syndrome and Post-COVID Syndrome
 , , , and
Abstract
1. Introduction
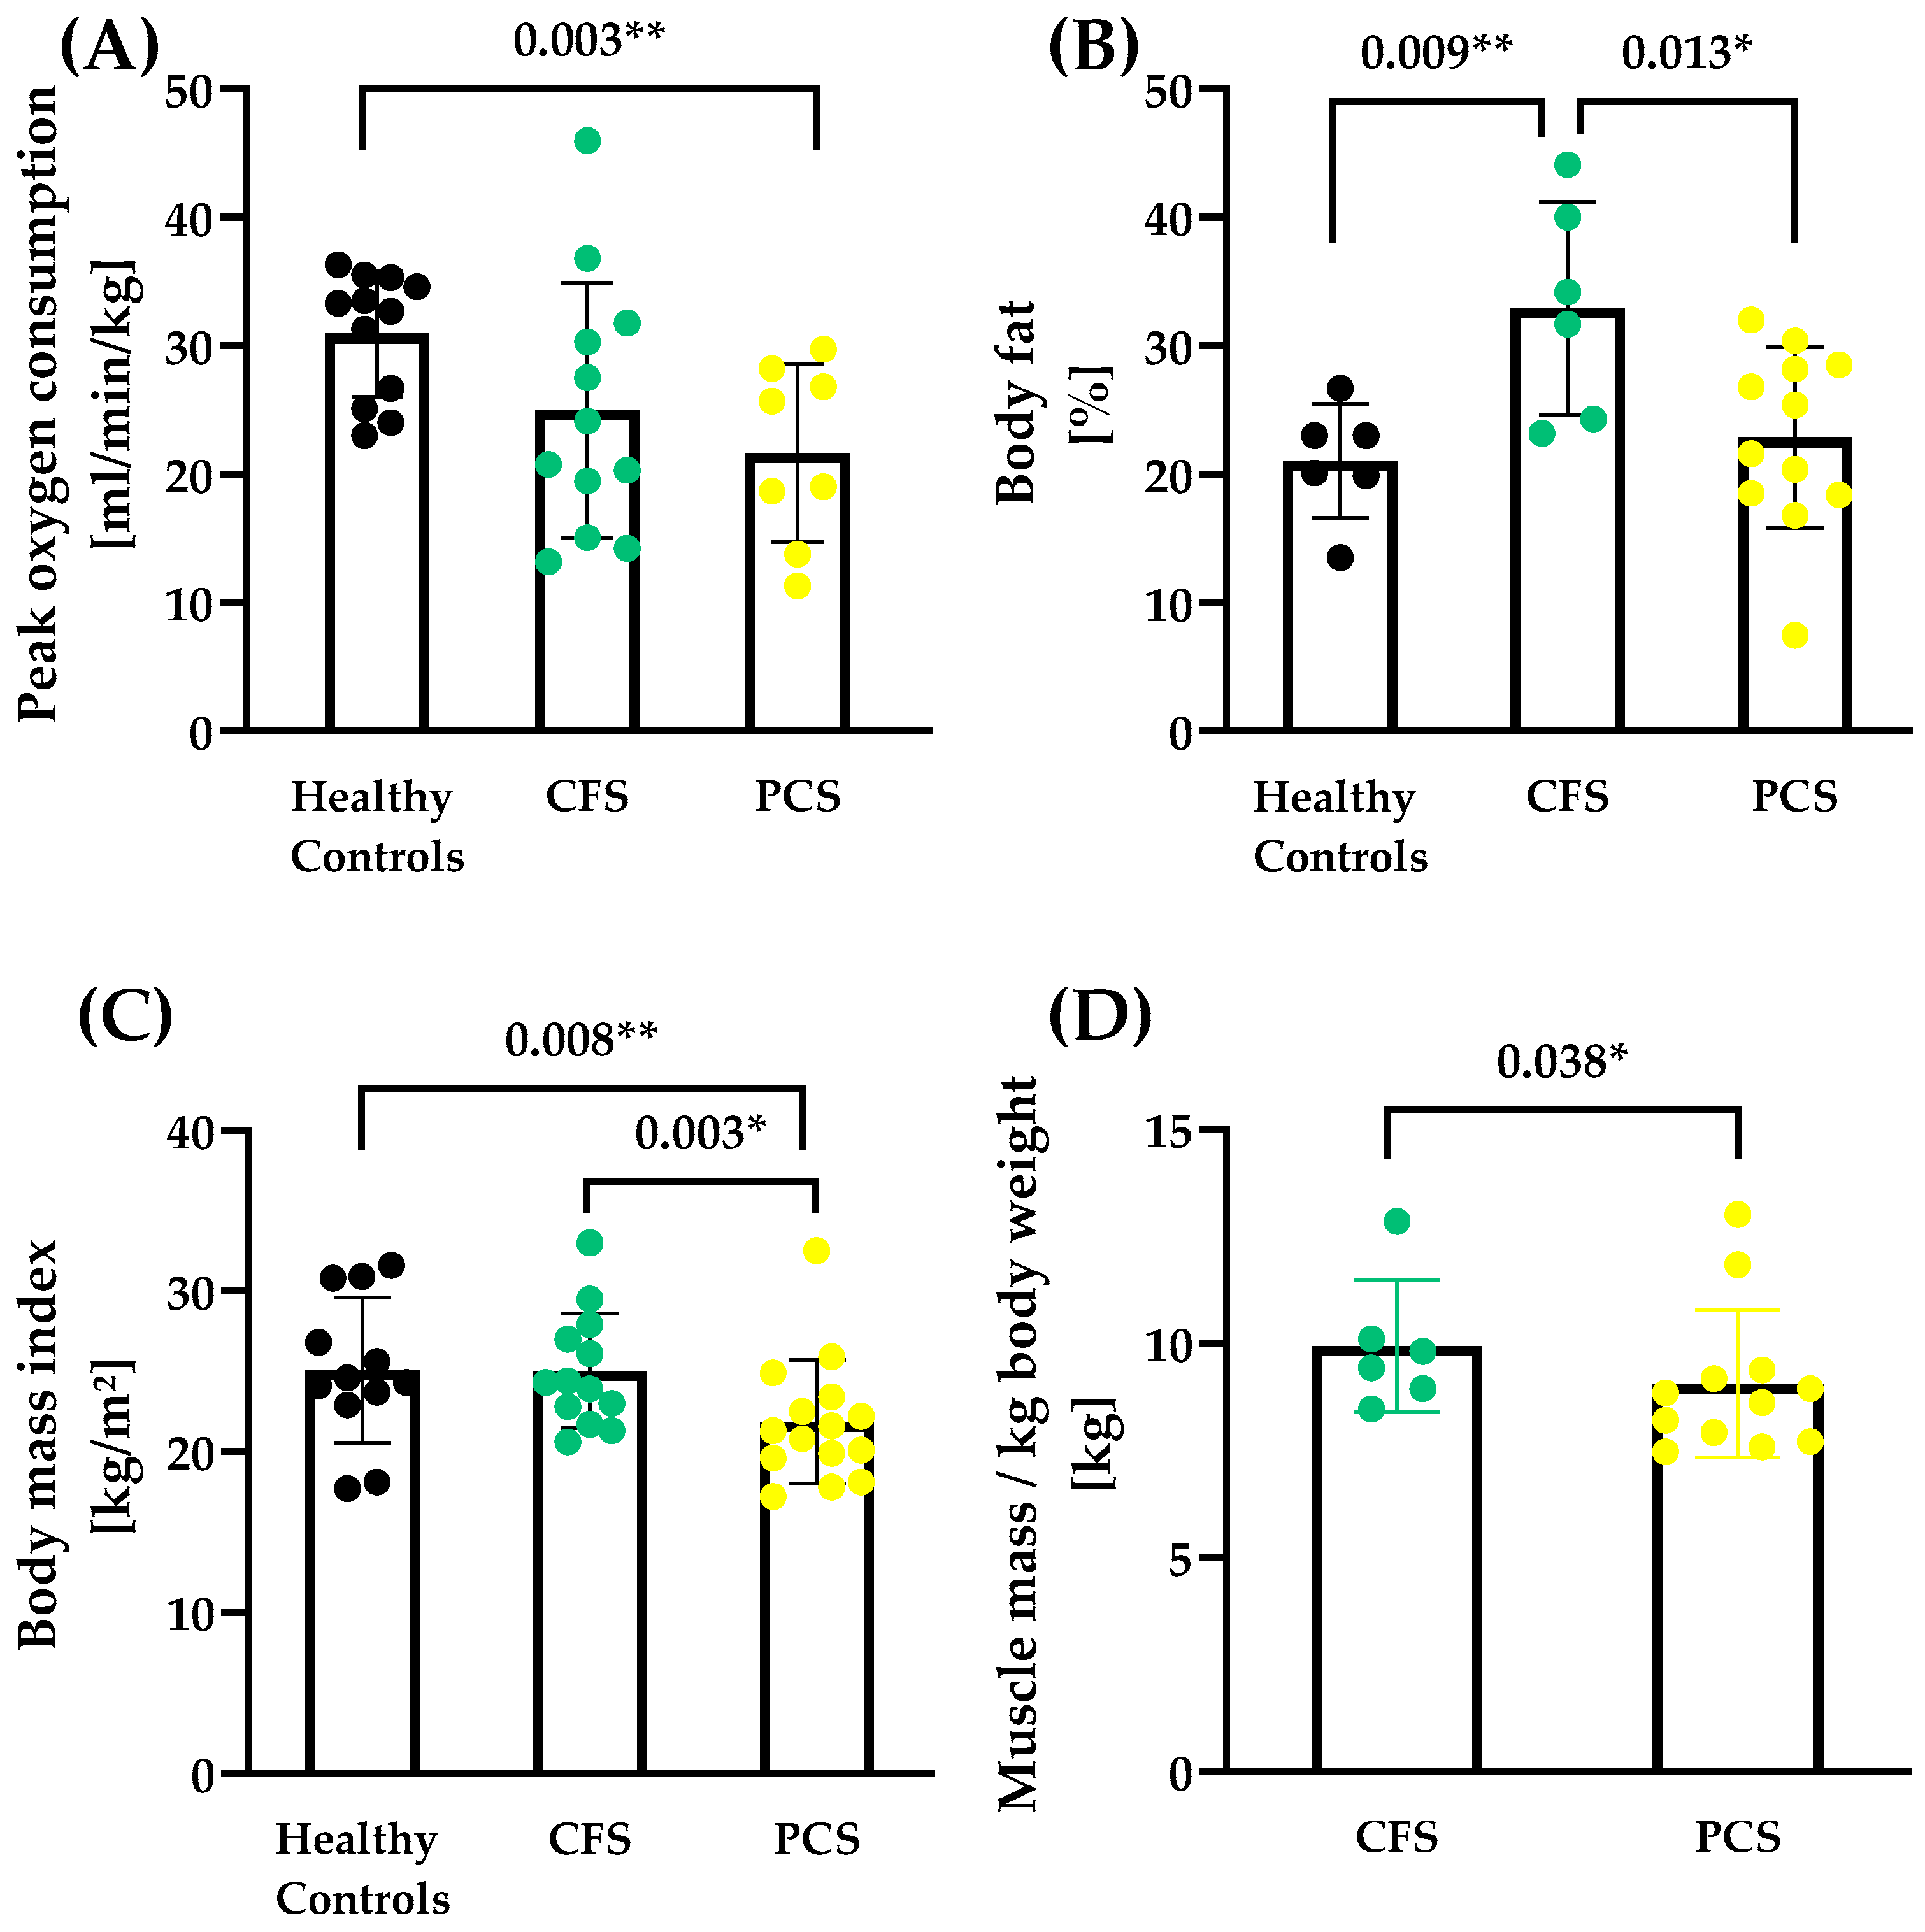
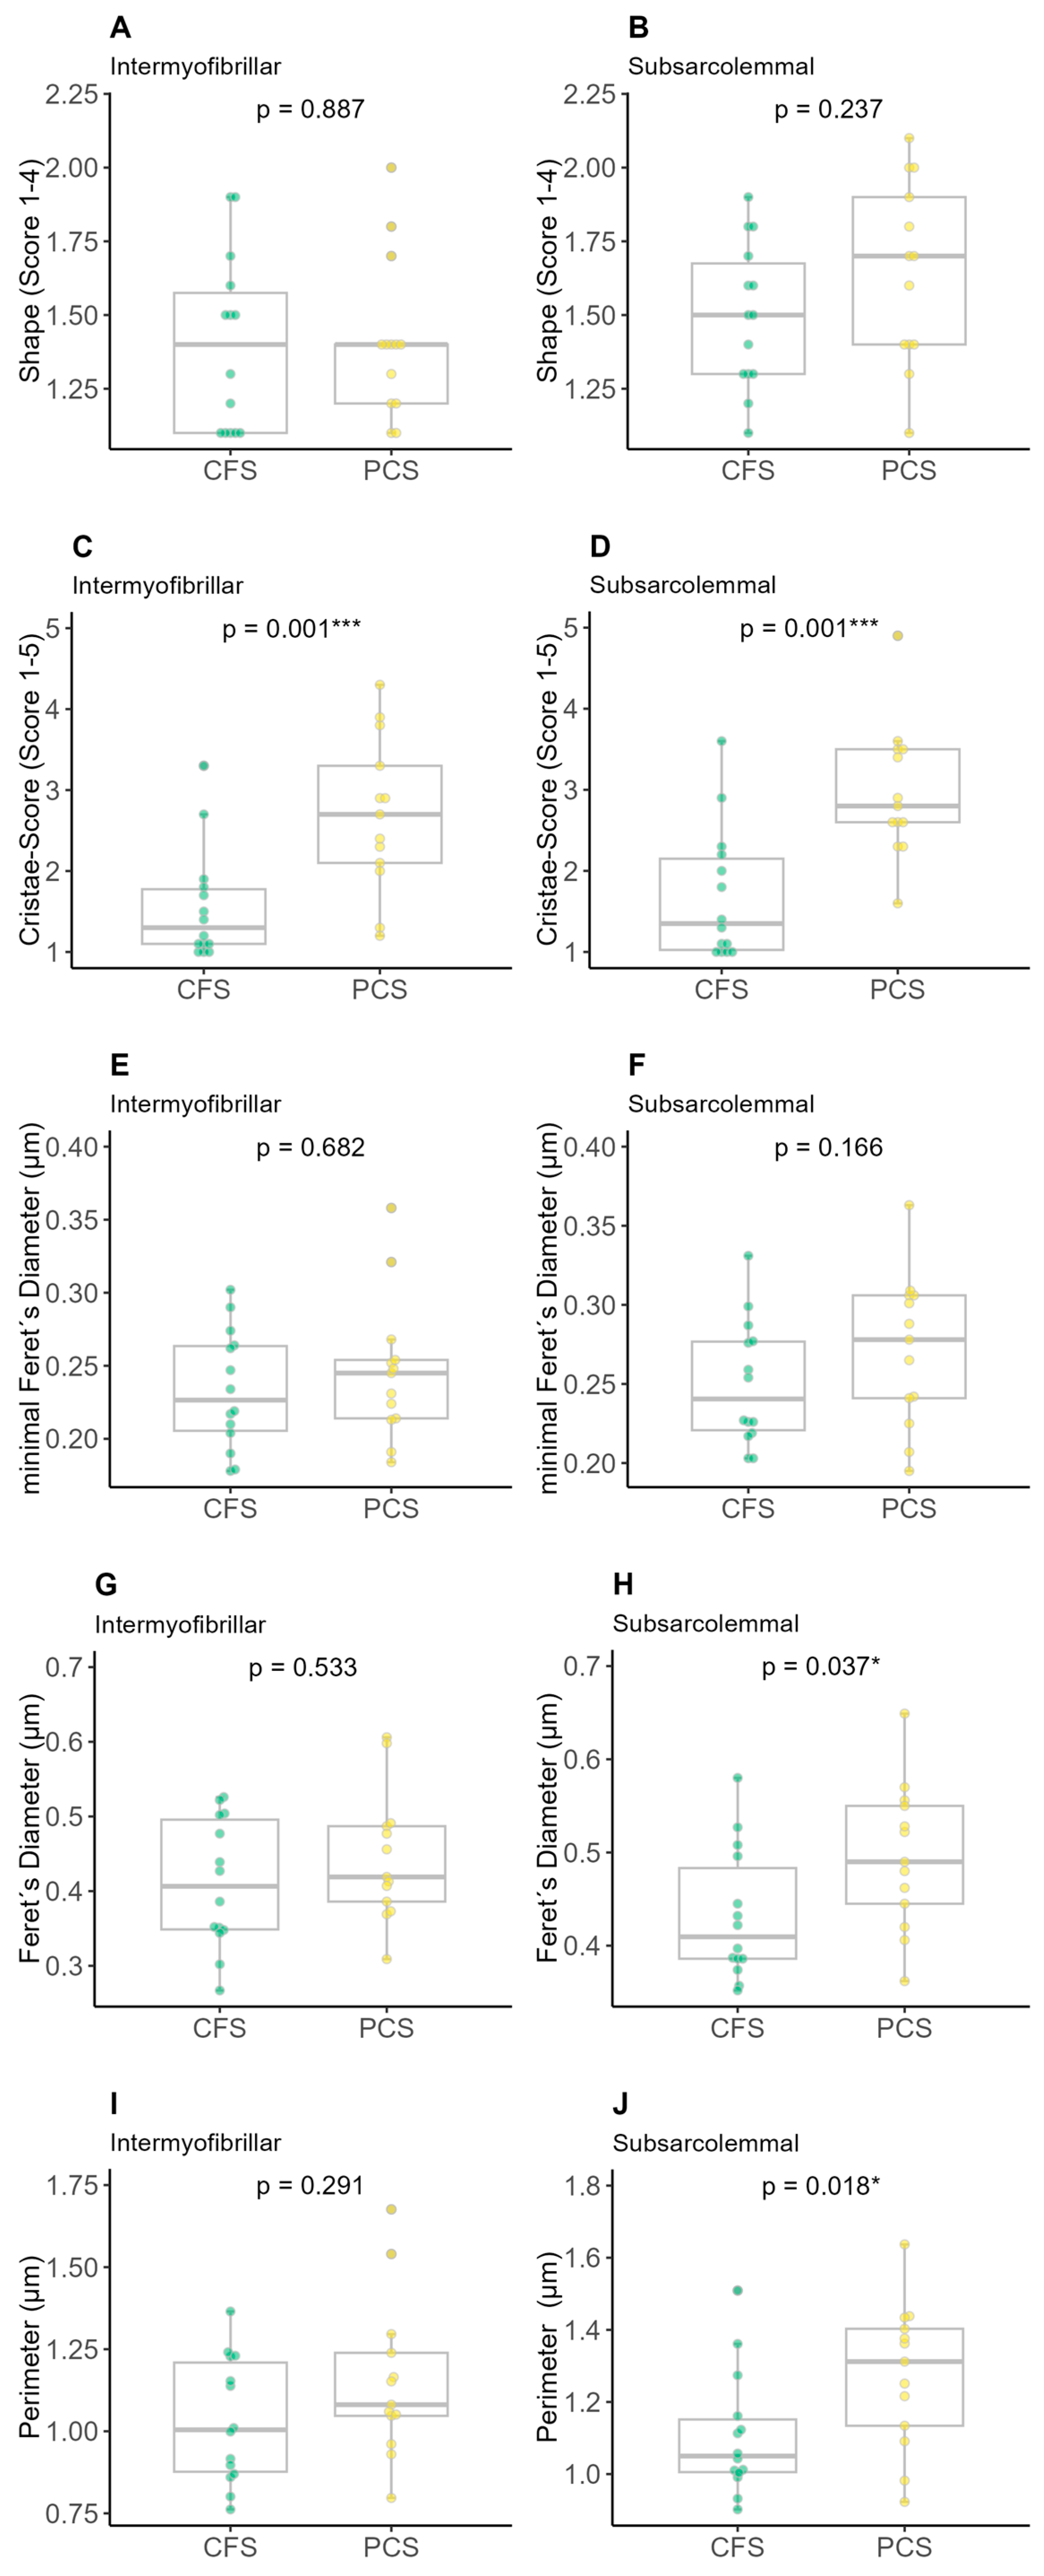
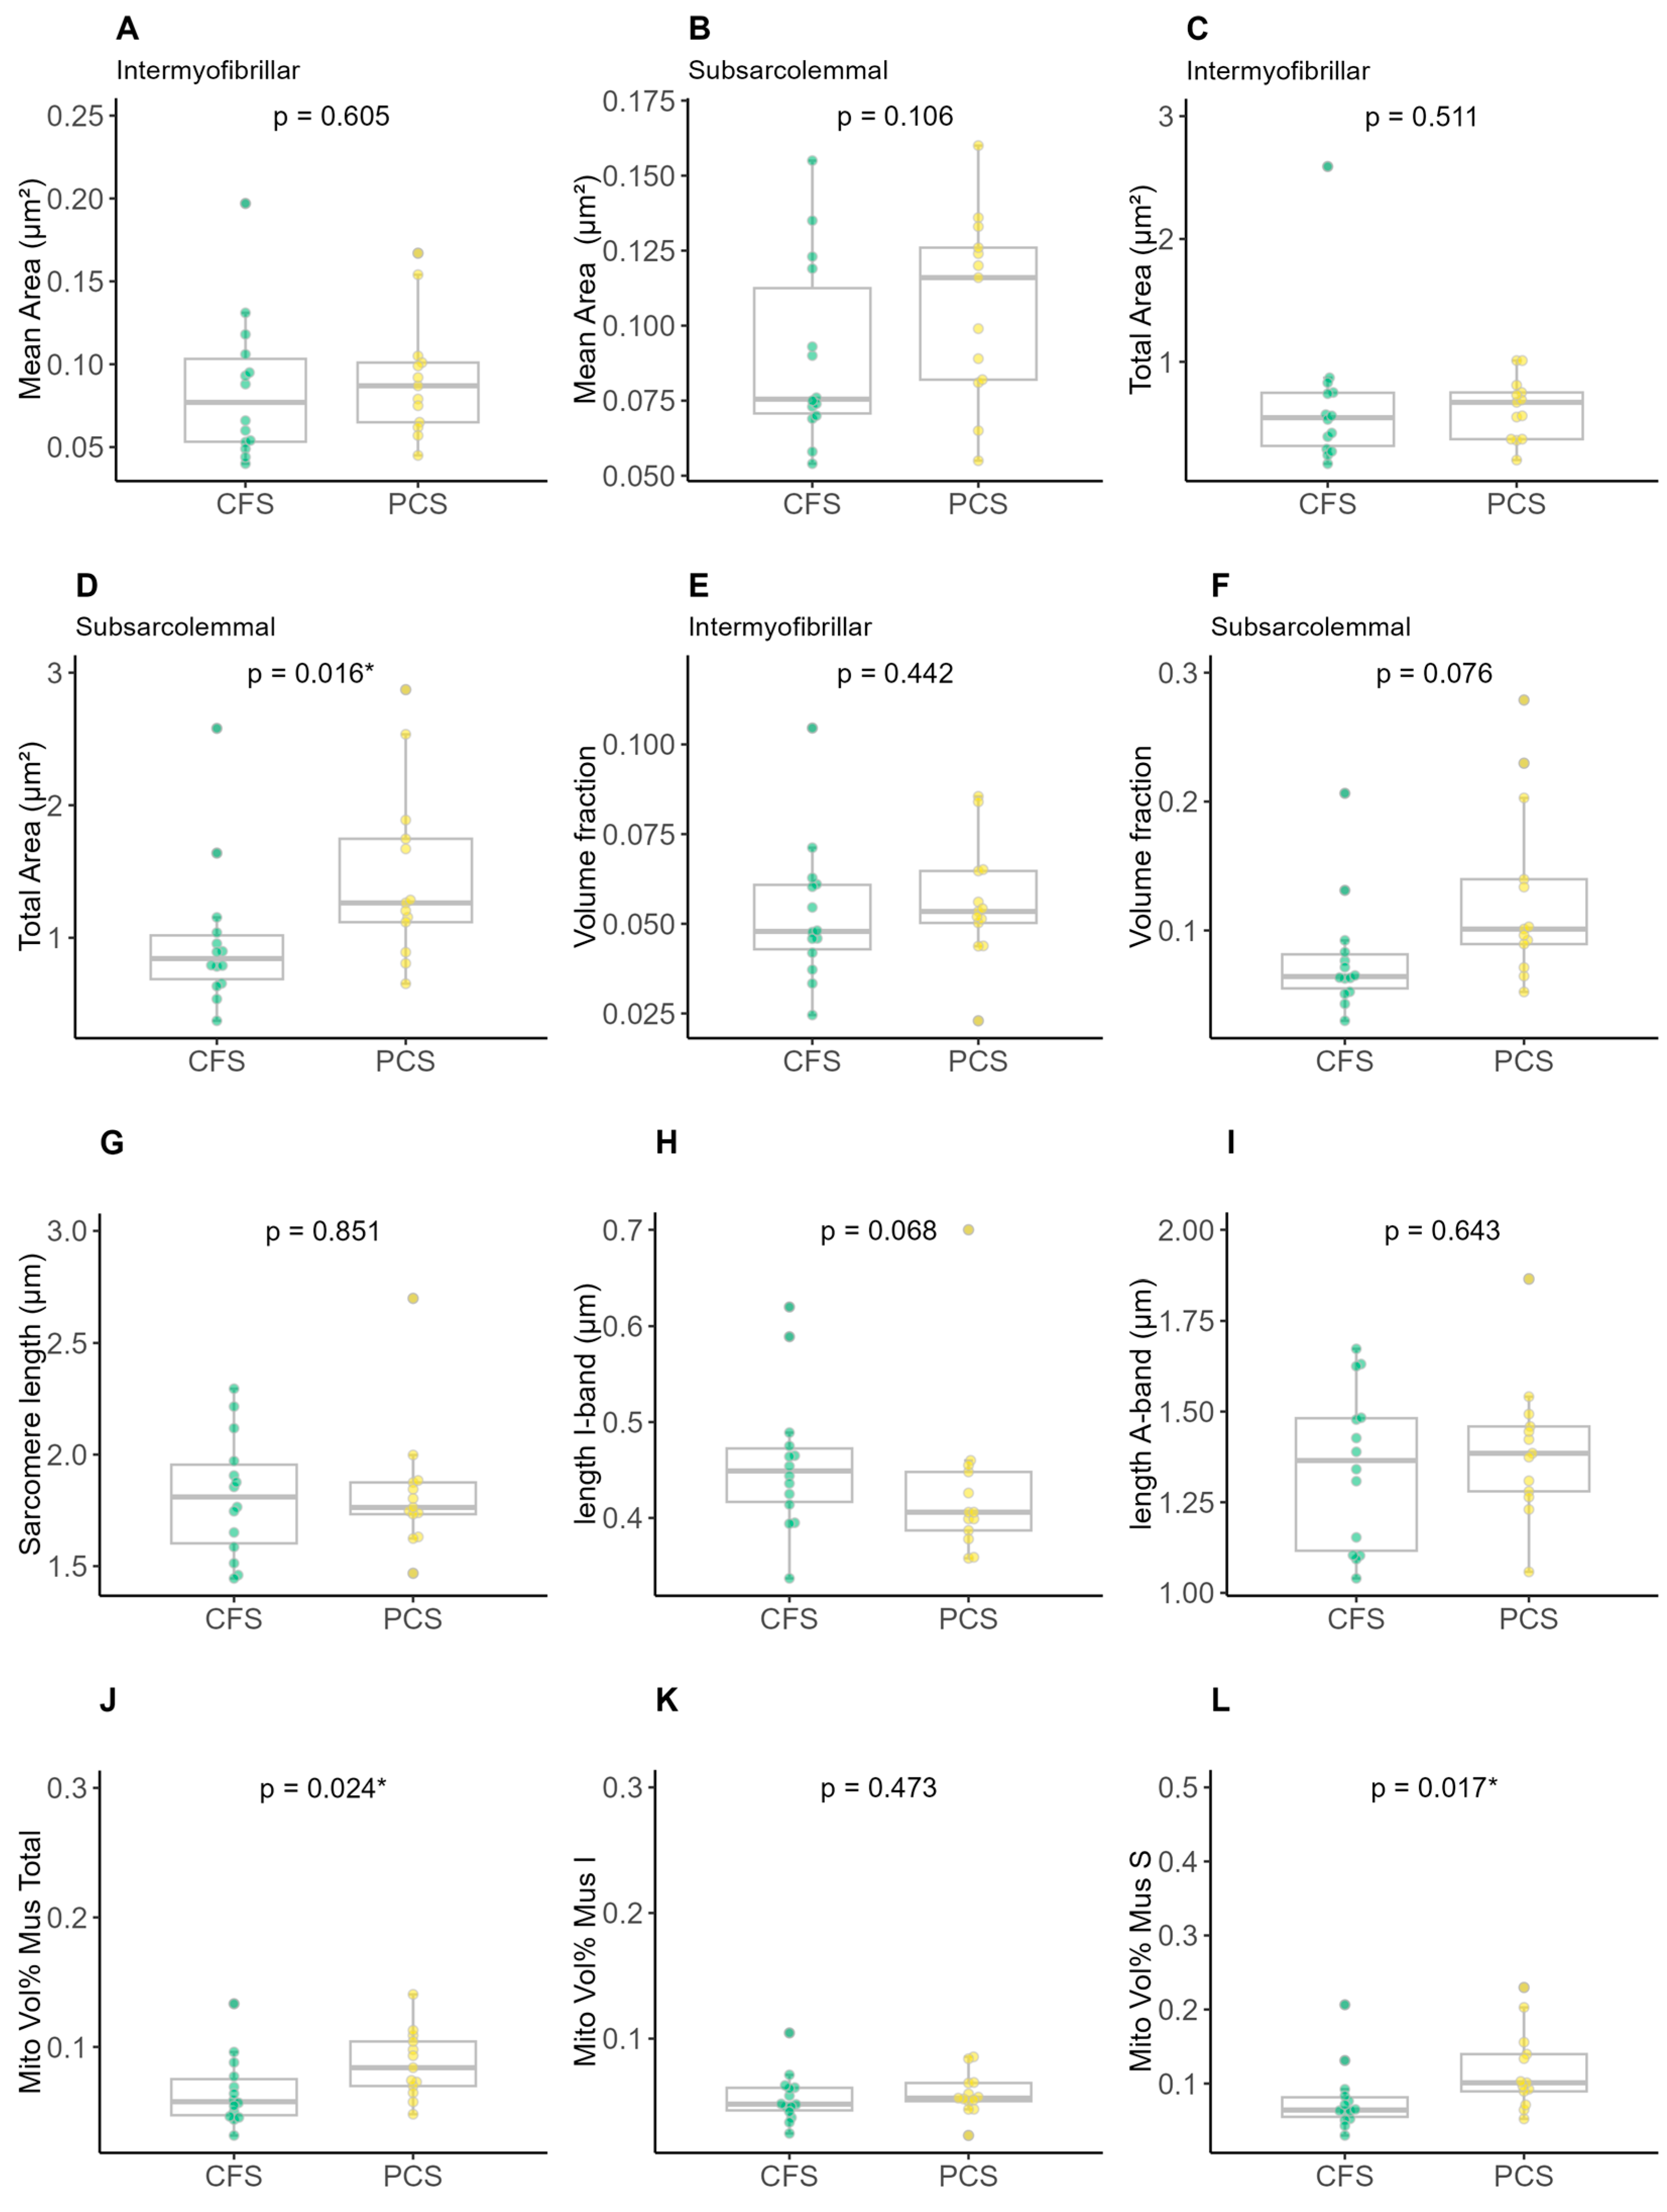
2. Results
3. Discussion
Strengths and Limitations
4. Materials and Methods
4.1. Study Population
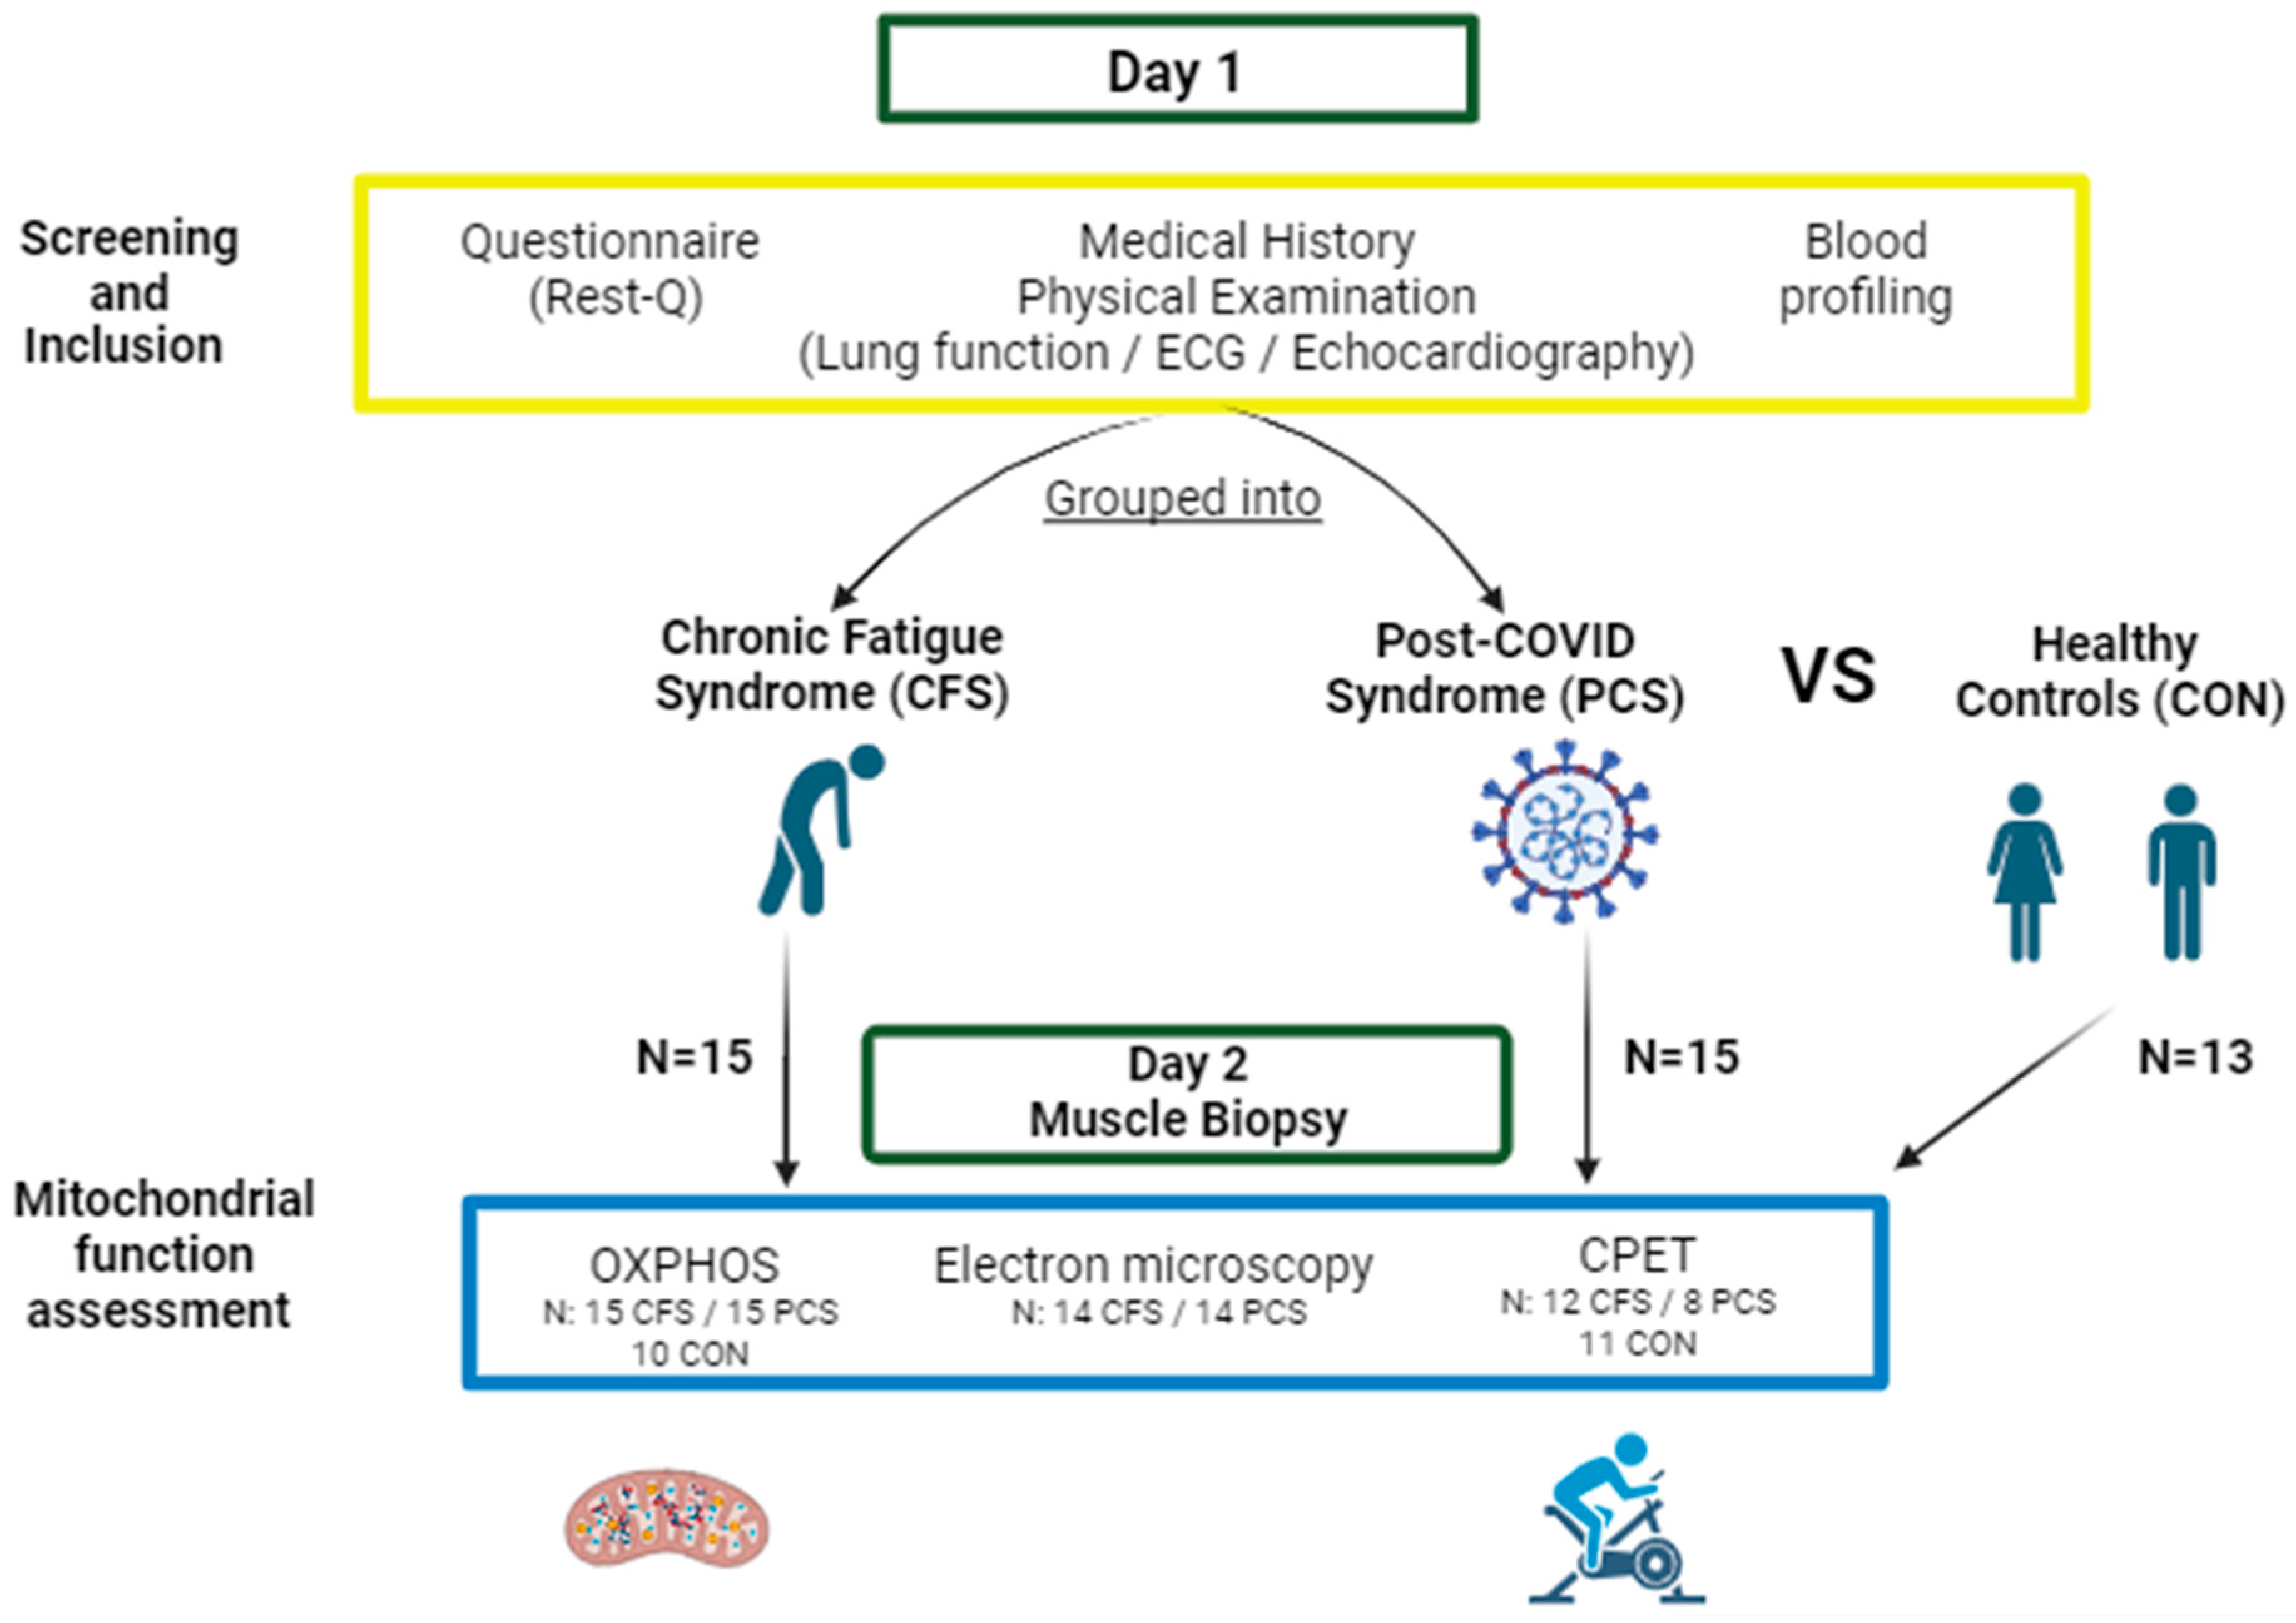
4.2. Study Design
4.3. Cardiopulmonary Exercise Test (CPET)
4.4. Skeletal Muscle Biopsy Sampling
4.5. Measurement of Mitochondrial Respiration
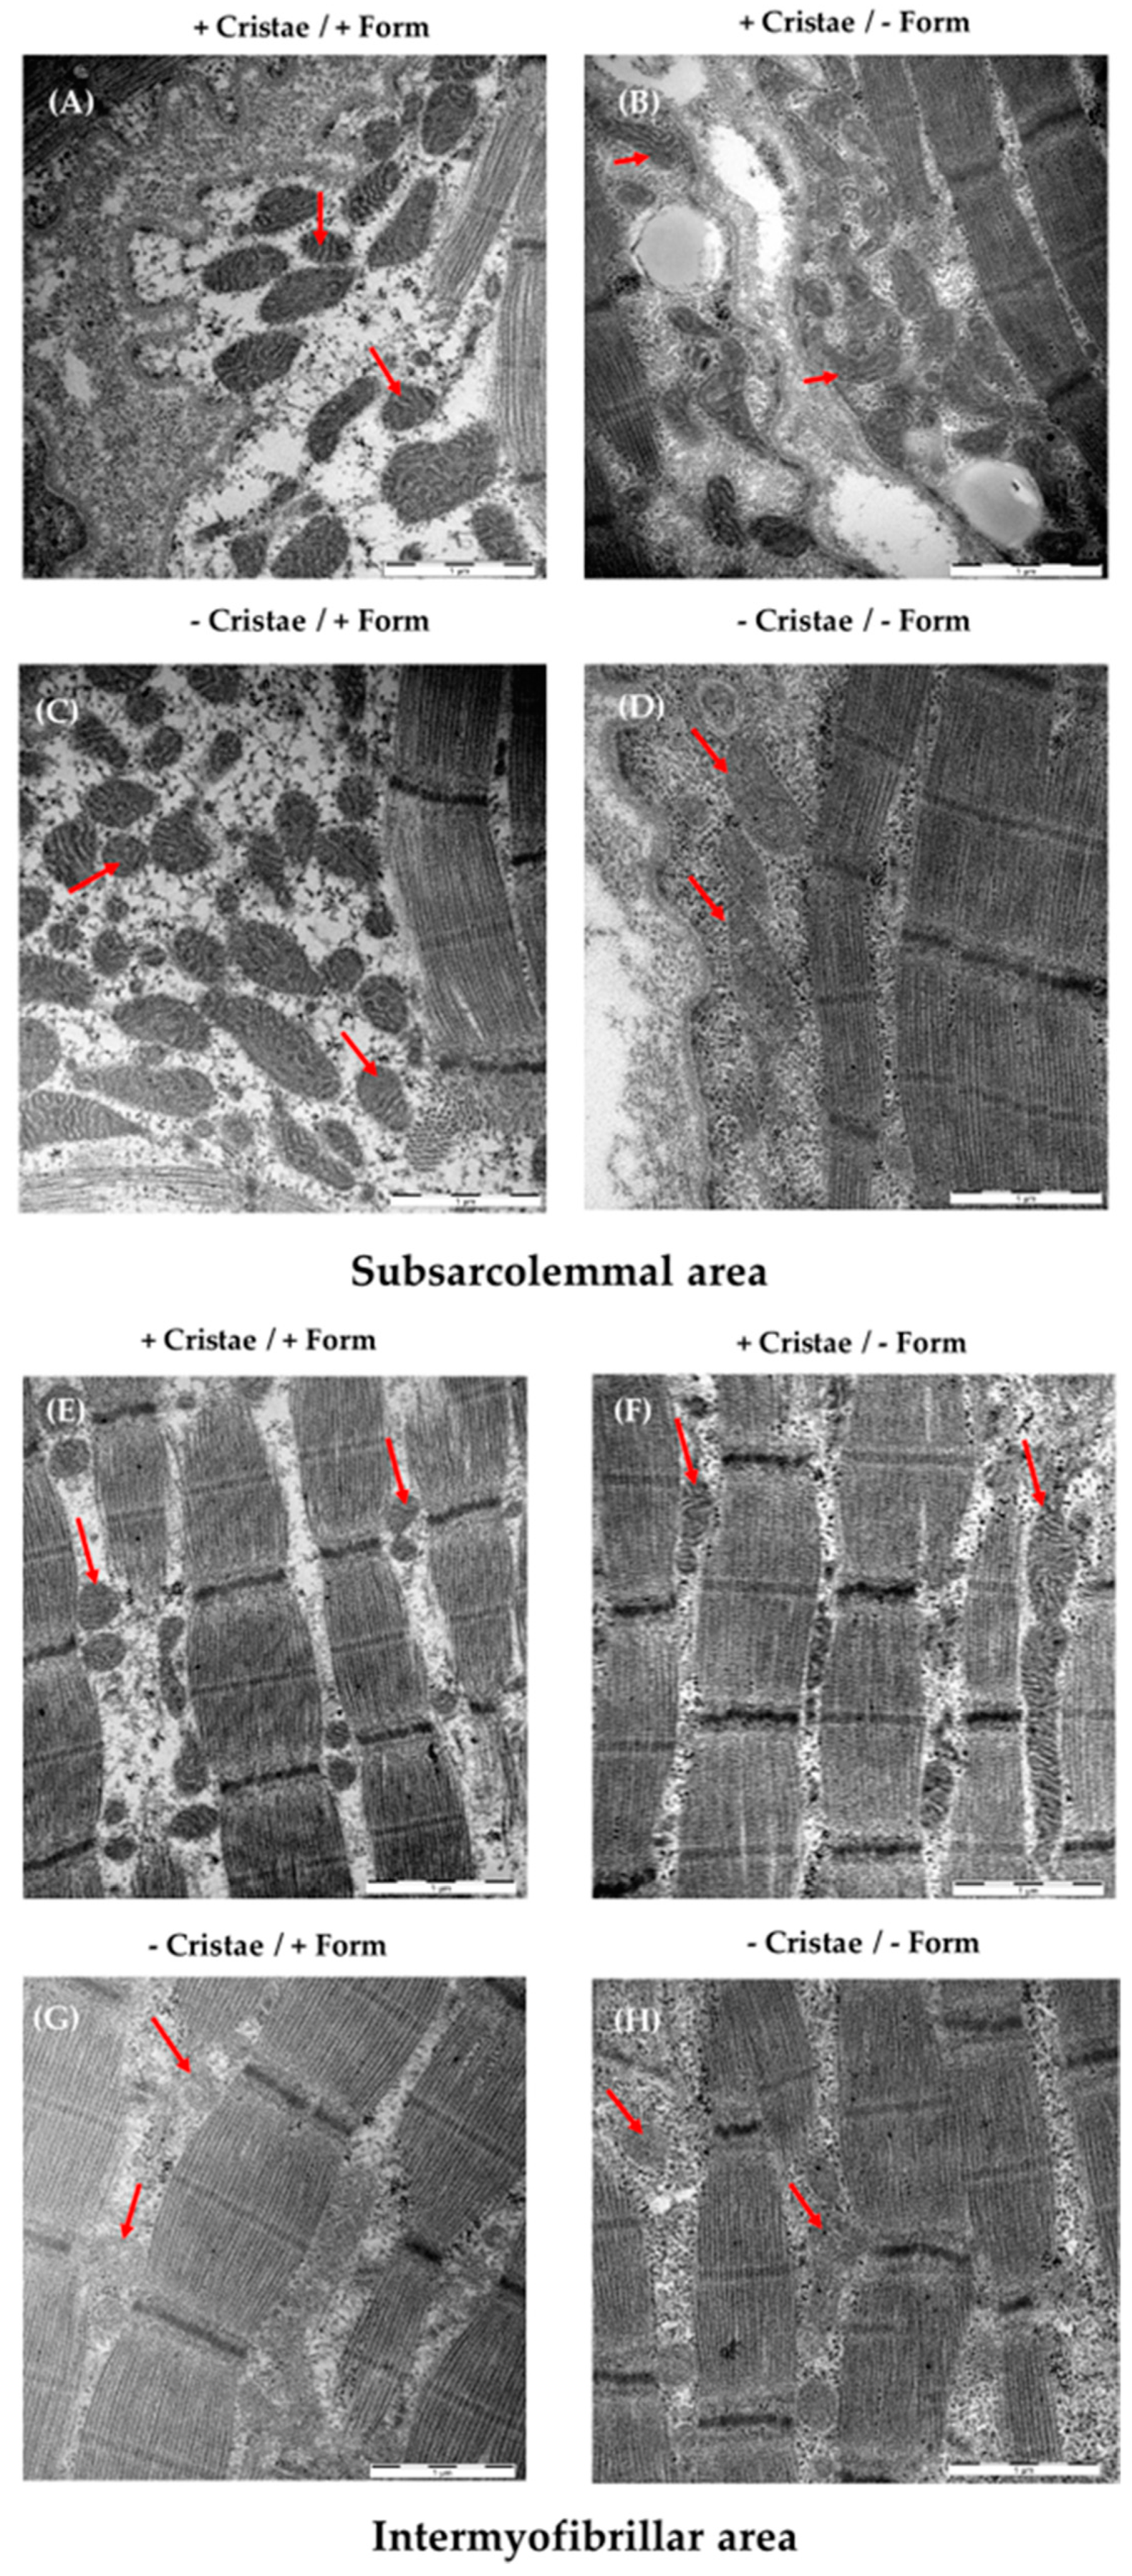
4.6. Electron Micrography of Mitochondrial Form and Cristae
4.7. Evaluation of the Image Recordings with ImageJ
- (a)
- Average length, width and circumference of mitochondria;
- (b)
- Shape of mitochondria (0 = inconspicuous, 1 = slightly changed shape, 2 = strongly changed shape, 3 = damage of mitochondrial membrane);
- (c)
- Average volume of mitochondria;
- (d)
- Volume fraction of mitochondria in skeletal muscle;
- (e)
- Surface area fraction of cristae;
- (f)
- Volume density of cristae (= cristae surface area/area of mitochondria);
- (g)
- Cristae score (0 = no sharply defined cristae, 1 = more than 50% the mitochondrial volume without cristae, 2 = more than 25% the mitochondrial volume without cristae, 3 = less than 25% the mitochondrial volume without cristae but cristae irregular, 4 = less than 25% the mitochondrial volume without cristae and regular cristae).
4.8. Statistical Analysis
5. Conclusions
Supplementary Materials
Author Contributions
Funding
Institutional Review Board Statement
Informed Consent Statement
Data Availability Statement
Acknowledgments
Conflicts of Interest
References
- San-Millán, I. The Key Role of Mitochondrial Function in Health and Disease. Antioxidants 2023, 12, 782. [Google Scholar] [CrossRef]
- Davis, R.E.; Williams, M. Mitochondrial Function and Dysfunction: An Update. J. Pharmacol. Exp. Ther. 2012, 342, 598–607. [Google Scholar] [CrossRef] [PubMed]
- Wong, T.L.; Weitzer, D.J. Long COVID and Myalgic Encephalomyelitis/Chronic Fatigue Syndrome (ME/CFS)—A Systemic Review and Comparison of Clinical Presentation and Symptomatology. Medicina 2021, 57, 418. [Google Scholar] [CrossRef] [PubMed]
- Jason, L.A.; Dorri, J.A. ME/CFS and Post-Exertional Malaise among Patients with Long COVID. Neurol. Int. 2022, 15, 1–11. [Google Scholar] [CrossRef] [PubMed]
- Wirth, K.J.; Scheibenbogen, C. Pathophysiology of skeletal muscle disturbances in Myalgic Encephalomyelitis/Chronic Fatigue Syndrome (ME/CFS). J. Transl. Med. 2021, 19, 162. [Google Scholar] [CrossRef]
- National Academies Press (US). Beyond Myalgic Encephalomyelitis/Chronic Fatigue Syndrome: Redefining an Illness; National Academies Press: Washington, DC, USA, 2015; ISBN 9780309316897. [Google Scholar]
- Lim, E.-J.; Ahn, Y.-C.; Jang, E.-S.; Lee, S.-W.; Lee, S.-H.; Son, C.-G. Systematic review and meta-analysis of the prevalence of chronic fatigue syndrome/myalgic encephalomyelitis (CFS/ME). J. Transl. Med. 2020, 18, 100. [Google Scholar] [CrossRef]
- Carruthers, B.M.; Jain, A.K.; De Meirleir, K.L.; Peterson, D.L.; Klimas, N.G.; Lerner, A.M.; Bested, A.C.; Flor-Henry, P.; Joshi, P.; Powles, A.C.P.; et al. Myalgic Encephalomyelitis/Chronic Fatigue Syndrome. J. Chronic Fatigue Syndr. 2003, 11, 7–115. [Google Scholar] [CrossRef]
- Han, Q.; Zheng, B.; Daines, L.; Sheikh, A. Long-Term Sequelae of COVID-19: A Systematic Review and Meta-Analysis of One-Year Follow-Up Studies on Post-COVID Symptoms. Pathogens 2022, 11, 269. [Google Scholar] [CrossRef]
- Sudre, C.H.; Murray, B.; Varsavsky, T.; Graham, M.S.; Penfold, R.S.; Bowyer, R.C.; Pujol, J.C.; Klaser, K.; Antonelli, M.; Canas, L.S.; et al. Attributes and predictors of long COVID. Nat. Med. 2021, 27, 626–631. [Google Scholar] [CrossRef]
- Maglietta, G.; Diodati, F.; Puntoni, M.; Lazzarelli, S.; Marcomini, B.; Patrizi, L.; Caminiti, C. Prognostic Factors for Post-COVID-19 Syndrome: A Systematic Review and Meta-Analysis. J. Clin. Med. 2022, 11, 1541. [Google Scholar] [CrossRef]
- Peter, R.S.; Nieters, A.; Kräusslich, H.-G.; Brockmann, S.O.; Göpel, S.; Kindle, G.; Merle, U.; Steinacker, J.M.; Rothenbacher, D.; Kern, W.V. Post-acute sequelae of covid-19 six to 12 months after infection: Population based study. BMJ 2022, 379, e071050. [Google Scholar] [CrossRef] [PubMed]
- Kedor, C.; Freitag, H.; Meyer-Arndt, L.; Wittke, K.; Hanitsch, L.G.; Zoller, T.; Steinbeis, F.; Haffke, M.; Rudolf, G.; Heidecker, B.; et al. A prospective observational study of post-COVID-19 chronic fatigue syndrome following the first pandemic wave in Germany and biomarkers associated with symptom severity. Nat. Commun. 2022, 13, 5104. [Google Scholar] [CrossRef]
- Tokumasu, K.; Honda, H.; Sunada, N.; Sakurada, Y.; Matsuda, Y.; Yamamoto, K.; Nakano, Y.; Hasegawa, T.; Yamamoto, Y.; Otsuka, Y.; et al. Clinical Characteristics of Myalgic Encephalomyelitis/Chronic Fatigue Syndrome (ME/CFS) Diagnosed in Patients with Long COVID. Medicina 2022, 58, 850. [Google Scholar] [CrossRef]
- Holden, S.; Maksoud, R.; Eaton-Fitch, N.; Cabanas, H.; Staines, D.; Marshall-Gradisnik, S. A systematic review of mitochondrial abnormalities in myalgic encephalomyelitis/chronic fatigue syndrome/systemic exertion intolerance disease. J. Transl. Med. 2020, 18, 290. [Google Scholar] [CrossRef]
- Tomas, C.; Brown, A.; Strassheim, V.; Elson, J.L.; Newton, J.; Manning, P. Cellular bioenergetics is impaired in patients with chronic fatigue syndrome. PLoS ONE 2017, 12, e0186802. [Google Scholar] [CrossRef] [PubMed]
- Booth, N.E.; Myhill, S.; McLaren-Howard, J. Mitochondrial dysfunction and the pathophysiology of Myalgic Encephalomyelitis/Chronic Fatigue Syndrome (ME/CFS). Int. J. Clin. Exp. Med. 2012, 5, 208–220. [Google Scholar]
- Kabekkodu, S.P.; Chakrabarty, S.; Jayaram, P.; Mallya, S.; Thangaraj, K.; Singh, K.K.; Satyamoorthy, K. Severe acute respiratory syndrome coronaviruses contributing to mitochondrial dysfunction: Implications for post-COVID complications. Mitochondrion 2023, 69, 43–56. [Google Scholar] [CrossRef] [PubMed]
- Lane, R.J.M.; Barrett, M.C.; Woodrow, D.; Moss, J.; Fletcher, R.; Archard, L.C. Muscle fibre characteristics and lactate responses to exercise in chronic fatigue syndrome. J. Neurol. Neurosurg. Psychiatry 1998, 64, 362–367. [Google Scholar] [CrossRef]
- Tomas, C.; Brown, A.E.; Newton, J.L.; Elson, J.L. Mitochondrial complex activity in permeabilised cells of chronic fatigue syndrome patients using two cell types. PeerJ 2019, 7, e6500. [Google Scholar] [CrossRef]
- Morris, G.; Maes, M. Mitochondrial dysfunctions in myalgic encephalomyelitis/chronic fatigue syndrome explained by activated immuno-inflammatory, oxidative and nitrosative stress pathways. Metab. Brain Dis. 2014, 29, 19–36. [Google Scholar] [CrossRef]
- Wong, R.; Lopaschuk, G.; Zhu, G.; Walker, D.; Catellier, D.; Burton, D.; Teo, K.; Collins-Nakai, R.; Montague, T. Skeletal muscle metabolism in the chronic fatigue syndrome. In vivo assessment by 31P nuclear magnetic resonance spectroscopy. Chest 1992, 102, 1716–1722. [Google Scholar] [CrossRef]
- McCully, K.K.; Natelson, B.H.; Iotti, S.; Sisto, S.; Leigh, J.S. Reduced oxidative muscle metabolism in chronic fatigue syndrome. Muscle Nerve 1996, 19, 621–625. [Google Scholar] [CrossRef]
- Lawson, N.; Hsieh, C.-H.; March, D.; Wang, X. Elevated Energy Production in Chronic Fatigue Syndrome Patients. J. Nat. Sci. 2016, 2, e221. [Google Scholar] [PubMed]
- Harrington, J.S.; Ryter, S.W.; Plataki, M.; Price, D.R.; Choi, A.M.K. Mitochondria in health, disease, and aging. Physiol. Rev. 2023, 103, 2349–2422. [Google Scholar] [CrossRef] [PubMed]
- Pileggi, C.A.; Parmar, G.; Elkhatib, H.; Stewart, C.M.; Alecu, I.; Côté, M.; Bennett, S.A.L.; Sandhu, J.K.; Cuperlovic-Culf, M.; Harper, M.-E. The SARS-CoV-2 spike glycoprotein interacts with MAO-B and impairs mitochondrial energetics. Curr. Res. Neurobiol. 2023, 5, 100112. [Google Scholar] [CrossRef] [PubMed]
- Guarnieri, J.W.; Dybas, J.M.; Fazelinia, H.; Kim, M.S.; Frere, J.; Zhang, Y.; Albrecht, Y.S.; Murdock, D.G.; Angelin, A.; Singh, L.N.; et al. Core mitochondrial genes are down-regulated during SARS-CoV-2 infection of rodent and human hosts. Sci. Transl. Med. 2023, 15, eabq1533. [Google Scholar] [CrossRef]
- Aschman, T.; Wyler, E.; Baum, O.; Hentschel, A.; Rust, R.; Legler, F.; Preusse, C.; Meyer-Arndt, L.; Büttnerova, I.; Förster, A.; et al. Post-COVID exercise intolerance is associated with capillary alterations and immune dysregulations in skeletal muscles. Acta Neuropathol. Commun. 2023, 11, 193. [Google Scholar] [CrossRef]
- Castro-Marrero, J.; Zacares, M.; Almenar-Pérez, E.; Alegre-Martín, J.; Oltra, E. Complement Component C1q as a Potential Diagnostic Tool for Myalgic Encephalomyelitis/Chronic Fatigue Syndrome Subtyping. J. Clin. Med. 2021, 10, 4171. [Google Scholar] [CrossRef]
- Signorile, A.; De Rasmo, D. Mitochondrial Complex I, a Possible Sensible Site of cAMP Pathway in Aging. Antioxidants 2023, 12, 221. [Google Scholar] [CrossRef]
- Reinecke, F.; Smeitink, J.A.M.; van der Westhuizen, F.H. OXPHOS gene expression and control in mitochondrial disorders. Biochim. Biophys. Acta (BBA) Mol. Basis Dis. 2009, 1792, 1113–1121. [Google Scholar] [CrossRef]
- Koves, T.R.; Noland, R.C.; Bates, A.L.; Henes, S.T.; Muoio, D.M.; Cortright, R.N. Subsarcolemmal and intermyofibrillar mitochondria play distinct roles in regulating skeletal muscle fatty acid metabolism. Am. J. Physiol. Cell Physiol. 2005, 288, C1074–C1082. [Google Scholar] [CrossRef]
- Krieger, D.A.; Tate, C.A.; McMillin-Wood, J.; Booth, F.W.; Porplycia, D.; Lau, G.Y.; McDonald, J.; Chen, Z.; Richards, J.G.; Moyes, C.D.; et al. Populations of rat skeletal muscle mitochondria after exercise and immobilization. J. Appl. Physiol. Respir. Environ. Exerc. Physiol. 1980, 48, 23–28. [Google Scholar] [CrossRef] [PubMed]
- Holmuhamedov, E.L.; Oberlin, A.; Short, K.; Terzic, A.; Jahangir, A. Cardiac subsarcolemmal and interfibrillar mitochondria display distinct responsiveness to protection by diazoxide. PLoS ONE 2012, 7, e44667. [Google Scholar] [CrossRef] [PubMed]
- Schwarzer, M.; Schrepper, A.; Amorim, P.A.; Osterholt, M.; Doenst, T. Pressure overload differentially affects respiratory capacity in interfibrillar and subsarcolemmal mitochondria. J. Physiol. Heart Circ. Physiol. 2013, 304, H529–H537. [Google Scholar] [CrossRef] [PubMed]
- Ferreira, R.; Vitorino, R.; Alves, R.M.P.; Appell, H.J.; Powers, S.K.; Duarte, J.A.; Amado, F. Subsarcolemmal and intermyofibrillar mitochondria proteome differences disclose functional specializations in skeletal muscle. Proteomics 2010, 10, 3142–3154. [Google Scholar] [CrossRef] [PubMed]
- Hoppeler, H.; Lindstedt, S.L. Malleability of skeletal muscle in overcoming limitations: Structural elements. J. Exp. Biol. 1985, 115, 355–364. [Google Scholar] [CrossRef] [PubMed]
- Colosio, M.; Brocca, L.; Gatti, M.F.; Neri, M.; Crea, E.; Cadile, F.; Canepari, M.; Pellegrino, M.A.; Polla, B.; Porcelli, S.; et al. Structural and functional impairments of skeletal muscle in patients with postacute sequelae of SARS-CoV-2 infection. J. Appl. Physiol. 2023, 135, 902–917. [Google Scholar] [CrossRef]
- Carruthers, B.M.; Van De Sande, M.I.; De Meirleir, K.L.; Klimas, N.G.; Broderick, G.; Mitchell, T.; Staines, D.; Powles, A.C.; Speight, N.; Vallings, R.; et al. Myalgic encephalomyelitis: International Consensus Criteria. J. Intern. Med. 2011, 270, 327–338. [Google Scholar] [CrossRef]
- Buck, E.; Zügel, M.; Schumann, U.; Merz, T.; Gumpp, A.M.; Witting, A.; Steinacker, J.M.; Landwehrmeyer, G.B.; Weydt, P.; Calzia, E.; et al. High-resolution respirometry of fine-needle muscle biopsies in pre-manifest Huntington’s disease expansion mutation carriers shows normal mitochondrial respiratory function. PLoS ONE 2017, 12, e0175248. [Google Scholar] [CrossRef]
- Shanely, R.A.; Zwetsloot, K.A.; Triplett, N.T.; Meaney, M.P.; Farris, G.E.; Nieman, D.C. Human skeletal muscle biopsy procedures using the modified Bergström technique. J. Vis. Exp. 2014, 91, e51812. [Google Scholar] [CrossRef]
- R Core Team. R: A Language and Environment for Statistical Computing; R Foundation for Statistical Computing: Vienna, Austria, 2023. [Google Scholar]
- Venables, W.N.; Ripley, B.D. Modern Applied Statistics with S, 4th ed.; Springer: New York, NY, USA, 2011; ISBN 978-1-4419-3008-8. [Google Scholar]
- Benjamini, Y.; Hochberg, Y. Controlling the False Discovery Rate: A Practical and Powerful Approach to Multiple Testing. J. R. Stat. Soc. Ser. B Methodol. 1995, 57, 289–300. [Google Scholar] [CrossRef]


| HC (7f/6m) | CFS (10f/5m) | PCS (13f/2m) | |||||||||
|---|---|---|---|---|---|---|---|---|---|---|---|
| M | SD | Median | M | SD | Median | M | SD | Median | t | p | |
| Age | 36.23 | 13.17 | 32.00 | 36.13 | 11.65 | 33.50 | 40.47 | 13.21 | 38.00 | 0.56 | 0.5762 |
| Body mass (kg) | 76.87 | 17.68 | 78.15 | 76.43 | 12.72 | 73.10 | 62.58 | 15.85 | 59.80 | 3.85 | 0.0302 * |
| Body height (cm) | 173.92 | 12.06 | 175.00 | 174.07 | 10.37 | 172.90 | 169.07 | 12.06 | 175.00 | 1.20 | 0.3129 |
| Body mass index (kg/m2) | 25.10 | 4.51 | 24.45 | 25.04 | 3.57 | 24.30 | 21.85 | 3.85 | 21.30 | 3.07 | 0.0586 |
| Body fat (%) | 21.03 | 4.44 | 21.55 | 32.92 | 8.33 | 32.95 | 22.87 | 7.02 | 21.55 | 5.57 | 0.0114 * |
| Absolute VO2peak (L/min) | 2.35 | 0.55 | 2.36 | 1.94 | 0.94 | 1.75 | 1.36 | 0.71 | 1.25 | 4.13 | 0.0265 * |
| Relative VO2peak (mL/min/kg) | 30.94 | 4.87 | 33.00 | 24.97 | 9.93 | 22.46 | 21.65 | 6.93 | 22.36 | 3.90 | 0.0317 * |
| CCC-Score | 19.00 | 5.91 | 17.50 | 18.54 | 7.11 | 18.00 | 0.03 | 0.8621 | |||
| Time since disease diagnosis (months) | 35.20 | 44.06 | 23.00 | 20.47 | 15.56 | 15.00 | 1.49 | 0.2322 | |||
| Muscle mass (%) | 29.28 | 13.41 | 32.72 | 39.80 | 8.27 | 40.88 | 4.29 | 0.0550 | |||
| Parameter 1 | Parameter 2 | r | CI | CI_Low | CI_High | t | p | N |
|---|---|---|---|---|---|---|---|---|
| VO2_peak | CriSco_I_m | −0.27 | 0.95 | −0.65 | 0.23 | −1.11 | 0.42 | 18 |
| VO2_peak | CriSco_S_m | 0.08 | 0.95 | −0.40 | 0.53 | 0.31 | 0.82 | 18 |
| VO2_peak | Form_S_m | 0.41 | 0.95 | −0.07 | 0.73 | 1.78 | 0.28 | 18 |
| VO2_peak | Form_I_m | 0.04 | 0.95 | −0.44 | 0.50 | 0.16 | 0.88 | 18 |
| VO2_peak | CA_I.x | 0.23 | 0.95 | −0.16 | 0.56 | 1.20 | 0.40 | 27 |
| CriSco_I_m | CriSco_S_m | 0.70 | 0.95 | 0.43 | 0.85 | 4.86 | 0.00 | 27 |
| CriSco_I_m | Form_S_m | 0.35 | 0.95 | −0.04 | 0.64 | 1.85 | 0.28 | 27 |
| CriSco_I_m | Form_I_m | 0.26 | 0.95 | −0.13 | 0.58 | 1.35 | 0.40 | 27 |
| CriSco_I_m | CA_I.x | −0.11 | 0.95 | −0.47 | 0.28 | −0.54 | 0.68 | 27 |
| CriSco_S_m | Form_S_m | 0.51 | 0.95 | 0.16 | 0.74 | 2.94 | 0.05 | 27 |
| CriSco_S_m | Form_I_m | 0.24 | 0.95 | −0.15 | 0.57 | 1.24 | 0.40 | 27 |
| CriSco_S_m | CA_I.x | −0.27 | 0.95 | −0.59 | 0.12 | −1.41 | 0.40 | 27 |
| Form_S_m | Form_I_m | 0.38 | 0.95 | 0.00 | 0.67 | 2.08 | 0.24 | 27 |
| Form_S_m | CA_I.x | −0.16 | 0.95 | −0.51 | 0.24 | −0.80 | 0.54 | 27 |
| Form_I_m | CA_I.x | 0.20 | 0.95 | −0.19 | 0.54 | 1.05 | 0.42 | 27 |
Disclaimer/Publisher’s Note: The statements, opinions and data contained in all publications are solely those of the individual author(s) and contributor(s) and not of MDPI and/or the editor(s). MDPI and/or the editor(s) disclaim responsibility for any injury to people or property resulting from any ideas, methods, instructions or products referred to in the content. |
© 2024 by the authors. Licensee MDPI, Basel, Switzerland. This article is an open access article distributed under the terms and conditions of the Creative Commons Attribution (CC BY) license (https://creativecommons.org/licenses/by/4.0/).
Share and Cite
Bizjak, D.A.; Ohmayer, B.; Buhl, J.L.; Schneider, E.M.; Walther, P.; Calzia, E.; Jerg, A.; Matits, L.; Steinacker, J.M. Functional and Morphological Differences of Muscle Mitochondria in Chronic Fatigue Syndrome and Post-COVID Syndrome. Int. J. Mol. Sci. 2024, 25, 1675. https://doi.org/10.3390/ijms25031675
Bizjak DA, Ohmayer B, Buhl JL, Schneider EM, Walther P, Calzia E, Jerg A, Matits L, Steinacker JM. Functional and Morphological Differences of Muscle Mitochondria in Chronic Fatigue Syndrome and Post-COVID Syndrome. International Journal of Molecular Sciences. 2024; 25(3):1675. https://doi.org/10.3390/ijms25031675
Chicago/Turabian StyleBizjak, Daniel Alexander, Birgit Ohmayer, Jasmine Leonike Buhl, Elisabeth Marion Schneider, Paul Walther, Enrico Calzia, Achim Jerg, Lynn Matits, and Jürgen Michael Steinacker. 2024. "Functional and Morphological Differences of Muscle Mitochondria in Chronic Fatigue Syndrome and Post-COVID Syndrome" International Journal of Molecular Sciences 25, no. 3: 1675. https://doi.org/10.3390/ijms25031675
APA StyleBizjak, D. A., Ohmayer, B., Buhl, J. L., Schneider, E. M., Walther, P., Calzia, E., Jerg, A., Matits, L., & Steinacker, J. M. (2024). Functional and Morphological Differences of Muscle Mitochondria in Chronic Fatigue Syndrome and Post-COVID Syndrome. International Journal of Molecular Sciences, 25(3), 1675. https://doi.org/10.3390/ijms25031675