
Investigating USP42 Mutation as Underlying Cause of Familial Non-Medullary Thyroid Carcinoma

 , ,
, ,  , ,
, ,  and
and 
Abstract

1. Introduction
2. Results
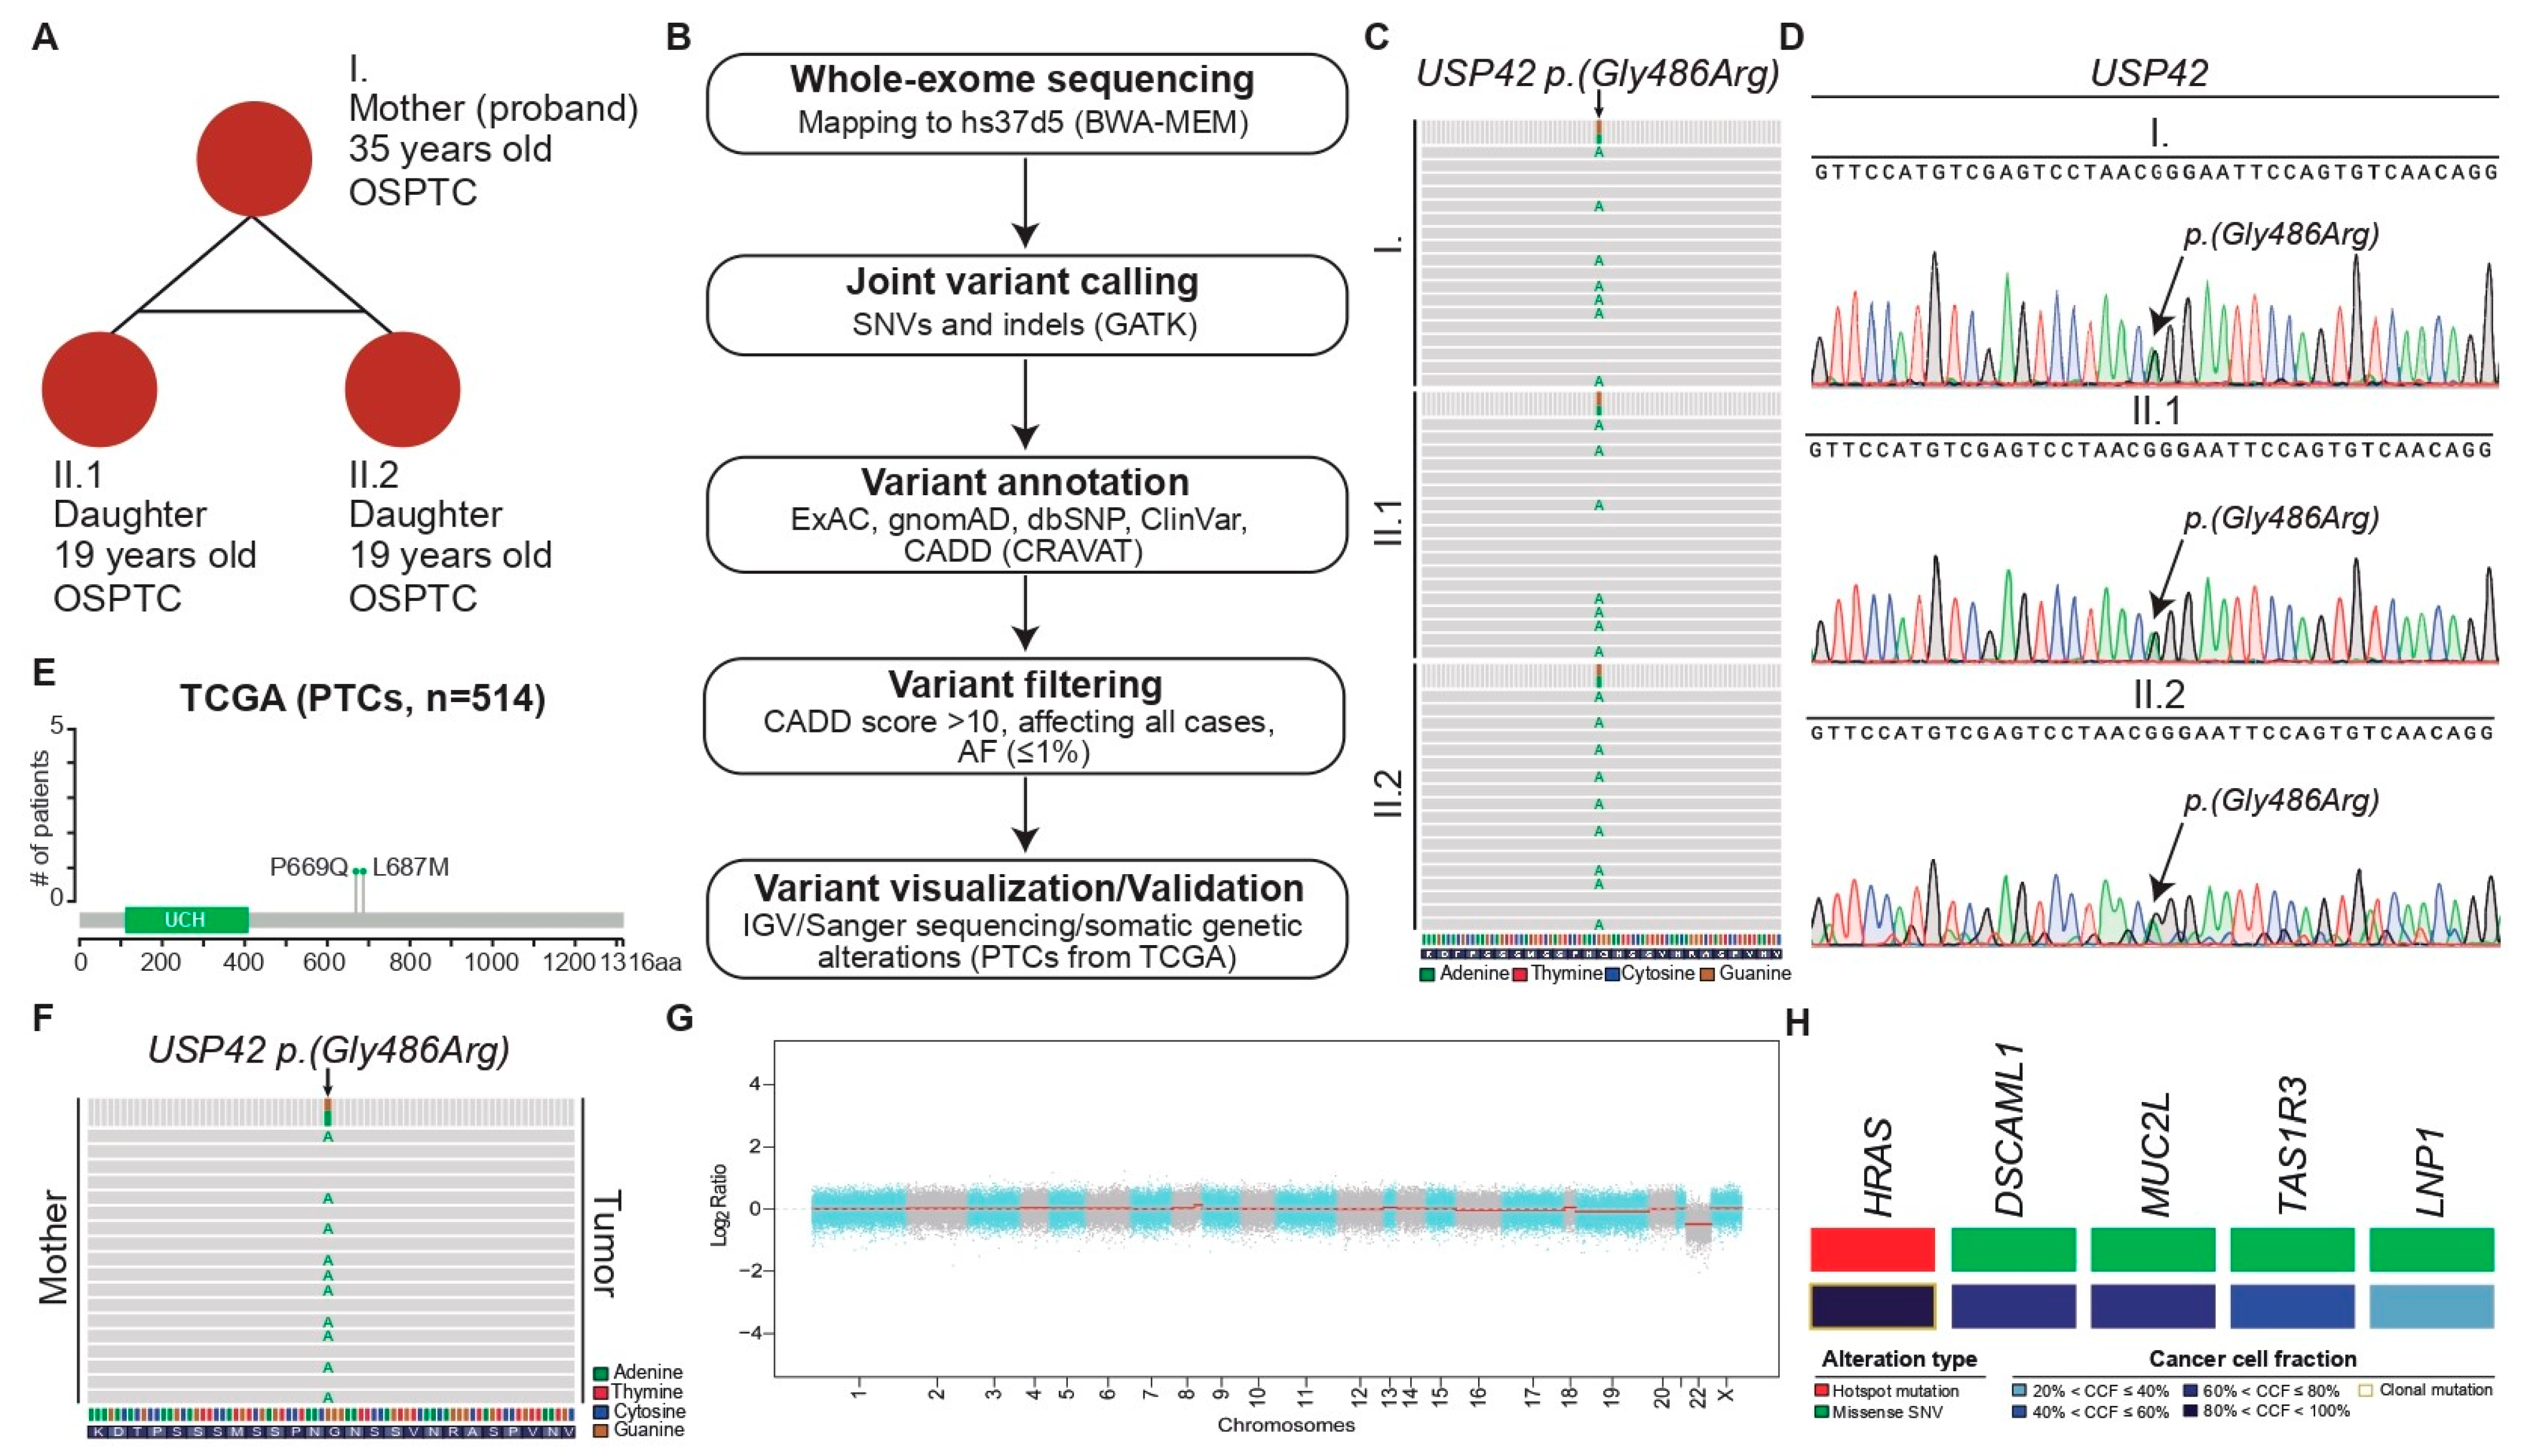
2.1. Case Report
2.2. Molecular Studies
2.2.1. USP42 Missense Mutation Validation
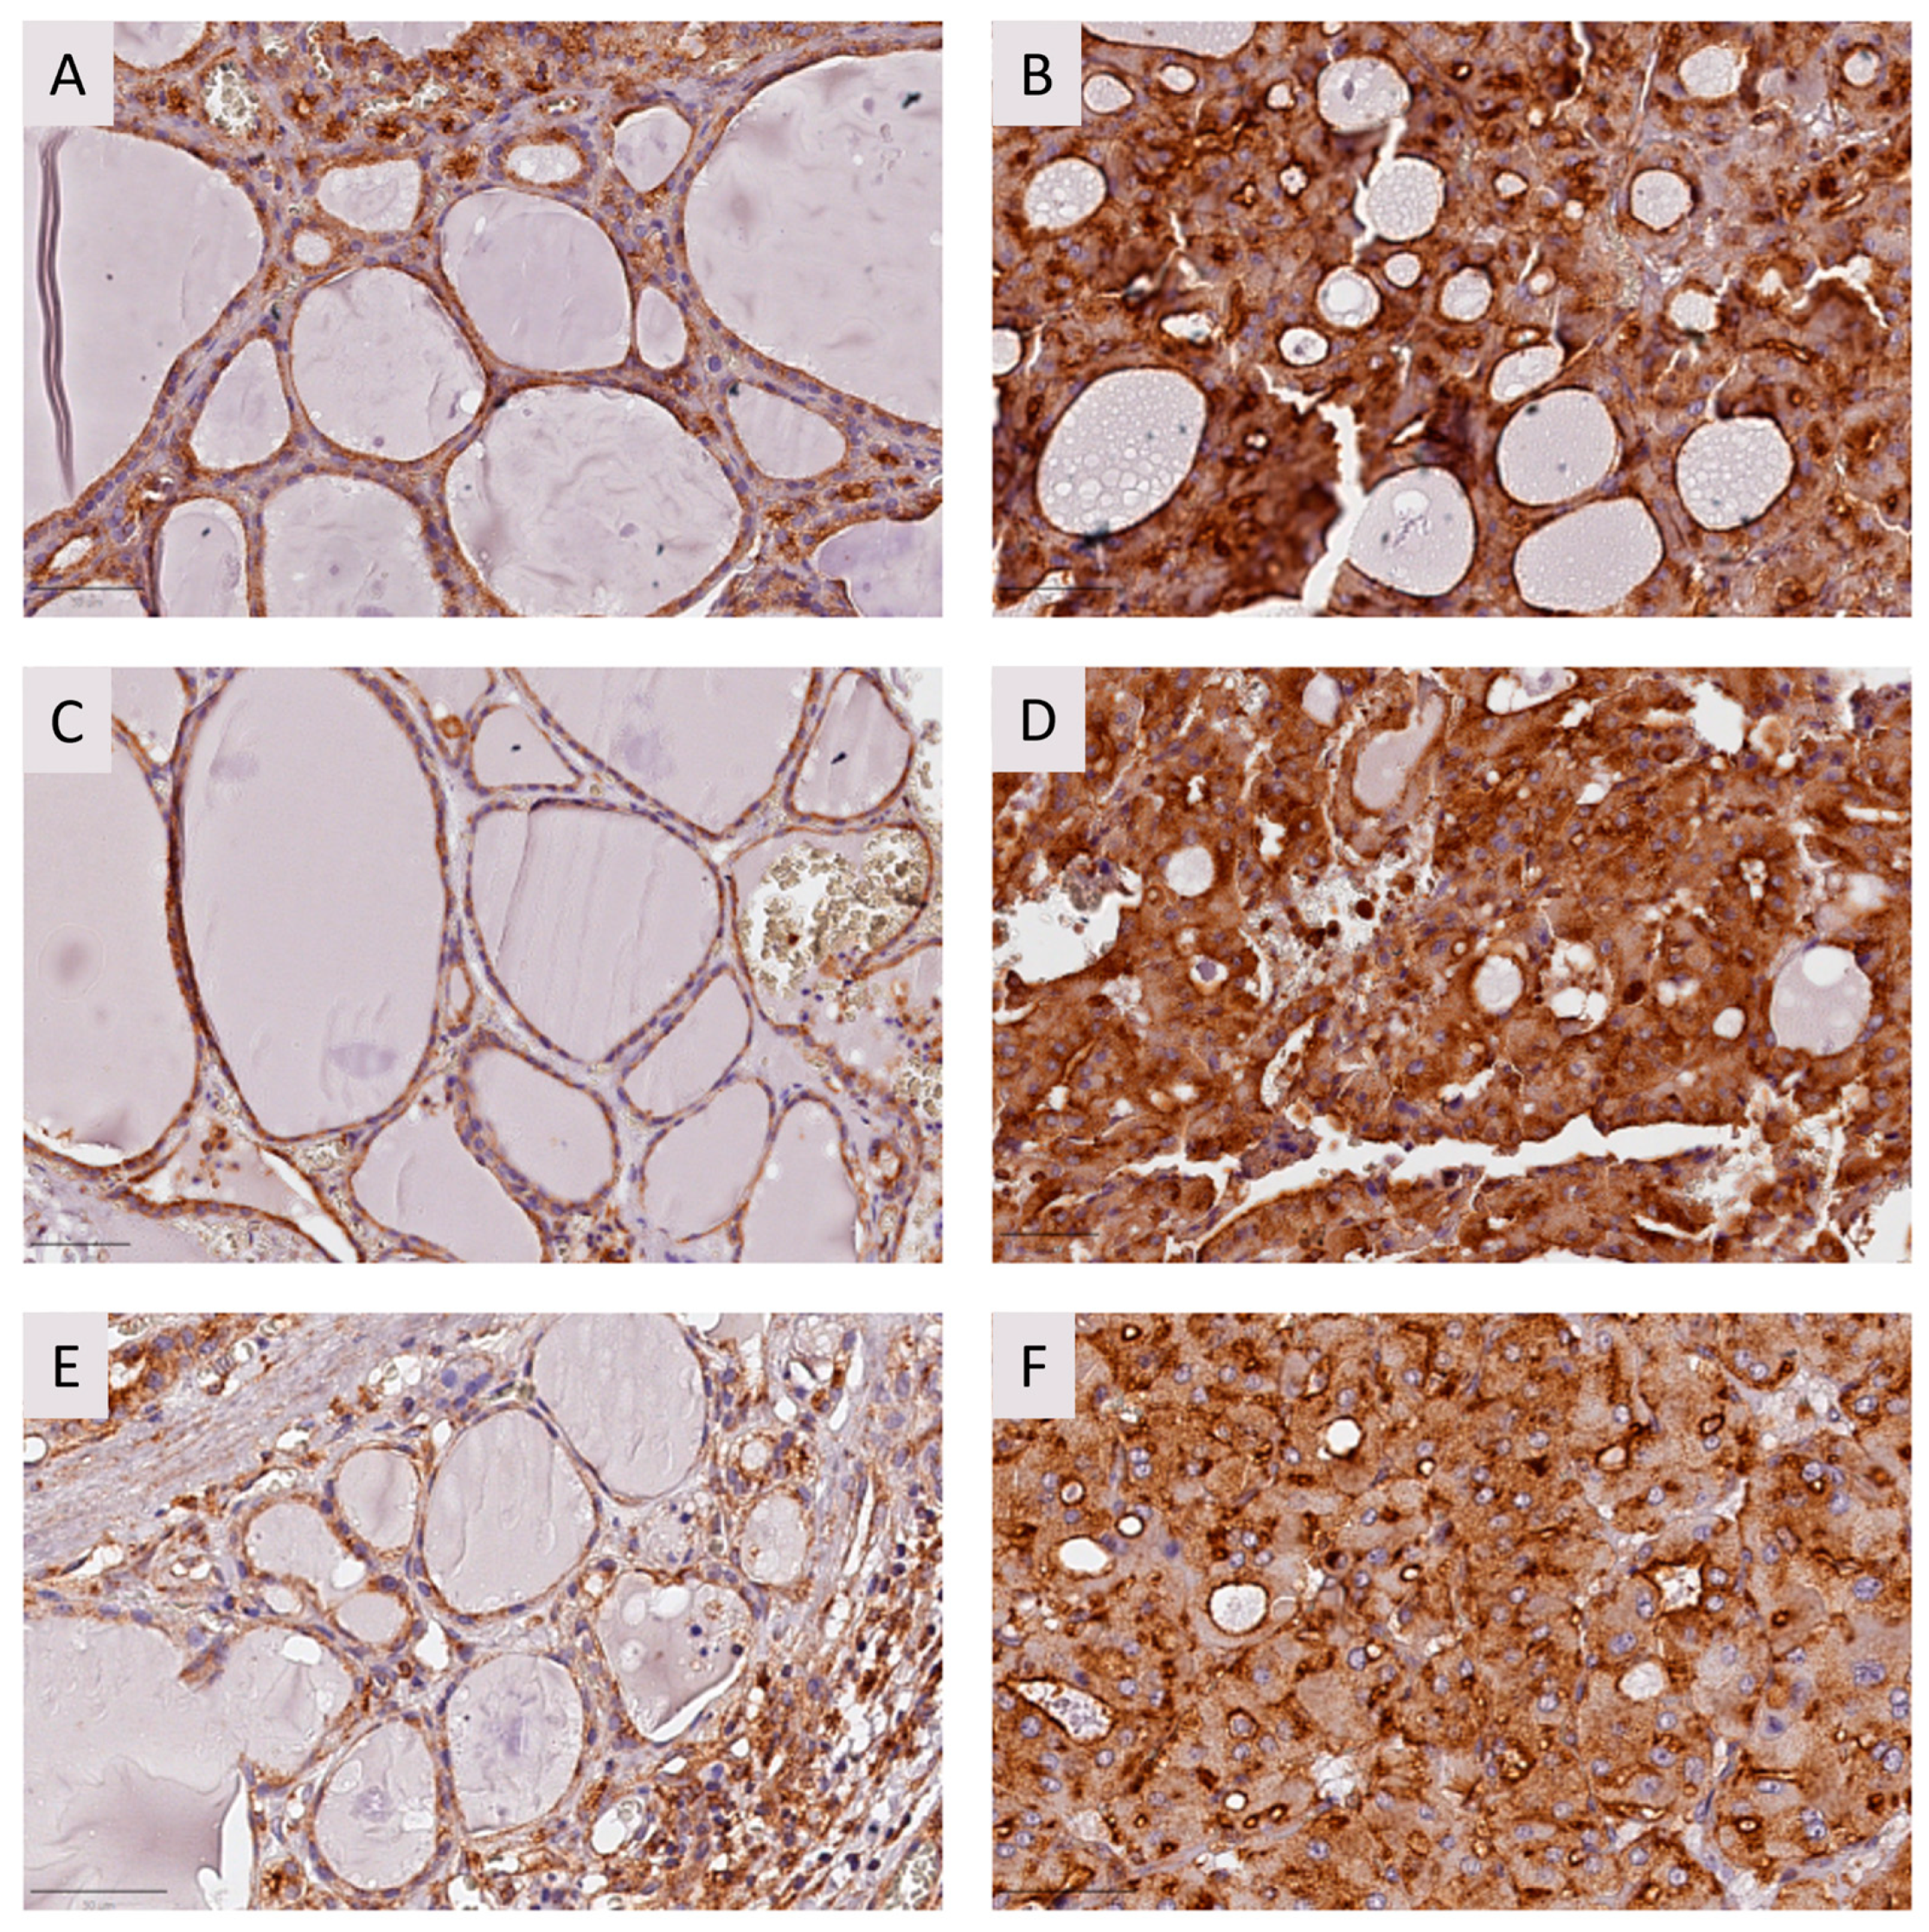
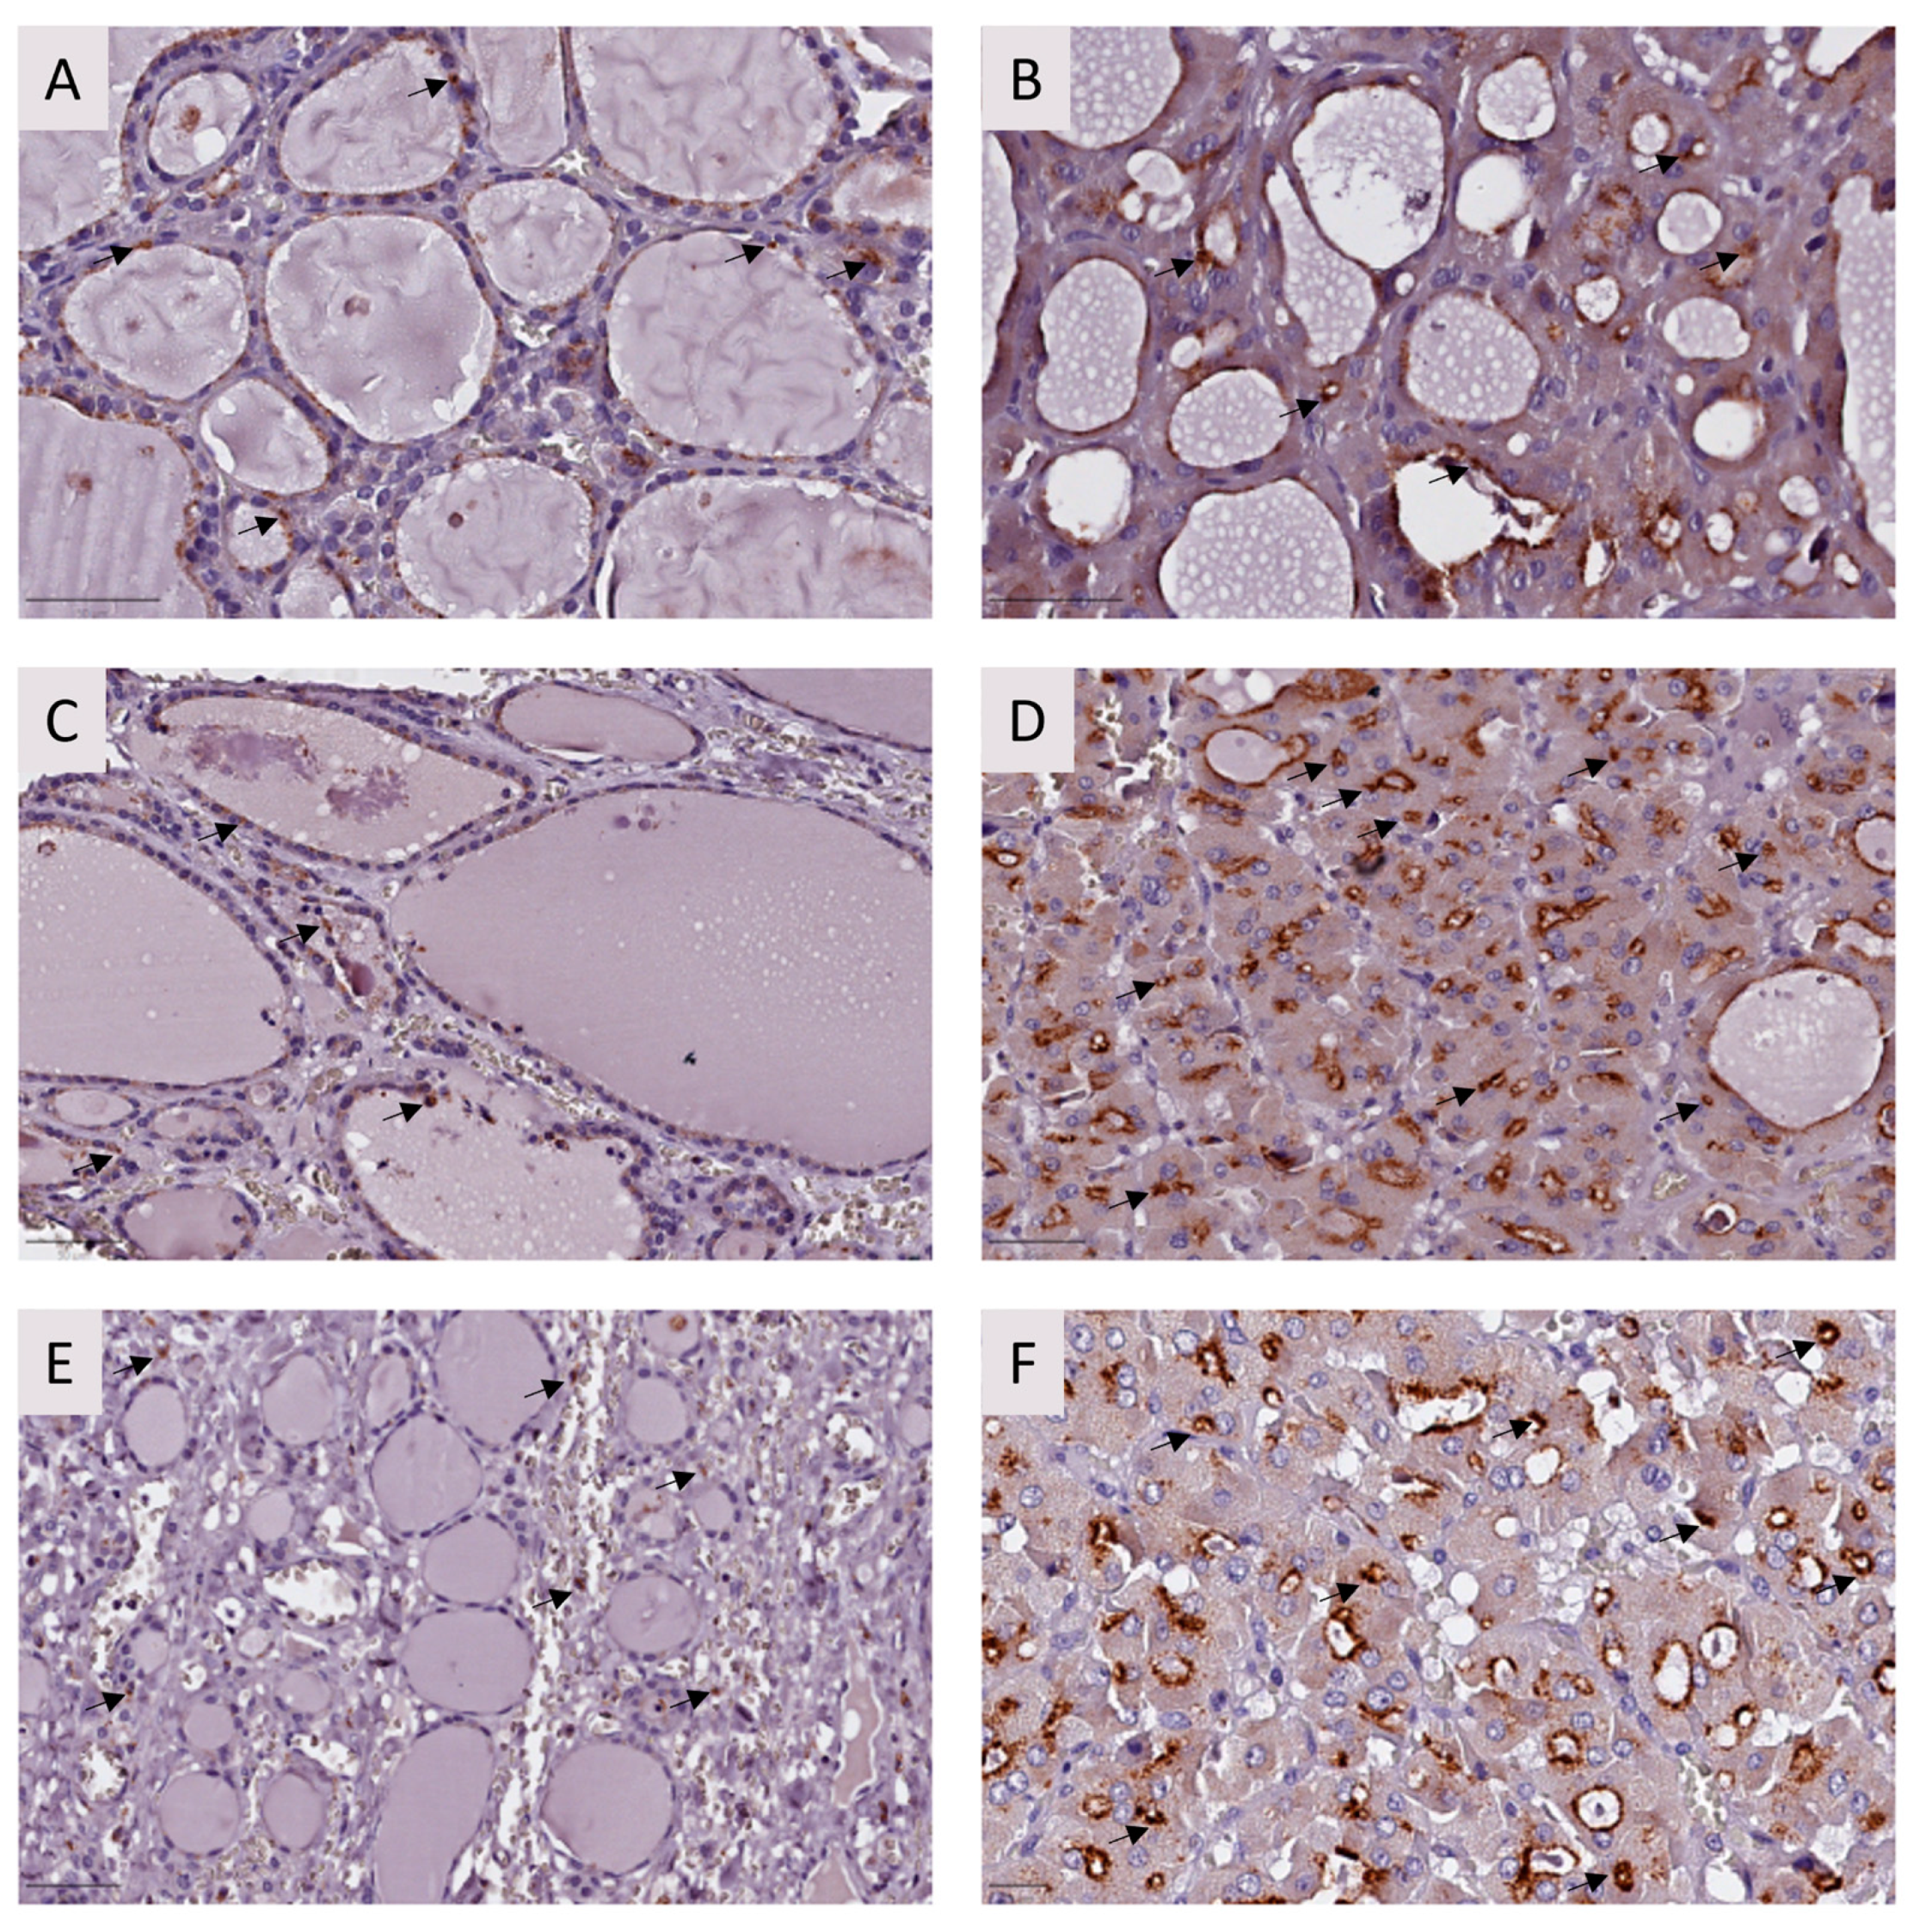
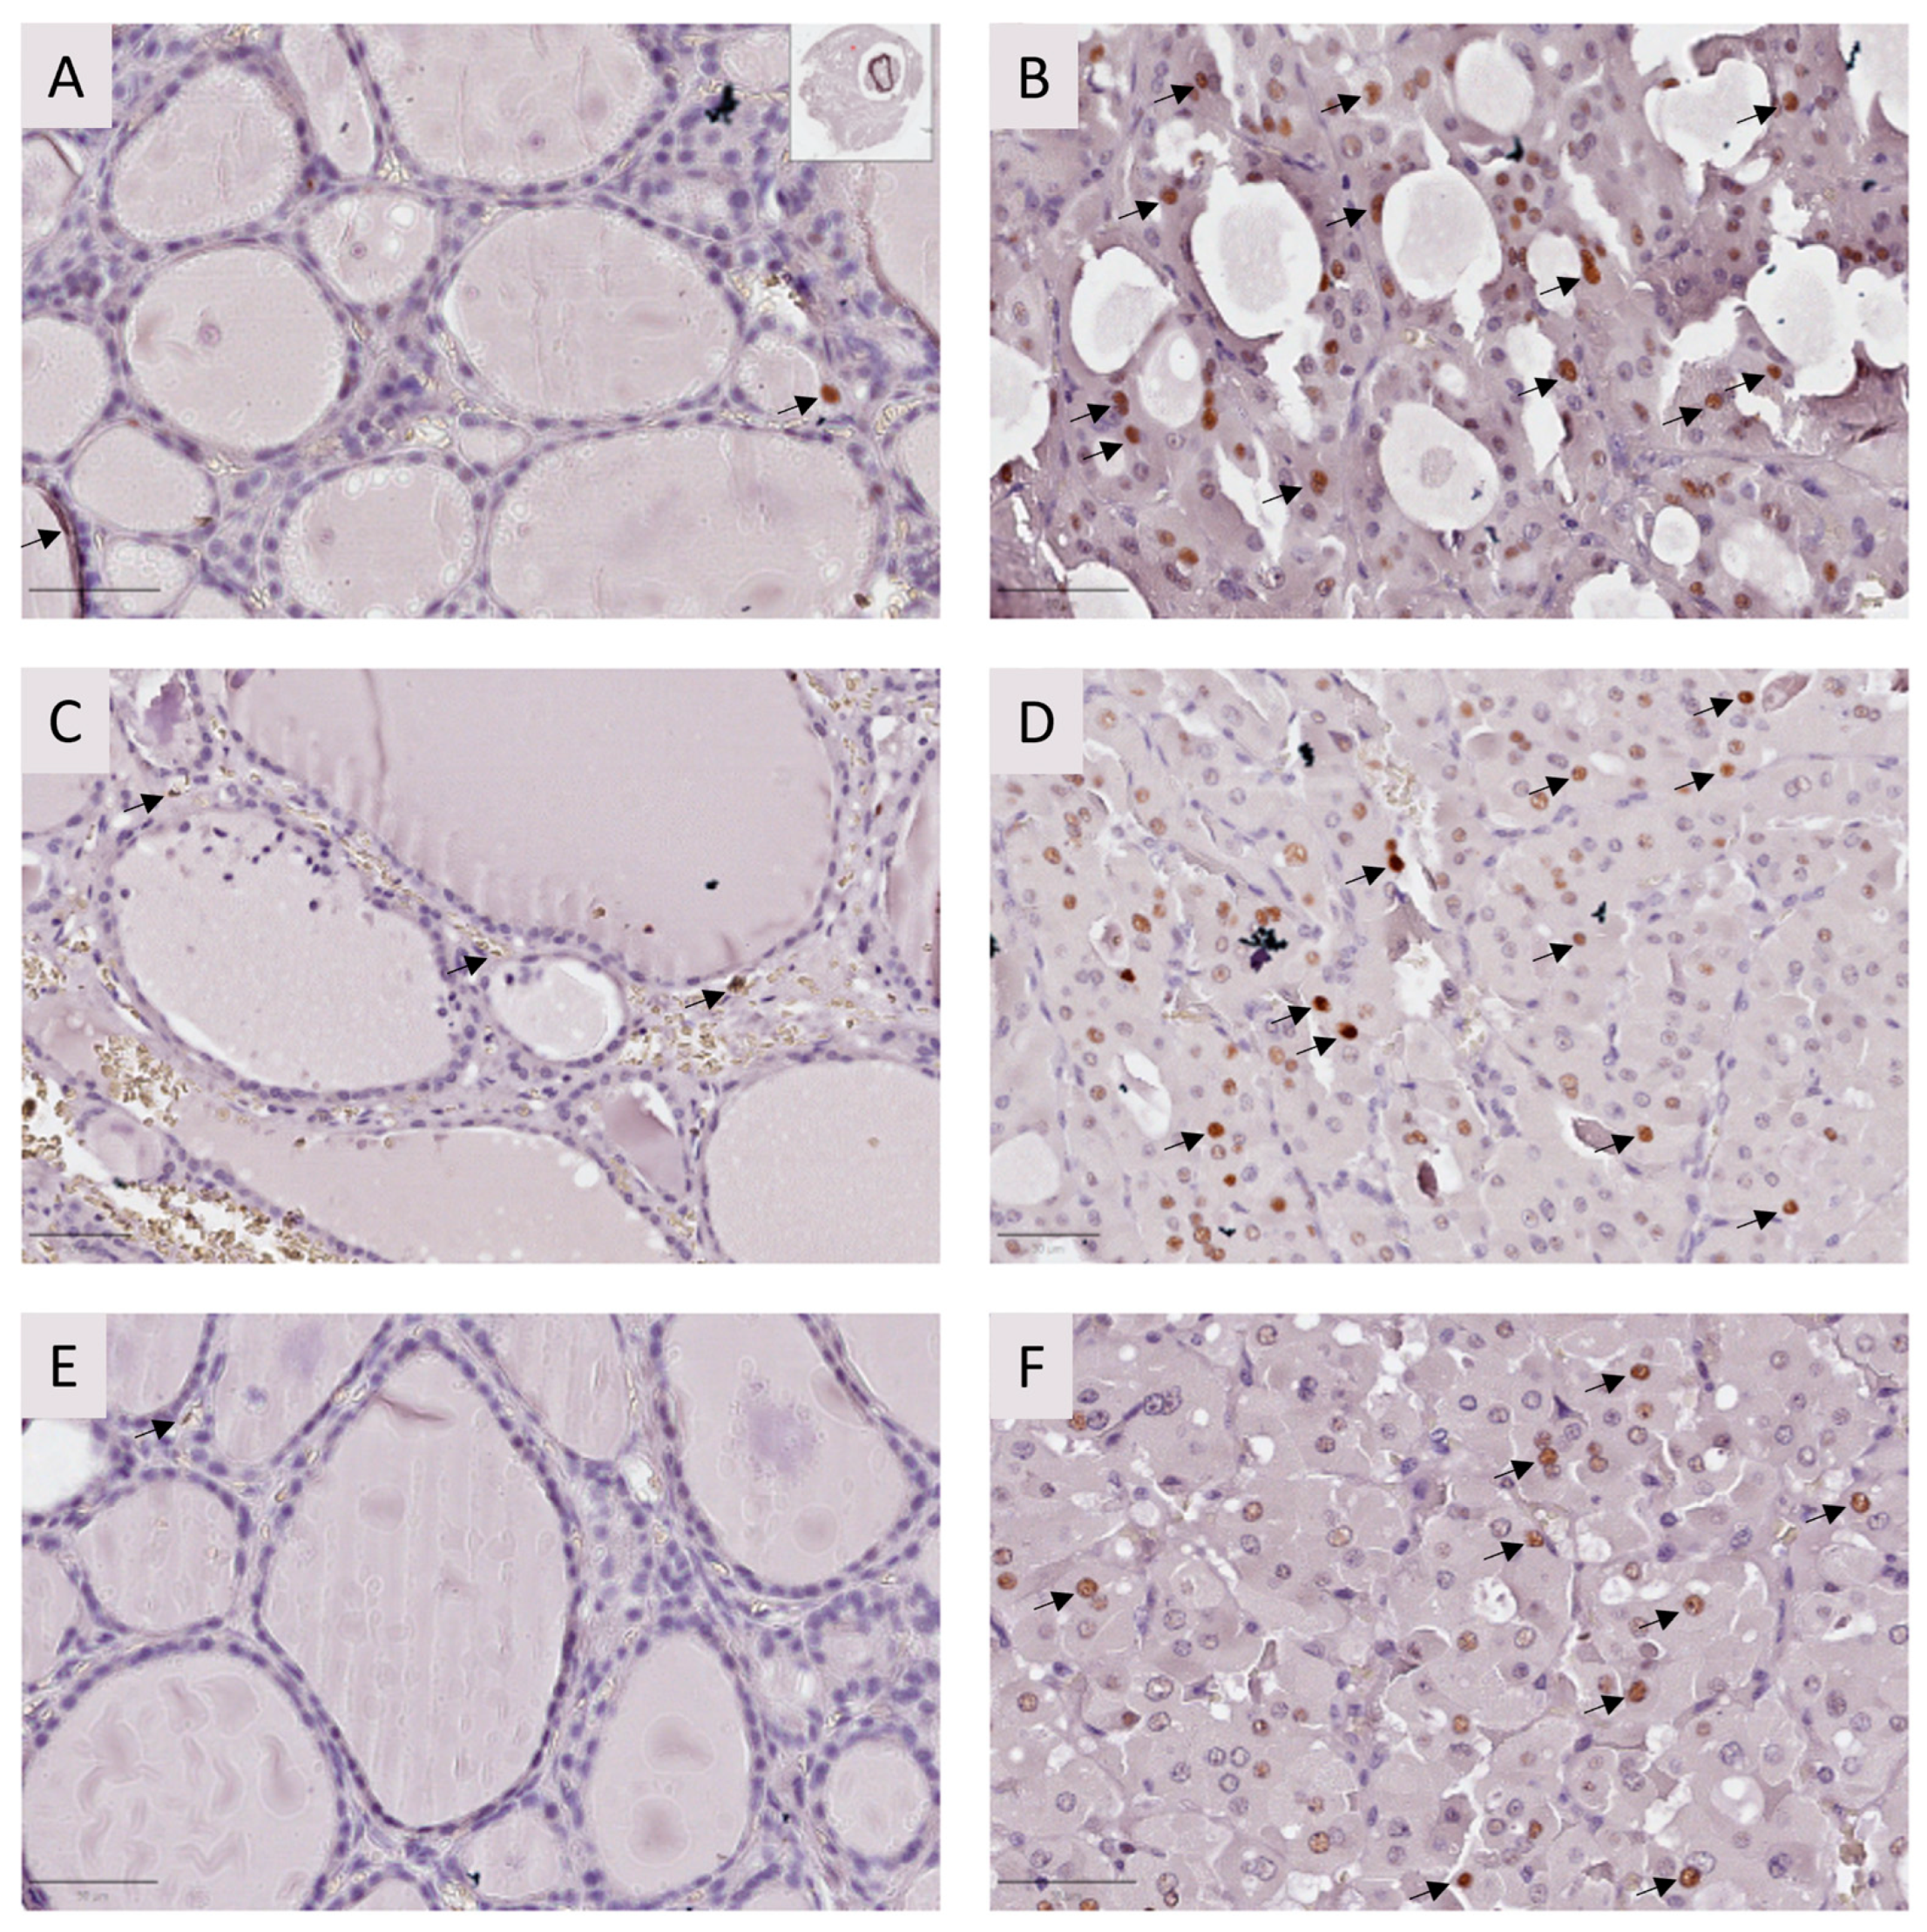
2.2.2. Immunohistochemistry
2.2.3. USP42 Silencing and Analysis of mRNA and Protein Expression
2.2.4. Cell Viability and Apoptosis Analysis
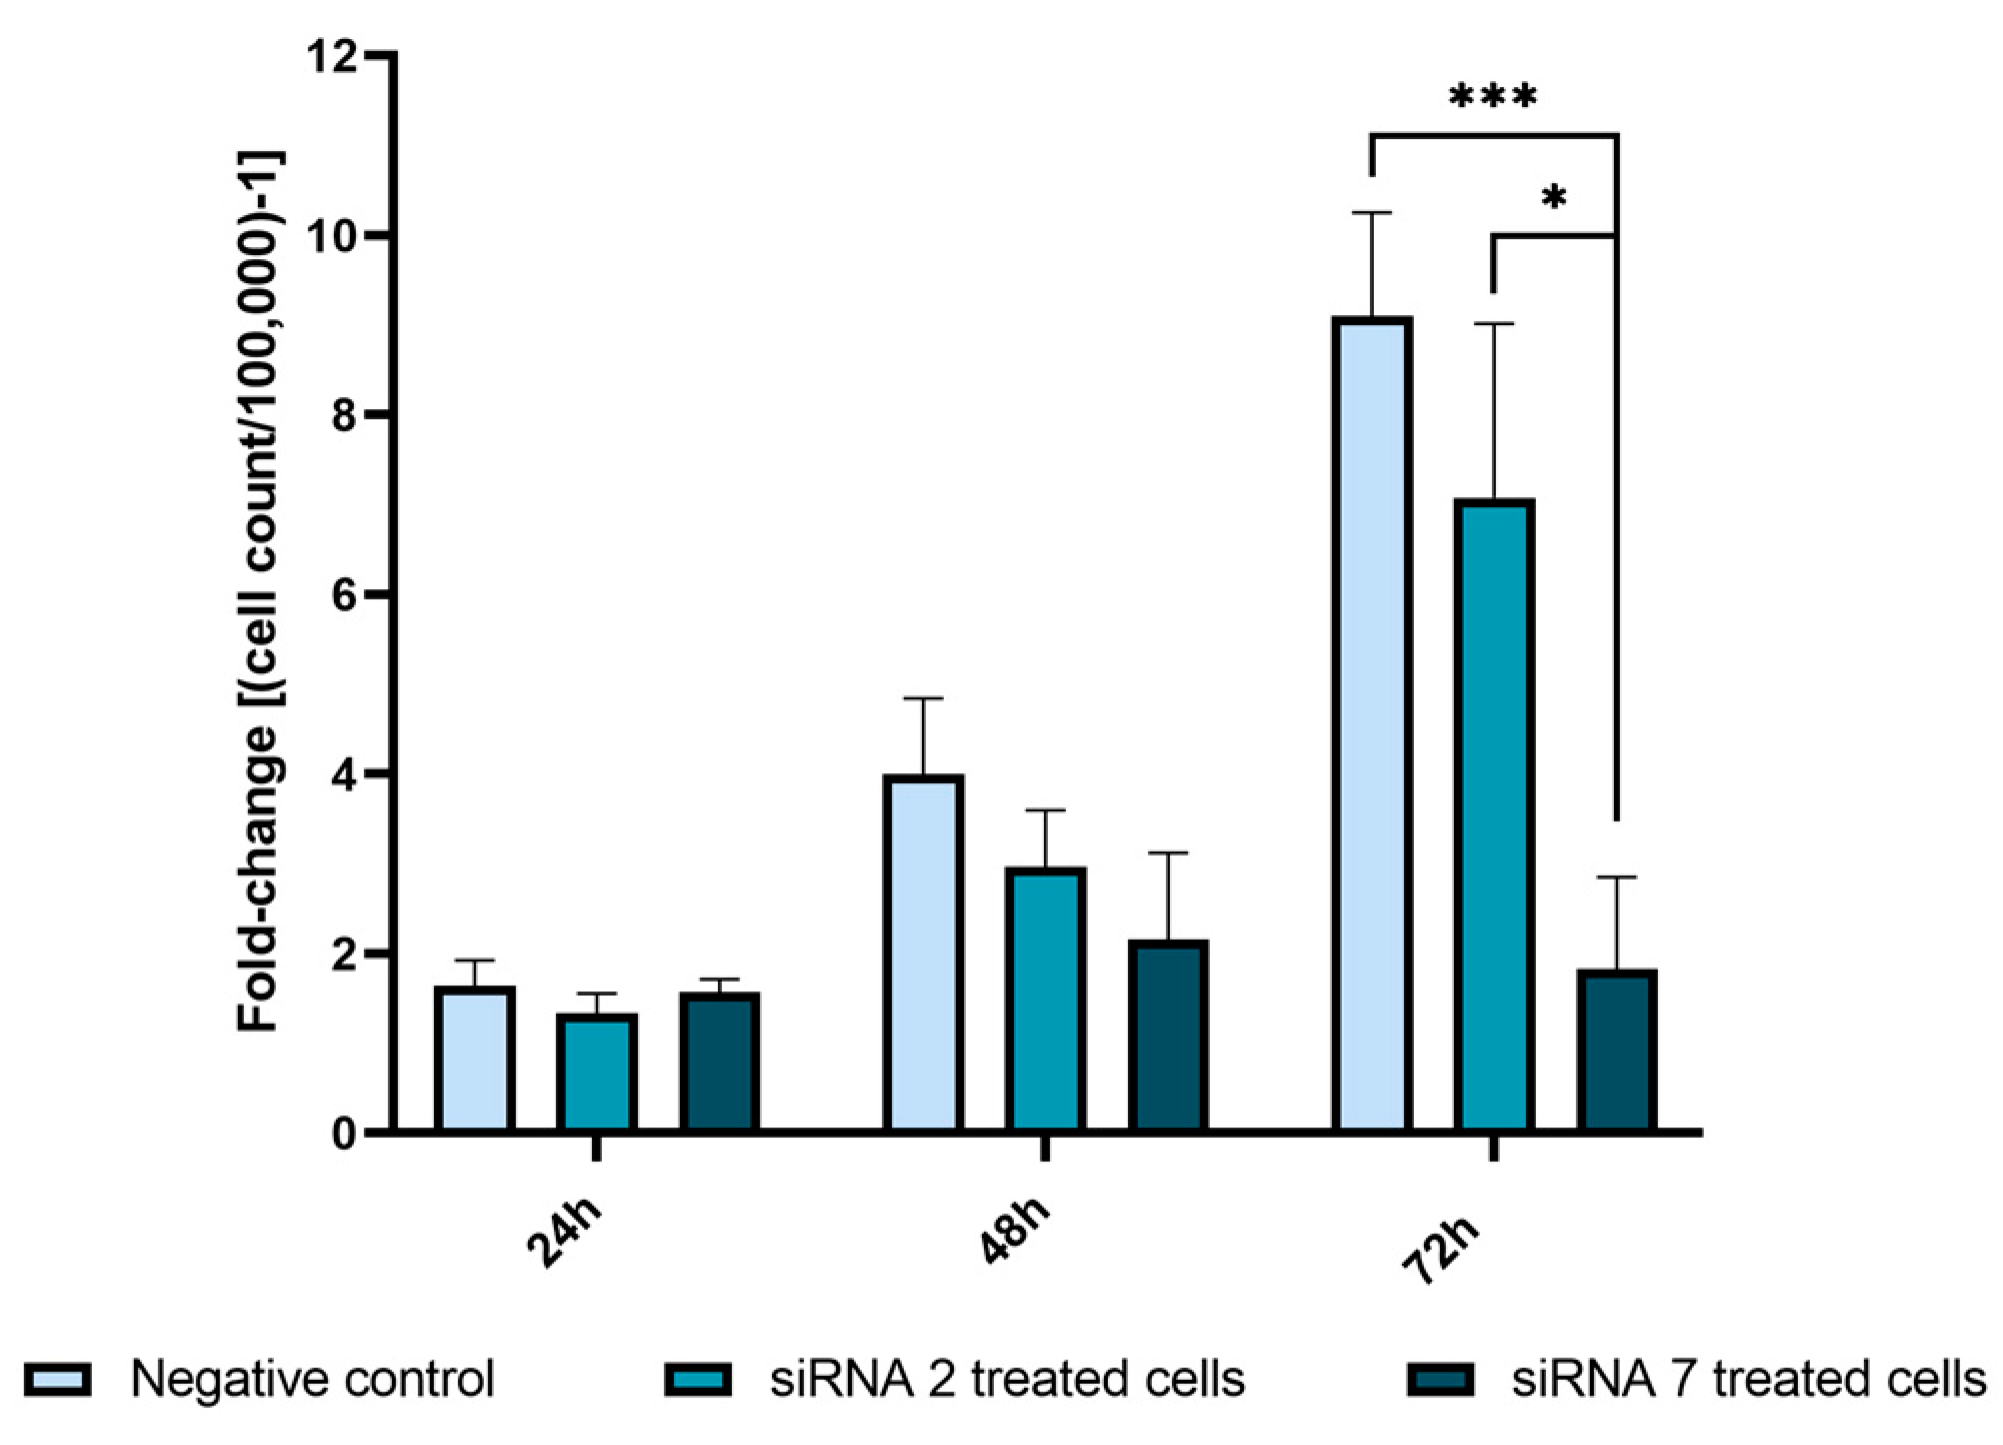
2.2.5. USP42 Silencing Effect in Cell Proliferation
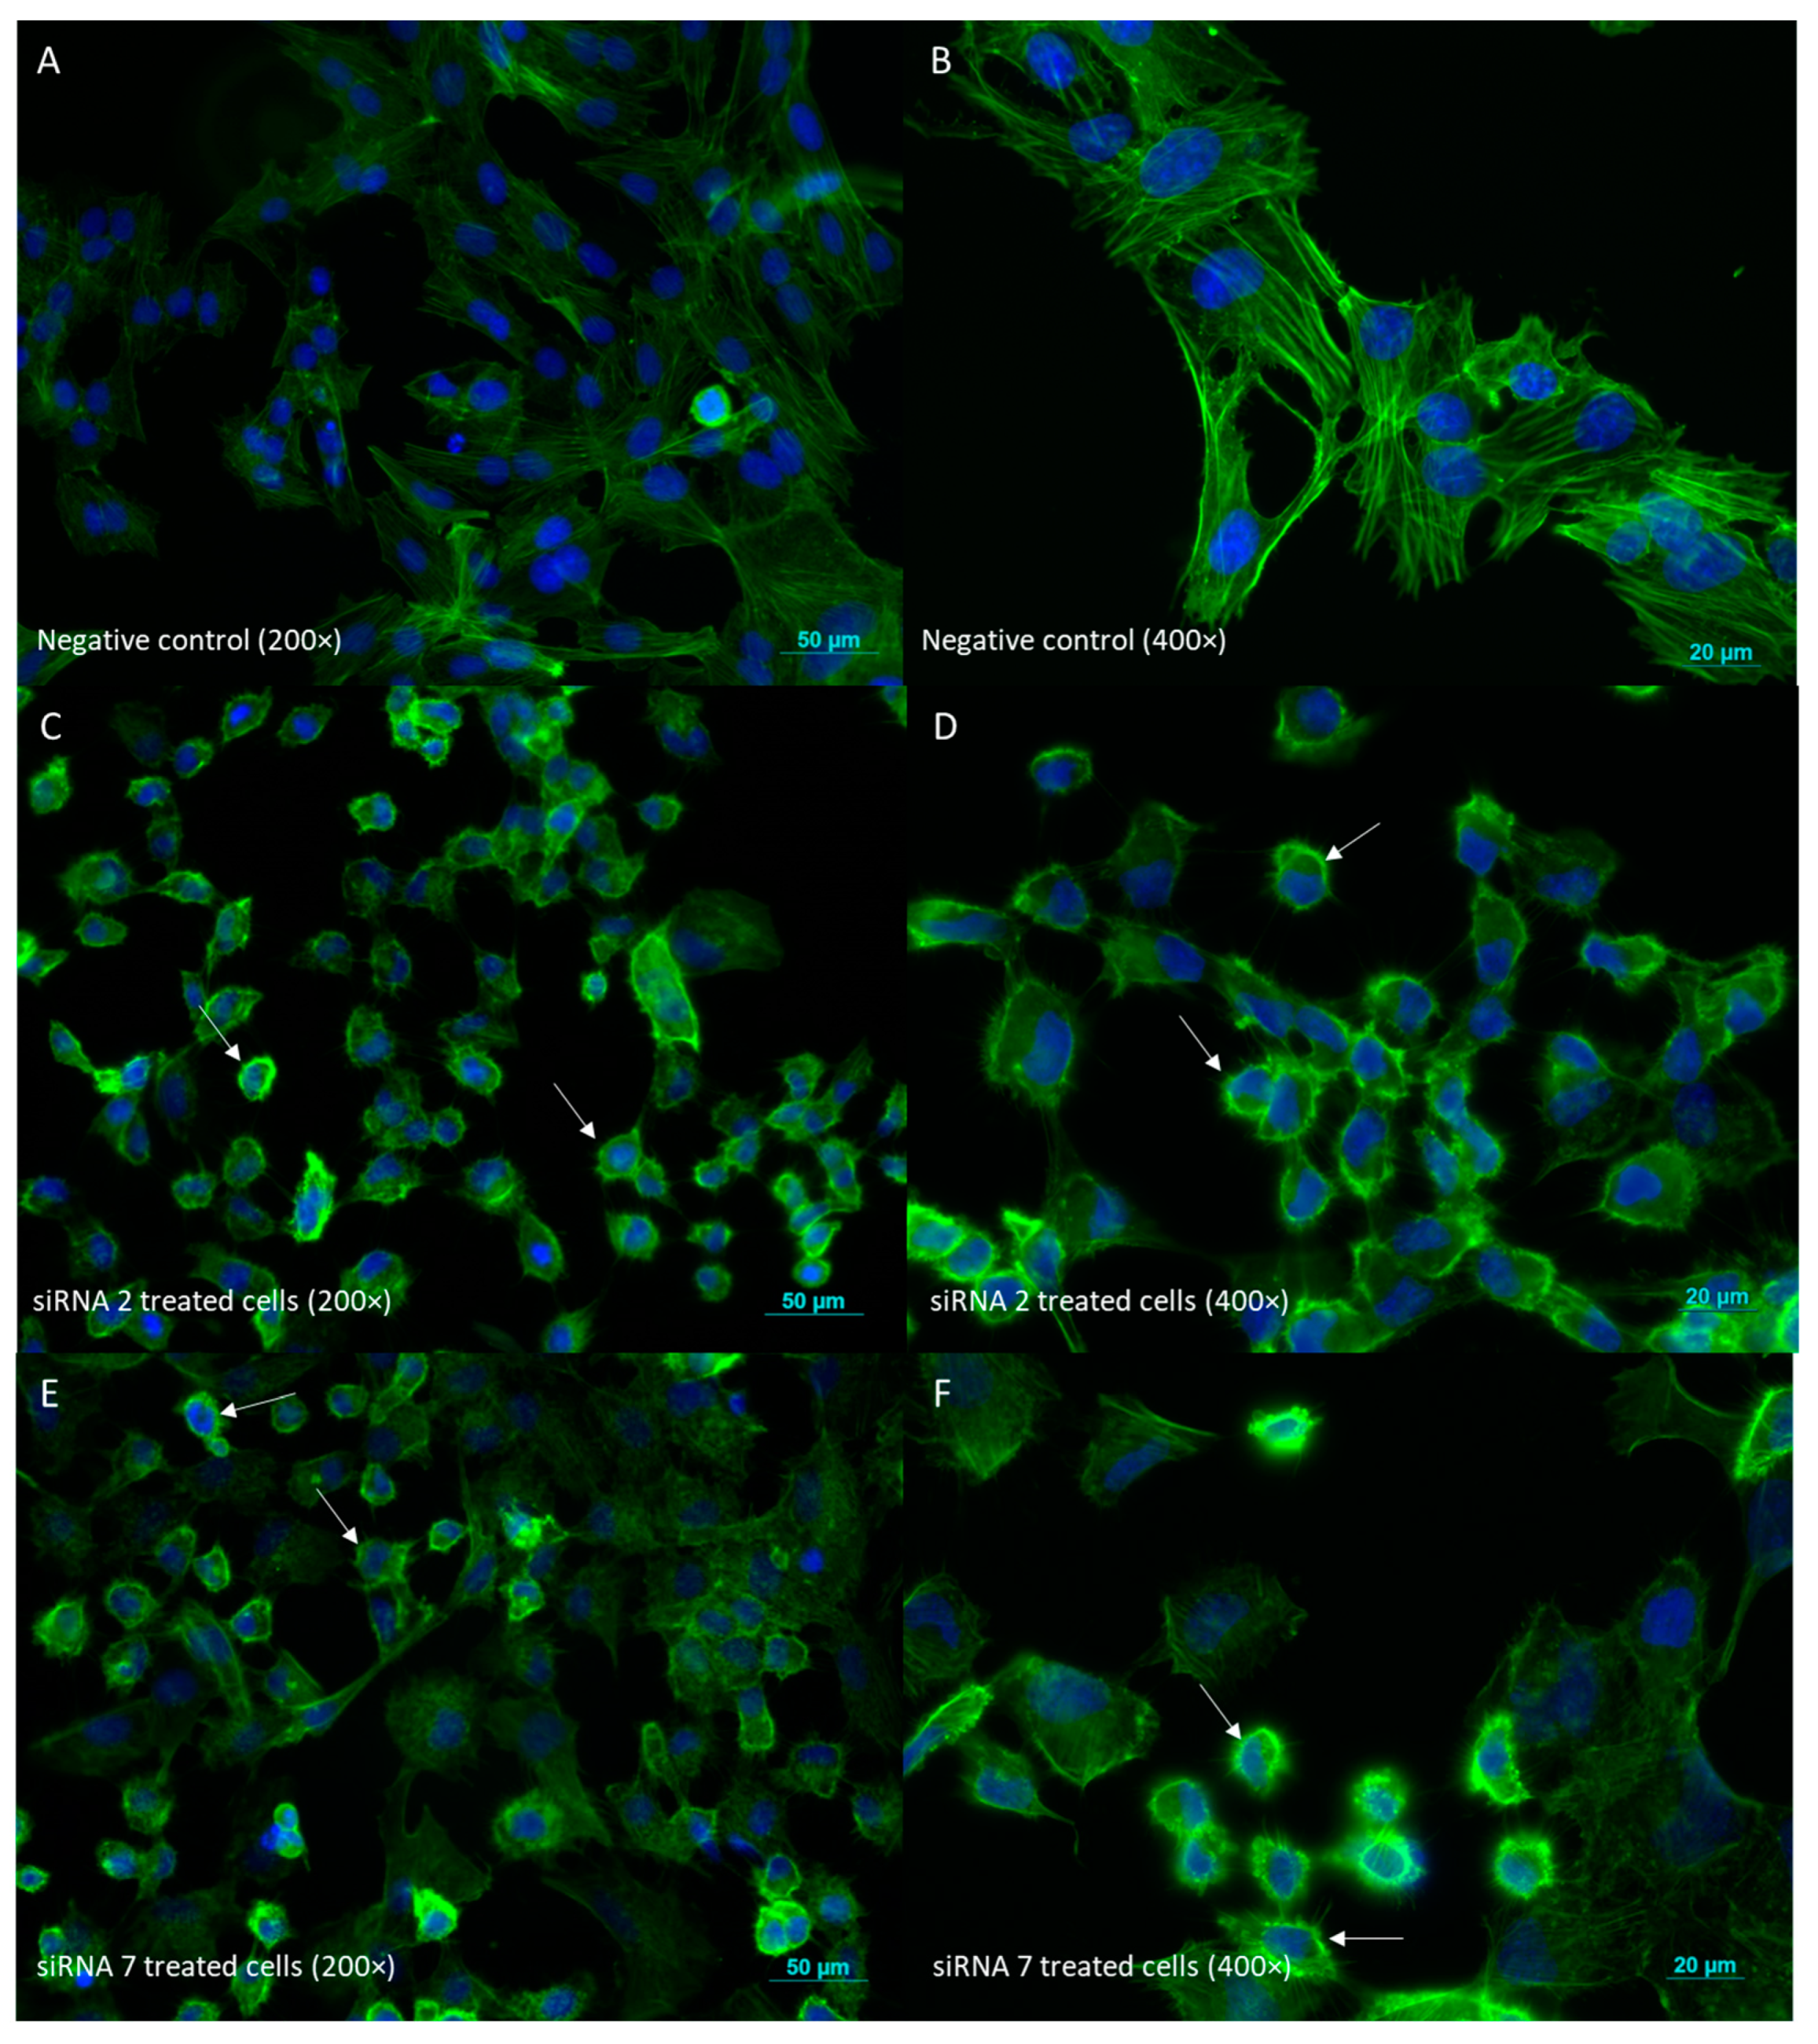
2.2.6. Cell Morphology Evaluation by Phalloidin Staining
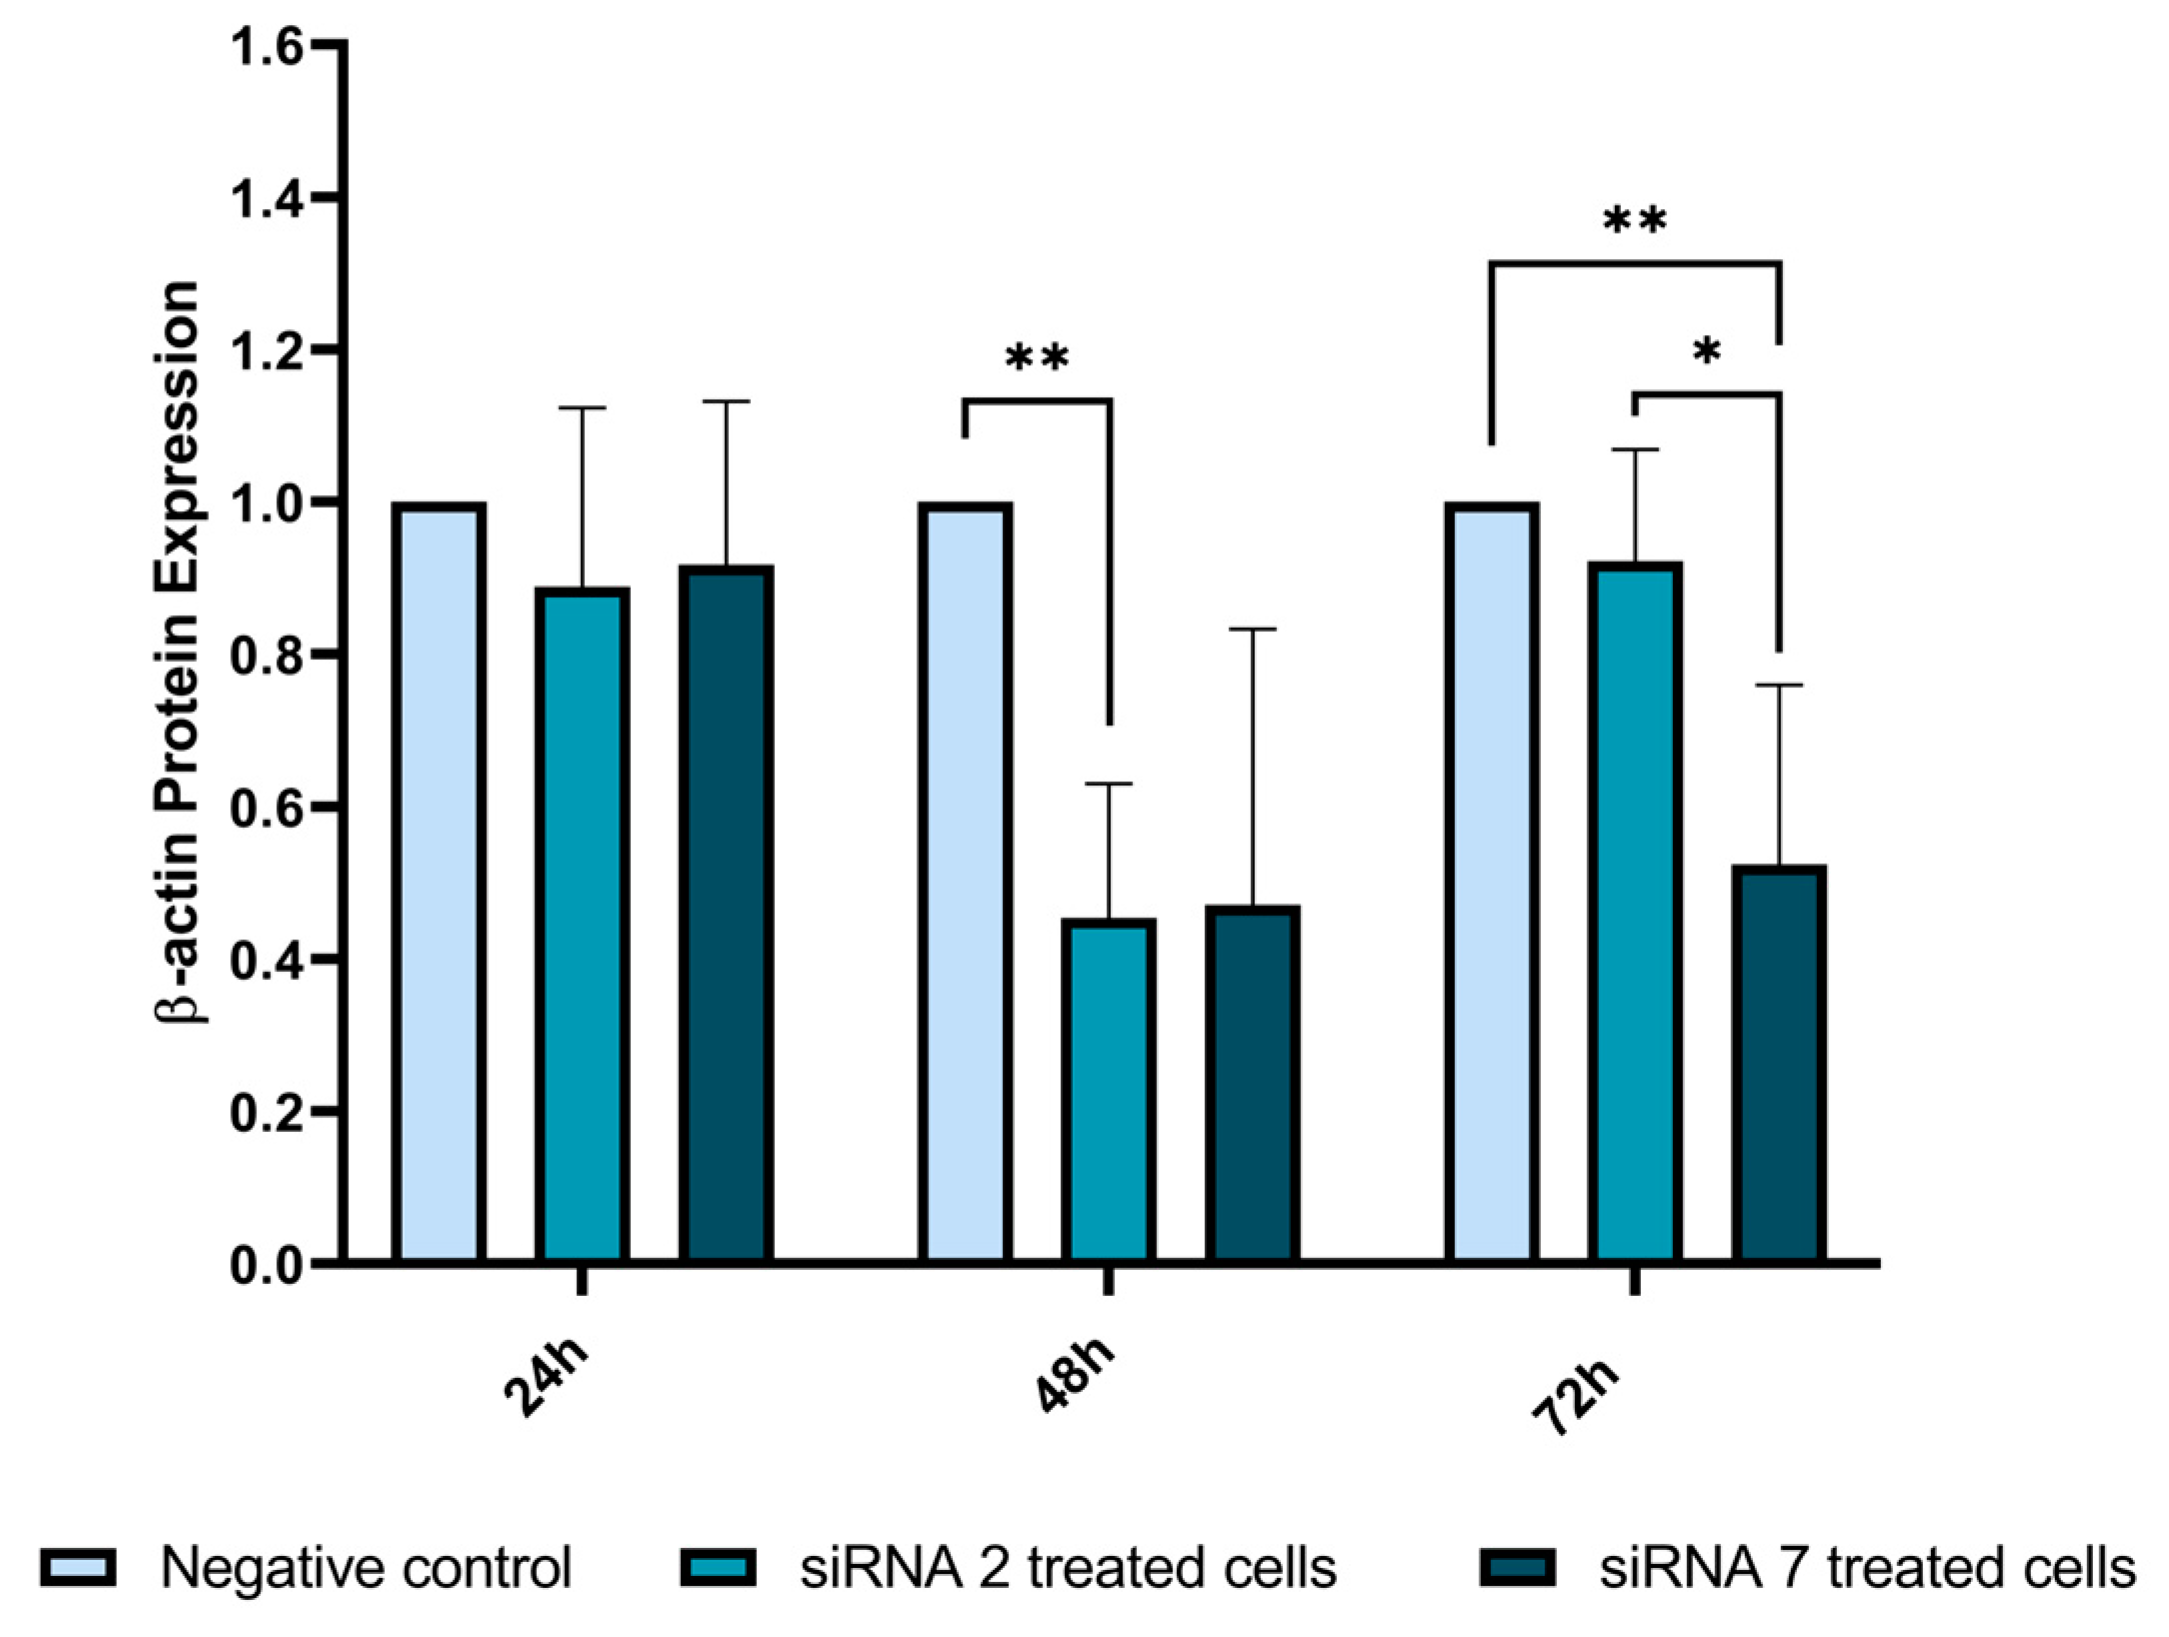
2.2.7. β-Actin Expression Analysis by Western Blot
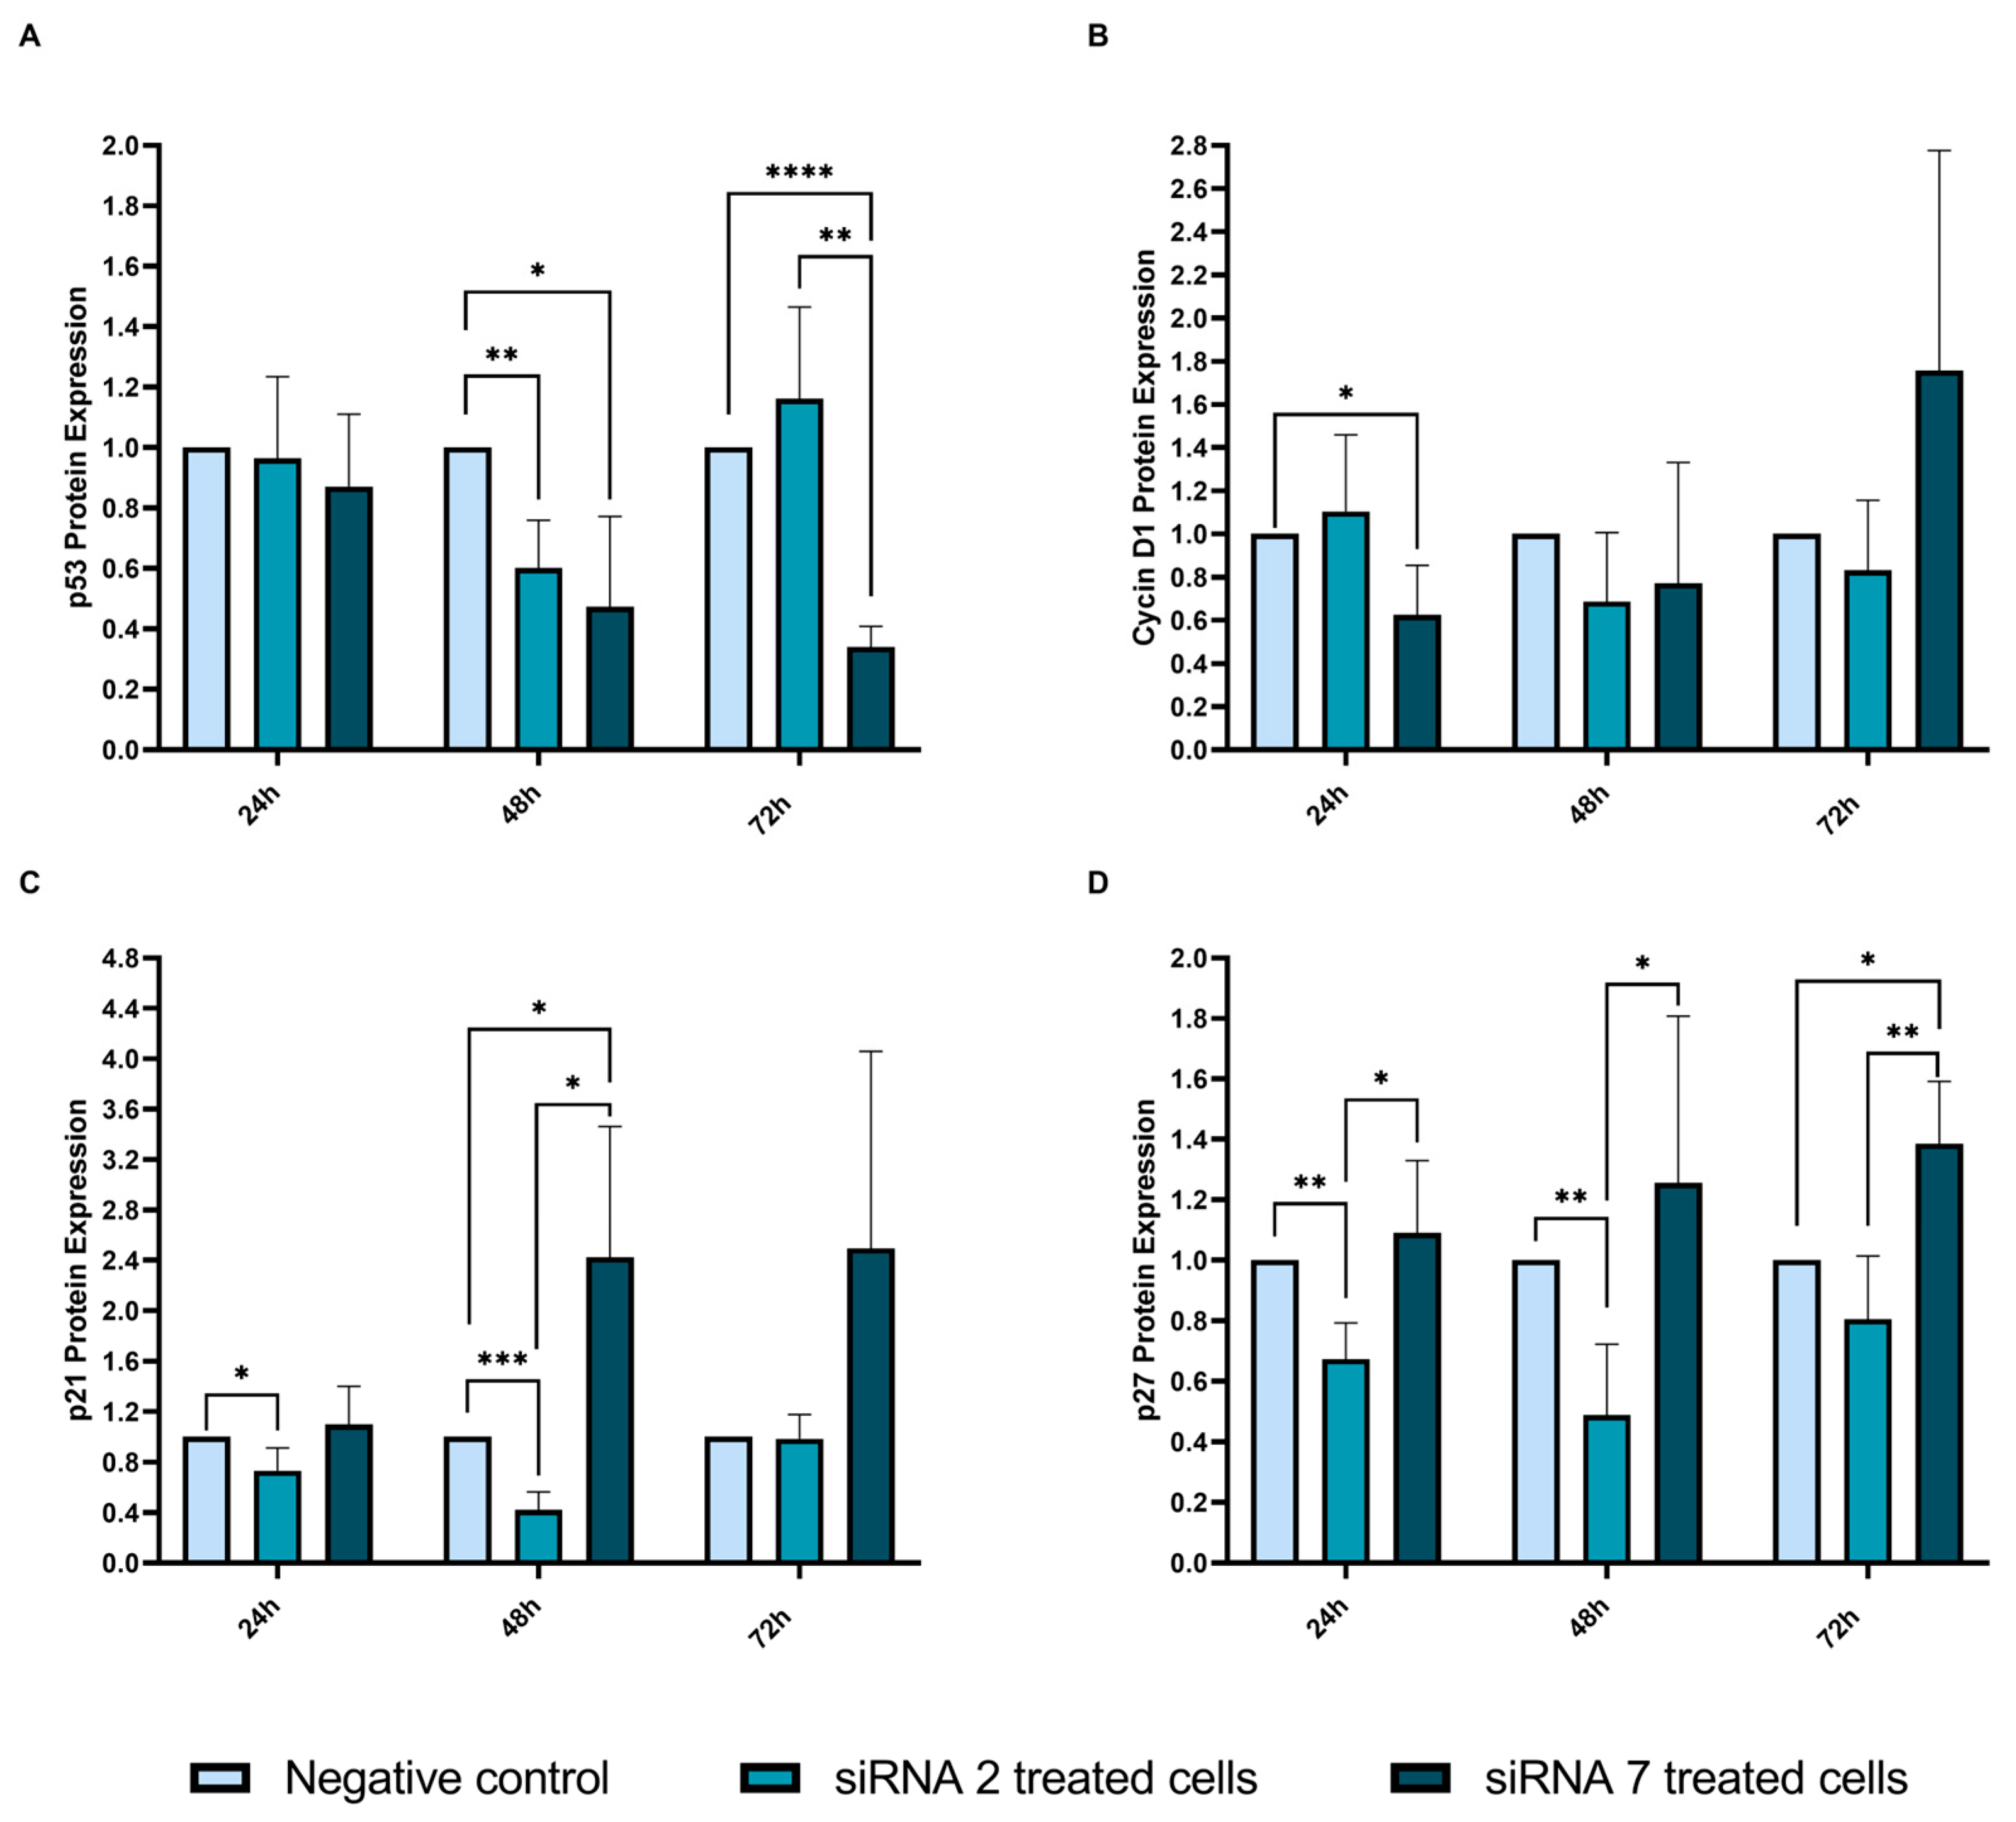
2.2.8. Cell Cycle-Related Proteins Analyzed by Western Blot
3. Discussion
4. Materials and Methods
4.1. Patients
4.2. Molecular Studies
4.2.1. DNA Extraction from Patient Samples
4.2.2. Immunohistochemistry
4.3. In Silico Studies
4.3.1. Variant Calling and Annotation
4.3.2. Whole-Exome Sequencing
4.3.3. Variant Prioritization
4.3.4. Analysis of Somatic Variants in the Tumor DNA
4.3.5. Polymerase Chain Reaction and Sanger Sequencing Analysis
4.3.6. USP Genetic Alterations in Papillary Thyroid Cancers
4.4. Functional Characterization
4.4.1. Cell Culture
4.4.2. siRNAs–USP42 Silencing
4.4.3. RNA Extraction and cDNA Conversion
4.4.4. Real-Time Quantitative Polymerase Chain Reaction
4.4.5. Protein Extraction
4.4.6. Western Blot Analysis
4.4.7. Phalloidin Staining
4.4.8. Annexin V Assay
4.4.9. Statistical Analysis
5. Conclusions
Supplementary Materials
Author Contributions
Funding
Institutional Review Board Statement
Informed Consent Statement
Data Availability Statement
Acknowledgments
Conflicts of Interest
References
- Wiltshire, J.J.; Drake, T.M.; Uttley, L.; Balasubramanian, S.P. Systematic review of trends in the incidence rates of thyroid cancer. Thyroid 2016, 26, 1541–1552. [Google Scholar] [CrossRef]
- Guilmette, J.; Nosé, V. Hereditary and familial thyroid tumours. Histopathology 2018, 72, 70–81. [Google Scholar] [CrossRef]
- Diquigiovanni, C.; Bonora, E. Genetics of Familial Non-Medullary Thyroid Carcinoma (FNMTC). Cancers 2021, 13, 2178. [Google Scholar] [CrossRef] [PubMed]
- Nosé, V.; Gill, A.; Teijeiro, J.M.C.; Perren, A.; Erickson, L. Overview of the 2022 WHO Classification of Familial Endocrine Tumor Syndromes. Endocr. Pathol. 2022, 33, 197–227. [Google Scholar] [CrossRef] [PubMed]
- Capezzone, M.; Robenshtok, E.; Cantara, S.; Castagna, M.G. Familial non-medullary thyroid cancer: A critical review. J. Endocrinol. Investig. 2021, 44, 943–950. [Google Scholar] [CrossRef] [PubMed]
- Pereira, J.S.; da Silva, J.G.; Tomaz, R.A.; Pinto, A.E.; Bugalho, M.J.; Leite, V.; Cavaco, B.M. Identification of a novel germline FOXE1 variant in patients with familial non-medullary thyroid carcinoma (FNMTC). Endocrine 2015, 49, 204–214. [Google Scholar] [CrossRef] [PubMed]
- Ngan, E.S.; Lang, B.H.; Liu, T.; Shum, C.K.; So, M.-T.; Lau, D.K.; Leon, T.Y.; Cherny, S.S.; Tsai, S.Y.; Lo, C.-Y. A germline mutation (A339V) in thyroid transcription factor-1 (TITF-1/NKX2. 1) in patients with multinodular goiter and papillary thyroid carcinoma. J. Natl. Cancer Inst. 2009, 101, 162–175. [Google Scholar] [CrossRef] [PubMed]
- Moses, W.; Weng, J.; Kebebew, E. Prevalence, clinicopathologic features, and somatic genetic mutation profile in familial versus sporadic nonmedullary thyroid cancer. Thyroid 2011, 21, 367–371. [Google Scholar] [CrossRef]
- Srivastava, A.; Giangiobbe, S.; Skopelitou, D.; Miao, B.; Paramasivam, N.; Diquigiovanni, C.; Bonora, E.; Hemminki, K.; Försti, A.; Bandapalli, O.R. Whole Genome Sequencing Prioritizes CHEK2, EWSR1, and TIAM1 as Possible Predisposition Genes for Familial Non-Medullary Thyroid Cancer. Front. Endocrinol. 2021, 12, 600682. [Google Scholar] [CrossRef]
- Young, M.-J.; Hsu, K.-C.; Lin, T.E.; Chang, W.-C.; Hung, J.-J. The role of ubiquitin-specific peptidases in cancer progression. J. Biomed. Sci. 2019, 26, 42. [Google Scholar] [CrossRef]
- Cruz, L.; Soares, P.; Correia, M. Ubiquitin-specific proteases: Players in cancer cellular processes. Pharmaceuticals 2021, 14, 848. [Google Scholar] [CrossRef]
- He, M.; Zhou, Z.; Wu, G.; Chen, Q.; Wan, Y. Emerging role of DUBs in tumor metastasis and apoptosis: Therapeutic implication. Pharmacol. Ther. 2017, 177, 96–107. [Google Scholar] [CrossRef]
- Hock, A.K.; Vigneron, A.M.; Carter, S.; Ludwig, R.L.; Vousden, K.H. Regulation of p53 stability and function by the deubiquitinating enzyme USP42. EMBO J. 2011, 30, 4921–4930. [Google Scholar] [CrossRef]
- Hock, A.K.; Vigneron, A.M.; Vousden, K.H. Ubiquitin-specific peptidase 42 (USP42) functions to deubiquitylate histones and regulate transcriptional activity. J. Biol. Chem. 2014, 289, 34862–34870. [Google Scholar] [CrossRef] [PubMed]
- Harmonizing model organism data in the Alliance of Genome Resources. Genetics 2022, 220, iyac022. [CrossRef]
- Quesada, V.; Díaz-Perales, A.; Gutiérrez-Fernández, A.; Garabaya, C.; Cal, S.; López-Otín, C. Cloning and enzymatic analysis of 22 novel human ubiquitin-specific proteases. Biochem. Biophys. Res. Commun. 2004, 314, 54–62. [Google Scholar] [CrossRef]
- Komander, D.; Clague, M.J.; Urbé, S. Breaking the chains: Structure and function of the deubiquitinases. Nat. Rev. Mol. Cell Biol. 2009, 10, 550–563. [Google Scholar] [CrossRef] [PubMed]
- Deng, L.; Meng, T.; Chen, L.; Wei, W.; Wang, P. The role of ubiquitination in tumorigenesis and targeted drug discovery. Signal Transduct. Target. Ther. 2020, 5, 11. [Google Scholar] [CrossRef] [PubMed]
- David, R. DUBs’ key to selectivity. Nat. Rev. Mol. Cell Biol. 2012, 13, 64–65. [Google Scholar] [CrossRef]
- Mevissen, T.E.; Komander, D. Mechanisms of deubiquitinase specificity and regulation. Annu. Rev. Biochem. 2017, 86, 159–192. [Google Scholar] [CrossRef] [PubMed]
- Clague, M.J.; Urbé, S.; Komander, D. Breaking the chains: Deubiquitylating enzyme specificity begets function. Nat. Rev. Mol. Cell Biol. 2019, 20, 338–352. [Google Scholar] [CrossRef]
- Wang, G.; He, C.; Chen, J.; He, W.; He, L.; Li, J. Deubiquitinating Enzyme USP42 Promotes Breast Cancer Progression by Inhibiting JNK/p38-Mediated Apoptosis. Res. Sq. 2022. [Google Scholar] [CrossRef]
- Tang, J.; Luo, Y.; Xiao, L. USP26 promotes anaplastic thyroid cancer progression by stabilizing TAZ. Cell Death Dis. 2022, 13, 326. [Google Scholar] [CrossRef] [PubMed]
- Liang, Q.; Zhong, W. Downregulated Expression of USP18 Is Associated with a Higher Recurrence Risk of Papillary Thyroid Carcinoma. Tohoku J. Exp. Med. 2021, 255, 203–212. [Google Scholar] [CrossRef]
- An, Y.; Yang, S.; Guo, K.; Ma, B.; Wang, Y. Reduced USP39 expression inhibits malignant proliferation of medullary thyroid carcinoma in vitro. World J. Surg. Oncol. 2015, 13, 255. [Google Scholar] [CrossRef]
- Maria, A.G.; Azevedo, B.; Settas, N.; Hannah-Shmouni, F.; Stratakis, C.A.; Faucz, F.R. USP13 genetics and expression in a family with thyroid cancer. Endocrine 2022, 77, 281–290. [Google Scholar] [CrossRef] [PubMed]
- Xu, M.; Takanashi, M.; Oikawa, K.; Tanaka, M.; Nishi, H.; Isaka, K.; Kudo, M.; Kuroda, M. USP15 plays an essential role for caspase-3 activation during Paclitaxel-induced apoptosis. Biochem. Biophys. Res. Commun. 2009, 388, 366–371. [Google Scholar] [CrossRef]
- Rodríguez-Pérez, F.; Manford, A.G.; Pogson, A.; Ingersoll, A.J.; Martínez-González, B.; Rape, M. Ubiquitin-dependent remodeling of the actin cytoskeleton drives cell fusion. Dev. Cell 2021, 56, 588–601. [Google Scholar] [CrossRef] [PubMed]
- Yan, G.; Liu, N.; Wang, J.; Tian, J.; Liu, H.; Li, S.; Liu, W.; Li, X.; Li, K.; Wang, H. Deubiquitylation and stabilization of Acf7 by ubiquitin carboxyl-terminal hydrolase 14 (USP14) is critical for NSCLC migration. J. Biosci. 2021, 46, 19. [Google Scholar] [CrossRef]
- Sun, X.X.; Dai, M.S. Deubiquitinating enzyme regulation of the p53 pathway: A lesson from Otub1. World J. Biol. Chem. 2014, 5, 75–84. [Google Scholar] [CrossRef]
- Morita, N.; Ikeda, Y.; Takami, H. Clinical Significance of P53 Protein Expression in Papillary Thyroid Carcinoma. World J. Surg. 2008, 32, 2617–2622. [Google Scholar] [CrossRef]
- Hou, K.; Zhu, Z.; Wang, Y.; Zhang, C.; Yu, S.; Zhu, Q.; Yan, B. Overexpression and biological function of ubiquitin-specific protease 42 in gastric cancer. PLoS ONE 2016, 11, e0152997. [Google Scholar] [CrossRef] [PubMed]
- Li, H.; Durbin, R. Fast and accurate short read alignment with Burrows-Wheeler transform. Bioinformatics 2009, 25, 1754–1760. [Google Scholar] [CrossRef] [PubMed]
- McKenna, A.; Hanna, M.; Banks, E.; Sivachenko, A.; Cibulskis, K.; Kernytsky, A.; Garimella, K.; Altshuler, D.; Gabriel, S.; Daly, M.; et al. The Genome Analysis Toolkit: A MapReduce framework for analyzing next-generation DNA sequencing data. Genome Res. 2010, 20, 1297–1303. [Google Scholar] [CrossRef] [PubMed]
- Masica, D.L.; Douville, C.; Tokheim, C.; Bhattacharya, R.; Kim, R.; Moad, K.; Ryan, M.C.; Karchin, R. CRAVAT 4: Cancer-Related Analysis of Variants Toolkit. Cancer Res. 2017, 77, e35–e38. [Google Scholar] [CrossRef] [PubMed]
- Collins, R.L.; Brand, H.; Karczewski, K.J.; Zhao, X.; Alföldi, J.; Francioli, L.C.; Khera, A.V.; Lowther, C.; Gauthier, L.D.; Wang, H.; et al. A structural variation reference for medical and population genetics. Nature 2020, 581, 444–451. [Google Scholar] [CrossRef] [PubMed]
- Martínez-Jiménez, F.; Muiños, F.; Sentís, I.; Deu-Pons, J.; Reyes-Salazar, I.; Arnedo-Pac, C.; Mularoni, L.; Pich, O.; Bonet, J.; Kranas, H.; et al. A compendium of mutational cancer driver genes. Nat. Rev. Cancer 2020, 20, 555–572. [Google Scholar] [CrossRef]
- Kircher, M.; Witten, D.M.; Jain, P.; O’Roak, B.J.; Cooper, G.M.; Shendure, J. A general framework for estimating the relative pathogenicity of human genetic variants. Nat. Genet. 2014, 46, 310–315. [Google Scholar] [CrossRef]
- Robinson, J.T.; Thorvaldsdóttir, H.; Winckler, W.; Guttman, M.; Lander, E.S.; Getz, G.; Mesirov, J.P. Integrative genomics viewer. Nat. Biotechnol. 2011, 29, 24–26. [Google Scholar] [CrossRef]
- Chang, M.T.; Asthana, S.; Gao, S.P.; Lee, B.H.; Chapman, J.S.; Kandoth, C.; Gao, J.; Socci, N.D.; Solit, D.B.; Olshen, A.B.; et al. Identifying recurrent mutations in cancer reveals widespread lineage diversity and mutational specificity. Nat. Biotechnol. 2016, 34, 155–163. [Google Scholar] [CrossRef]
- Shen, R.; Seshan, V.E. FACETS: Allele-specific copy number and clonal heterogeneity analysis tool for high-throughput DNA sequencing. Nucleic Acids Res. 2016, 44, e131. [Google Scholar] [CrossRef]
- Kim, S.H.; Da Cruz Paula, A.; Basili, T.; Dopeso, H.; Bi, R.; Pareja, F.; da Silva, E.M.; Gularte-Mérida, R.; Sun, Z.; Fujisawa, S.; et al. Identification of recurrent FHL2-GLI2 oncogenic fusion in sclerosing stromal tumors of the ovary. Nat. Commun. 2020, 11, 44. [Google Scholar] [CrossRef]
- Carter, S.L.; Cibulskis, K.; Helman, E.; McKenna, A.; Shen, H.; Zack, T.; Laird, P.W.; Onofrio, R.C.; Winckler, W.; Weir, B.A.; et al. Absolute quantification of somatic DNA alterations in human cancer. Nat. Biotechnol. 2012, 30, 413–421. [Google Scholar] [CrossRef] [PubMed]
- Póvoa, A.A.; Teixeira, E.; Bella-Cueto, M.R.; Batista, R.; Pestana, A.; Melo, M.; Alves, T.; Pinto, M.; Sobrinho-Simões, M.; Maciel, J. Genetic determinants for prediction of outcome of patients with papillary thyroid carcinoma. Cancers 2021, 13, 2048. [Google Scholar] [CrossRef]
- Siwei, C.; Laurent, C.F.; Julia, K.G.; Ryan, L.C.; Masahiro, K.; Qingbo, W.; Jessica, A.; Nicholas, A.W.; Christopher, V.; Laura, D.G.; et al. A genome-wide mutational constraint map quantified from variation in 76,156 human genomes. bioRxiv 2002. [Google Scholar] [CrossRef]
- Tate, J.G.; Bamford, S.; Jubb, H.C.; Sondka, Z.; Beare, D.M.; Bindal, N.; Boutselakis, H.; Cole, C.G.; Creatore, C.; Dawson, E.; et al. COSMIC: The Catalogue Of Somatic Mutations In Cancer. Nucleic Acids Res. 2018, 47, D941–D947. [Google Scholar] [CrossRef]
- Martin, F.J.; Amode, M.R.; Aneja, A.; Austine-Orimoloye, O.; Azov, A.G.; Barnes, I.; Becker, A.; Bennett, R.; Berry, A.; Bhai, J.; et al. Ensembl 2023. Nucleic Acids Res. 2022, 51, D933–D941. [Google Scholar] [CrossRef] [PubMed]
- Landrum, M.J.; Chitipiralla, S.; Brown, G.R.; Chen, C.; Gu, B.; Hart, J.; Hoffman, D.; Jang, W.; Kaur, K.; Liu, C.; et al. ClinVar: Improvements to accessing data. Nucleic Acids Res. 2020, 48, D835–D844. [Google Scholar] [CrossRef]
- Peixoto, J.; Príncipe, C.; Pestana, A.; Osório, H.; Pinto, M.T.; Prazeres, H.; Soares, P.; Lima, R.T. Using a Dual CRISPR/Cas9 Approach to Gain Insight into the Role of LRP1B in Glioblastoma. Int. J. Mol. Sci. 2023, 24, 1285. [Google Scholar] [CrossRef] [PubMed]


| 1 ID | Position (2 Chr. 7) | Alternate Allele | Gene | Mutation Type | Amino Acid Change | gnomAD AF Total | dbSNP | CADD | ClinVar |
|---|---|---|---|---|---|---|---|---|---|
| I | 6189283 | G > A | USP42 | Missense | p.(Gly486Arg) | 0.0004582 | rs200908439 | 23.6 | 3 US |
| II.1 | 6189283 | G > A | USP42 | Missense | p.(Gly486Arg) | 0.0004582 | rs200908439 | 23.6 | US |
| II.2 | 6189283 | G > A | USP42 | Missense | p.(Gly486Arg) | 0.0004582 | rs200908439 | 23.6 | US |
| 1 ID | 2 Chr. | Position | Alternate Allele | Gene | Mutation Type | Amino Acid Change | Alt. Reads | Ref. Reads | Tumor 3 MAF | Tumor Depth | Cancer Cell Fraction | Clonal Status |
|---|---|---|---|---|---|---|---|---|---|---|---|---|
| I | 11 | 533874 | T > C | HRAS | Missense | p.(Gln61Arg) | 171 | 68 | 0.2845 | 239 | 0.93 | Clonal |
| I | 3 | 100170600 | A > T | LNP1 | Missense | p.(His78Leu) | 37 | 5 | 0.119 | 42 | 0.39 | Subclonal |
| I | 1 | 1269225 | G > A | TAS1R3 | Missense | p.(Cys647Tyr) | 165 | 25 | 0.1316 | 190 | 0.43 | Subclonal |
| I | 6 | 30954414 | C > G | MUC21 | Missense | p.(Asp154Glu) | 39 | 9 | 0.1875 | 48 | 0.61 | Subclonal |
| I | 11 | 117299237 | G > A | DSCAML1 | Missense | p.(Pro2050Leu) | 24 | 7 | 0.2258 | 31 | 0.74 | Subclonal |
| 1 ID | Sample | Lesion | Total (N) | p53 (+) | p53 (−) | Ratio (%) |
|---|---|---|---|---|---|---|
| I | Sample 1 | Tumor | 1084 | 624 | 460 | 57.56 |
| Adjacent tissue | 1026 | 67 | 959 | 6.53 | ||
| Sample 2 | 2 FND | 1069 | 29 | 1040 | 2.71 | |
| II.1 | Sample 3 | Tumor | 1092 | 453 | 639 | 41.48 |
| Adjacent tissue | 1005 | 107 | 898 | 10.65 | ||
| Sample 4 | Tumor | 1094 | 288 | 806 | 26.33 | |
| Adjacent tissue | 1071 | 8 | 1063 | 0.75 | ||
| II.2 | Sample 5 | Tumor | 1006 | 536 | 470 | 53.28 |
| Adjacent tissue | 1017 | 14 | 1003 | 1.38 | ||
| Sample 6 | Tumor | 902 | 431 | 471 | 47.78 | |
| Adjacent tissue | 1027 | 48 | 979 | 4.67 |
Disclaimer/Publisher’s Note: The statements, opinions and data contained in all publications are solely those of the individual author(s) and contributor(s) and not of MDPI and/or the editor(s). MDPI and/or the editor(s) disclaim responsibility for any injury to people or property resulting from any ideas, methods, instructions or products referred to in the content. |
© 2024 by the authors. Licensee MDPI, Basel, Switzerland. This article is an open access article distributed under the terms and conditions of the Creative Commons Attribution (CC BY) license (https://creativecommons.org/licenses/by/4.0/).
Share and Cite
Teixeira, E.; Fernandes, C.; Bungărdean, M.; Paula, A.D.C.; Lima, R.T.; Batista, R.; Vinagre, J.; Sobrinho-Simões, M.; Máximo, V.; Soares, P. Investigating USP42 Mutation as Underlying Cause of Familial Non-Medullary Thyroid Carcinoma. Int. J. Mol. Sci. 2024, 25, 1522. https://doi.org/10.3390/ijms25031522
Teixeira E, Fernandes C, Bungărdean M, Paula ADC, Lima RT, Batista R, Vinagre J, Sobrinho-Simões M, Máximo V, Soares P. Investigating USP42 Mutation as Underlying Cause of Familial Non-Medullary Thyroid Carcinoma. International Journal of Molecular Sciences. 2024; 25(3):1522. https://doi.org/10.3390/ijms25031522
Chicago/Turabian StyleTeixeira, Elisabete, Cláudia Fernandes, Maria Bungărdean, Arnaud Da Cruz Paula, Raquel T. Lima, Rui Batista, João Vinagre, Manuel Sobrinho-Simões, Valdemar Máximo, and Paula Soares. 2024. "Investigating USP42 Mutation as Underlying Cause of Familial Non-Medullary Thyroid Carcinoma" International Journal of Molecular Sciences 25, no. 3: 1522. https://doi.org/10.3390/ijms25031522
APA StyleTeixeira, E., Fernandes, C., Bungărdean, M., Paula, A. D. C., Lima, R. T., Batista, R., Vinagre, J., Sobrinho-Simões, M., Máximo, V., & Soares, P. (2024). Investigating USP42 Mutation as Underlying Cause of Familial Non-Medullary Thyroid Carcinoma. International Journal of Molecular Sciences, 25(3), 1522. https://doi.org/10.3390/ijms25031522