
Expression of RASSF1A, DIRAS3, and AKAP9 Genes in Thyroid Lesions: Implications for Differential Diagnosis and Prognosis of Thyroid Carcinomas

 , , and
Abstract
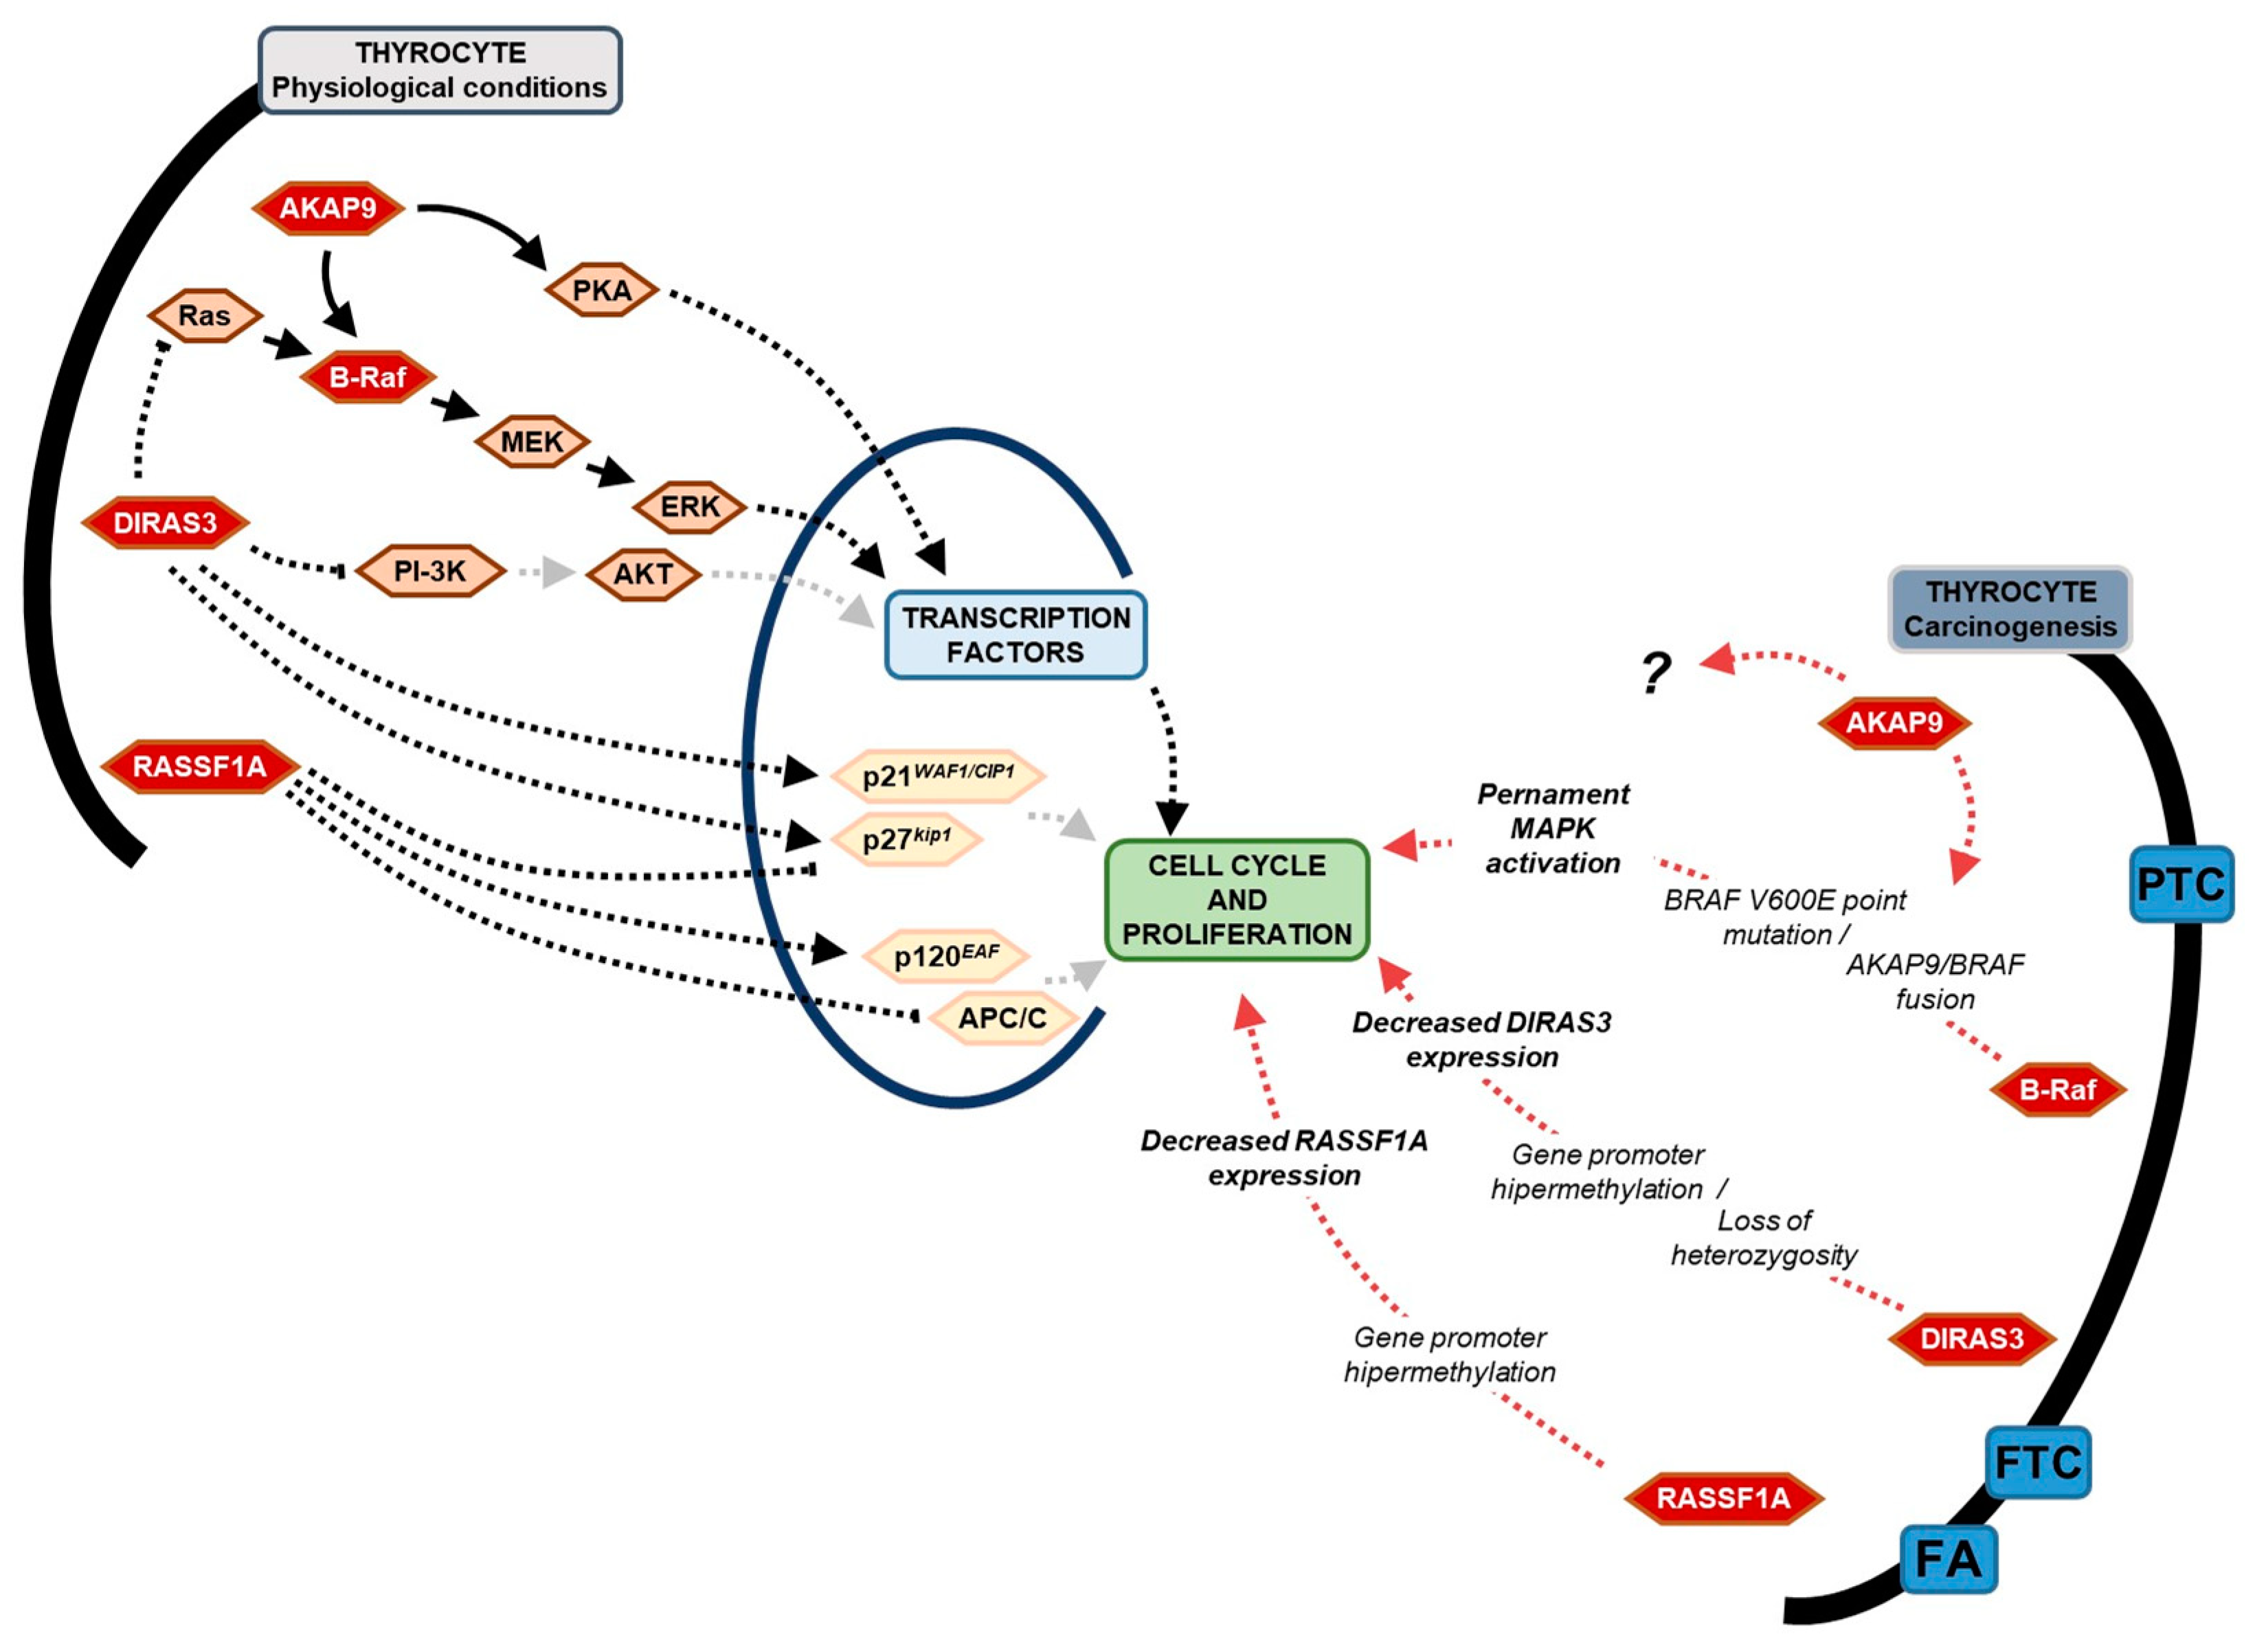
1. Introduction
2. Results
2.1. BRAF V600E Mutation
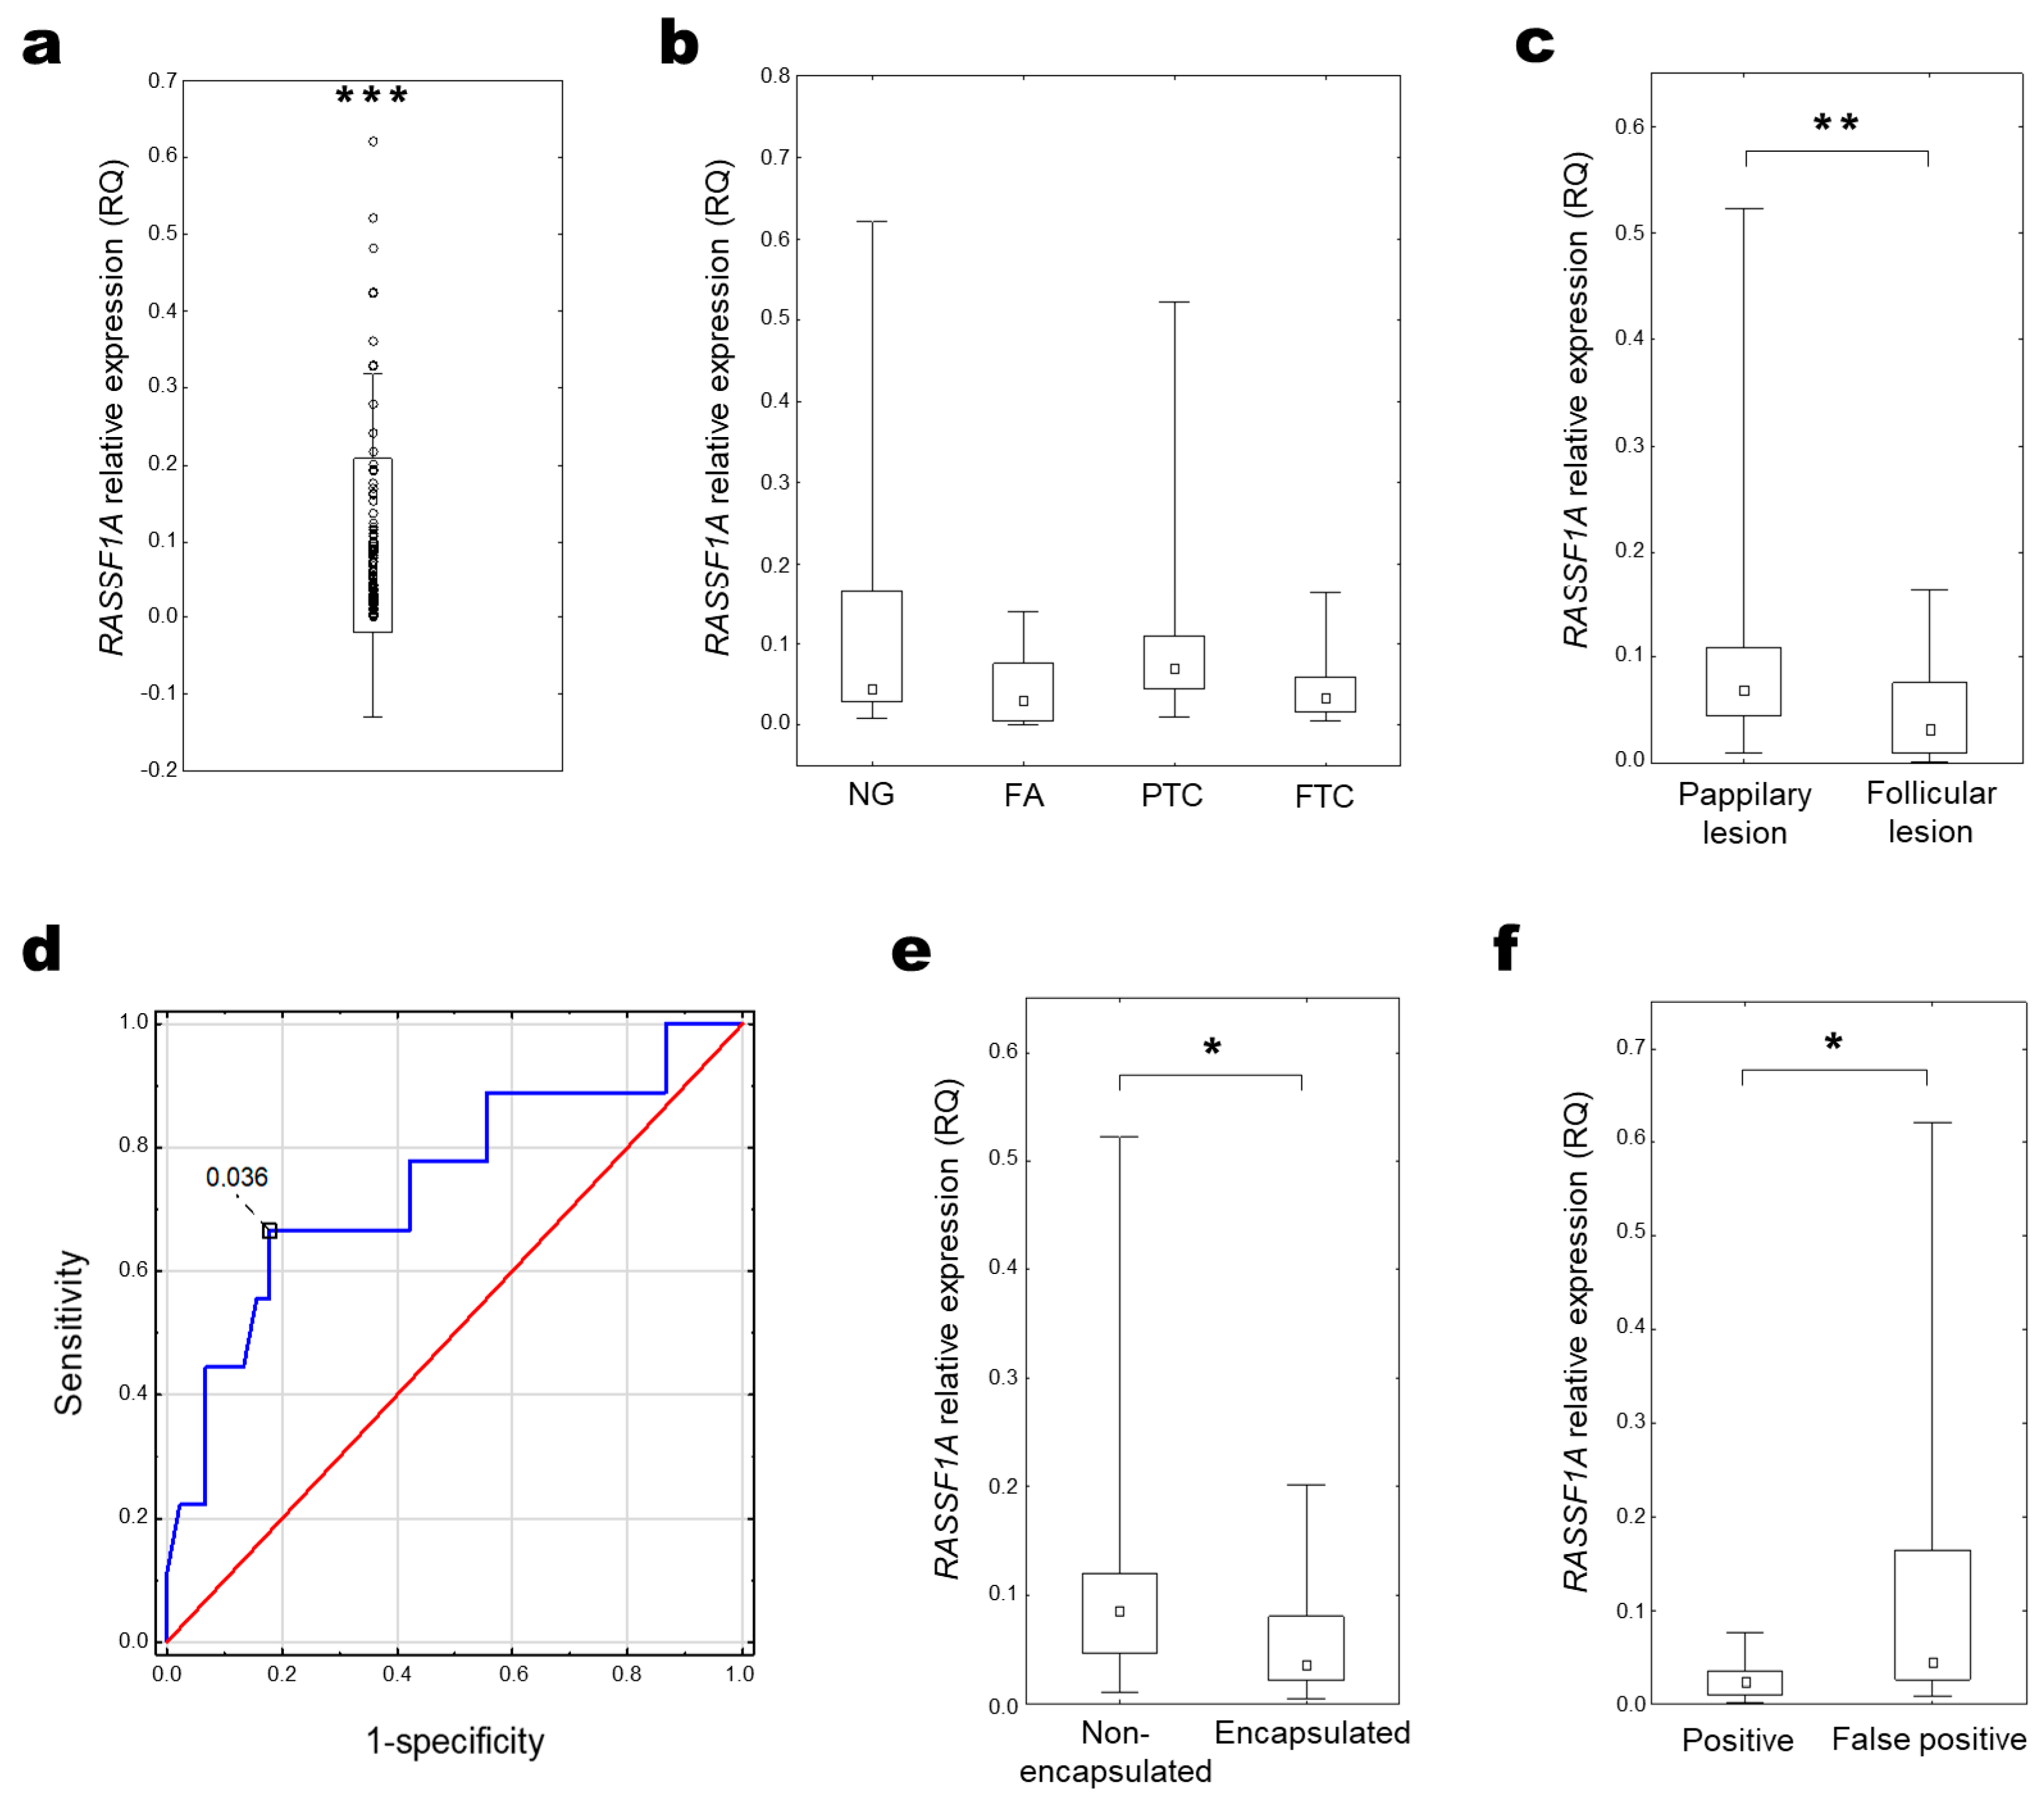
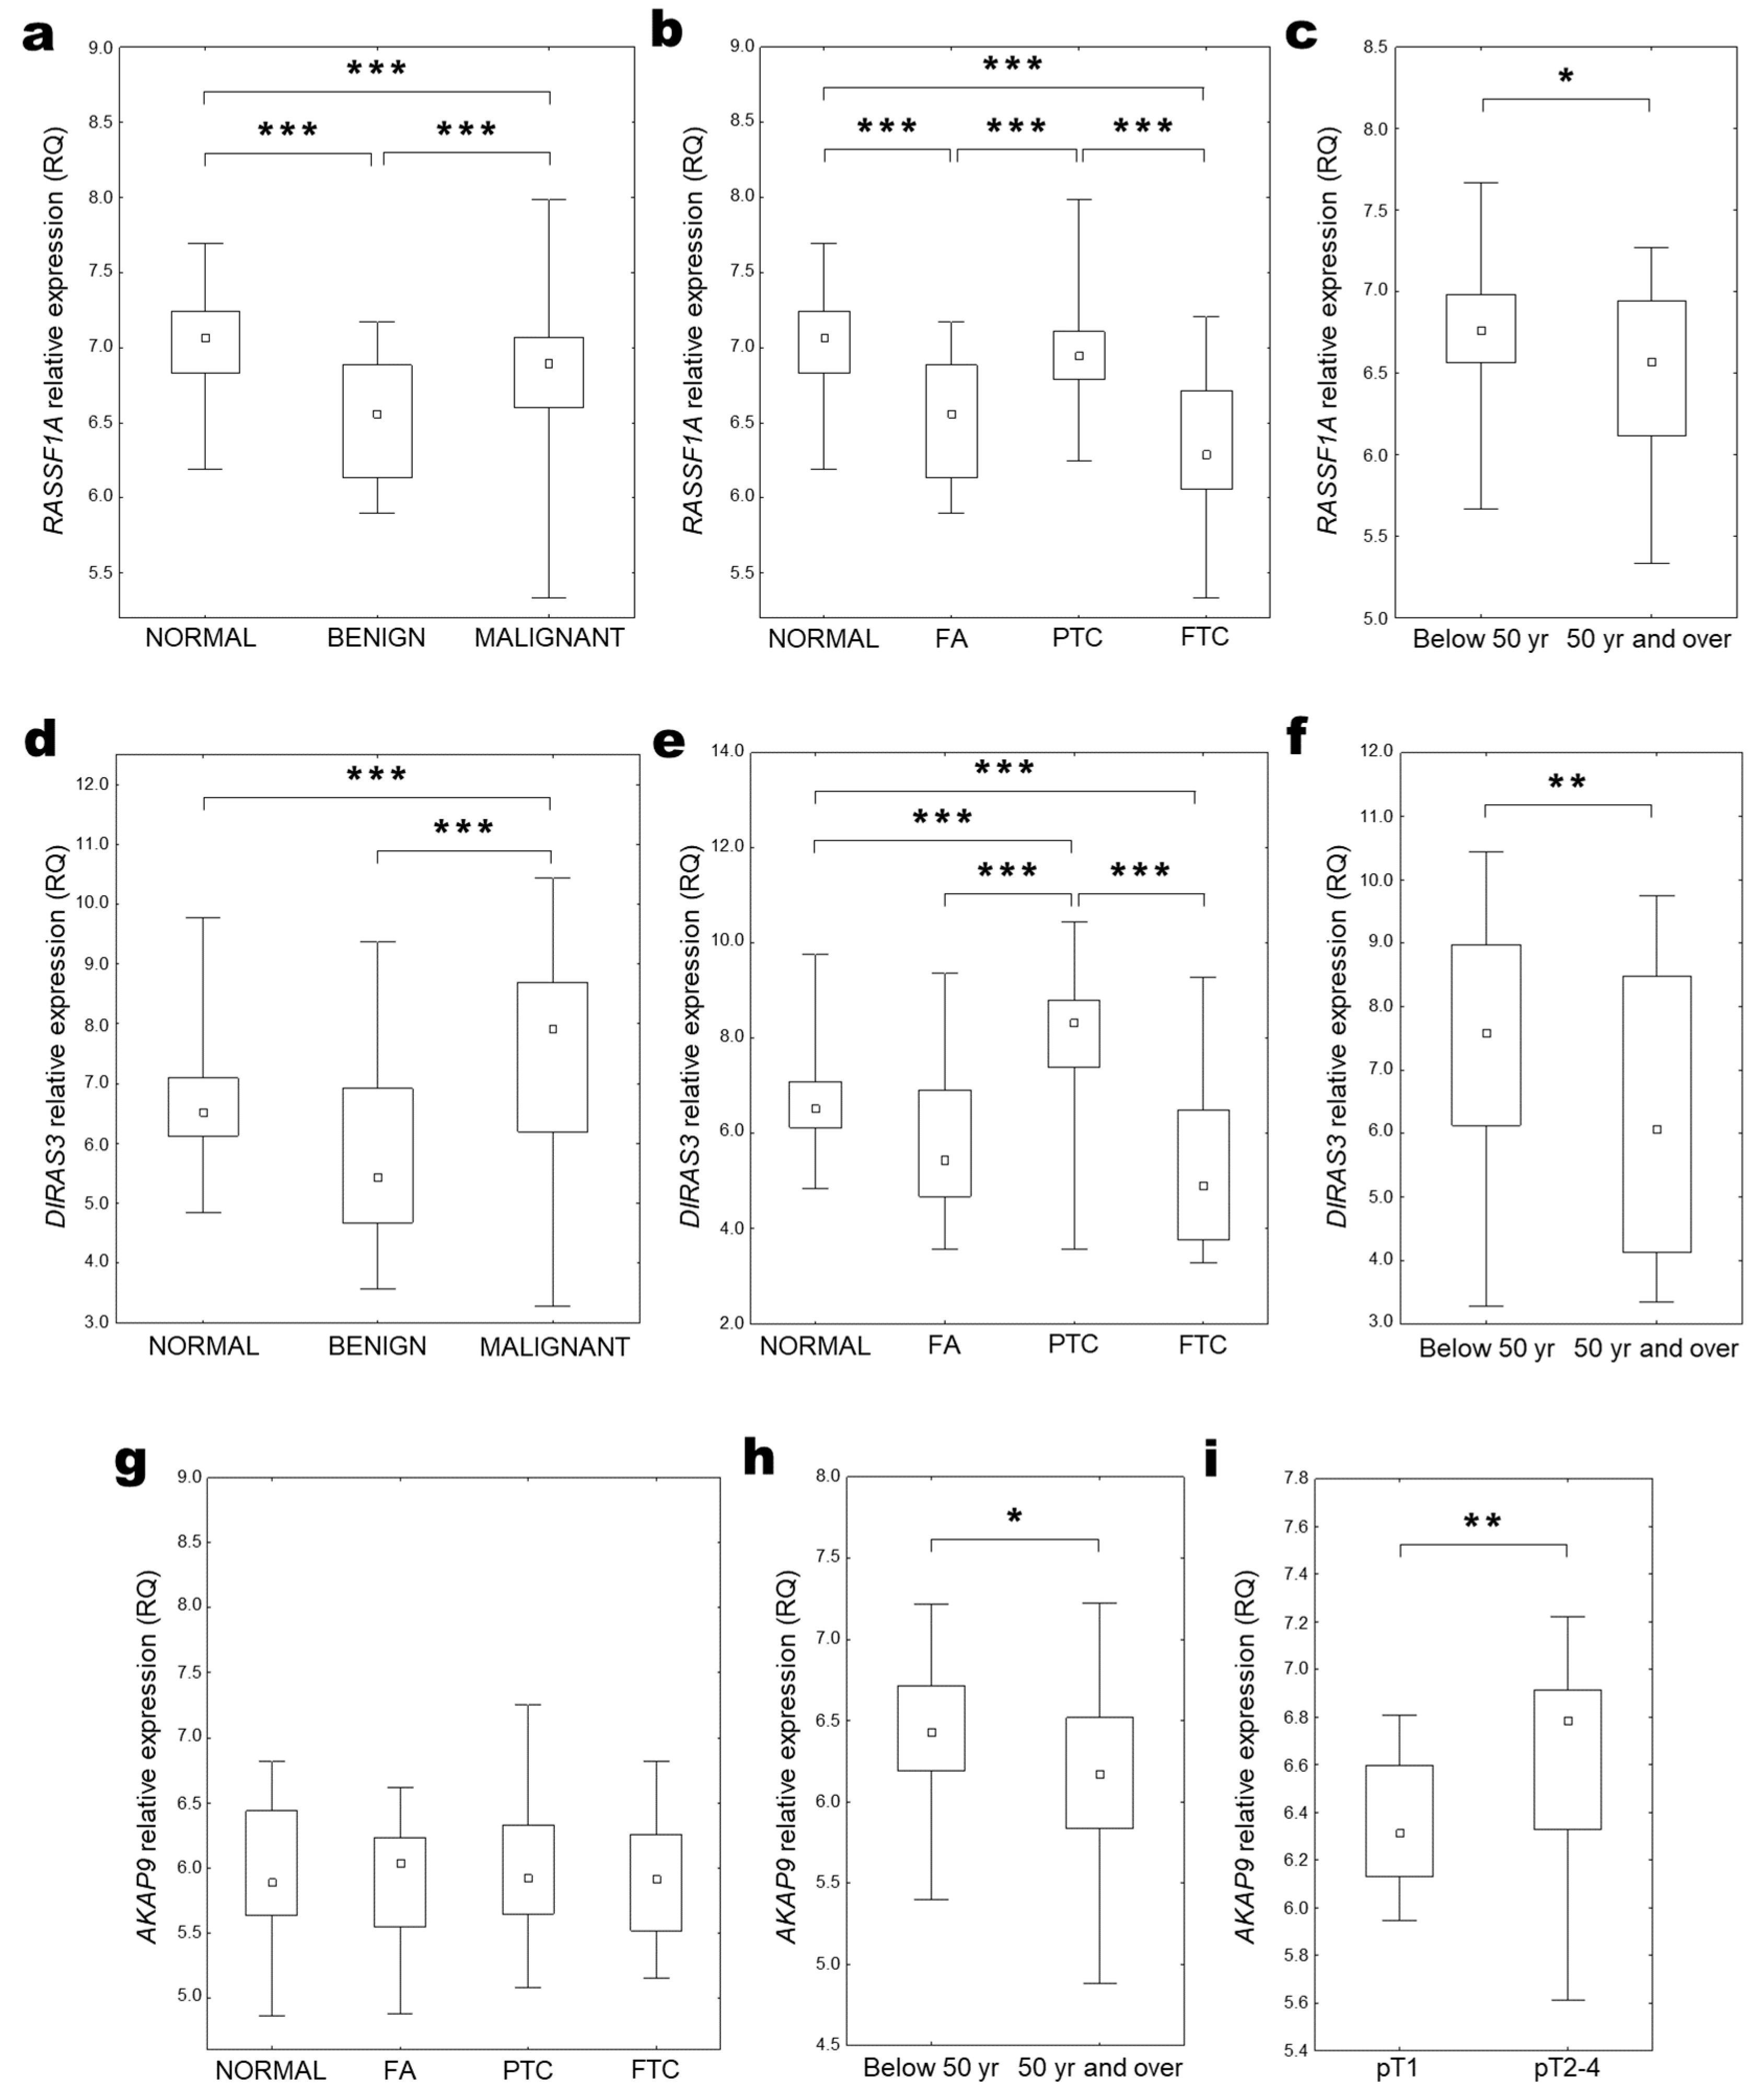
2.2. RASSF1A Expression
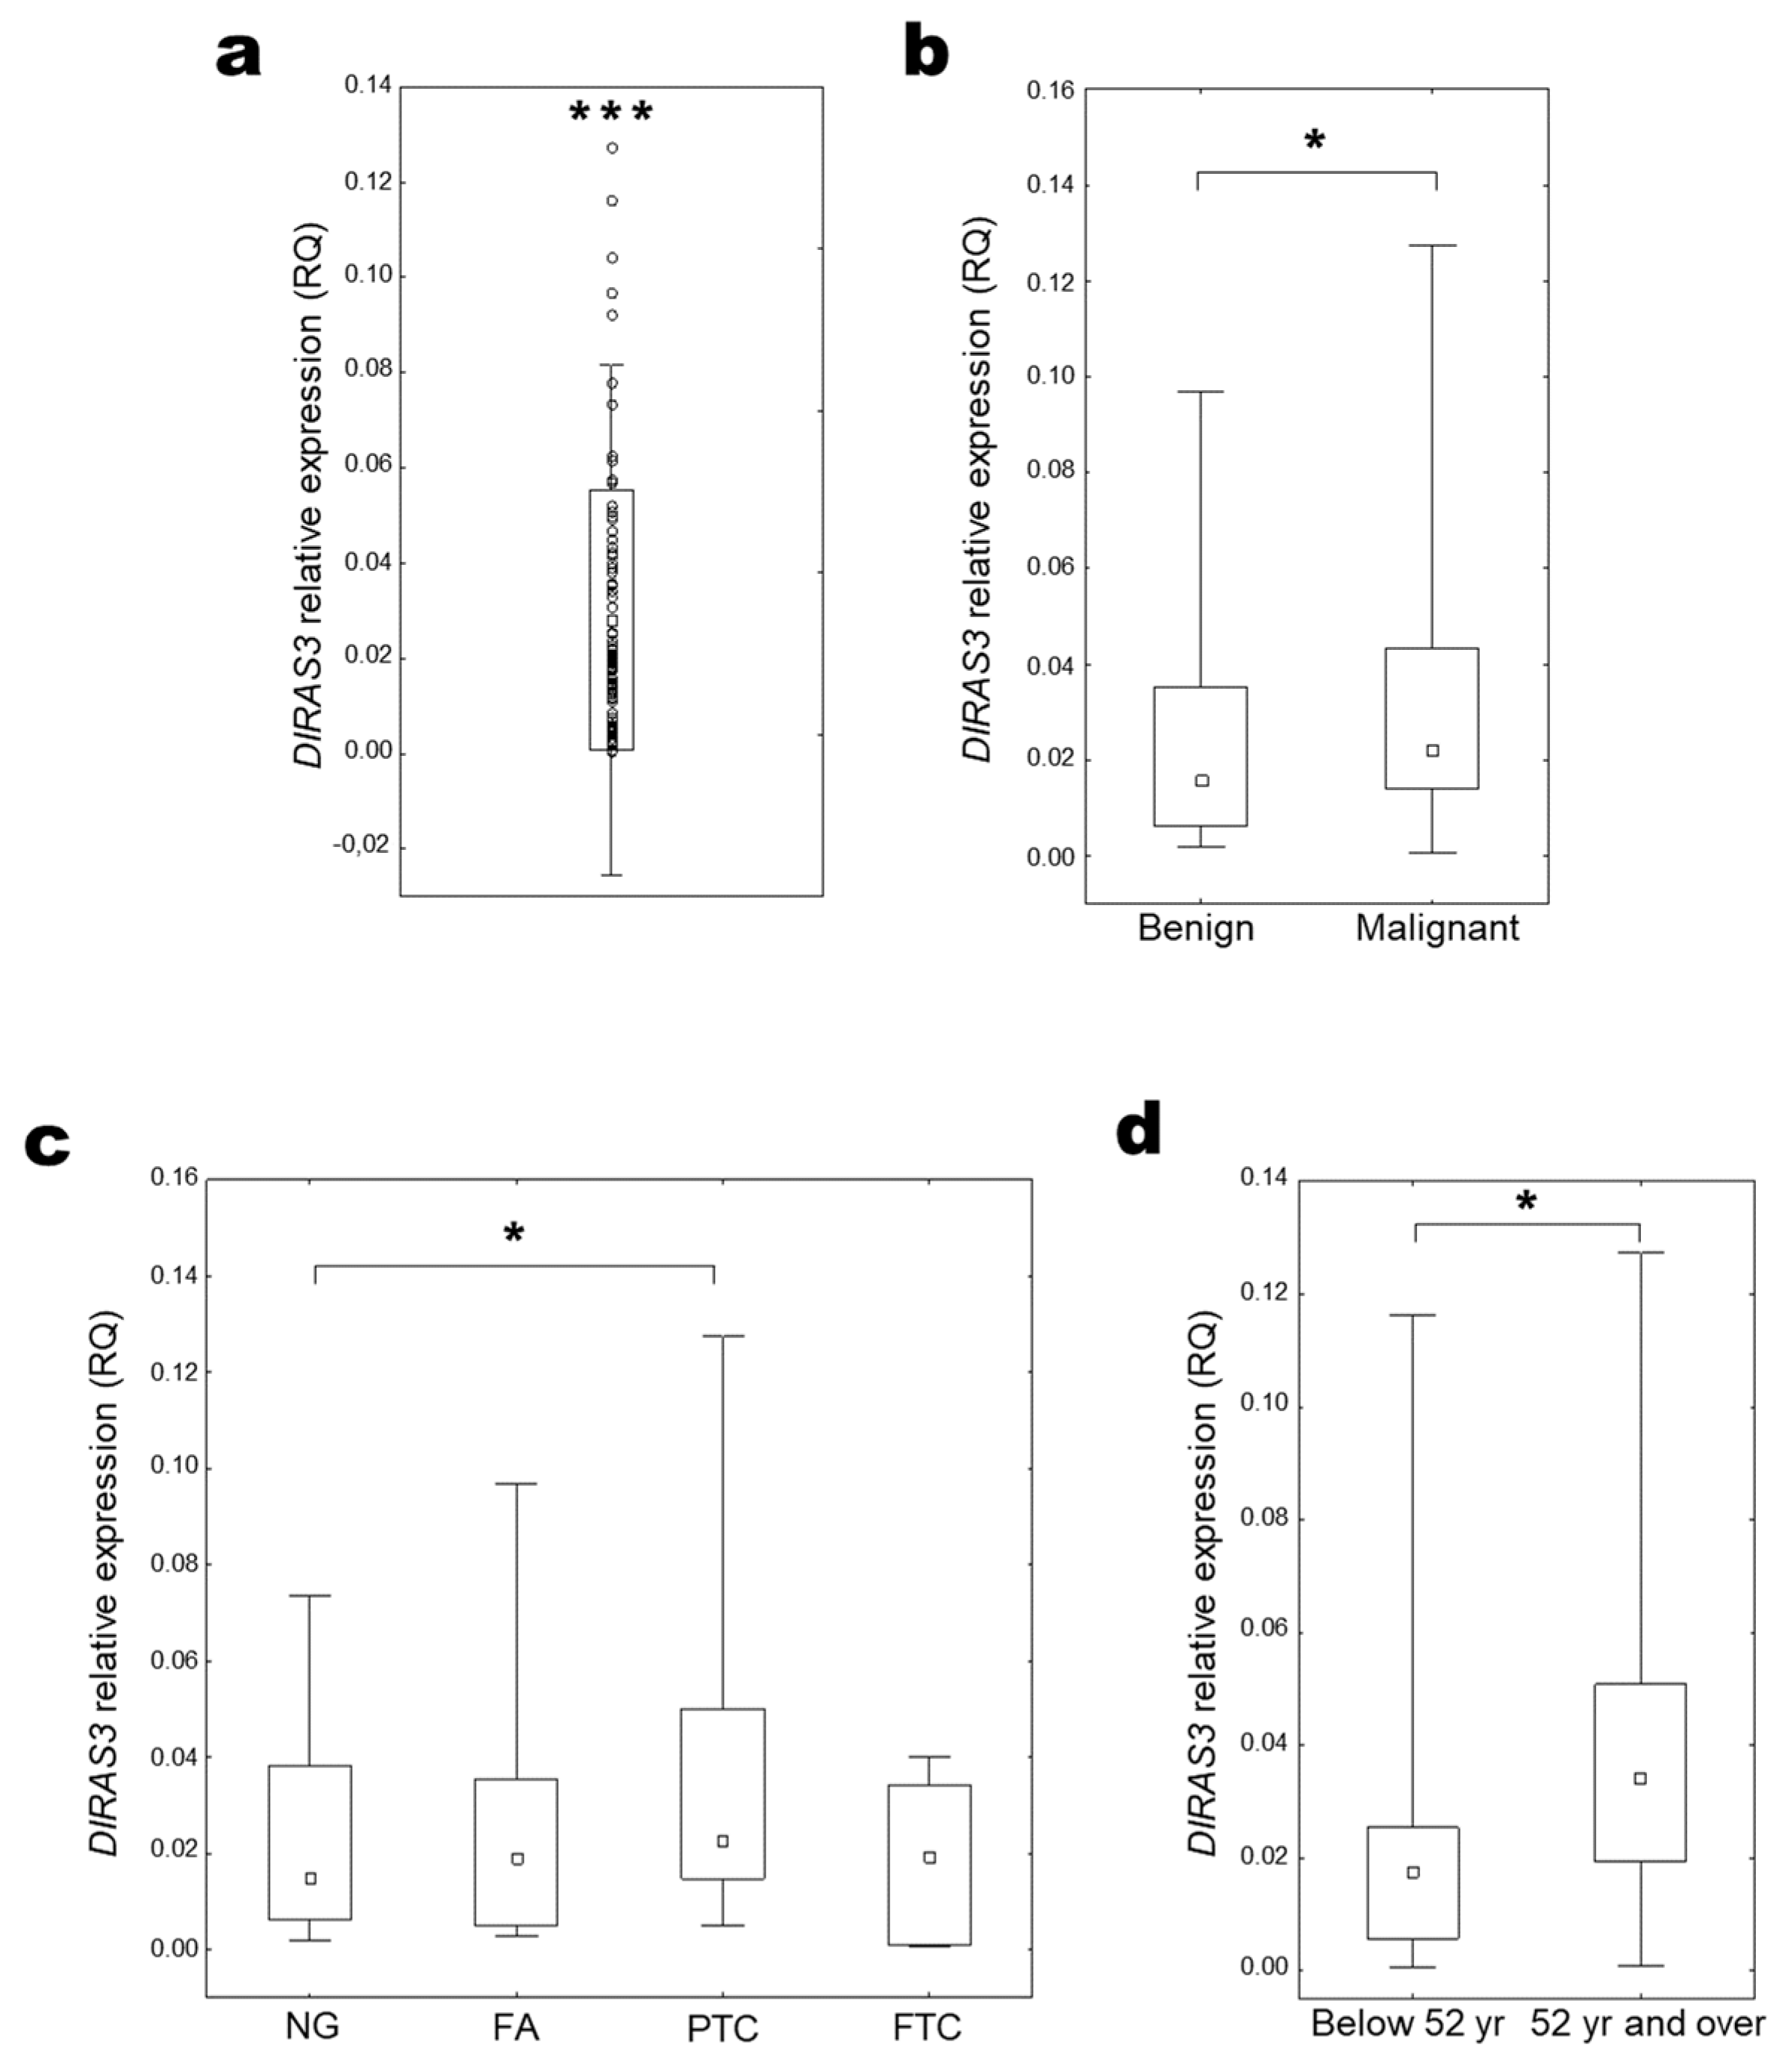
2.3. DIRAS3 Expression
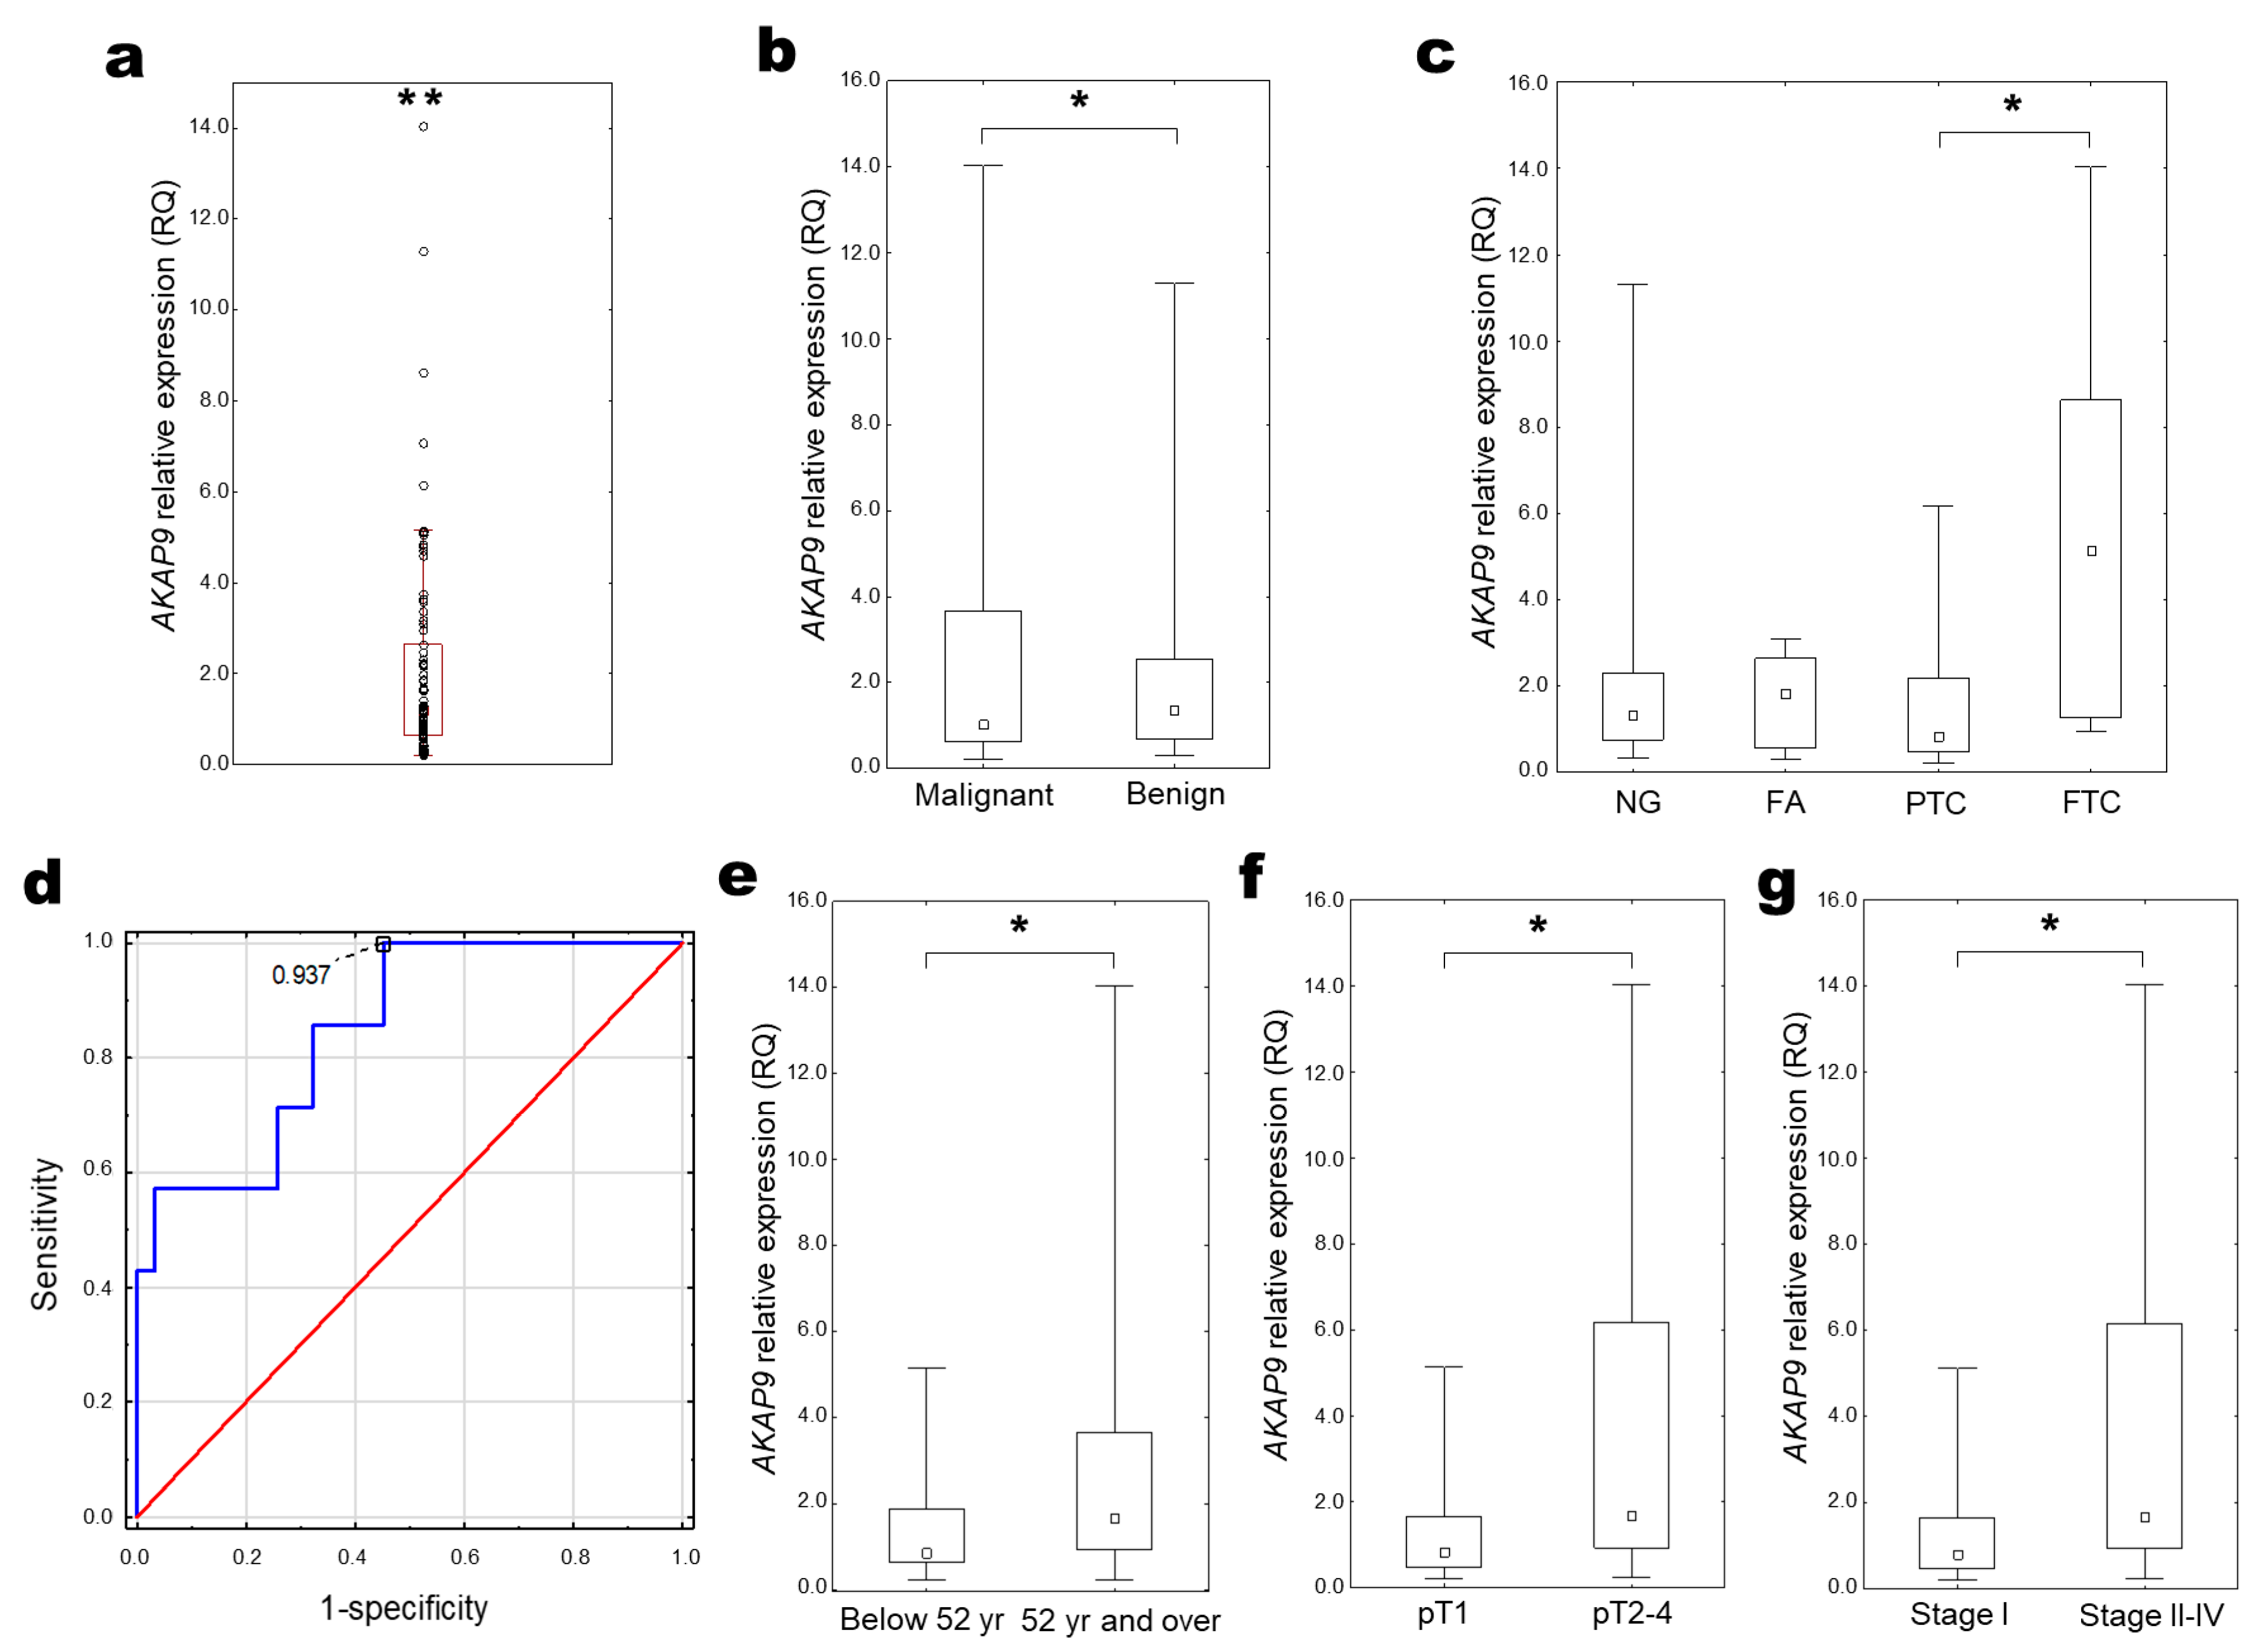
2.4. AKAP9 Expression
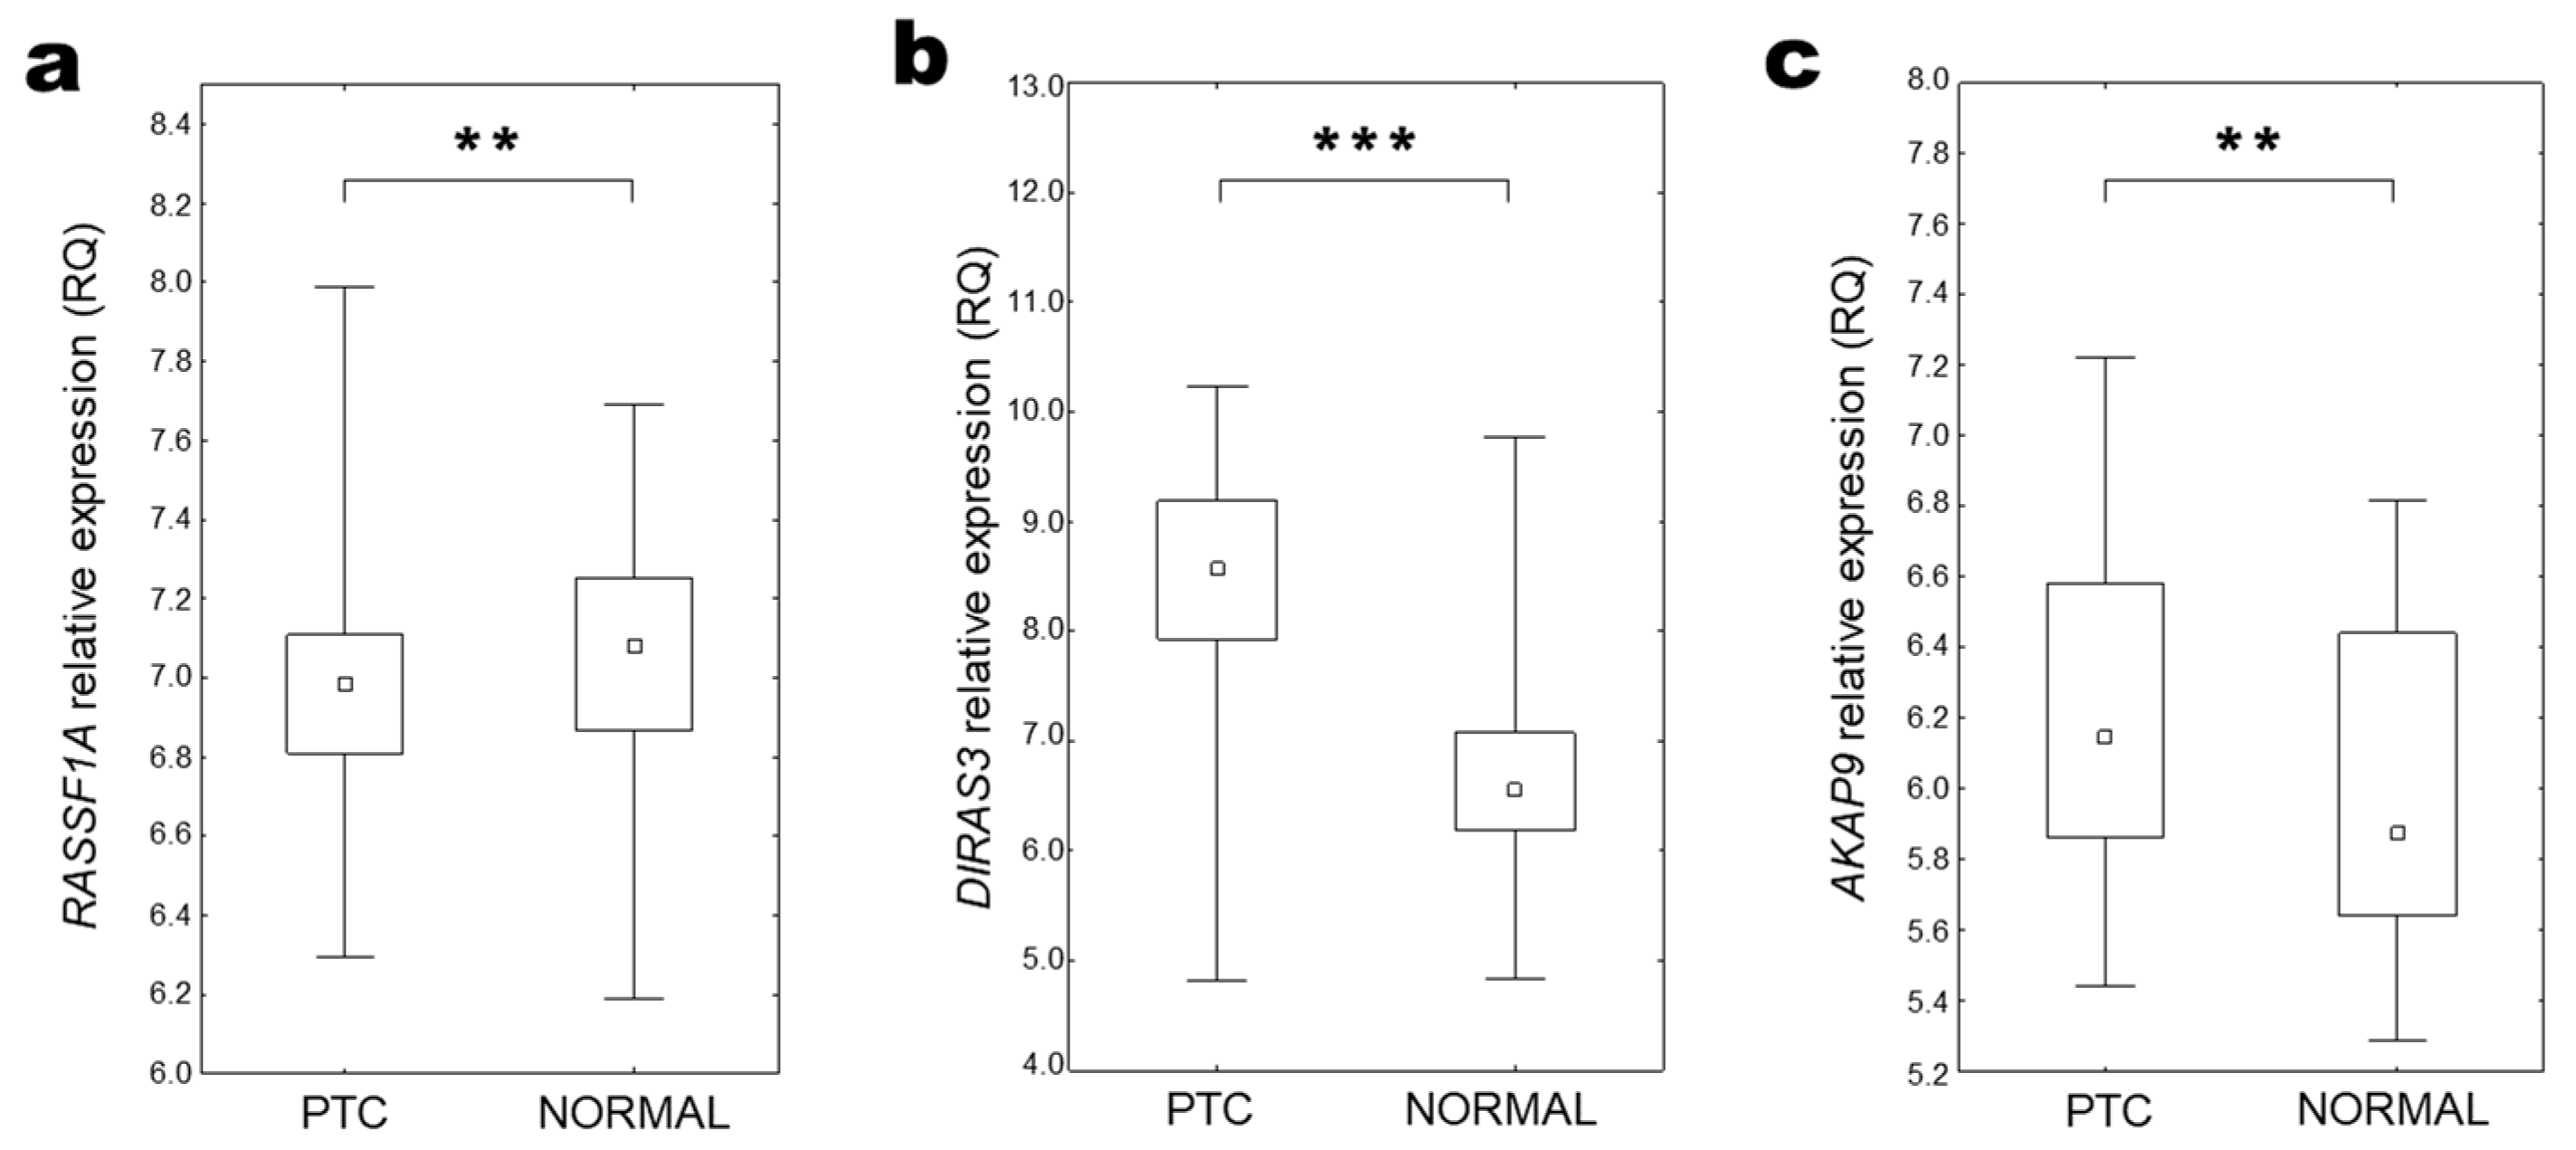
2.5. RASSF1A, DIRAS3, and AKAP9 Expression in Thyroid Tissue (in GEO Database)
3. Discussion
4. Materials and Methods
4.1. Thyroid Tissues
4.2. DNA and RNA Isolation, Reverse Transcription
4.3. ARMS-PCR
4.4. Evaluation of Gene Expression
4.5. GEO Dataset Analysis
4.6. Statistical Analysis
5. Conclusions
Supplementary Materials
Author Contributions
Funding
Institutional Review Board Statement
Informed Consent Statement
Data Availability Statement
Acknowledgments
Conflicts of Interest
References
- Kebebew, E.; Weng, J.; Bauer, J.; Ranvier, G.; Clark, O.H.; Duh, Q.Y.; Shibru, D.; Bastian, B.; Griffin, A. The prevalence and prognostic value of BRAF mutation in thyroid cancer. Ann. Surg. 2007, 246, 466–470. [Google Scholar] [CrossRef] [PubMed]
- Lee, S.T.; Kim, S.W.; Ki, C.S.; Jang, J.H.; Shin, J.H.; Oh, Y.L.; Kim, J.W.; Chung, J.H. Clinical implication of highly sensitive detection of the BRAF V600E mutation in fine-needle aspirations of thyroid nodules: A comparative analysis of three molecular assays in 4585 consecutive cases in a BRAF V600E mutation-prevalent area. J. Clin. Endocrinol. Metab. 2012, 97, 2299–2306. [Google Scholar] [CrossRef] [PubMed][Green Version]
- Li, M.; Dal Maso, L.; Vaccarella, S. Global trends in thyroid cancer incidence and the impact of overdiagnosis. Lancet Diabetes Endocrinol. 2020, 8, 468–470. [Google Scholar] [CrossRef] [PubMed]
- Sung, H.; Ferlay, J.; Siegel, R.L.; Laversanne, M.; Soerjomataram, I.; Jemal, A.; Bray, F. Global Cancer Statistics 2020: GLOBOCAN Estimates of Incidence and Mortality Worldwide for 36 Cancers in 185 Countries. CA Cancer J. Clin. 2021, 71, 209–249. [Google Scholar] [CrossRef] [PubMed]
- Pizzato, M.; Li, M.; Vignat, J.; Laversanne, M.; Singh, D.; La Vecchia, C.; Vaccarella, S. The epidemiological landscape of thyroid cancer worldwide: GLOBOCAN estimates for incidence and mortality rates in 2020. Lancet Diabetes Endocrinol. 2022, 10, 264–272. [Google Scholar] [CrossRef] [PubMed]
- Patel, H.H.; Goyal, N.; Goldenberg, D. Imaging, genetic testing, and biomarker assessment of follicular cell-derived thyroid cancer. Ann. Med. 2014, 46, 409–416. [Google Scholar] [CrossRef]
- Guevara, N.; Lassalle, S.; Benaim, G.; Sadoul, J.L.; Santini, J.; Hofman, P. Role of frozen section analysis in nodular thyroid pathology. Eur. Ann. Otorhinolaryngol. Head Neck Dis. 2015, 132, 67–70. [Google Scholar] [CrossRef]
- Sakorafas, G.H.; Peros, G.; Farley, D.R. Thyroid nodules: Does the suspicion for malignancy really justify the increased thyroidectomy rates? Surg. Oncol. 2006, 15, 43–55. [Google Scholar] [CrossRef]
- Muzza, M.; Colombo, C.; Pogliaghi, G.; Karapanou, O.; Fugazzola, L. Molecular markers for the classification of cytologically indeterminate thyroid nodules. J. Endocrinol. Investig. 2020, 43, 703–716. [Google Scholar] [CrossRef]
- Nylén, C.; Mechera, R.; Maréchal-Ross, I.; Tsang, V.; Chou, A.; Gill, A.J.; Clifton-Bligh, R.J.; Robinson, B.G.; Sywak, M.S.; Sidhu, S.B.; et al. Molecular Markers Guiding Thyroid Cancer Management. Cancers 2020, 12, 2164. [Google Scholar] [CrossRef]
- Rajab, M.; Payne, R.J.; Forest, V.I.; Pusztaszeri, M. Molecular Testing for Thyroid Nodules: The Experience at McGill University Teaching Hospitals in Canada. Cancers 2022, 14, 4140. [Google Scholar] [CrossRef] [PubMed]
- Xing, M. BRAF mutation in papillary thyroid cancer: Pathogenic role, molecular bases, and clinical implications. Endocr. Rev. 2007, 28, 742–762. [Google Scholar] [CrossRef] [PubMed]
- Schubert, L.; Mariko, M.L.; Clerc, J.; Huillard, O.; Groussin, L. MAPK Pathway Inhibitors in Thyroid Cancer: Preclinical and Clinical Data. Cancers 2023, 15, 710. [Google Scholar] [CrossRef] [PubMed]
- Frasca, F.; Nucera, C.; Pellegriti, G.; Gangemi, P.; Attard, M.; Stella, M.; Loda, M.; Vella, V.; Giordano, C.; Trimarchi, F.; et al. BRAF(V600E) mutation and the biology of papillary thyroid cancer. Endocr. Relat. Cancer 2008, 15, 191–205. [Google Scholar] [CrossRef] [PubMed]
- Huang, T.; Zhuge, J.; Zhang, W.W. Sensitive detection of BRAF V600E mutation by Amplification Refractory Mutation System (ARMS)-PCR. Biomark Res. 2013, 1, 3. [Google Scholar] [CrossRef] [PubMed]
- Schulten, H.J.; Alotibi, R.; Al-Ahmadi, A.; Ata, M.; Karim, S.; Huwait, E.; Gari, M.; Al-Ghamdi, K.; Al-Mashat, F.; Al-Hamour, O.; et al. Effect of BRAF mutational status on expression profiles in conventional papillary thyroid carcinomas. BMC Genom. 2015, 16 (Suppl. 1), S6. [Google Scholar] [CrossRef]
- Brzeziańska, E.; Pastuszak-Lewandoska, D.; Wojciechowska, K.; Migdalska-Sek, M.; Cyniak-Magierska, A.; Nawrot, E.; Lewiński, A. Investigation of V600E BRAF mutation in papillary thyroid carcinoma in the Polish population. Neuro Endocrinol. Lett. 2007, 28, 351–359. [Google Scholar]
- Chakraborty, A.; Narkar, A.; Mukhopadhyaya, R.; Kane, S.; D’Cruz, A.; Rajan, M.G. BRAF V600E mutation in papillary thyroid carcinoma: Significant association with node metastases and extra thyroidal invasion. Endocr. Pathol. 2012, 23, 83–93. [Google Scholar] [CrossRef]
- Ciampi, R.; Zhu, Z.; Nikiforov, Y.E. BRAF copy number gains in thyroid tumors detected by fluorescence in situ hybridization. Endocr. Pathol. 2005, 16, 99–105. [Google Scholar] [CrossRef]
- Amin, K.S.; Banerjee, P.P. The cellular functions of RASSF1A and its inactivation in prostate cancer. J. Carcinog. 2012, 11, 3. [Google Scholar] [CrossRef]
- Li, X.; Liu, S.; Fang, X.; He, C.; Hu, X. The mechanisms of DIRAS family members in role of tumor suppressor. J. Cell Physiol. 2019, 234, 5564–5577. [Google Scholar] [CrossRef] [PubMed]
- Dubois, F.; Bergot, E.; Zalcman, G.; Levallet, G. RASSF1A, puppeteer of cellular homeostasis, fights tumorigenesis, and metastasis-an updated review. Cell Death Dis. 2019, 10, 928. [Google Scholar] [CrossRef] [PubMed]
- García-Gutiérrez, L.; McKenna, S.; Kolch, W.; Matallanas, D. RASSF1A Tumour Suppressor: Target the Network for Effective Cancer Therapy. Cancers 2020, 12, 229. [Google Scholar] [CrossRef] [PubMed]
- Bildik, G.; Liang, X.; Sutton, M.N.; Bast, R.C., Jr.; Lu, Z. DIRAS3: An Imprinted Tumor Suppressor Gene that Regulates RAS and PI3K-driven Cancer Growth, Motility, Autophagy, and Tumor Dormancy. Mol. Cancer Ther. 2022, 21, 25–37. [Google Scholar] [CrossRef] [PubMed]
- Sutton, M.N.; Lu, Z.; Li, Y.C.; Zhou, Y.; Huang, T.; Reger, A.S.; Hurwitz, A.M.; Palzkill, T.; Logsdon, C.; Liang, X.; et al. DIRAS3 (ARHI) Blocks RAS/MAPK Signaling by Binding Directly to RAS and Disrupting RAS Clusters. Cell Rep. 2019, 29, 3448–3459.e6. [Google Scholar] [CrossRef] [PubMed]
- Yu, Y.; Luo, R.; Lu, Z.; Feng, W.W.; Badgwell, D.; Issa, J.P.; Rosen, D.G.; Liu, J.; Bast, R.C., Jr. Biochemistry and biology of ARHI (DIRAS3), an imprinted tumor suppressor gene whose expression is lost in ovarian and breast cancers. Methods Enzymol. 2006, 407, 455–468. [Google Scholar] [CrossRef] [PubMed]
- Lu, Z.; Luo, R.Z.; Lu, Y.; Zhang, X.; Yu, Q.; Khare, S.; Kondo, S.; Kondo, Y.; Yu, Y.; Mills, G.B.; et al. The tumor suppressor gene ARHI regulates autophagy and tumor dormancy in human ovarian cancer cells. J. Clin. Investig. 2008, 118, 3917–3929. [Google Scholar] [CrossRef]
- Badgwell, D.B.; Lu, Z.; Le, K.; Gao, F.; Yang, M.; Suh, G.K.; Bao, J.J.; Das, P.; Andreeff, M.; Chen, W.; et al. The tumor-suppressor gene ARHI (DIRAS3) suppresses ovarian cancer cell migration through inhibition of the Stat3 and FAK/Rho signaling pathways. Oncogene 2012, 31, 68–79. [Google Scholar] [CrossRef]
- Lu, Z.; Baquero, M.T.; Yang, H.; Yang, M.; Reger, A.S.; Kim, C.; Levine, D.A.; Clarke, C.H.; Liao, W.S.; Bast, R.C., Jr. DIRAS3 regulates the autophagosome initiation complex in dormant ovarian cancer cells. Autophagy 2014, 10, 1071–1092. [Google Scholar] [CrossRef]
- Czarnecka, K.; Pastuszak-Lewandoska, D.; Migdalska-Sek, M.; Nawrot, E.; Brzezinski, J.; Dedecjus, M.; Pomorski, L.; Brzezianska, E. Aberrant methylation as a main mechanism of TSGs silencing in PTC. Front. Biosci. Elite Ed. 2011, 3, 137–157. [Google Scholar] [CrossRef][Green Version]
- Weber, F.; Aldred, M.A.; Morrison, C.D.; Plass, C.; Frilling, A.; Broelsch, C.E.; Waite, K.A.; Eng, C. Silencing of the maternally imprinted tumor suppressor ARHI contributes to follicular thyroid carcinogenesis. J. Clin. Endocrinol. Metab. 2005, 90, 1149–1155. [Google Scholar] [CrossRef] [PubMed]
- Reggi, E.; Diviani, D. The role of A-kinase anchoring proteins in cancer development. Cell Signal. 2017, 40, 143–155. [Google Scholar] [CrossRef] [PubMed]
- Colledge, M.; Scott, J.D. AKAPs: From structure to function. Trends Cell Biol. 1999, 9, 216–221. [Google Scholar] [CrossRef] [PubMed]
- Jo, Y.S.; Kim, M.S.; Yoo, N.J.; Lee, S.H. Frameshift Mutations of AKAP9 Gene in Gastric and Colorectal Cancers with High Microsatellite Instability. Pathol. Oncol. Res. 2016, 22, 587–592. [Google Scholar] [CrossRef] [PubMed]
- Ciampi, R.; Knauf, J.A.; Kerler, R.; Gandhi, M.; Zhu, Z.; Nikiforova, M.N.; Rabes, H.M.; Fagin, J.A.; Nikiforov, Y.E. Oncogenic AKAP9-BRAF fusion is a novel mechanism of MAPK pathway activation in thyroid cancer. J. Clin. Investig. 2005, 115, 94–101. [Google Scholar] [CrossRef] [PubMed]
- Yang, M.H.; Hu, Z.Y.; Xu, C.; Xie, L.Y.; Wang, X.Y.; Chen, S.Y.; Li, Z.G. MALAT1 promotes colorectal cancer cell proliferation/migration/invasion via PRKA kinase anchor protein 9. Biochim. Biophys. Acta 2015, 1852, 166–174. [Google Scholar] [CrossRef] [PubMed]
- Hu, Z.Y.; Liu, Y.P.; Xie, L.Y.; Wang, X.Y.; Yang, F.; Chen, S.Y.; Li, Z.G. AKAP-9 promotes colorectal cancer development by regulating Cdc42 interacting protein 4. Biochim. Biophys. Acta 2016, 1862, 1172–1181. [Google Scholar] [CrossRef]
- Yan, Q.; Wu, Y.; Li, D.; Li, Y. A-Kinase Anchoring Protein 9 Promotes Gastric Cancer Progression as a Downstream Effector of Cadherin 1. J. Oncol. 2022, 2022, 2830634. [Google Scholar] [CrossRef]
- Wu, S.; Shen, D.; Zhao, L. AKAP9 Upregulation Predicts Unfavorable Prognosis in Pediatric Acute Myeloid Leukemia and Promotes Stemness Properties via the Wnt/β-Catenin Pathway. Cancer Manag. Res. 2022, 14, 157–167. [Google Scholar] [CrossRef]
- Xing, M.; Alzahrani, A.S.; Carson, K.A.; Viola, D.; Elisei, R.; Bendlova, B.; Yip, L.; Mian, C.; Vianello, F.; Tuttle, R.M.; et al. Association between BRAF V600E mutation and mortality in patients with papillary thyroid cancer. JAMA 2013, 309, 1493–1501. [Google Scholar] [CrossRef]
- Chen, X.; Zhou, Q.; Wang, F.; Zhang, F.; Du, H.; Zhang, Q.; Wu, W.; Gong, X. Value of BRAF V600E in High-Risk Thyroid Nodules with Benign Cytology Results. AJNR Am. J. Neuroradiol. 2018, 39, 2360–2365. [Google Scholar] [CrossRef] [PubMed]
- Kim, W.Y.; Kim, H.; Hwang, T.S.; Oh, S.Y. Comparison between Real-Time PCR and Pyrosequencing for Detection of BRAF V600E Mutation in Thyroid Fine-Needle Aspirates. Appl. Immunohistochem. Mol. Morphol. 2017, 25, 358–365. [Google Scholar] [CrossRef] [PubMed]
- Ellison, G.; Donald, E.; McWalter, G.; Knight, L.; Fletcher, L.; Sherwood, J.; Cantarini, M.; Orr, M.; Speake, G. A comparison of ARMS and DNA sequencing for mutation analysis in clinical biopsy samples. J. Exp. Clin. Cancer Res. 2010, 29, 132. [Google Scholar] [CrossRef] [PubMed]
- Nikiforova, M.N.; Kimura, E.T.; Gandhi, M.; Biddinger, P.W.; Knauf, J.A.; Basolo, F.; Zhu, Z.; Giannini, R.; Salvatore, G.; Fusco, A.; et al. BRAF mutations in thyroid tumors are restricted to papillary carcinomas and anaplastic or poorly differentiated carcinomas arising from papillary carcinomas. J. Clin. Endocrinol. Metab. 2003, 88, 5399–5404. [Google Scholar] [CrossRef] [PubMed]
- Koziołek, M.; Bińczak-Kuleta, A.; Stepaniuk, M.; Parczewski, M.; Andrysiak-Mamos, E.; Sieradzka, A.; Safranow, K.; Osowicz-Korolonek, L.; Kiedrowicz, B.; Kram, A.; et al. Frequency assessment of BRAF mutation, KRas mutation, and RASSF1A methylation in nodular goitre based on fine-needle aspiration cytology specimens Ocena częstości występowania mutacji genów BRAF, KRas oraz. Endokrynol. Pol. 2015, 66, 384–393. [Google Scholar] [CrossRef] [PubMed][Green Version]
- Czarniecka, A.; Rusinek, D.; Stobiecka, E.; Krajewska, J.; Kowal, M.; Kropińska, A.; Zebracka, J.; Kowalska, M.; Włoch, J.; Maciejewski, A.; et al. Occurrence of BRAF mutations in a Polish cohort of PTC patients-preliminary results. Endokrynol. Pol. 2010, 61, 462–466. [Google Scholar] [PubMed]
- Murugan, A.K.; Qasem, E.; Al-Hindi, H.; Shi, Y.; Alzahrani, A.S. Classical V600E and other non-hotspot BRAF mutations in adult differentiated thyroid cancer. J. Transl. Med. 2016, 14, 204. [Google Scholar] [CrossRef]
- Wang, Z.; Chen, J.Q.; Liu, J.L.; Qin, X.G. Clinical impact of BRAF mutation on the diagnosis and prognosis of papillary thyroid carcinoma: A systematic review and meta-analysis. Eur. J. Clin. Investig. 2016, 46, 146–157. [Google Scholar] [CrossRef]
- Nakamura, N.; Carney, J.A.; Jin, L.; Kajita, S.; Pallares, J.; Zhang, H.; Qian, X.; Sebo, T.J.; Erickson, L.A.; Lloyd, R.V. RASSF1A and NORE1A methylation and BRAFV600E mutations in thyroid tumors. Lab. Investig. 2005, 85, 1065–1075. [Google Scholar] [CrossRef]
- Pastuszak-Lewandoska, D.; Kordiak, J.; Migdalska-Sęk, M.; Czarnecka, K.H.; Antczak, A.; Górski, P.; Nawrot, E.; Kiszałkiewicz, J.M.; Domańska, D.; Brzeziańska-Lasota, E. Quantitative analysis of mRNA expression levels and DNA methylation profiles of three neighboring genes: FUS1, NPRL2/G21 and RASSF1A in non-small cell lung cancer patients. Respir. Res. 2015, 16, 76. [Google Scholar] [CrossRef]
- Schagdarsurengin, U.; Gimm, O.; Hoang-Vu, C.; Dralle, H.; Pfeifer, G.P.; Dammann, R. Frequent epigenetic silencing of the CpG island promoter of RASSF1A in thyroid carcinoma. Cancer Res. 2002, 62, 3698–3701. [Google Scholar] [PubMed]
- Hoque, M.O.; Rosenbaum, E.; Westra, W.H.; Xing, M.; Ladenson, P.; Zeiger, M.A.; Sidransky, D.; Umbricht, C.B. Quantitative assessment of promoter methylation profiles in thyroid neoplasms. J. Clin. Endocrinol. Metab. 2005, 90, 4011–4018. [Google Scholar] [CrossRef] [PubMed]
- Xing, M. Gene methylation in thyroid tumorigenesis. Endocrinology 2007, 148, 948–953. [Google Scholar] [CrossRef]
- Huang, G.; Chen, J.; Zhou, J.; Xiao, S.; Zeng, W.; Xia, J.; Zeng, X. Epigenetic modification and BRAF gene mutation in thyroid carcinoma. Cancer Cell Int. 2021, 21, 687. [Google Scholar] [CrossRef] [PubMed]
- Kunstman, J.W.; Korah, R.; Healy, J.M.; Prasad, M.; Carling, T. Quantitative assessment of RASSF1A methylation as a putative molecular marker in papillary thyroid carcinoma. Surgery 2013, 154, 1255–1261. [Google Scholar] [CrossRef] [PubMed]
- Brown, T.C.; Juhlin, C.C.; Healy, J.M.; Prasad, M.L.; Korah, R.; Carling, T. Frequent silencing of RASSF1A via promoter methylation in follicular thyroid hyperplasia: A potential early epigenetic susceptibility event in thyroid carcinogenesis. JAMA Surg. 2014, 149, 1146–1152. [Google Scholar] [CrossRef] [PubMed]
- Xing, M.; Cohen, Y.; Mambo, E.; Tallini, G.; Udelsman, R.; Ladenson, P.W.; Sidransky, D. Early occurrence of RASSF1A hypermethylation and its mutual exclusion with BRAF mutation in thyroid tumorigenesis. Cancer Res. 2004, 64, 1664–1668. [Google Scholar] [CrossRef]
- Brait, M.; Loyo, M.; Rosenbaum, E.; Ostrow, K.L.; Markova, A.; Papagerakis, S.; Zahurak, M.; Goodman, S.M.; Zeiger, M.; Sidransky, D.; et al. Correlation between BRAF mutation and promoter methylation of TIMP3, RARβ2 and RASSF1A in thyroid cancer. Epigenetics 2012, 7, 710–719. [Google Scholar] [CrossRef]
- Lázcoz, P.; Muñoz, J.; Nistal, M.; Pestaña, A.; Encío, I.; Castresana, J.S. Frequent promoter hypermethylation of RASSF1A and CASP8 in neuroblastoma. BMC Cancer 2006, 6, 254. [Google Scholar] [CrossRef]
- Bryś, M.; Migdalska-Sęk, M.; Pastuszak-Lewandoska, D.; Forma, E.; Czarnecka, K.; Domańska, D.; Nawrot, E.; Wilkosz, J.; Różański, W.; Brzeziańska, E. Diagnostic value of DNA alteration: Loss of heterozygosity or allelic imbalance-promising for molecular staging of prostate cancers. Med. Oncol. 2013, 30, 391. [Google Scholar] [CrossRef]
- Zhu, H.; Qu, Y. Expression levels of ARHI and Beclin1 in thyroid cancer and their relationship with clinical pathology and prognosis. Oncol. Lett. 2020, 19, 1241–1246. [Google Scholar] [CrossRef] [PubMed]
- Dai, J.; Chen, Q.; Li, G.; Chen, M.; Sun, H.; Yan, M. DIRAS3, GPR171 and RAC2 were identified as the key molecular patterns associated with brain metastasis of breast cancer. Front. Oncol. 2022, 12, 965136. [Google Scholar] [CrossRef] [PubMed]
- Truong, T.; Sauter, W.; McKay, J.D.; Hosgood, H.D., 3rd; Gallagher, C.; Amos, C.I.; Spitz, M.; Muscat, J.; Lazarus, P.; Illig, T.; et al. International Lung Cancer Consortium: Coordinated association study of 10 potential lung cancer susceptibility variants. Carcinogenesis 2010, 31, 625–633. [Google Scholar] [CrossRef]
- Frank, B.; Wiestler, M.; Kropp, S.; Hemminki, K.; Spurdle, A.B.; Sutter, C.; Wappenschmidt, B.; Chen, X.; Beesley, J.; Hopper, J.L.; et al. Association of a common AKAP9 variant with breast cancer risk: A collaborative analysis. J. Natl. Cancer Inst. 2008, 100, 437–442. [Google Scholar] [CrossRef]
- Jarząb, B.; Dedecjus, M.; Słowińska-Klencka, D.; Lewiński, A.; Adamczewski, Z.; Anielski, R.; Bagłaj, M.; Bałdys-Waligórska, A.; Barczyński, M.; Bednarczuk, T.; et al. Guidelines of Polish National Societies Diagnostics and Treatment of Thyroid Carcinoma. 2018 Update. Endokrynol. Pol. 2018, 69, 34–74. [Google Scholar] [CrossRef] [PubMed]
- Edge, S.B.; Compton, C.C. The American Joint Committee on Cancer: The 7th edition of the AJCC cancer staging manual and the future of TNM. Ann. Surg. Oncol. 2010, 17, 1471–1474. [Google Scholar] [CrossRef] [PubMed]
- Schmittgen, T.D.; Livak, K.J. Analyzing real-time PCR data by the comparative C(T) method. Nat Protoc. 2008, 3, 1101–1108. [Google Scholar] [CrossRef]
- Migdalska-Sęk, M.; Czarnecka, K.H.; Kusiński, M.; Pastuszak-Lewandoska, D.; Nawrot, E.; Kuzdak, K.; Brzeziańska-Lasota, E. Clinicopathological Significance of Overall Frequency of Allelic Loss (OFAL) in Lesions Derived from Thyroid Follicular Cell. Mol. Diagn. Ther. 2019, 23, 369–382. [Google Scholar] [CrossRef]
- Akobeng, A.K. Understanding Diagnostic Tests 3: Receiver Operating Characteristic Curves. Acta Paediatr. 2007, 96, 644–647. [Google Scholar] [CrossRef]


| Clinical and Pathological Features of Samples | Number of Samples: | p # | ||
|---|---|---|---|---|
| BRAF V600E | BRAF WT | |||
| A | Patient’s age (below vs over median) | 16 vs 21 | 35 vs 31 | 0.412 |
| B | Gender (women vs men) | 33 vs 4 | 55 vs 11 | 0.564 |
| C | Type of lesion (benign vs malignant) | 11 vs 26 | 41 vs 28 | ** 0.004 |
| D | Histopathological type (NG vs PTC) | 7 vs 23 | 34 vs 20 | *** 0.0006 |
| E | Tumour diameter (below vs over median) | 13 vs 12 | 21 vs 11 | 0.415 |
| F | pT scale (pT1 vs pT2-4) | 17 vs 9 | 15 vs 9 | 1.000 |
| G | N (N0 vs N1) | 18 vs 7 | 19 vs 3 | 0.297 |
| H | Stage (AJCC I vs AJCC II-IV) | 17 vs 8 | 16 vs 8 | 1.000 |
| Clinical and Pathological Features | |
|---|---|
| Number of sample pairs | 120 |
| Median age (years) * | 52.0 (36.2–60.7) |
| Gender | |
| Women | 100 |
| Men | 20 |
| Histopathological type | |
| NG | 46 |
| FA | 14 |
| FTC | 11 |
| PTC | 49 |
| Oxyphilic Metaplasia ** | 5 |
| Clinical and Pathological Features | |
|---|---|
| Number of sample pairs | 60 |
| Median primary tumour diameter (mm) * | 14.0 (7.7–25.0) |
| Below the median | 31 |
| Over the median | 25 |
| nd | 4 |
| pTNM | |
| T1 | 40 |
| T2 | 5 |
| T3 | 15 |
| N0 | 44 |
| N1 | 11 |
| nd | 5 |
| AJCC classification | |
| AJCC I | 41 |
| AJCC II | 3 |
| AJCC III | 12 |
| AJCC IV | 3 |
| nd | 1 |
| Tumour encapsulation | |
| No | 32 |
| Yes | 17 |
| nd | 11 |
| Clinical and Pathological Features | |
|---|---|
| Sample number | 307 |
| Normal thyroid tissue | 80 |
| Pathologically changed tissue | 227 |
| Median age (years) */** | 50.00 (36.00–62.25) |
| Below the median | 53 |
| Over the median | 49 |
| nd | 125 |
| Gender | |
| Women | 92 |
| Men | 41 |
| nd | 172 |
| Histopathological type | |
| Normal thyroid tissue | 80 |
| FA | 35 |
| FTC | 44 |
| PTC | 148 |
| Clinical and Pathological Features | |
|---|---|
| Sample number | 192 |
| Median primary tumour diameter (mm) * | 1.60 (1.50–3.00) |
| Below the median | 16 |
| Over the median | 15 |
| Nd | 161 |
| pTNM | |
| T1 | 6 |
| T2 | 2 |
| T3 | 22 |
| T4 | 2 |
| nd | 160 |
| N0 | 14 |
| N1 | 19 |
| nd | 159 |
| AJCC classification | |
| AJCC I | 19 |
| AJCC II | - |
| AJCC III | 10 |
| AJCC IV | 3 |
| nd | 160 |
Disclaimer/Publisher’s Note: The statements, opinions and data contained in all publications are solely those of the individual author(s) and contributor(s) and not of MDPI and/or the editor(s). MDPI and/or the editor(s) disclaim responsibility for any injury to people or property resulting from any ideas, methods, instructions or products referred to in the content. |
© 2024 by the authors. Licensee MDPI, Basel, Switzerland. This article is an open access article distributed under the terms and conditions of the Creative Commons Attribution (CC BY) license (https://creativecommons.org/licenses/by/4.0/).
Share and Cite
Soboska, K.; Kusiński, M.; Pawelczyk, K.; Migdalska-Sęk, M.; Brzeziańska-Lasota, E.; Czarnecka-Chrebelska, K.H. Expression of RASSF1A, DIRAS3, and AKAP9 Genes in Thyroid Lesions: Implications for Differential Diagnosis and Prognosis of Thyroid Carcinomas. Int. J. Mol. Sci. 2024, 25, 562. https://doi.org/10.3390/ijms25010562
Soboska K, Kusiński M, Pawelczyk K, Migdalska-Sęk M, Brzeziańska-Lasota E, Czarnecka-Chrebelska KH. Expression of RASSF1A, DIRAS3, and AKAP9 Genes in Thyroid Lesions: Implications for Differential Diagnosis and Prognosis of Thyroid Carcinomas. International Journal of Molecular Sciences. 2024; 25(1):562. https://doi.org/10.3390/ijms25010562
Chicago/Turabian StyleSoboska, Kamila, Michał Kusiński, Karol Pawelczyk, Monika Migdalska-Sęk, Ewa Brzeziańska-Lasota, and Karolina H. Czarnecka-Chrebelska. 2024. "Expression of RASSF1A, DIRAS3, and AKAP9 Genes in Thyroid Lesions: Implications for Differential Diagnosis and Prognosis of Thyroid Carcinomas" International Journal of Molecular Sciences 25, no. 1: 562. https://doi.org/10.3390/ijms25010562
APA StyleSoboska, K., Kusiński, M., Pawelczyk, K., Migdalska-Sęk, M., Brzeziańska-Lasota, E., & Czarnecka-Chrebelska, K. H. (2024). Expression of RASSF1A, DIRAS3, and AKAP9 Genes in Thyroid Lesions: Implications for Differential Diagnosis and Prognosis of Thyroid Carcinomas. International Journal of Molecular Sciences, 25(1), 562. https://doi.org/10.3390/ijms25010562