Article

Genome-Wide Identification, Functional Characterization, and Stress-Responsive Expression Profiling of Subtilase (SBT) Gene Family in Peanut (Arachis hypogaea L.)

1
Centre for Legume Plant Genetics and System Biology, School of Future Technology and Haixia Institute of Science and Technology, College of Life Sciences, Fujian Agriculture and Forestry University, Fuzhou 350002, China
2
College of Plant Protection, Fujian Agriculture and Forestry University, Fuzhou 350002, China
3
College of Agriculture, Fujian Agriculture and Forestry University, Fuzhou 350002, China
4
Department of Agronomy, Faculty of Agriculture, Nasarawa State University, Keffi P.M.B 1022, Nigeria
*
Author to whom correspondence should be addressed.
Int. J. Mol. Sci. 2024, 25(24), 13361; https://doi.org/10.3390/ijms252413361
Submission received: 13 November 2024 / Revised: 4 December 2024 / Accepted: 6 December 2024 / Published: 13 December 2024
(This article belongs to the Special Issue Plant Responses to Abiotic and Biotic Stresses)

Abstract

:
Subtilases (SBTs), known as serine proteases or phytoproteases in plants, are crucial enzymes involved in plant development, growth, and signaling pathways. Despite their recognized importance in other plant species, information regarding their functional roles in cultivated peanut (Arachis hypogea L.) remains sparse. We identified 122 AhSBT genes in the STQ peanut genome, classifying them into six subgroups based on phylogenetic analysis. Detailed structural and motif analyses revealed the presence of conserved domains, highlighting the evolutionary conservation of AhSBTs. The collinearity results indicate that the A. hypogea SBT gene family has 17, 5, and 1 homologous gene pairs with Glycine max, Arabidopsis thaliana, and Zea mays, respectively. Furthermore, the prediction of cis-elements in promoters indicates that they are mainly associated with hormones and abiotic stress. GO and KEGG analyses showed that many AhSBTs are important in stress response. Based on transcriptome datasets, some genes, such as AhSBT2, AhSBT18, AhSBT19, AhSBT60, AhSBT102, AhSBT5, AhSBT111, and AhSBT113, showed remarkably higher expression in diverse tissues/organs, i.e., embryo, root, and leaf, potentially implicating them in seed development. Likewise, only a few genes, including AhSBT1, AhSBT39, AhSBT53, AhSBT92, and AhSBT115, were upregulated under abiotic stress (drought and cold) and phytohormone (ethylene, abscisic acid, paclobutrazol, brassinolide, and salicylic acid) treatments. Upon inoculation with Ralstonia solanacearum, the expression levels of AhSBT39, AhSBT50, AhSBT92, and AhSBT115 were upregulated in disease-resistant and downregulated in disease-susceptible varieties. qRT-PCR-based expression profiling presented the parallel expression trends as generated from transcriptome datasets. The comprehensive dataset generated in the study provides valuable insights into understanding the functional roles of AhSBTs, paving the way for potential applications in crop improvement. These findings deepen our understanding of peanut molecular biology and offer new strategies for enhancing stress tolerance and other agronomically important traits.

1. Introduction

Subtilisin is an alkaline serine protease first discovered in Bacillus subtilis [1]. It is found in living organisms [2]. SBT genes are proteases used in the feed, food, nutrition, and cosmetics sectors to hydrolyze proteins. It is commonly found in plants, bacteria, fungi, and parasites. These genes are widely distributed among the kingdom Plantae, contributing to varied functions in plant defense mechanisms and growth. However, limited information is available regarding the A. hypogaea SBT gene family. The MEROPS database classification standard identifies serine peptidases as a significant group of the S8 subtilase family. Hydrolysis of proteins into amino acids is catalyzed by these enzymes [3]. Subtilases are typically inactive protein precursors that include several key components: a propeptide domain (19 inhibitory regions), a signal peptide, a protease-associated (PA) domain, and a subtilisin domain. Part of the subtilases perhaps possesses a few of these structures [2]. They have a catalytic triad in their three-dimensional structure: ASP (aspartic acid), His (histidine), and Ser (serine). This triad facilitates protein hydrolysis through the nucleophilic attack of the active site Ser residues on peptide bonds [4].
Different plant species contain varying numbers of SBT genes, which seem to correlate with their evolutionary complexity. For instance, the moss Physcomitrella patens has 23 SBT genes [5]. Contrarily, these SBT genes are said to be more in land plants: Arabidopsis thaliana possesses 56 SBT genes [6]; grape (Vitis vinifera) has 11 [7]; rice (Oryza sativa L.) has 63 [8]; cotton has 122 [9]; barley (Hordeum vulgare L.) has 54 [10]; tomato (Solanum lycopersicum) has 80 [11]; and Z. mays has 58 [12]. Various validation methods have determined that these SBT genes possess a wide range of functions. For instance, in A. thaliana, overexpression of the subtilase gene AtSBT3.3 triggers an innate immune response and downstream immunological signaling [13]. Upregulated expression of the Bacillus subtilis-like protease GbSBT1 gene isolated from cotton after jasmonic acid (JA) and ethylene (Eth) treatments suggests its involvement in defense mechanisms [14]. Bacillus subtilis-like protease HbSPA from rubber tree leaves is possibly involved in defense mechanisms in Phaseolus vulgaris [15]. PvSLP2’s chymotrypsin activity is amplified in dehydration, signifying its importance in senescence and drought control. [16]. Eight SBT genes in barley exhibited elevated expression during germination, indicating their function in barley grain germination [17].
Arachis hypogaea L. (peanut) is a significant agricultural crop that serves as a crucial source of plant oil and protein worldwide [18]. Although SBT genes have been identified in many cultivated species, there is still no report on their identification in peanuts. Here, we have identified 122 SBT genes in the peanut genome [18]. These genes are grouped based on phylogenetic relationships into six groups. By analyzing protein-conserved domains and gene structures, it was observed that different groups of peanuts had varied gene structures, although their structural domains remained relatively conserved. Additionally, we conducted chromosomal localization, homology, promoter analysis, gene expression profiling, and subcellular localization studies. The findings show that the extracellular space was the location of a sizable fraction of AhSBTs. Several AhSBTs hypothesized to reside in the nucleus, extracellular space, or plasma membrane were found to be there by experimental confirmation. Overall, this paper helps with the functional characterization and use of the peanut SBT gene family.

2. Results

2.1. Protein Physicochemical Property Analysis and Identification of AhSBTs in the STQ Genome

A total of 122 AhSBTs were identified in the peanut genome by HMM search using the Pfam: PF00082 domain, followed by de-redundant operations. These genes were named in ascending order of AhSBT1AhSBT122 according to chromosome locations (Supplementary Table S1). Among them, Chr04 recorded the highest gene numbers, totaling 15 members. Chr16, Chr14, and Chr19 had 14, 13, and 9 genes, respectively. Chr03/Chr05/Chr09/Chr13/Chr15 with seven genes each, Chr01/Chr12 with six genes each, Chr11 with five genes, Chr02 with four genes, Chr06/Chr08/Chr17/Chr20 with three genes each. The lowest number of AhSBTs (1) was found on Chr07/Chr10/Chr18 (Figure 1). Protein physicochemical characterization shows the peanut SBT proteins ranged from 250 aa (AhSBT122) to 1387 aa (AhSBT119). The expected molecular weight of 122 SBT proteins ranged from 27.77417 (AhSBT122) to 153.6648 kDa (AhSBT119), and the isoelectric point varied from 4.94 (AhSBT86) to 9.91 (AhSBT122). The shifts in MW and pI were mainly due to elevated essential amino acid content and post-translational changes. Subcellular localization prediction using BUSCA indicated diverse distributions of peanut SBT proteins across cellular compartments. Specifically, 78 SBT proteins were distributed in six different cell compartments, with 10 localized in the nucleus and 19 proteins in the plasma membrane. Three proteins were predicted in the endosperm system, including at least two found in the inner membrane of the chloroplast, and five proteins were anticipated to reside in the cytoplasm and chloroplast.

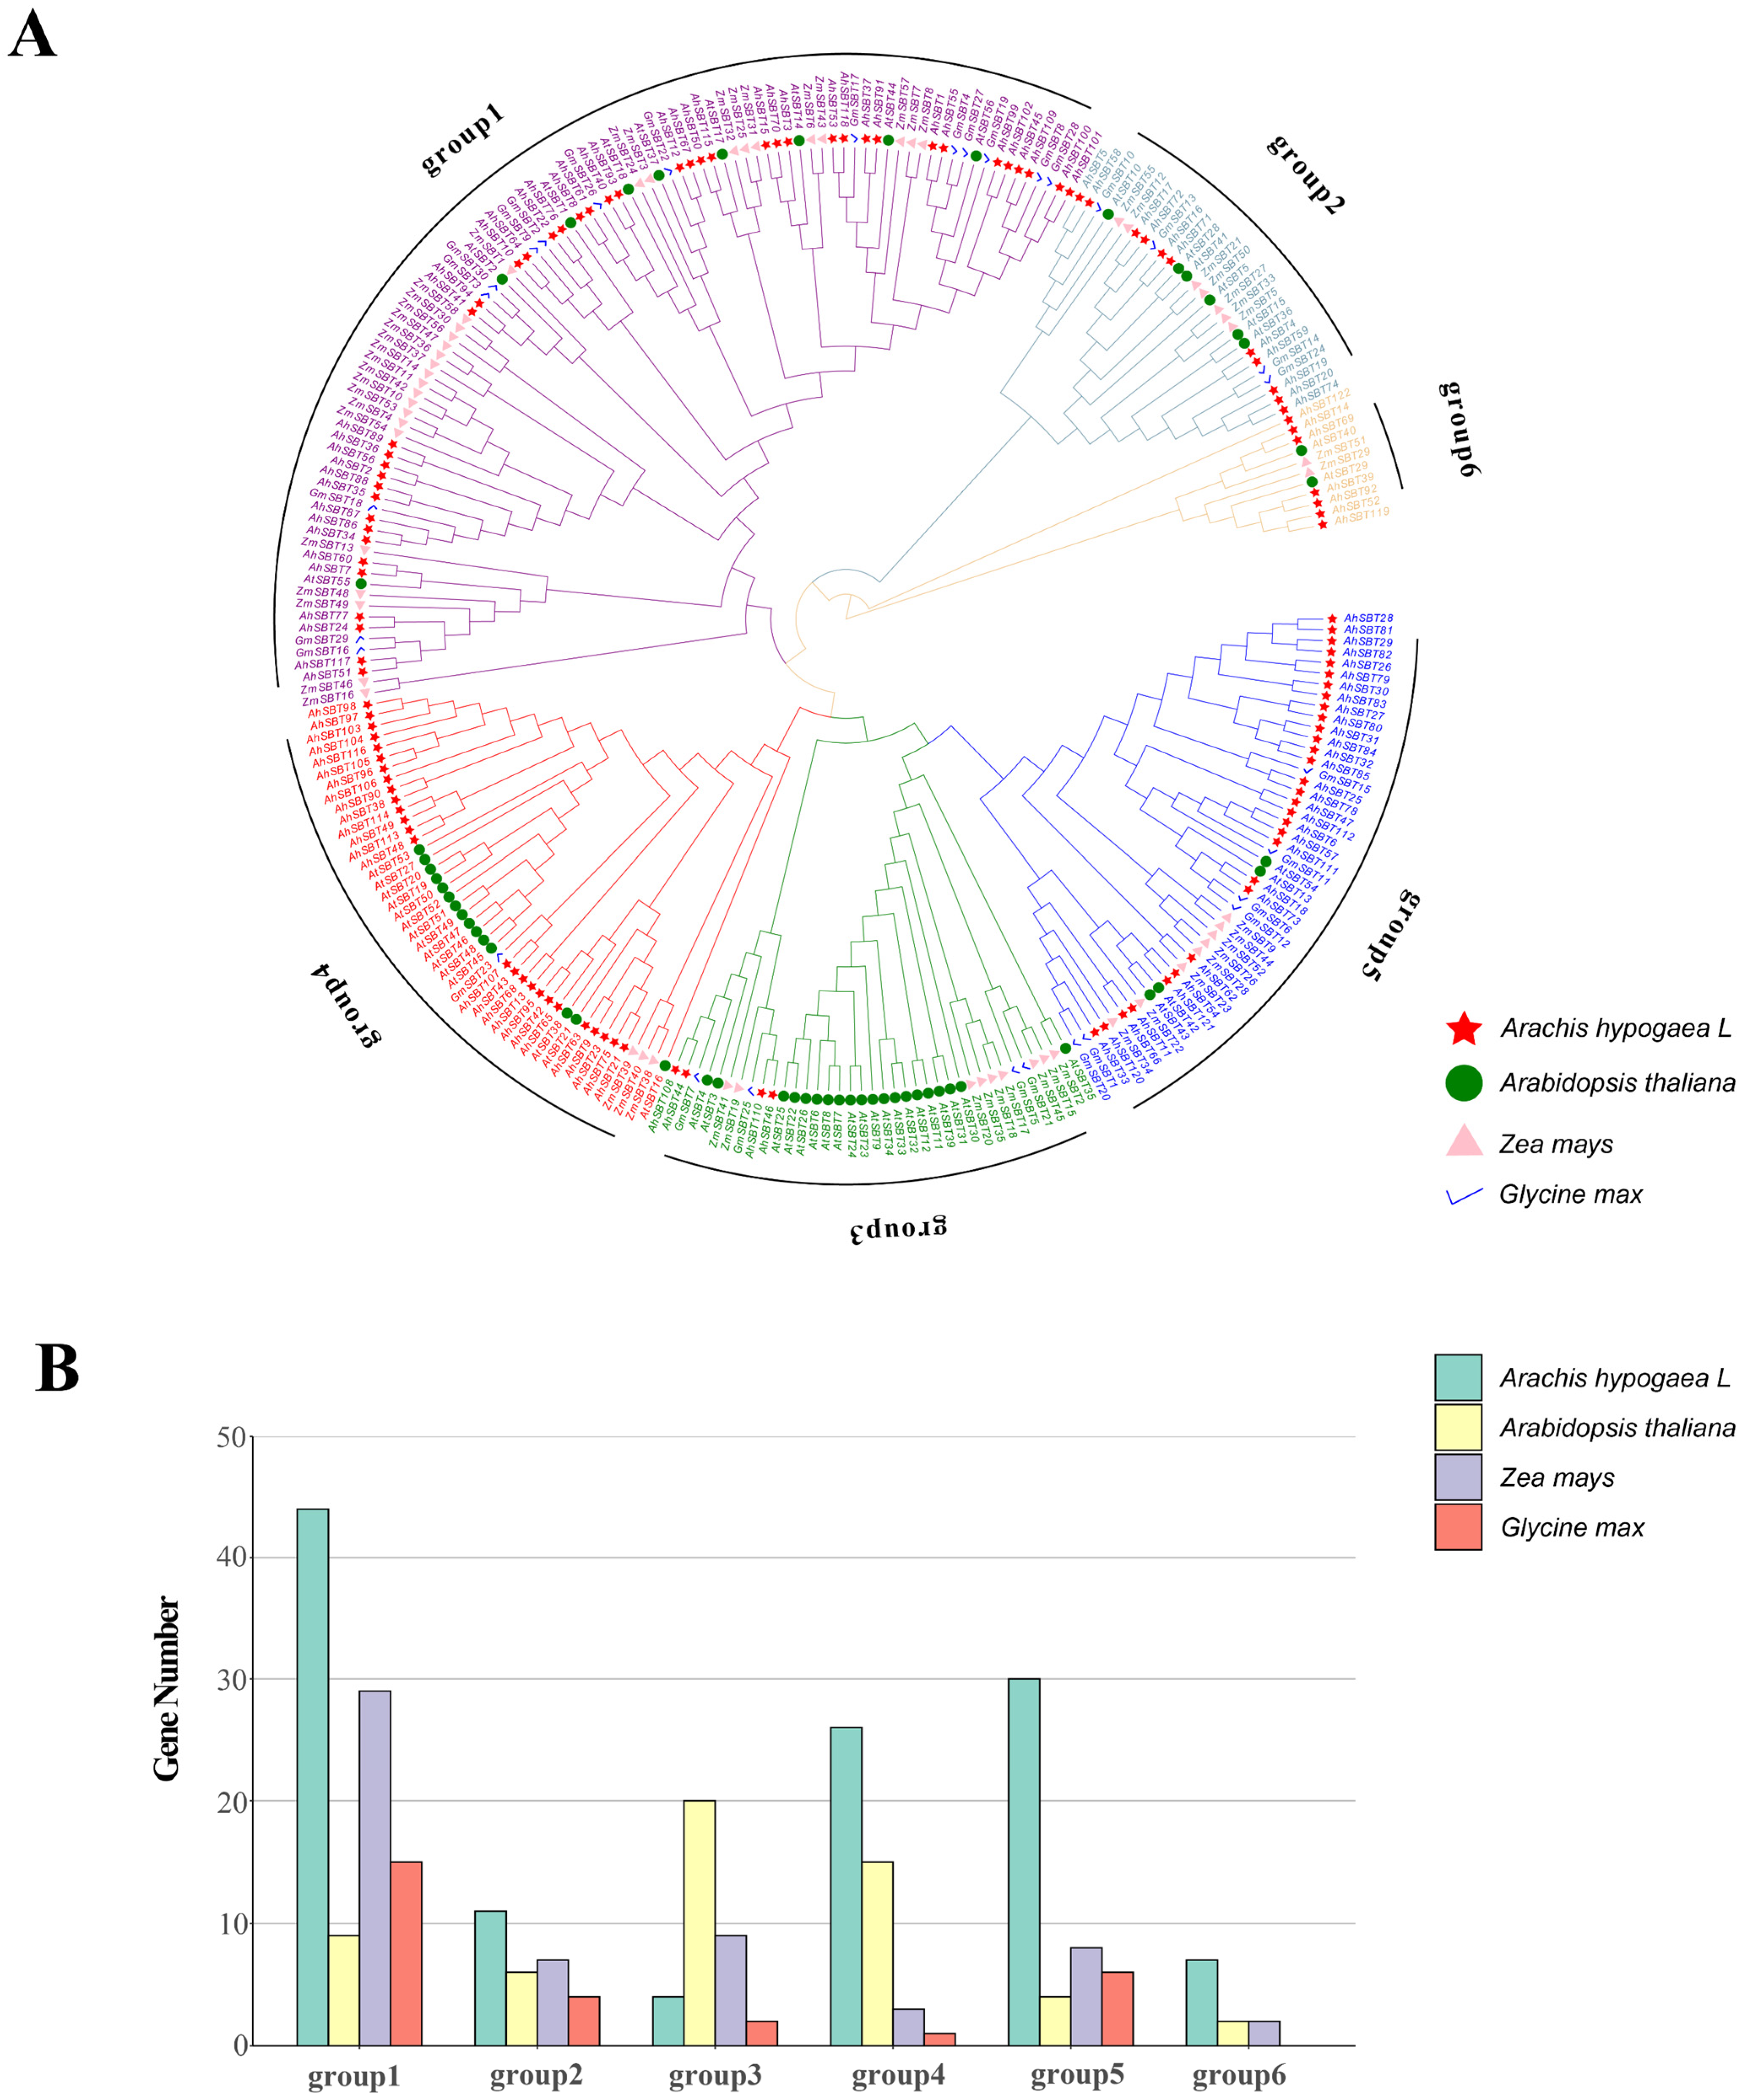
2.2. AhSBTs Phylogenetic Tree Analysis

To investigate the phylogenetic relationship of AhSBT genes, a phylogenetic tree was constructed, comprising AhSBTs (122) and those of A. thaliana (56), G. max (30), and Z. mays (58) (Figure 2). SBT proteins from these species were grouped into six clades (1–6), which contained 44, 11, 4, 26, 30, and 7 SBT members, respectively (Supplementary Figure S1). Except for AhSBT3 and AhSBT4, the classification of SBT genes in A. thaliana aligned with previous studies suggesting the reliability of the topological structure of the phylogenetic tree [6]. These findings support the SBT family’s strong evolutionary conservatism across plant taxa. It’s interesting that Group 6 has the fewest members and Group 1 the most. As per the findings of A. thaliana, Group 6 is the smallest. However, compared to A. thaliana, A. hypogea has a remarkably greater number of SBT genes, implying that Group 1 members may have a wider variety of roles.
This study utilized protein structure prediction in A. thaliana to analyze the structure and function of various SBT subfamilies. One protein of A. thaliana from each of the six subgroups was selected to explore structural similarities (Supplementary Figure S2). According to prior research [19], SBT contains the peptidase S8 structural domain, which has three enzymatic active sites and is involved in the digestion of certain substrates. Comparison of structural domains among subfamilies revealed significant differences in the peptidase S8 domain of SBT6 (AtSBT40), suggesting potential functional distinctions from other subfamilies. Notably, only SBT6 members possessed a single peptidase S8 domain.

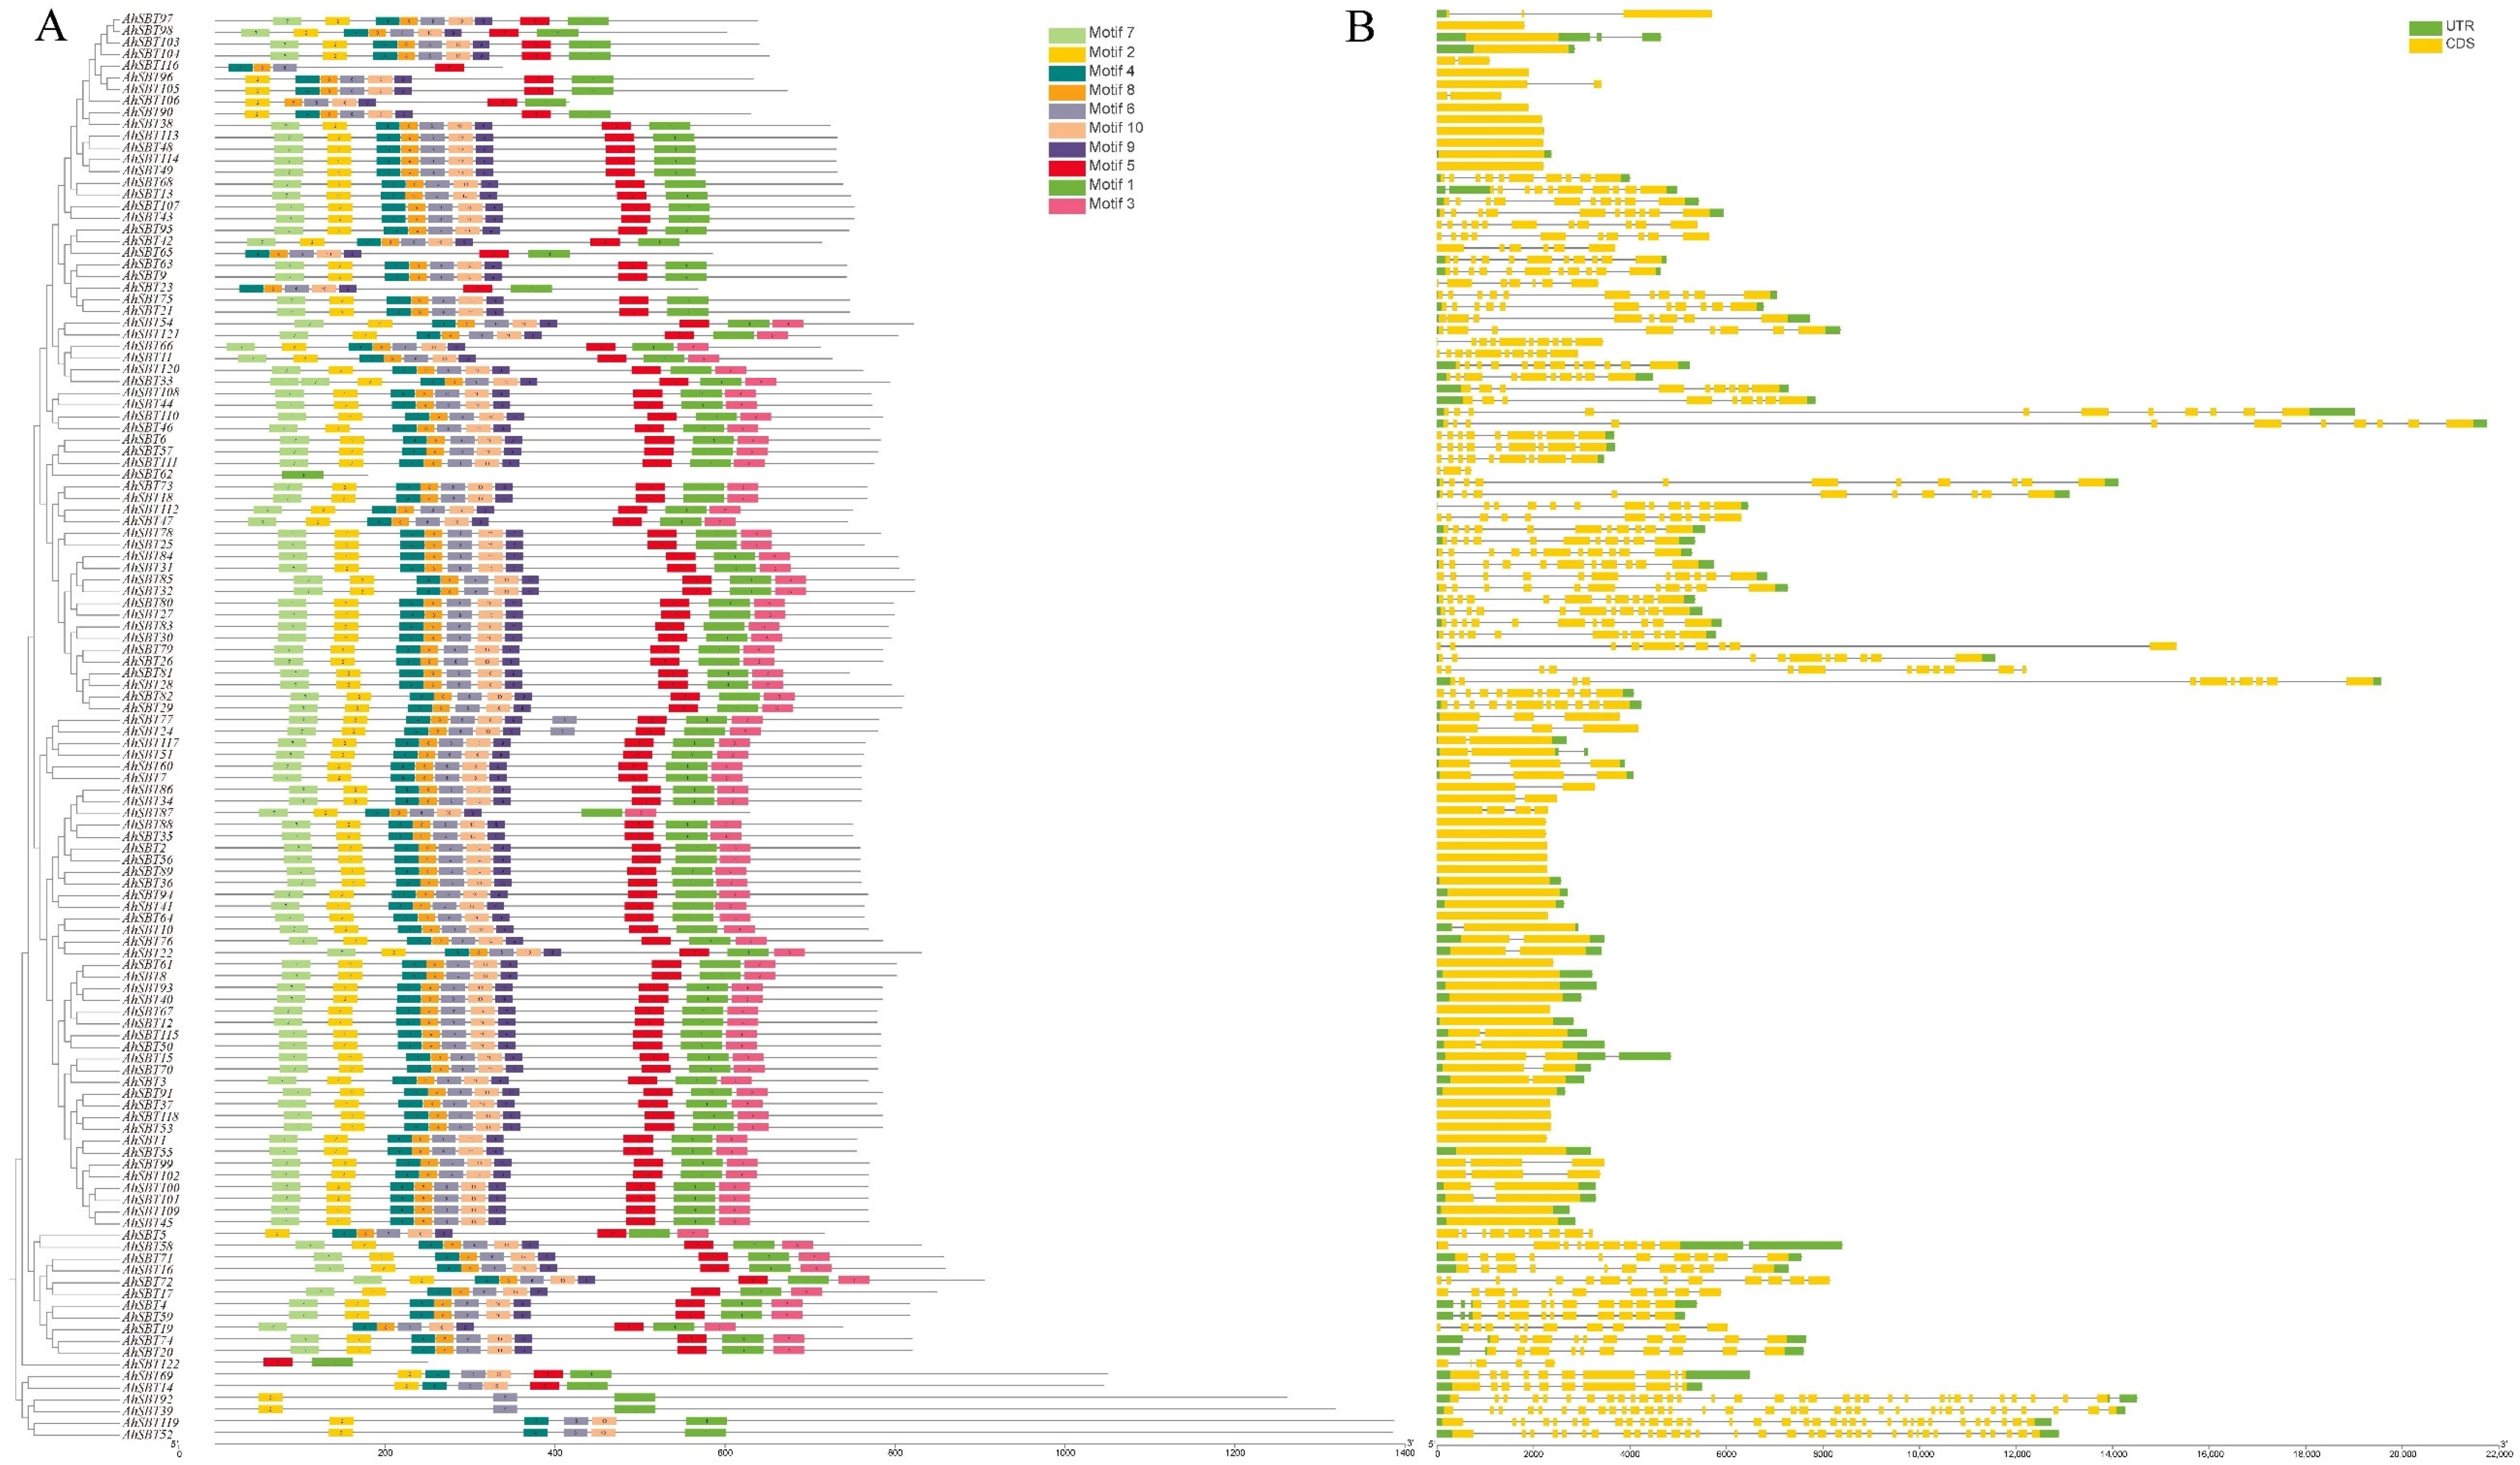
2.3. Analysis of AhSBTs Protein Conserved Domain and Structure

Using MEME’s conserved motif analysis, ten motifs were found among the members of the SBT family (Supplementary Table S2). These motifs were designated motifs 1 through 10. The peptidase_S8 domain (PF00082) was present in motifs 1, 4, and 6, whereas the inhibitor_I9 domain was found in motif 7. The motif distributions among the phylogenetic subgroups exhibited similarities to gene structure (Figure 3A). However, several motifs were discovered to be exclusive to particular genes. Genes, such as AhSBT69/14/119/52/92/39, for example, were restricted to motifs 6, demonstrating their tight association as determined by phylogenetic tree, conserved motif analysis, and gene structure. On the other hand, AhSBT116 had motifs 1, 4, 5, and 6, while AhSBT122 and AhSBT62 only included motif 1. With a few exceptions, most motifs were consistently found across nearly all genes (Figure 3A). In conclusion, phylogenetic relationships, conserved motif patterns, and gene structures confirmed the consistency of gene organizations within subgroups. This suggested a well-sustained amino acid deposition among SBT proteins and that SBT members within the same subtree might have corresponding roles.
Divergences in exon–intron architecture and amino acid substitutions can cause differences in coding regions, potentially changing gene function. We examined the exon–intron arrangement of the peanut SBT genes to explore the variability in gene structure. Members closely related within a phylogenetic group typically exhibit comparable exon–intron structures. The results showed that exons and introns ranged from 1–34 and 0–33, respectively. The maximum number of exons was present on AhSBT39, AhSBT52, and AhSBT119 (Supplementary Table S1). Overall, genes within the same subgroup exhibited similar structures, with a few exceptions (Figure 3B). Among all genes analyzed, AhSBT39 and AhSBT92 possessed the most extended structures, while a small number of genes, such as AhSBT52, AhSBT119, and AhSBT72, showed complex structures (Figure 3B). There is no intron in 10 genes (AhSBT90, AhSBT38, AhSBT113, AhSBT48, AhSBT49, AhSBT88, AhSBT35, AhSBT2, AhSBT56, AhSBT89), suggesting that gain or loss of exon has occurred in the history of SBT genes. Additionally, members within specific subgroups exhibit gene structures close to their phylogenetic clusters.

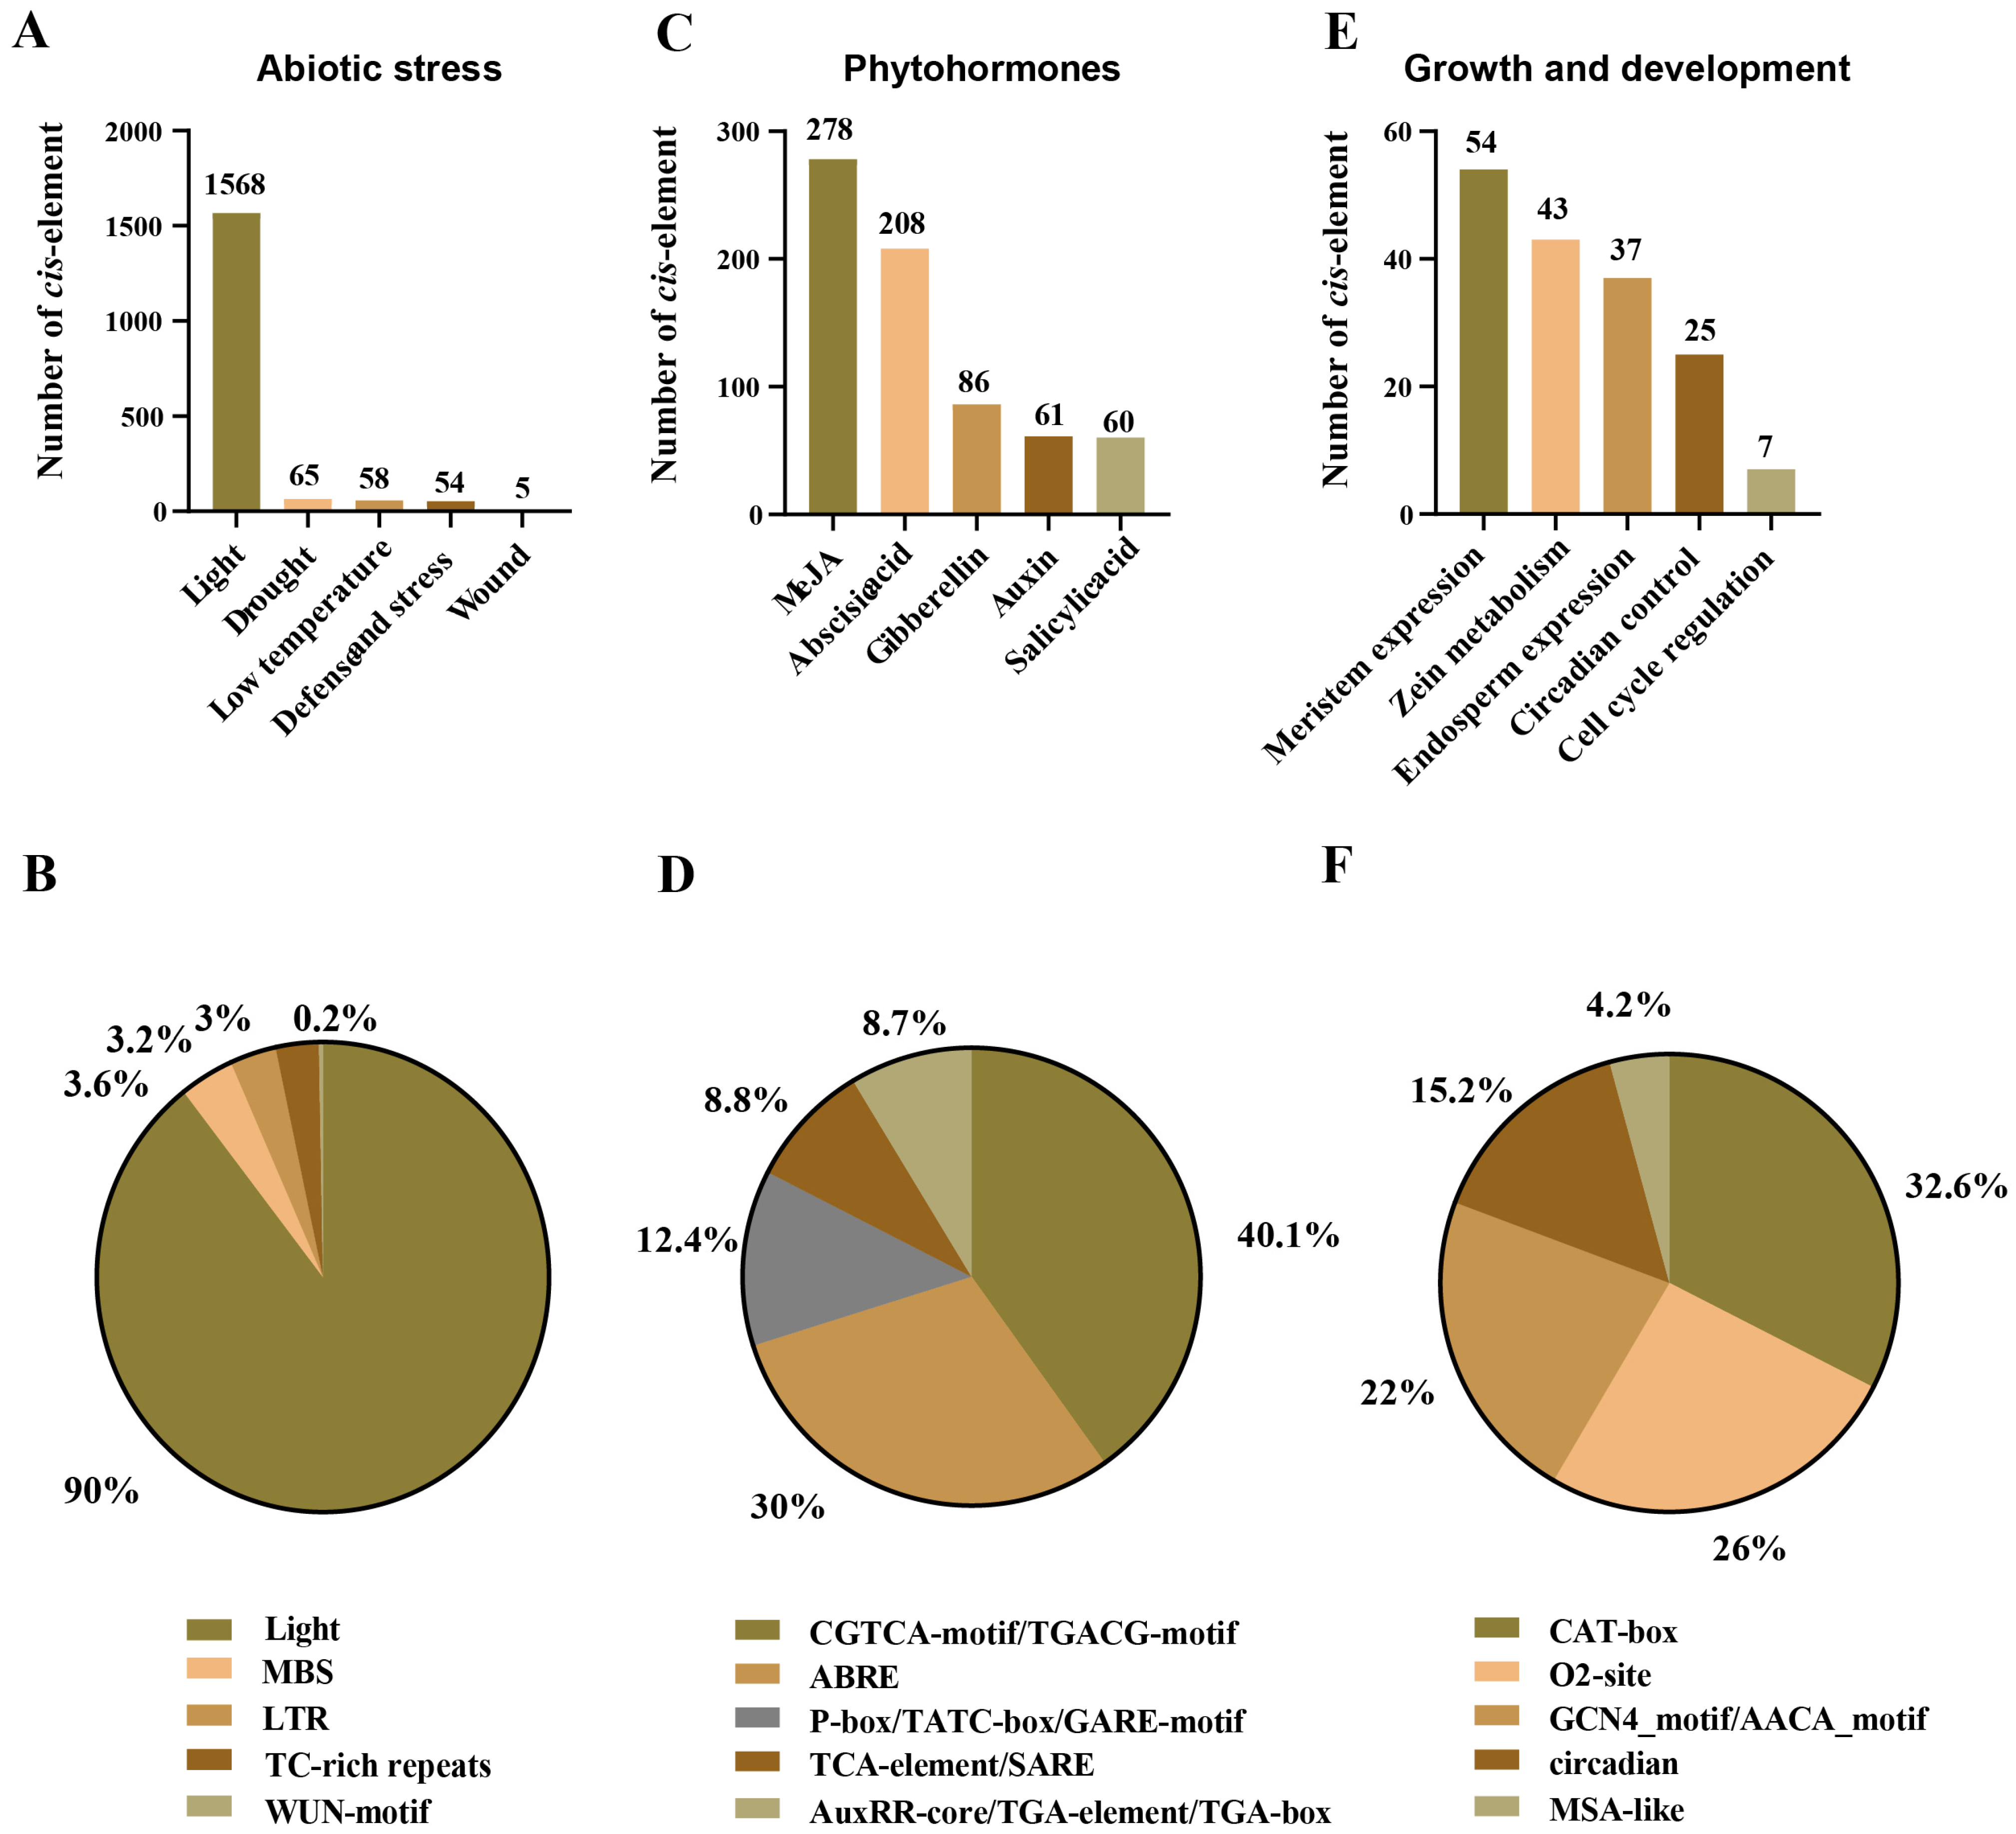
2.4. Cis-Elements: Crucial Components in the Promoter Regions of AhSBTs

To gain insights into the function of AhSBTs in peanut development, growth, and responses to abiotic stressors and plant hormone treatment, the cis-regulatory components in AhSBT promoters were examined (Supplementary Table S3). We focused on three major categories of cis-regulatory elements: phytohormone responsiveness, abiotic stress responsiveness, and development and growth regulation (Figure 4). Among abiotic stress response elements, six primary types were identified, including drought, low temperature, light, defense, stress, and wounding. These elements comprise various motifs, such as ATCT, I-box, GT1, box 4, and GA, with photoresponsive motifs accounting for 90% of the total. In addition, other cis-elements were detected, such as MBS (3.6%), TC-rich repetitive sequences (3.2%), LTR (3%), and WUN motifs (0.2%) (Figure 5A,B, and Supplement Table S3). These elements are likely associated with specific genes, indicating their role in defense against stress conditions (Figure 5 and Supplementary Table S3).
Regarding hormone responsiveness, a total of 663 hormone-related elements were detected. Among these, two regulatory elements are linked to methyl jasmonate responsiveness—the CGTCA-motif and TGACG-motif. Two hundred and eight abscisic acid-responsive elements were present in the SBT promoter regions. Furthermore, it was shown that 60 gene promoters included a TCA element linked to salicylic acid responses, whereas 61 gene promoters contained a TGA element linked to auxin responses. Additionally, it was shown that the gibberellin-responsiveness-associated GARE-motif, TATC-box, and P-box were present in 36, 27, and 23 promoters (Figure 5C,D, and Supplementary Table S3), respectively. These findings suggest that genes containing specific hormone-related elements could be prioritized for further functional studies to explore their protective effects when treated with plant hormones.
Furthermore, we also identified five elements related to development and growth (regulating the expression of meristems, zein metabolism, control of the cell cycle, expression of endosperm, and circadian rhythm), and their key elements are CAT box (31%), O2-site (34%), GCN4_motif/AACA_motif (17%), MSA-like (5%), and circadian rhythm (14%) (Figure 5E,F and Supplementary Table S3), indicating their active involvement in various phases of peanut development and growth. These results reveal that certain important components are broadly and randomly distributed across multiple genes, while others are specific to particular ones. Consequently, we can infer that the expression patterns of the AhSBTs may vary across stages of development, besides various phytohormones and abiotic stressor conditions.

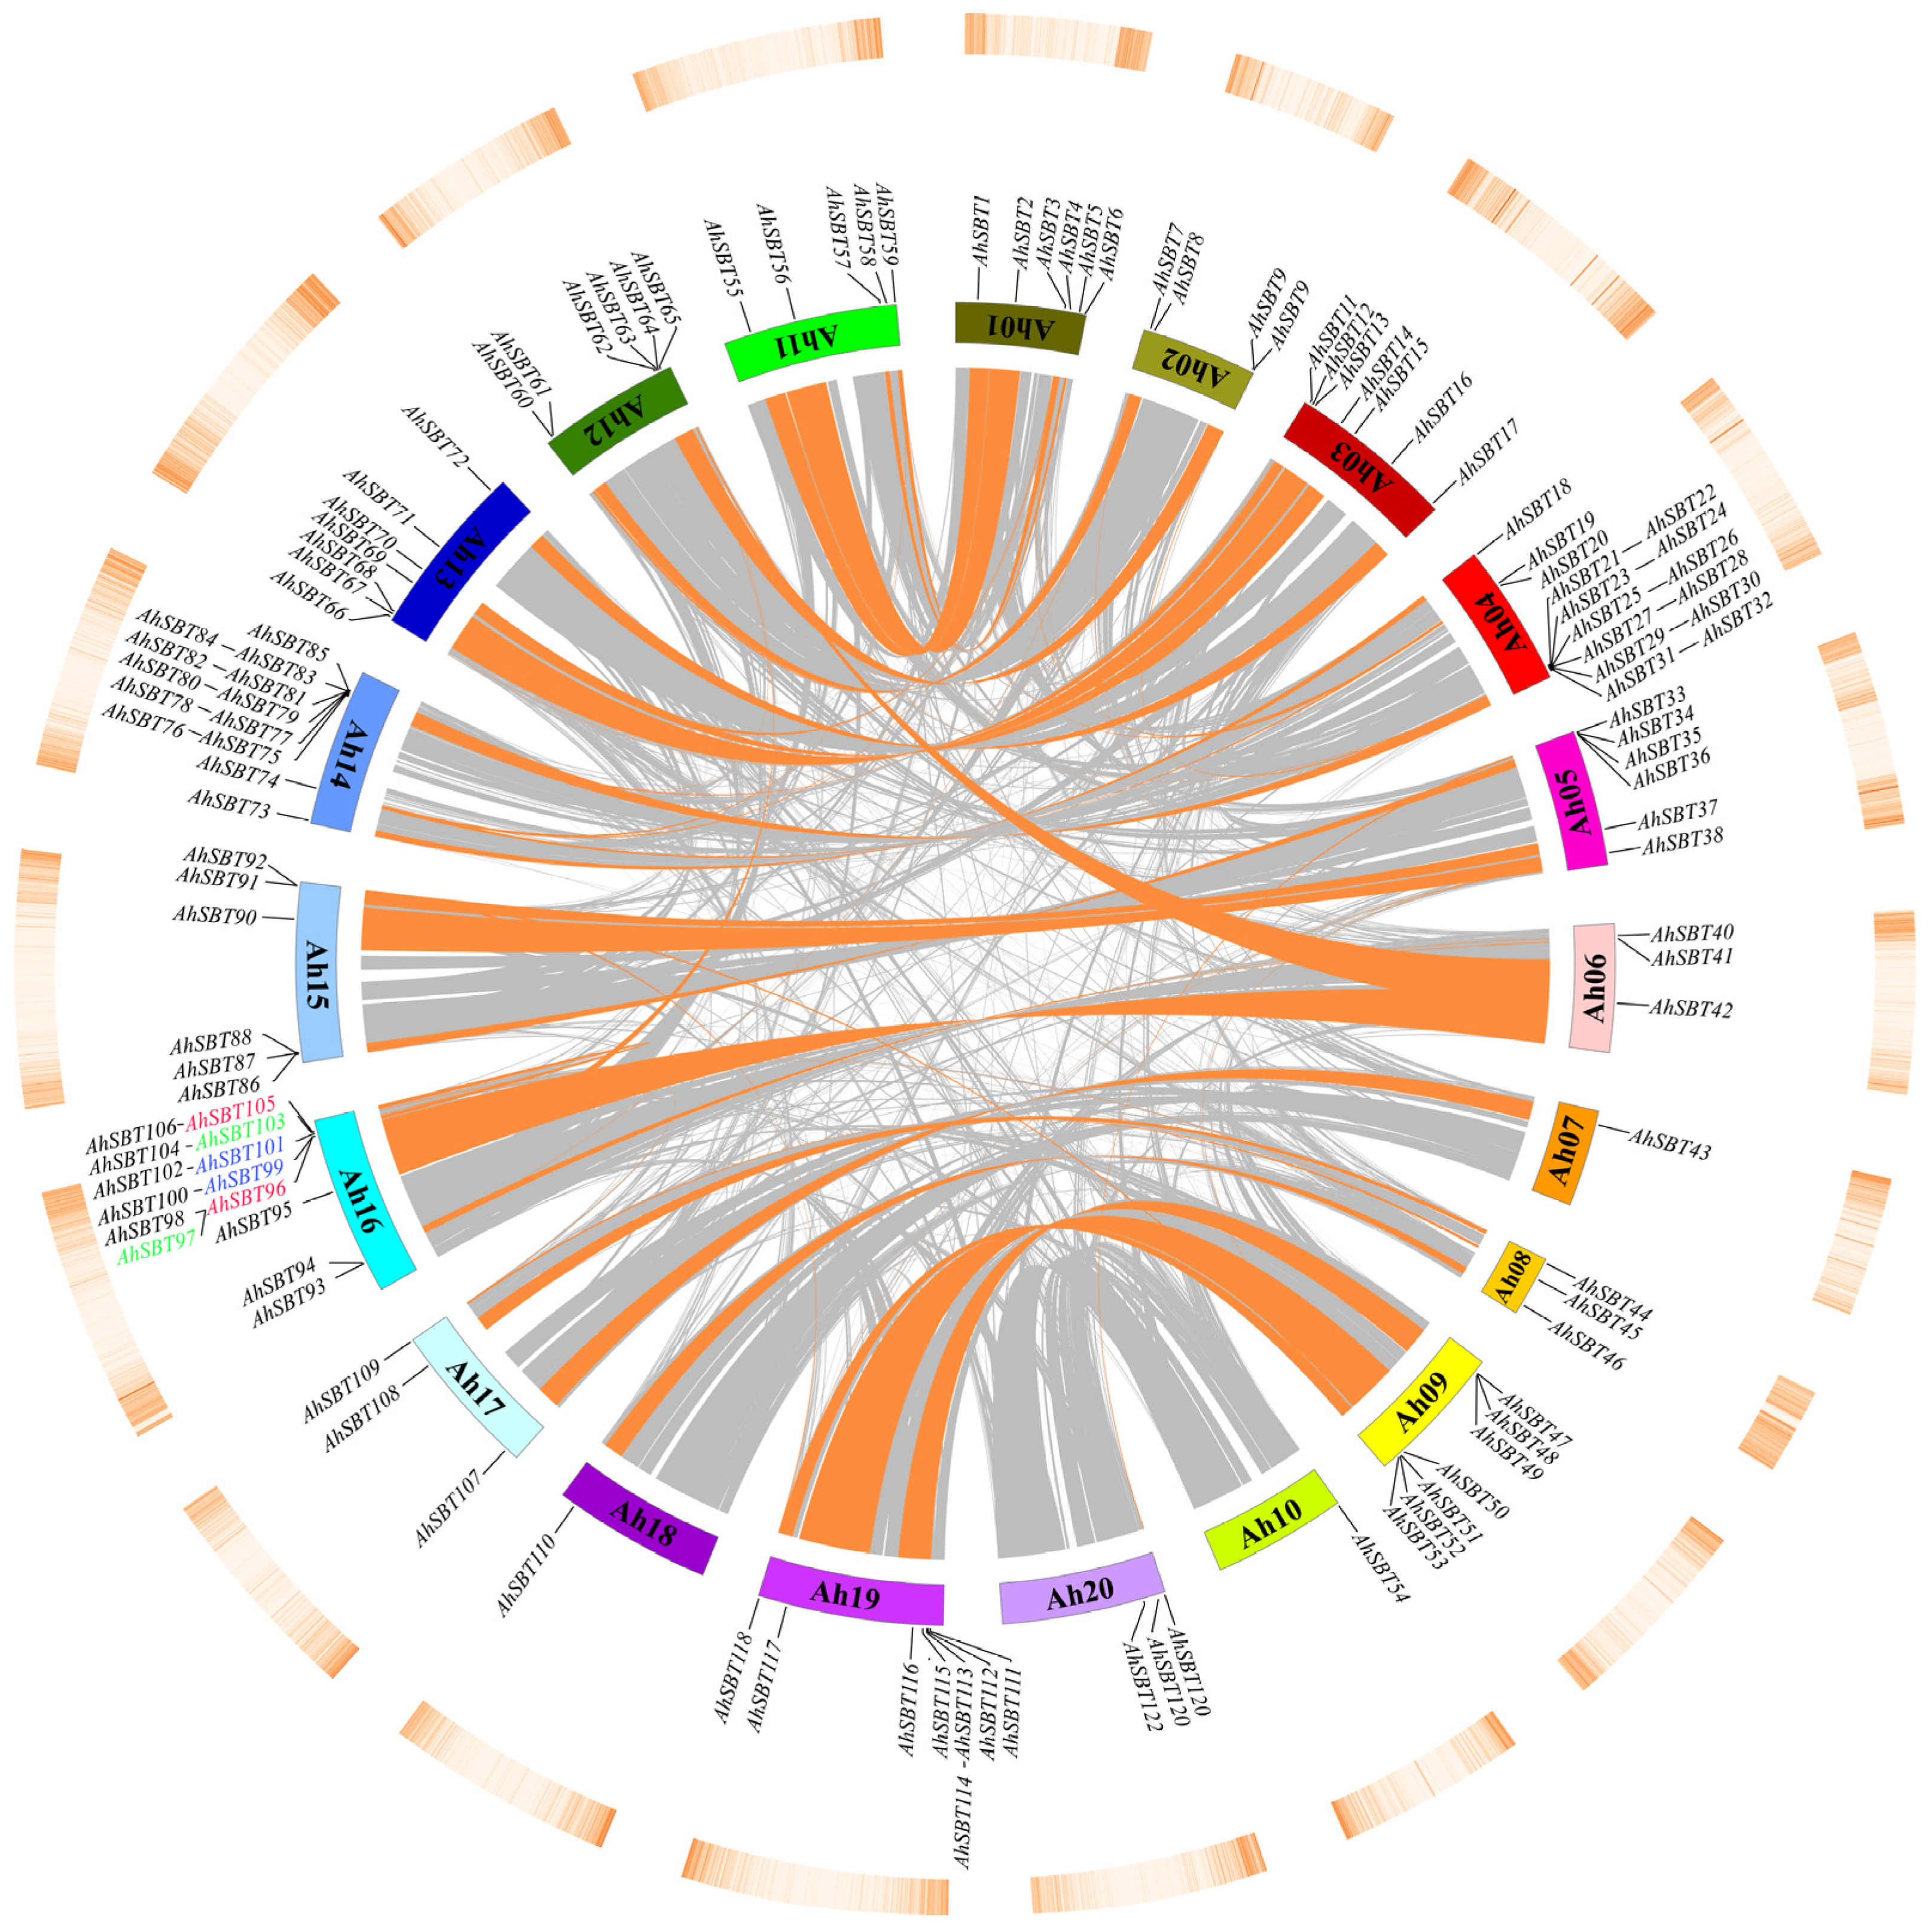
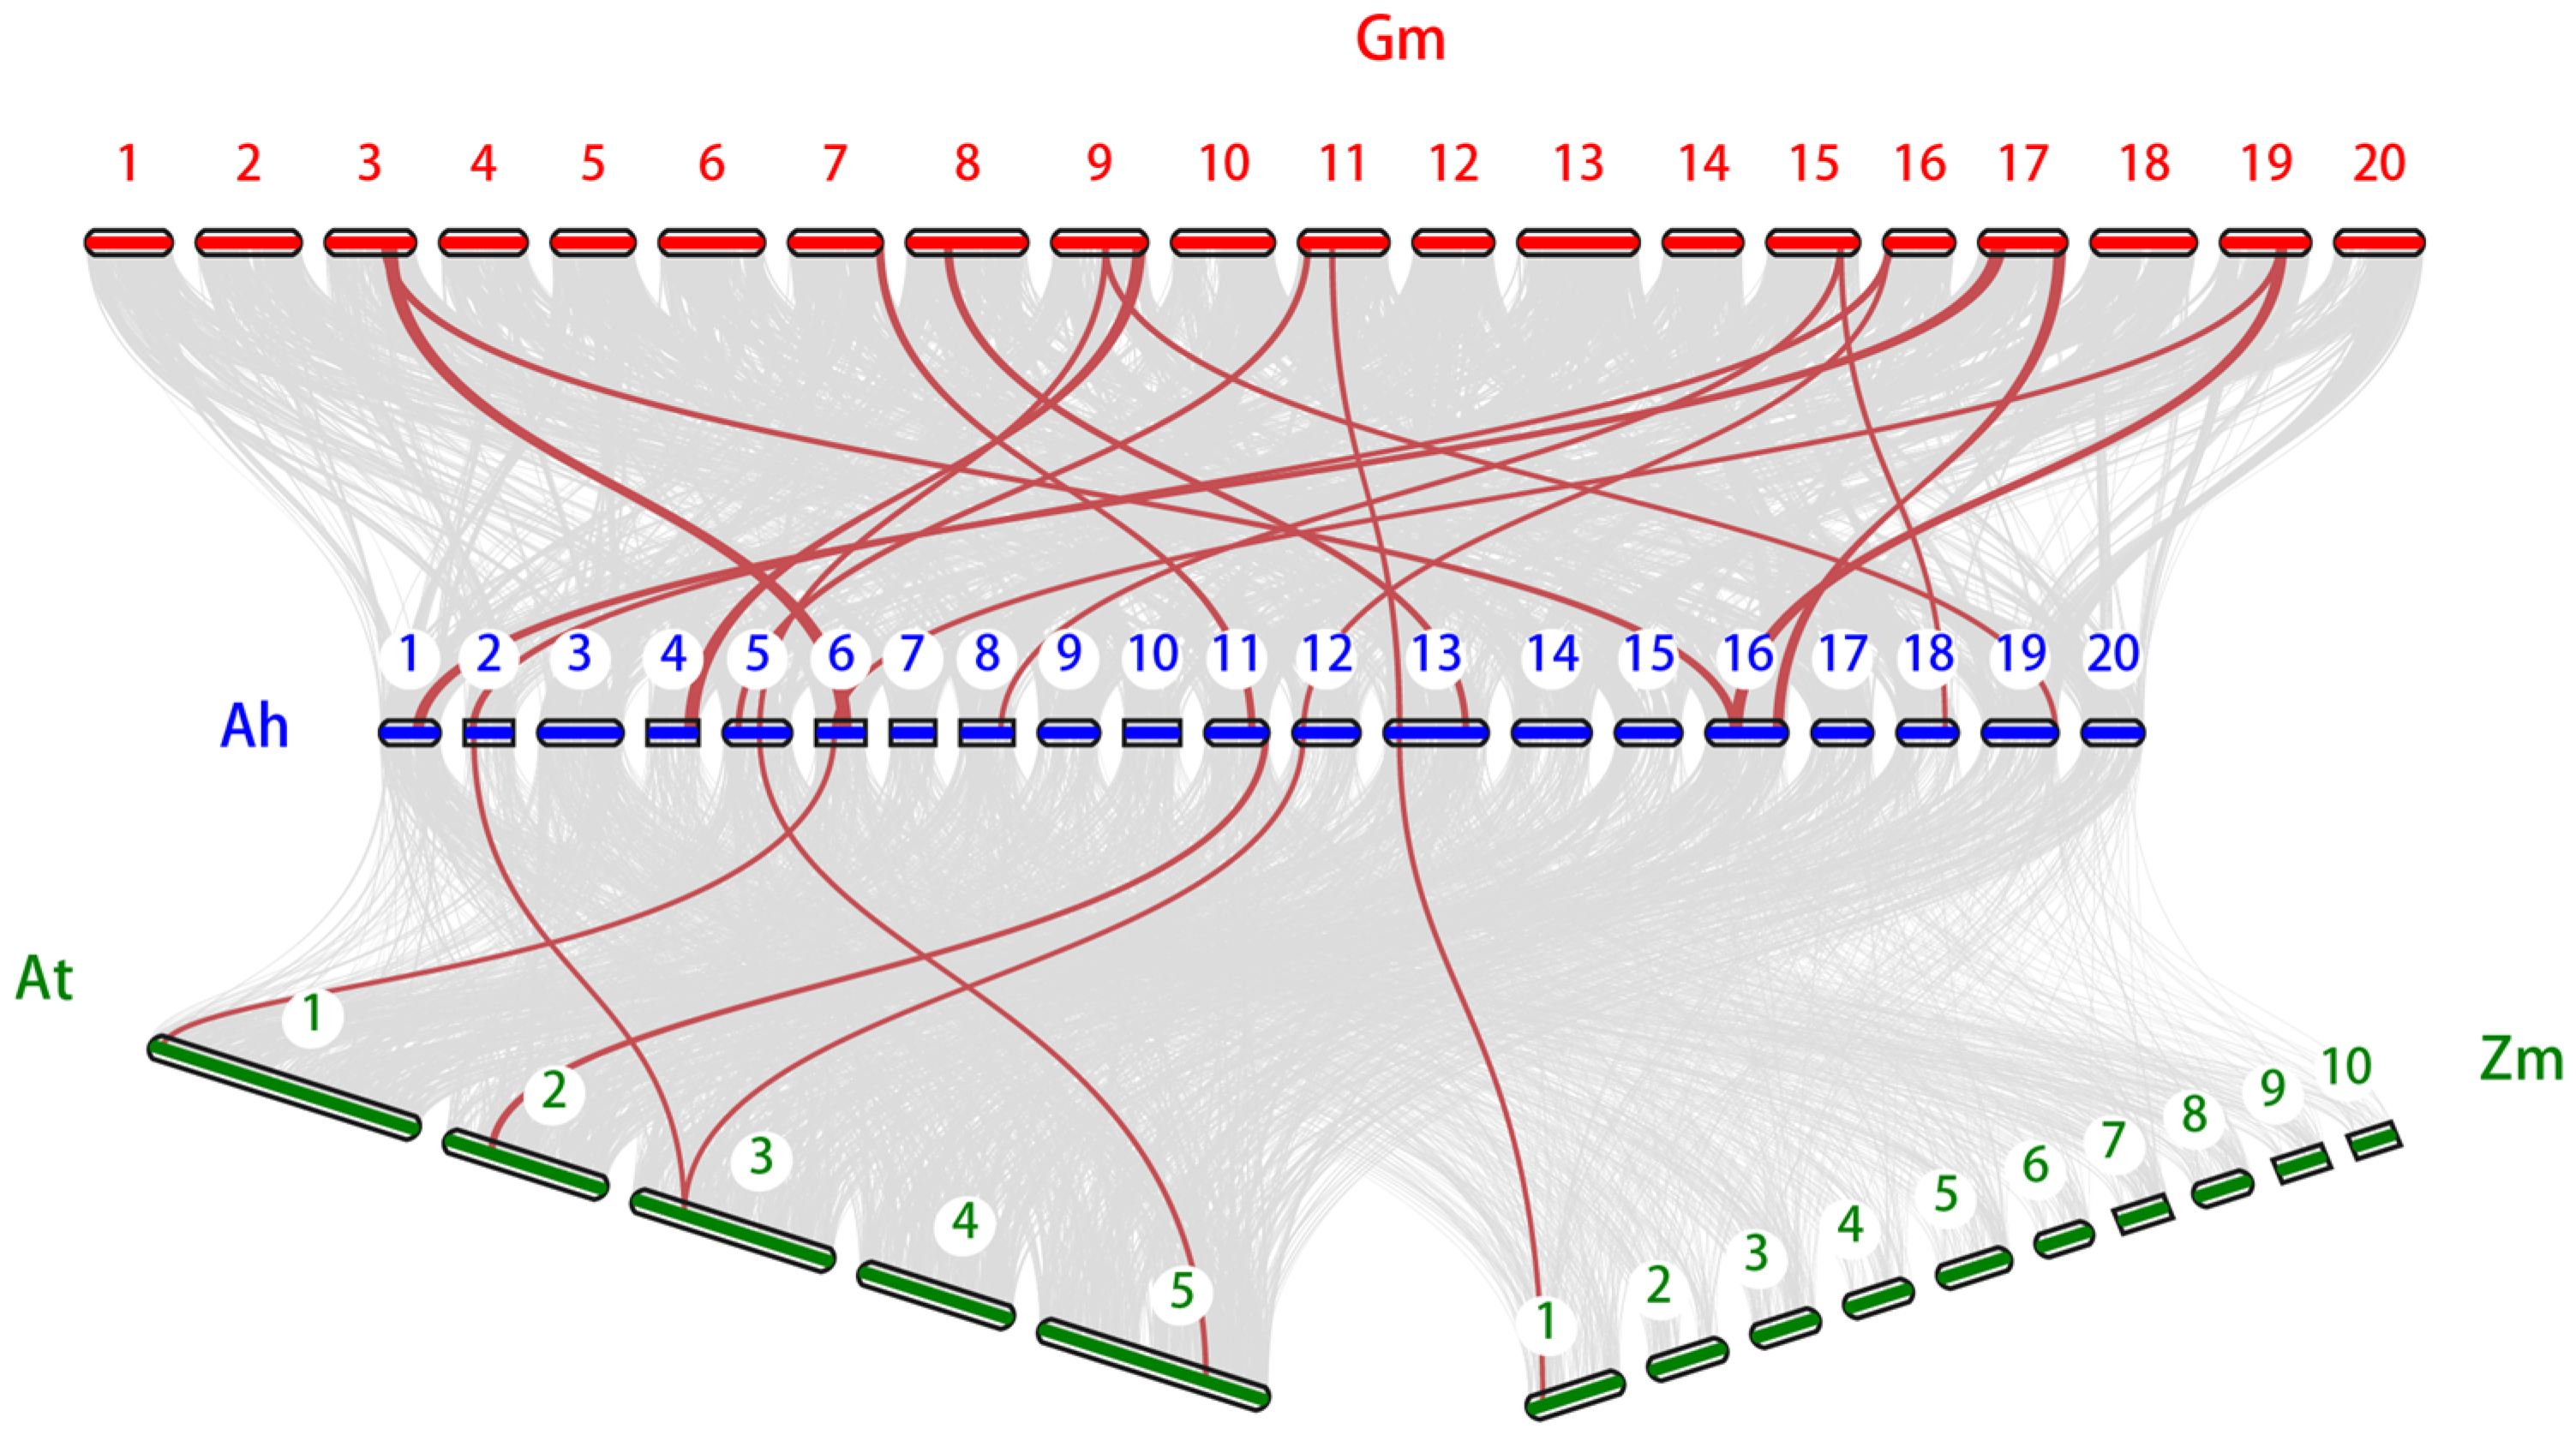
2.5. Tandem Duplication and Synteny Analyses of AhSBTs

Tandem and whole-genome duplications are important processes that increase the complexity of genomes and evolutionary innovation. Upon examining the chromosomal distribution of AhSBTs, we discovered they are dispersed randomly throughout 20 chromosomes, with a minimum of one SBT gene on each chromosome (Supplementary Table S4). Upon examining gene duplication events, we found that 96 AhSBTs, or 78.68% of all AhSBTs, were discovered to have a role in gene duplication. Tandem duplications were linked to six genes (4.9%) (Figure 6 and Supplementary Table S4). Notably, three tandemly duplicated AhSBT pairs were located on chromosome 16, whereas the remaining 73 AhSBTs showed segmental duplications, suggesting that amplification of the peanut SBT gene family predominantly results from segmental duplications. Group 1 comprises 24 segmentally duplicated pairs, suggesting that group 1 is expanding at the fastest rate.
Ka represents the non-synonymous mutation rate, while Ks denotes the rate of synonymous mutation, which helps to determine the frequency and timing of duplication. The evolutionary rate of duplication events in the peanut SBT gene family was estimated by computing the Ks and Ka values for each pair of duplicated genes. Two of the three tandem duplication pairs had close Ks values of 0.032–0.104, indicating that duplications of these genes occurred approximately 1.97 to 6.38 million years ago (Mya). The 73 pairs of segmental duplications exhibited a wide range of Ks values (0.014–1.62), insinuating that duplications occurred between 0.86 to 100.02 Mya (Supplementary Table S4). To further understand the evolutionary pressures acting on AhSBTs, we calculated the Ka/Ks ratio of each pair. The KS values for subfamilies 1, 2, 3, 4, 5, and 6 are 0.0396–1.624, 0.027–0.634, 0.029–0.061, 0.032–1.2, 0.26–0.683, and 0.024–0.584, respectively. Based on the KS analysis of the subgenomes, the results show that the Group 1 subfamily has the longest and most variable divergence time, ranging from 2.437 to 100.024 Mya. The Group 3 subfamily has the most recent divergence, with a range of 1.764 to 3.731 Mya. Subfamily Groups 2, 5, and 6 mostly diverged within 1 to 42 Mya, while the Group 4 subfamily diverged between 1.980 and 73.929 Mya (Supplementary Table S4). All duplicates had a Ka/Ks ratio smaller than 1, meaning that the protein function of their progenitors is still present in these duplicated subtilase proteins despite being subject to intense purifying selection (Supplementary Table S4).
To comprehend the phylogenetic interplay of AhSBTs in peanut and other species, a comparative homologous map of four related genomes (A. thaliana, G. max, peanut, and Z. mays) was created. AhSBTs have 17 homologous pairs with G. max, five collinear gene pairs in Arabidopsis, and one collinear gene pair with Z. mays (Figure 7). The greater number of SBT pairs of collinear genes between peanut and other leguminous members (G. max) compared to distant species like A. thaliana or Z. mays suggest that the SBT gene family is more conserved within legume plants.

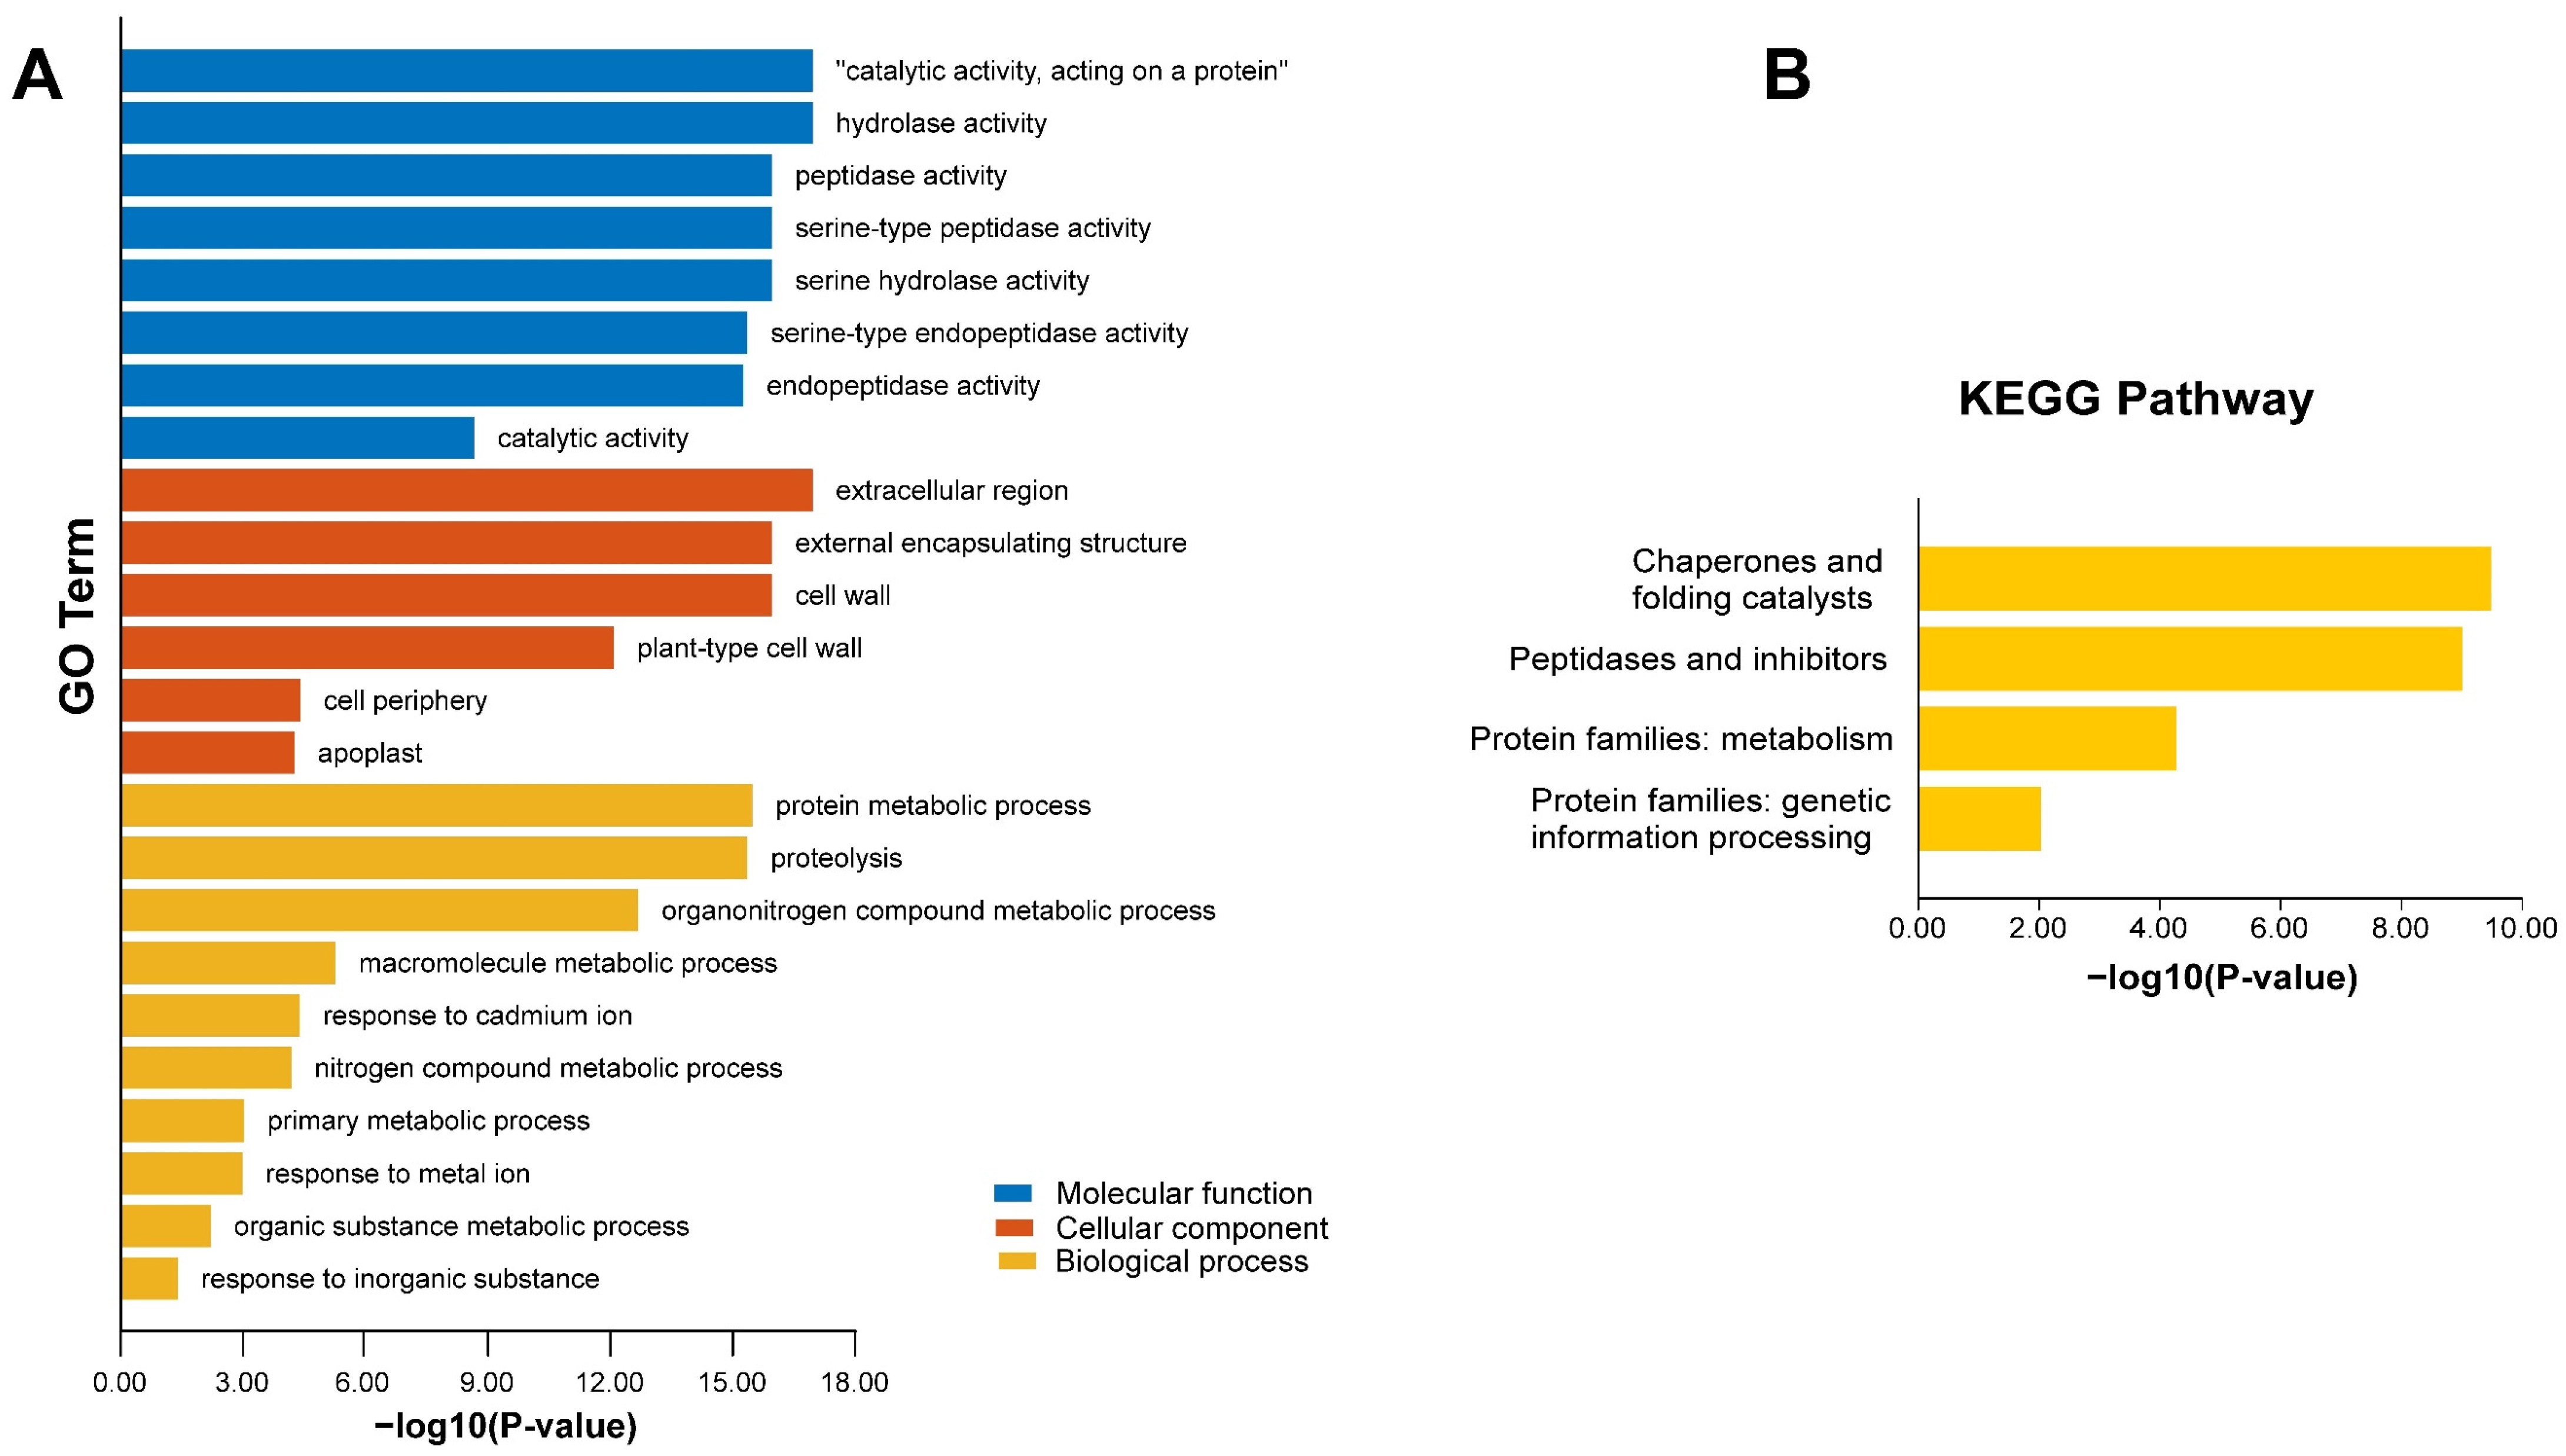
2.6. AhSBTs Enrichment Analysis Using Kyoto Encyclopedia of Genes and Genomics and Gene Ontology

We performed enrichment analysis using the Kyoto Encyclopaedia of Genes and Genomes (KEGG) pathways and gene ontology (GO) annotation to gain a deeper understanding of the AhSBTs at the molecular level (Figure 8 and Supplementary Table S5). The GO annotation revealed significant enrichment in three main categories: molecular function (MF), biological process (BP), and cellular component (CC). In the MF category, the most enriched terms included catalytic activity on proteins (GO:0140096s), hydrolase activity (GO:0016787), peptidase activity (GO:0008233), and serine-type peptidase activity (GO:0004252); serine hydrolase activity (GO:0004175); and general catalytic activity (GO:0003824). In the CC category, the most enriched terms were extracellular region (GO:0005576), exterior plant-type cell wall (GO:0009505), encapsulating structure (GO:0030312), and cell wall (GO:0005618). For the BP category, the highly enriched terms included cellular reaction to protein metabolic process (GO:0019538), proteolysis (GO:0006508), and organonitrogen compound metabolic process (GO:1901564). Several immune-related GO terms were identified, including cellular response to protein metabolic process, proteolysis, organonitrogen cell wall, extracellular region, external encapsulating structure, and compound metabolic process.
Additionally, KEGG enrichment pathway analysis identified three distinct functions of the AhSBTs (Figure 8B and Supplementary Table S5). Highly enriched pathways include chaperones and folding catalysts (03110); peptidases and inhibitors (01002); protein families: metabolism (B09181); and protein families: genetic information processing (B09182). GO and enrichment of KEGG validate the functional contributions of AhSBTs in various biochemical, molecular, and cellular processes, such as disease resistance, response to stress, and the production of several metabolites. These results illustrate the importance of AhSBTs in important biological processes.

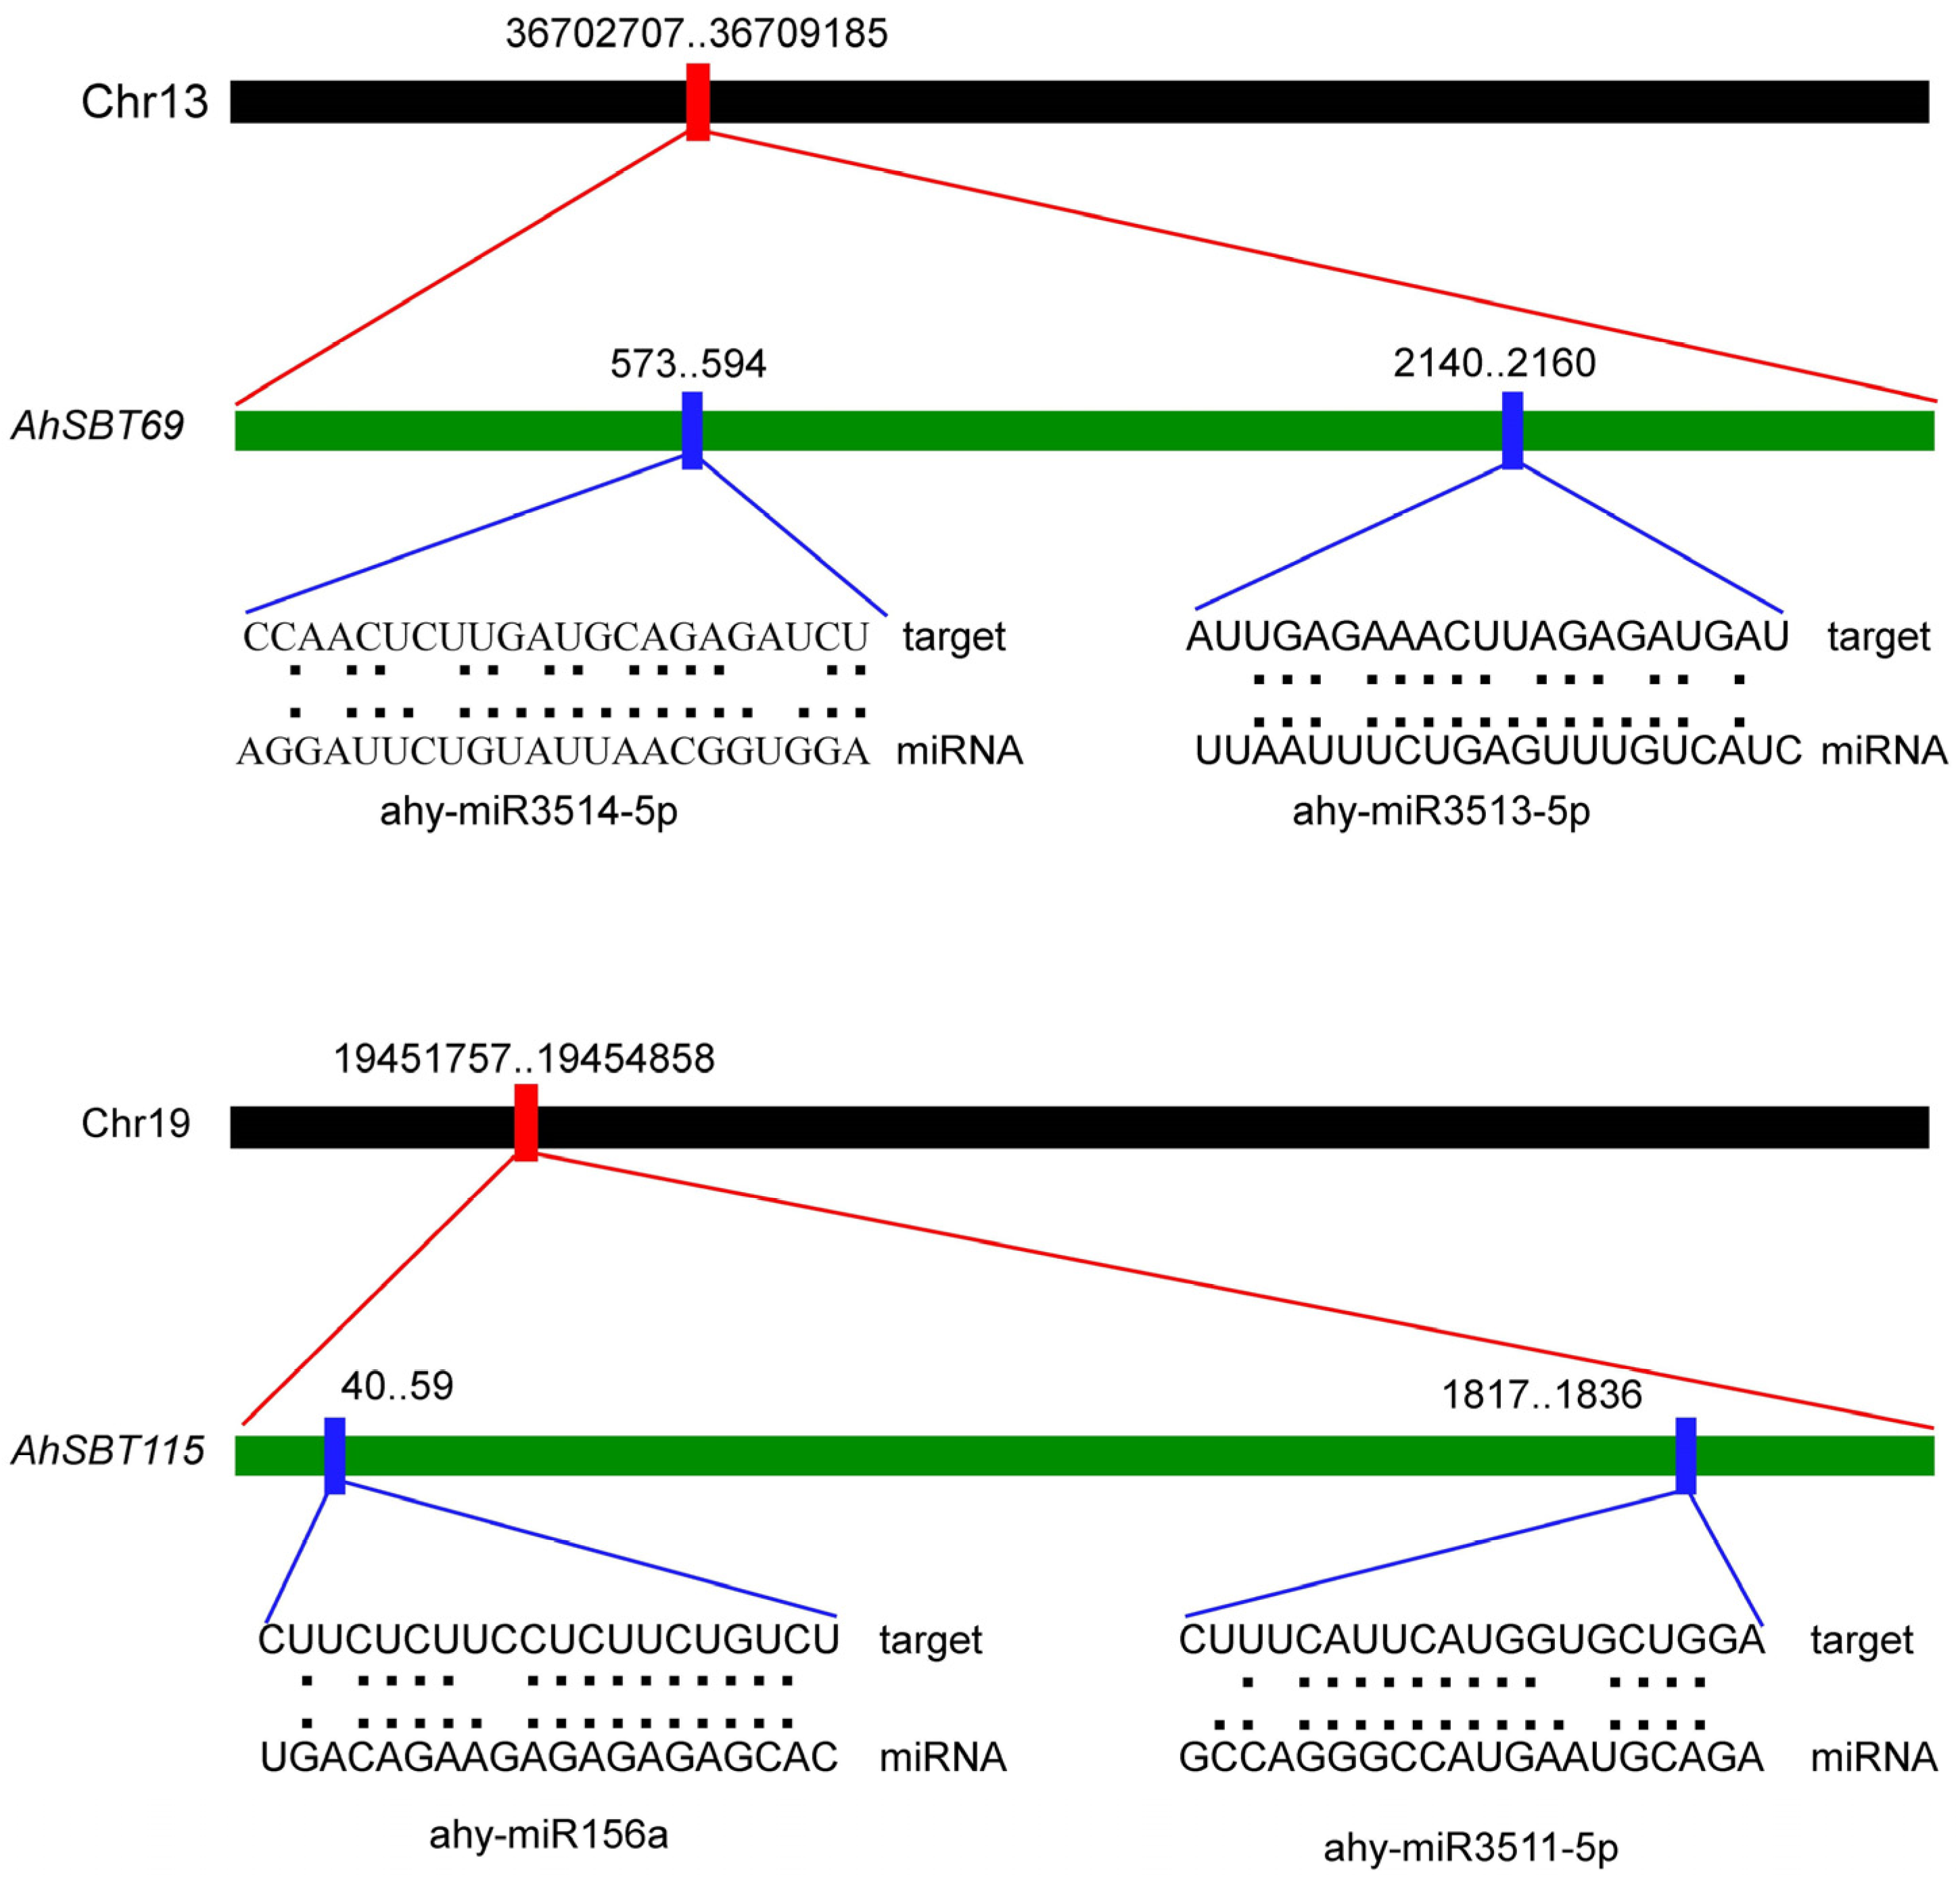
2.7. Exploration of miRNAs Targeting AhSBTs

To understand the post-transcriptional regulation mediated by miRNAs on AhSBTs, we identified 24 miRNAs targeting 58 genes (Supplementary Figure S3 and Table S6). We selected AhSBT69 and AhSBT115 to show the representative sketch of miRNA target sites on genes (Figure 9) and provided a complete data set for all miRNA-targeting genes/sites (Supplementary Table S6). The findings indicated that ahy-miR3511-3p and ahy-miR3513-3p had the largest number of targeted genes, with ten genes each. Ahy-miR159 targets seven genes, while ahy-miR3515 and ahy-miR3517 target six genes each. In addition, ahy-miR3513-5p, ahy-miR3518, ahy-miR3519, and ahy-miR156a target five genes each. Notably, ahy-miR3513-398, ahy-miR3514-3p, and ahy-miR167-5p only target one gene each. Some genes, such as AhSBT69, AhSBT115, AhSBT119, AhSBT72, AhSBT39, and AhSBT92, were discovered to be the targets of several miRNAs. To clarify the biological roles of these anticipated miRNAs in the cultivated peanut genome, more study is necessary to validate the expression profiles between these miRNAs and the genes they target.

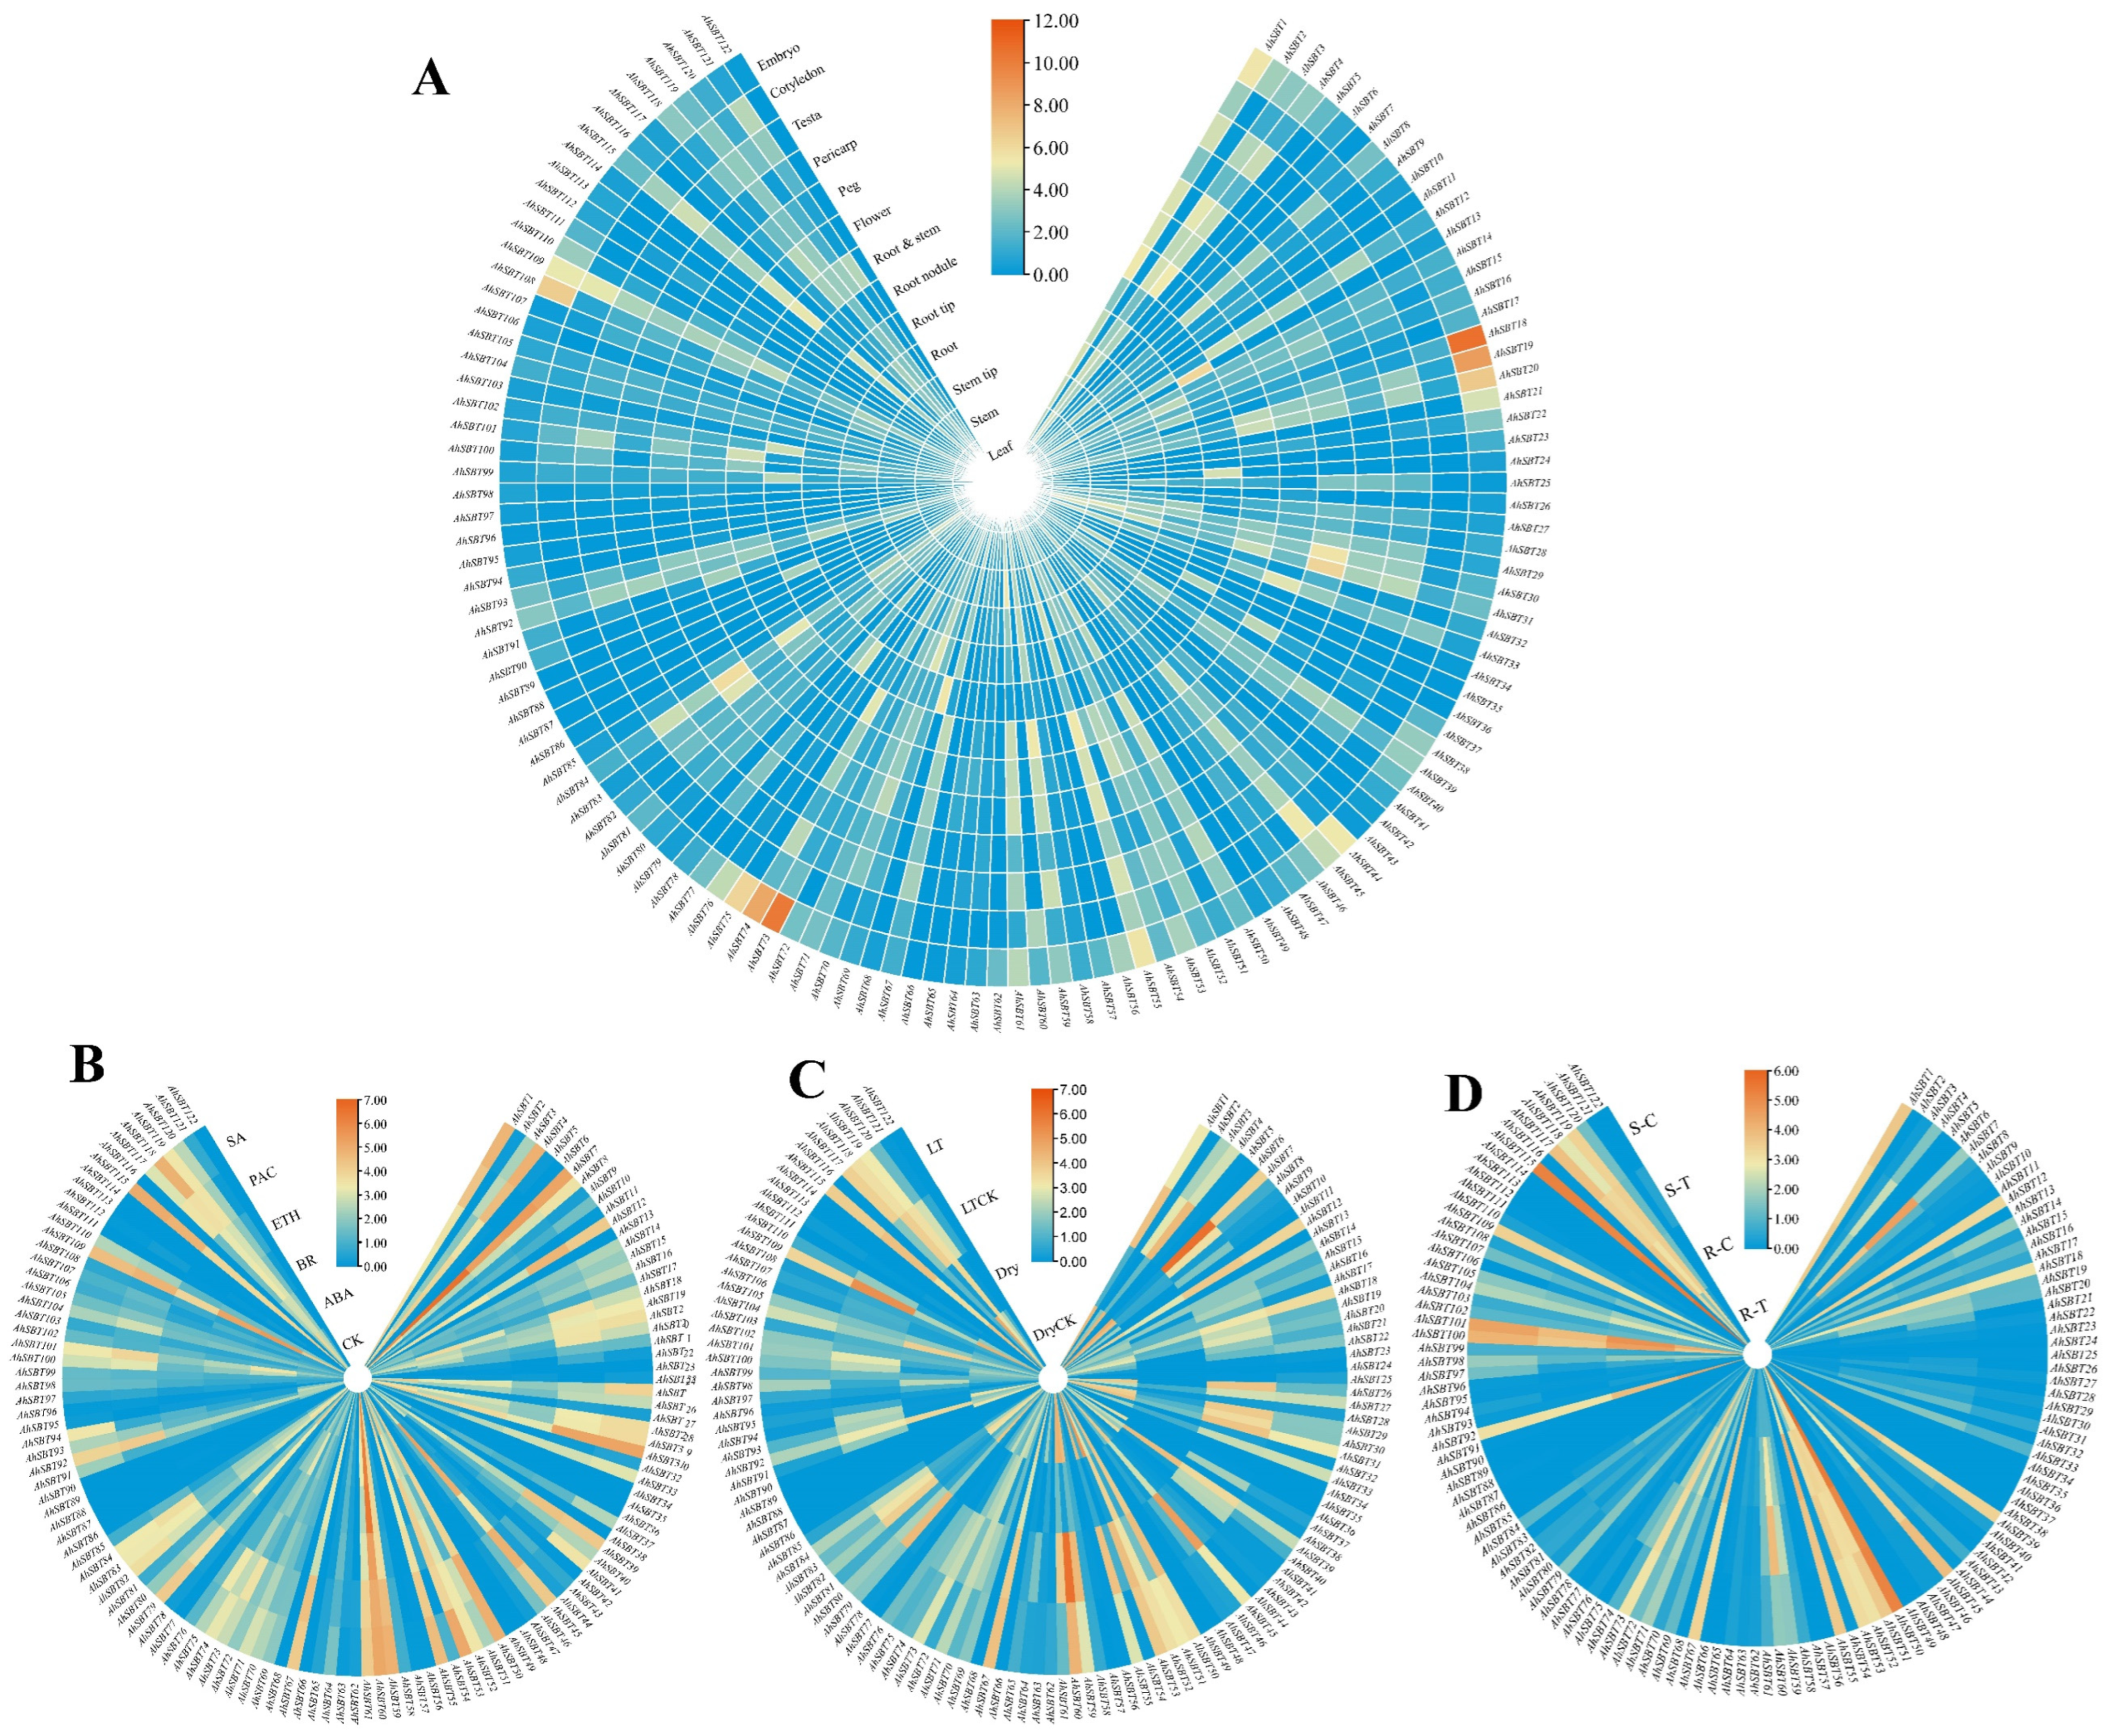
2.8. Profiling the Expression of AhSBTs in Various Developmental Tissues

We examined the expression of the 122 AhSBTs in various peanut tissues (embryo, cotyledon, testa, pericarp, peg, root and stem, root nodule, root tip, root, step tip, stem, leaf). Overall, we found that AhSBTs are expressed only in certain specific tissues and not in all tissues (Supplementary Table S6 and Figure 10A). For example, 32 genes, such as AhSBT86, AhSBT34, AhSBT90, AhSBT58, AhSBT35, and AhSBT21, had more significant expression in the embryo than in other tissues. Eight genes were found to have a notable expression in root nodules. Additionally, a few genes also exhibited modest expressions in a variety of tissues. The expression dataset shows that some genes may substantially participate in peanut growth and development. Hence, the functional characterization of AhSBTs could potentially be conducted in future research.

2.9. Expression of AhSBTs Under Bacterial Wilt, Hormones, and Abiotic Treatments

To investigate the in-depth contribution of AhSBTs in peanut tolerance to abiotic, bacterial wilt, and hormonal stresses, expression levels of these genes were assessed using publicly available transcriptomic datasets (Figure 10B–D). The results show that only a few genes showed higher expressions in cold and drought stresses. For example, AhSBT112, AhSBT97, and AhSBT98 showed increased expression levels under drought and cold conditions relative to controls. Some genes like AhSBT67, AhSBT76, AhSBT12, AhSBT84, and AhSBT3 also showed moderate expression levels under cold and normal conditions. On the other hand, AhSBT42, AhSBT115, AhSBT92, AhSBT25, AhSBT39, AhSBT51, and AhSBT102 displayed considerable expression under cold stress compared to control conditions (Figure 10B).
Under phytohormone treatments, AhSBT78, AhSBT111, AhSBT13, AhSBT88, and AhSBT44 displayed moderate expression patterns throughout the treatments. However, certain AhSBTs displayed specific expression responses to hormone treatments compared to control (CK) conditions. For example, AhSBT78, AhSBT88, AhSBT111, and AhSBT13 were specifically expressed under ETH treatment; AhSBT109 and AhSBT77 under ABA treatment; AhSBT2 and AhSBT14 under SA treatment; and AhSBT23 and AhSBT42 showed specific expression under PAC treatment (Figure 10B–D). These hormone-specific expression patterns suggest that AhSBTs may play diverse regulatory roles in peanut responses to hormonal cues.
Studying the expression levels of AhSBTs under bacterial wilt treatment revealed some important findings. Some AhSBTs, including AhSBT39, AhSBT50, AhSBT92, AhSBT104, and AhSBT115, showed a high expression level in disease-resistant and low in highly susceptible varieties. Conversely, other AhSBTs (AhSBT59, AhSBT82, and AhSBT110) showed the opposite trend. Interestingly, the expression levels of some AhSBTs (AhSBT98, AhSBT81, and AhSBT97) were upregulated in both resistant and susceptible varieties under treatment with Ralstonia solanacearum. These findings provide important clues and references for further research on improving peanut resistance to bacterial wilt.

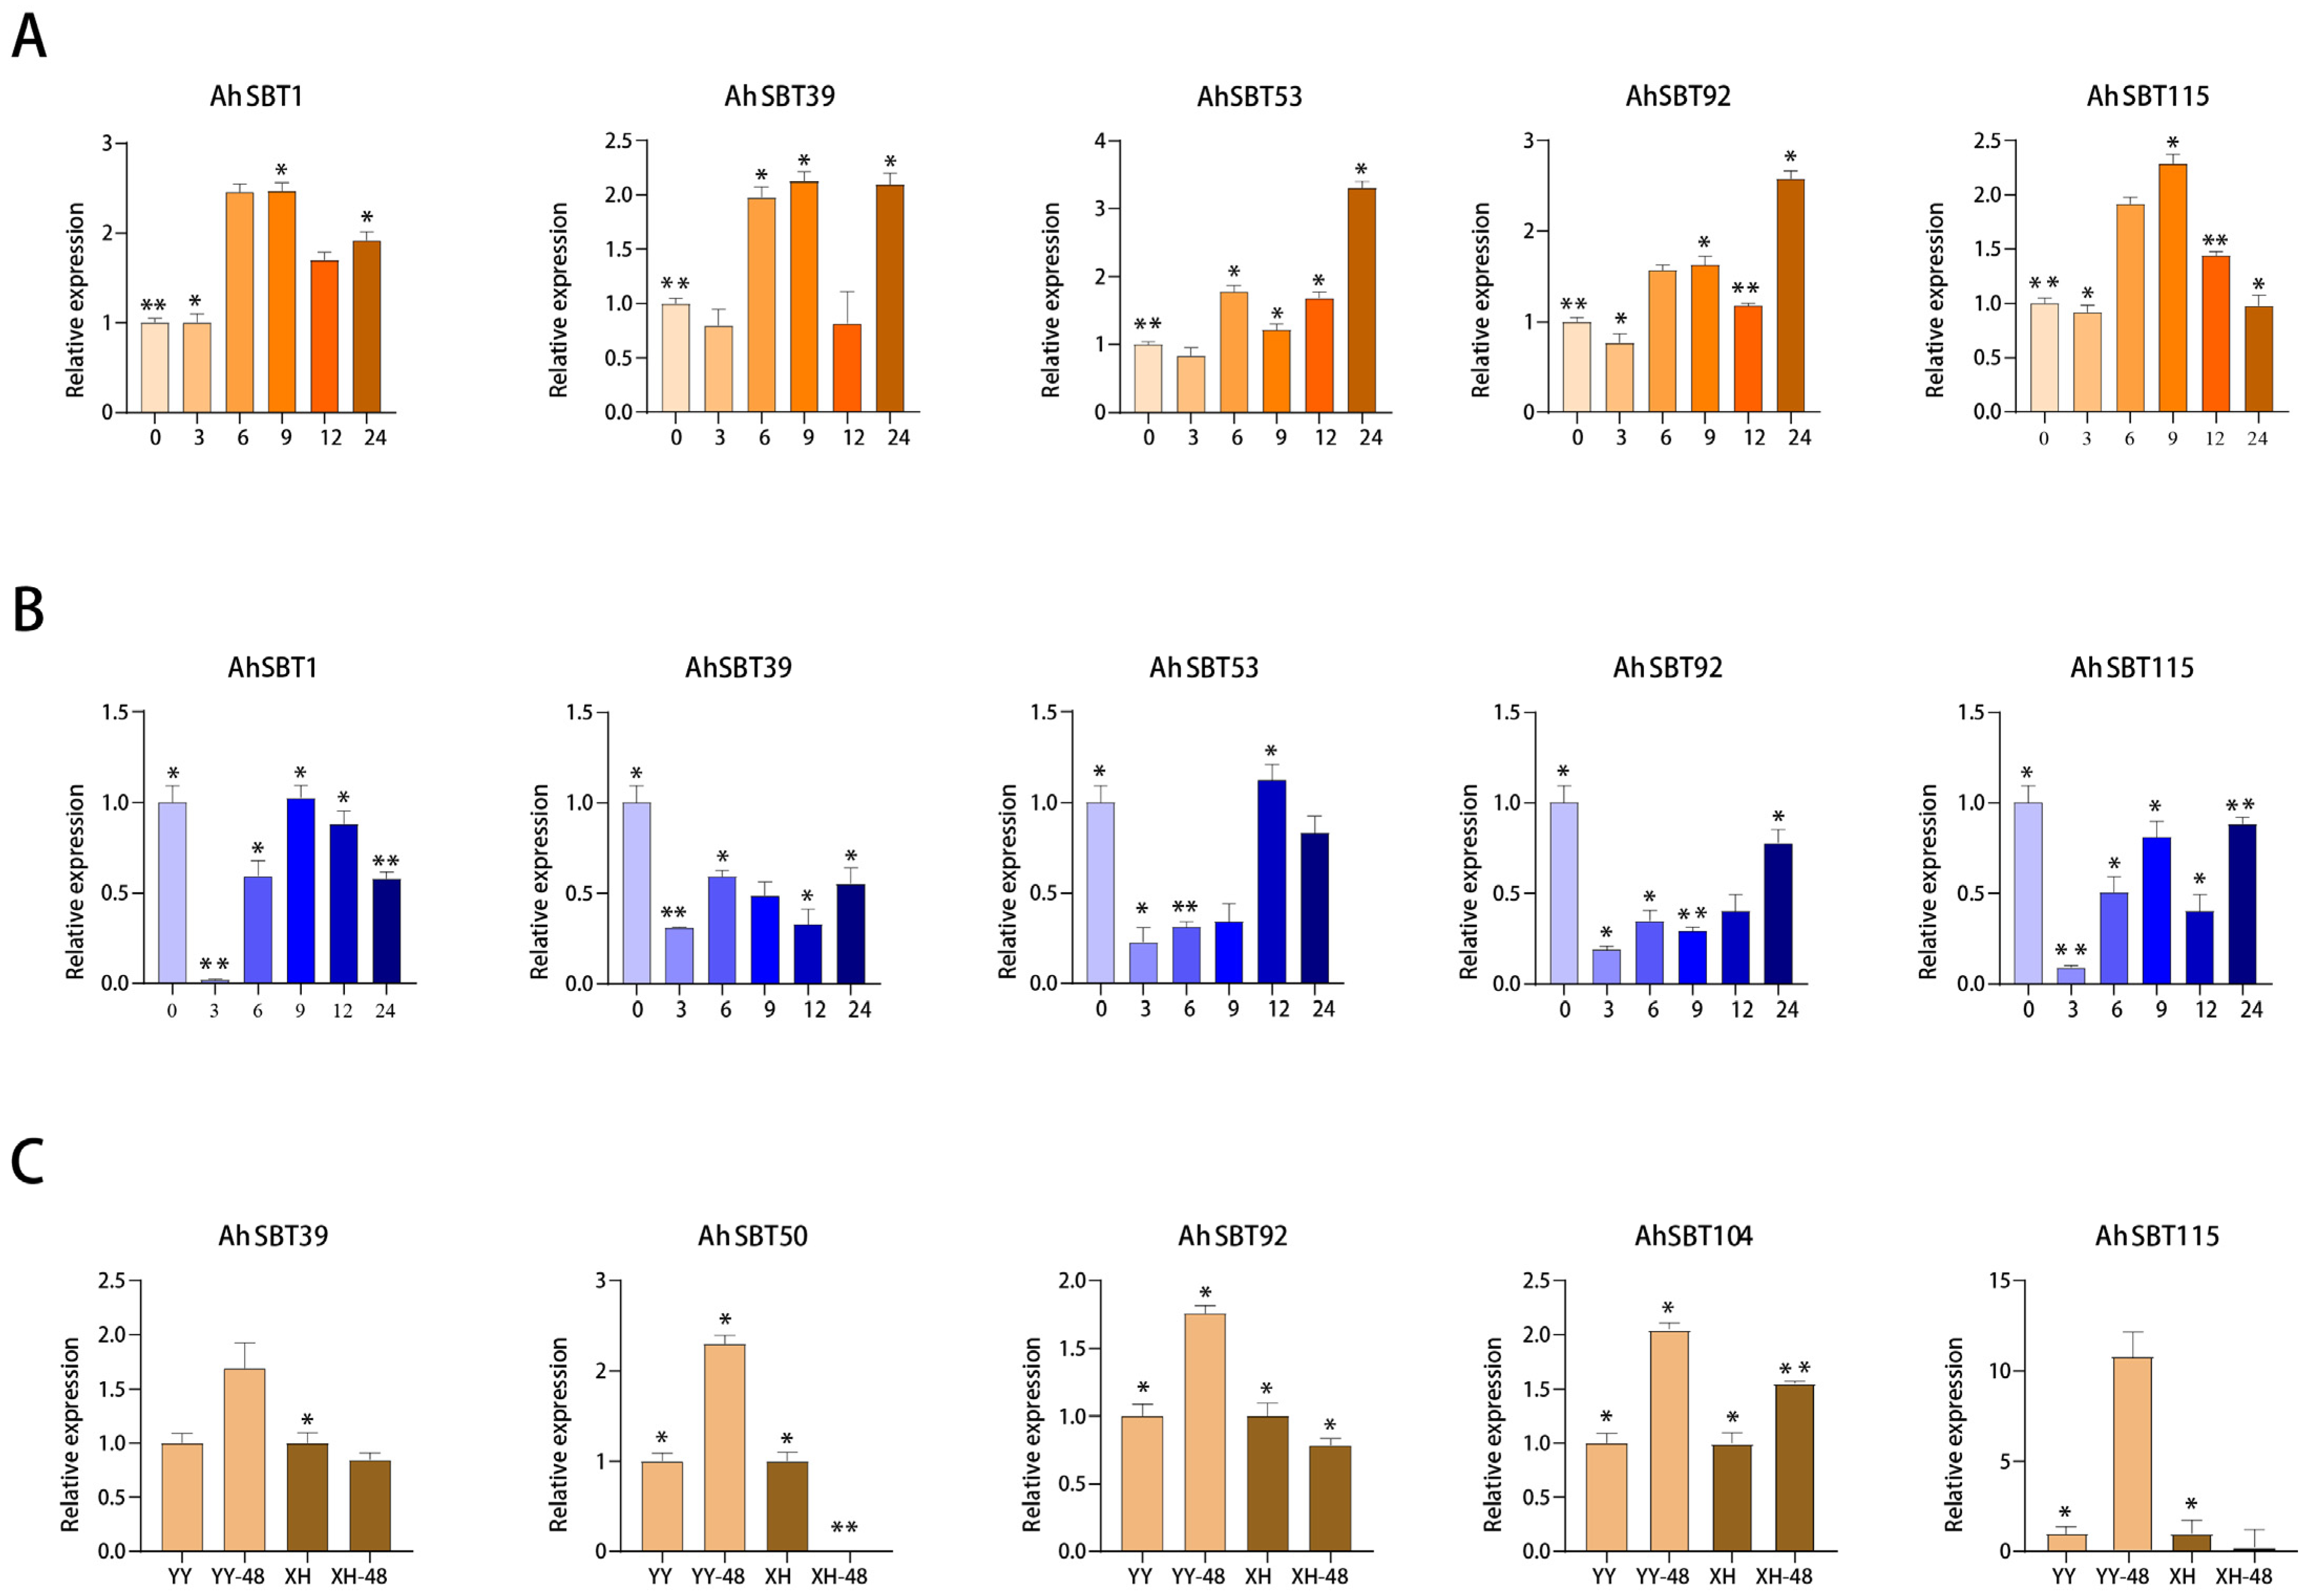
2.10. Profiling Expression of AhSBTs Under Bacterial Wilt, ABA and Cold Treatment Using qRT-PCR

We analyzed the gene expression profiles using qRT-PCR under ABA, cold, and Ralstonia solanacearum treatment (Supplementary Table S7). Based on the transcriptome data, we selected six genes with specific expression patterns to verify their transcription levels under these treatments at different time points (Supplementary Table S8). Under ABA treatment, almost all genes demonstrated higher expression levels at all time points than CK, excluding a few cases (Figure 11A). Despite the elevated expression levels of AhSBT1 and AhSBT53, which contradicted the transcriptome data, other AhSBTs are consistent with the transcriptome data. Similarly, although all the genes were upregulated in response to cold stress, some genes showed relatively low expression levels compared to CK, such as AhSBT39, AhSBT92, and AhSBT115. Whereas the expression levels of AhSBT1 and AhSBT53 are higher than CK at 9h and 12h (Figure 11B). In response to Ralstonia solanacearum, AhSBT39, AhSBT50, AhSBT104, and AhSBT115 were downregulated in susceptible varieties and upregulated in resistant varieties. However, AhSBT92 is upregulated in both susceptible and resistant varieties. (Figure 11C). Overall, the results of our selected genes are in accordance with the transcriptome data, which suggests the credibility of the data.

3. Discussion

SBT genes are widespread in numerous bacteria, fungi, plants, and parasites. In plants, the multifunctional role of SBT genes is intimately linked to their conserved structural domains, which play a major role in signaling, protein degradation, and development regulation. So far, the SBT gene family has been characterized and functionally validated in several plants, including wheat [20], cotton [19] and Z. mays [21]. These studies have highlighted the involvement of SBT genes in diverse processes, including evolution, growth and development, and defensive responses to biotic and abiotic stimuli. A thorough genome-wide characterization of the SBT gene family in the cultivated peanut has not yet been carried out. This leaves a gap in our knowledge of the functions of these genes, particularly in the presence of biotic and abiotic stress conditions. The fully annotated reference genomes of the cultivated peanut cultivar Shitouqi (STQ) have been released [18], which now provides the opportunity to identify all the putative SBT genes in peanuts and analyze potential functions.
By identifying SBT genes in peanuts, we found that the number of AhSBTs (122) is much higher than ZmSBTs (58), AtSBTs (56), and GmSBTs (54). The high number of AhSBTs may be attributed to the heterozygous tetraploid nature of peanut (AABB, 2n = 40) in the cultivated species, which underwent a whole-genome duplication and a subsequent gene duplication event [22]. Genome-wide duplications and gene replication events have been established as drivers for expanding gene families in plant evolution [23]. The differences in members of SBT genes among different plant species may be attributed to gene duplication events, including tandem and segmental repeats, which play a role in the expansion and variation of SBT genses. SBT gene duplication has also been found in several other plant species [9,19,20,21]. Our findings confirmed that AhSBTs had undergone segmental duplications (Supplementary Table S4); this suggests that AhSBTs duplication events may play an essential role in gene evolution. The synonymous substitution rate (Ks) across gene pairs is often used to estimate the time since whole genome replication [24]. The Ks values of the AhSBT pairs ranged from 0.014 to 1.62, and all had Ka/Ks values less than 1.0, indicating that AhSBTs had undergone intense purifying selection.
The chromosomal distribution of AhSBTs showed non-uniform distribution across chromosomes (Figure 1). The SBT genes were grouped into six groups by BLAST and phylogenetic analysis (Figure 2). The recent research on wheat and cotton supports this classification, in which all SBT genes are divided into six subfamilies [12,19,20]. The Group 6 members in peanut had the most exons. Gene structure analysis revealed that genes within the same subtree had identical exon–intron patterns, with exons ranging from 1 to 34 and introns from 0 to 33 (Supplementary Table S1). This consistency may be due to selective pressure during peanut evolution [25]. Regarding conserved motifs and exon–intron layout, the AhSBTs in each group had almost similar patterns (Figure 3). Also, we predicted 3D protein structure and compared six groups of protein structures in Arabidopsis (Supplementary Figure S2). Notably, the sixth subfamily had a unique structure containing only a peptidasea_S8 domain, which showed significant structural differences compared with the other five groups. The peptidase_S8, along with the PA domain, is involved in substrate recognition through protein-protein interactions, facilitating homodimerization and activation of phytochelatinases [26]. In Glycine max, the PA domain of chymotrypsin regulates substrate length [27]. The N-terminal inhibitor_I9 domain controls chymotrypsin activity by blocking substrate access to the active site, and to increase chymotrypsin activity, this domain must be excised [27]. Additionally, the FNIII (fibronectin III-like) domain is thought to support enzymatic activity by stabilizing the ring structure near the active site, a finding confirmed in multiple studies [28].
These structural characteristics indicate that the subfamilies of SBT genes have undergone distinct evolutionary pathways and play unique biological roles [29]. Our analysis of the AhSBT gene family revealed a complex and diverse structure, which likely reflects their broad range of functions. To enhance our comprehension of how AhSBTs respond to various environmental factors, we predicted the cis-elements in promoters of AhSBTs. We found elements related to phytohormones, abiotic stress, and growth and development (Figure 4 and Supplementary Table S3). Recent studies showed that the cis-elements within SBT genes play a significant role in how plants respond to abiotic and biotic stress [19,29,30]. Moreover, GO enrichment and KEGG analysis further predicted the functional roles of AhSBTs, supporting their involvement in stress response and disease resistance (Figure 8). To validate these functions, we analyzed their expression levels under various hormone treatments and biotic and abiotic stresses. The result showed significant AhSBTs contributed to ABA, cold, and drought, aligning with the findings from other studies. For instance, in cotton, GhSBT27A-silenced plants were more susceptible to drought stress under PEG treatment [9], and AcoSBTs were implicated in ABA signaling [19]. Cold stress downregulated the expression of ZmSBT17, ZmSBT18, and ZmSBT41 in Z. mays [21], further supporting the role of SBT genes in plant adaptation to environmental stresses.
Recent reports also suggest that manipulating SBT genes could contribute to enhancing the immune response in plants. In A. thaliana, overexpressing SBT genes can increase plant resistance to pathogens, while loss of AtSBT3.3 activity can decrease innate immune responses [13]. In wheat, genes including TaSBT7, TaSBT11, TaSBT213, TaSBT193, TaSBT102, and TaSBT26 were significantly upregulated during compatibility (CYR31) and incompatibility (CYR23) interactions, suggesting their potential roles in pathogen resistance [20]. Knocking down TaSBT1.7 using barley stripe mosaic virus-induced gene silencing compromised the hypersensitive response and resistance against Puccinia striiformis f. sp. tritici, the causal agent of wheat stripe rust [31]. Our results also demonstrate that SBT genes play a significant role in the immune response of plants. For instance, AhSBT39, AhSBT50, AhSBT92, AhSBT104, and AhSBT115 showed high expression in disease-resistant varieties under R. solanacearum treatment. These results were verified by qRT-PCR, which agreed with the transcriptome data, strengthening the reliability of these findings. Overall, this study identified several AhSBTs possibly associated with R. solanacearum, ABA, and cold stress, laying the groundwork for future research into their specific roles and regulatory mechanisms under bacterial wilt and abiotic stresses.
We utilized publicly available transcriptome data to analyze the tissue-specific expression profiles of 122 AhSBTs in various tissues/organs. Overall, 122 AhSBTs exhibit diverse organ-specific expression patterns (Figure 10A), and most AhSBTs exhibit higher expression levels in underground organs like roots, embryos, and root nodules/tips. Only the leaves exhibited higher expression levels among the above-ground organs or tissues. During the reproductive development of Arabidopsis, AtSBT1.4 was expressed in all above-ground organs. It was shown to down-regulate the number of branching inflorescences and the pace at which seeds were set [6]. In legumes, including Medicago truncatula and Pisum sativum, SBT1.1 proteins are highly expressed in the endosperm and localized in the endosperm, controlling seed size variation by regulating embryo cell division during reproductive development [32]. In pineapples, six genes (AcoSBT2.4, AcoSBT1.24, AcoSBT6.2, AcoSBT1.6, AcoSBT1.13, and AcoSBT1.22) are expressed in various tissues, particularly in six types of fruit developmental tissues and roots [33]. It can be concluded that AhSBTs may play an important role in the process of seed development, and therefore, particular attention should be paid to the AhSBTs (AhSBT58, AhSBT72, AhSBT122, and AhSBT34) that are specifically expressed in organs related to seed development.
miRNAs are a highly conserved class of molecules that bind precisely to messenger ribonucleic acid (mRNA) targets to suppress post-transcriptional gene expression [34]. Some progress has been made in understanding miRNA function in peanuts [35]. Several miRNAs identified are implicated in stress tolerance and plant development. For example, miRNA156 is engaged in the ABA-miRNA156 interaction, which controls the expression profile of the responsible gene for anthocyanin synthesis under drought stress in plants [36]. Another example is miR159, which regulates plant development, and loss-of-function mutations in miR159, such as those in mir159ab, a double mutant of mir159a and mir159b, enhanced seed drought tolerance and sensitivity to ABA [37]. The target genes of miR160, miR167, and miR393, namely TIR1 and ARF, play a significant role in the response to salt stress [38]. Notably, other miRNA families, including miR3513, miR3518, miR3520, miR3513, and miR3516, have yet to undergo functional characterization. As a result, future research may concentrate on these distinct miRNAs to uncover their potential role in plant development and growth. Furthermore, confirmation of the projected miRNAs’ expression patterns and target genes is required to inform the biological significance of these molecules in peanut breeding initiatives.
Based on these findings, we aim to investigate the functional roles of AhSBT30, AhSBT50, AhSBT92, and AhSBT115 through their heterologous overexpression in A. thaliana. This approach will allow us to assess their involvement in plant disease resistance, specifically against R. solanacearum, and determine whether overexpression leads to enhanced resistance. Additionally, we will analyze the expression dynamics of these genes and their associated pathways using qRT-PCR. To further elucidate their roles, we will perform subcellular localization studies and protein interaction screening to identify potential interacting partners involved in the plant’s stress response mechanisms.

4. Materials and Methods

4.1. Identification of AhSBTs Across the Genome

We downloaded the whole genome data, including the latest protein data for identifying potential SBT genes in peanut species [18]. TAIR (https://arabidopsis.org/, accessed on 28 June 2024) database provided the A. thaliana SBT protein sequences; Soybase (https://www.soybase.org/, accessed on 28 June 2024) provided the soybean SBT protein sequences; and the ensembl (https://ensembl.gramene.org, accessed on 28 June 2024) provided the Z. mays SBT protein sequences. Next, the peptidase-S8 domain’s HMM (hidden Markov model) file (PF00082) was obtained from the Pfam database of proteins. The SBT protein sequences in the peanut genome were identified using the HMMER 3.3 program [39]. High standard screening condition E-value < 1 × 10⁻⁵ was set to the initial results obtained using the raw peptidase-S8 HMM. Third, the obtained protein sequences were de-duplicated, and only proteins corresponding to the most extended transcript of each gene were retained. The selected proteins were further validated using the NCBI conserved domain database (CDD) (https://www.ncbi.nlm.nih.gov/Structure/cdd/wrpsb.cgi, accessed on 30 June 2024) and PFAM (phmmer search|HMMER (ebi.ac.uk, accessed on 30 June 2024). After removing sequences without typical peptidase-S8 structural domains, 122 proteins containing peptidase-S8 domains were identified as SBT proteins of peanut. The BioPerl tool was used to analyze the physicochemical characteristics, including data like molecular weight, grand average of hydropathicity (GRAVY), and isoelectric points [40]. Lastly, BUSCA software (http://busca.biocomp.unibo.it/ accessed on 30 June 2024) was used to analyze the subcellular localization data of anticipated SBT proteins.

4.2. SBTs Distribution Across Chromosomes, Evolutionary Phylogenetic Analysis, and Covariance Study

Using the MapChart 2.32 software, the chromosomal locations of AhSBTs were mapped based on data extracted from the peanut annotation file [41]. Afterwards, the evolutionary relationships of SBT genes were analyzed. The sequences of A. hypogea (AhSBTs), A. thaliana (AtSBTs), G. max (GmSBTs), and Z. mays (ZmSBTs) proteins were aligned with ClustalW in MEGA7 with default parameters, and the resulting aligned sequences were utilized to construct a neighbor-joining evolutionary tree with 1000 bootstrap replications. At the same time, the nucleotide substitution model was set to p-distance, gap/missing data treatment was set to pairwise deletion, and other settings were set to default parameters. The resulting evolutionary tree was visually depicted using the web-based tool EvolView, available at https://www.evolgenius.info/evolview (accessed on 10 July 2024). To demonstrate the three-dimensional structure of SBT genes, one representative protein from each of the six subgroups was selected for modeling using the InterPro database (https://www.ebi.ac.uk/interpro/, accessed on 10 July 2024)).
To determine whether the AhSBT genes underwent tandem or segmental duplications, we analyzed the duplication events by MCScanX [42]. To further investigate the evolutionary relationships between the peanut SBT gene family and those in A. thaliana, G. max, and Z. mays, covariate analysis was performed, and the results were visualized using Circos 0.69-8 software [43]. The KaKs calculator 3.0 was used to compute nucleotide substitution rates [44]. For that, the newick file for the NG-phylogenetic tree was exported and given as input to the KaKs calculator 3.0 software under the “Phylogenetic Tree section.” The Yang–Nilson model was used to calculate the Ka and Ks values. The estimated timing of the duplication event was determined by the formula T = Ks/2λ (λ = alike substitutions rate) for cultivated peanut was 8.12−9 [45].

4.3. Analysis of Gene Structure and Motifs

Information about coding sequences (CDS), exons, and UTRs of the peanut SBT genes was extracted from genome annotation files, and gene structures were visually represented using GSDS 2.0 [46]. MEME 5.5.7 software (https://meme-suite.org/, accessed on 12 July 2024) detected conserved protein motifs in peanut SBT proteins with default parameters for amino acid residues. Finally, these results were displayed graphically by TBtools 1.6 software [47].

4.4. Promoter Analysis of AhSBTs

The cis-regulatory elements of AhSBT promoters were identified within the 2 kb upstream region from each AhSBT transcription start site (ATG). The online tool PlantCARE (http://bioinformatics.psb.ugent.be/webtools/plantcare/html/, accessed on 12 July 2024) was used to identify the cis-acting elements, and TBtools 1.6 software was used to visualize them in picture form.

4.5. Prediction of Potential miRNAs Targeting AhSBTs and Assessment of Functional Annotation

The coding sequences (CDS) of the AhSBTs were utilized to predict the miRNA target sites through the psRNATarget (https://www.zhaolab.org/psRNATarget/analysis, accessed on 14 July 2024) [48]. An interactive network diagram linking the potential miRNAs and AhSBTs was created using Cytoscape 3.9.0 software [49]. Moreover, KEGG and GO annotations were assessed by scanning the proteins through eggNOG v.5.0 software [50]. The findings of KEGG and GO analyses were visualized using TBtools 1.6 software.

4.6. Expression Patterns of the AhSBTs

Expression of AhSBTs was assessed in different developmental tissues and organs, such as the testa, root, stem, cotyledon, embryo, pericarp, stem tip, peg, root nodule, root tip, leaf, and flower. The study also investigated their responses to various hormones, including ethylene, abscisic acid, salicylic acid, paclobutrazol, and brassinolide. Furthermore, the expression level of AhSBTs was analyzed under biotic and abiotic stressors, including cold, drought, and bacterial wilt. These evaluations were conducted using publicly available transcriptome datasets of cultivated peanuts from the PGR database. Detailed information on harvested samples and data analysis can be consulted in previous studies [18]. To address significant variations in gene expression, we normalized the data by logarithmically transforming FPKM (fragment per kilobase of transcript per million) values to base log2(FPKM + 1). Finally, heat maps were generated using R software, version 4.3.0.

4.7. Plant Material and Stress Conditions

We utilized the cultivated peanut variety “Minhua-6” from southeastern China to investigate stress responses. Viable seeds were planted in small pots containing a vermicompost mixture. Seedlings underwent cold stress at 4 °C and were treated with 10 mg/mL−1 of ABA at the four-leaf stage for varying durations, including 3, 6, 9, 12, and 24 h. Each treatment was replicated three times to minimize experimental errors. After treatment, all plant samples were collected, preserved in liquid nitrogen, and stored at −80 °C before RNA extraction. Four-leaf stage plants of highly resistant and susceptible varieties were inoculated with Ralstonia solanacearum for biotic stress, and young leaves (0 and 48 h) were sampled. Each set of experiments was conducted in triplicate.

4.8. RNA Extraction and qRT-PCR-Based Expression Analysis

The CTAB method was used to extract the total RNA. Subsequently, from 1 μg of total RNA, cDNA was synthesized using the 5x All-In-One RT MasterMix kit (ABM, Richmond, BC, Canada) as per the producers’ instructions. RT-qPCR was conducted on a QuantStudio 5 system (Thermo Fisher Scientific, Waltham, MA, USA) with SYBR TB GreenTM Premix (TaKaRa, Dalian, China). This study employed AhActin (housekeeping gene) to ensure gene expression stability. Data normalization was carried out using the 2−ΔΔCT method [51]. The qRT-PCR primers are listed in Supplementary Table S2, and GraphPad Prism v9.0.0 was used for graph creation.

5. Conclusions

In this study, we characterized and identified the SBT gene family in peanuts. A total of 122 genes were identified as SBT gene family members, and a comprehensive bioinformatics analysis, including characterization, evolution, structure, cis-elements, GO, KEGG, and miRNA, was conducted for the AhSBTs. Promoter cis-element analysis revealed key regulatory elements linked to abiotic stress responses and phytohormone signaling, while expression profiling highlighted tissue-specific and stress-induced expression patterns of key AhSBTs. These findings contribute significantly to the understanding of the molecular mechanisms underlying stress tolerance and developmental regulation in peanut. In particular, AhSBT genes showing strong expression responses to abiotic stresses (e.g., cold and drought), phytohormones (e.g., ABA and SA), and biotic challenges (e.g., Ralstonia solanacearum infection) represent promising candidates for further functional validation. Such genes may be exploited in peanut breeding programs to enhance stress resilience and disease resistance. In brief, this study provides a foundation for comprehending the biological roles of SBT gene family members under both biotic and abiotic stress. By integrating these insights into breeding pipelines, it may be possible to develop peanut cultivars with improved agronomic traits, ultimately contributing to sustainable crop production and food security.

Supplementary Materials

The following supporting information can be downloaded at https://www.mdpi.com/article/10.3390/ijms252413361/s1.

Author Contributions

Conceptualization, S.L. and Y.Z. (Yuhui Zhuang); methodology, S.L., H.F., L.W., and Y.Z. (Yongli Zhang); software, S.L., H.F., Y.S., and L.W.; formal analysis, S.L., H.F., and Y.Z. (Yongli Zhang); resources, Y.Z. (Yuhui Zhuang); writing—original draft preparation, S.L. and Y.S.; writing—review and editing, S.L., Y.S., S.A., and Y.Z. (Yongli Zhang); supervision, Y.Z. (Yuhui Zhuang); funding acquisition, Y.Z. (Yuhui Zhuang). All authors have read and agreed to the published version of the manuscript.

Funding

This work was supported by grants from the National Natural Science Foundation (NSFC) of China (32401787, U1705233, 32272155, 32072103, 31701463, and 31601337), the National Key Research and Development Program of China (2023YFD1202802 and 2023YFD1202804), the Special Fund for Scientific and Technological Innovation of Fujian Agriculture and Forestry University (KFB23002, KFb22010XA, and KFb22011XA), and the Science and Technology Foundation of Fujian Province of China (2021N5007 and 2017N0006).

Institutional Review Board Statement

Not applicable.

Informed Consent Statement

Not applicable.

Data Availability Statement

Online repositories house the datasets used in this investigation. Accession number(s) and repository names are available at https://www.ncbi.nlm.nih.gov/bioproject/PRJNA480120 (accessed on 30 June 2024).

Conflicts of Interest

There is no conflict of interest among the authors.

Abbreviations

AhSBTArachis hypogaea subtilases
AhArachis hypogaea
ASPAspartic acid
AtArabidopsis thaliana
ChrChromosome
FPKMFragments per kilobase of transcript per million mapped reads
GmGlycin max
GOGene ontology
HISHistidine
HMMHidden Markov model
KEGGKyoto Encyclopedia of Genes and Genomes
miRNAsMicro RNAs
MyaMillion years ago
qRT-PCRQuantitative real-time PCR
SERSerine
STQ Peanut cultivar Shitouqi
ZmZea mays

References

  1. Schaller, A. A cut above the rest: The regulatory function of plant proteases. Planta 2004, 220, 183–197. [Google Scholar] [CrossRef] [PubMed]
  2. Siezen, R.J.; Leunissen, J.A. Subtilases: The superfamily of subtilisin-like serine proteases. Protein Sci. 1997, 6, 501–523. [Google Scholar] [CrossRef] [PubMed]
  3. Truskina, J.; Brück, S.; Stintzi, A.; Boeuf, S.; Doll, N.M.; Fujita, S.; Geldner, N.; Schaller, A.; Ingram, G.C. A peptide-mediated, multilateral molecular dialogue for the coordination of pollen wall formation. Proc. Natl. Acad. Sci. USA 2022, 119, e2201446119. [Google Scholar] [CrossRef] [PubMed]
  4. Barrett, A.J.; Rawlings, N.D. Families and clans of serine peptidases. Arch. Biochem. Biophys. 1995, 318, 247–250. [Google Scholar] [CrossRef]
  5. Schaller, A.; Stintzi, A.; Graff, L. Subtilases—Versatile tools for protein turnover, plant development, and interactions with the environment. Physiol. Plant. 2012, 145, 52–66. [Google Scholar] [CrossRef]
  6. Rautengarten, C.; Steinhauser, D.; Büssis, D.; Stintzi, A.; Schaller, A.; Kopka, J.; Altmann, T. Inferring hypotheses on functional relationships of genes: Analysis of the Arabidopsis thaliana subtilase gene family. PLoS Comput. Biol. 2005, 1, e40. [Google Scholar] [CrossRef] [PubMed]
  7. Roberts, I.N.; Veliz, C.G.; Criado, M.V.; Signorini, A.; Simonetti, E.; Caputo, C. Identification and expression analysis of 11 subtilase genes during natural and induced senescence of barley plants. J. Plant Physiol. 2017, 211, 70–80. [Google Scholar] [CrossRef]
  8. Tripathi, L.P.; Sowdhamini, R. Cross genome comparisons of serine proteases in Arabidopsis and rice. BMC Genom. 2006, 7, 200. [Google Scholar] [CrossRef]
  9. Dai, M.; Zhou, N.; Zhang, Y.; Zhang, Y.; Ni, K.; Wu, Z.; Liu, L.; Wang, X.; Chen, Q. Genome-wide analysis of the SBT gene family involved in drought tolerance in cotton. Front. Plant Sci. 2022, 13, 1097732. [Google Scholar] [CrossRef]
  10. Cao, J.; Han, X.; Zhang, T.; Yang, Y.; Huang, J.; Hu, X. Genome-wide and molecular evolution analysis of the subtilase gene family in Vitis vinifera. BMC Genom. 2014, 15, 1116. [Google Scholar] [CrossRef]
  11. Reichardt, S.; Repper, D.; Tuzhikov, A.I.; Galiullina, R.A.; Planas-Marquès, M.; Chichkova, N.V.; Vartapetian, A.B.; Stintzi, A.; Schaller, A. The tomato subtilase family includes several cell death-related proteinases with caspase specificity. Sci. Rep. 2018, 8, 10531. [Google Scholar] [CrossRef] [PubMed]
  12. Cui, H.; Zhou, G.; Ruan, H.; Zhao, J.; Hasi, A.; Zong, N. Genome-Wide Identification and Analysis of the Maize Serine Peptidase S8 Family Genes in Response to Drought at Seedling Stage. Plants 2023, 12, 369. [Google Scholar] [CrossRef] [PubMed]
  13. Ramírez, V.; López, A.; Mauch-Mani, B.; Gil, M.J.; Vera, P. An extracellular subtilase switch for immune priming in Arabidopsis. PLoS Pathog. 2013, 9, e1003445. [Google Scholar] [CrossRef] [PubMed]
  14. Duan, X.; Zhang, Z.; Wang, J.; Zuo, K. Characterization of a novel cotton subtilase gene GbSBT1 in response to extracellular stimulations and its role in Verticillium resistance. PLoS ONE 2016, 11, e0153988. [Google Scholar] [CrossRef]
  15. Ekchaweng, K.; Khunjan, U.; Churngchow, N. Molecular cloning and characterization of three novel subtilisin-like serine protease genes from Hevea brasiliensis. Physiol. Mol. Plant Pathol. 2017, 97, 79–95. [Google Scholar] [CrossRef]
  16. Budič, M.; Sabotič, J.; Meglič, V.; Kos, J.; Kidrič, M. Characterization of two novel subtilases from common bean (Phaseolus vulgaris L.) and their responses to drought. Plant Physiol. Biochem. 2013, 62, 79–87. [Google Scholar] [CrossRef]
  17. Galotta, M.F.; Pugliese, P.; Gutiérrez-Boem, F.H.; Veliz, C.G.; Criado, M.V.; Caputo, C.; Echeverria, M.; Roberts, I.N. Subtilase activity and gene expression during germination and seedling growth in barley. Plant Physiol. Biochem. 2019, 139, 197–206. [Google Scholar] [CrossRef]
  18. Zhuang, W.; Chen, H.; Yang, M.; Wang, J.; Pandey, M.K.; Zhang, C.; Chang, W.C.; Zhang, L.; Zhang, X.; Tang, R.; et al. The genome of cultivated peanut provides insight into legume karyotypes, polyploid evolution and crop domestication. Nat. Genet. 2019, 51, 865–876. [Google Scholar] [CrossRef]
  19. Xue, T.; Liu, L.; Zhang, X.; Li, Z.; Sheng, M.; Ge, X.; Xu, W.; Su, Z. Genome-Wide Investigation and Co-Expression Network Analysis of SBT Family Gene in Gossypium. Int. J. Mol. Sci. 2023, 24, 5760. [Google Scholar] [CrossRef]
  20. Zhao, X.; Goher, F.; Chen, L.; Song, J.; Zhao, J. Genome-Wide Identification, Phylogeny and Expression Analysis of Subtilisin (SBT) Gene Family under Wheat Biotic and Abiotic Stress. Plants 2023, 12, 3065. [Google Scholar] [CrossRef]
  21. Hou, Q.; Wang, L.; Qi, Y.; Yan, T.; Zhang, F.; Zhao, W.; Wan, X. A systematic analysis of the subtilase gene family and expression and subcellular localization investigation of anther-specific members in maize. Plant Physiol. Biochem. 2023, 203, 108041. [Google Scholar] [CrossRef] [PubMed]
  22. Bertioli, D.J.; Seijo, G.; Freitas, F.O.; Valls, J.F.; Leal-Bertioli, S.C.; Moretzsohn, M.C.J.P.G.R. An overview of peanut and its wild relatives. Plant Genet. Resour. 2011, 9, 134–149. [Google Scholar] [CrossRef]
  23. Conant, G.C.; Wolfe, K.H. Turning a hobby into a job: How duplicated genes find new functions. Nat. Rev. Genet. 2008, 9, 938–950. [Google Scholar] [CrossRef]
  24. Ren, R.; Wang, H.; Guo, C.; Zhang, N.; Zeng, L.; Chen, Y.; Ma, H.; Qi, J. Widespread whole genome duplications contribute to genome complexity and species diversity in angiosperms. Mol. Plant 2018, 11, 414–428. [Google Scholar] [CrossRef]
  25. Babenko, V.N.; Rogozin, I.B.; Mekhedov, S.L.; Koonin, E.V. Prevalence of intron gain over intron loss in the evolution of paralogous gene families. Nucleic Acids Res. 2004, 32, 3724–3733. [Google Scholar] [CrossRef]
  26. Rose, R.; Schaller, A.; Ottmann, C. Structural features of plant subtilases. Plant Signal. Behav. 2010, 5, 180–183. [Google Scholar] [CrossRef] [PubMed]
  27. Tan-Wilson, A.; Bandak, B.; Prabu-Jeyabalan, M. The PA domain is crucial for determining optimum substrate length for soybean protease C1: Structure and kinetics correlate with molecular function. Plant Physiol. Biochem. 2012, 53, 27–32. [Google Scholar] [CrossRef]
  28. Ottmann, C.; Rose, R.; Huttenlocher, F.; Cedzich, A.; Hauske, P.; Kaiser, M.; Huber, R.; Schaller, A. Structural basis for Ca2+-independence and activation by homodimerization of tomato subtilase 3. Proc. Natl. Acad. Sci. USA 2009, 106, 17223–17228. [Google Scholar] [CrossRef]
  29. Xu, Y.; Wang, S.; Li, L.; Sahu, S.K.; Petersen, M.; Liu, X.; Melkonian, M.; Zhang, G.; Liu, H. Molecular evidence for origin, diversification and ancient gene duplication of plant subtilases (SBTs). Sci. Rep. 2019, 9, 12485. [Google Scholar] [CrossRef]
  30. Wang, G.; Ellendorff, U.; Kemp, B.; Mansfield, J.W.; Forsyth, A.; Mitchell, K.; Bastas, K.; Liu, C.-M.; Woods-Tör, A.; Zipfel, C.; et al. A Genome-Wide Functional Investigation into the Roles of Receptor-Like Proteins in Arabidopsis. Plant Physiol. 2008, 147, 503–517. [Google Scholar] [CrossRef]
  31. Yang, Y.; Zhang, F.; Zhou, T.; Fang, A.; Yu, Y.; Bi, C.; Xiao, S. In Silico Identification of the Full Complement of Subtilase-Encoding Genes and Characterization of the Role of TaSBT1.7 in Resistance Against Stripe Rust in Wheat. Phytopathology 2021, 111, 398–407. [Google Scholar] [CrossRef] [PubMed]
  32. D’Erfurth, I.; Le Signor, C.; Aubert, G.; Sanchez, M.; Vernoud, V.; Darchy, B.; Lherminier, J.; Bourion, V.; Bouteiller, N.; Bendahmane, A.; et al. A role for an endosperm-localized subtilase in the control of seed size in legumes. New Phytol. 2012, 196, 738–751. [Google Scholar] [CrossRef] [PubMed]
  33. Jin, X.; Liu, Y.; Hou, Z.; Zhang, Y.; Fang, Y.; Huang, Y.; Cai, H.; Qin, Y.; Cheng, Y. Genome-Wide Investigation of SBT Family Genes in Pineapple and Functional Analysis of AcoSBT1.12 in Floral Transition. Front. Genet. 2021, 12, 730821. [Google Scholar] [CrossRef]
  34. Jamla, M.; Patil, S.; Joshi, S.; Khare, T.; Kumar, V. MicroRNAs and their exploration for developing heavy metal-tolerant plants. J. Plant Growth Regul. 2021, 41, 2579–2595. [Google Scholar] [CrossRef]
  35. Zhao, C.; Xia, H.; Cao, T.; Yang, Y.; Zhao, S.; Hou, L.; Zhang, Y.; Li, C.; Zhang, X.; Wang, X. Small RNA and degradome deep sequencing reveals peanut microRNA roles in response to pathogen infection. Plant Mol. Biol. Rep. 2015, 33, 1013–1029. [Google Scholar] [CrossRef]
  36. Yao, X.; Chen, J.; Zhou, J.; Yu, H.; Ge, C.; Zhang, M.; Gao, X.; Dai, X.; Yang, Z.-N.; Zhao, Y. An essential role for miRNA167 in maternal control of embryonic and seed development. Plant Physiol. 2019, 180, 453–464. [Google Scholar] [CrossRef] [PubMed]
  37. Waadt, R.; Seller, C.A.; Hsu, P.-K.; Takahashi, Y.; Munemasa, S.; Schroeder, J.I. Plant hormone regulation of abiotic stress responses. Nat. Rev. Mol. Cell Biol. 2022, 23, 680–694. [Google Scholar] [CrossRef]
  38. Li, Y.; Luo, W.; Sun, Y.; Chang, H.; Ma, K.; Zhao, Z.; Lu, L. Identification and expression analysis of miR160 and their target genes in cucumber. Biochem. Genet. 2022, 60, 127–152. [Google Scholar] [CrossRef] [PubMed]
  39. Potter, S.C.; Luciani, A.; Eddy, S.R.; Park, Y.; Lopez, R.; Finn, R.D. HMMER web server: 2018 update. Nucleic Acids Res. 2018, 46, W200–W204. [Google Scholar] [CrossRef]
  40. Stajich, J.E. An Introduction to BioPerl. Methods Mol. Biol. 2007, 406, 535–548. [Google Scholar] [CrossRef]
  41. Voorrips, R.E. MapChart: Software for the graphical presentation of linkage maps and QTLs. J. Hered. 2002, 93, 77–78. [Google Scholar] [CrossRef] [PubMed]
  42. Wang, Y.; Tang, H.; Debarry, J.D.; Tan, X.; Li, J.; Wang, X.; Lee, T.H.; Jin, H.; Marler, B.; Guo, H.; et al. MCScanX: A toolkit for detection and evolutionary analysis of gene synteny and collinearity. Nucleic Acids Res. 2012, 40, e49. [Google Scholar] [CrossRef] [PubMed]
  43. Krzywinski, M.; Schein, J.; Birol, I.; Connors, J.; Gascoyne, R.; Horsman, D.; Jones, S.J.; Marra, M.A. Circos: An information aesthetic for comparative genomics. Genome Res. 2009, 19, 1639–1645. [Google Scholar] [CrossRef]
  44. Zhang, Z. KaKs_Calculator 3.0: Calculating Selective Pressure on Coding and Non-coding Sequences. Genom. Proteom. Bioinform. 2022, 20, 536–540. [Google Scholar] [CrossRef]
  45. Bertioli, D.J.; Cannon, S.B.; Froenicke, L.; Huang, G.; Farmer, A.D.; Cannon, E.K.; Liu, X.; Gao, D.; Clevenger, J.; Dash, S. The genome sequences of Arachis duranensis and Arachis ipaensis, the diploid ancestors of cultivated peanut. Nat. Genet. 2016, 48, 438–446. [Google Scholar] [CrossRef]
  46. Hu, B.; Jin, J.; Guo, A.-Y.; Zhang, H.; Luo, J.; Gao, G. GSDS 2.0: An upgraded gene feature visualization server. Bioinformatics 2015, 31, 1296–1297. [Google Scholar] [CrossRef]
  47. Chen, C.; Chen, H.; Zhang, Y.; Thomas, H.R.; Frank, M.H.; He, Y.; Xia, R. TBtools: An integrative toolkit developed for interactive analyses of big biological data. Mol. Plant 2020, 13, 1194–1202. [Google Scholar] [CrossRef]
  48. Dai, X.; Zhuang, Z.; Zhao, P.X. psRNATarget: A plant small RNA target analysis server (2017 release). Nucleic Acids Res. 2018, 46, W49–W54. [Google Scholar] [CrossRef] [PubMed]
  49. Shannon, P.; Markiel, A.; Ozier, O.; Baliga, N.S.; Wang, J.T.; Ramage, D.; Amin, N.; Schwikowski, B.; Ideker, T. Cytoscape: A software environment for integrated models of biomolecular interaction networks. Genome Res. 2003, 13, 2498–2504. [Google Scholar] [CrossRef]
  50. Huerta-Cepas, J.; Szklarczyk, D.; Heller, D.; Hernández-Plaza, A.; Forslund, S.K.; Cook, H.; Mende, D.R.; Letunic, I.; Rattei, T.; Jensen, L.J. eggNOG 5.0: A hierarchical, functionally and phylogenetically annotated orthology resource based on 5090 organisms and 2502 viruses. Nucleic Acids Res. 2019, 47, D309–D314. [Google Scholar] [CrossRef]
  51. Livak, K.J.; Schmittgen, T.D. Analysis of relative gene expression data using real-time quantitative PCR and the 2(-Delta Delta C(T)) Method. Methods 2001, 25, 402–408. [Google Scholar] [CrossRef] [PubMed]
Figure 1. Chromosomal mapping of AhSBTs on A. hypogea genome. Map distribution of 20 chromosomes (grey bars). Representative chromosome numbers are shown on the left (black), and gene names are on the right side (red).
Ijms 25 13361 g001
Figure 2. Phylogenetic analysis of AhSBTs. (A) The phylogenetic tree shows AhSBTs were classified into six groups. Shades of colors represent different branches. (B) Number of SBT proteins of A. hypogea, Z. mays, G. max, and A. thaliana in each group of the phylogenetic tree.
Ijms 25 13361 g002
Figure 3. Gene structures and conserved domains of peanut. (A) AhSBTs evolutionary connection. The conserved domains of AhSBTs were shown by various colors in the right column. (B) AhSBTs structures, green, yellow, and black lines represent UTR regions, exons, and introns, respectively. The bar displays the length of AhSBTs.
Ijms 25 13361 g003
Figure 4. Examination of the AhSBTs promoters’ regions cis-elements. Similar colors are used to symbolize cis-elements that share a functional similarity.
Ijms 25 13361 g004
Figure 5. Cis-element in the promoter regions of AhSBTs. (A,C,E) The total number of elements in AhSBT promoters associated with abiotic stress, phytohormones, and growth and development categories, respectively. (B,D,F) Pie charts display the percentage (%) ratio of the various cis-elements from each category, such as (B) abiotic stress sensitive, (D) phytohormones responsive, and (F) plant growth and development responsive.
Ijms 25 13361 g005
Figure 6. Distribution of AhSBTs on chromosomes and gene duplications. The gene density spread on the respective chromosomes is indicated by the outermost circle. Using colored lines, AhSBTs inside segmental duplications are connected. Tandem duplications are indicated with different colors. Orange lines show collinearity links among AhSBTs.
Ijms 25 13361 g006
Figure 7. Multiple collinearity assessments of SBT genes among A. thaliana (At), G. max (Gm), A. hypogea (Ah), and Z. mays (Zm). The red lines indicate the syntenic SBT orthologs, whereas the grey lines in the background designate the collinear blocks within peanut and the other three genomes.
Ijms 25 13361 g007
Figure 8. Gene ontology (GO) and KEGG enrichment analysis of AhSBT proteins. (A) The extremely rich GO terms in AhSBTs from the MF, CC, and BP categories. (B) Highly enriched KEGG pathways in AhSBT proteins.
Ijms 25 13361 g008
Figure 9. miRNAs targeting AhSBTs. The pictorial representation showing the physical target positions of miRNAs (ahy-miR3514-5p and ahy-miR3513-5p) on the AhSBT69 and the physical target positions of miRNAs (ahy-miR156a and ahy-miR3511-5p) on AhSBT115. The black bar shows the chromosome; the red bar shows the gene position on the chromosome. The position of miRNAs on the gene sequence is indicated by the thick blue bar.
Ijms 25 13361 g009
Figure 10. AhSBTs expression analysis in different tissues, hormones, and stress conditions. (A) The heatmap displays the expression levels of AhSBTs in 13 peanut tissues. (B) The expression levels of AhSBTs following treatment with five hormones. (C) The expression levels of AhSBTs under drought and low-temperature conditions. (D) Expression levels under R. solanacearum treatment in highly sensitive and highly resilient varieties to bacterial wilt (R/S-T: Treated resistant and susceptible varieties, R/S-C: Control for resistant/susceptible varieties).
Ijms 25 13361 g010
Figure 11. Quantitative expression of AhSBTs. The expression levels of representative AhSBTs under low temperature (A), ABA hormone treatment (B), and under R. solanacearum infection in varieties with high susceptibility and high resistance to bacterial wilt (C) (**: p < 0.01, *: p < 0.05).
Ijms 25 13361 g011
Disclaimer/Publisher’s Note: The statements, opinions and data contained in all publications are solely those of the individual author(s) and contributor(s) and not of MDPI and/or the editor(s). MDPI and/or the editor(s) disclaim responsibility for any injury to people or property resulting from any ideas, methods, instructions or products referred to in the content.

