
Sustainable Solid-State Sodium-Ion Batteries Featuring Ferroelectric Electrolytes


Abstract
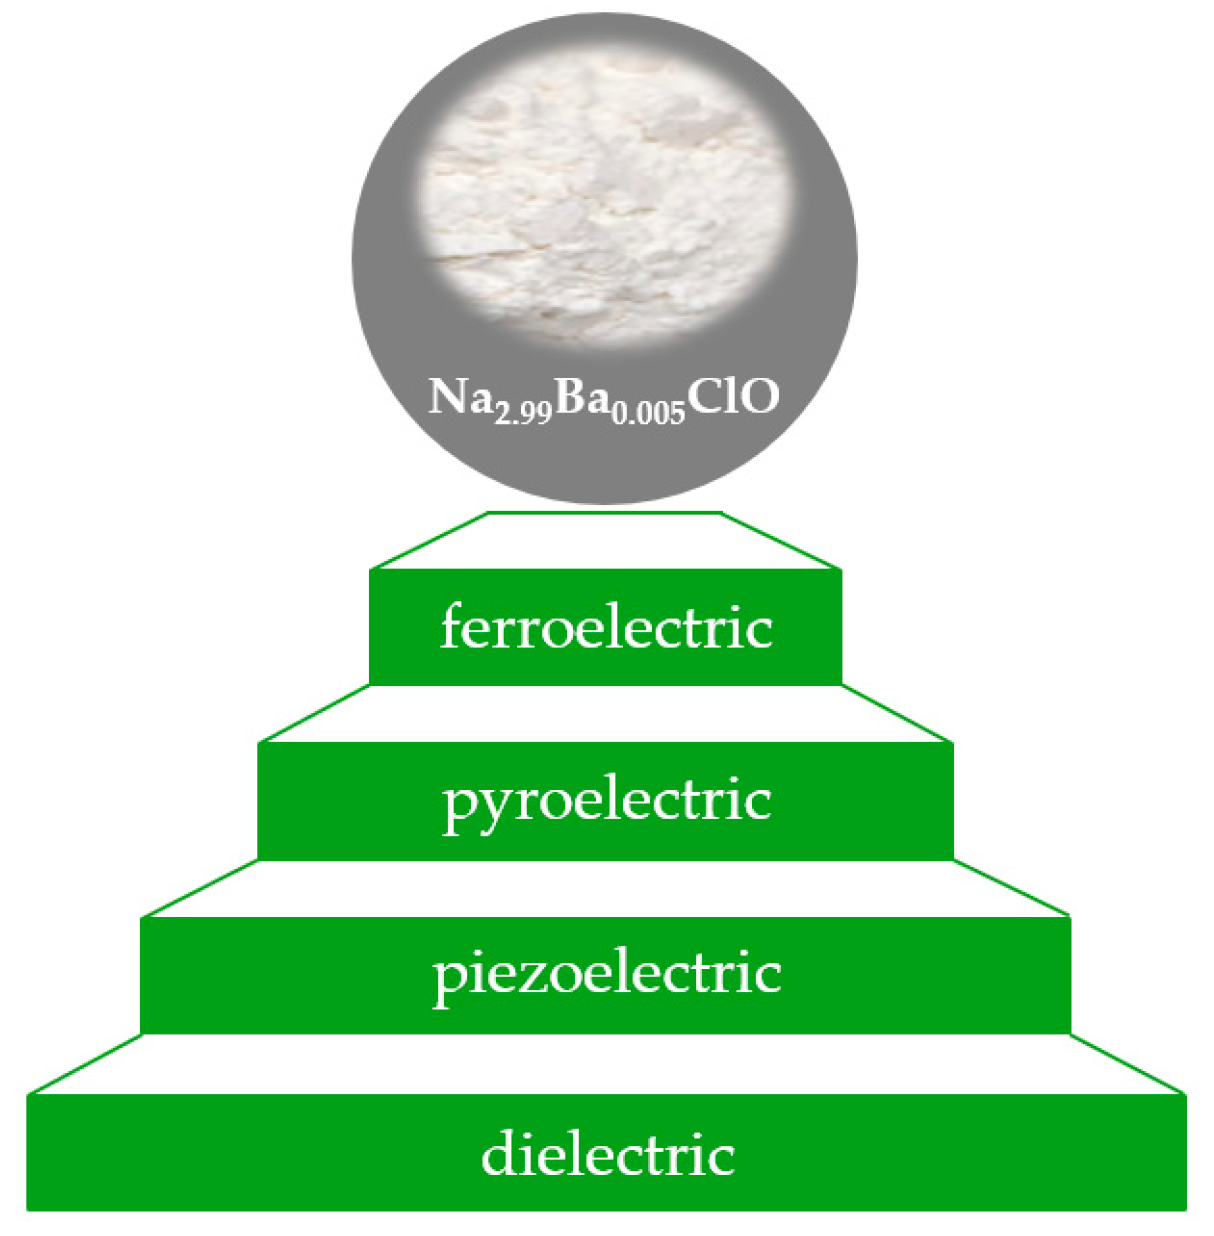
1. Introduction
2. Results and Discussion
2.1. Performance of Cu/Na2.99Ba0.005ClO Composite in Cellulose/Zn Pouch Cells
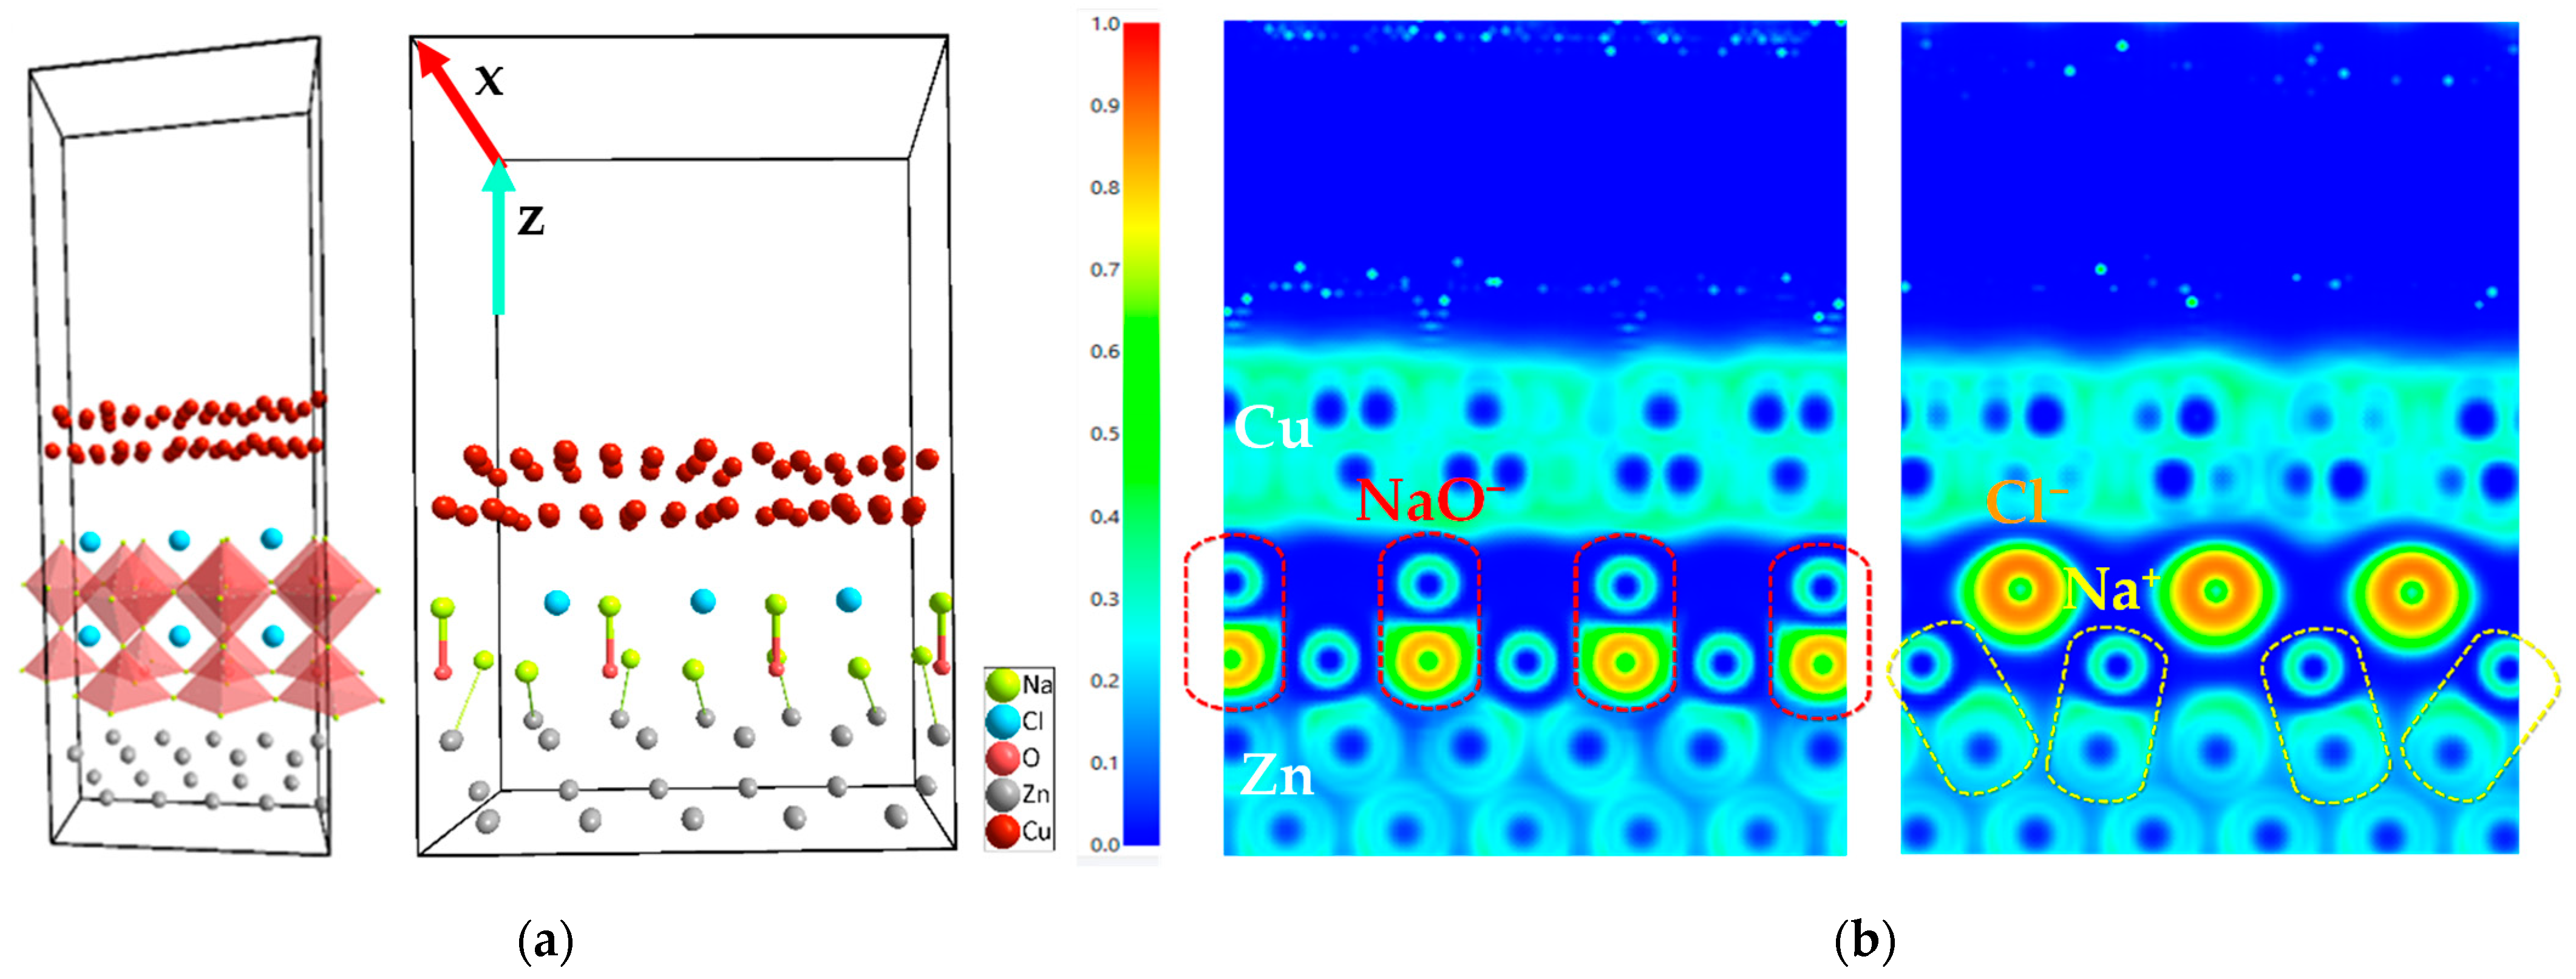
2.1.1. Heterojunction: Ab Initio Simulated Interfaces
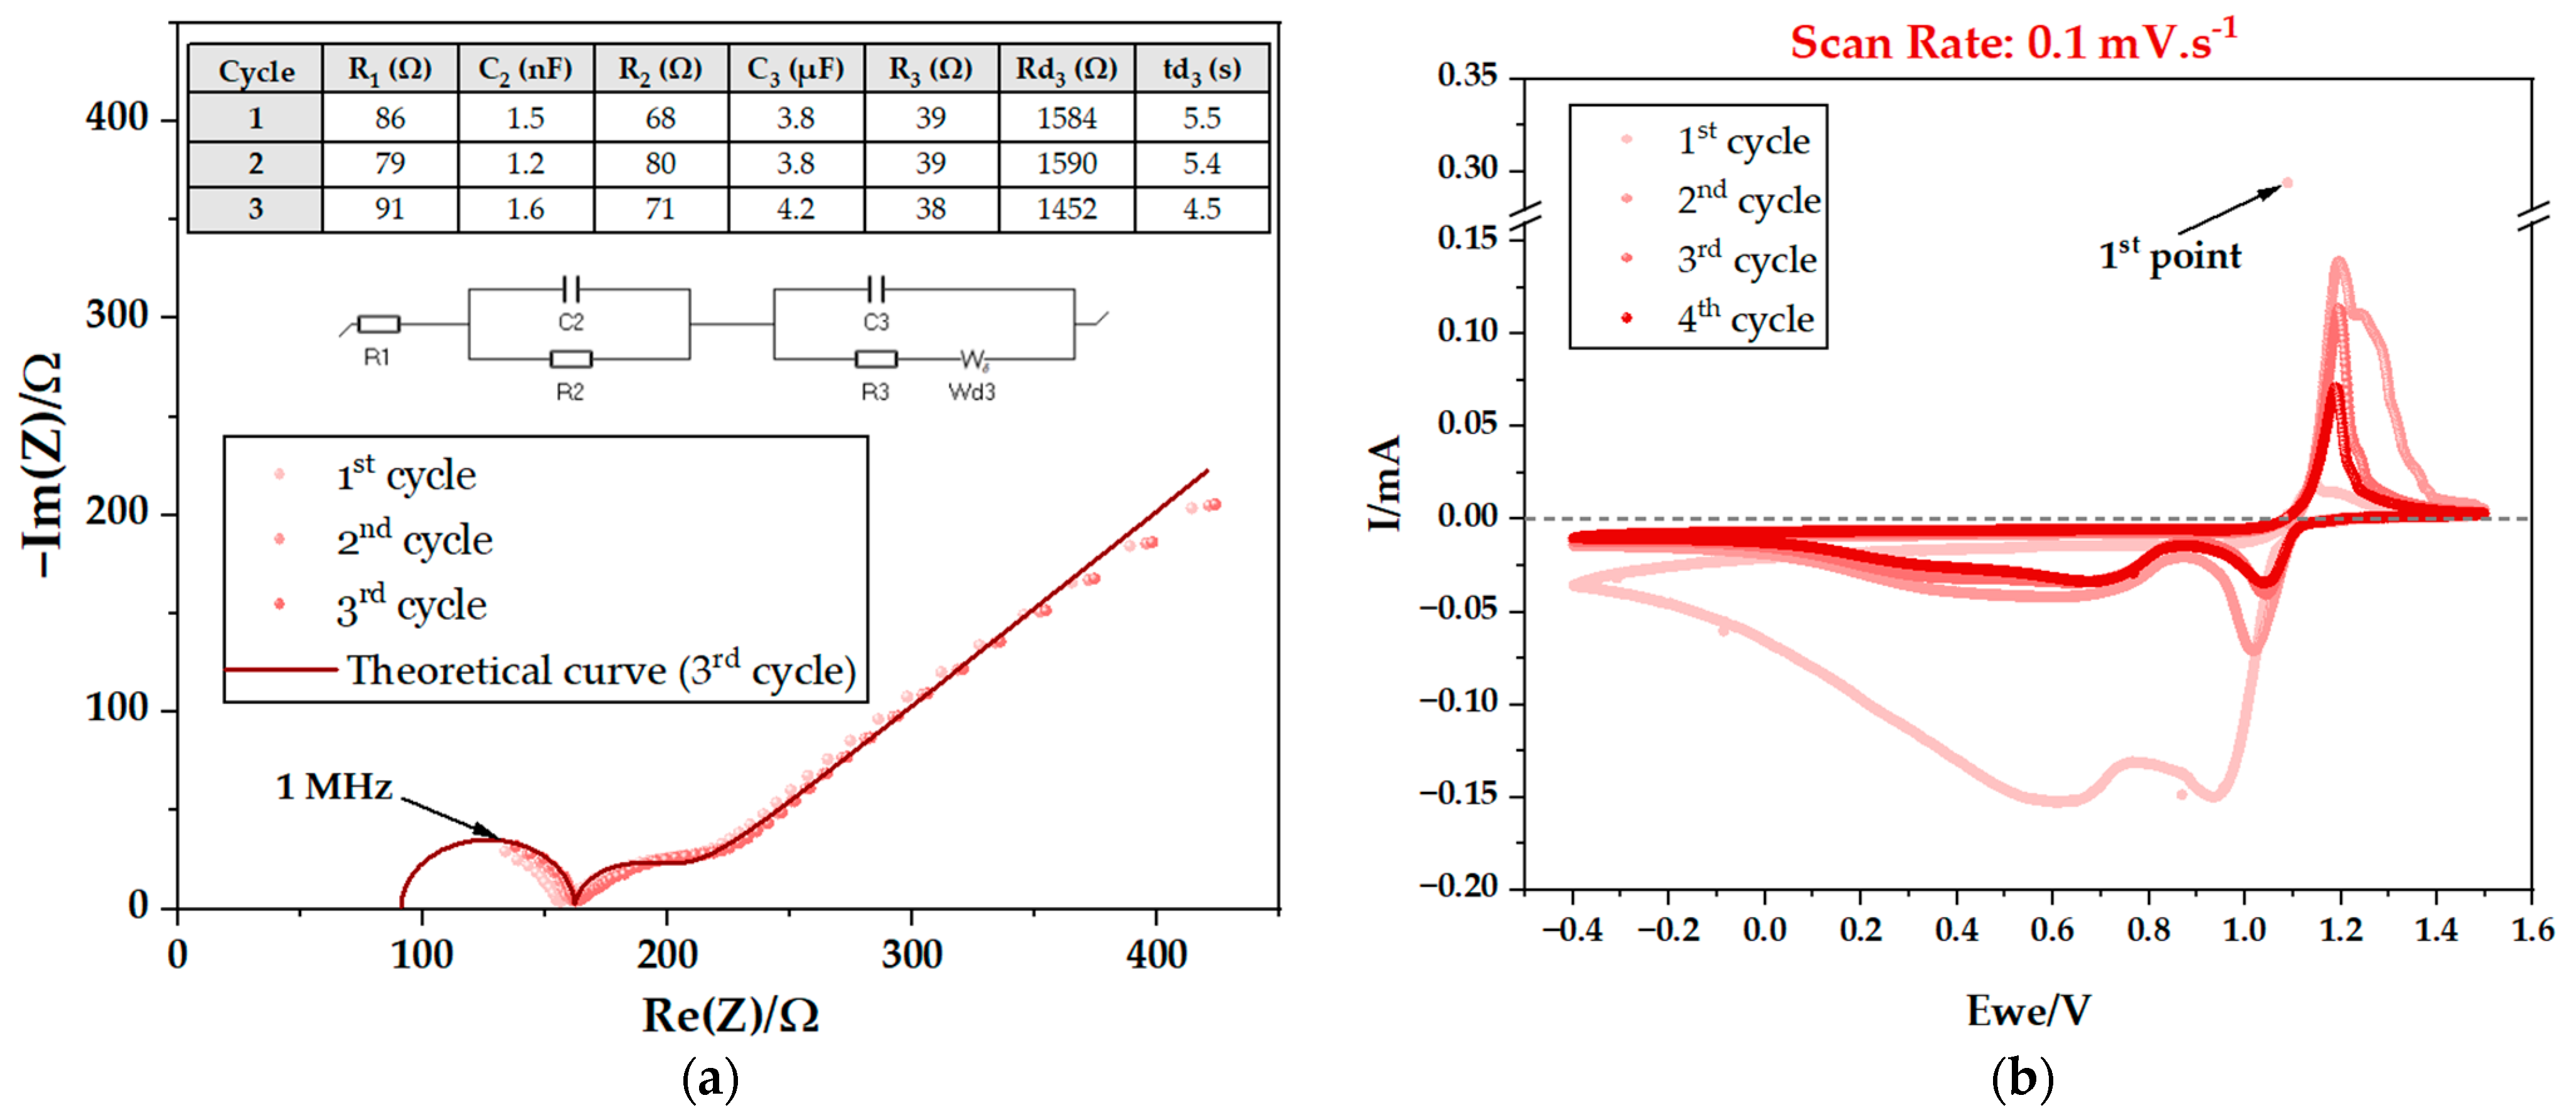
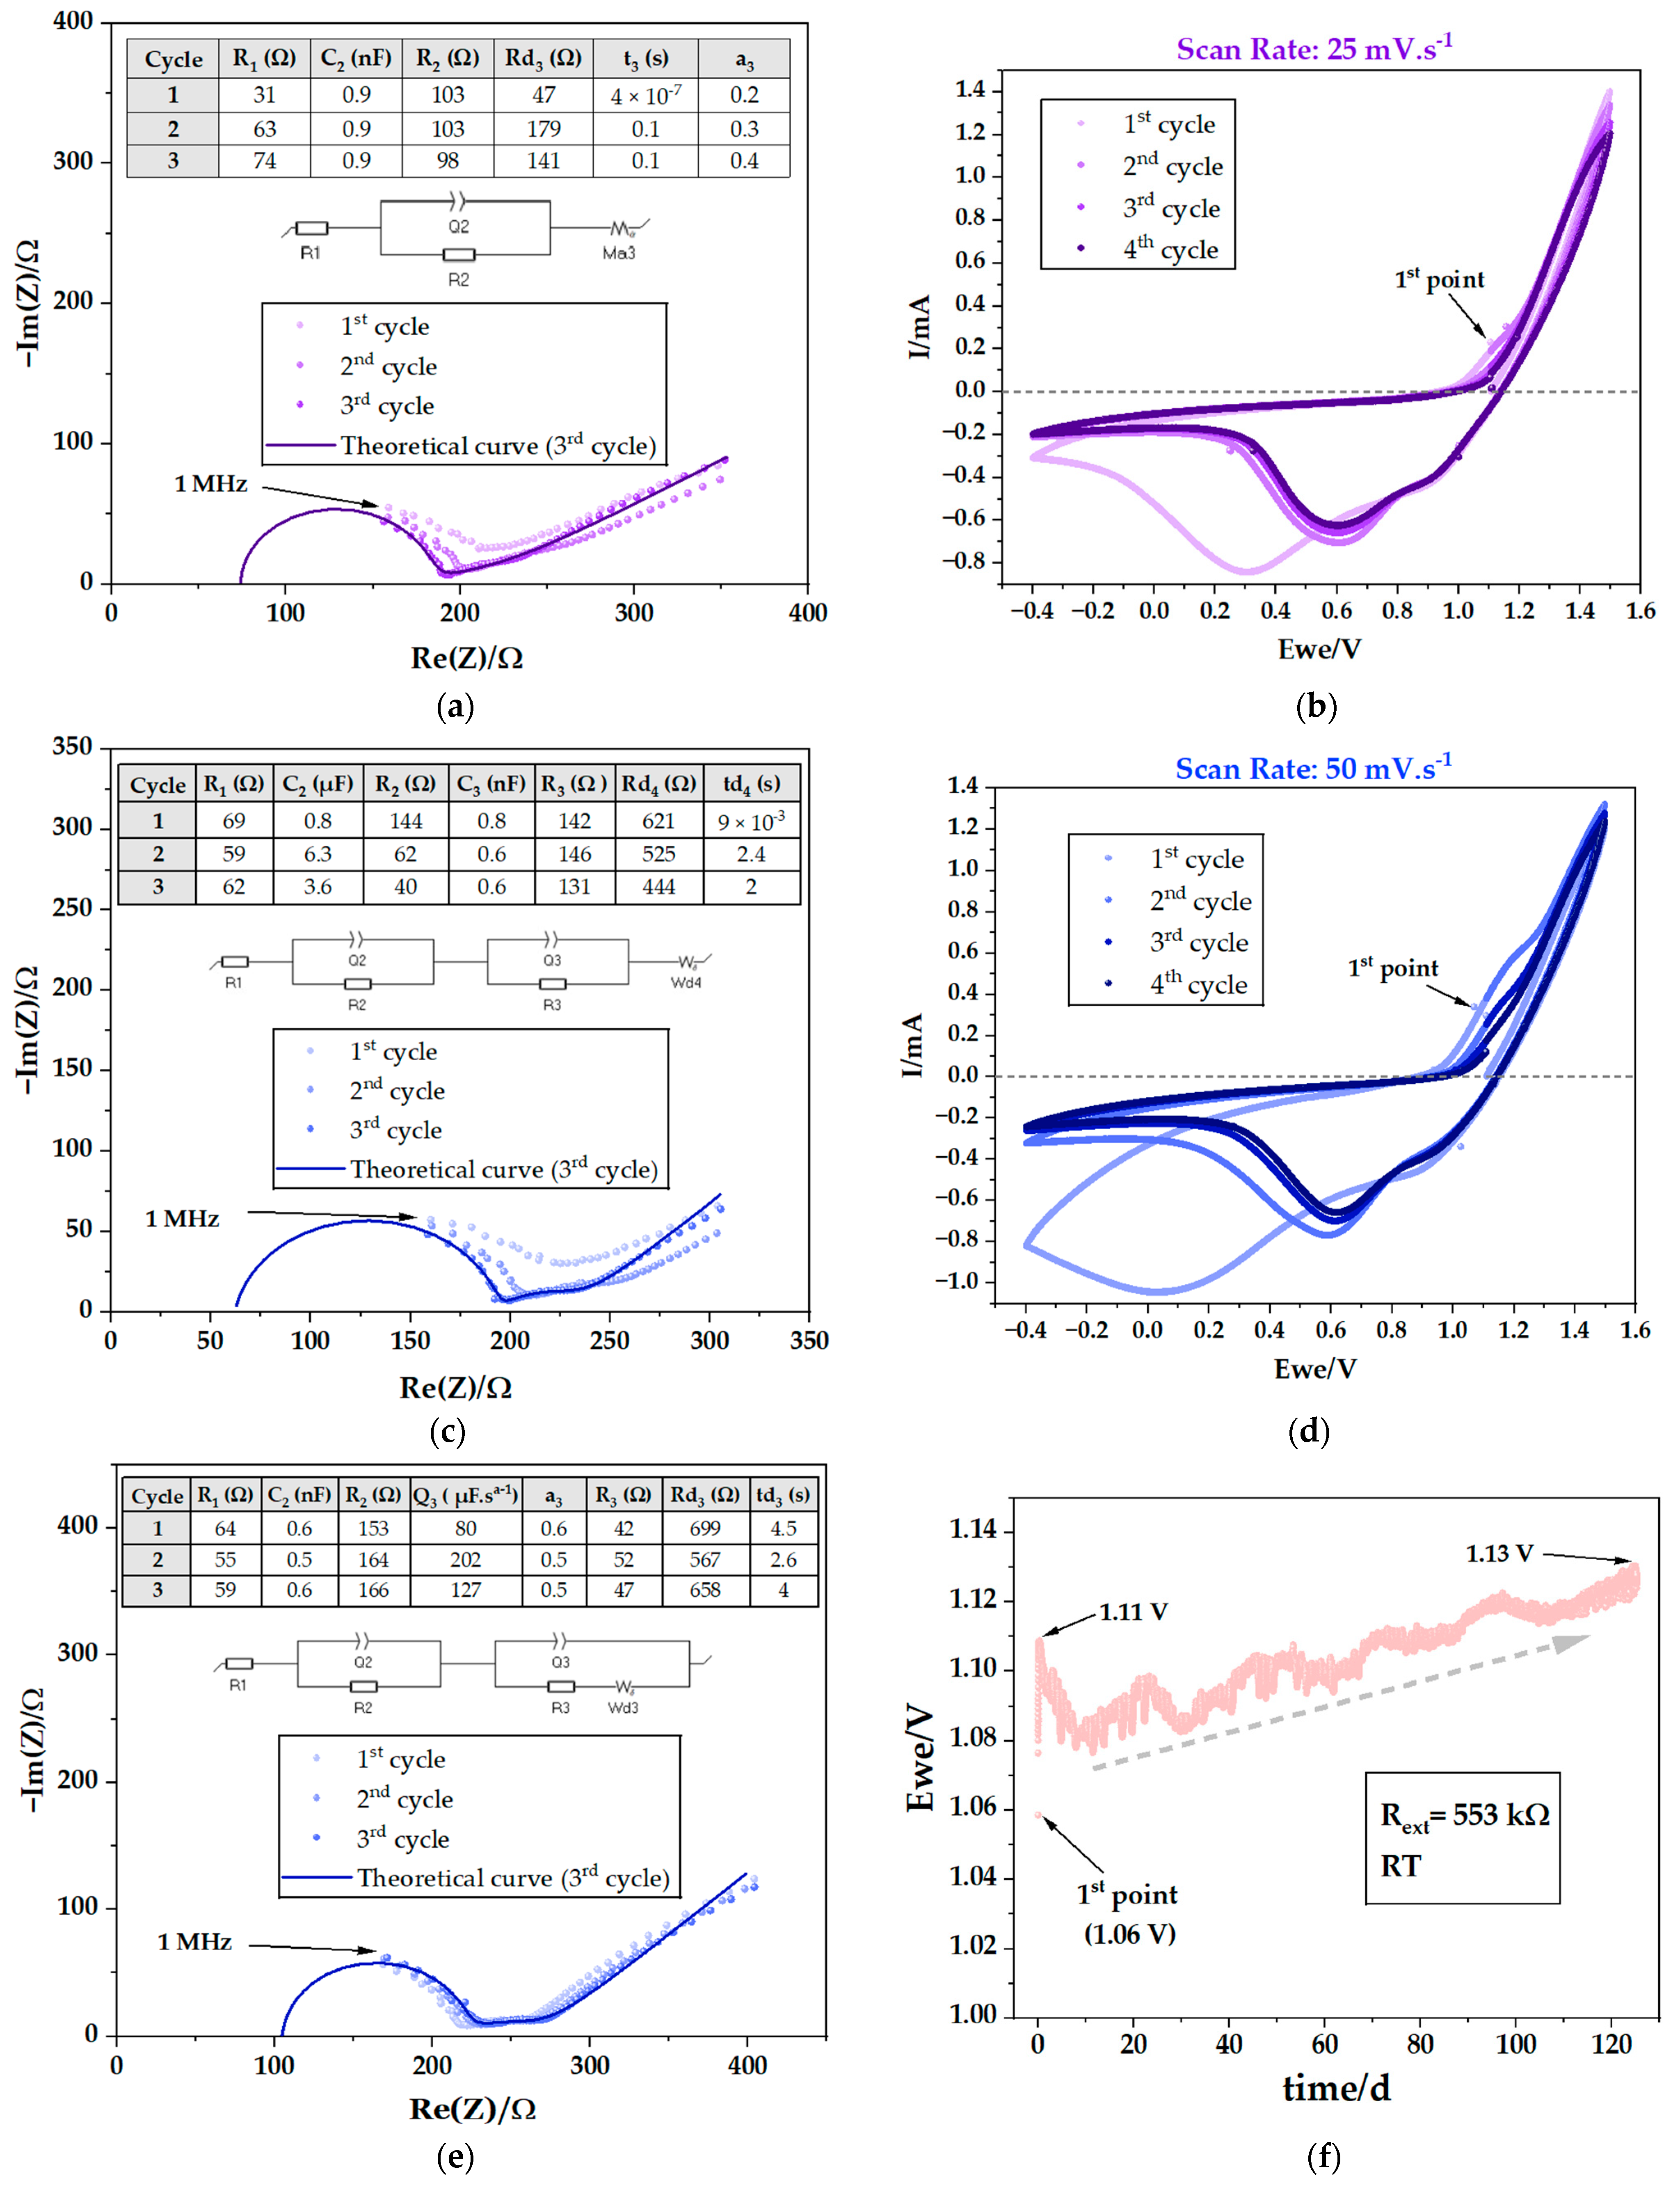
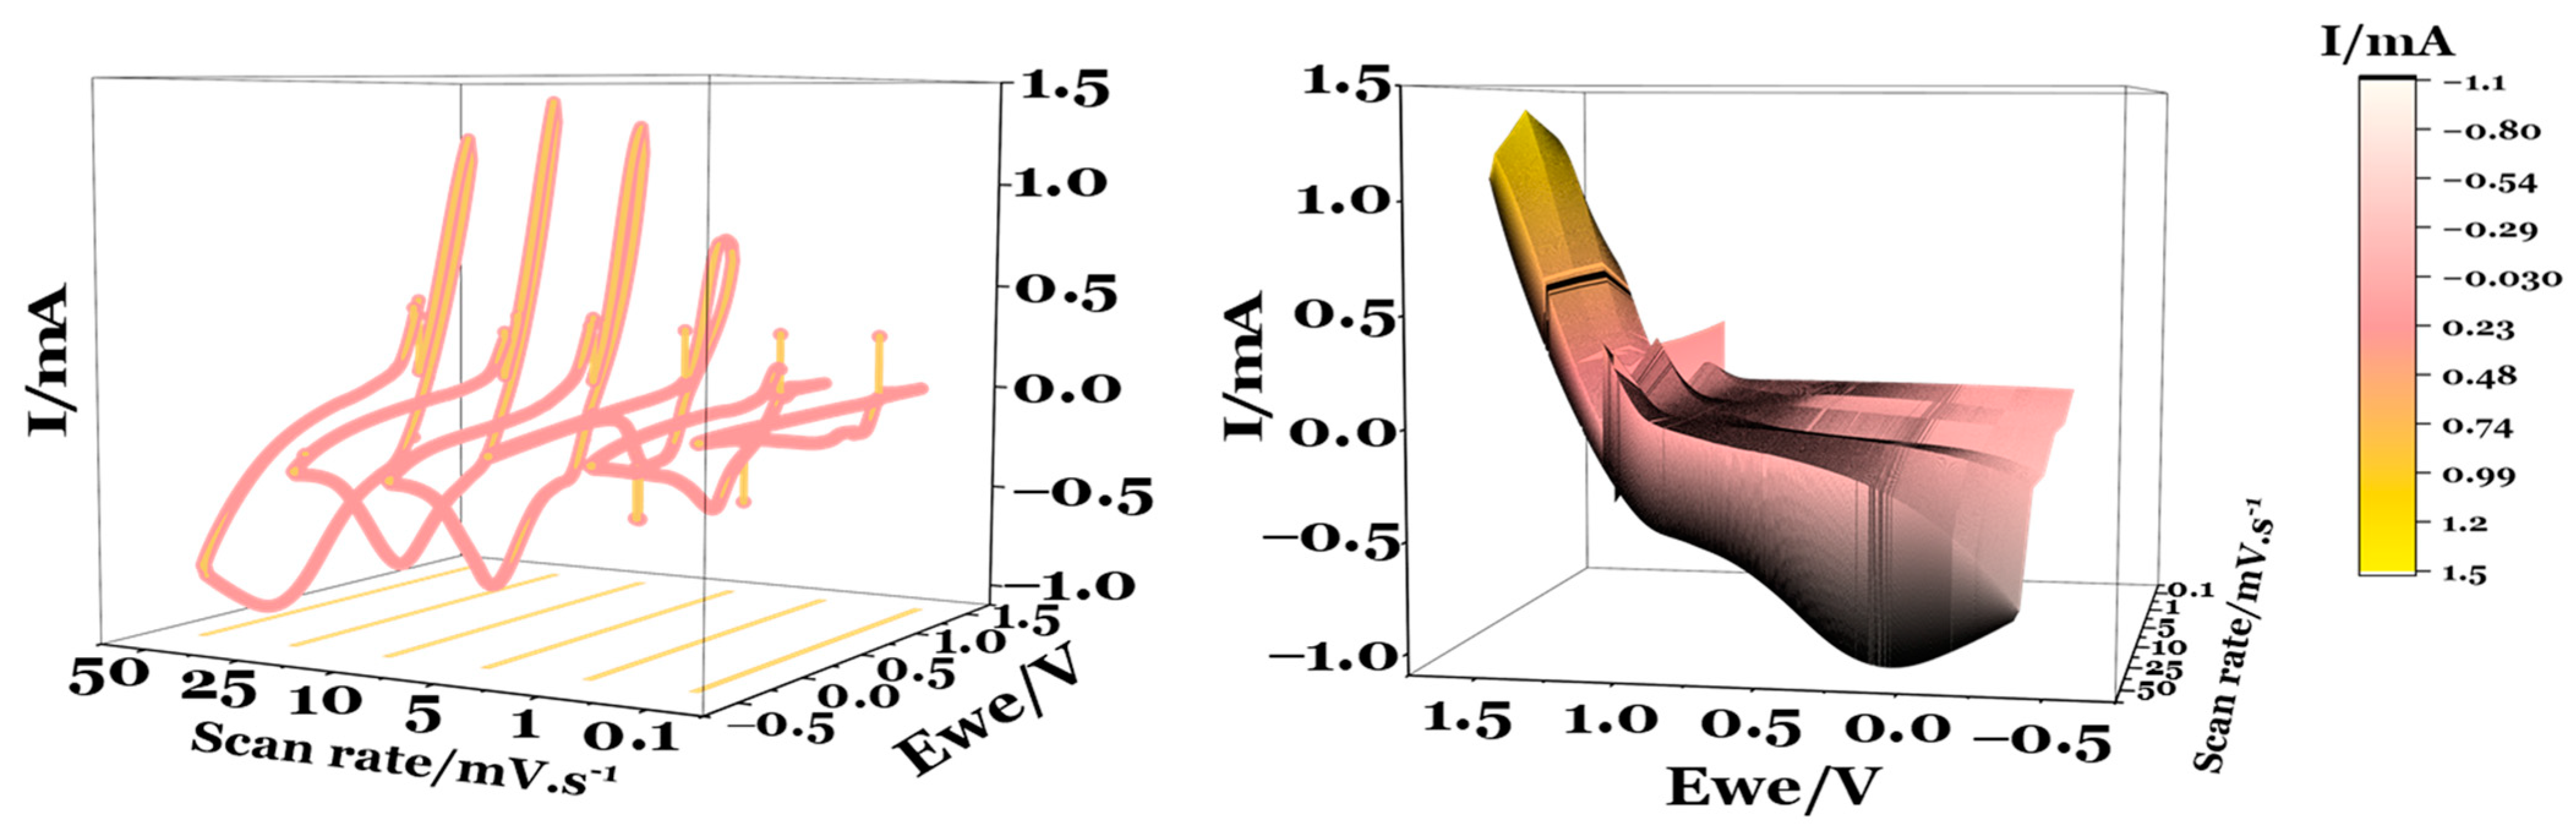
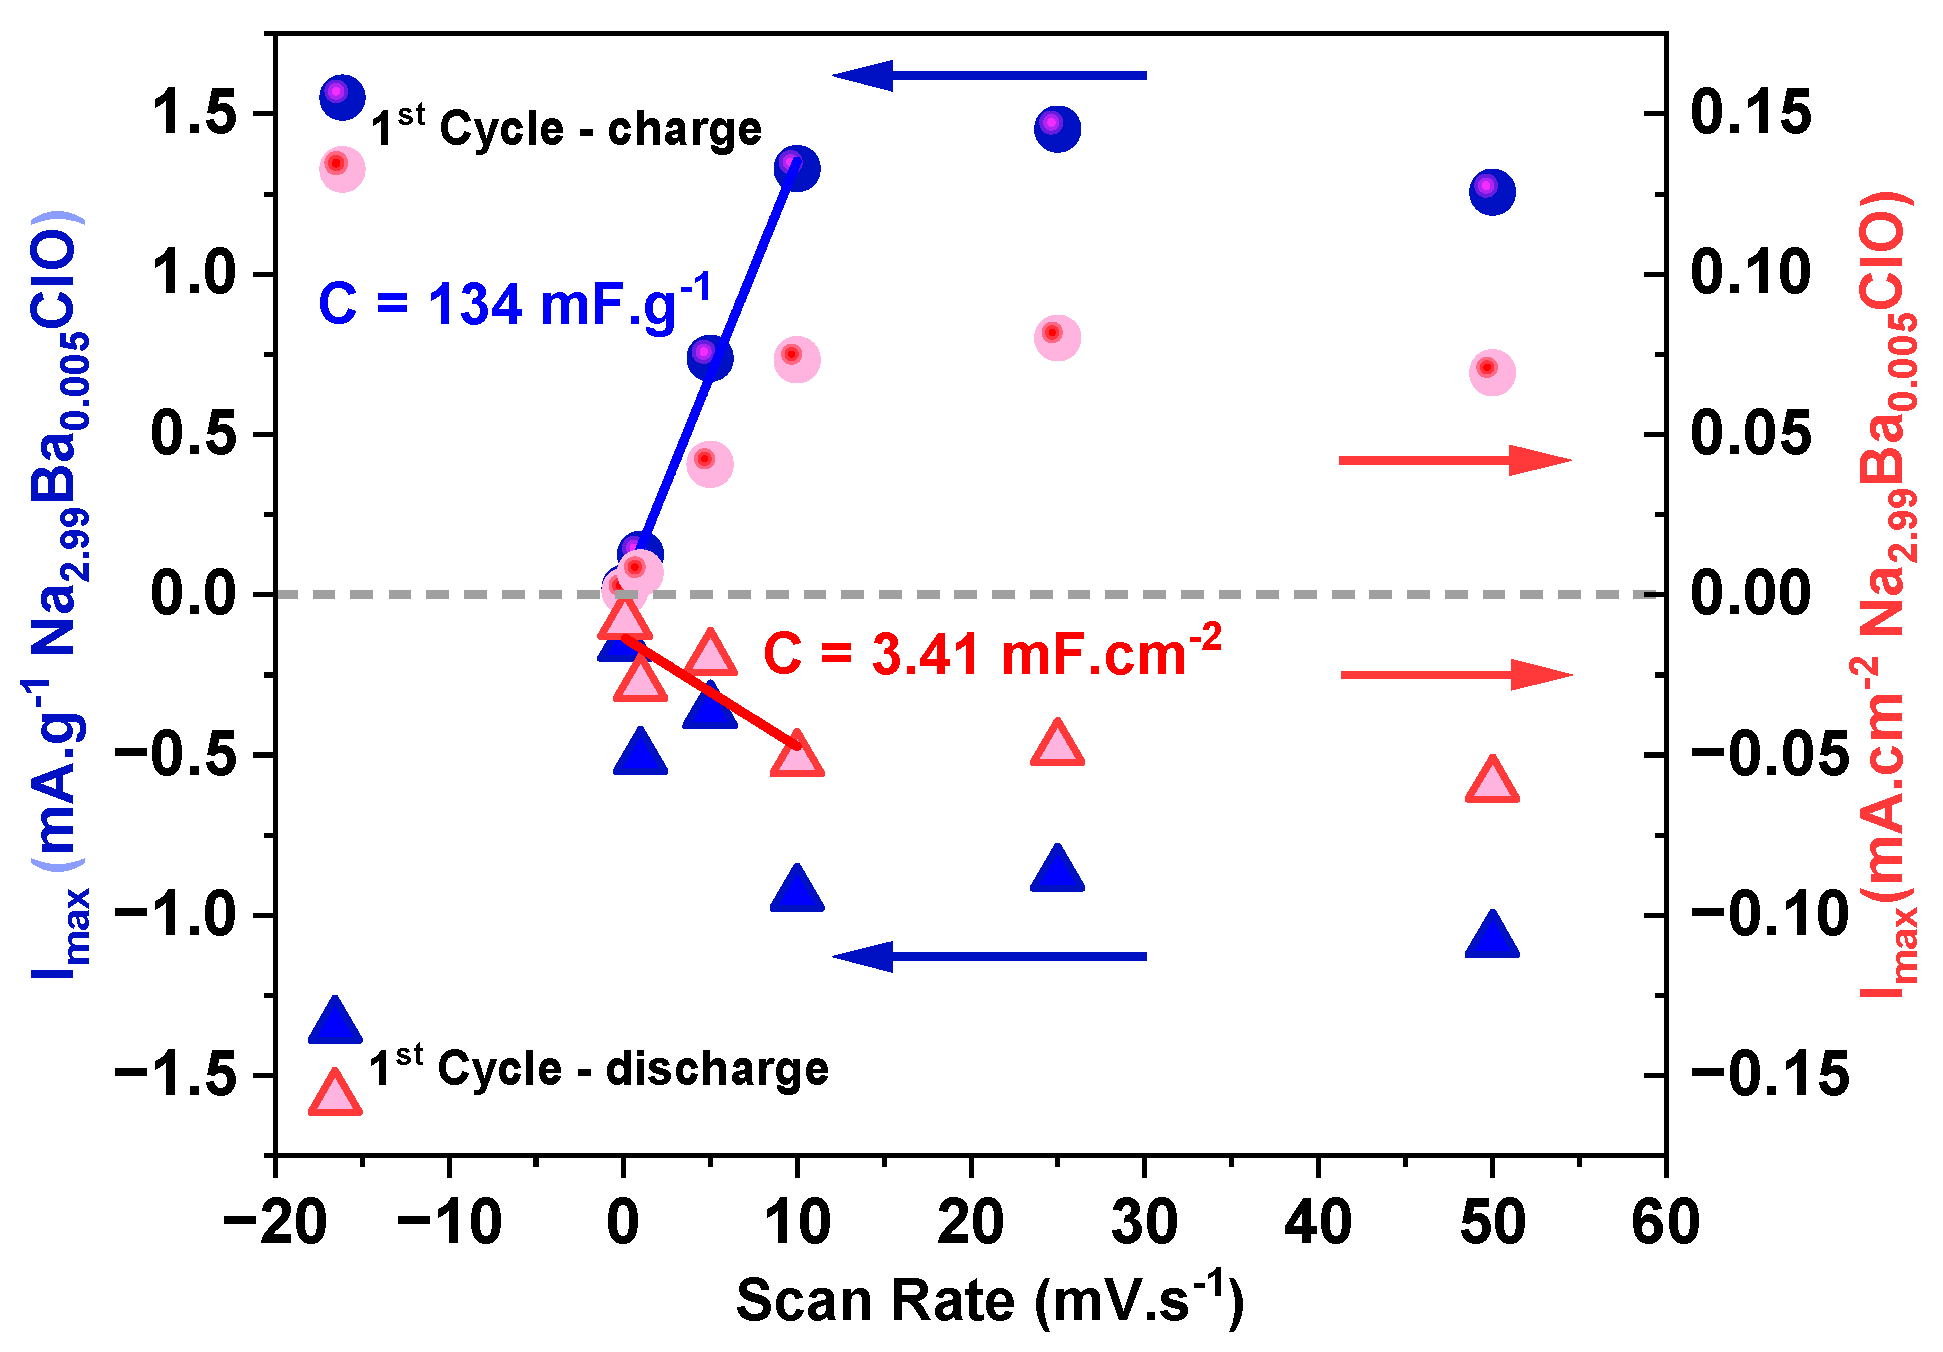
2.1.2. Electrochemical Cycling
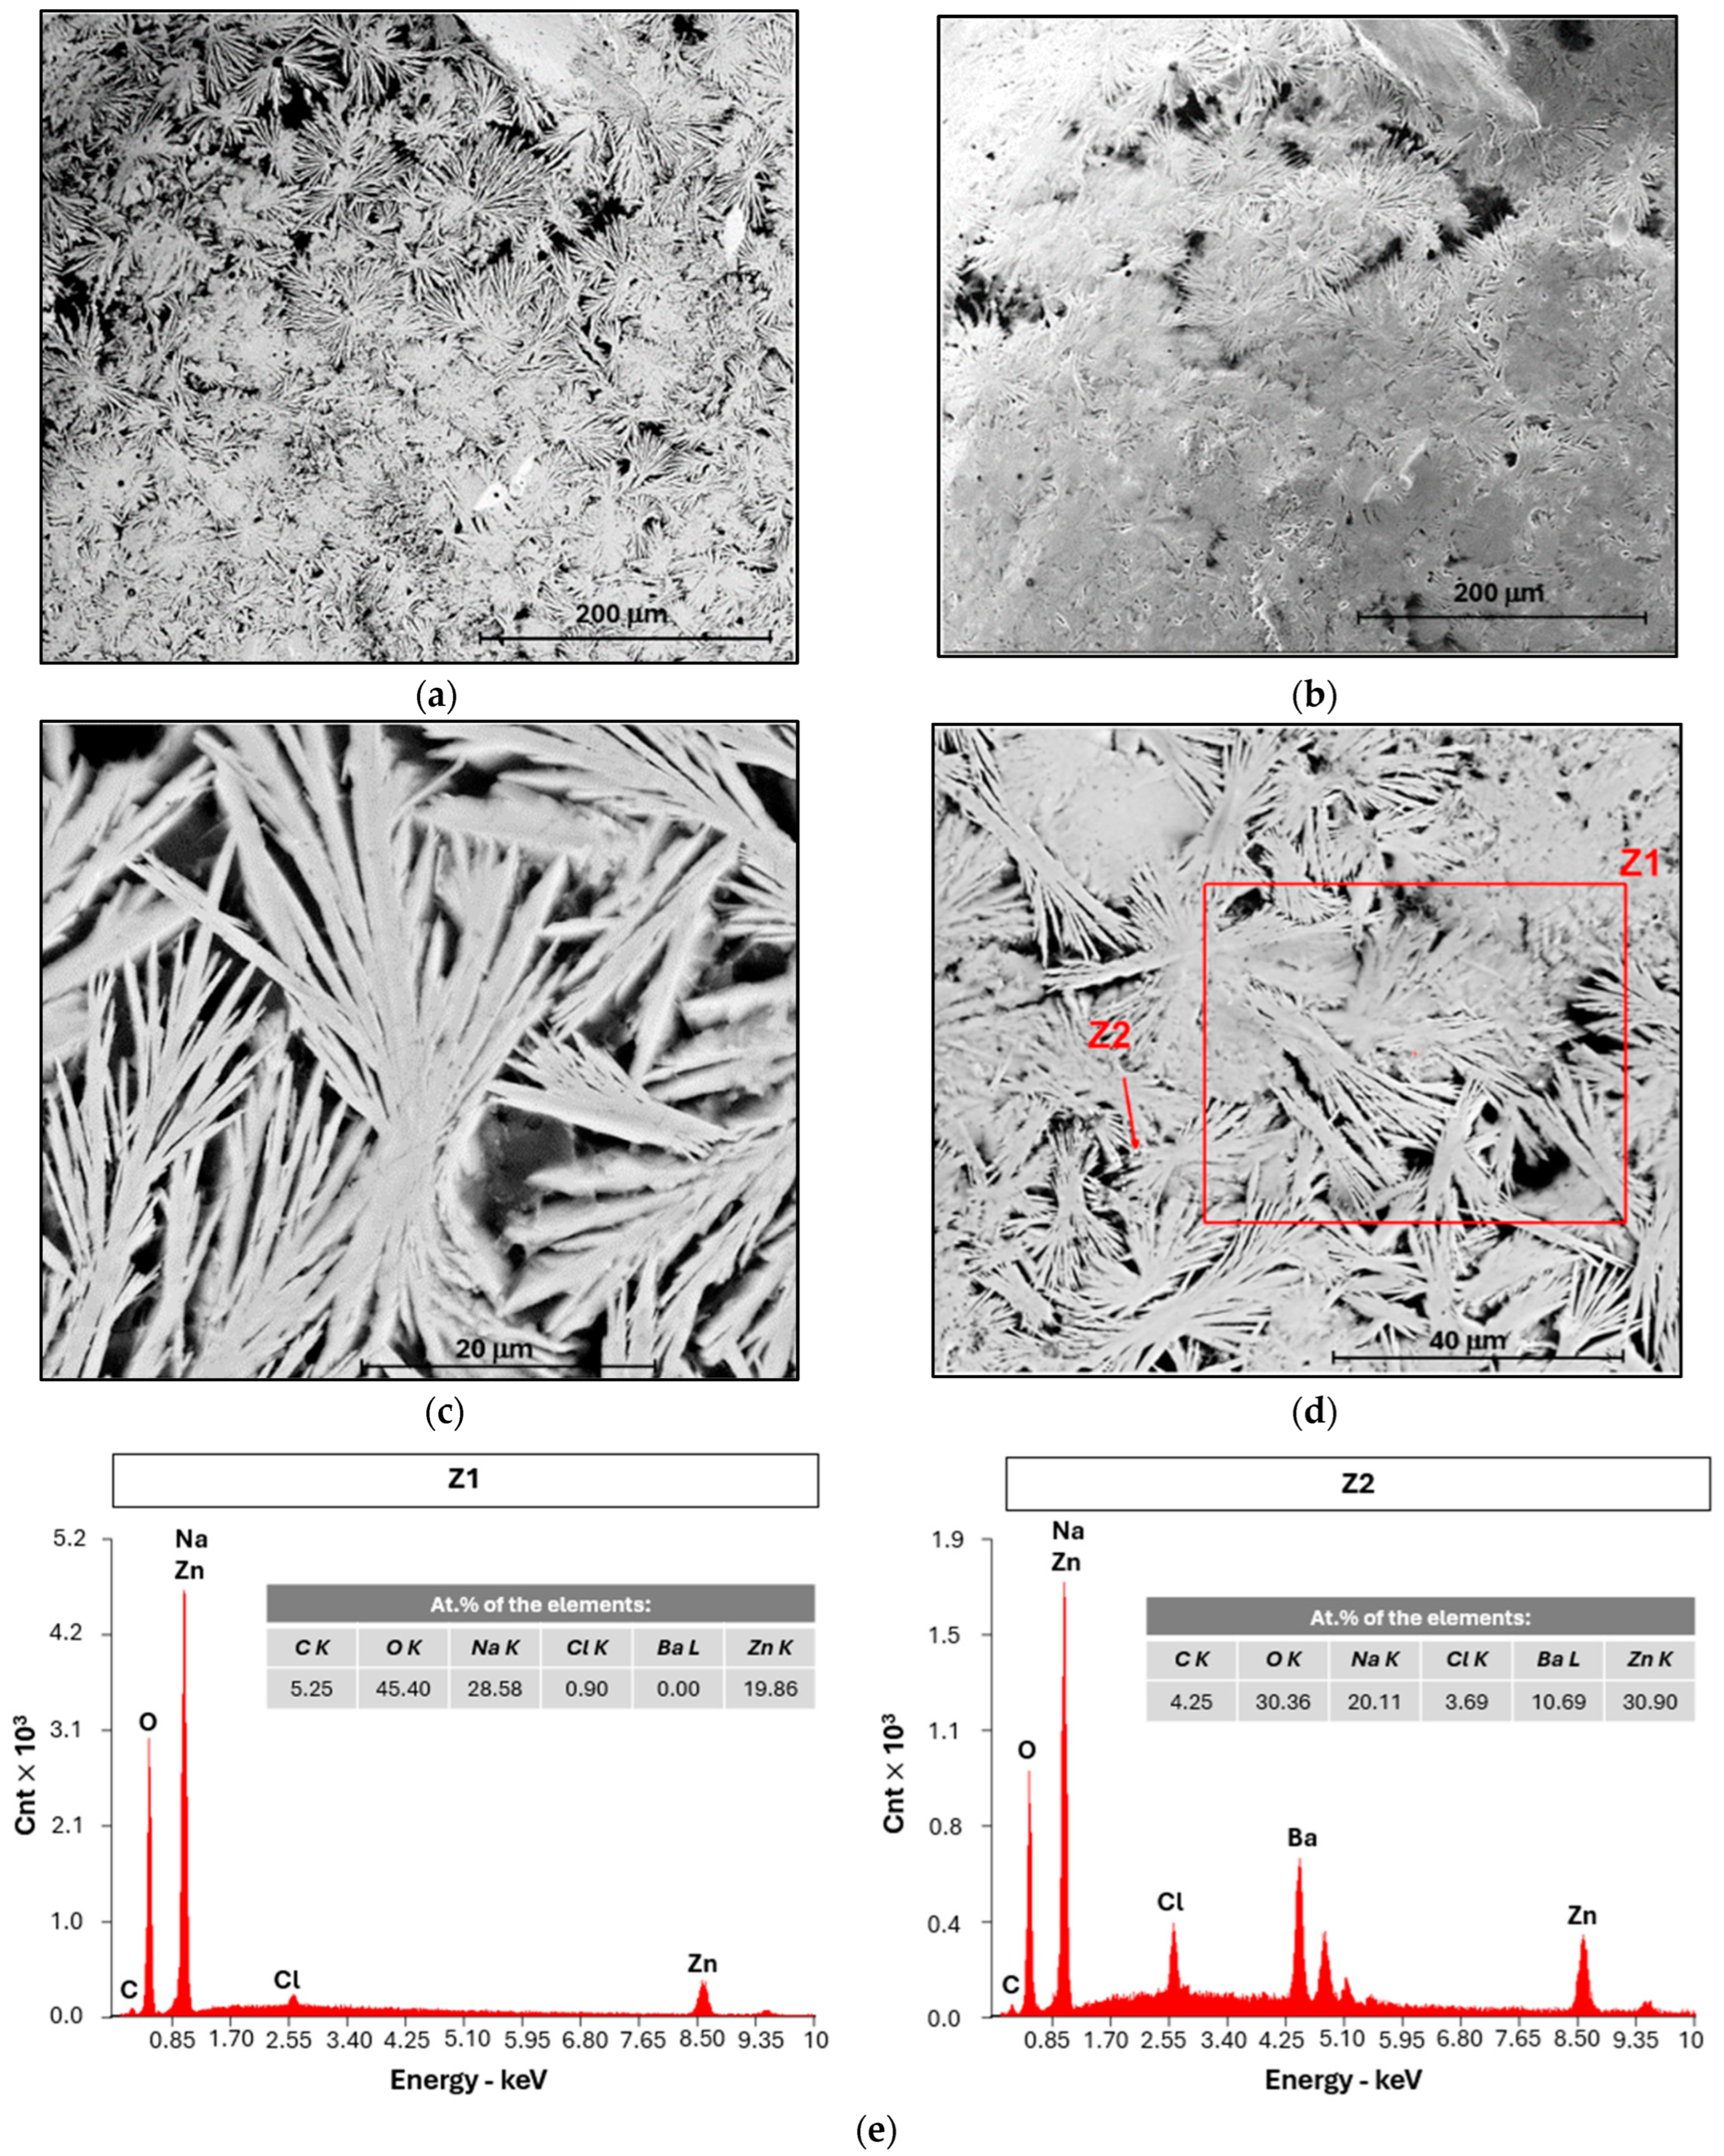
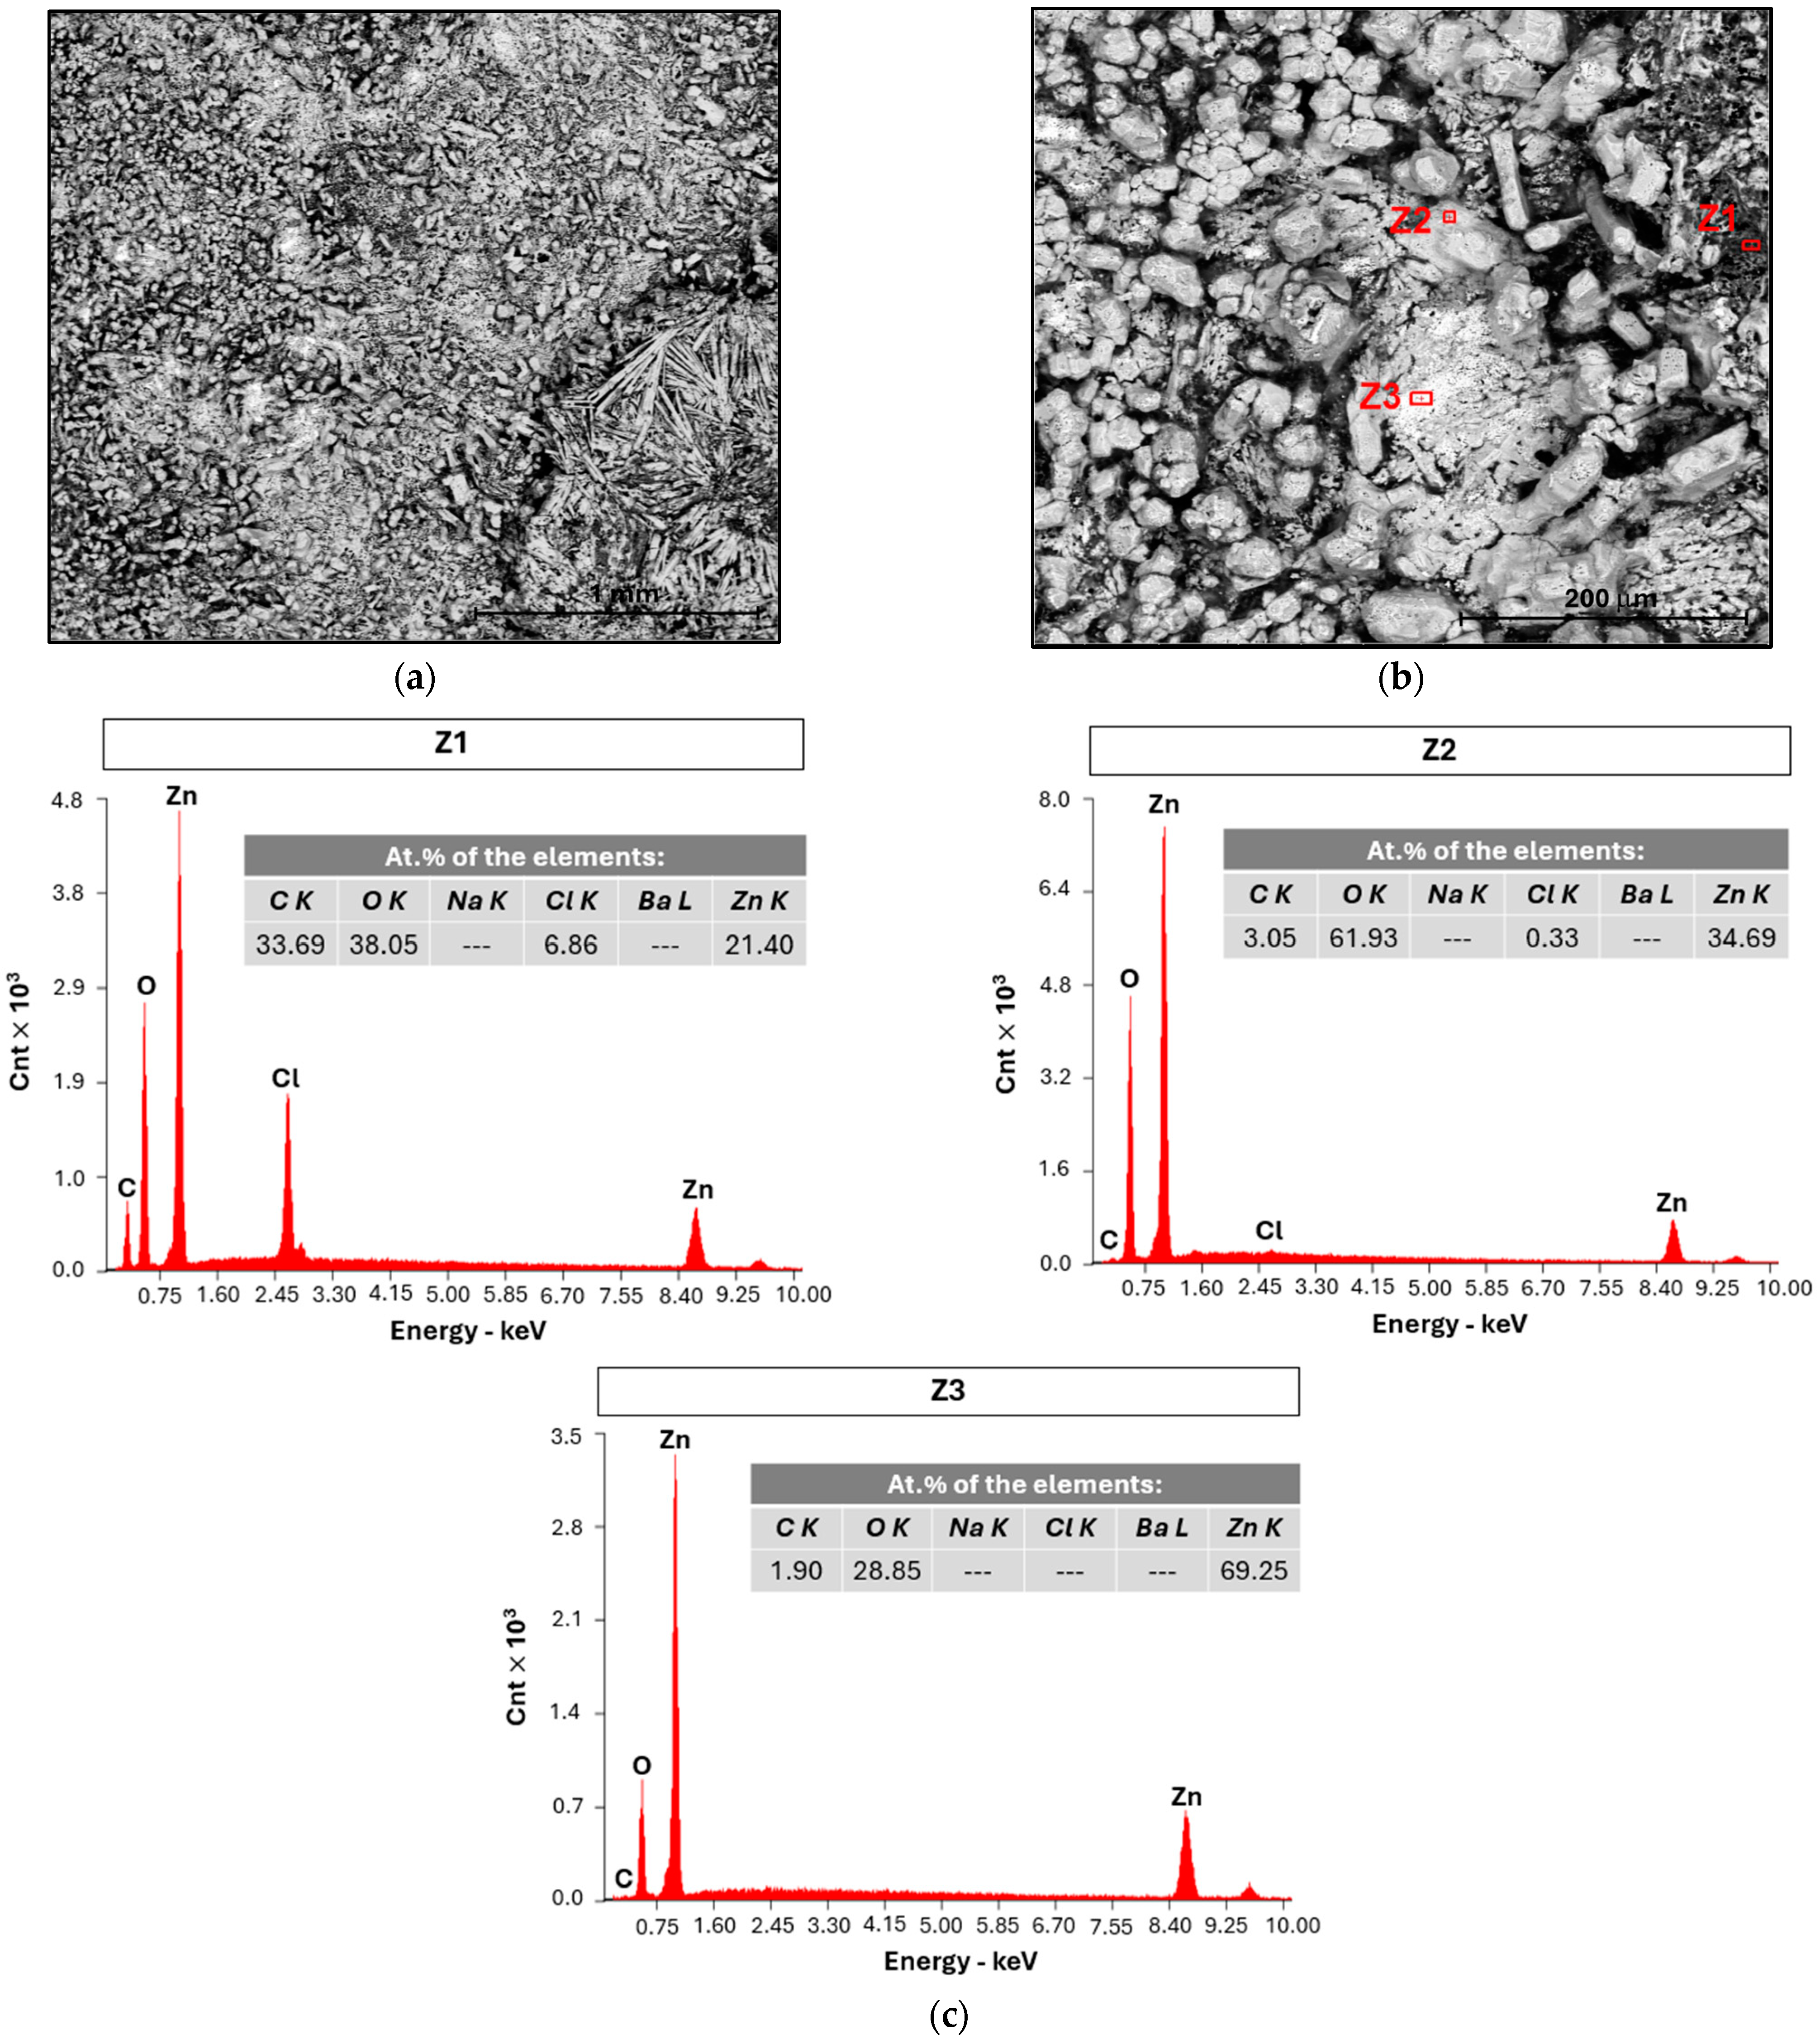
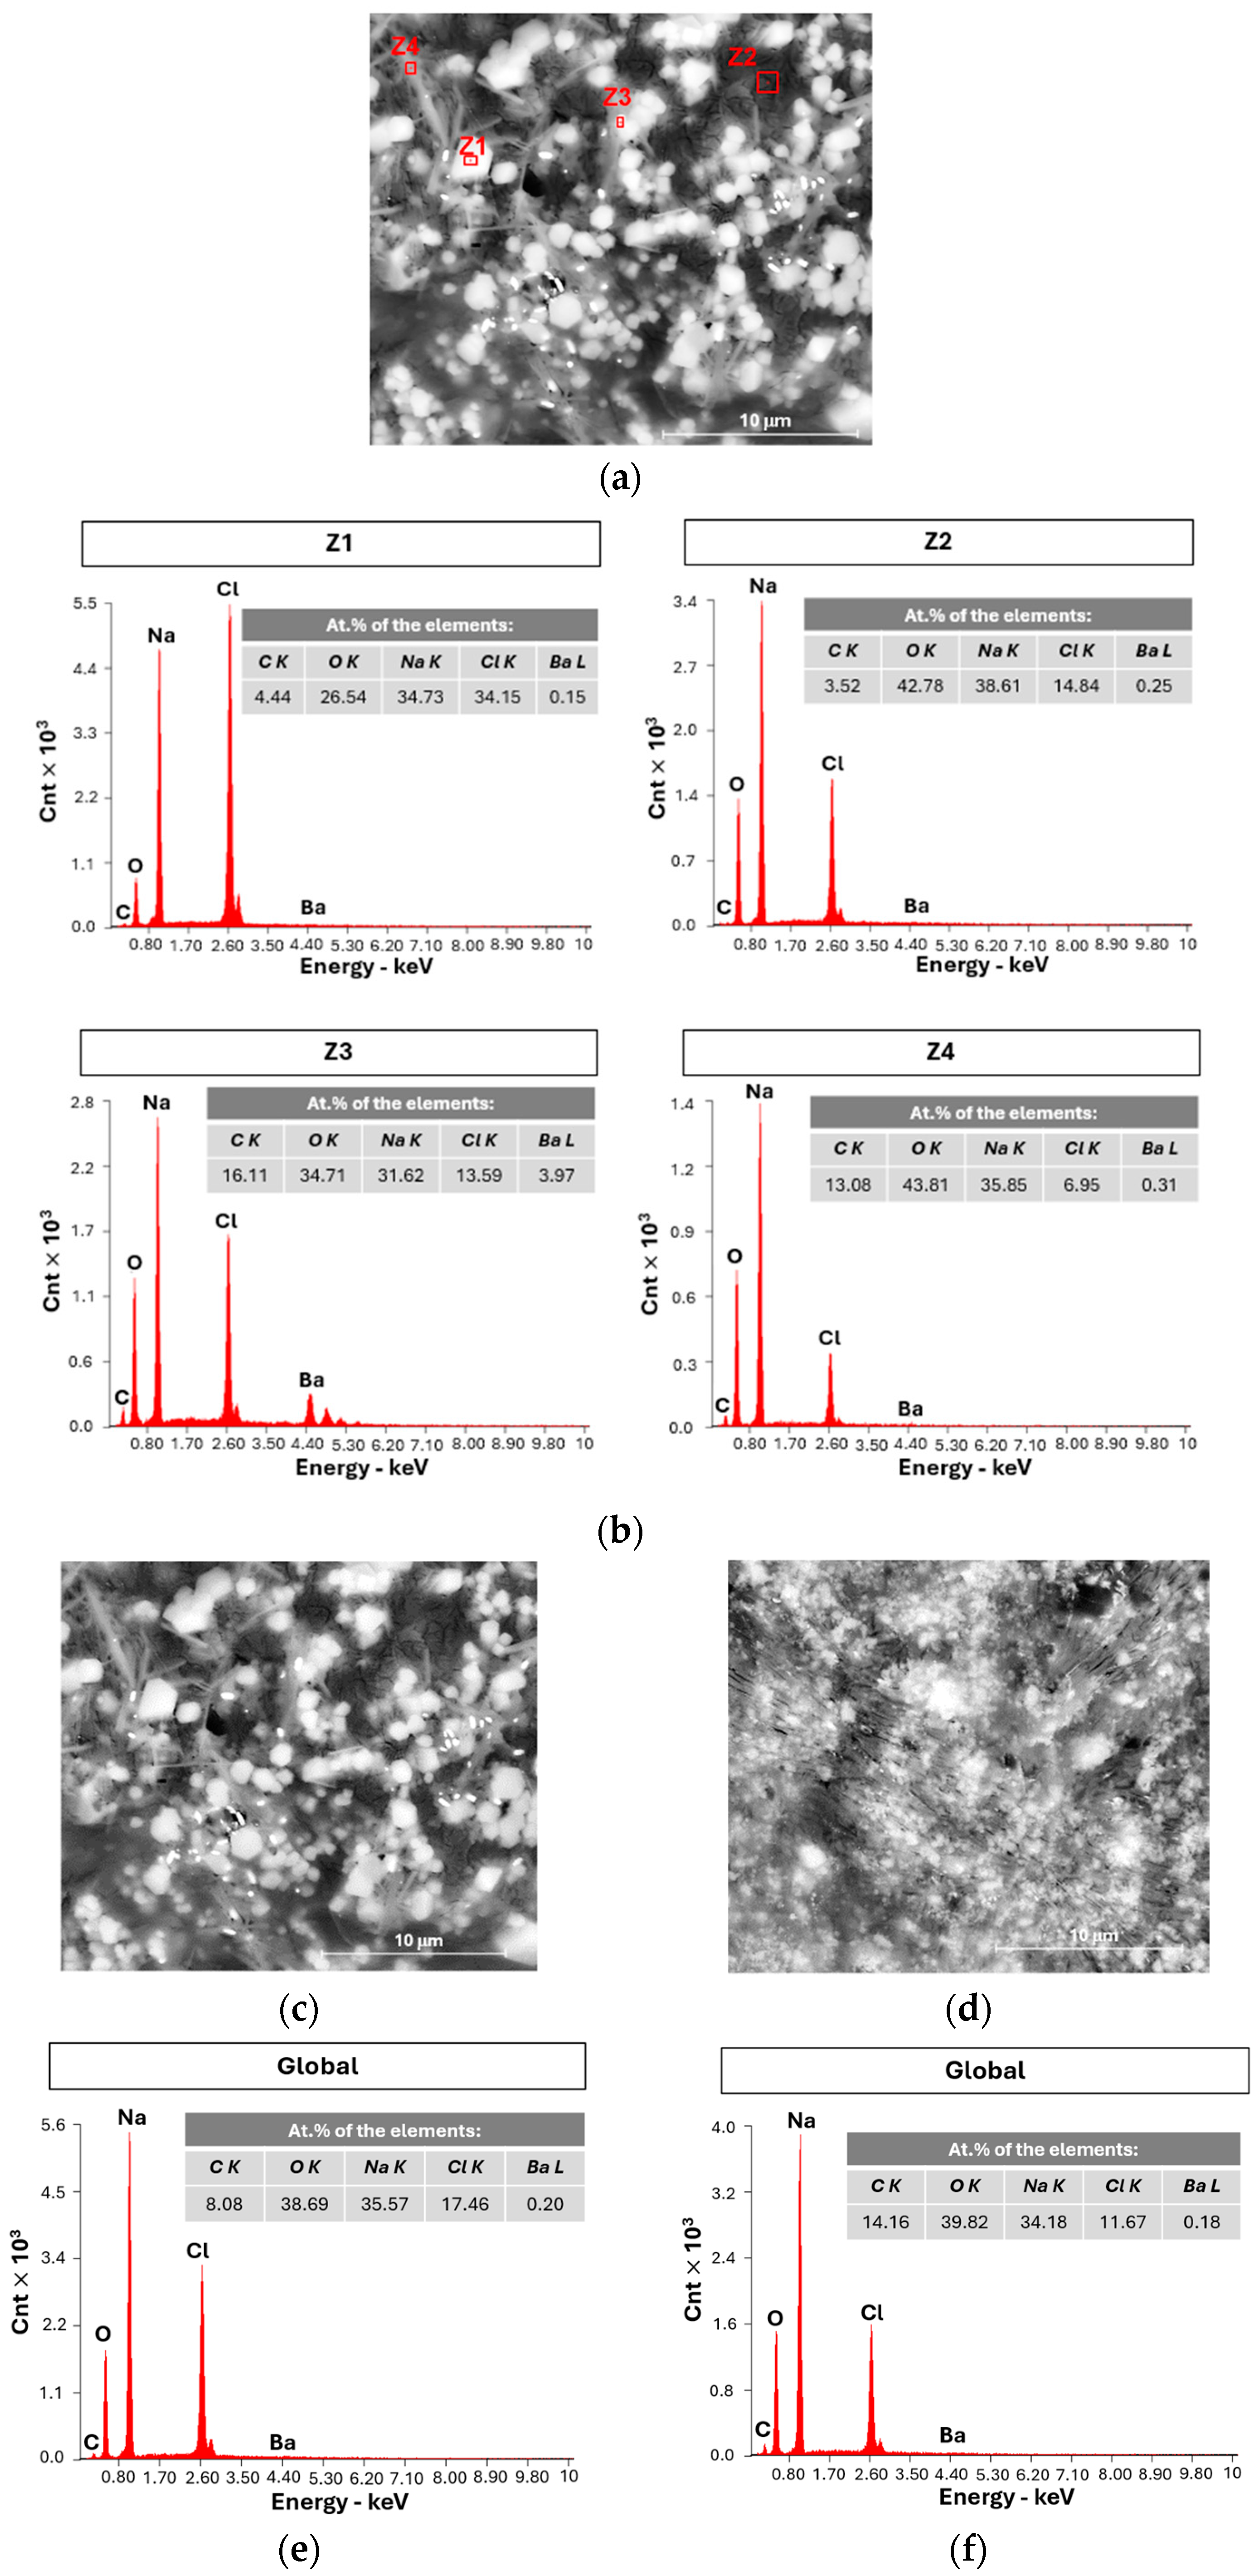
2.1.3. SEM and EDX Analysis
2.2. Performance of Cu/Carbon Felt/Na2.99Ba0.005ClO Composite in Cellulose/Zn Pouch Cell
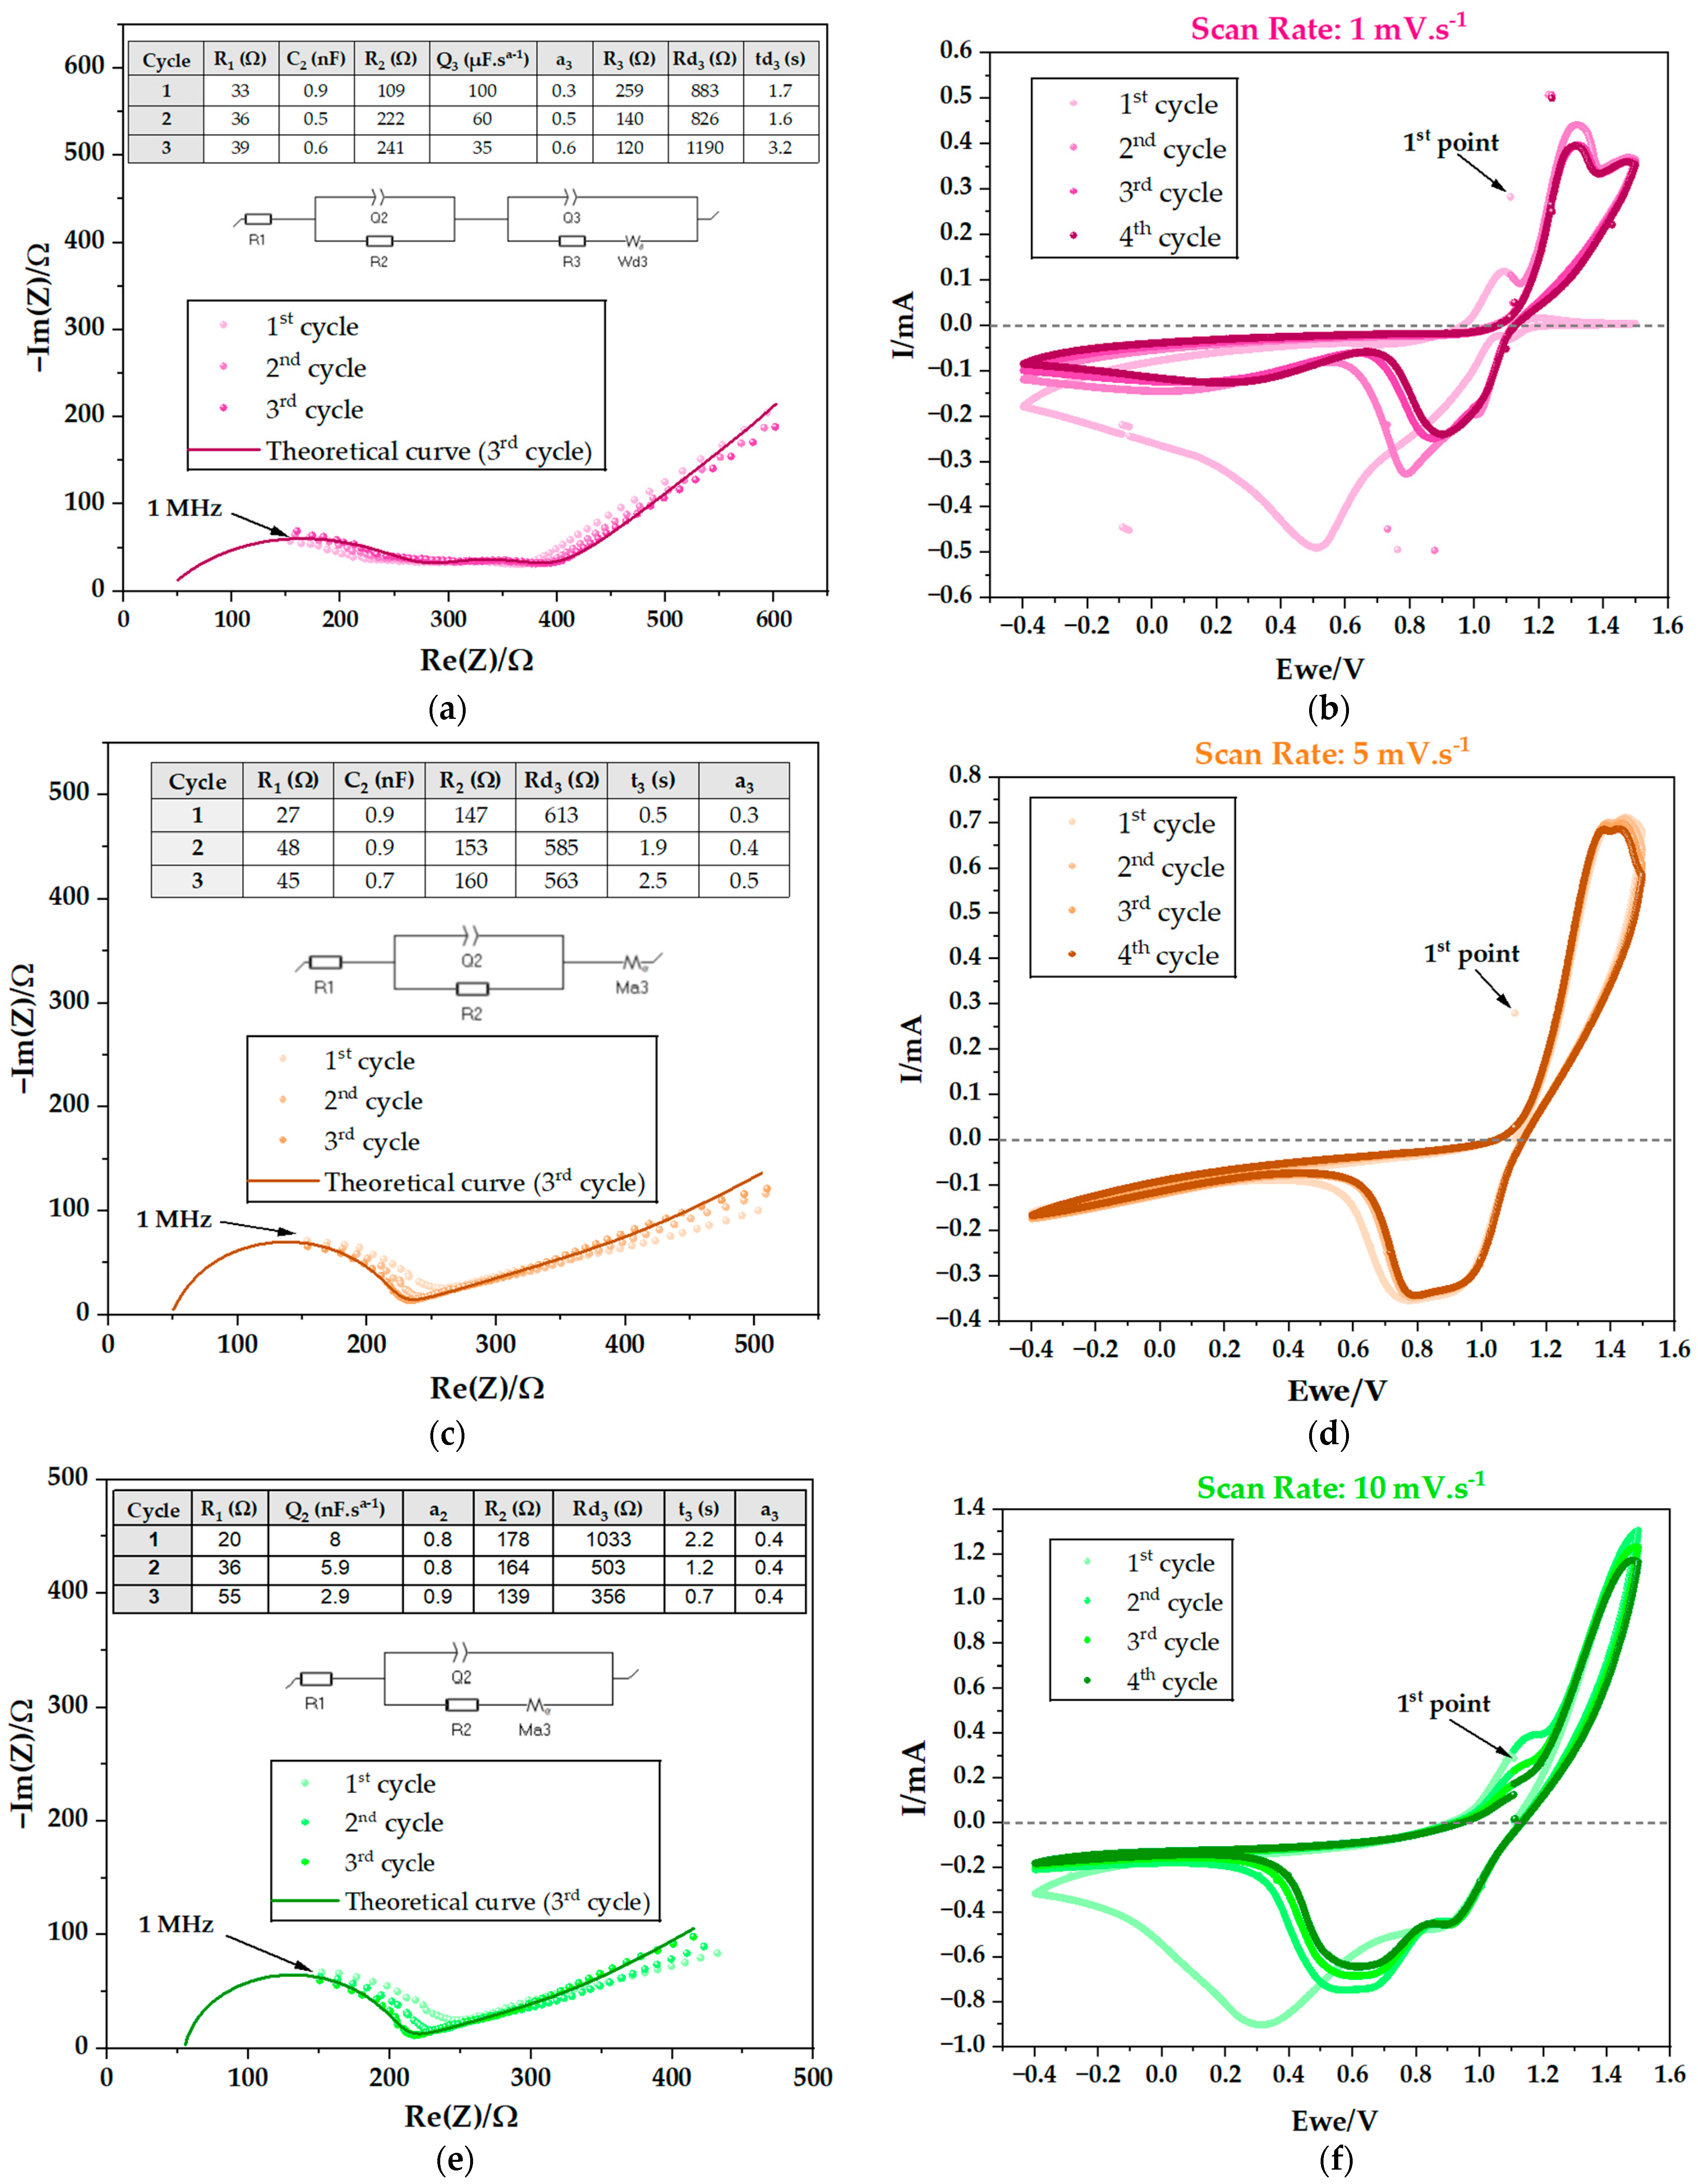
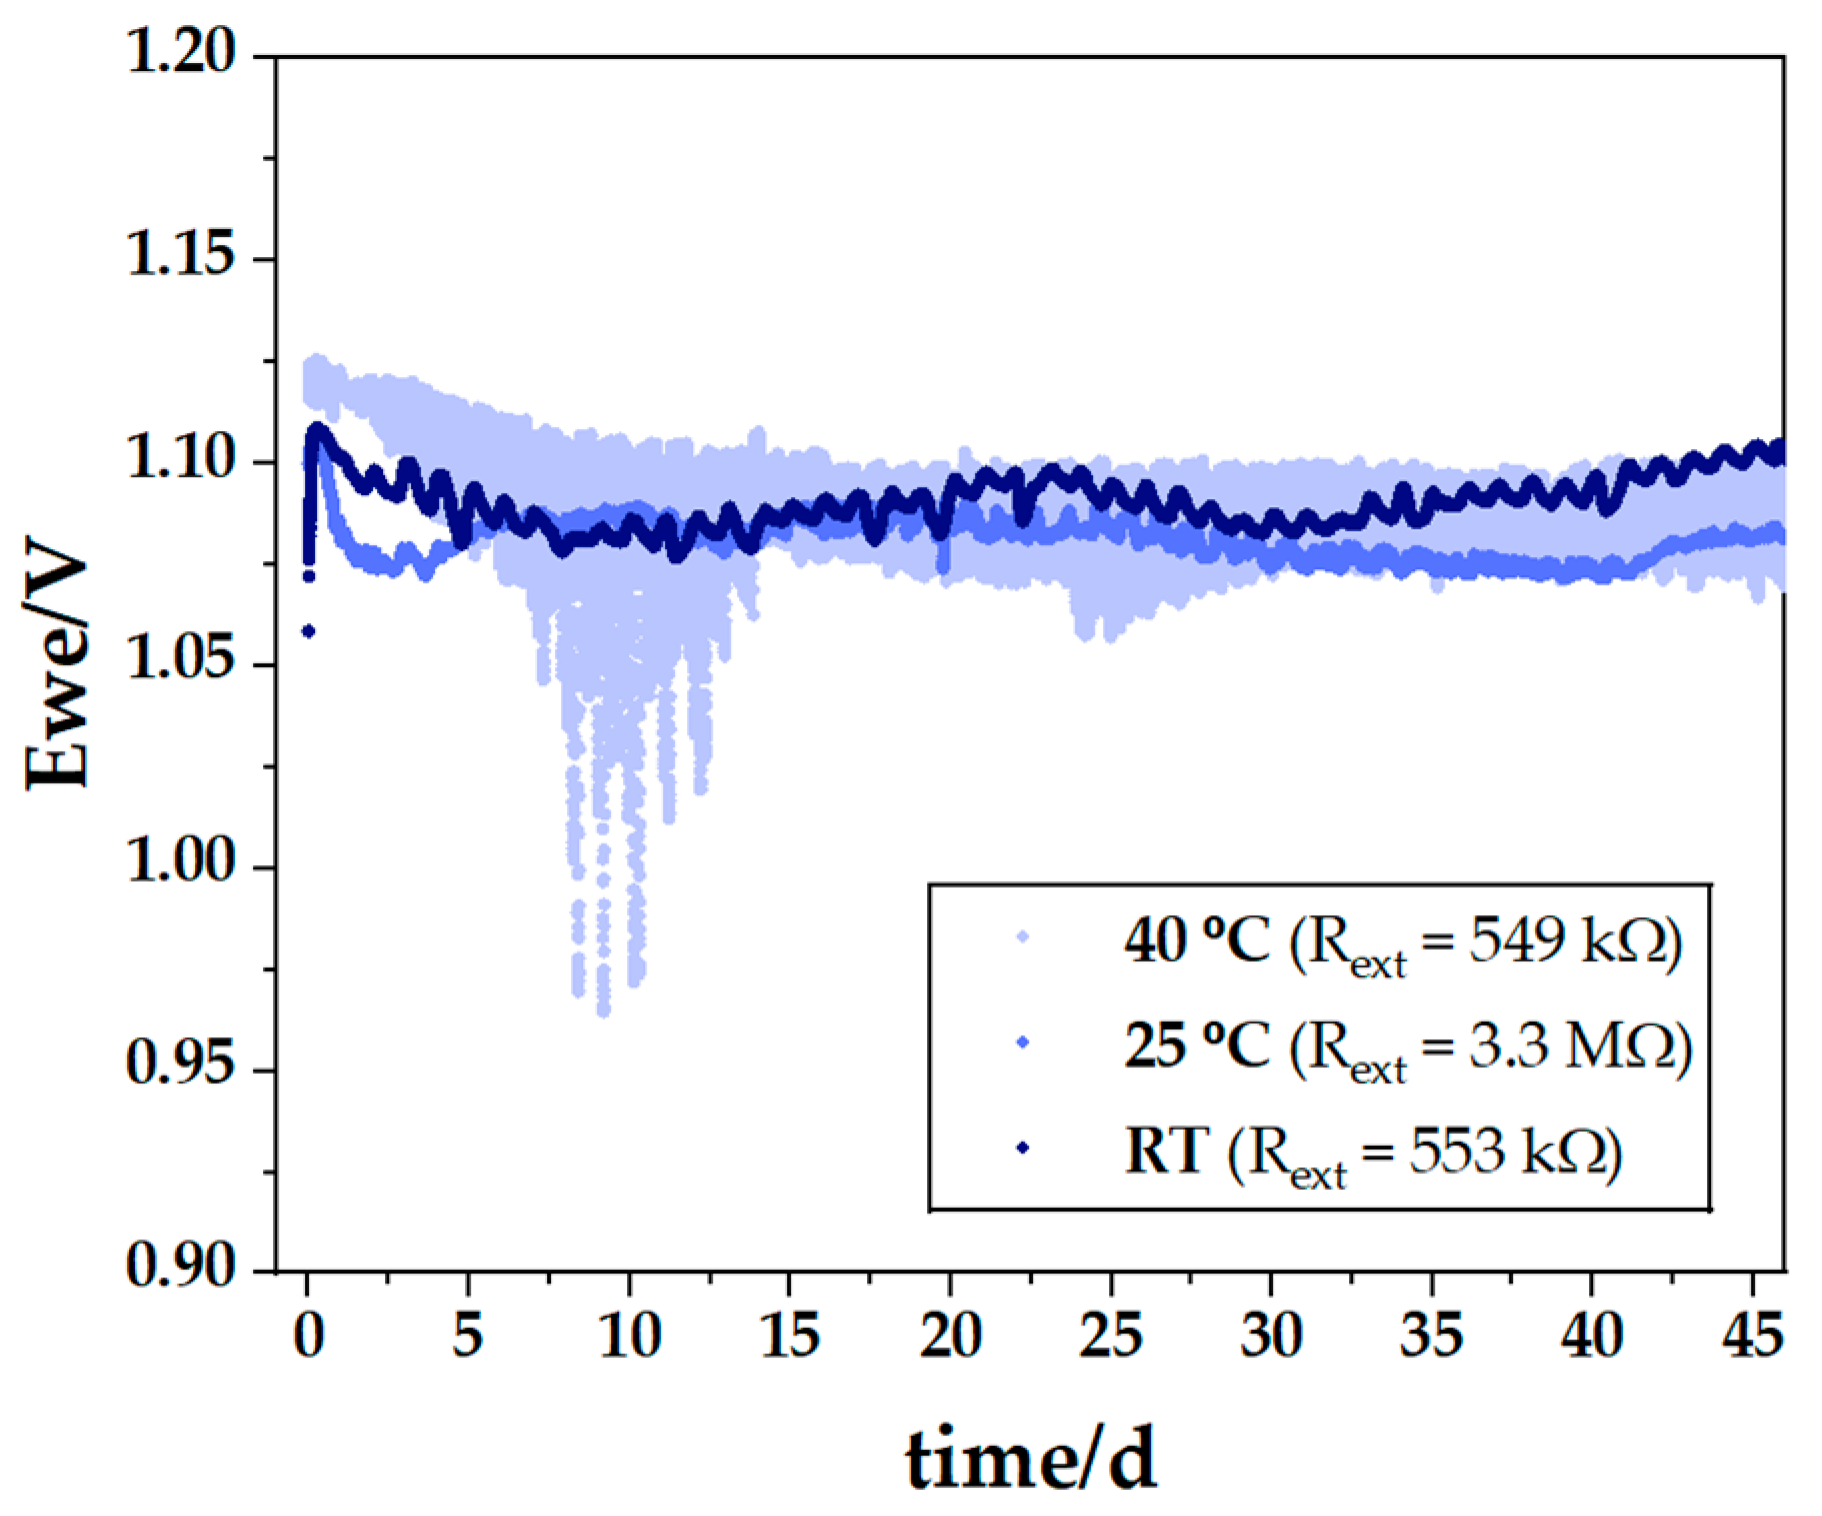
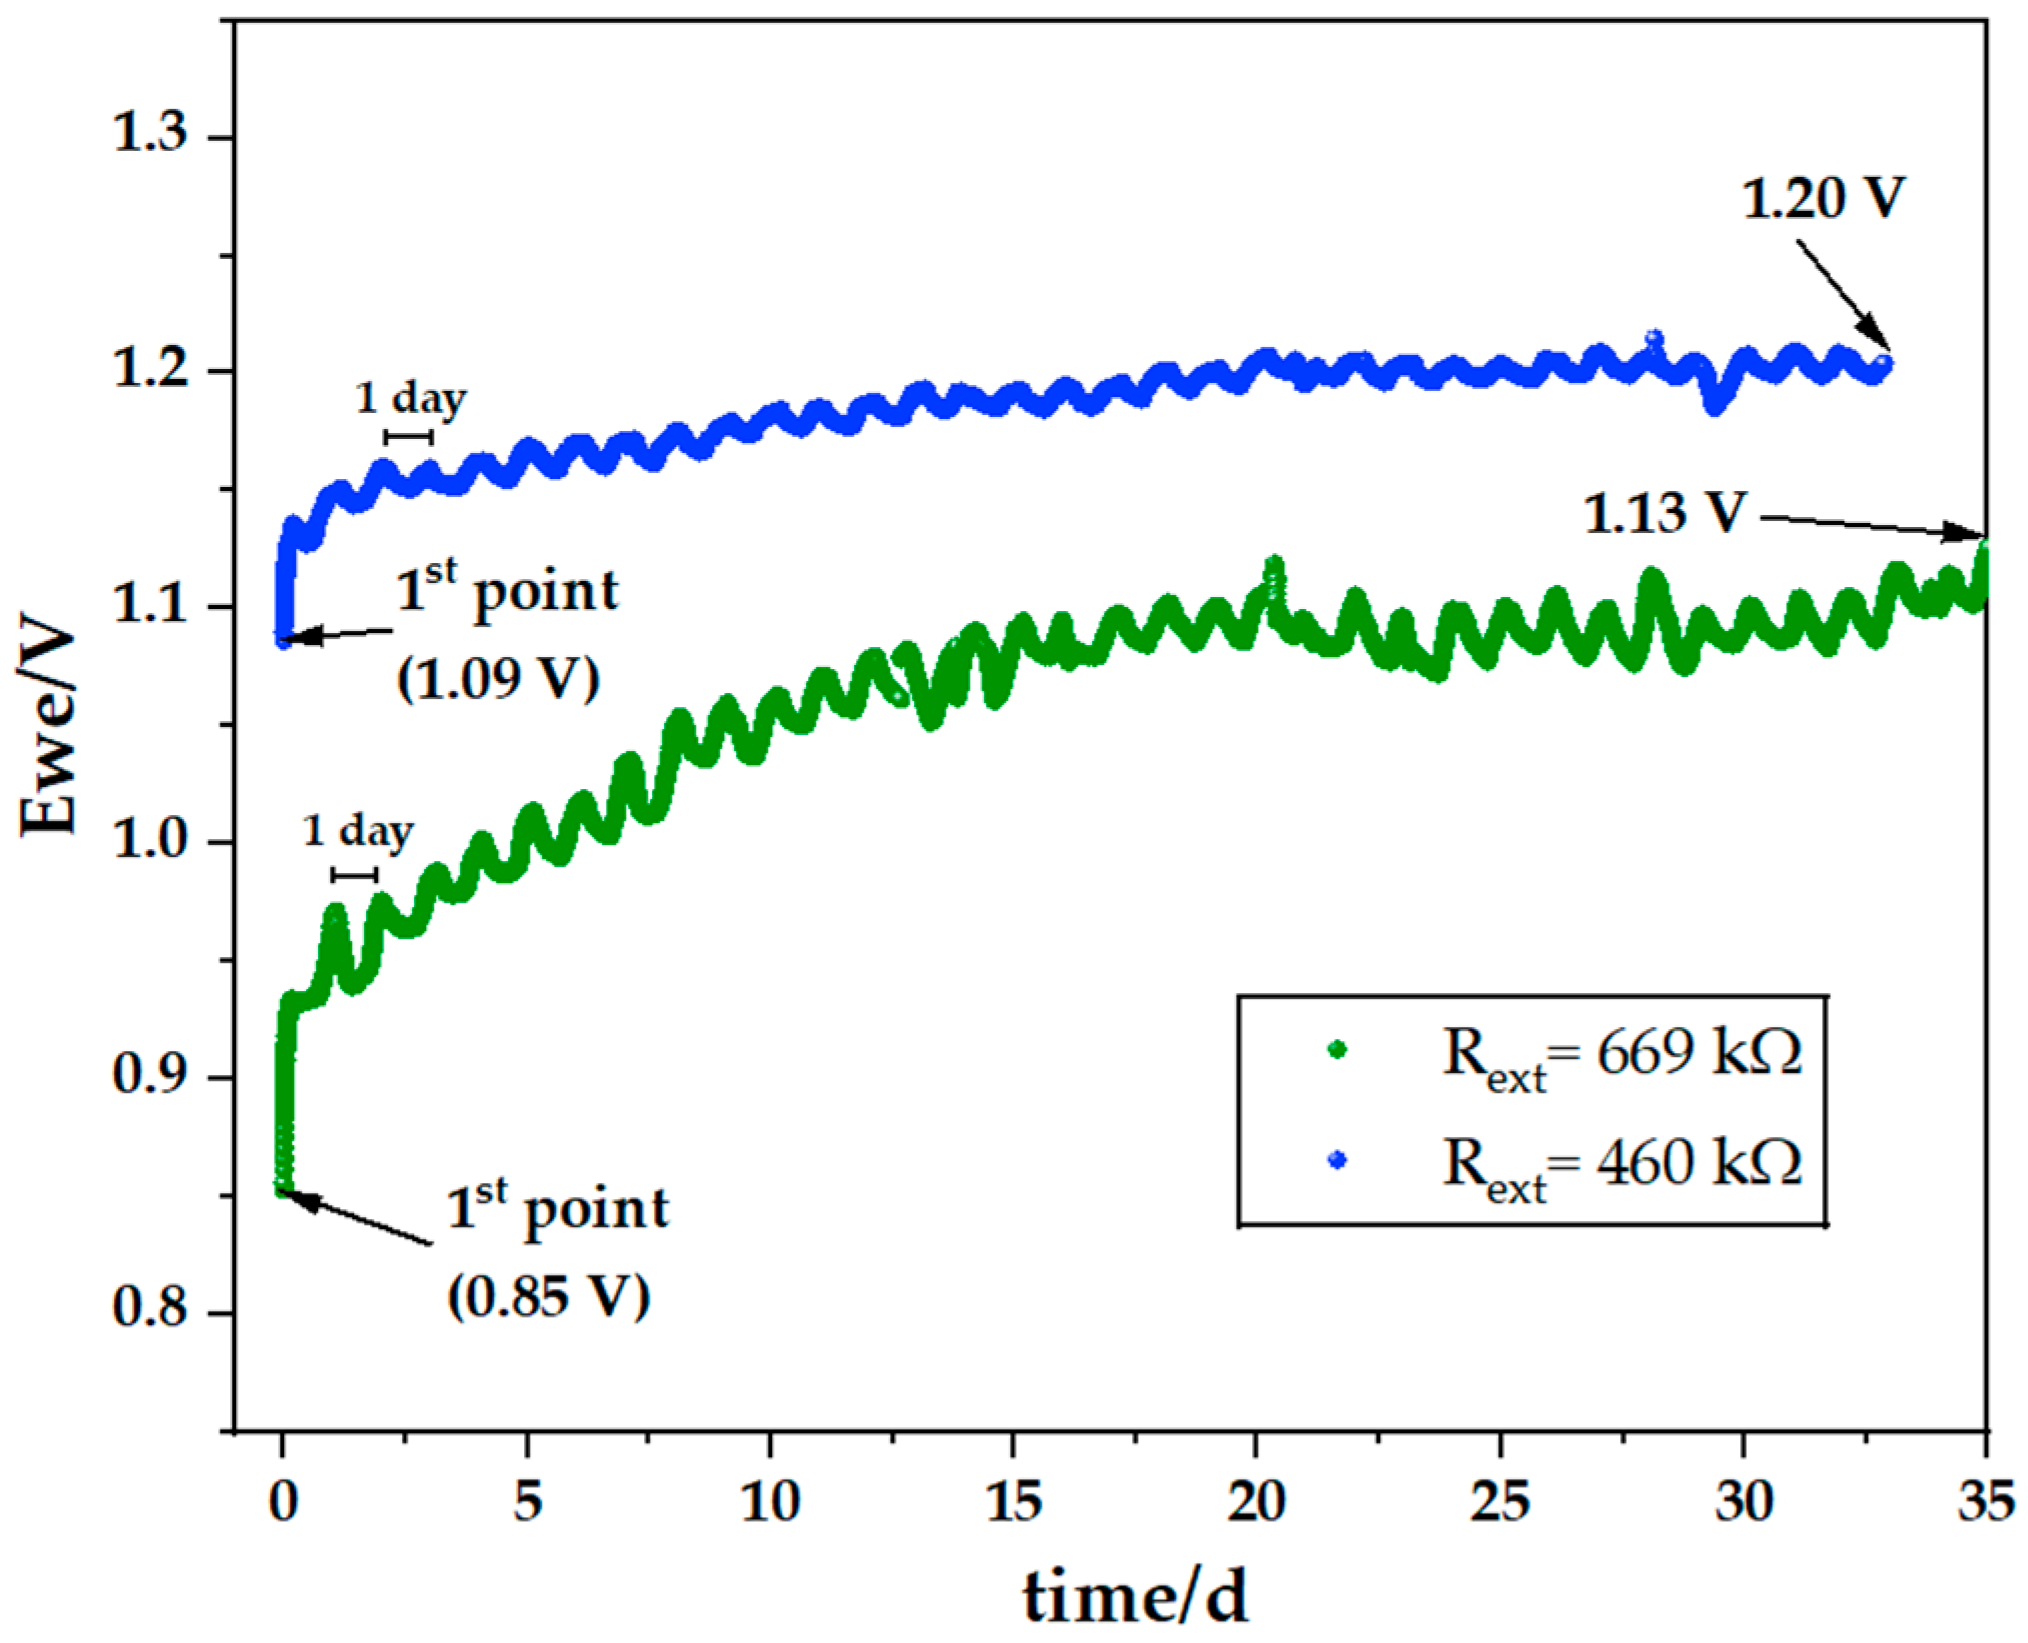
Electrochemical Cycling
3. Materials and Methods
3.1. Materials
3.2. Methods
3.2.1. Ab Initio Simulations of the Cu/Na3ClO/Zn Cell
3.2.2. Preparation of Materials
The Current Collectors
The Separator
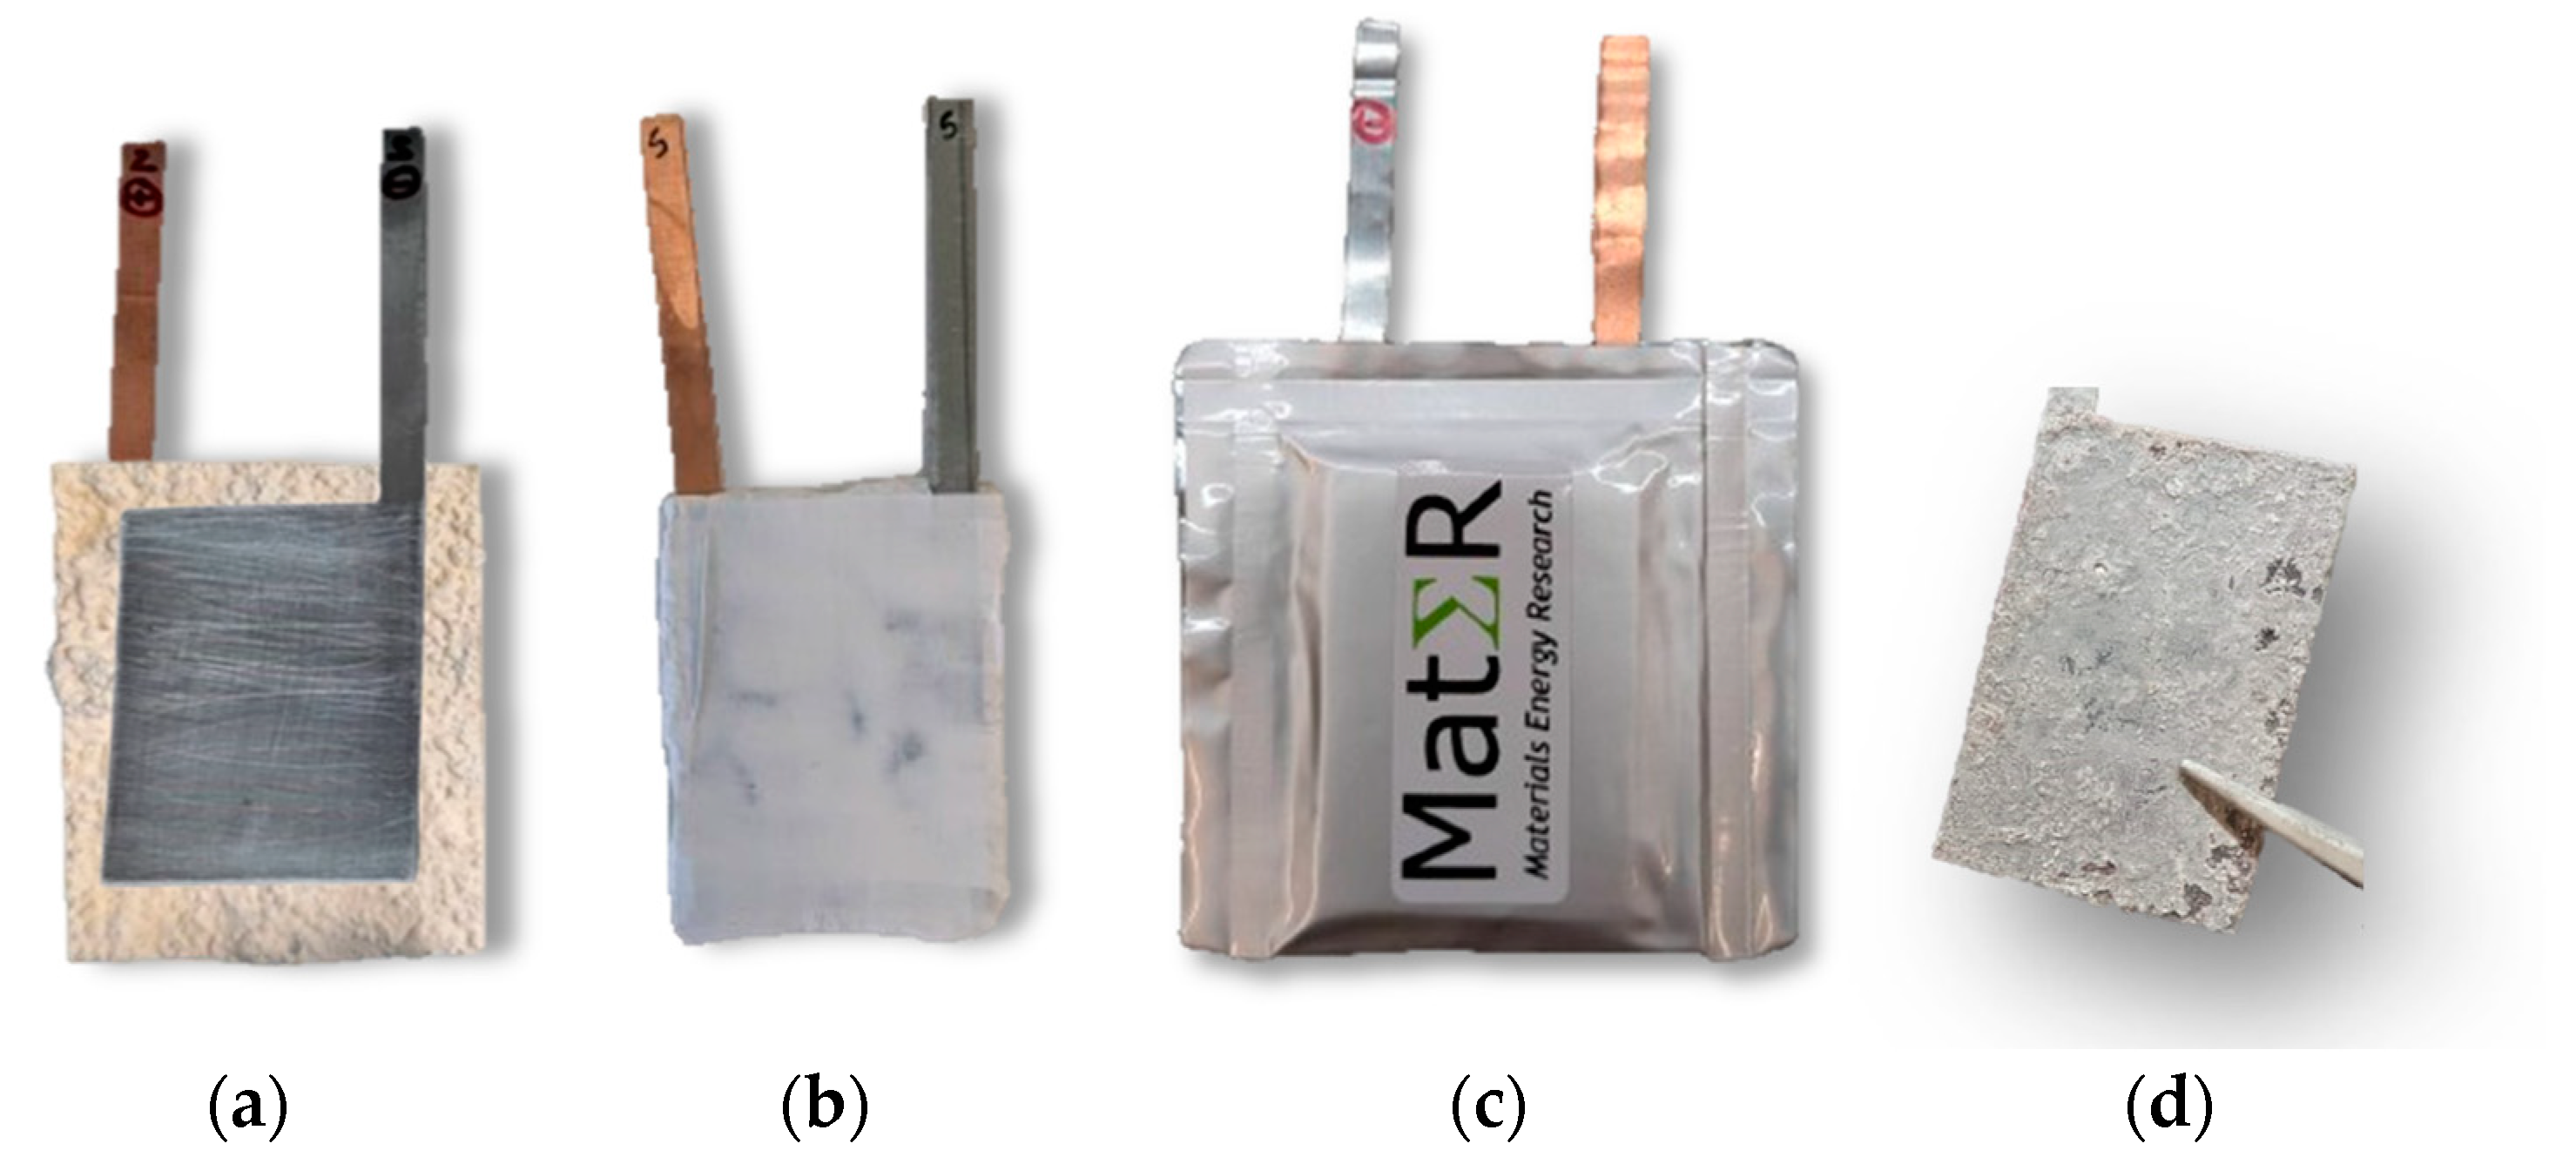
3.2.3. Pouch Cell Manufacturing
3.2.4. Electrochemical Measurements
3.2.5. SEM/EDX Analysis and Sample Preparation
4. Conclusions
Author Contributions
Funding
Institutional Review Board Statement
Informed Consent Statement
Data Availability Statement
Conflicts of Interest
References
- Akpan, J.; Olanrewaju, O. Sustainable Energy Development: History and Recent Advances. Energies 2023, 16, 7049. [Google Scholar] [CrossRef]
- Batra, G. Renewable Energy Economics: Achieving Harmony between Environmental Protection and Economic Goals. Soc. Sci. Chron. 2023, 2, 1–32. [Google Scholar] [CrossRef]
- Hamdan, A.; Daudu, C.D.; Fabuyide, A.; Etukudoh, E.A.; Sonko, S. Next-Generation Batteries and US Energy Storage: A Comprehensive Review: Scrutinizing Advancements in Battery Technology, Their Role in Renewable Energy, and Grid Stability. World J. Adv. Res. Rev. 2024, 21, 1984–1998. [Google Scholar] [CrossRef]
- Kebede, A.A.; Kalogiannis, T.; Van Mierlo, J.; Berecibar, M. A Comprehensive Review of Stationary Energy Storage Devices for Large Scale Renewable Energy Sources Grid Integration. Renew. Sustain. Energy Rev. 2022, 159, 112213. [Google Scholar] [CrossRef]
- Zhu, Z.; Jiang, T.; Ali, M.; Meng, Y.; Jin, Y.; Cui, Y.; Chen, W. Rechargeable Batteries for Grid Scale Energy Storage. Chem. Rev. 2022, 122, 16610–16751. [Google Scholar] [CrossRef]
- Elalfy, D.A.; Gouda, E.; Kotb, M.F.; Bureš, V.; Sedhom, B.E. Comprehensive Review of Energy Storage Systems Technologies, Objectives, Challenges, and Future Trends. Energy Strategy Rev. 2024, 54, 101482. [Google Scholar] [CrossRef]
- Wu, D.; Wu, F. Toward Better Batteries: Solid-State Battery Roadmap 2035+. Etransportation 2023, 16, 100224. [Google Scholar] [CrossRef]
- Thomas, F.; Mahdi, L.; Lemaire, J.; Santos, D.M.F. Technological Advances and Market Developments of Solid-State Batteries: A Review. Materials 2024, 17, 239. [Google Scholar] [CrossRef]
- Schmaltz, T.; Hartmann, F.; Wicke, T.; Weymann, L.; Neef, C.; Janek, J. A Roadmap for Solid-State Batteries. Adv. Energy Mater. 2023, 13, 2301886. [Google Scholar] [CrossRef]
- Song, Y.; Sun, X.; Lou, S.; Sun, F.; Wang, J. Alleviating Range Anxiety: Solid-State Batteries and Extreme Fast Charging. Prog. Mater. Sci. 2024, 147, 101339. [Google Scholar] [CrossRef]
- Shah, R.; Mittal, V.; Precilla, A.M. Challenges and Advancements in All-Solid-State Battery Technology for Electric Vehicles. J 2024, 7, 204–217. [Google Scholar] [CrossRef]
- Kazyak, E.; García-Méndez, R. Recent Progress and Challenges for Manufacturing and Operating Solid-State Batteries for Electric Vehicles. MRS Bull. 2024, 49, 717–729. [Google Scholar] [CrossRef]
- Braga, M.H.; Oliveira, J.E.; Murchison, A.J.; Goodenough, J.B. Performance of a Ferroelectric Glass Electrolyte in a Self-Charging Electrochemical Cell with Negative Capacitance and Resistance. Appl. Phys. Rev. 2020, 7, 011406. [Google Scholar] [CrossRef]
- Danzi, F.; Camanho, P.P.; Braga, M.H. An All-Solid-State Coaxial Structural Battery Using Sodium-Based Electrolyte. Molecules 2021, 26, 5226. [Google Scholar] [CrossRef] [PubMed]
- Wen, J.; Yu, Y.; Chen, C. A Review on Lithium-Ion Batteries Safety Issues: Existing Problems and Possible Solutions. Mater. Express 2012, 2, 197–212. [Google Scholar] [CrossRef]
- Deberdt, R.; Le Billon, P. Conflict Minerals and Battery Materials Supply Chains: A Mapping Review of Responsible Sourcing Initiatives. Extr. Ind. Soc. 2021, 8, 100935. [Google Scholar] [CrossRef]
- Wang, W.; Dutton, S.; Liu, G.; Manthiram, A. Editorial for Special Issue on Abundant and Non-Toxic Materials for Batteries. APL Mater. 2022, 10, 100401. [Google Scholar] [CrossRef]
- Ryu, H.-H.; Sun, H.H.; Myung, S.-T.; Yoon, C.S.; Sun, Y.-K. Reducing Cobalt from Lithium-Ion Batteries for the Electric Vehicle Era. Energy Environ. Sci. 2021, 14, 844–852. [Google Scholar] [CrossRef]
- Lebrouhi, B.E.; Baghi, S.; Lamrani, B.; Schall, E.; Kousksou, T. Critical Materials for Electrical Energy Storage: Li-Ion Batteries. J. Energy Storage 2022, 55, 105471. [Google Scholar] [CrossRef]
- Bruno, M.; Fiore, S. Review of Lithium-Ion Batteries’ Supply-Chain in Europe: Material Flow Analysis and Environmental Assessment. J. Environ. Manag. 2024, 358, 120758. [Google Scholar] [CrossRef]
- Lehtimäki, H.; Karhu, M.; Kotilainen, J.M.; Sairinen, R.; Jokilaakso, A.; Lassi, U.; Huttunen-Saarivirta, E. Sustainability of the Use of Critical Raw Materials in Electric Vehicle Batteries: A Transdisciplinary Review. Environ. Chall. 2024, 16, 100966. [Google Scholar] [CrossRef]
- Nayak, P.K.; Yang, L.; Brehm, W.; Adelhelm, P. From Lithium-ion to Sodium-ion Batteries: Advantages, Challenges, and Surprises. Angew. Chem. Int. Ed. 2018, 57, 102–120. [Google Scholar] [CrossRef] [PubMed]
- Hafiz, N.S.M.; Singla, G.; Jha, P.K. Next Generation Sodium-Ion Battery: A Replacement of Lithium. Mater. Today Proc. 2022, in press. [Google Scholar] [CrossRef]
- Eftekhari, A.; Kim, D.-W. Sodium-Ion Batteries: New Opportunities beyond Energy Storage by Lithium. J. Power Sources 2018, 395, 336–348. [Google Scholar] [CrossRef]
- Yabuuchi, N.; Kubota, K.; Dahbi, M.; Komaba, S. Research Development on Sodium-Ion Batteries. Chem. Rev. 2014, 114, 11636–11682. [Google Scholar] [CrossRef]
- Ellis, B.L.; Nazar, L.F. Sodium and Sodium-Ion Energy Storage Batteries. Curr. Opin. Solid. State Mater. Sci. 2012, 16, 168–177. [Google Scholar] [CrossRef]
- Li, F.; Wei, Z.; Manthiram, A.; Feng, Y.; Ma, J.; Mai, L. Sodium-Based Batteries: From Critical Materials to Battery Systems. J. Mater. Chem. A Mater. 2019, 7, 9406–9431. [Google Scholar] [CrossRef]
- Liu, Z.; Lu, Z.; Guo, S.; Yang, Q.-H.; Zhou, H. Toward High Performance Anodes for Sodium-Ion Batteries: From Hard Carbons to Anode-Free Systems. ACS Cent. Sci. 2023, 9, 1076–1087. [Google Scholar] [CrossRef]
- Zhuang, R.; Zhang, X.; Qu, C.; Xu, X.; Yang, J.; Ye, Q.; Liu, Z.; Kaskel, S.; Xu, F.; Wang, H. Fluorinated Porous Frameworks Enable Robust Anode-Less Sodium Metal Batteries. Sci. Adv. 2023, 9, eadh8060. [Google Scholar] [CrossRef]
- Guerreiro, A.N.; Costa, I.B.; Vale, A.B.; Braga, M.H. Distinctive Electric Properties of Group 14 Oxides: SiO2, SiO, and SnO2. Int. J. Mol. Sci. 2023, 24, 15985. [Google Scholar] [CrossRef]
- Berlanga, C.; Monterrubio, I.; Armand, M.; Rojo, T.; Galceran, M.; Casas-Cabanas, M. Cost-Effective Synthesis of Triphylite-NaFePO4 Cathode: A Zero-Waste Process. ACS Sustain. Chem. Eng. 2019, 8, 725–730. [Google Scholar] [CrossRef]
- Hasa, I.; Mariyappan, S.; Saurel, D.; Adelhelm, P.; Koposov, A.Y.; Masquelier, C.; Croguennec, L.; Casas-Cabanas, M. Challenges of Today for Na-Based Batteries of the Future: From Materials to Cell Metrics. J. Power Sources 2021, 482, 228872. [Google Scholar] [CrossRef]
- Arnaiz, M.; Gómez-Cámer, J.L.; Gonzalo, E.; Drewett, N.E.; Ajuria, J.; Goikolea, E.; Galceran, M.; Rojo, T. Exploring Na-Ion Technological Advances: Pathways from Energy to Power. Mater. Today Proc. 2021, 39, 1118–1131. [Google Scholar] [CrossRef]
- Liu, G.; Yang, J.; Wu, J.; Peng, Z.; Yao, X. Inorganic Sodium Solid Electrolytes: Structure Design, Interface Engineering and Application. Adv. Mater. 2024, 36, 2311475. [Google Scholar] [CrossRef]
- Shi, C.; Takeuchi, S.; Alexander, G.V.; Hamann, T.; O’Neill, J.; Dura, J.A.; Wachsman, E.D. High Sulfur Loading and Capacity Retention in Bilayer Garnet Sulfurized-Polyacrylonitrile/Lithium-Metal Batteries with Gel Polymer Electrolytes. Adv. Energy Mater. 2023, 13, 2301656. [Google Scholar] [CrossRef]
- Braga, M.H.; Ferreira, J.A.; Stockhausen, V.; Oliveira, J.E.; El-Azab, A. Novel Li3ClO Based Glasses with Superionic Properties for Lithium Batteries. J. Mater. Chem. A Mater. 2014, 2, 5470–5480. [Google Scholar] [CrossRef]
- Chi, X.; Zhang, Y.; Hao, F.; Kmiec, S.; Dong, H.; Xu, R.; Zhao, K.; Ai, Q.; Terlier, T.; Wang, L. An Electrochemically Stable Homogeneous Glassy Electrolyte Formed at Room Temperature for All-Solid-State Sodium Batteries. Nat. Commun. 2022, 13, 2854. [Google Scholar] [CrossRef]
- Eshetu, G.G.; Elia, G.A.; Armand, M.; Forsyth, M.; Komaba, S.; Rojo, T.; Passerini, S. Electrolytes and Interphases in Sodium-based Rechargeable Batteries: Recent Advances and Perspectives. Adv. Energy Mater. 2020, 10, 2000093. [Google Scholar] [CrossRef]
- Tao, J.; Chen, Y.; Bhardwaj, A.; Wen, L.; Li, J.; Kolosov, O.V.; Lin, Y.; Hong, Z.; Huang, Z.; Mathur, S. Combating Li Metal Deposits in All-Solid-State Battery via the Piezoelectric and Ferroelectric Effects. Proc. Natl. Acad. Sci. USA 2022, 119, e2211059119. [Google Scholar] [CrossRef]
- Zhu, X.; Xiong, S.; Zhu, G.; Chen, D.; Wang, Z.; Lei, X.; Liu, L.; Li, C. Dielectric Properties and Excellent Energy Storage Density under Low Electric Fields for High Entropy Relaxor Ferroelectric (Li0.2Ca0.2Sr0.2Ba0.2La0.2)TiO3 Ceramic. J. Alloys Compd. 2024, 984, 173987. [Google Scholar] [CrossRef]
- Braga, M.H.; Murchison, A.J.; Oliveira, J.E.; Goodenough, J.B. Low-Temperature Performance of a Ferroelectric Glass Electrolyte Rechargeable Cell. ACS Appl. Energy Mater. 2019, 2, 4943–4953. [Google Scholar] [CrossRef]
- Braga, M.H. Coherence in the Ferroelectric A3ClO (A = Li, Na) Family of Electrolytes. Materials 2021, 14, 2398. [Google Scholar] [CrossRef] [PubMed]
- Li, S.; Wang, F.; Wang, Y.; Yang, J.; Wang, X.; Zhan, X.; He, J.; Wang, Z. Van Der Waals Ferroelectrics: Theories, Materials, and Device Applications. Adv. Mater. 2024, 36, 2301472. [Google Scholar] [CrossRef] [PubMed]
- Liu, S.; Kim, Y.; Tan, L.Z.; Rappe, A.M. Strain-Induced Ferroelectric Topological Insulator. Nano Lett. 2016, 16, 1663–1668. [Google Scholar] [CrossRef]
- Gomes, B.M.; Moutinho, J.F.R.; Braga, M.H. A Perspective on the Building Blocks of a Solid-State Battery: From Solid Electrolytes to Quantum Power Harvesting and Storage. J. Mater. Chem. A Mater. 2024, 12, 690–722. [Google Scholar] [CrossRef]
- Monserrat, B.; Bennett, J.W.; Rabe, K.M.; Vanderbilt, D. Antiferroelectric Topological Insulators in Orthorhombic A MgBi Compounds (A = Li, Na, K). Phys. Rev. Lett. 2017, 119, 036802. [Google Scholar] [CrossRef] [PubMed]
- Dutt, A.; Minkov, M.; Williamson, I.A.D.; Fan, S. Higher-Order Topological Insulators in Synthetic Dimensions. Light. Sci. Appl. 2020, 9, 131. [Google Scholar] [CrossRef]
- Braga, M.H. Energy Harnessing and Storage from Surface Switching with a Ferroelectric Electrolyte. Chem. Commun. 2024, 60, 5395–5398. [Google Scholar] [CrossRef]
- Gandi, S.S.; Katta, V.K.; Jayasankar, C.K.; Pecharapa, W.; Ravuri, B.R. Glass-Ceramic Na3+x[(Zr/Cr)x(Sc/Ti)2−x(PO4)3 Electrolyte Materials for Na-Ion Full-Cell Application. Integr. Ferroelectr. 2023, 238, 334–342. [Google Scholar] [CrossRef]
- Gopinadh, S.V.; Anoopkumar, V.; Ansari, M.J.N.; Srivastava, D.; Raj, M.A.; John, B.; Samridh, A.; Vijayakumar, P.S.; Mercy, T.D. Lithium-Ion Pouch Cells: An Overview. In Energy Harvesting and Storage: Fundamentals and Materials; Springer: Singapore, 2022; pp. 209–224. [Google Scholar] [CrossRef]
- Wang, X.; Zhang, Q.; Zhao, C.; Li, H.; Zhang, B.; Zeng, G.; Tang, Y.; Huang, Z.; Hwang, I.; Zhang, H. Achieving a High-Performance Sodium-Ion Pouch Cell by Regulating Intergrowth Structures in a Layered Oxide Cathode with Anionic Redox. Nat. Energy 2024, 9, 184–196. [Google Scholar] [CrossRef]
- Tang, J.; Barker, J.; Pol, V.G. Sodium-ion Battery Anodes Comprising Carbon Sheets: Stable Cycling in Half-and Full-pouch Cell Configuration. Energy Technol. 2018, 6, 213–220. [Google Scholar] [CrossRef]
- Lim, G.J.H.; Chan, K.K.; Sutrisnoh, N.A.A.; Srinivasan, M. Design of Structural Batteries: Carbon Fibers and Alternative Form Factors. Mater. Today Sustain. 2022, 20, 100252. [Google Scholar] [CrossRef]
- Parviziomran, E.; Elliot, V. Barriers to Circular Economy: Insights from a Small Electric Vehicle Battery Manufacturer. J. Purch. Supply Manag. 2024, 30, 100905. [Google Scholar] [CrossRef]
- Chigbu, B.I. Advancing Sustainable Development through Circular Economy and Skill Development in EV Lithium-Ion Battery Recycling: A Comprehensive Review. Front. Sustain. 2024, 5, 1409498. [Google Scholar] [CrossRef]
- Zhao, T.; Mahandra, H.; Marthi, R.; Ji, X.; Zhao, W.; Chae, S.; Traversy, M.; Li, W.; Yu, F.; Li, L. An Overview on the Life Cycle of Lithium Iron Phosphate: Synthesis, Modification, Application, and Recycling. Chem. Eng. J. 2024, 485, 149923. [Google Scholar] [CrossRef]
- Hu, G.; Huang, K.; Du, K.; Peng, Z.; Cao, Y. Efficient Recovery and Regeneration of FePO4 from Lithium Extraction Slag: Towards Sustainable LiFePO4 Battery Recycling. J. Clean. Prod. 2024, 434, 140091. [Google Scholar] [CrossRef]
- Gucciardi, E.; Galceran, M.; Bustinza, A.; Bekaert, E.; Casas-Cabanas, M. Sustainable Paths to a Circular Economy: Reusing Aged Li-Ion FePO4 Cathodes within Na-Ion Cells. J. Phys. Mater. 2021, 4, 034002. [Google Scholar] [CrossRef]
- Wesselkämper, J.; Dahrendorf, L.; Mauler, L.; Lux, S.; Von Delft, S. Towards Circular Battery Supply Chains: Strategies to Reduce Material Demand and the Impact on Mining and Recycling. Resour. Policy 2024, 95, 105160. [Google Scholar] [CrossRef]
- Carvalho Baptista, M.; Khalifa, H.; Araújo, A.; Maia, B.A.; Souto, M.; Braga, M.H.; Baptista, M.C.; Khalifa, H.; Maia, B.A.; Braga, M.H.; et al. Giant Polarization in Quasi-Adiabatic Ferroelectric Na+ Electrolyte for Solid-State Energy Harvesting and Storage. Adv. Funct. Mater. 2022, 33, 2212344. [Google Scholar] [CrossRef]
- Kresse, G.; Furthmüller, J. Efficient Iterative Schemes for Ab Initio Total-Energy Calculations Using a Plane-Wave Basis Set. Phys. Rev. B Condens. Matter Mater. Phys. 1996, 54, 11169–11186. [Google Scholar] [CrossRef]
- Baptista, M.C.; Gomes, B.M.; Vale, A.B.; Braga, M.H. In-Series All-Solid-State Anode-Less Cells. J. Energy Storage 2024, 102, 113983. [Google Scholar] [CrossRef]
- Wang, S.; Zhang, J.; Gharbi, O.; Vivier, V.; Gao, M.; Orazem, M.E. Electrochemical Impedance Spectroscopy. Nat. Rev. Methods Primers 2021, 1, 41. [Google Scholar] [CrossRef]
- Lazanas, A.C.; Prodromidis, M.I. Electrochemical Impedance Spectroscopy—A Tutorial. ACS Meas. Sci. Au 2023, 3, 162–193. [Google Scholar] [CrossRef] [PubMed]
- Vadhva, P.; Hu, J.; Johnson, M.J.; Stocker, R.; Braglia, M.; Brett, D.J.L.; Rettie, A.J.E. Electrochemical Impedance Spectroscopy for All-solid-state Batteries: Theory, Methods and Future Outlook. ChemElectroChem 2021, 8, 1930–1947. [Google Scholar] [CrossRef]
- Rusling, J.F.; Suib, S.L. Characterizing Materials with Cyclic Voltammetry. Adv. Mater. 1994, 6, 922–930. [Google Scholar] [CrossRef]
- Morales, D.M.; Risch, M. Seven Steps to Reliable Cyclic Voltammetry Measurements for the Determination of Double Layer Capacitance. J. Phys. Energy 2021, 3, 034013. [Google Scholar] [CrossRef]
- Newbury, D.E.; Ritchie, N.W.M. Is Scanning Electron Microscopy/Energy Dispersive X-ray Spectrometry (SEM/EDS) Quantitative? Scanning 2013, 35, 141–168. [Google Scholar] [CrossRef]


| # Cell | mseparator (g) | mcellulose (g) | for (4.0 × 5.5) cm2 (g) | for (4.0 × 5.5) cm2 (g) | for (3.5 × 5.0) cm2 (g) |
|---|---|---|---|---|---|
| PC I | 1.630 | 0.044 | 1.586 | 1.269 | 1.009 |
| PC II | 1.250 | 0.044 | 1.206 | 0.965 | 0.768 |
| PC III | 1.895 | 0.045 | 1.850 | 1.480 | 1.177 |
| PC IV | 0.978 | 0.046 | 0.932 | 0.746 | 0.593 |
| PC V | 2.916 | 0.046 | 2.870 | 2.296 | 1.826 |
| PC VI | 1.584 | 0.046 | 1.538 | 1.230 | 0.978 |
| 1st Cycle | 2nd Cycle | 3rd Cycle | |||||||
|---|---|---|---|---|---|---|---|---|---|
| R1 (Ω) | R2 (Ω) | R3 (Ω) | R1 (Ω) | R2 (Ω) | R3 (Ω) | R1 (Ω) | R2 (Ω) | R3 (Ω) | |
| After assembly | 86 | 68 | 39 | 79 | 80 | 39 | 91 | 71 | 38 |
| Σ = 193 | Σ = 198 | Σ = 200 | |||||||
| After 1st CV | 33 | 109 | 259 | 36 | 222 | 140 | 39 | 241 | 120 |
| Σ = 401 | Σ = 398 | Σ = 400 | |||||||
| After 2nd CV | 27 | 147 | - | 48 | 153 | - | 45 | 160 | - |
| Σ = 174 | Σ = 201 | Σ = 205 | |||||||
| After 3rd CV | 20 | 178 | - | 36 | 164 | - | 55 | 139 | - |
| Σ = 198 | Σ = 200 | Σ = 194 | |||||||
| After 4th CV | 31 | 103 | - | 63 | 103 | - | 74 | 98 | - |
| Σ = 134 | Σ = 166 | Σ = 172 | |||||||
| After 5th CV | 69 | 144 | 142 | 59 | 62 | 146 | 62 | 40 | 131 |
| Σ = 355 | Σ = 267 | Σ = 233 | |||||||
| After 6th CV | 64 | 153 | 42 | 55 | 164 | 52 | 59 | 166 | 47 |
| Σ = 259 | Σ = 271 | Σ = 272 | |||||||
| Open Circuit Voltage OCV (V) | External Resistor Rext (kΩ) | Discharge Time Time (h) | Maximum Discharge Potential Ewe (V) | Discharge Current IRext (mA) | Discharge Capacity QRext (mAh) | Thickness Na on Zn(−) dNa (μm) |
|---|---|---|---|---|---|---|
| 1.06 | 553 | 3003 | 1.13 | 0.002 | 5.996 | 3.0 |
| Open Circuit Voltage OCV (V) | External Resistor Rext (kΩ) | Discharge Time Time (h) | Last Discharge Potential Ewe (V) | Maximum Discharge Current IRext (mA) | Discharge Capacity QRext (mAh) | Thickness Na in Zn dNa (μm) |
|---|---|---|---|---|---|---|
| 0.85 | 669 | 2277 | 1.20 | 0.002 | 4.554 | 2.3 |
| 1.09 | 460 | 789 | 1.10 | 0.002 | 1.578 | 0.8 |
Disclaimer/Publisher’s Note: The statements, opinions and data contained in all publications are solely those of the individual author(s) and contributor(s) and not of MDPI and/or the editor(s). MDPI and/or the editor(s) disclaim responsibility for any injury to people or property resulting from any ideas, methods, instructions or products referred to in the content. |
© 2024 by the authors. Licensee MDPI, Basel, Switzerland. This article is an open access article distributed under the terms and conditions of the Creative Commons Attribution (CC BY) license (https://creativecommons.org/licenses/by/4.0/).
Share and Cite
Freitas, Â.; Baptista, M.C.; Braga, M.H. Sustainable Solid-State Sodium-Ion Batteries Featuring Ferroelectric Electrolytes. Int. J. Mol. Sci. 2024, 25, 12694. https://doi.org/10.3390/ijms252312694
Freitas Â, Baptista MC, Braga MH. Sustainable Solid-State Sodium-Ion Batteries Featuring Ferroelectric Electrolytes. International Journal of Molecular Sciences. 2024; 25(23):12694. https://doi.org/10.3390/ijms252312694
Chicago/Turabian StyleFreitas, Ângela, Manuela C. Baptista, and Maria Helena Braga. 2024. "Sustainable Solid-State Sodium-Ion Batteries Featuring Ferroelectric Electrolytes" International Journal of Molecular Sciences 25, no. 23: 12694. https://doi.org/10.3390/ijms252312694
APA StyleFreitas, Â., Baptista, M. C., & Braga, M. H. (2024). Sustainable Solid-State Sodium-Ion Batteries Featuring Ferroelectric Electrolytes. International Journal of Molecular Sciences, 25(23), 12694. https://doi.org/10.3390/ijms252312694