Article

Characterization of Cytoskeletal Profilin Genes in Plasticity Elongation of Mesocotyl and Coleoptile of Maize Under Diverse Abiotic Stresses

State Key Laboratory of Aridland Crop Science, College of Agronomy, Gansu Agricultural University, Lanzhou 730070, China
*
Author to whom correspondence should be addressed.
Int. J. Mol. Sci. 2024, 25(21), 11693; https://doi.org/10.3390/ijms252111693
Submission received: 29 September 2024 / Revised: 23 October 2024 / Accepted: 29 October 2024 / Published: 30 October 2024
(This article belongs to the Special Issue Advanced Plant Molecular Responses to Abiotic Stresses)

Abstract

:
The plasticity elongation of mesocotyl (MES) and coleoptile (COL) largely determines the morphology of maize seedlings under abiotic stresses. The profilin (PRF) proteins play a pivotal role in cytoskeleton dynamics and plant development via regulating actin polymerization. However, little is known about whether and how the expression of the ZmPRF gene family regulates MES and COL elongation in maize under adverse abiotic stresses. Here, a total of eight ZmPRF gene members were identified in the maize genome. They were mainly located in the cytoplasm, chloroplast, and mitochondrion, and clearly divided into four classes, based on phylogenetic analysis. Segmental duplication was the main driver for the expansion of ZmPRF genes. Ka/Ks analysis indicated that most ZmPRF genes were intensely purified and selected. Promoter cis-element analysis suggested their potential roles in response to growth and development, stress adaption, hormone response, and light response. The protein–protein interaction network and two independent RNA-sequencing analyses revealed that eight ZmPRF genes and their thirty-seven interacting genes showed varied expression patterns in MES and COL of three maize genotypes under different sowing depths, 24-epibrassinolide application, and light spectral-quality treatments, of which ZmPRF3.3 was a potential core conserved gene for breeding application. Moreover, the quantitative real-time PCR (qRT-PCR) verified that the relative expression levels of most ZmPRF genes in MES and COL under above treatments were significantly correlated with the plasticity elongation of MES and COL in maize. Therefore, these results perform a comprehensive overview of the ZmPRF family and will provide valuable information for the validation of the function of ZmPRF genes in maize development under diverse abiotic stress.

1. Introduction

Maize (Zea mays), is the most widely planted crop in the world, and is utilized globally as food, feed, and fuel, with a production of more than 1.14 billion tons in 2018 [1]. According to a forecast of the United Nations (https://www.fao.org/home/en/ (accessed on 8 September 2024)), the world’s population will exceed nine billion and global demand for maize will double, by 2050. In fact, maize generally grows in various harsh environment, such as drought, low/high temperature, and acid/saline–alkali soils, which seriously inhibits plant growth and reduces production [2,3,4,5,6]. Fortunately, maize has evolved a series of adaptive changes including morphology and physiology, and activated multiple stress-specific response genes and transcription factors (TFs) to response to stress regulations [7,8]. Considering their importance, more and more promising genes have been identified to understand how they respond to different stresses at transcriptional levels.
The actin cytoskeleton is the central player in the cytoskeleton, and displays crucial roles throughout the whole plant life cycle, such as cell expansion and division, vesicle trafficking, organelle movement, morphogenesis, and stress responses [9,10,11]. Interestingly, there are multiple proteins and factors taking part in these biological processes by regulating the formation of microfilaments and microtubules, actin nucleation and the homeostasis maintenance of globular (G-)actin [12,13]. In addition, the actin-binding proteins (ABPs) are an important class of proteins involved in the regulation of this dynamic rearrangement of action filaments [14], of which, profilin (PRF) is thought to be one of the major modulators [15].
The PRFs (Pfam accession number PF00235) have low molecular weight in both mono- and dicotyledonous, and they control action polymerization by ADP/ATP exchanges [16], and profilin/G-actin ratio, as well as ionic environment of cells [17]. Actin dynamics analysis revealed that PRFs bind to actin by forming a 1:1 complex with G-actin, suppress spontaneous actin nucleation, and inhibit monomer addition at filament pointed ends [18]. In vitro studies showed that PRF-actin complex could associate with the barbed ends of filaments, along with promoted actin polymerization, and that these changes were achieved by lowering the critical concentration and increasing nucleotide exchange on G-actin [19]. An early study [20] also suggested that PRFs had their molecular interactions mainly with polyphosphoinositides and proline-rich domain-containing proteins during cell wall development. In addition, PRFs participated in signal transduction, and may link transmembrane signaling to the control of the microfilament system [21]. In recent years, more than 400 PRF genes from different plant species have been found in the National Center for Biotechnology Information (NCBI) database, which were clearly divided into four classes [22]. Among them, PRF1 in cotton (Gossypium hirsutum) regulated floral/apical meristem development and early-flowering phenotypes [16]. The inhibited PRF-1 (PFN-U) Arabidopsis thaliana etiolated seedlings showed an overall dwarf phenotype, including short hypocotyls whose lengths were 20~25% that of the wild type at low temperatures [23]. Three PRF genes in rice (Oryza sativa) were involved in abiotic stresses (including NaCl, PEG6000, cold, light, and UV-B) and hormone response (i.e., indole-3-acetic acid (IAA), gibberellic acid 3 (GA3), abscisic acid (ABA), salicylic acid (SA), and brassinolide (BR)) processes [13]. A total of five PRF genes in maize have been identified so far, with distinct biochemical and live-cell properties [24,25], speculating that maize PRF genes may perform distinct functions. However, whether there are other PRF genes, and how these genes were expressed in different maize tissues under various environmental stresses, remain unclear.
The mesocotyl (MES) and coleoptile (COL) are important embryonic organs for sensing various stresses in maize, with their plasticity elongation thus influencing seedling emergence and morphology establishment [26]. Certainly, what we are interested in is whether PRF genes regulate plasticity elongation of MES and COL in maize under diverse stresses. Therefore, the aims of this study are to (1) identify ZmPRF gene members in maize and analyze their physicochemical properties, phylogenetic relationships, gene structure, conserved motifs, evolutionary selection patterns, duplication events, and protein interaction networks; (2) analyze gene expression patterns of ZmPRFs in both tissues under different treatments via RNA-sequencing (RNA-Seq); and (3) clarify the relationships between all ZmPRF expression and MES/COL plasticity elongation. These findings may provide valuable insights into studying the biology function of the ZmPRF family in maize and suggest their use for future breeding programs.

2. Results

2.1. Identification of PRF Family Members in Maize

Using 31 PRF proteins sequences from Arabidopsis thaliana [27], Oryza sativa [13], and Brassica juncea [22], as a reference for the Hidden Markov Model (HMM) and BLASTP alignment, as a result, a total of eight ZmPRF members were identified in the maize genome (https://ftp.ensemblgenomes.ebi.ac.uk/pub/plants/release-60/fasta/zea_mays/dna/ (accessed on 16 April 2024)), and their names were assigned by the nomenclature of Khuman et al. [22] (Table 1). These ZmPRF members were then distributed on chromosome 3, 4, 6, 8, and 9 (Table 1; Figure 1A). Further analysis showed that these ZmPRF gene members encoded amino acids from 131 to 187, had protein molecular weights (MWs) varying from 14.11 to 19.34 kDa, and exhibited the theoretical isoelectric point (pI) values ranging from 4.59 to 6.29 (pI value < 7.0; Table 1), indicating that they may be acidic proteins. Meanwhile, except for ZmPRF3.1, the instability index of the other seven PRF proteins was less than 40 (Table 1), suggesting their stable nature. Moreover, the grand average of hydropathicity (GRAVY) values analysis indicated that only one protein, i.e., ZmPRF3.5, exhibited hydrophilic residues on its surface, whereas other members showed hydrophobic residues (Table 1). Additionally, all PRF proteins displayed diverse subcellular localizations, including cytoplasm, chloroplast, and mitochondrion (Table 1), showing their involvement in various cellular transport processes [22].

2.2. Phylogenetic Analysis of PRF Family

To further elucidate the evolutionary relationship of ZmPRF gene members in maize, a total of 46 PRF genes from seven plant species were selected (Table S1). There were significance differences in their amino acid number (ranging from 125 to 145, average 135), MWs (ranging from 13.62 to 15.76 kDa, average 14.58 kDa), and theoretical pI values (ranging from 4.86 to 5.59, average 5.16) among all species (Table S1). Using all PRF protein sequences, a neighbor-joining (NJ) phylogenetic tree was further constructed, and these PRF genes were then distinctly grouped into four classes (Figure 1B). Among them, Class I (consisting of 16 PRF protein members, including ZmPRF3.1 and ZmPRF3.3), Class III (consisting of 11 PRF protein members, including ZmPRF2.1), and Class IV (consisting of 7 PRF protein members, including ZmPRF3.2 and ZmPRF3.4) were commonly found in monocotyledonous and dicotyledonous species, while Class II consisted of 12 PRF protein members, including ZmPRF1.1, ZmPRF1.2, and ZmPRF3.5 (Figure 1B). It is thus speculated that these PRF sequences may undergo significant structural transformations during the evolutionary split of monocotyledonous and dicotyledonous plants; at the same time, these transformations may have caused variations in the number of PRF sequences within each plant subfamily and species.

2.3. Gene Structures and Conserved Motifs of PRF Family

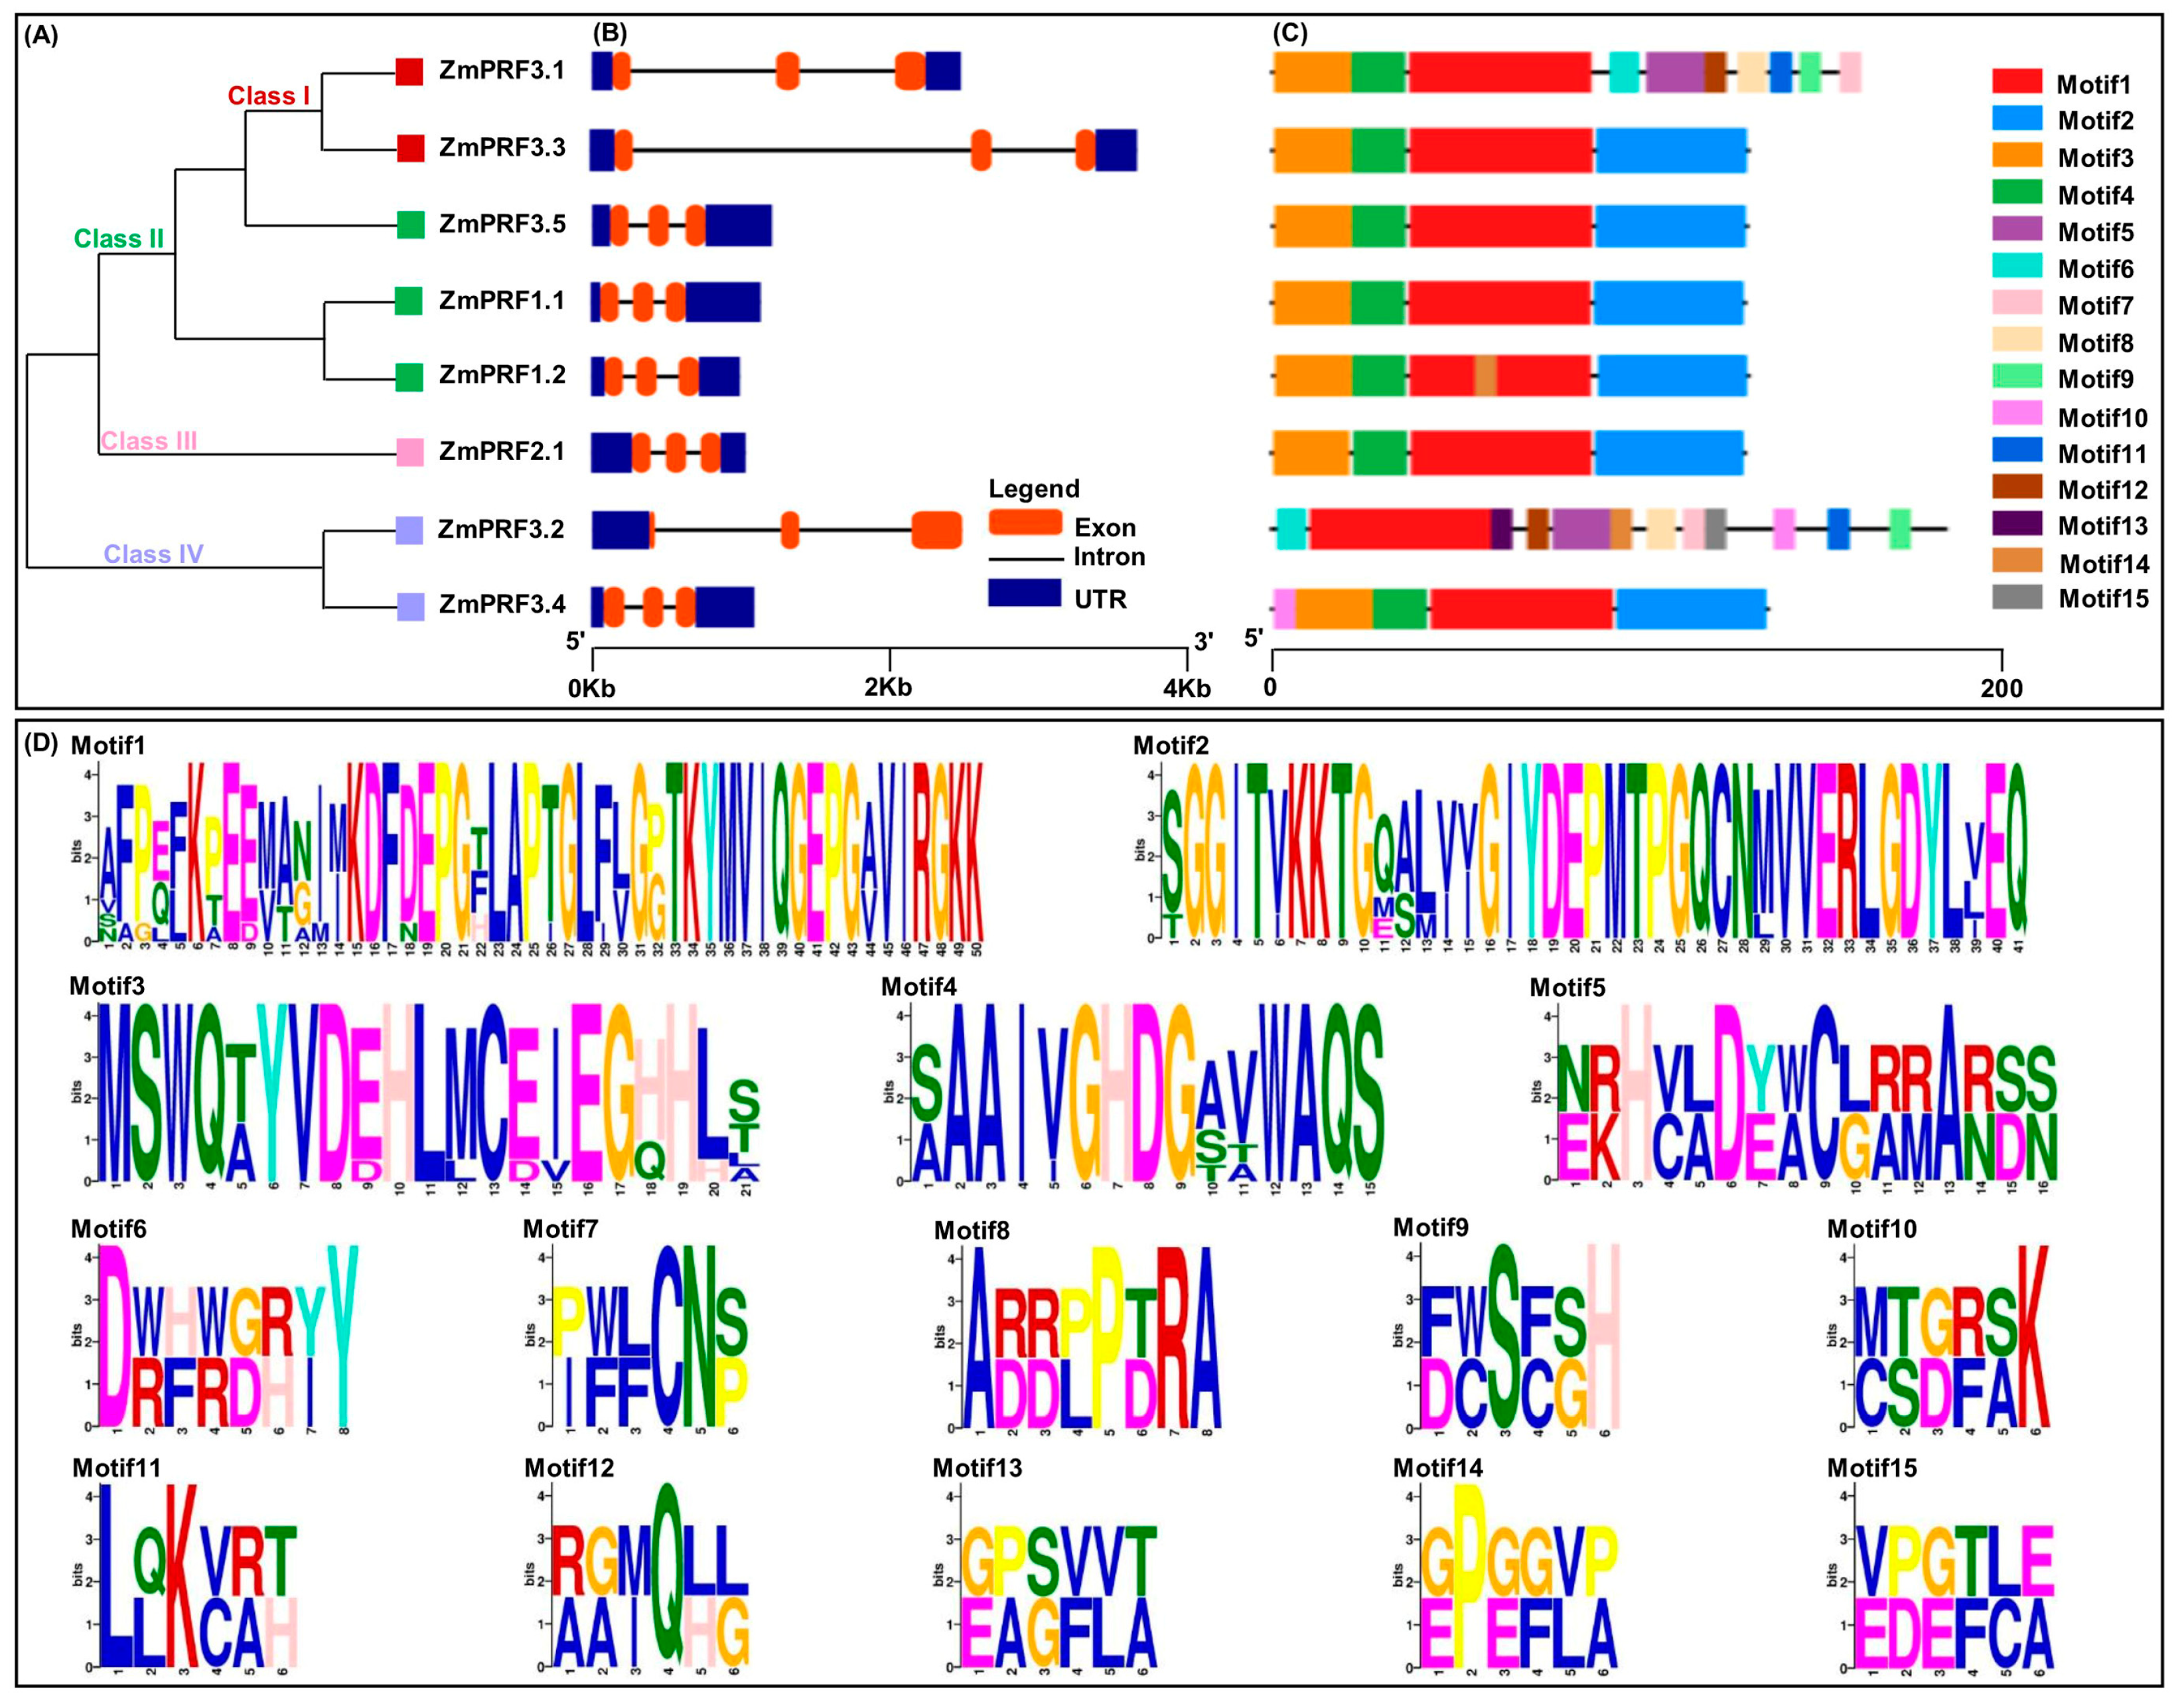
To gain insight into the architectures of maize ZmPRF gene members, exon–intron structure analysis was carried. The results showed that these genes contained three exons and two introns, and their untranslated region (UTR) lengths were clearly different (Figure 2B). Additional analysis of conserved motifs in maize ZmPRF members was conducted using the online tool Multiple Em for Motif Elicitation (MEME). The results revealed that a total of 15 conserved motifs were identified among all protein sequences, designated as Motif1–Motif15 (Figure 2C,D); of which, 4 (ZmPRF1.1, ZmPRF2.1, ZmPRF3.3, and ZmPRF3.5) to 12 (ZmPRF3.2) conserved motifs were detected in each protein (Figure 2C,D). Meanwhile, the same Motif1 was found in all PRF proteins, while some special conserved motifs, such as the Motif10 only existed in Class IV (ZmPRF3.2 and ZmPRF3.4), and the Motif9 only arose in Class I (ZmPRF3.1) (Figure 2A,C,D). This suggested that these motifs may have evolved to perform specific functions unique to these classes, highlighting potential functional divergence among ZmPRF family members.

2.4. Cis-Element Analysis of PRF Family

To predict possible functions and regulatory mechanisms of maize ZmPRF gene members, cis-elements within their 2 kb promoter-region sequence upstream of the start codon were analyzed. A total of 67 cis-elements were identified (Figure 3A). They were divided into 4 categories, including 13 growth-and-development-related elements, 19 stress-adaption elements, 16 hormone-response elements, and 19 light-response elements (Figure 3A). The findings suggested that these maize PRF genes likely interacted with multiple TFs. It is thus plausible to infer that maize ZmPRF genes may play a significant role in regulating multiple physiological processes, and that understanding their regulatory mechanisms could inform future studies focused on improving maize resilience and yield under varying environmental conditions. Moreover, we further obtained the top 12 important cis-elements, i.e., the growth-and-development-related elements of AT~TATA-box, CAAT-box, CCAAT-box, and TATA-box, the stress-adaption elements of the MYB, MYB-recognition site, MYC, and WRE3, the hormone-response elements of ABRE, STRE, and the TGACG-motif, as well as the light-response element of G-box (Figure 3B).

2.5. Collinearity Relationships of PRF Family

To investigate the evolution mechanisms of PRF gene members, we also analyzed intraspecific and interspecific collinearity analyses of all PRF genes. There was one collinearity relationship among eight PRF genes identified in the maize genome (Figure S1), suggesting that some maize PRF genes may have arisen from gene duplication events and that segmental duplication events are the main driver of maize PRF evolution. Moreover, only ZmPRF2.1 was discovered to exhibit a collinear relationship with one Sorghum bicolor SbPRF1 (the non-synonymous (Ka)/synonymous (Ks) value was 0.108); only ZmPRF3.5 was found to have a collinear relationship with one SbPRF3 (the Ka/Ks value was 0.120); only ZmPRF3.4 was ascertained to show a collinear relationship with one SbPRF2 (the Ka/Ks value was 0.061); ZmPRF3.3 was detected to display a collinear relationship with one Oryza sativa OsPRF3 (the Ka/Ks value was 0.962, and two Triticum aestivum TaPRF11 (the Ka/Ks value was 0.996), and TaPRK13 (the Ka/Ks value was 0.982) (Figure S2; Table S2), implying that these genes underwent evolutionary processes under purifying selection. Similarly, during the evolution of Triticum aestivum and Sorghum bicolor, Triticum aestivum and Oryza sativa, Glycine max and Gossypium hirsutum, Arabidopsis thaliana and Brassica juncea, 1, 3, 6, and 16 colinear gene pairs had Ka/Ks values less than 1, respectively (Figure S2; Table S2), indicating that natural selection favored the conservation of these genes throughout the evolutionary trajectory of both monocotyledonous and dicotyledonous species. However, ZmPRF3.3 was found to have a collinear relationship with one SbPRF5 (the Ka/Ks value was 1.017) and one TaPRF12 (the Ka/Ks value was 1.006) (Figure S2; Table S2), suggesting that these genes were subjected to evolutionary processes under positive selection, which were thus retained during the evolution process and may contribute to their growth and development, as well as to adverse stress responses.

2.6. Protein–Protein Interaction (PPI) Networks Prediction

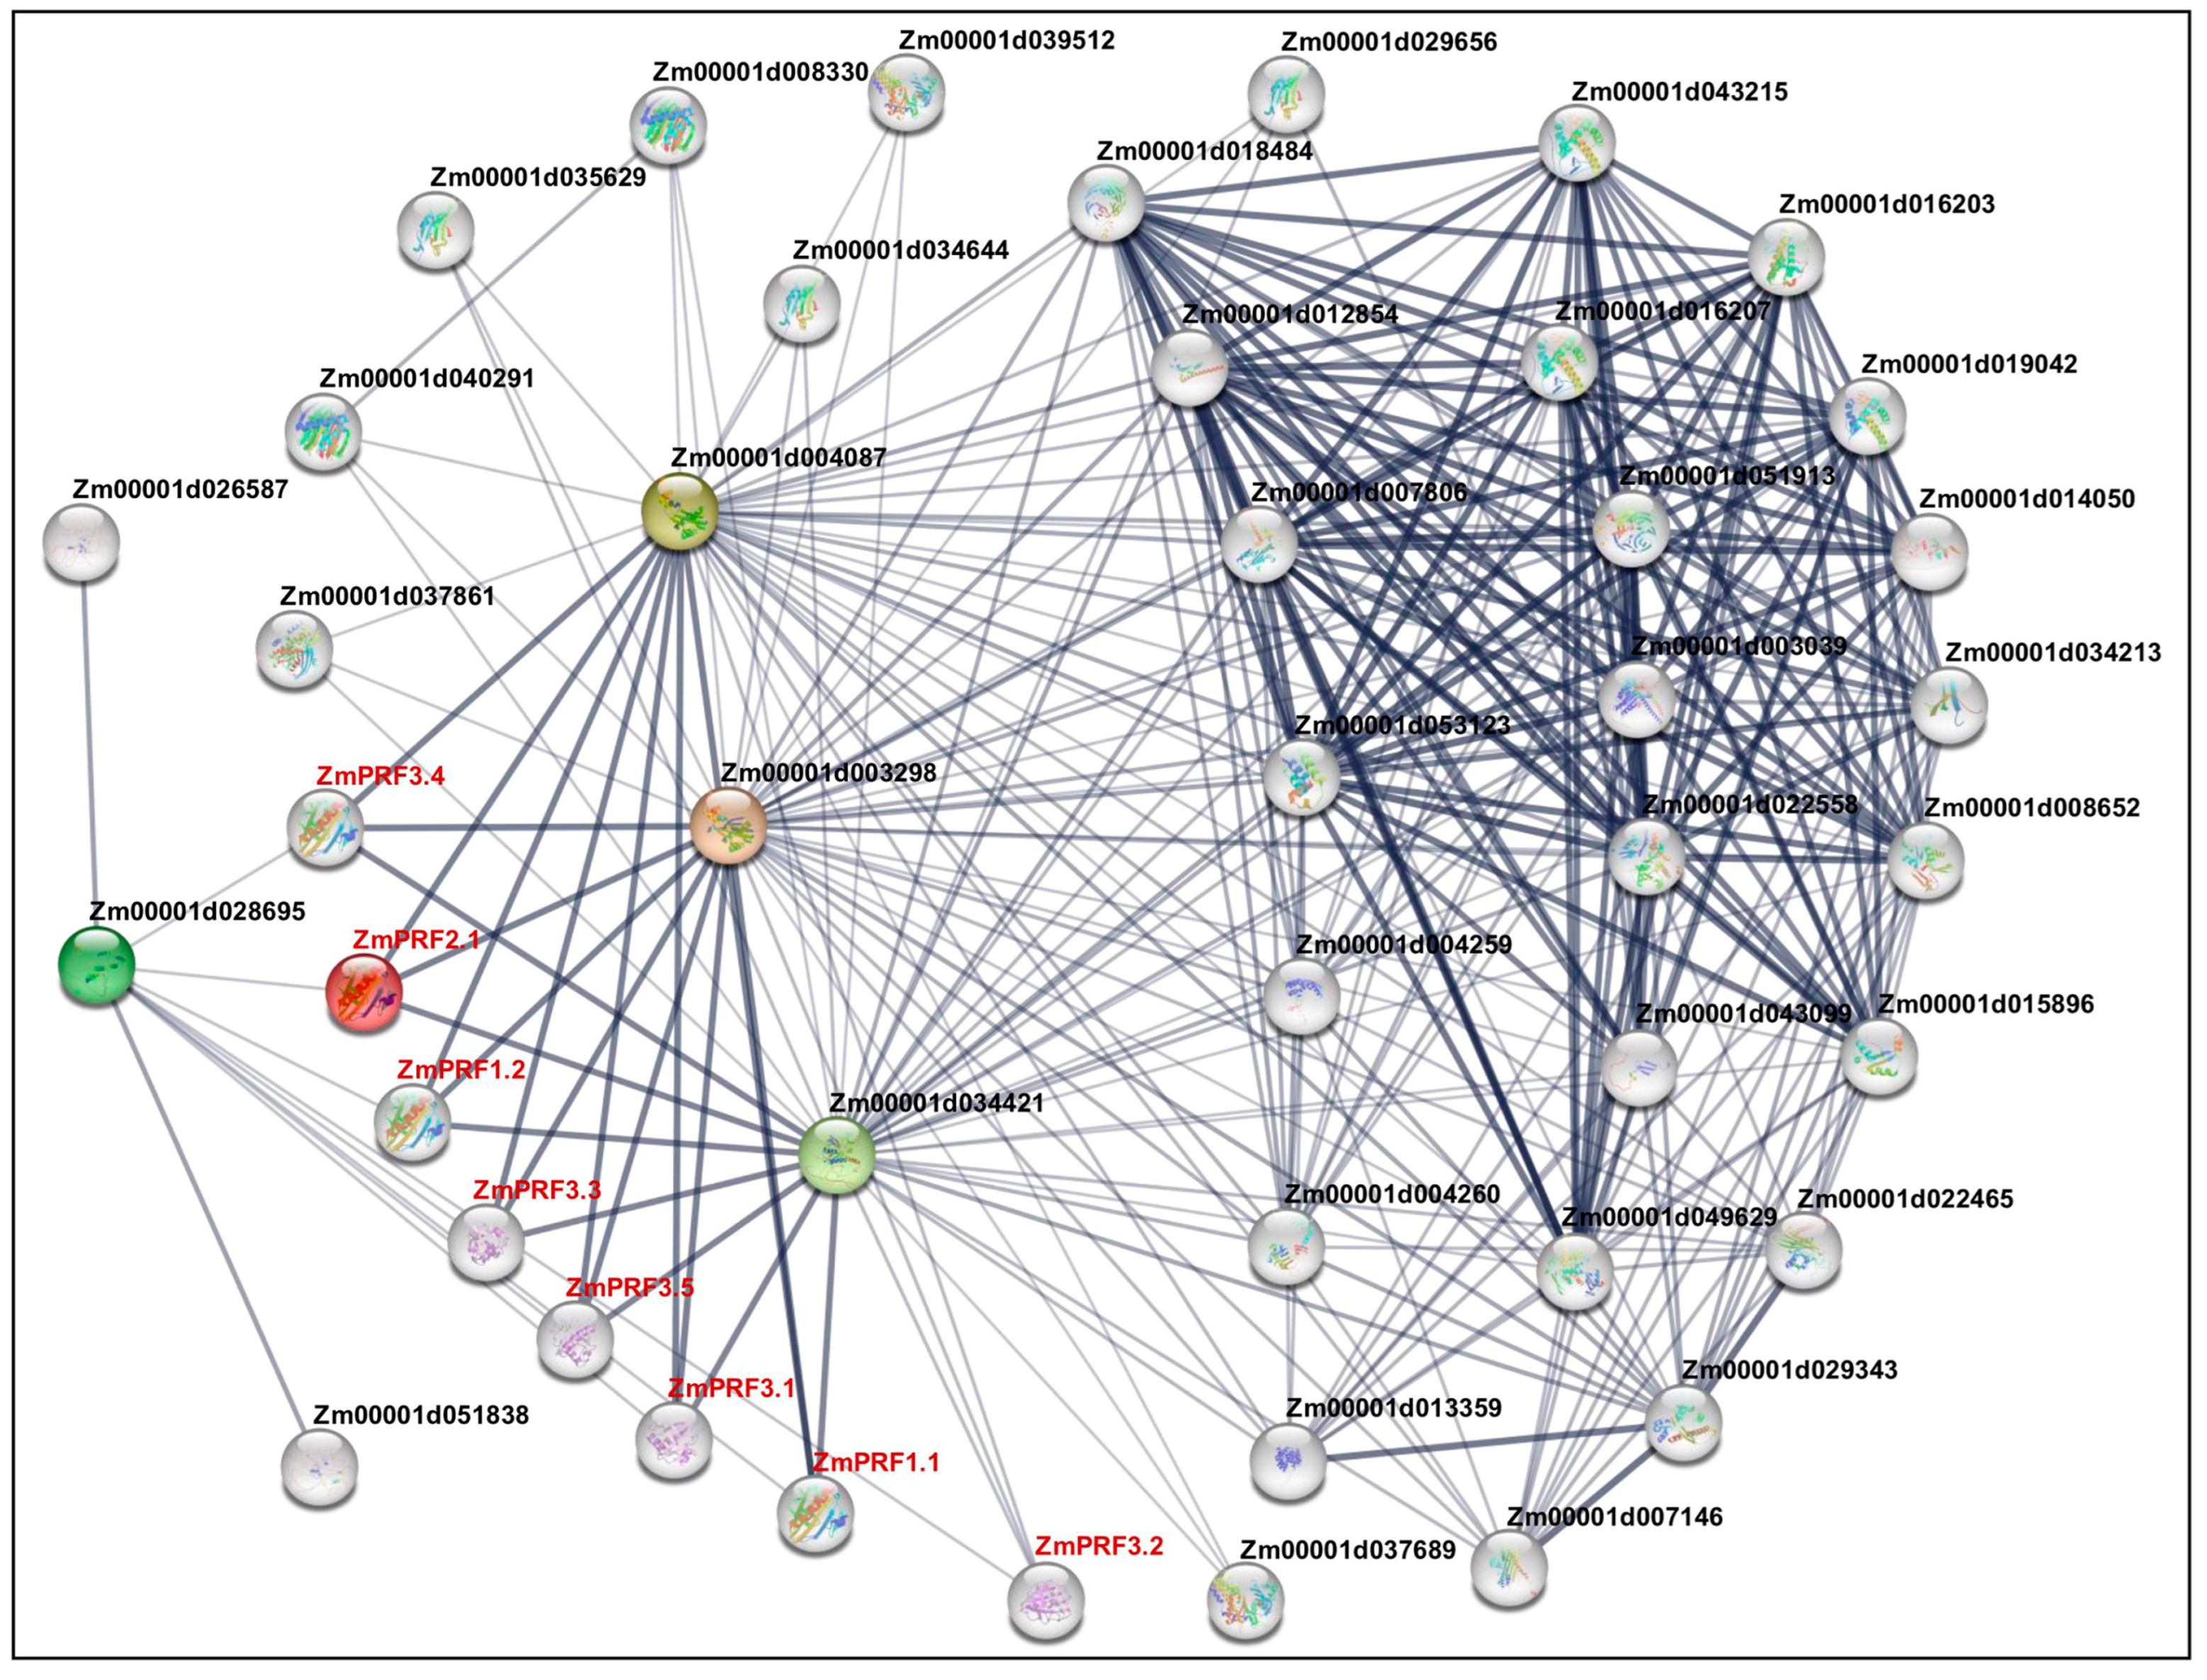
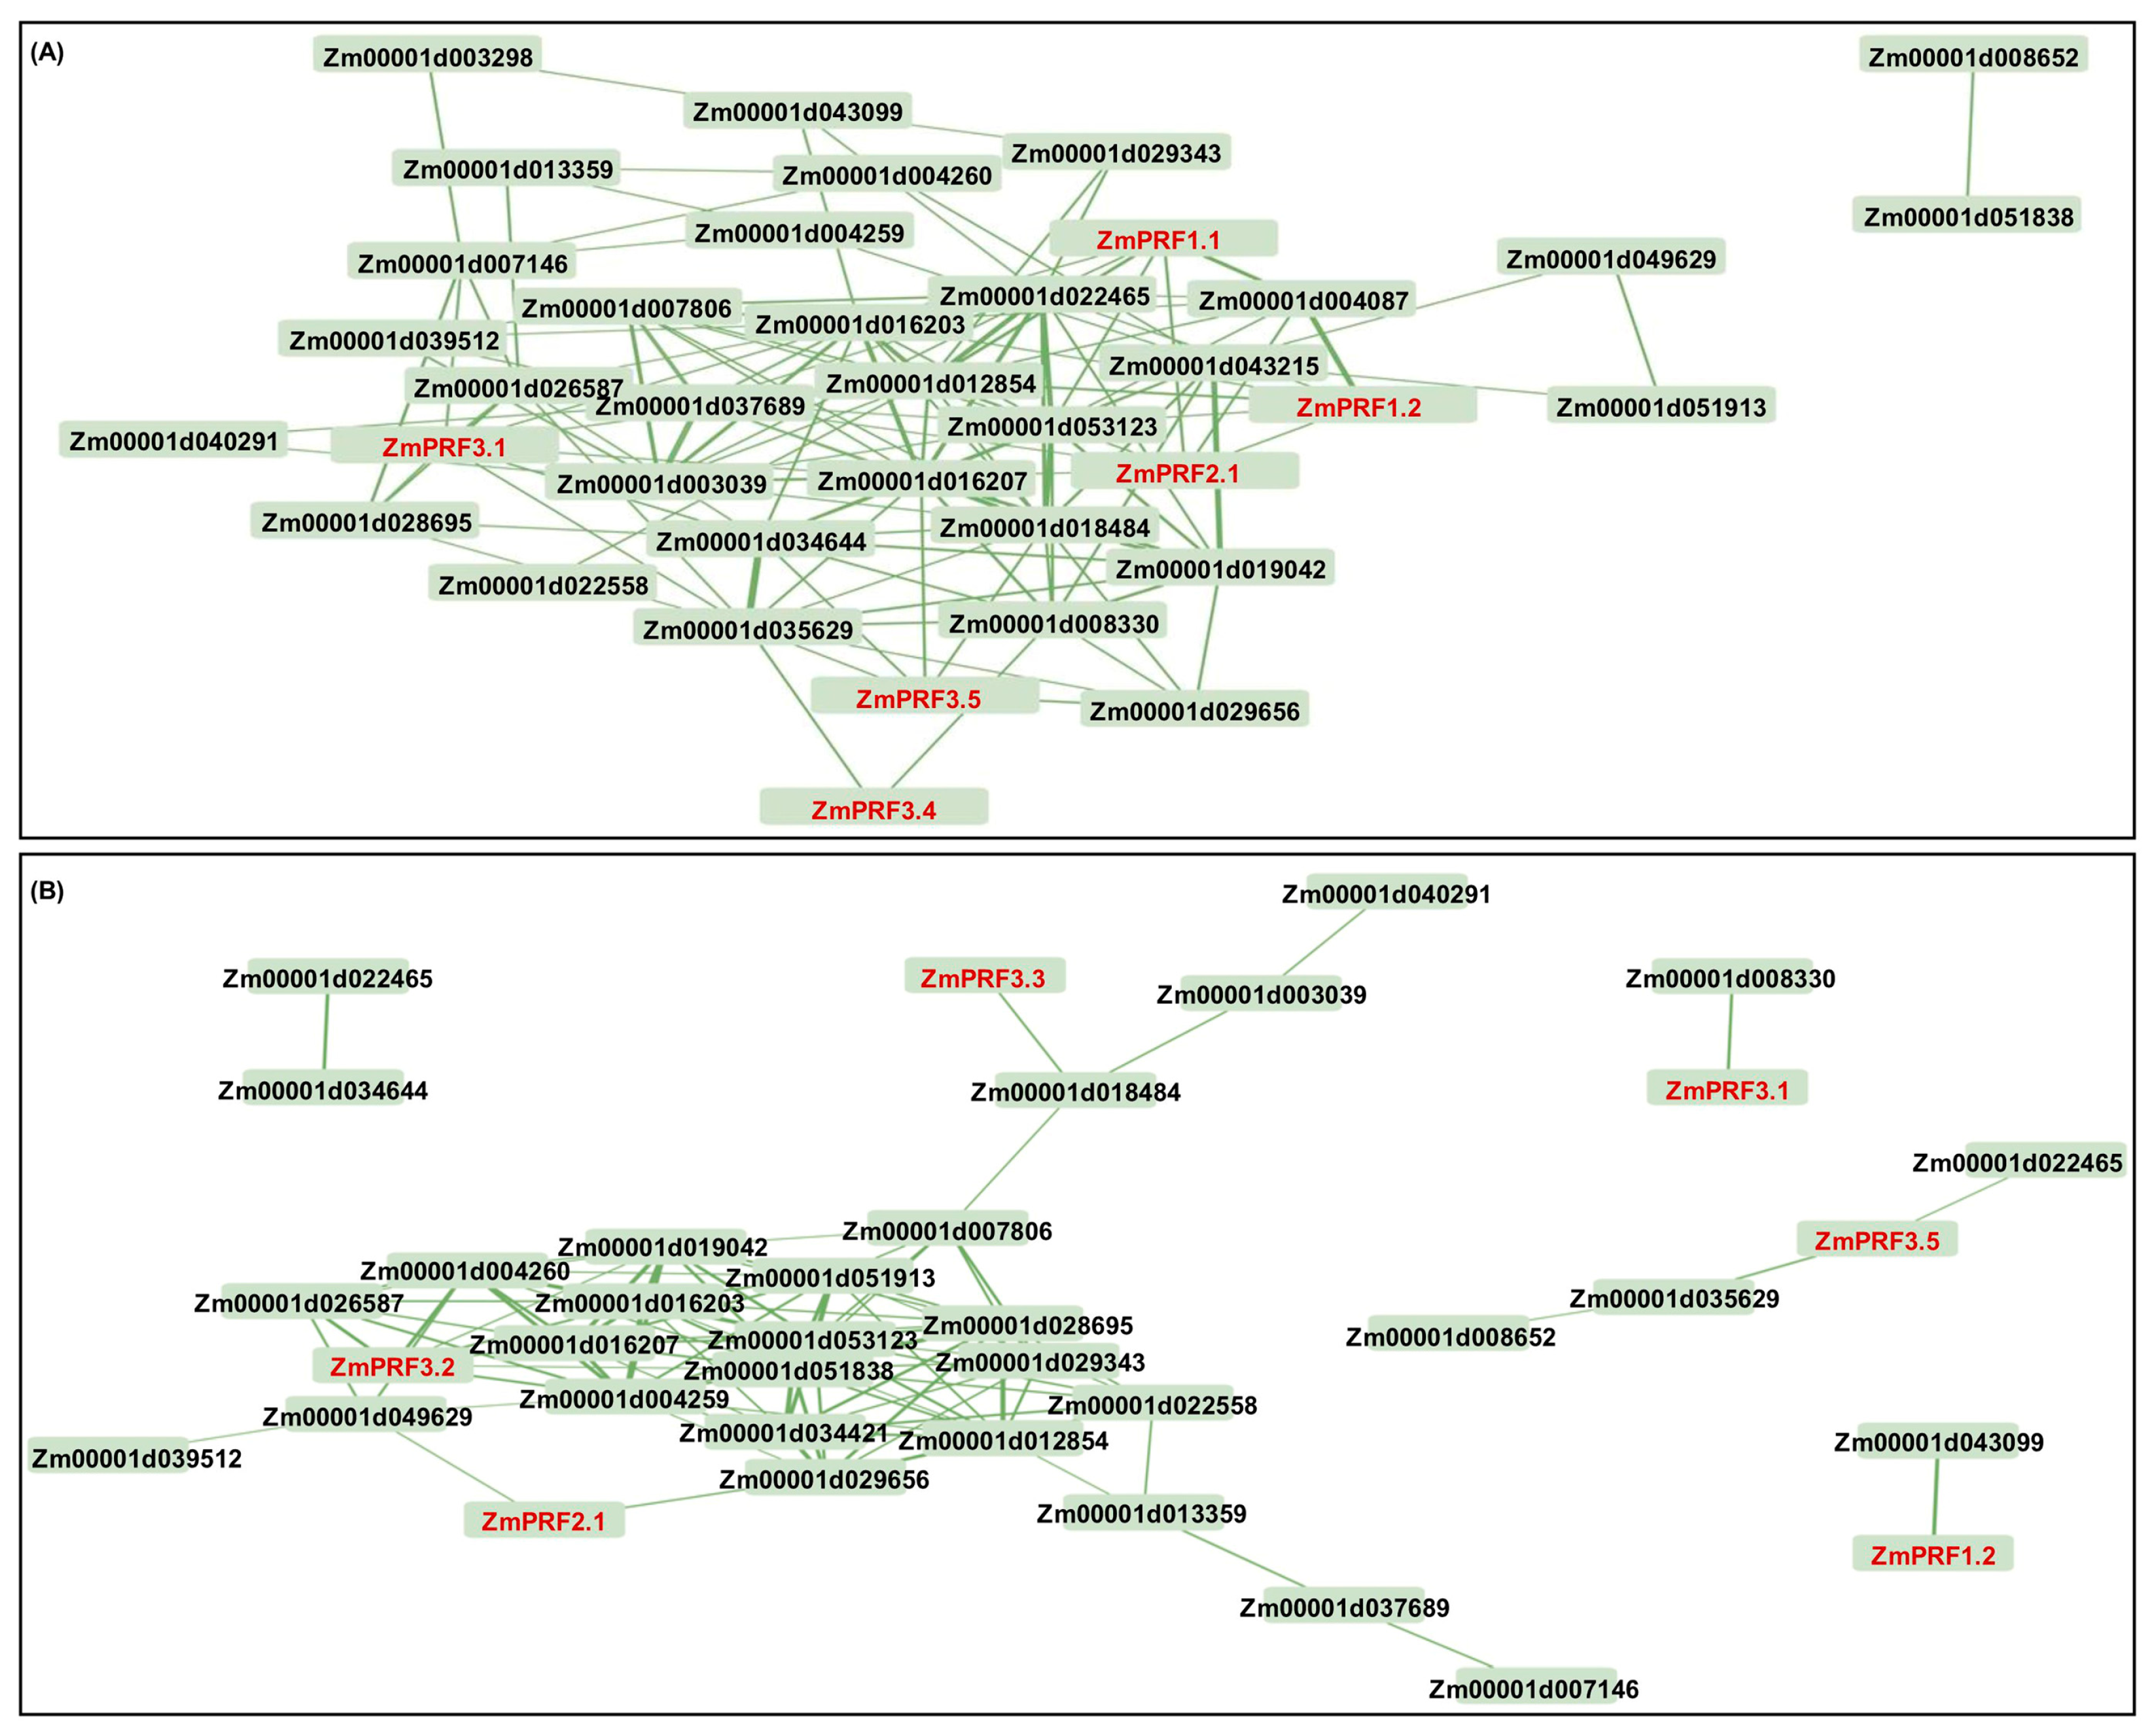
The construction of PPI networks to link unknown functional proteins are beneficial for understanding the myriad biological activities and dynamic regulatory networks among biomolecules. In this study, we tried to explore potential PPI networks among PRF proteins in maize, including their direct and indirect associations using the STRING database (https://cn.string-db.org/ (accessed on 10 July 2024)). Based on the criteria of PPI enrichment p-value < 1 × 10⁻¹⁶ and an average local-clustering coefficient of 0.502, a total of thirty-seven functional proteins, including twenty-two actin (ACT), three F-actin, three actin-depolymerizing factors (ADFs), two dynein, three hexokinase, two zinc finger C-x8-C-x5-C-x3-H-type family proteins, one protein modifier of SNC1 11, and one unknown protein (Zm00001d013359) (Table S3), they showed direct and indirect association with eight PRF proteins (Figure 4). Subsequently, the Gene Ontology (GO) enrichment analysis of these 45 proteins was performed: the main categories were “actin filament depolymerization”, “negative regulation of actin filament polymerization”, “negative regulation of cytoskeleton organization”, “cell morphogenesis”, “negative regulation of organelle organization”, “negative regulation of cellular process”, “negative regulation of biological process”, and “response to stimulus” for the biological process, as well as the “cell cortex” and “cell periphery” for the cellular component (Figure S3). Thereby, these findings may reveal that they formed complex interaction networks to regulate cytoskeletal organization, actin filament dynamics, cell morphogenesis, and stress responses in maize.

2.7. PRF Gene Members Involved in Plasticity Elongation of Both Mesocotyl and Coleoptile in Maize Under Multiple Abiotic Stresses

The MES and COL are important tissues for early seedlings in maize to sense various abiotic stresses and signal molecules, determining the morphological formation of maize seedlings [26,28,29]. To reveal whether ZmPRF gene members regulated the plasticity elongation of both MES and COL in maize under different abiotic stresses, the following corresponding MES and COL were selected among different maize genotypes under diverse abiotic stresses to analyze the expression levels of eight PRF gene members by RNA-Seq and qRT-PCR analyses.
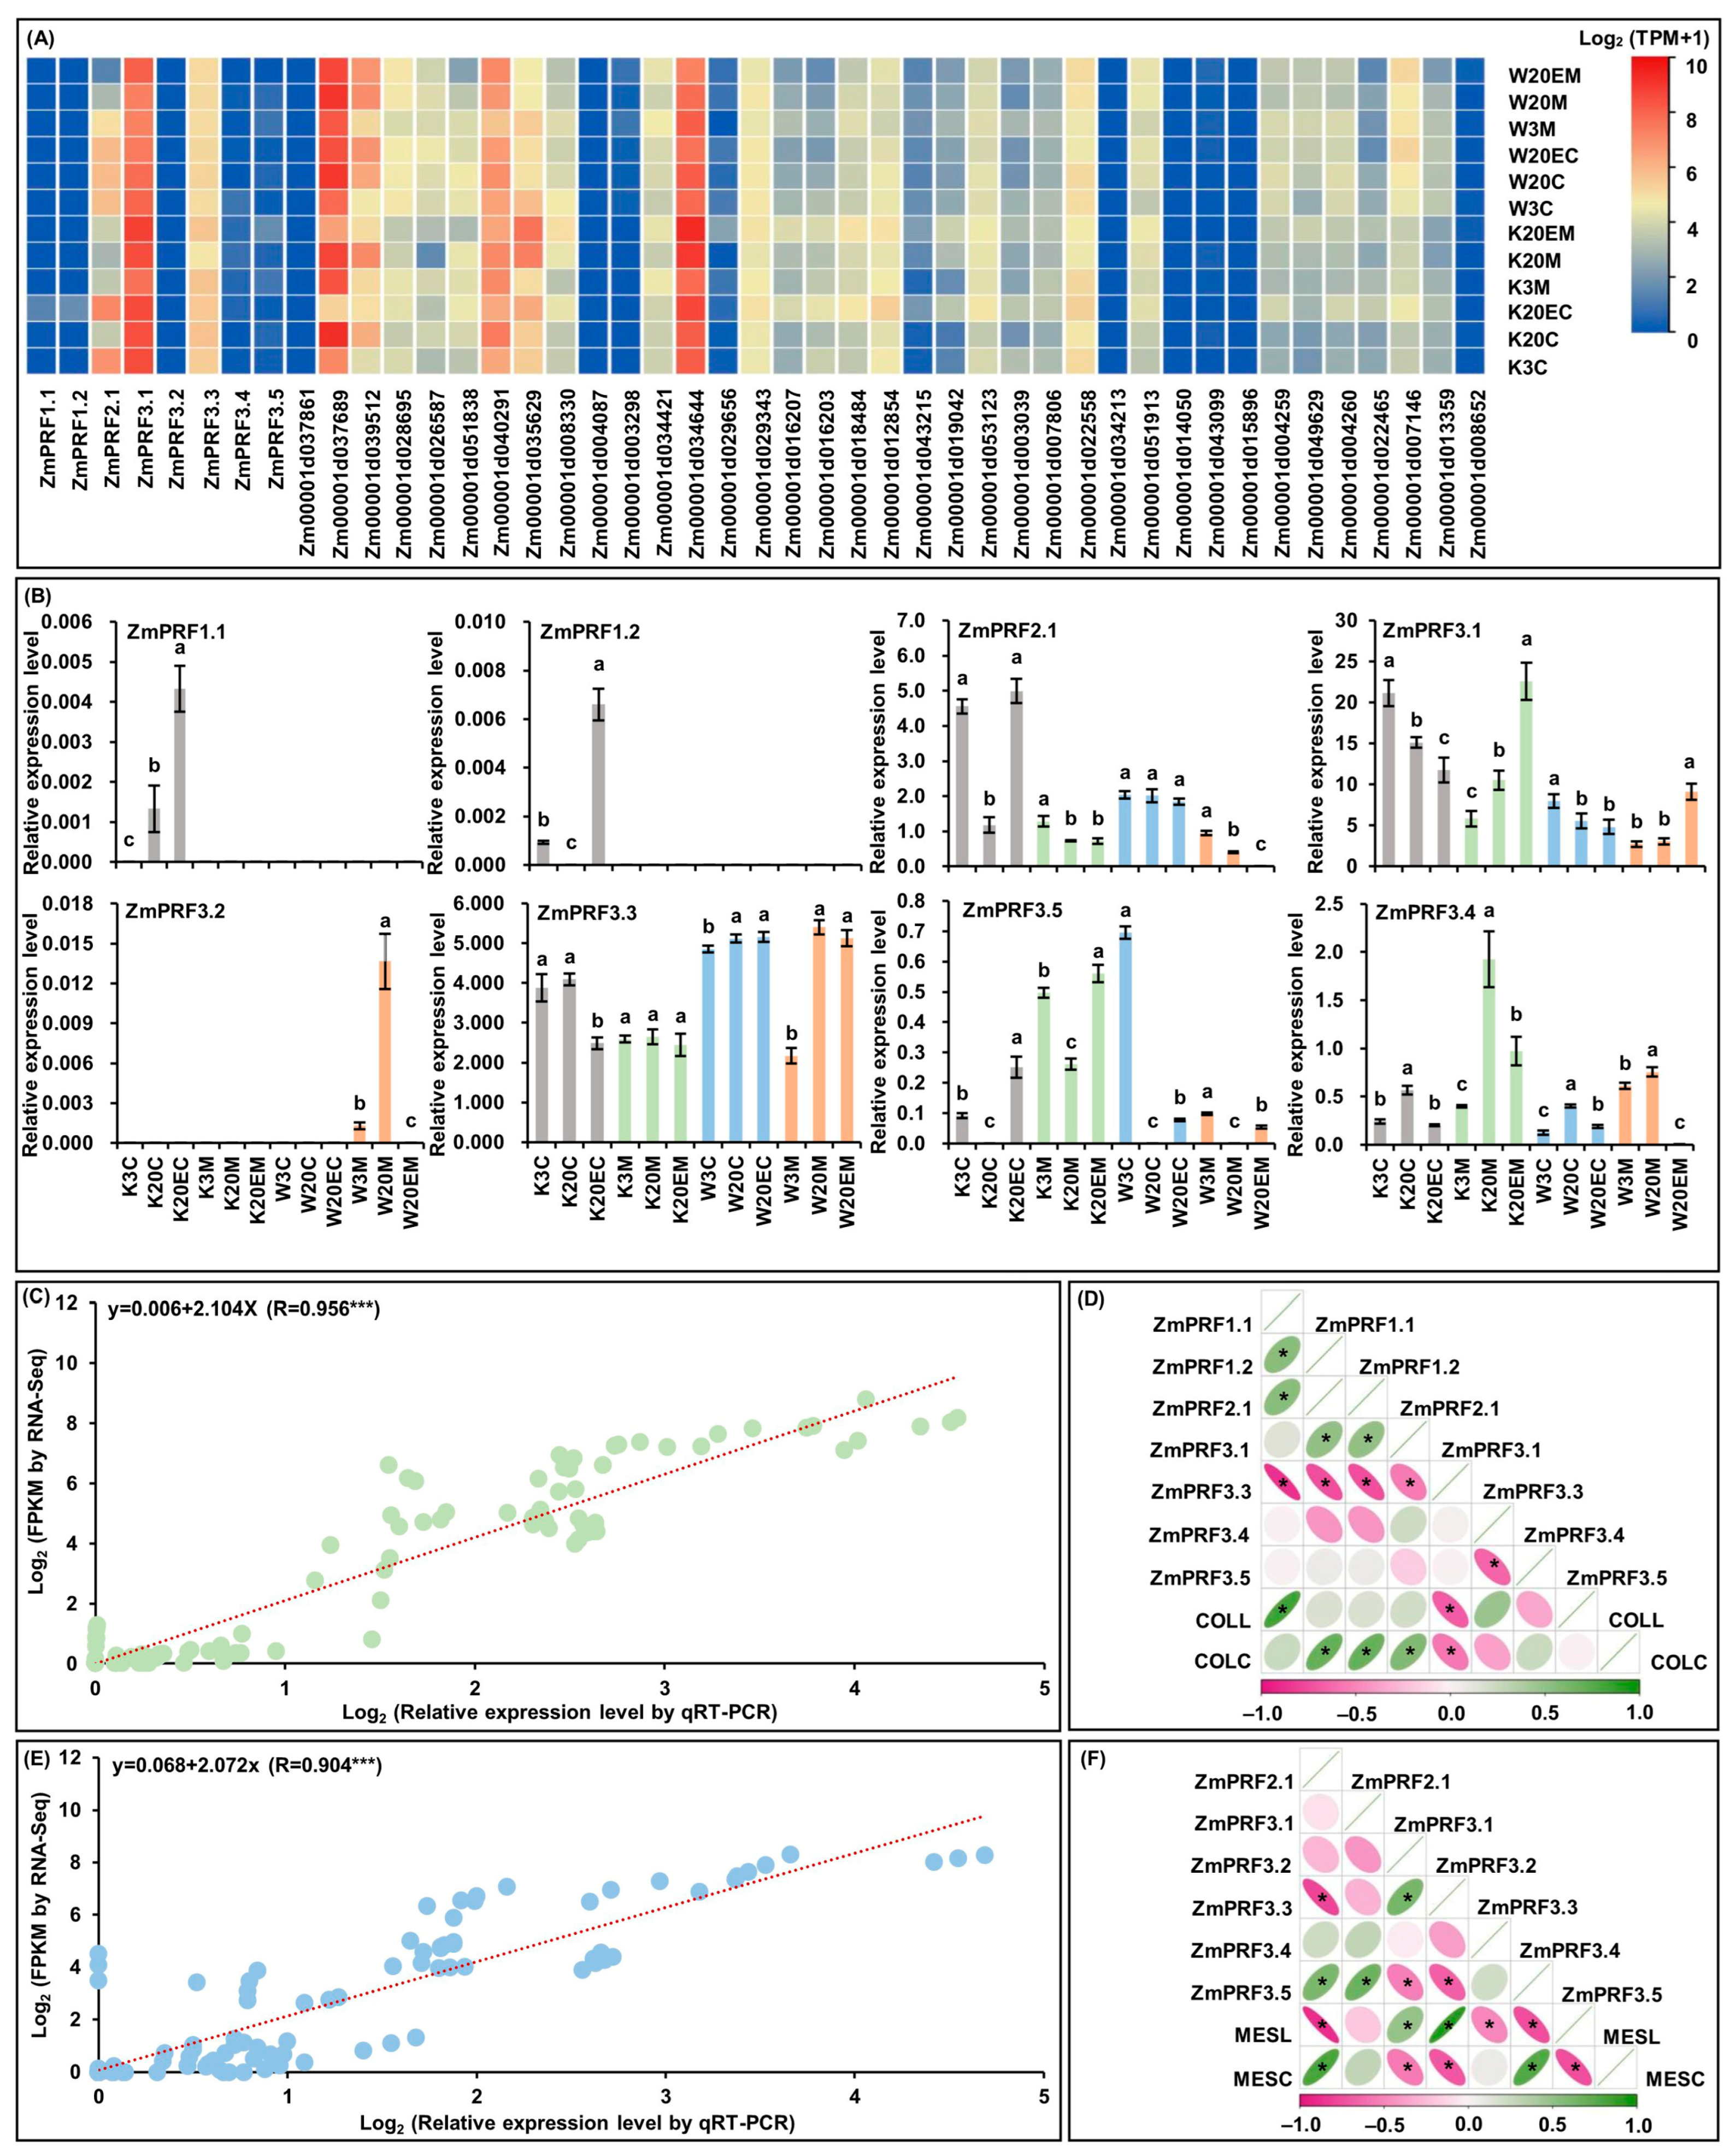
For RNA-Seq of MES and COL in W64A (deep-sowing tolerant genotype) and K12 (intolerant genotype) seedlings, that were cultured under two sowing-depth treatments and exogenous EBR stimulation for ten days [28,29]. Interestingly, the results showed that eight PRF genes members and their thirty-seven interacting genes had varied transcript-per-million (TPM) expression levels in both tissues of W64A and K12 seedlings under all treatments (Figure 5A; Table S4). At the same time, these ZmPRF gene members were then performed the qRT-PCR analysis in two tissues of both maize genotypes under three treatments (Figure 5B). The results showed that the qRT-PCR expression patterns were in agreement with eight ZmPFR genes in RNA-Seq dataset, and there was a good linear relationship between RNA-Seq expression levels and qRT-PCR expression patterns in MES (y = 0.068 + 2.072x; R = 0.904 ***)/COL (y = 0.006 + 2.104x; R = 0.956 ***) of both maize materials under all treatments (Figure 5C,E). According to the plasticity elongation phenotypes and ZmPRF qRT-PCR expression in MES and COL of W64A and K12 seedlings under all treatments, further Pearson correlation analysis showed that coleoptile length (COLL) was significantly correlated to the expression levels of ZmPRF1.1 and ZmPRF3.3, and coleoptile coarse (COLC) was significantly correlated to the expression levels of ZmPRF1.2, ZmPRF2.1, ZmPRF3.1, and ZmPRF3.3 (Figure 5D); similarly, mesocotyl length (MESL) was clearly correlated to the expression levels of ZmPRF2.1, ZmPRF3.2, ZmPRF3.3, ZmPRF3.4, and ZmPRF3.5, and mesocotyl coarse (MESC) was clearly correlated to the expression levels of ZmPRF2.1, ZmPRF3.2, ZmPRF3.3, and ZmPRF3.5 (Figure 5F). These findings thus suggested that the activated or inhibited ZmPRF genes members could regulate the plasticity elongation of MES and COL in maize under deep-sowing stress and EBR stimulation.
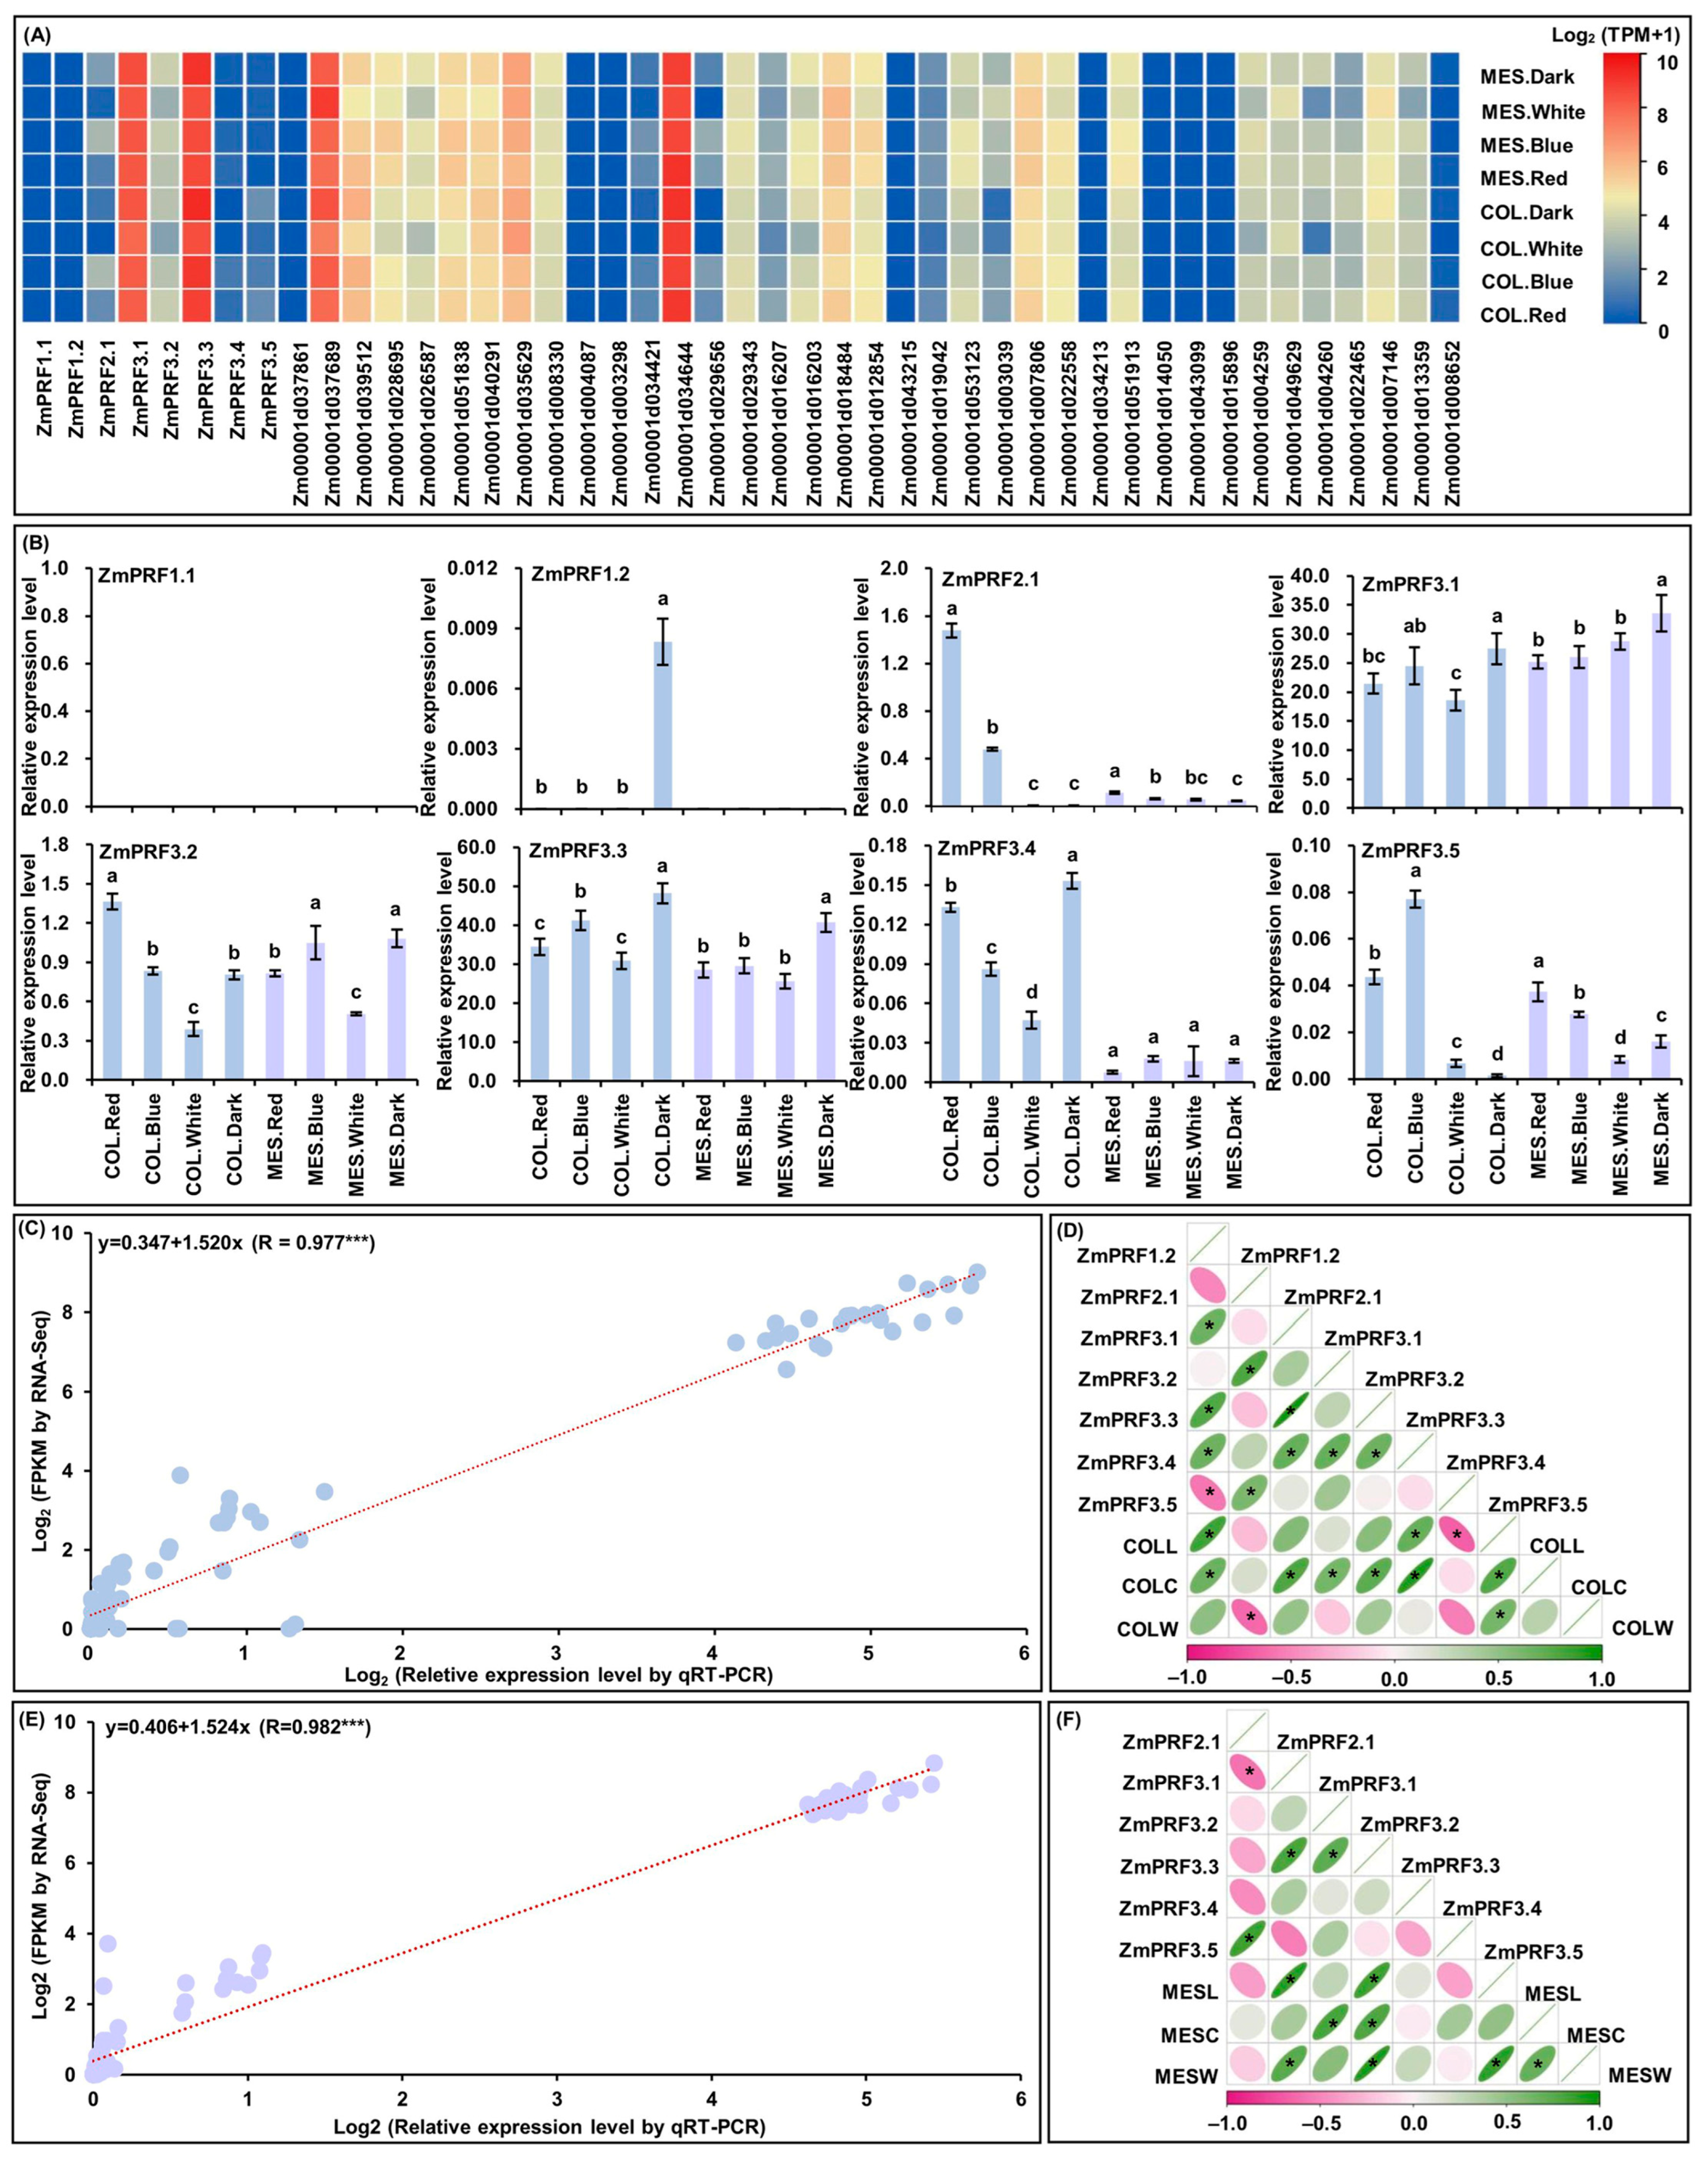
For RNA-Seq of MES and COL in Zheng58 seedlings, that were cultured four treatments for five days [26]. Intriguingly, the results showed that there were abundant TPM expression profiles of eight ZmPRF gene members and their thirty-seven interacting genes in both MES and COL of Zheng58 seedlings under all treatments (Figure 6A; Table S5). Subsequently, the qRT-PCR expression levels of these ZmPRF genes in MES and COL of Zheng58 under all treatments were further analyzed, and showing that the expression patterns from qRT-PCR and RNA-Seq analyses existed similar expression levels of up- or down-regulation (Figure 6B), and there was a good linear relationship between RNA-Seq dataset and qRT-PCR expression levels in MES (y = 0.406 + 1.524x; R = 0.982 ***)/COL (y = 0.347 + 1.520x; R = 0.977 ***) of Zheng58 seedlings under four light treatments (Figure 6C,E). Based on the plasticity elongation phenotypes and ZmPRF genes qRT-PCR expression in MES and COL of Zheng58 seedlings under four light treatments, their Pearson correlation analysis showed that COLL was significantly correlated to the expression levels of ZmPRF1.2, ZmPRF3.4, and ZmPRF3.5, COLC was significantly correlated to the expression levels of ZmPRF1.2, ZmPRF3.1, ZmPRF3.2, ZmPRF3.3, and ZmPRF3.4, and coleoptile weight (COLW) was significantly correlated to the expression level of ZmPRF2.1 (Figure 6D); similarly, MESL was clearly correlated to the expression levels of ZmPRF3.1 and ZmPRF3.3, MESC was clearly correlated to the expression levels of ZmPRF3.2 and ZmPRF3.3, and mesocotyl weight (MESW) was clearly correlated to the expression levels of ZmPRF3.1 and ZmPRF3.3 (Figure 6F). These findings thus indicated that different light spectral-quality irradiation could induce the up-/down-regulation of ZmPRF genes members in both MES and COL of maize, to determine their plasticity elongation.

3. Discussion

It is reported that the PRF family is ancient, universal, and functionally diverged across kingdoms, and that it regulates various development processes of plant cells, especially cell wall maintenance through actin sequestering, nucleation and cytokinesis [30]. In long plant evolution, PRF sequences were identified in bryophytes and gymnosperms, which evolved approximately 400 and 300~325 million years ago, respectively, and these occurrences preceded the emergence of angiosperms, showcasing unexpectedly high functional homology [31]. In addition, their functional divergence in different species implied both subfunctionalization and neofunctionalization [32]. Based on these considerations, we identified eight ZmPRF gene members in maize genome and revealed their potential functions and evolution in the present study.
Our evolutionary analysis showed that forty-six PRF proteins from seven plant species, including both dicotyledons (Arabidopsis thaliana, Brassica juncea, Gossypium hirsutum, and Glycine max,) and monocotyledons (Oryza sativa, Sorghum bicolor, Triticum aestivum, and Zea mays), were clearly divided into four classes (Figure 1B), which was consistent with the phylogenetic tree analysis of PRF proteins in Brassica species [22]. These findings thus suggested that these PRF sequences from monocot species and dicot species have a common evolutionary origin. For example, ZmPRF3.1 and ZmPRF3.3 in Class I were more closely related to Sorghum bicolor SbPRF5, ZmPRF1.1 and ZmPRF1.2 in Class II were more closely related to Oryza sativa OsPRF1, ZmPRF3.5 in Class II was more closely related to SbPRF3, ZmPRF2.1 in Class III was more closely related to Gossypium hirsutum GhPRF3, and ZmPRF3.4 and ZmPRF3.2 in Class IV were more closely related to SbPRF4 (Figure 1B). Except for SbPRF2, there existed two exon regions, and SbPRF4 had five exon regions; other PRF genes members from seven species showed three exon regions (Table S1), and previous exon–intron analysis also reported that twenty-three Brassica juncea PRFs consisted of three exon regions [22]. Similarly, for these eight maize PRF genes, we identified three exon regions that were separated by intron regions of different sizes (Figure 2B). Moreover, ZmPRF3.3 had the largest intron region among all maize PRF genes (Figure 2B). In addition, the UTR sequences, an important regulatory region for RNA transcription, RNA translation and RNA stability [32], also showed obvious differences among these maize PRF gene members (Figure 2B). This may be associated with the variation in expression patterns of the PRF genes in both maize tissues under different abiotic stresses and hormone treatments.
In Brassica juncea, except for BjPRF3-4 that was a hydrophobic protein, other 22 BjPRF members were hydrophilic proteins [22]. Unlike dicot Brassica juncea, in monocot maize, nearly 90% (seven) PRF proteins showed hydrophobic proteins (Table 1). It is thus speculated that the hydrophobicity of PRF proteins in monocot species may drive the folding of proteins’ complex structures, forming their stable structures [33]. As is well known, the primary forces driving the emergence of new family members and novel functions in plant evolution are undergoing segmental duplication and tandem duplication [34]. In this study, only one pair of segmentally duplicated genes was identified in maize PRF gene members (Figure S1). This implied that the evolution of maize PRF genes was dominated by segmental duplication, which may play a pivotal role in the expansion of the PRF gene family in maize. Certainly, our genomic collinearity analysis of the PRF family from seven species identified numerous collinear gene pairs, the presence of collinear relationships in Zea mays and Sorghum bicolor with three pairs, Zea mays and Oryza sativa with one pair, Zea mays and Triticum aestivum with two pairs, Triticum aestivum and Sorghum bicolor with one pair, Triticum aestivum and Oryza sativa with three pairs, and Glycine max and Gossypium hirsutum with six pairs, as well as Arabidopsis thaliana and Brassica juncea with sixteen pairs (Figure S2; Table S2). Thereby, these data suggest that the PRF family are highly conserved. Additionally, subcellular localization prediction can locate a certain protein or expression product at a cell-specific location, providing a research direction for elucidating gene mechanisms [35]. Like twenty-three PRF proteins from Brassica juncea, eight maize PRF proteins were mainly located in the chloroplast, cytoplasm, and mitochondrion (Table 1), indicating that PRF genes act on these organelles and perform different biological functions in various plant species. Previously, Park et al. [36] also reported that when plants respond to the innate immunity response, chloroplasts generated tubular structures to facilitate chloroplast movement towards the nuclei, and the microtubules and actin filaments provided direction and driving force during these changes. Notably, to further verify the results of subcellular prediction, it is necessary to analyze the instantaneous expression of ZmPRFs in tobacco leaves using Agrobacterium-mediated methods and observe the fluorescence signals by laser confocal microscopy, in the future.
Initially, identifying their role in actin sequestration/binding, which thus actively contributes to the dynamics of actin polymerization [22], increasing evidence has revealed diverse functions of PRF proteins across different plant species, such as increased PRF transcription correlated with a proportional improvement in F-actin levels by a RNA-Seq analysis of 10-day post-anthesis fiber tissues across different cotton cultivars, resulting in regulating cotton-fiber elongation [37]. Overexpression of AtPRF3 resulted in significant decreases in root length and hypocotyl length, and in delayed seed germination in Arabidopsis thaliana [38]. Using pronp1 (a PRF gene) transgenic Nicotiana tabacum plants, revealed a prominent expression of pronp1 in mature pollen and elongating pollen tubes, and significant activity in the root hairs of developing seedlings [39]. Domestication-driven GhPRF1 transduced the early-flowering phenotype in Nicotiana tabacum by spatial alteration of apical/floral-meristem-related gene expression [16]. Triticum aestivum PRFs had aberrant distribution in root-tip cells of seedlings exposed to enhanced UV-B radiation, influencing the cell-elongating axis during the telophase [40]. The specific members of PRFs and ADFs might participate in regulating the response of wheat to low-temperature stress [41]. Similarly to the above previous studies, our promoter cis-elements of maize PRF genes confirmed that these genes may be involved in maize growth and development, stress adaption, light response, and hormone stimulation (Figure 3). Moreover, it is possible to form a complex interaction network among multiple PRF, ACT, F-actin, ADF, denein, and hexokinase proteins, to control various functions in maize (Figure 4).
Further, we found that these ZmPRFs showed positive/negative expression patterns, and they even interacted with multiple proteins to regulate the plasticity elongation of MES and COL in maize under diverse deep-sowing stress, exogenous EBR application, and light spectral-quality irradiation (Figure 5, Figure 6 and Figure 7). For example, the ZmPRF1.1 expression level was significantly up-regulated in COL of the K12 genotype under 20 cm deep-sowing stress and 2.0 mg g−1 exogenous EBR stimulation, to positively regulate the length of the coleoptile in K12, implying that this gene shows tissue-expression specificity. ZmPRF3.3 showed varied expression patterns in MES and COL of three genotypes (W64A, K12, and Zheng58) under diverse deep-sowing stress, exogenous EBR application, and light spectral-quality irradiation; which was interacted with Zm00001d018484 (ACT), subsequently, their cooperation regulated the plasticity elongation of MES and COL in maize exposed to different light spectral conditions (Figure 7), including the remodeling of MES and COL phenotypes, as a potential core-conserved gene in the future. In addition, ZmPRF3.4 transcription showed significantly positive correlation with the length of the mesocotyl in maize under deep-sowing stress and exogenous EBR application; in contrast, it showed a clearly negative correlation with the length and coarse of coleoptile in maize under various light spectral-quality conditions. However, the observed diverse functions of ZmPRFs highlight the necessity for further exploration to unravel the intricate molecular mechanisms governing the involvement of ZmPRFs in other growth and development processes, while it is worth noting that we need to further verify their interaction relationships among ZmPRFs and other genes with yeast two-hybrid tests, in the future.

4. Materials and Methods

4.1. Genome-Wide Identification of PRF Gene Members

Five AtPRF genes were obtained from the Arabidopsis thaliana genome database (https://www.arabidopsis.org/ (accessed on 16 April 2024)), three OsPRF genes were downloaded from the Oryza sativa genome database (http://rice.plantbiology.msu.edu/ (accessed on 16 April 2024)), and twenty-three BjPRF genes were collected from the Brassicaceae genome database (http://brassicadb.cn/#/ (accessed on 16 April 2024)). We then used the HMM profile of the specific “PF00235” domain in the Pfam database (http://pfam.xfam.org/ (accessed on 16 April 2024)) to identify eight ZmPRF genes from the maize genome (http://ftp.ensemblgenomes.org/pub/plants/release-50/fasta/zea_mays/dna/ (accessed on 16 April 2024)) with the HMMER 3.0 software (http://hmmer.org/download.html (accessed on 20 April 2024)). Next, BLASTP comparisons were performed as a query, with the E-value < 1 × 10⁻⁵ [42]. After removing all redundant sequences, these ZmPRF genes were named using the nomenclature of Khuman et al. [22].

4.2. Sequence Analysis, Structural Characterization, Subcellular Localization Prediction, and Phylogenetic Tree of PRF Genes

The CDS, gDNA, and protein sequences of all PRF gene members from seven species were downloaded from the NCBI public database (https://www.ncbi.nlm.nih.gov/ (accessed on 11 May 2024)), respectively. The amino acid numbers, MW, theoretical pI value, instability index, aliphatic index, and GRAVY of these PRF proteins were further determined using the ExPASy (https://web.expasy.org/protparam/ (accessed on 13 May 2024)). The MG2C v.2.1 (http://mg2c.iask.in/mg2c_v2.1/ (accessed on 14 May 2024)) [43] was utilized to generate a physical map depicting the localization of PRF genes on maize chromosomes. The exon–intron structure of all maize ZmPRFs were displayed by the Gene Structure Display Server (GSDS2.0; http://gsds.cbi.pku.edu.cn/ (accessed on 15 May 2024)). The conserved motifs of corresponding PRF proteins were predicted via the MEME suite program v.5.0.5 (http://meme-suite.org/ (accessed on 4 June 2024)), with the maximum number of motifs set to 15 [44]. The subcellular localization prediction of these PRF proteins was also performed, using the Plant-mPLOC program (http://www.csbio.sjtu.edu.cn/bioinf/plant-multi/ (accessed on 19 June 2024)). The NJ phylogenetic tree of all PRF proteins was further conducted using the molecular evolutionary genetics analysis software (MEGA 6.0; https://www.megasoftware.net/ (accessed on 29 June 2024)) [45].

4.3. Cis-Element Analysis of PRF Genes

The PlantCARE online tool (http://bioinformatics.psb.ugent.be/webtools/plantcare/html/ (accessed on 3 July 2024)) [46] was used to analyze the initiation codon (ATG) 2000 bp upstream sequence of the promoter sequence from eight maize PRF gene members.

4.4. Duplication Events and Collinearity Analysis of PRF Genes

The MCscanX v.1.5.1 (https://help.rc.ufl.edu/doc/MCScanX (accessed on 2 July 2024)) [47] was used to detect maize PRF duplication and collinearity analysis, and Circos v.069 (https://circos.ca/ (accessed on 5 July 2024)) [48] was applied to provide a visual representation of the synteny blocks between PRF genes from seven species, including Arabidopsis thaliana, Brassica juncea, Gossypium hirsutum, Glycine max, Oryza sativa, Sorghum bicolor, Triticum aestivum, and Zea amys. Following that, the KaKs_Calculator 2.0 (https://sourceforge.net/projects/kakscalculator2/ (accessed on 11 July 2024)) [49] was employed for Ka and Ks substitution rates for each duplicated pair of PRF genes.

4.5. Protein–Protein Interaction (PPI) Network Prediction and Their GO Annotation

The STRING v.12.0 (https://cn.string-db.org/ (accessed on 24 July 2024)) was used to construct a PPI network among PRF proteins and other proteins in maize [50]. The STRING database can systematically collect and integrate PPI in both physical interactions and functional associations, and provides tools for GO enrichment analysis and Kyoto Encyclopedia of Genes and Genomes (KEGG) pathway analysis [50]. In this study, k-means clustering from STRING was utilized to cluster genes based on the evidence score, with a PPI enrichment p-value < 1 × 10⁻¹⁶ and an average local-clustering coefficient of 0.502.

4.6. Expression Patterns of PRF Genes and Their Interacting Genes Under Diverse Abiotic Stresses

For our previous studies [28,29], briefly, the 100 mL of 0.0 (ddH2O) and 2.0 mg g−1 EBR solution was mixed with 100 g dry vermiculite to prepare two cultivation substrates, respectively, which were then put into PVC tubes (50 cm height, 17 cm diameter); next, 30 soaked seeds (with 2.0 mg g−1 EBR solution or ddH2O for 24 h in darkness, respectively) of W64A and K12 were sown in corresponding PVC tubes that contained 2.0 mg g−1 EBR solution and ddH2O cultivation substrates at 3 cm and 20 cm sowing depths, respectively. In total, there were three treatments, i.e., 3 cm sowing depth + 0 mg g−1 EBR solution, 20 cm sowing depth + 0 mg g−1 EBR solution, and 20 cm sowing depth + 2.0 mg g−1 EBR solution. These were then cultured in a greenhouse (22 ± 0.5 °C, with 12/12 h light/dark cycle, and 60% relative humidity) for 10 days, and 40 mL corresponding EBR solution was added at 2-day intervals. Then MES and COL of W64A and K12 seedlings under three treatments, with three replicates, 36 samples in total, were used to perform RNA-Seq and measure their phenotypes, including MESL, COLL, MESC, and COLC, respectively [28,29].
For our previous study [26], briefly, the sterilized seeds of Zheng58 (i.e., the female parent of Zhengdan958 cultivar, China [51]) were soaked for 24 h in darkness, and were then pre-cultured in germinating boxes for five days at 22 ± 0.5 °C in darkness. Next, these etiolated seedlings were continuously cultured in plant chambers and illuminated with lamps consisting of three light-emitting diode (LED) bars specifically designed to provide a custom spectrum, i.e., red light: peak wavelength 660 nm, photosynthetic photon flux density (PFD) 22 µM m−2 s−1, 12 h photoperiod, blue light: peak wavelength 450 nm, PFD 13 µM m−2 s−1, 12 h photoperiod, and white light: PFD 17 µM m−2 s−1, 12 h photoperiod, in each chamber, respectively. Control etiolated seedlings were still cultured in darkness. The 20 mL Hoagland solution was added to each box at 2-day intervals, and to the other culture environment with 22 ± 0.5 °C, and 70% relative humidity was maintained. Then, MES and COL of Zheng58 seedlings under four treatments, with three biological replicates, a total of twenty-four samples, were used to perform RNA-Seq and measure their phenotypes, including MESL, COLL, MESC, COLC, MESW, and COLW, respectively [26].
After filtering, all clean reads were obtained and aligned to the Zea mays B73_v4 reference genome (ftp://ftp.ensemblgenomes.org/pub/plants/release-6/fasta/zea_mays/dna/ (accessed on 18 December 2023)) using HISAT 2.2.1 (http://ccb.jhu.edu/software/hisat2 (accessed on 18 December 2023)). The corresponding data were then analyzed using HTSeq v.0.9.0 (http://htseq.readthedocs.io/en/release_0.9.1/ (accessed on 18 December 2023)) based on the read count data obtained from expression profiling and calculated fragments per-kilobase-per-million mapped (FPKM) [52]. Meanwhile, their transcripts-per-million (TPM) values of corresponding genes based on the normalized scale method were calculated [53]. The gene-expression profiling was visualized using TBtools v.2.030 software (https://github.com/CJ-Chen/TBtools-II/releases (accessed on 3 August 2024)), according to the above predicted results of the PPI networks, using the FPKM expression patterns of these PPI genes from our independent RNA-Seq analyses to verify their interaction networks, using Cytoscape v.3.7.1 (https://cytoscape.org/ (accessed on 25 August 2024)).

4.7. qRT-PCR Analysis of PRF Genes

The same total RNA as our previous RNA-Seq [26,28,29] was reverse-transcribed to produce first-strand cDNA using the PrimeScriptTM first-strand cDNA synthesis Kit (TaKaRa, Japan). The special primers of eight ZmPRF genes were designed using Primer3web v.4.1.0 (https://primer3.ut.ee/ (accessed on 16 August 2024)) (Table S6). The LightCycler480II fluorescent quantitative PCR instrument (Roche, Munich, Germany) was used for ZmPRF qRT-PCR analysis. Actin-1 (Zm00001d010159) was used as the internal reference gene [26]. There were three replicates for gene relative-expression analysis, and the relative gene-expression level was calculated by the 2−ΔΔCT method [26].

4.8. Statistical Analyses

The analysis of variance (ANOVA) of qRT-PCR expression levels of eight ZmPRF genes was performed using IBM-SPSS Statistics v.19.0. The linear-relationship analysis between qRT-PCR expression levels and RNA-Seq FPKM expression patterns among all ZmPRF genes was performed by IBM-SPSS Statistics v.19.0. Further, all phenotype observations of MES and COL [26,28,29] and the corresponding qRT-PCR expression levels of these ZmPRF genes were used to analyze their Pearson correlation relationships and to visualize them via the online Genescloud tool (https://www.genescloud.cn (accessed on 18 August 2024)).

5. Conclusions

This study provided the comprehensive identification and analysis of ZmPRF gene members in maize. A total of eight identified ZmPRF gene members were unevenly distributed on five chromosomes. The analyses of gene structure, conserved motifs, and the phylogenetic tree showed that these ZmPRFs sequences were conserved, structurally similar, and divided into four categories. Notably, segmental duplication was found to be the main reason for family expansion during the evolution of maize ZmPRFs. Further Ka/Ks analysis revealed that most ZmPRF genes were intensely purified and selected. PPI prediction found that thirty-seven corresponding proteins were interacted with eight PRF proteins in maize, which were involved in actin cytoskeleton regulation, cell morphogenesis, and stress responses in maize. Multiple growth-and-development elements, stress-adaption elements, hormone-response elements, and light-response elements were identified in the promoter region. Moreover, by combining multiple analyses including RNA-Seq, qRT-PCR, Pearson correlation, and interaction network mapping, we confirmed that most ZmPRFs and their multiple interacting genes formed a complex interaction network to regulate MES/COL plasticity elongation in maize under various sowing depths, EBR application, and light spectral-quality treatments. These results thus lay the foundation for further studies on the functions of the ZmPRF family in plasticity elongation of MES and COL and abiotic-stress responses, which may have potential for application to maize breeding with stress resistance.

Supplementary Materials

The following supporting information can be downloaded at: https://www.mdpi.com/article/10.3390/ijms252111693/s1.

Author Contributions

Conceptualization, X.Z.; methodology, X.Z.; analysis, X.Z.; investigation, X.Z., S.S., Z.S., F.H., G.Q., X.L. and Y.N.; resources, X.Z.; writing—original draft preparation, X.Z.; writing—review and editing, X.Z.; supervision, X.Z.; project administration, X.Z.; funding acquisition, X.Z. All authors have read and agreed to the published version of the manuscript.

Funding

This research was supported by the Youth mentor Support Fund of Gansu Agricultural University, China (GAU-QDFC-2024-19), the National Natural Science Foundation of China (32360478, 32060486), the Fuxi Yong Talent Foundation of Gansu Agricultural University, China (Gaufx-05Y08), the State Key Laboratory of Aridland Crop Science, Gansu Agricultural University, China (GSCS-2023-Z01), the Gansu Province Joint Research Fund, China (24JRRA843), the Major Scientific and Technological Special Project of Gansu, China (22ZD6NA009), and the horizontal project of Gansu Agricultural University, China (GSAU-JSXK-2024-001).

Institutional Review Board Statement

Not applicable.

Informed Consent Statement

Not applicable.

Data Availability Statement

Data are contained within the article and Supplementary Material.

Conflicts of Interest

The authors declare no conflicts of interest.

References

  1. Niu, Y.N.; Zhao, X.Q.; Chao, W.; Lu, P.N.; Bai, X.D.; Mao, T.T. Genetic variation, DIMBOA accumulation, and candidate gene identification in maize multiple insect-resistance. Int. J. Mol. Sci. 2023, 24, 2138. [Google Scholar] [CrossRef]
  2. Liu, Y.E.; Hou, P.; Zhang, W.Y.; Xing, J.F.; Lv, T.F.; Zhang, C.Y.; Wang, R.H.; Zhao, J.R. Drought resistance of nine maize cultivars released from the 1970s through the 2010s in China. Field Crops Res. 2023, 302, 109065. [Google Scholar] [CrossRef]
  3. Dewi-Hayati, P.K.; Sutoyo, A.; Syarif, A.; Prasetyo, T. Performance of maize single-cross hybrids evaluated on acidic soils. Int. J. Adv. Sci. Eng. Inf. Technol. 2014, 4, 30–33. [Google Scholar]
  4. He, F.Q.; Zhao, X.Q.; Qi, G.X.; Sun, S.Q.; Shi, Z.Z.; Niu, Y.N.; Wu, Z.F.; Zhou, W.Q. Exogenous melatonin alleviates NaCl injury by influencing stomatal morphology, photosynthetic performance, and antioxidant balance in maize. Int. J. Mol. Sci. 2024, 25, 10077. [Google Scholar] [CrossRef] [PubMed]
  5. Zhao, X.Q.; He, F.Q.; Qi, G.X.; Sun, S.Q.; Shi, Z.Z.; Niu, Y.N.; Wu, Z.F. Transcriptomic and physiological studies unveil that brassinolide maintains the balance of maize’s multiple metabolisms under low-temperature stress. Int. J. Mol. Sci. 2024, 25, 9396. [Google Scholar] [CrossRef]
  6. Ruan, M.X.; Zhao, H.; Wen, Y.J.; Chen, H.; He, F.; Hou, X.B.; Song, X.Q.; Jiang, H.Y.; Ruan, Y.L.; Wu, L.M. The complex transcriptional regulation of heat stress response in maize. Stress Biol. 2024, 4, 24. [Google Scholar] [CrossRef]
  7. Singh, A.; Pandey, H.; Pandey, S.; Lal, D.; Chauhan, D.; Antre, S.H.; Kumar, A. Drought stress in maize: Stress perception to molecular response and strategies for its improvement. Funct. Integr. Genom. 2023, 23, 296. [Google Scholar] [CrossRef]
  8. Thirunavukkarasu, N.; Sharma, R.; Singh, N.; Shiriga, K.; Mohan, S.; Mittal, S.; Mittal, S.; Mallikarjuna, M.G.; Rao, A.R.; Dash, P.K.; et al. Genomewide expression and functional interactions of genes under drought stress in maize. Int. J. Genom. 2017, 2017, 2568706. [Google Scholar] [CrossRef]
  9. Colin, L.; Ruhnow, F.; Zhu, J.K.; Zhao, C.; Zhao, Y.; Persson, S. The cell biology of primary cell walls during salt stress. Plant Cell 2023, 35, 201–217. [Google Scholar] [CrossRef]
  10. Cheung, A.Y.; Duan, Q.H.; Costa, S.S.; DE Graaf, B.H.J.; Di Stilio, V.S.; Feijo, J.; Wu, H.M. The dynamic pollen tube cytoskeleton: Live cell studies using action-binding and microtubule-binding reporter proteins. Mol. Plant 2008, 1, 686–702. [Google Scholar] [CrossRef]
  11. Sun, H.; Qiao, Z.; Chua, K.P.; Tursic, A.; Liu, X.; Gao, Y.G.; Mu, Y.G.; Hou, X.L.; Miao, Y.S. Profilin negatively regulates formin-mediated actin assembly to modulate PAMP-triggered plant immunity. Curr. Biol. 2018, 28, 1882–1895. [Google Scholar] [CrossRef]
  12. Ketelaar, T.; de Ruijter, N.C.; Emons, A.M. Unstable F-action specifies the area and microtubule direction of cell expansion in Arabidopsis root hairs. Plant Cell 2008, 15, 285–292. [Google Scholar] [CrossRef] [PubMed]
  13. Zhang, Y.L.; Dong, G.J.; Wu, L.M.; Chen, F.; Yu, Y.C.; Ma, D.R. Identification and characterization of profilin gene family in rice. Electron. J. Biotechnol. 2021, 54, 47–59. [Google Scholar] [CrossRef]
  14. Vantard, M.; Blanchoin, L. Actin polymerization processes in plant cells. Curr. Opin. Plant Biol. 2002, 5, 502–506. [Google Scholar] [CrossRef] [PubMed]
  15. Jimenez-Lopez, J.C.; Morales, S.; Castro, A.J.; Volkmann, D.; Rodríguez-García, M.I.; Alché, J.D. Characterization of profiling polymorphism in pollen with a focus on multifunctionality. PLoS ONE 2012, 7, e30878. [Google Scholar] [CrossRef]
  16. Pandey, D.K.; Chaudhary, B. Domestication-driven gossypium profilin 1 (GhPRF1) gene transduces early flowering phenotype in tobacco by spatial alteration of apical/floral-meristem related gene expression. BMC Plant Biol. 2016, 16, 112. [Google Scholar] [CrossRef]
  17. Schlüter, K.; Jockusch, B.M.; Rothkegel, M. Profilins as regulators of actin dynamics. Biochim. Biophys. Acta 1997, 27, 97–109. [Google Scholar] [CrossRef]
  18. Blanchoin, L.; Boujemaa-Paterski, R.; Sykes, C.; Plastino, J. Actin dynamics, architecture, and mechanics in cell motility. Physiol. Rev. 2014, 94, 235–263. [Google Scholar] [CrossRef]
  19. Pantaloni, D.; Carlier, M.F. How profilin promotes actin filament as sembly in the presence of thymosin beta 4. Cell 1993, 75, 1007–1014. [Google Scholar] [CrossRef]
  20. Machesky, L.M.; Cole, N.B.; Moss, B.; Pollard, T.D. Vaccinia virus expresses a novel profiling with a higher affinity for polyphosphoinositides than actin. Biochemistry 1994, 33, 10815–10824. [Google Scholar] [CrossRef]
  21. Bjorkegren-Sjogren, C.; Korenbaum, E.; Nordberg, P.; Lindberg, U.; Karlsson, R. Isolation and characterization of two mutants of human profilin I that do not bind poly (L-proline). FEBS Lett. 1997, 418, 258–264. [Google Scholar] [CrossRef] [PubMed]
  22. Khuman, A.; Yadav, V.; Chaudhary, B. Evolutionary dynamics of the cytoskeletal profilin gene family in Brassica juncea L. reveal its roles in silique development and stress resilience. Int. J. Biol. Macromol. 2024, 266, 131247. [Google Scholar] [CrossRef] [PubMed]
  23. Ramachandran, S.; Christensen, H.E.M.; Ishimaru, Y.; Dong, C.H.; Chao-Ming, W.; Cleary, A.L.; Chua, N.H. Profilin plays a role in cell elongation, cell shape maintenance, and flowering in Arabidopsis. Plant Physiol. 2000, 124, 1637–1647. [Google Scholar] [CrossRef] [PubMed]
  24. Staiger, C.J.; Goodbody, K.C.; Hussey, P.J.; Valenta, R.; Drøbak, B.K.; Lloyd, C.W. The profilin multigene family of maize: Differential expression of three isoforms. Plant J. 1993, 4, 631–641. [Google Scholar] [CrossRef]
  25. Liu, X.N.; Qu, X.L.; Jiang, Y.X.; Chang, M.; Zhang, R.H.; Wu, Y.J.; Fu, Y.; Huang, S.J. Profilin regulates apical actin polymerization to control polarized pollen tube growth. Mol. Plant 2015, 8, 1694–1709. [Google Scholar] [CrossRef]
  26. Zhao, X.Q.; Niu, Y.N.; Hossain, Z.; Zhao, B.Y.; Bai, X.D.; Mao, T.T. New insights into light spectral quality inhibits the plasticity elongation of maize mesocotyl and coleoptile during seed germination. Front. Plant Sci. 2023, 14, 1152399. [Google Scholar] [CrossRef]
  27. Jeong, Y.M.; Mun, J.H.; Lee, I.; Woo, J.C.; Hong, C.B.; Kim, S.G. Distinct roles of the first introns on the expression of Arabidopsis profilin gene family members. Plant Physiol. 2006, 140, 196–209. [Google Scholar] [CrossRef]
  28. Zhao, X.Q.; Zhong, Y.; Shi, J.; Zhou, W.Q. 24-Epibrassinolide confers tolerance against deep-seeding stress in Zea mays L. coleoptile development by phytohormones signaling transduction and their interaction network. Plant Signal. Behav. 2021, 16, 1963583. [Google Scholar] [CrossRef]
  29. Zhao, X.Q.; Zhong, Y.; Zhou, W.Q. Molecular mechanisms of mesocotyl elongation induced by brassinosteroid in maize under deep-seeding stress by RNA-sequencing, microstructure observation, and physiological metabolism. Genomics 2021, 113, 3565–3581. [Google Scholar] [CrossRef]
  30. Pandey, D.K.; Chaudhary, B. Evolutionary expansion and structural functionalism of the ancient family of profilin proteins. Gene 2017, 626, 70–86. [Google Scholar] [CrossRef]
  31. Lynch, M.; Conery, J.S. The evolutionary fate and consequences of duplicate genes. Science 2000, 290, 1151–1155. [Google Scholar] [CrossRef] [PubMed]
  32. Kwok, C.K.; Ding, Y.L.; Shahid, S.; Assmann, S.M.; Bevilacqua, P.C. A stable RNA G-quadruplex within the 5’-UTR of Arabidopsis thaliana ATR mRNA inhibits translation. Biochem. J. 2015, 467, 91–102. [Google Scholar] [CrossRef] [PubMed]
  33. Zhang, Z.Y.; Zhang, J.; Wang, C.; Chang, Y.L.; Han, K.N.; Gao, Y.Q.; Xie, J.M. Characterization of GPX gene family in pepper (Capsicum annuum L.) under abiotic stress and ABA treatment. Int. J. Mol. Sci. 2024, 25, 8343. [Google Scholar] [CrossRef] [PubMed]
  34. Cannon, S.B.; Mitra, A.; Baumgarten, A.; Young, N.D.; May, G. The roles of segmental and tandem gene duplication in the evolution of large gene families in Arabidopsis thaliana. BMC Plant Biol. 2004, 4, 10. [Google Scholar] [CrossRef]
  35. Yu, C.S.; Chen, Y.C.; Lu, C.H.; Hwang, J.K. Prediction of protein subcellular localization. Proteins Struct. Funct. Bioinform. 2006, 64, 643–651. [Google Scholar] [CrossRef]
  36. Park, E.; Caplan, J.L.; Dinesh-Kumar, S.P. Dynamic coordination of plastid morphological changes by cytoskeleton for chloplast-nucleus communication during plant immune responses. Plant Signal. Behav. 2018, 13, e1500064. [Google Scholar]
  37. Pandey, D.K.; Chaudhary, B. Synchronous transcription of cytoskeleton-associated genes is critical to cotton fiber elongation. J. Plant Growth Regul. 2019, 38, 1037–1061. [Google Scholar] [CrossRef]
  38. Fan, T.T.; Zhai, H.H.; Shi, W.W.; Wang, J.; Jia, H.L.; Xiang, Y.; An, L.Z. Overexpression of profilin 3 affects cell elongation and F-actin organization in Arabidopsis thaliana. Plant Cell Rep. 2013, 32, 149–160. [Google Scholar] [CrossRef]
  39. Swoboda, I.; Bhalla, P.L.; Xu, H.; Zhang, Y.; Mittermann, I.; Valenta, R.; Singh, M.B. Identification of pronp1, a tobacco profilin gene activated in tip-growing cells. Plant Mol. Biol. 2001, 46, 531–538. [Google Scholar] [CrossRef]
  40. Liu, J.Y.; Tie, H.L.; Chen, H.Z.; Han, R. The distribution of profilin in root-tip cells of wheat seedlings exposed to enhanced UV-B radiation. Front. Plant Sci. 2016, 9, 44–51. [Google Scholar] [CrossRef]
  41. Fan, T.T.; Ni, J.J.; Dong, W.C.; An, L.Z.; Xiang, Y.; Cao, S.Q. Effect of low temperature on profilins and ADFs transcription and actin cytoskeleton reorganization in Arabidopsis. Biol. Plant. 2015, 59, 793–796. [Google Scholar] [CrossRef]
  42. Camacho, C.; Coulouris, G.; Avagyan, V.; Ma, N.; Papadopoulos, J.; Bealer, K.; Madden, T.L. BLAST+: Architecture and applications. BMC Bioinform. 2009, 10, 421. [Google Scholar] [CrossRef] [PubMed]
  43. Chao, J.T.; Li, Z.Y.; Sun, Y.H.; Aluko, O.O.; Wu, X.R.; Wang, Q.; Liu, G.S. MG2C: A user-friendly online tool for drawing genetic maps. Mol. Hortic. 2021, 1, 16. [Google Scholar] [CrossRef] [PubMed]
  44. Bailey, T.L.; Boden, M.; Buske, F.A.; Frith, M.; Grant, C.E.; Clementi, L.; Ren, J.; Li, W.W.; Noble, W.S. MEME SUITE: Tools for motif discovery and searching. Nucleic Acids Res. 2009, 37, 202–208. [Google Scholar] [CrossRef] [PubMed]
  45. Tamura, K.; Stecher, G.; Peterson, D.; Filipski, A.; Kumar, S. MEGA6: Molecular evolutionary genetics analysis version 6.0. Mol. Biol. Evol. 2013, 30, 2725–2729. [Google Scholar] [CrossRef]
  46. Rombauts, S.; Dehais, P.; Van Montagu, M. PlantCARE: A plant cis-acting regulatory element database. Nucleic Acids Res. 1999, 27, 295–296. [Google Scholar] [CrossRef]
  47. Wang, Y.; Tang, H.; DeBarry, J.D.; Tan, X.; Li, J.; Wang, X.; Lee, T.H.; Jin, H.; Marler, B.; Guo, H.; et al. MCScanX: A toolkit for detection and evolutionary analysis of gene synteny and collinearity. Nucleic Acids Res. 2012, 40, e49. [Google Scholar] [CrossRef]
  48. Krzywinski, M.; Schein, J.; Birol, I.; Connors, J.; Gascoyne, R.; Horsman, D.; Jones, S.J.; Marra, M.A. Circos: An information aesthetic for comparative genomics. Genome Res. 2009, 19, 1639–1645. [Google Scholar] [CrossRef]
  49. Wang, D.; Zhang, Y.; Zhang, Z.; Zhu, J.; Yu, J. KaKs_Calculator 2.0: A toolkit incorporating gamma-series methods and sliding window strategies. Genom. Proteom. Bioinform. 2010, 8, 77–80. [Google Scholar] [CrossRef]
  50. Szklarczyk, D.; Kirsch, R.; Koutrouli, M.; Nastou, K.; Mehryary, F.; Hachilif, R.; Gable, A.; Fang, T.; Doncheva, N.T.; Pyysalo, S.; et al. The STRING database in 2023: Protein-protein association networks and functional enrichment analysis for any sequenced genome of interest. Nucleic Acids Res. 2023, 51, D638–D646. [Google Scholar] [CrossRef]
  51. Sun, J.Y.; Gao, J.L.; Wang, Z.G.; Hu, S.P.; Zhang, F.J.; Bao, H.Z.; Fan, Y.F. Maize canopy photosynthetic efficiency, plant growth, and yield response to tillage depth. Agronomy 2019, 9, 3. [Google Scholar] [CrossRef]
  52. Sinha, R.; Howe, E.A.; Quackenbush, J.; Schlauch, D. RNA-Seq analysis in MeV. Bioinformatics 2011, 27, 3209–3210. [Google Scholar]
  53. Li, N.; Miao, Y.P.; Ma, J.F.; Zhang, P.P.; Chen, T.; Liu, Y.; Che, Z.; Shahinnia, F.; Yang, D.L. Consensus genomic regions for grain quality traits in wheat revealed by meta-QTL analysis and in silico transcriptome integration. Plant Genome 2023, 16, e20336. [Google Scholar] [CrossRef]
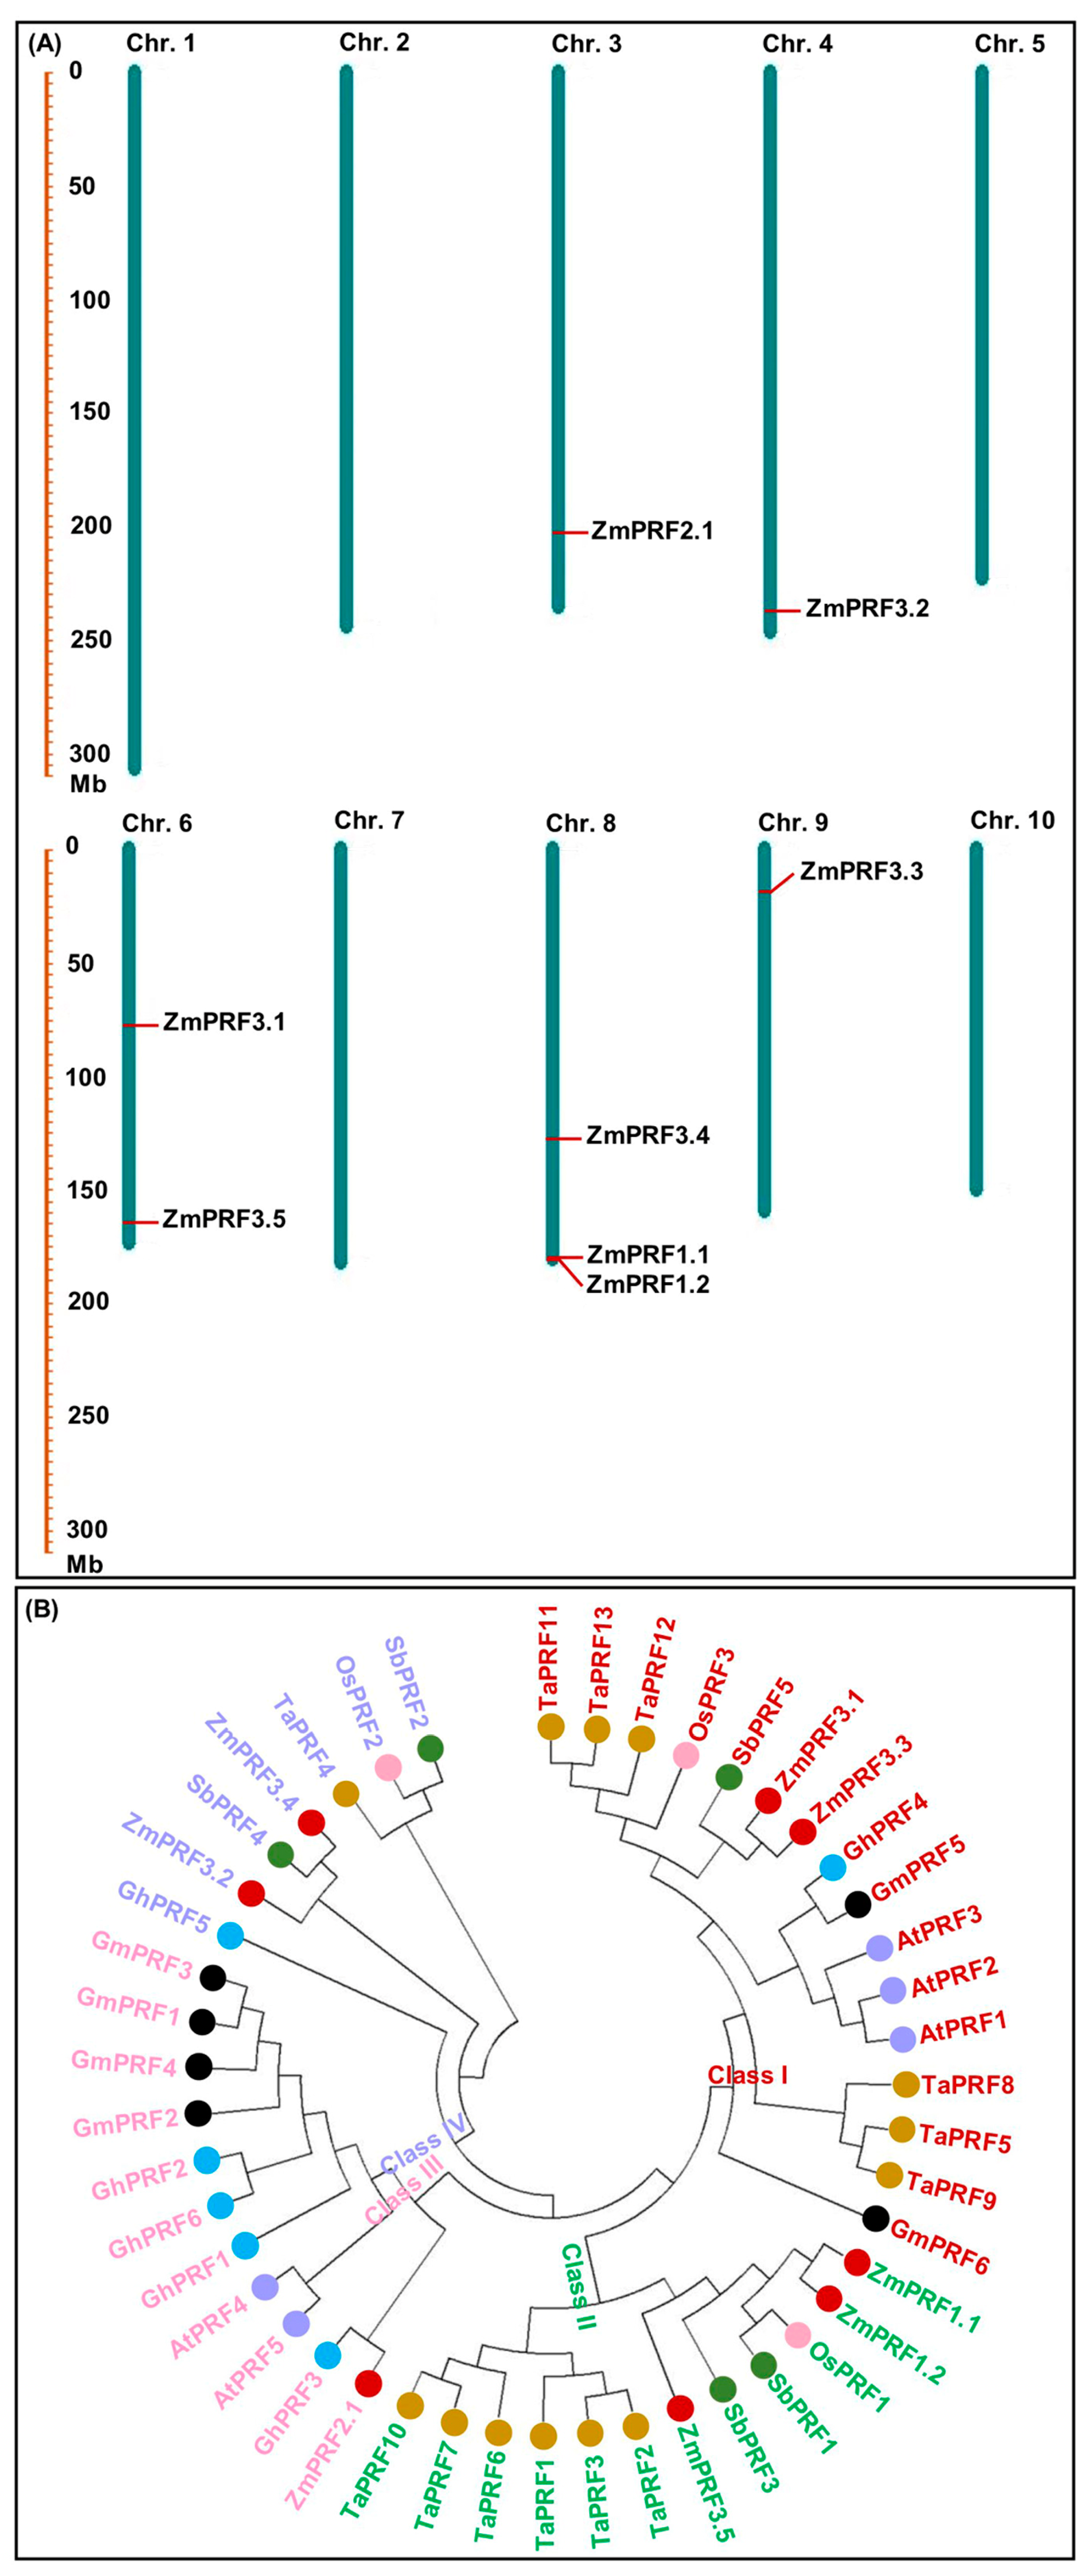
Figure 1. (A) Chromosomal locations of eight profilin (PRF) gene members detected in maize. (B) Phylogenic tree of PRF proteins from seven plant species, including Arabidopsis thaliana (At), Glycine max (Gm), Triticum aestivum (Ta), Gossypium hirsutum (Gh), Sorghum bicolor (Sb), Zea mays (Zm), and Oryza sativa (Os).
Ijms 25 11693 g001
Figure 2. (A) Phylogenic tree of eight profilin (PRF) protein members in maize. (B) The exon–intron structure of these PRF gene members in maize. (C) Conserved motif distribution of all PRF protein members in maize. (D) The sequence logos of the 15 conserved motifs.
Ijms 25 11693 g002
Figure 3. (A) Number statistics and element categories of predicted cis-elements in maize profilin (PRF) gene promoter regions. (B) Number statistics of the top 12 cis-elements in maize PRF gene promoter regions.
Ijms 25 11693 g003
Figure 4. Protein–protein interaction network between profilin (PRF) proteins and other proteins in maize. Nodes represent proteins, and empty nodes are proteins with unknown 3D structures. Connections between nodes represent interactions between proteins, with edge thickness indicating the confidence level of the interaction. Query proteins are depicted in red-colored nodes.
Ijms 25 11693 g004
Figure 5. (A) Heatmaps of expression patterns from eight profilin (PRF) genes and their thirty-seven interacting genes in mesocotyl (MES) and coleoptile (COL) of W64A and K12 seedlings under three treatments by RNA-sequencing (RNA-Seq). W3M: MES of W64A seedlings at 3 cm sowing depth; W20M: MES of W64A seedlings at 20 cm deep-sowing stress; W20EM: MES of W64A seedlings were treated with 2.0 mg g−1 24-epibrassinolide (EBR) application at 20 cm deep-sowing stress; W3C: COL of W64A seedlings at 3 cm sowing depth; W20C: COL of W64A seedlings at 20 cm deep-sowing stress; W20EC: COL of W64A seedlings were treated with 2.0 mg g−1 EBR application at 20 cm deep-sowing stress; K3M: MES of K12 seedlings at 3 cm sowing depth; K20M: MES of K12 seedlings at 20 cm deep-sowing stress; K20EM: MES of K12 seedlings were treated with 2.0 mg g−1 EBR application at 20 cm deep-sowing stress; K3C: COL of K12 seedlings at 3 cm sowing depth; K20C: COL of K12 seedlings at 20 cm deep-sowing stress; K20EC: COL of K12 seedlings were treated with 2.0 mg g−1 EBR application at 20 cm deep-sowing stress. TPM: transcripts per million. (B) The relative expression levels of eight PRF genes in MES and COL of W64A and K12 seedlings under three treatments by quantitative real-time PCR (qRT-PCR). Different lowercase letters in MES or COL in W64A/K12 seedlings under three treatments represent significant differences (p < 0.05) by analysis of variance (ANOVA). (C) Linear relationship between qRT-PCR and RNA-Seq for eight PRF genes in COL of two genotypes under three treatments. *** represents significant difference (p < 0.001) by ANOVA. (D) The Pearson correlation among eight PRF genes and two coleoptile phenotypes in two genotypes under three treatments. COLL: coleoptile length; COLC: coleoptile coarse. * represents significant correlations at p < 0.01 level. (E) Linear relationship between qRT-PCR and RNA-Seq for eight PRF genes in MES of two genotypes under three treatments. *** represents significant difference (p < 0.001) by ANOVA. (F) The Pearson correlation among eight PRF genes and two mesocotyl phenotypes in two genotypes under three treatments. MESL: mesocotyl length; MESC: mesocotyl coarse. * represents significant correlations at p < 0.01 level.
Ijms 25 11693 g005
Figure 6. (A) Heatmaps of expression patterns from eight profilin (PRF) genes and their thirty-seven interacting genes in mesocotyl (MES) and coleoptile (COL) of Zheng58 seedlings under four treatments by RNA-sequencing (RNA-Seq). MES.Red: mesocotyl was cultured in red light; MES.Blue: mesocotyl was cultured in blue light; MES.White: mesocotyl was cultured in white light; MES.Dark: mesooctyl was cultured in darkness; COL.Red: coleoptile was cultured in red light; COL.Blue: coleoptile was cultured in blue light; COL.White: coleoptile was cultured in white light; COL.Dark: coleoptile was cultured in darkness. TPM: transcripts per million. (B) The relative expression levels of eight PRF genes in MES and COL of Zheng58 seedlings under four treatments by quantitative real-time PCR (qRT-PCR). Different lowercase letters in MES or COL in Zheng58 seedlings under four treatments represent significant differences (p < 0.05) by analysis of variance (ANOVA). (C) Linear relationship between qRT-PCR and RNA-Seq for eight PRF genes in COL of Zheng58 seedlings under four treatments. *** represents significant difference (p < 0.001) by ANOVA. (D) The Pearson correlation among eight PRF genes and three coleoptile phenotypes in Zheng58 seedlings under four treatments. COLL: coleoptile length; COLC: coleoptile coarse; COLW: coleoptile weight. * represents significant correlations at p < 0.01 level. (E) Linear relationship between qRT-PCR and RNA-Seq for eight PRF genes in MES of Zheng58 seedlings under four treatments. *** represents significant difference (p < 0.001) by ANOVA. (F) The Pearson correlation among eight PRF genes and three mesocotyl phenotypes in Zheng58 seedlings under four treatments. MESL: mesocotyl length; MESC: mesocotyl coarse, MESW: mesooctyl weight. * represents significant correlations at p < 0.01 level.
Ijms 25 11693 g006
Figure 7. (A) Based on the fragments-per-kilobase-per-million mapped (FPKM) values of RNA-sequencing (RNA-Seq) for mesocotyl (MES) and coleoptile (COL) in W64A and K12 seedlings under three treatments, including 3 cm sowing depth, 20 cm sowing depth, 2.0 mg g−1 24-epibrassinolide (EBR) was applied at 20 cm sowing depth, the interaction network mapping was constructed between profilin (PRF) and other corresponding genes in maize. (B) Based on the FPKM values of RNA-Seq for MES and COL in Zheng58 seedlings under four treatments, including red light, blue light, white light, and darkness, the interaction networks mapping was constructed between PRF and other corresponding genes in maize.
Ijms 25 11693 g007
Table 1. Genomic information and protein characteristics of eight profilin (PRF) gene family members in maize.
NomenclatureGene_IDChr.Position (bp)Amino Acid (No.)MW (Da)pIInstability IndexAliphatic IndexGRAVYSubcellular Localization Predictions
ZmPRF2.1Zm00001d0435233202,712,631–202,713,67213214,336.54.9426.1081.210.057Cytoplasm
ZmPRF3.2Zm00001d0536314237,406,007–237,408,98118719,343.94.8135.3273.050.147Chloroplast
ZmPRF3.1Zm00001d036213677,268,316–77,270,83016118,356.86.2945.6076.890.376Cytoplasm
ZmPRF3.5Zm00001d0387836164,327,814–164,329,02913114,121.24.9432.1682.67–0.102Cytoplasm
ZmPRF3.4Zm00001d0107978128,115,856–128,116,96213714,811.05.0935.4574.820.166Mitochondrion
ZmPRF1.1Zm00001d0127728180,571,569–180,572,72313114,265.44.9129.6375.110.115Cytoplasm
ZmPRF1.2Zm00001d0127738180,621,908–180,623,04113214,365.54.9133.3084.170.073Cytoplasm
ZmPRF3.3Zm00001d045323918,935,792–18,946,86913114,114.24.5934.0387.020.044Cytoplasm
Chr.: chromosome; MW: molecular weight; pI: theoretical isoelectric point; GRAVY: grand average of hydropathicity.
Disclaimer/Publisher’s Note: The statements, opinions and data contained in all publications are solely those of the individual author(s) and contributor(s) and not of MDPI and/or the editor(s). MDPI and/or the editor(s) disclaim responsibility for any injury to people or property resulting from any ideas, methods, instructions or products referred to in the content.