Communication

Effects of Aminomethylphosphonic Acid on the Transcriptome and Metabolome of Red Swamp Crayfish, Procambarus clarkii

1
State Key Laboratory of Agricultural Microbiology, College of Life Science and Technology, Huazhong Agricultural University, Wuhan 430070, China
2
Yangtze River Fisheries Research Institute, Chinese Academy of Fishery Sciences, Wuhan 430223, China
*
Authors to whom correspondence should be addressed.
Int. J. Mol. Sci. 2024, 25(2), 943; https://doi.org/10.3390/ijms25020943
Submission received: 13 December 2023 / Revised: 30 December 2023 / Accepted: 2 January 2024 / Published: 11 January 2024
(This article belongs to the Section Molecular Informatics)

Abstract

:
Red swamp crayfish, Procambarus clarkii (P. clarkii), is an important model crustacean organism used in many types of research. However, the effects of different doses of aminomethylphosphonic acid (AMAP) on the transcriptome and metabolites of P. clarkii have not been explored. Thus, this study investigated the molecular and metabolic mechanisms activated at the different exposure dosages of AMAP in P. clarkii to provide new insights into the strategies of P. clarkii in response to the high concentrations of AMAP in the environment. In the present study, the P. clarkii were divided into three groups (control group; low-dosage AMAP exposure; high-dosage AMAP exposure), and hepatopancreatic tissue samples were dependently taken from the three groups. The response mechanisms at the different dosages of AMAP were investigated based on the transcriptome and metabolome data of P. clarkii. Differentially expressed genes and differentially abundant metabolites were identified in the distinct AMAP dosage exposure groups. The genes related to ribosome cell components were significantly up-regulated, suggesting that ribosomes play an essential role in responding to AMAP stress. The metabolite taurine, involved in the taurine and hypotaurine metabolism pathway, was significantly down-regulated. P. clarkii may provide feedback to counteract different dosages of AMAP via the upregulation of ribosome-related genes and multiple metabolic pathways. These key genes and metabolites play an important role in the response to AMAP stress to better prepare for survival in high AMAP concentrations.

1. Introduction

In recent years, there has been growing concern regarding the impact of aminomethylphosphonic acid (AMAP) (N-phosphonomethylglycine) on aquatic species [1,2]. Glyphosate is the most widely used non-selective herbicide for controlling weed growth worldwide [3,4], and its natural degradation product was AMPA. In soils and surface waters, AMPA can undergo a process of degradation mediated by microbial communities, during which AMPA is formed, resulting in the main breakdown product [5,6,7]. Generally, high levels of AMPA and AMPA in surface water occur with the first runoff episode after application [8].
The red swamp crayfish, Procambarus clarkii (P. clarkii), originally from America, was introduced into China and has multiplied and proliferated abundantly in the years that followed [9]. Crayfish farming is becoming a developing aquaculture industry in China, especially in Jiangsu Province, with a gross output value of more than USD 200 millionin 2009 [10]. The biological response of P. clarkii to exposure to AMPA involves changes at the biochemical and cellular levels, which in turn cause changes in the structure and function of cells and tissues and, ultimately, changes in the physiology and behavior of organisms [11,12]. Therefore, the potential impact of exposure to AMPA is important in the assessment of P. clarkii as a commercial product. Several transcriptome and metabolome studies of P. clarkii have been reported in recent years [13,14,15]. Studies have suggested that virus infection might affect the growth of P. clarkii via the use of high-throughput transcriptome sequencing [16]. Based on a targeted and untargeted metabolomic analysis, Moro et al. investigated the metabolic impairments caused by diclofenac in P. clarkii [17,18]. However, limited information is available about the effects of exposure to AMPA at different dosages when aiming to assess the effects on the transcriptome and metabolome.
There are limited data on the effects of AMPA on freshwater crayfish, in particular P. clarkii. The objective of this study was to investigate the effects of exposure to different dosages of AMPA on the gene expression and metabolite abundance in P. clarkii. A control, low (100 ppb) dosage, and high (1000 ppb) dosage exposure to realistic concentrations of AMPA were performed, and the effects on the transcriptome and metabolome were sequenced. Differentially expressed genes (DEGs) and differentially abundant metabolites were identified in distinct AMPA dosage groups. GO (Gene Ontology) and KEGG (Kyoto Encyclopedia of Genes and Genomes) functional analyses were performed to explore the impact of AMPA on the molecular and metabolites in P. clarkii.

2. Results

2.1. Identification of AMPA Dosage-Related DEGs in P. clarkii

Our study identified DEGs related to low (100 ppb) dosage and high (1000 ppb) dosage AMPA exposure. In total, 1109 significantly up-regulated genes and 611 significantly down-regulated genes were selected between the low-dosage AMPA-exposed P. clarkii and control samples (Figure 1A). In total, 1639 significantly up-regulated genes and 844 significantly down-regulated genes were selected between the high-dosage AMPA-exposed P. clarkii samples and control samples. (Figure 1B). Between the high-dosage and low-dosage AMPA exposure in P. clarkii, we identified 288 over-expressed and 202 down-expressed genes (Figure 1C). In addition, 64 DEGs were identified simultaneously in the three groups (Figure 1D). The overlapping of DEGs included LOC123767151, LOC123774039, and LOC123774908. Real-time quantitative PCR also found that LOC123767151, LOC123774039, and LOC123774908 were up-regulated in P. clarkii with low-dosage and high-dosage AMPA exposure compared with the control P. clarkii samples (Figure 1E–G). LOC123767151, LOC123774039, and LOC123774908 were annotated in multiple “Biological Process” terms, including prolyl-tRNA aminoacylation, tRNA aminoacylation for protein translation, the regulation of transcription, and the nucleoside metabolic process (Figure 2).
Moreover, we annotated the DEGs using the GO term to investigate the function of the DEGs. The DEGs from the three groups simultaneously annotated the cellular process, metabolic process, single-organism process terms in “Biological Process”, the catalytic activity, signal transducer activity, and binding terms in “Molecular Function”, the membrane, macromolecular complex, and organelle part terms in “Cellular Component”, and so on (Figure 2A–C). Thus, these results implied that high-dosage and low-dosage AMPA-related DEGs were involved in the same biological terms in P. clarkii.

2.2. Functional Enrichment Analysis of AMPA Doses Related DEGs

We performed GO and KEGG pathway enrichment analysis based on the detected DEGs from the three groups. The DEGs between the low-dosage AMPA and control samples were involved in ribosome-related function, including the structural constituents of the ribosome, small ribosomal subunit, and ribosome GO terms (Figure 3A). The DEGs between the high-dosage AMPA and control samples were also enriched for protein peptidyl-prolyl isomerization and mitochondrial inner membrane GO terms, in addition to ribosome-related GO terms (Figure 3B). Additionally, the DEGs between the high-dosage and low-dosage AMPA samples were enriched in oxidoreductase activity, the extracellular region, lipid transporter activity, and lipid transport GO terms (Figure 3C). KEGG pathway enrichment analysis suggested that the DEGs from the low-dosage and high-dosage AMPA were simultaneously enriched in the thermogenesis, retrograde endocannabinoid signaling, and oxidative phosphorylation pathways (Figure 3D,E). Moreover, the DEGs between the high-dosage and low-dosage AMPA samples were related to multiple biosynthetic and metabolic pathways, such as steroid biosynthesis, arginine biosynthesis, pyrimidine metabolism, and amino sugar and nucleotide sugar metabolism (Figure 3F). These results suggest that different doses of AMPA may affect the metabolic functions of P. clarkii.

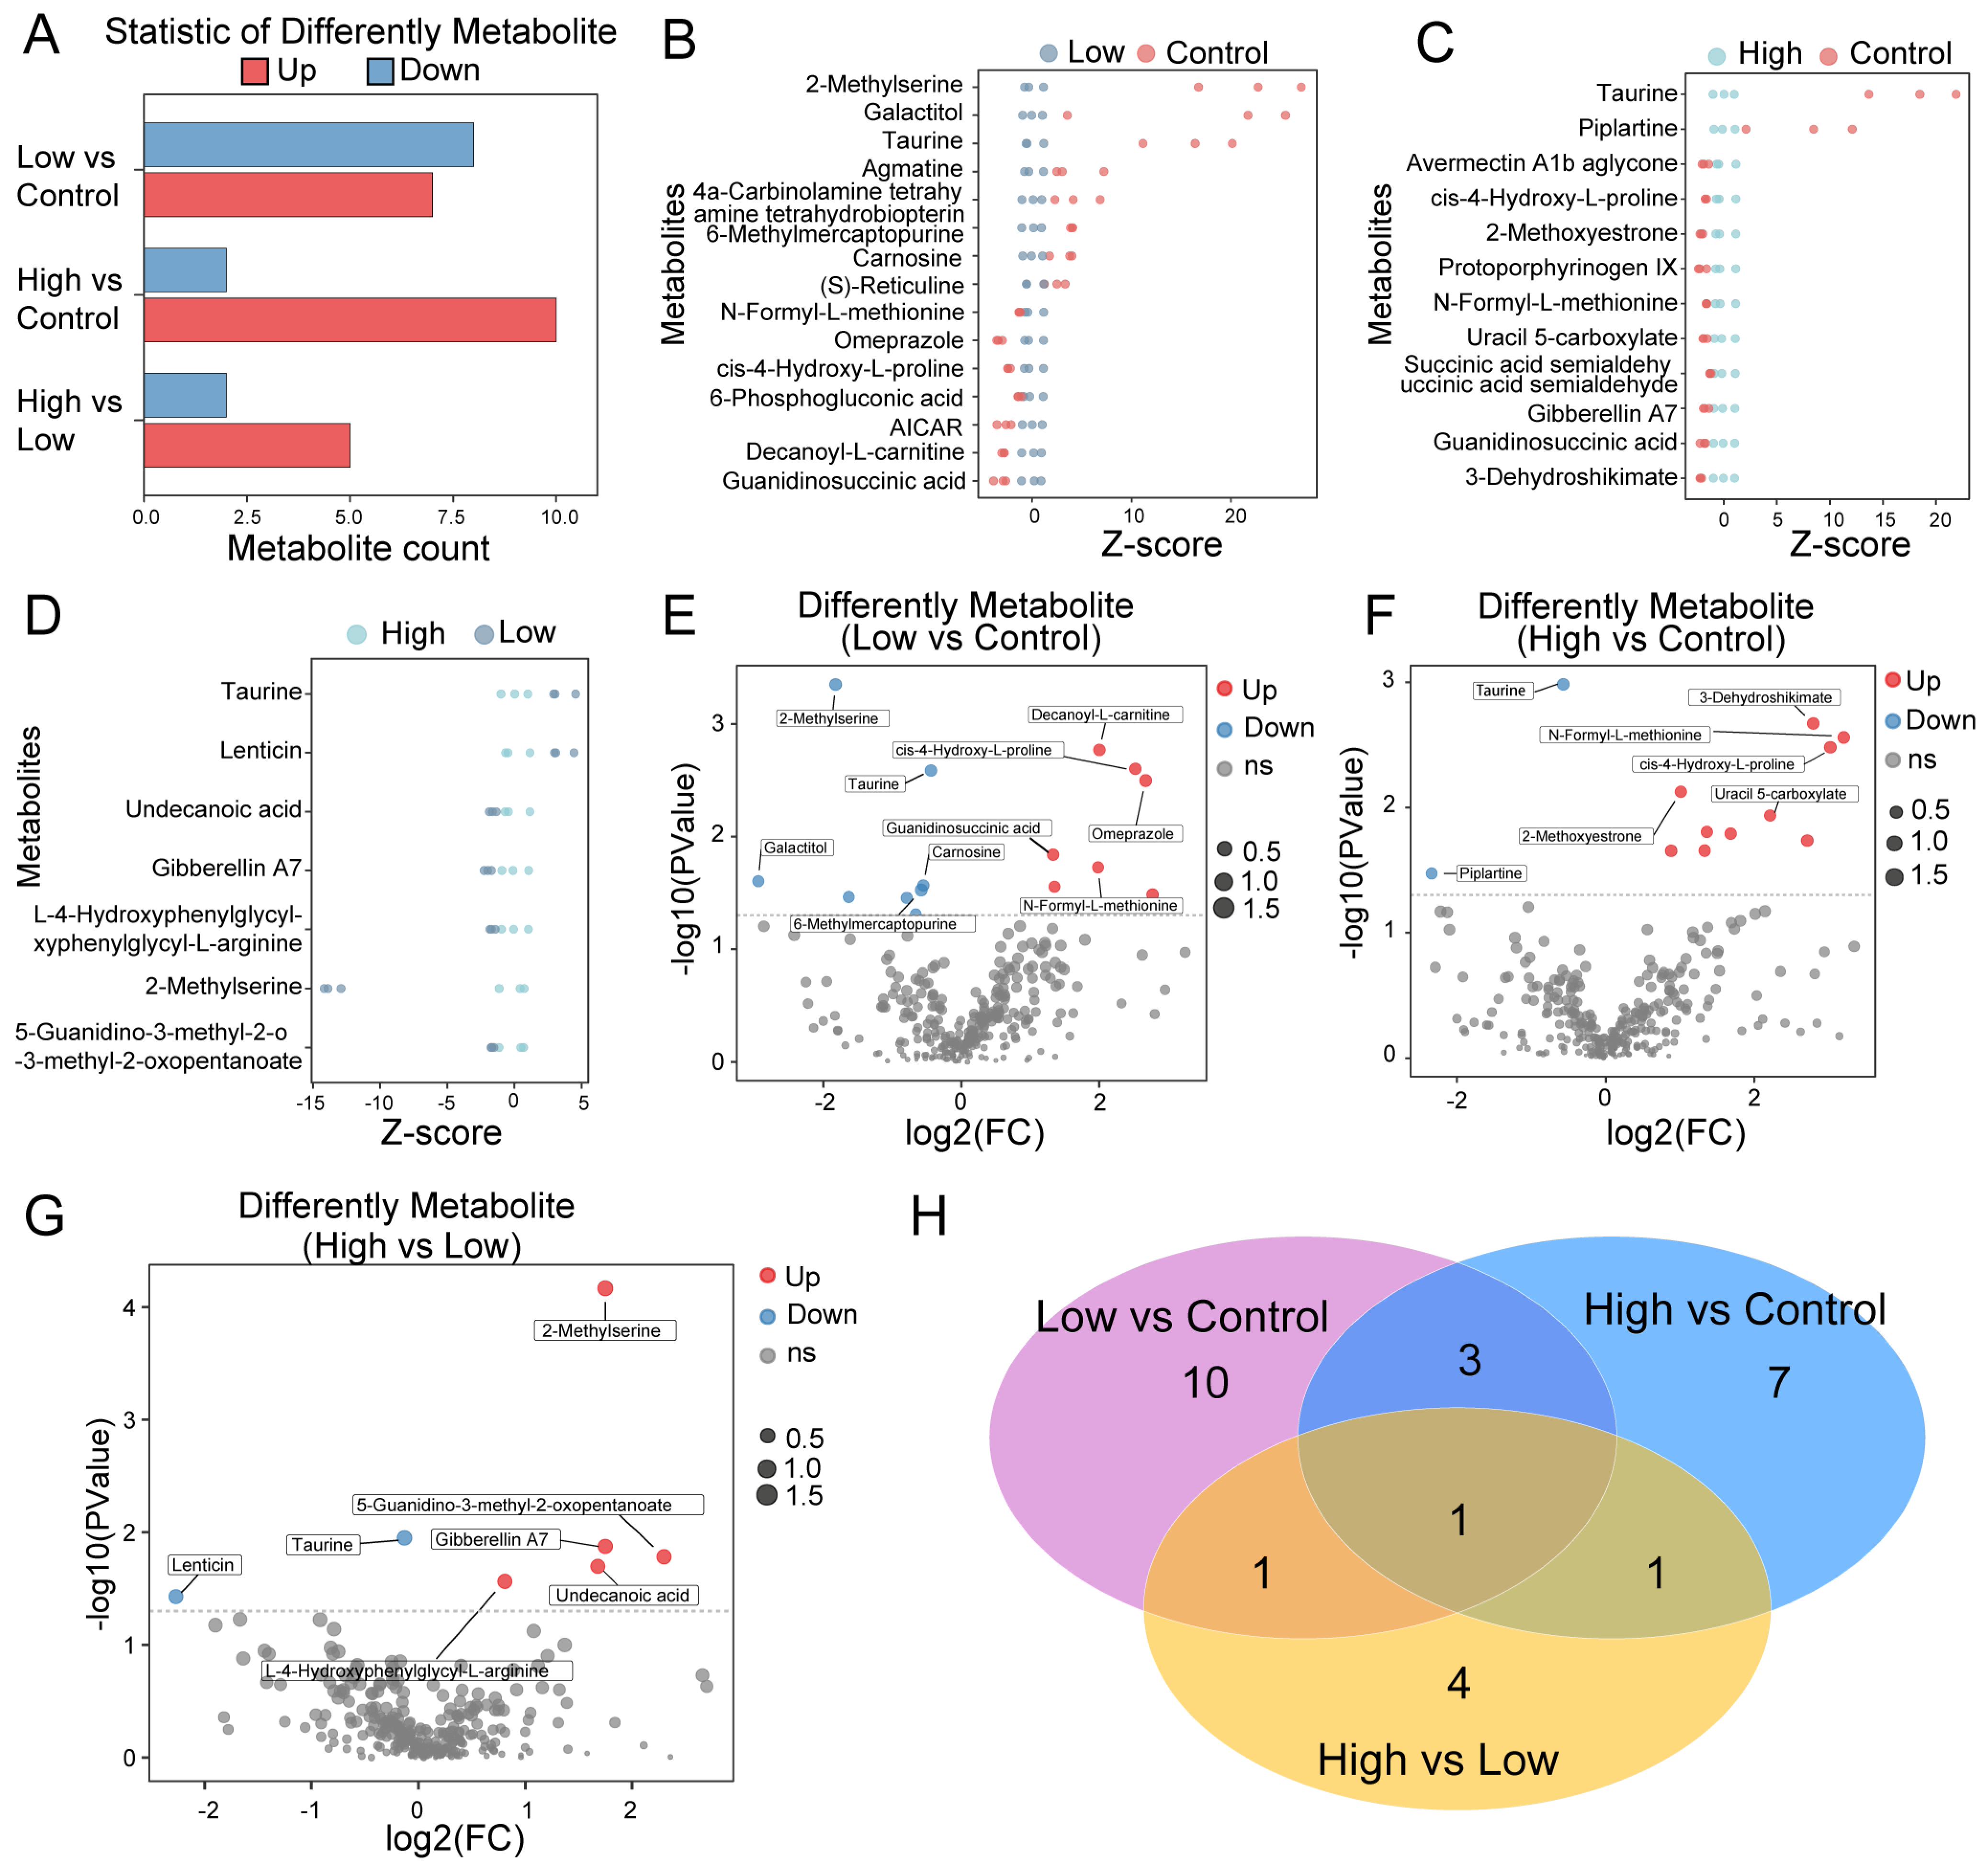
2.3. Identifying AMPA Dosage-Related Metabolites in P. clarkii

As the pathway serves as an enrichment function for DEGs, we assessed the AMPA dosage of different metabolites. This work identified different metabolites between the low-dosage AMPA and control P. clarkii samples, between the high-dosage AMPA and control P. clarkii samples, and between the high-dosage AMPA and low-dosage AMPA P. clarkii samples (Figure 4A). The number and levels of metabolites between the three groups are presented in Figure 4B–D. This work selected 15 different metabolites between the low-dosage AMPA and control P. clarkii samples, including seven different high-abundance metabolites and eight different low-abundance metabolites (Figure 4E). Twelve different metabolites were identified between the high-dosage AMPA and control P. clarkii samples, including ten different high-abundance metabolites and two different low-abundance metabolites (Figure 4F). In addition, we identified seven different metabolites between the high-dosage AMPA and high-dosage AMPA exposure P. clarkii samples, including five different high-abundance metabolites and two different low-abundance metabolites (Figure 4G). Furthermore, only one different metabolite was identified simultaneously in the three groups (Figure 4H). In brief, exposure to different dosages of AMPA also impacts the metabolome of P. clarkii.

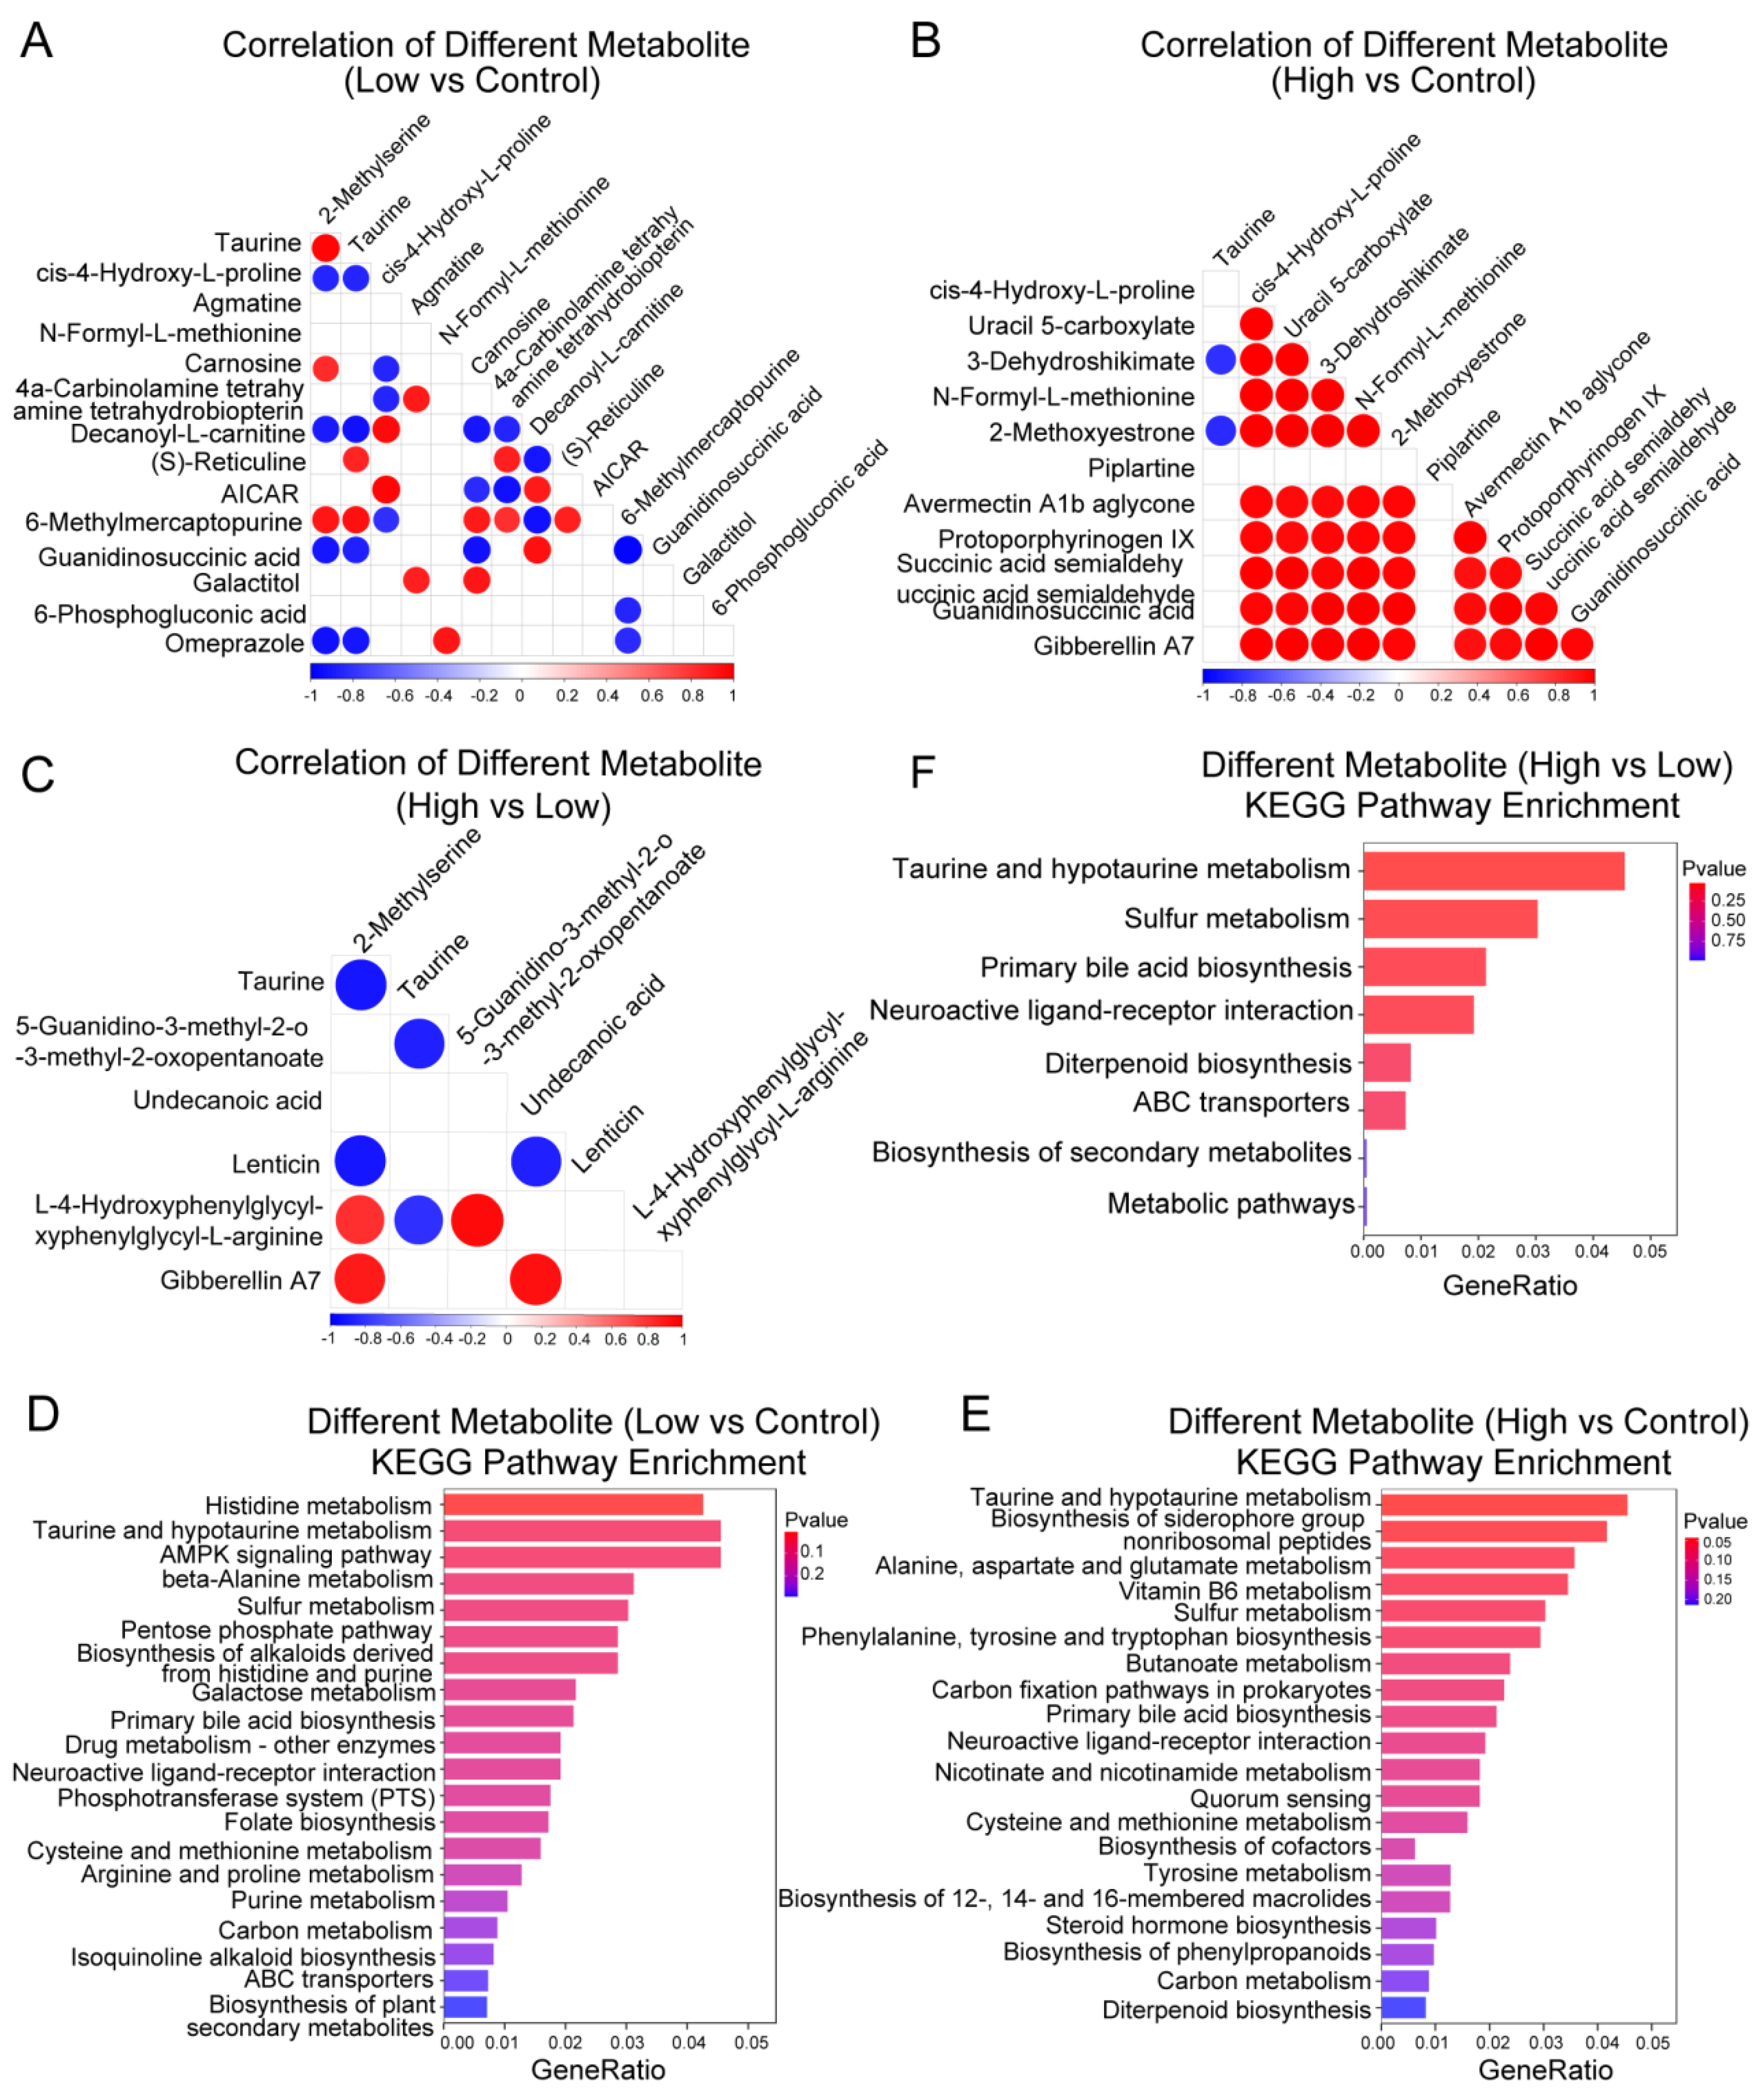
2.4. Functional Enrichment Analysis of AMPA Dosage-Related Differential Metabolites

We next investigated the correlation between different metabolites and the biological properties associated with different metabolites. This study found that different metabolites identified from three groups showed a correlation in their metabolite abundance (Figure 5A–C). In particular, several metabolites showed a positive correlation between the high-dose AMPA and control P. clarkii samples. (Figure 5B). The KEGG pathway enrichment analysis suggested that different metabolites from three groups were enriched in some of the same pathways, such as carbon metabolism, taurine and hypotaurine metabolism, ABC transporters, and cysteine and methionine metabolism pathways (Figure 5D–F). Overall, these findings demonstrate that the AMPA dosage correlated with the metabolite abundance and metabolic function in P. clarkii.

3. Discussion

There were few studies on the effects of AMPA exposure on Procrazii clarkii, especially in combination with transcriptomes and metabolomes. The present study found that DEGs and different metabolites were associated with different dosages of AMPA in the P. clarkii model. Some DEGs were validated by real-time quantitative PCR. The genes related to ribosome cell components were up-regulated, suggesting that the ribosome played an essential role in responding to AMAP stress. This work suggested that the dosage of AMPA influences metabolic pathways and functions. This is the first study to simultaneously compare the effects of different doses of AMPA on P. clarkii metabolites and transcriptomes.
The functional enrichment analysis of DEGs suggested that high-dosage exposure to AMPA affected the lipid transporter activity and lipid transport function of P. Clarkii (Figure 3C). A recent study found that AMPA exposure induced lipid metabolism disorder in grass carp based on metabolomics analysis [19]. Meanwhile, Sulukan et al. reported that lipid accumulation was detected in a zebrafish model exposed to AMPA [20]. Therefore, the present work concluded that exposure to AMPA may affect the growth and function of aquatic organisms by affecting lipid metabolism [21,22,23]. The capability of lipopolysaccharide to influence ribosome function has already been demonstrated in P. Clarkii [24]. In the present study, we discovered that ribosome-associated functions were up-regulated in both the high- and low-dose AMPA groups, suggesting that AMAP exposure also affects ribosome functions in P. Clarkii (Figure 3A,B,D,E). Yan et al.’s study provides novel insights into the effects of glyphosate on fish species by regulating metabolites, such as bile acids and short-chain fatty acids [19]. This work selected different metabolites from the high-throughput quantification for metabolites and performed a functional enrichment analysis of the different metabolites. We found that the metabolism pathways were identified in the three AMPA groups. This result is consistent with previous reports finding that AMPA affects the metabolism disorders of aquatic organisms [25,26].
Although our work was limited by a large number of samples, we used three AMPA exposure groups of P. clarkii samples to analyze the influence of AMPA on both the transcriptome and metabolome. In the future, we will expand the samples and add different dosages of AMPA exposure to comprehensively explore the mechanisms implicated in the effect of AMPA on metabolic function. In addition, the exposure of P. clarkii to high dosages of AMPA showed alterations in several metabolic pathways, which warrants future detailed biological experiments to validate these discoveries.

4. Materials and Methods

4.1. Ethics Statement

This study was approved by the Animal Care and Use Committee of Yangtze River Fisheries Research Institute (Permit No. 2022yfimaotao001).

4.2. P. clarkii Exposure to AMPA

The red crayfish (weight, 30 ± 5 g) were purchased from a farm in Hubei Province, China, and were temporarily bred at a water (DO > 5 mg/L, ammonium nitrogen < 0.2 mg/L, pH 6~9) temperature of 25 ± 1 °C for 7 days without testing for any abnormalities. In total, 120 healthy red swamp crayfish, half male and half female, were randomly selected and divided into three groups, with 40 in each group. Two groups were prepared for breeding in low (100 ppb)-dosage and high (1000 ppb)-dosage exposures of AMPA. The LC50 of the AMPA was 124 mg/L. The rest of the P. clarkii samples were used as a control group. The AMPA was purchased from Sigma-Aldrich as a 40% water solution of N-phosphonomethyl glycine-monoisopropylamine salt, was diluted in phosphate-buffered saline (PBS) 1X, and adjusted to pH 7.4 with NaOH [27,28]. AMPA with a purity above 98% (analytical standard) was obtained from Sigma-Aldrich Chemical Company (Spain, Madrid).

4.3. RNA Extraction, Transcriptome Library Construction and Sequencing

RNA was isolated from P. clarkii hepatopancreatic tissue and RNA-sequencing performed. The total RNA was isolated with Oligo(dT). RNA-seq libraries were constructed according to the manufacturer’s protocol. The mRNA was divided into fragments using a fragmentation buffer. The first cDNA strand was synthesized using an mRNA template with six-base random hexamers. A second strand of cDNA was then synthesized by adding buffer, dNTPs, RNase H, and DNA polymerase I. After purification with the QiaQuick PCR kit and elution with EB buffer solution, the terminal repair was performed, poly (A) was added, and the sequencing bridge was connected. The fragment sizes were selected via agarose gel electrophoresis and PCR amplification was performed. Then, the quality-checked libraries were sequenced on the Illumina HiSeq™ platform. RNA reads were aligned to the reference genome assembly using hisat2 (version 2.2.1) software. Then, we used FastQC software (version 0.11.9, http://www.bioinformatics.babraham.ac.uk/projects/fastqc, accessed on 16 March 2022) to control the quality for the subsequent analysis.

4.4. Chemicals and Reagents

LC–MS-grade methanol (MeOH) was purchased from Fisher Scientific (Loughborough, UK). 2-amino-3-(2-chlorophenyl)-propionic acid was purchased from Aladdin (Shanghai, China).

4.5. Sample Preparation and Standards

For this work, an appropriate amount of P. clarkii hepatopancreatic tissue sample was weighted into a 2 mL centrifuge tube, and a 100 mg glass bead was added. Next, 1000 µL of 50% methanol water (stored at 4 °C) was added and vortexed for 30 s. We placed the centrifuge tube containing the sample in the 2 mL adapter matched to the instrument, immersed it in liquid nitrogen for rapid freezing for 5 min, removed the centrifuge tube and thawed it at room temperature, placed the centrifuge tube back in the 2 mL adapter, placed it in the tissue grinder, and ground it at 55 Hz for 2 min. We repeated the last step twice. The centrifuge tube was removed; after being centrifuged for 10 min at 12,000 rpm and 4 °C, the entire supernatant was removed, transferred to a new 2 mL centrifuge tube, concentrated, and dried. The sample was then redissolved by adding 300 μL of 2-amino-3-(2-chlorophenyl)-propionic acid (4 ppm) solution prepared with 50% methanol-water (stored at 4 °C) to redissolve the sample, and the supernatant was filtered through a 0.22 μm membrane and transferred to the detection bottle for LC–MS detection.

4.6. Differential Expression Genes and Differential Metabolite Abundance in Three Dose Groups of AMPA

The “edgeR” package of the R 4.0.3 software was used to analyze the differential expression genes (DEGs) in the three low-dosage groups, including three low-dosage samples versus three control P. clarkii, three high-dosage versus three control P. clarkii, and three high-dosage versus three low-dosage P. clarkii samples. After significance analysis and false discovery rate (FDR) adjustment, FDR < 0.05 and fold change (FC) > 2 were considered as significantly up-regulated genes, and FDR < 0.05 and FC < −2 were considered as significantly down-regulated genes.

4.7. Real-Time Quantitative PCR Quantify Differential Expression Genes

The total RNA of the liver tissues was isolated using OHAUS-5515R following the manufacturer’s instructions (OHAUS, Parsippany-Troy Hills, NJ, USA). The RNA concentration was determined using NanoDrop 8000 (Thermo Fisher, Waltham, MA, USA). The expression levels of mRNAs were determined using the StepOnePlusTM Real-Time System. Based on the gene sequence information, primers for qPCR amplification were designed using the primer design software Primer 5. The relative levels of expression of mRNAs were analyzed using the 2−ΔΔCt method [29,30].

4.8. GO Term Annotation and KEGG Pathway Enrichment

Based on the results of the DEGs, we performed GO enrichment analysis using clusterProfiler (version 4.0.2) software. Significant GO terms and KEGG pathways were identified via a hypergeometric test, and an FDR was used to correct the p-value. The statistical significance was set at an adjusted p-value < 0.05.

4.9. Statistical Analyses

All analyses and graphs were performed and made using R software (v 4.0.3). The “edgeR” package was used to identify the DEGs and a hypergeometric test was used to perform GO term annotation and KEGG pathway enrichment. After FDR adjust, an adjusted p-value < 0.05 indicates a statistically significant.

5. Conclusions

Overall, this work explored the effects of different doses of AMAP on the transcriptome and metabolites of P. clarkii. Differentially expressed genes and differentially abundant metabolites were identified in the distinct AMAP dosage groups. The genes related to ribosome cell components were significantly up-regulated, suggesting that ribosomes play an essential role in responding to AMAP stress. P. clarkii may provide feedback to counteract different dosages of AMAP via the upregulation of ribosome-related genes and multiple metabolic pathways.

Author Contributions

T.M. and G.W. conceived and designed the study. T.M., G.W. and J.G. completed data processing, analysis, and draft of the paper. L.H., Y.Y. and Z.L. extracted data and visualized the results. Y.Z., K.Y. and G.W. provided valuable suggestions for the manuscript. All authors have read and agreed to the published version of the manuscript.

Funding

This work was supported by grants from the National Natural Science Foundation of China (No. 31971383 to Gaobing Wu), and the China Agriculture Research System of MOF and MARA (No. CARS-48 to Li He).

Institutional Review Board Statement

Not applicable.

Informed Consent Statement

Not applicable.

Data Availability Statement

The data used for the analysis is available upon request.

Conflicts of Interest

The authors declare that they have no known competing financial interests or personal relationships that could have appeared to influence the work reported in this paper.

References

  1. Lopes, A.R.; Moraes, J.S.; Martins, C.d.M.G. Effects of the herbicide glyphosate on fish from embryos to adults: A review addressing behavior patterns and mechanisms behind them. Aquat. Toxicol. 2022, 251, 106281. [Google Scholar] [CrossRef] [PubMed]
  2. Lares, B.A.; Vignatti, A.M.; Echaniz, S.A.; Gutiérrez, M.F. Effects of glyphosate on cladocera: A synthetic review. Aquat. Toxicol. 2022, 249, 106232. [Google Scholar] [CrossRef] [PubMed]
  3. Rawat, D.; Bains, A.; Chawla, P.; Kaushik, R.; Yadav, R.; Kumar, A.; Sridhar, K.; Sharma, M. Hazardous impacts of glyphosate on human and environment health: Occurrence and detection in food. Chemosphere 2023, 329, 138676. [Google Scholar] [CrossRef] [PubMed]
  4. Masotti, F.; Garavaglia, B.S.; Gottig, N.; Ottado, J. Bioremediation of the herbicide glyphosate in polluted soils by plant-associated microbes. Curr. Opin. Microbiol. 2023, 73, 102290. [Google Scholar] [CrossRef] [PubMed]
  5. Grandcoin, A.; Piel, S.; Baurès, E. AminoMethylPhosphonic acid (AMPA) in natural waters: Its sources, behavior and environmental fate. Water Res. 2017, 117, 187–197. [Google Scholar] [CrossRef] [PubMed]
  6. Poiger, T.; Buerge, I.J.; Bächli, A.; Müller, M.D.; Balmer, M.E. Occurrence of the herbicide glyphosate and its metabolite AMPA in surface waters in Switzerland determined with on-line solid phase extraction LC-MS/MS. Environ. Sci. Pollut. Res. Int. 2017, 24, 1588–1596. [Google Scholar] [CrossRef] [PubMed]
  7. Desmet, N.; Touchant, K.; Seuntjens, P.; Tang, T.; Bronders, J. A hybrid monitoring and modelling approach to assess the contribution of sources of glyphosate and AMPA in large river catchments. Sci. Total Environ. 2016, 573, 1580–1588. [Google Scholar] [CrossRef]
  8. Coupe, R.H.; Kalkhoff, S.J.; Capel, P.D.; Gregoire, C. Fate and transport of glyphosate and aminomethylphosphonic acid in surface waters of agricultural basins. Pest Manag. Sci. 2012, 68, 16–30. [Google Scholar] [CrossRef]
  9. Mendoza-Vargas, L.; Guarneros-Bañuelos, E.; Báez-Saldaña, A.; Galicia-Mendoza, F.; Flores-Soto, E.; Fuentes-Pardo, B.; Alvarado, R.; Valdés-Tovar, M.; Sommer, B.; Benítez-King, G.; et al. Involvement of Melatonin in the Regulation of the Circadian System in Crayfish. Int. J. Mol. Sci. 2018, 19, 2147. [Google Scholar] [CrossRef]
  10. Hou, J.; Styles, D.; Cao, Y.; Ye, X. The sustainability of rice-crayfish coculture systems: A mini review of evidence from Jianghan plain in China. J. Sci. Food Agric. 2021, 101, 3843–3853. [Google Scholar] [CrossRef]
  11. Marçal, R.; Pacheco, M.; Guilherme, S. DNA of crayfish spermatozoa as a target of waterborne pesticides—An ex vivo approach as a tool to short-term spermiotoxicity screening. J. Hazard. Mater. 2020, 400, 123300. [Google Scholar] [CrossRef] [PubMed]
  12. Yan, B.; Lei, L.; Chen, X.; Men, J.; Sun, Y.; Guo, Y.; Yang, L.; Wang, Q.; Han, J.; Zhou, B. Glyphosate and glufosinate-ammonium in aquaculture ponds and aquatic products: Occurrence and health risk assessment. Environ. Pollut. 2022, 296, 118742. [Google Scholar] [CrossRef]
  13. Wang, Z.; Yang, L.; Zhou, F.; Li, J.; Wu, X.; Zhong, X.; Lv, H.; Yi, S.; Gao, Q.; Yang, Z.; et al. Integrated comparative transcriptome and weighted gene co-expression network analysis provide valuable insights into the response mechanisms of crayfish (P. clarkii) to copper stress. J. Hazard. Mater. 2023, 448, 130820. [Google Scholar] [CrossRef] [PubMed]
  14. Shi, G.; Gao, T.; Li, X.; Shi, L.; Chen, S.; Ding, A.; Li, X.; Qiao, Y.; Liao, L.; Xiong, G.; et al. Integrating transcriptomic and metabolomic analysis to understand muscle qualities of red swamp crayfish (P. clarkii) under transport stress. Food Res. Int. 2023, 164, 112361. [Google Scholar] [CrossRef] [PubMed]
  15. Ou-Yang, K.; Feng, T.; Han, Y.; Li, J.; Ma, H. Cyhalofop-butyl and pyribenzoxim-induced oxidative stress and transcriptome changes in the muscle of crayfish (P. clarkii). Sci. Total Environ. 2023, 864, 161170. [Google Scholar] [CrossRef]
  16. Nian, Y.-Y.; Chen, B.-K.; Wang, J.-J.; Zhong, W.-T.; Fang, Y.; Li, Z.; Zhang, Q.-S.; Yan, D.-C. Transcriptome analysis of P. clarkii infected with infectious hypodermal and haematopoietic necrosis virus. Fish Shellfish Immunol. 2020, 98, 766–772. [Google Scholar] [CrossRef]
  17. Rodríguez-Moro, G.; Román-Hidalgo, C.; Ramírez-Acosta, S.; Aranda-Merino, N.; Gómez-Ariza, J.L.; Abril, N.; Bello-López, M.A.; Fernández-Torres, R.; García-Barrera, T. Targeted and untargeted metabolomic analysis of P. clarkii exposed to a “chemical cocktail” of heavy metals and diclofenac. Chemosphere 2022, 293, 133410. [Google Scholar] [CrossRef]
  18. Fernández-Cisnal, R.; García-Sevillano, M.A.; García-Barrera, T.; Gómez-Ariza, J.L.; Abril, N. Metabolomic alterations and oxidative stress are associated with environmental pollution in P. clarkii. Aquat. Toxicol. 2018, 205, 76–88. [Google Scholar] [CrossRef]
  19. Yan, B.; Sun, Y.; Fu, K.; Zhang, Y.; Lei, L.; Men, J.; Guo, Y.; Wu, S.; Han, J.; Zhou, B. Effects of glyphosate exposure on gut-liver axis: Metabolomic and mechanistic analysis in grass carp (Ctenopharyngodon idellus). Sci. Total Environ. 2023, 902, 166062. [Google Scholar] [CrossRef]
  20. Sulukan, E.; Baran, A.; Kankaynar, M.; Kızıltan, T.; Bolat, İ.; Yıldırım, S.; Ceyhun, H.A.; Ceyhun, S.B. Global warming and glyphosate toxicity (II): Offspring zebrafish modelling with behavioral, morphological and immunohistochemical approaches. Sci. Total Environ. 2023, 856, 158903. [Google Scholar] [CrossRef]
  21. Telahigue, K.; Rabeh, I.; Mhadhbi, L.; Nechi, S.; Chelbi, E.; Ali, M.B.; Hedfi, A.; Al-Harbi, M.S.; Hajji, T. Glyphosate exposure modulates lipid composition, histo-architecture and oxidative stress status and induces neurotoxicity in the smooth scallop Flexopecten glaber. Pestic. Biochem. Physiol. 2022, 184, 105099. [Google Scholar] [CrossRef] [PubMed]
  22. Wang, X.; Chang, L.; Zhao, T.; Liu, L.; Zhang, M.; Li, C.; Xie, F.; Jiang, J.; Zhu, W. Metabolic switch in energy metabolism mediates the sublethal effects induced by glyphosate-based herbicide on tadpoles of a farmland frog Microhyla fissipes. Ecotoxicol. Environ. Saf. 2019, 186, 109794. [Google Scholar] [CrossRef] [PubMed]
  23. Ma, J.; Zhu, J.; Wang, W.; Ruan, P.; Rajeshkumar, S.; Li, X. Biochemical and molecular impacts of glyphosate-based herbicide on the gills of common carp. Environ. Pollut. 2019, 252, 1288–1300. [Google Scholar] [CrossRef] [PubMed]
  24. Jiao, T.; Yang, T.-T.; Wang, D.; Gao, Z.-Q.; Wang, J.-L.; Tang, B.-P.; Liu, Q.-N.; Zhang, D.-Z.; Dai, L.-S. Characterization and expression analysis of immune-related genes in the red swamp crayfish, Procambarus clarkii in response to lipopolysaccharide challenge. Fish Shellfish Immunol. 2019, 95, 140–150. [Google Scholar] [CrossRef] [PubMed]
  25. Meng, Q.-Y.; Kang, C.-Q.; Dang, W.; Melvin, S.-D.; Lu, H.-L. Minor metabolomic disturbances induced by glyphosate-isopropylammonium exposure at environmentally relevant concentrations in an aquatic turtle, Pelodiscus sinensis. Aquat. Toxicol. 2023, 256, 106415. [Google Scholar] [CrossRef] [PubMed]
  26. Yousefi, M.; Adineh, H.; Reverter, M.; Hamidi, M.K.; Vatnikov, Y.A.; Kulikov, E.V.; Hoseinifar, S.H.; Van Doan, H. Protective effects of black seed (Nigella sativa) diet supplementation in common carp (Cyprinus carpio) against immune depression, oxidative stress and metabolism dysfunction induced by glyphosate. Fish Shellfish Immunol. 2021, 109, 12–19. [Google Scholar] [CrossRef] [PubMed]
  27. Lucia, R.M.; Huang, W.-L.; Pathak, K.V.; McGilvrey, M.; David-Dirgo, V.; Alvarez, A.; Goodman, D.; Masunaka, I.; Odegaard, A.O.; Ziogas, A.; et al. Association of Glyphosate Exposure with Blood DNA Methylation in a Cross-Sectional Study of Postmenopausal Women. Environ. Health Perspect. 2022, 130, 47001. [Google Scholar] [CrossRef] [PubMed]
  28. Velisek, J.; Stara, A.; Zuskova, E.; Kubec, J.; Buric, M.; Kouba, A. Chronic toxicity of metolachlor OA on growth, ontogenetic development, antioxidant biomarkers and histopathology of early life stages of marbled crayfish. Sci. Total Environ. 2018, 643, 1456–1463. [Google Scholar] [CrossRef]
  29. Livak, K.J.; Schmittgen, T.D. Analysis of relative gene expression data using real-time quantitative PCR and the 2−ΔΔCT Method. Methods 2001, 25, 402–408. [Google Scholar] [CrossRef]
  30. Harshitha, R.; Arunraj, D.R. Real-time quantitative PCR: A tool for absolute and relative quantification. Biochem. Mol. Biol. Educ. 2021, 49, 800–812. [Google Scholar] [CrossRef]
Figure 1. Identification of differential expression genes (DEGs) in P. clarkii samples. (A) Volcano plot exhibiting 1109 up-regulated DEGs and 611 down-regulated DEGs between low-dosage AMPA and control P. clarkii samples. (B) Volcano plot exhibiting 1639 up-regulated DEGs and 844 down-regulated DEGs between high-dosage AMPA and control P. clarkii samples. (C) Volcano plot exhibiting 288 up-regulated DEGs and 208 down-regulated DEGs between high-dosage AMPA and low-dosage AMPA P. clarkii samples. (D) Venn diagram represents the overlapping of DEGs from low-dosage AMPA and control, high-dosage AMPA and control, and high-dosage AMPA and low-dosage AMPA P. clarkii samples. (E) Expression levels of LOC123767151 estimated from qPCR in control, low-dosage, and high-dosage AMPA-exposed samples. (F) Expression levels of LOC123774039 estimated from qPCR in control, low-dosage, and high-dosage AMPA-exposed samples. (G) Expression levels of LOC123774908 estimated from qPCR in control, low-dosage, and high-dosage AMPA-exposed samples. DEGs, differentially expressed genes.
Ijms 25 00943 g001
Figure 2. Annotation number of DEGs. (A) The number of GO annotations of DEGs between low-dose AMPA and control P. clarkii samples. (B) The number of GO annotations of DEGs between high-dose AMPA and control P. clarkii samples. (C) The number of GO annotations of DEGs between high-dose AMPA and low-dose AMPA P. clarkii samples. DEGs, differentially expressed genes; GO, gene ontology.
Ijms 25 00943 g002
Figure 3. Functional analysis for DEGs. (A) GO categories of DEGs between low-dose AMPA and control P. clarkii samples. (B) GO categories of DEGs between high-dose AMPA and control P. clarkii samples. (C) GO categories of DEGs between high-dose AMPA and low-dose AMPA P. clarkii samples. (D) KEGG pathway enrichment analysis of DEGs between low-dose AMPA and control P. clarkii samples. (E) KEGG pathway enrichment analysis of DEGs between high-dose AMPA and control P. clarkii samples. (F) KEGG pathway enrichment analysis of DEGs between high-dose AMPA and low-dose AMPA P. clarkii samples.
Ijms 25 00943 g003
Figure 4. Identification of different metabolites in P. clarkii samples. (A) Statistics of differently up-regulated and down-regulated metabolites between low-dosage AMPA and control, high-dosage AMPA and control, and high-dosage AMPA and low-dosage AMPA P. clarkii samples. (B) Metabolite abundance in low-dosage AMPA and control P. clarkii samples. (C) Abundance of metabolites in high-dosage AMPA and control P. clarkii samples. (D) Abundance of metabolites in high-dosage AMPA and low-dosage AMPA P. clarkii samples. (E) Volcano plot exhibiting seven up-regulated metabolites and eight down-regulated metabolites between low-dose AMPA and control P. clarkii sample. (F) Volcano plot showing ten up-regulated metabolites and two down-regulated metabolites between high-dose AMPA and control P. clarkii sample. (G) Volcano plot showing five up-regulated metabolites and two down-regulated metabolites between high-dosage AMPA and low-dosage AMPA P. clarkii sample. (H) Venn diagram represents the overlapping of the different metabolites from three groups.
Ijms 25 00943 g004
Figure 5. Correlation analysis and functional analysis for different metabolites. (A) Correlation analysis of different metabolites between low-dosage AMPA and control P. clarkii samples. (B) Correlation analysis of different metabolites between high-dosage AMPA and control P. clarkii samples. (C) Correlation analysis of different metabolites between high-dosage AMPA and low-dosage AMPA P. clarkii samples. (D) KEGG pathway enrichment analysis of different metabolites between low-dose AMPA and control P. clarkii sample. (E) KEGG pathway enrichment analysis of different metabolites between high-dose AMPA and control P. clarkii sample. (F) KEGG pathway enrichment analysis of different metabolites between high-dose AMPA and low-dose AMPA P. clarkii sample.
Ijms 25 00943 g005
Disclaimer/Publisher’s Note: The statements, opinions and data contained in all publications are solely those of the individual author(s) and contributor(s) and not of MDPI and/or the editor(s). MDPI and/or the editor(s) disclaim responsibility for any injury to people or property resulting from any ideas, methods, instructions or products referred to in the content.

