Article

Bacillus altitudinis AD13−4 Enhances Saline–Alkali Stress Tolerance of Alfalfa and Affects Composition of Rhizosphere Soil Microbial Community

1
Key Laboratory of Saline-Alkali Vegetation Ecology Restoration, Ministry of Education, College of Life Sciences, Northeast Forestry University, Harbin 150040, China
2
College of Life Sciences and Agriculture and Forestry, Qiqihar University, Qiqihar 161006, China
*
Authors to whom correspondence should be addressed.
These authors contributed equally to this work.
Int. J. Mol. Sci. 2024, 25(11), 5785; https://doi.org/10.3390/ijms25115785
Submission received: 21 March 2024 / Revised: 10 May 2024 / Accepted: 15 May 2024 / Published: 26 May 2024
(This article belongs to the Special Issue Molecular Regulatory Mechanisms of Salinity Tolerance in Plants 2.0)

Abstract

:
Saline and alkaline stresses limit plant growth and reduce crop yield. Soil salinization and alkalization seriously threaten the sustainable development of agriculture and the virtuous cycle of ecology. Biofertilizers made from plant growth−promoting rhizobacteria (PGPR) not only enhance plant growth and stress tolerance, but also are environmentally friendly and cost-effective. There have been many studies on the mechanisms underlying PGPRs enhancing plant salt resistance. However, there is limited knowledge about the interaction between PGPR and plants under alkaline–sodic stress. To clarify the mechanisms underlying PGPR’s improvement of plants’ tolerance to alkaline–sodic stress, we screened PGPR from the rhizosphere microorganisms of local plants growing in alkaline–sodic land and selected an efficient strain, Bacillus altitudinis AD13−4, as the research object. Our results indicate that the strain AD13−4 can produce various growth-promoting substances to regulate plant endogenous hormone levels, cell division and differentiation, photosynthesis, antioxidant capacity, etc. Transcriptome analysis revealed that the strain AD13−4 significantly affected metabolism and secondary metabolism, signal transduction, photosynthesis, redox processes, and plant–pathogen interactions. Under alkaline–sodic conditions, inoculation of the strain AD13−4 significantly improved plant biomass and the contents of metabolites (e.g., soluble proteins and sugars) as well as secondary metabolites (e.g., phenols, flavonoids, and terpenoids). The 16S rRNA gene sequencing results indicated that the strain AD13−4 significantly affected the abundance and composition of the rhizospheric microbiota and improved soil activities and physiochemical properties. Our study provides theoretical support for the optimization of saline–alkali-tolerant PGPR and valuable information for elucidating the mechanism of plant alkaline–sodic tolerance.

1. Introduction

Soil salinity and alkalinity represent one of the major global environmental issues that threaten food security and agricultural sustainability. The total area of saline–alkali land in China is about 9.91 × 10⁷ ha [1]. In northeast China, the saline–alkali land mainly contains high concentration of carbonates, including Na2CO3 and NaHCO3; therefore, it is also known as Soda saline–alkali land [1,2,3]. The presence of sodium ions in the soil induces stress, which significantly hampers plant growth [4]. On the other hand, the saline–alkali stress caused by carbonates has more serious impacts on plants than salt stress [5]. Because, in addition to osmotic stress, ion toxicity, and oxidative stress, which are usually caused by salt stress [6,7], alkali stress also causes nutritional deficiency and high pH stress [1,8,9]. The nutrient deficiency mainly refers to the unavailability of nutrients such as phosphorus and iron ions due to the precipitation in alkaline soil [10,11]. Compound saline and alkali stresses can lead to more severe oxidative stress, disruption of ion homeostasis, and metabolic disorders [12,13,14], leading to damage to cell structure and activities, thereby inhibiting plant growth and development. To re–establish osmotic and ion homeostasis to adapt to adverse environments, plant cells rapidly accumulate inorganic ions [15,16] and small organic molecules such as betaine, proline, polyamines, polyols, and sugars [17,18]. For instance, the trehalose biosynthesis process in quinoa leaves is significantly affected under saline–sodic stress [19]. In addition to highly accumulated lipids and amino acids, the energy metabolism and reactive oxygen species (ROS)-scavenging machineries in rice leaves are significantly enhanced under severe saline–sodic stress, such as tricarboxylic acid (TCA) cycle and glutathione metabolism [1]. The accumulation of proline and its derivatives in rice leaves facilitates osmotic balance control, thereby improving plant saline–alkali tolerance [1,20].
Considering the potential threats of saline–alkali stress on ecosystems and food security, significant efforts are needed to improve saline–alkali land. Plant growth–promoting rhizobacteria (PGPRs) play a crucial role in plant growth [21]. For instance, inoculation of Sinorhizobium meliloti GL1 and Enterobacter ludwigii MJM–11 improves the yield, nodulation, and quality of alfalfa in a saline–alkali environment [22,23]. Enterobacter asburiae strain D2 has the ability to produce 1–aminocyclop ropane–1–carboxylate (ACC) deaminase, indole−3−acetic acid (IAA), and siderophore, as well as to solubilize phosphate. It may alleviate the impacts of saline–alkali stress on rice [24]. Bacillus subtilis has been found to enhance crop saline–alkali stress tolerance by preventing excessive sodium accumulation and enhancing nutrient absorption. Application of the bacteria enhances the activities of peroxidase and catalase in leaves, thereby protecting plants from salt stress–induced damage [25]. A combination of Enterobacter sp. Z1 and Klebsiella sp. Z2 can significantly improve soybean growth and nitrogen fixation by producing flavonoids, IAA, salicylic acid (SA), and taurine (51). Enterobacter aerogenes (LJL–5) and Pseudomonas aeruginosa (LJL–13) synergistically increased the biomass of alfalfa plants and improved phosphorus content and antioxidase activities (superoxide dismutase, peroxidase, and catalase) in saline–alkali conditions [26]. A research has shown that the strains Stutzerimonas stutzeri A38 and Bacillus pumilus A49 have the ability to enhance root size in Medicago sativa and Medicago polymorpha plants when exposed to osmotic stress [4]. In addition, PGPRs can also protect plants from heavy metal pollution by regulating the levels of plant endogenous SA, abscisic acid (ABA), and jasmonic acid (JA) [27,28]. Bacillus sp. ZC3–2–1 can improve the phytoremediation efficiency of Cd–Zn–contaminated soil and maintain ion homeostasis by promoting the phytoextraction and immobilization of the metal ions [29,30]. Thus, PGPRs are widely used as biofertilizers to improve crop biomass and yields, and as soil amendments to improve land availability [31,32,33]. Due to its low carbon, environmental friendliness, and cost-effectiveness, PGPR has obtained increasing public acceptance [33,34].
The diversity of microorganisms associated with plant roots with approximately tens of thousands of species, known as the plant’s second genome, plays vital roles in plant development, health, and environmental adaptation in their natural habitats [35,36]. For example, the presence of Enterobacterium and Pseudomonas in soil indicates that exotic species highly rely on rhizosphere microorganisms to fulfill their nutritional needs [37]. The important role of co–evolution and interaction between plants and microorganisms suggest that plants can shape their rhizosphere microbial communities, which proves that different plant species have specific microbial communities when grown in the same soil [38,39]. This complex relationship goes beyond the rhizosphere and involves a diverse range of interactions that have a significant influence on plant vitality and the dynamics of the ecosystem [23,40,41]. Furthermore, recent progress in high–throughput sequencing and omics technologies has given a deeper understanding of the functions and metabolic processes of rhizosphic microbiota [42], revealing the complex involvement of rhizosphic microorganisms in nutrient cycling, the formation of soil structure, and the regulation of plant signaling pathways [42,43]. The acquisition of this knowledge has facilitated the development of novel approaches to exploiting plant–related advantageous characteristics of rhizosphic microorganisms [35]. Furthermore, the recently developed field of microbiome engineering has shown the potential to intentionally alter the rhizosphere microbial populations to enhance plant production and adaptability to environmental changes [44,45].
Various studies have been conducted to investigate the potential role of PGPR in alleviating the impacts of environmental stresses on plants while increasing biomass and yield (Supplementary Table S1). However, there is limited knowledge about the interactions between PGPR and plants under alkaline–sodic stress caused by carbonates. To clarify the mechanisms underlying PGPRs which improve the tolerance of plants to alkaline–sodic stress and the plants response to the PGPR, we isolated PGPRs from the rhizosphere microorganisms of local plants grown in Soda saline–alkali land; selected an effective strain, Bacillus altitudinis AD13−4; and explored the mechanisms underlying its growth–promoting function. Via biochemistry, molecular biology, and transcriptomics analysis, the strain AD13−4 was clarified to improve plant adaptation to alkaline–sodic environments by regulating plant metabolism, signal transduction, and plant–pathogen interaction, as well as by affecting the abundance and composition of the rhizosphere microbial community. Our study provides theoretical support for the optimization of saline–alkali–tolerant PGPR and valuable information for elucidating the alkaline–sodic tolerance mechanism of plants.

2. Results

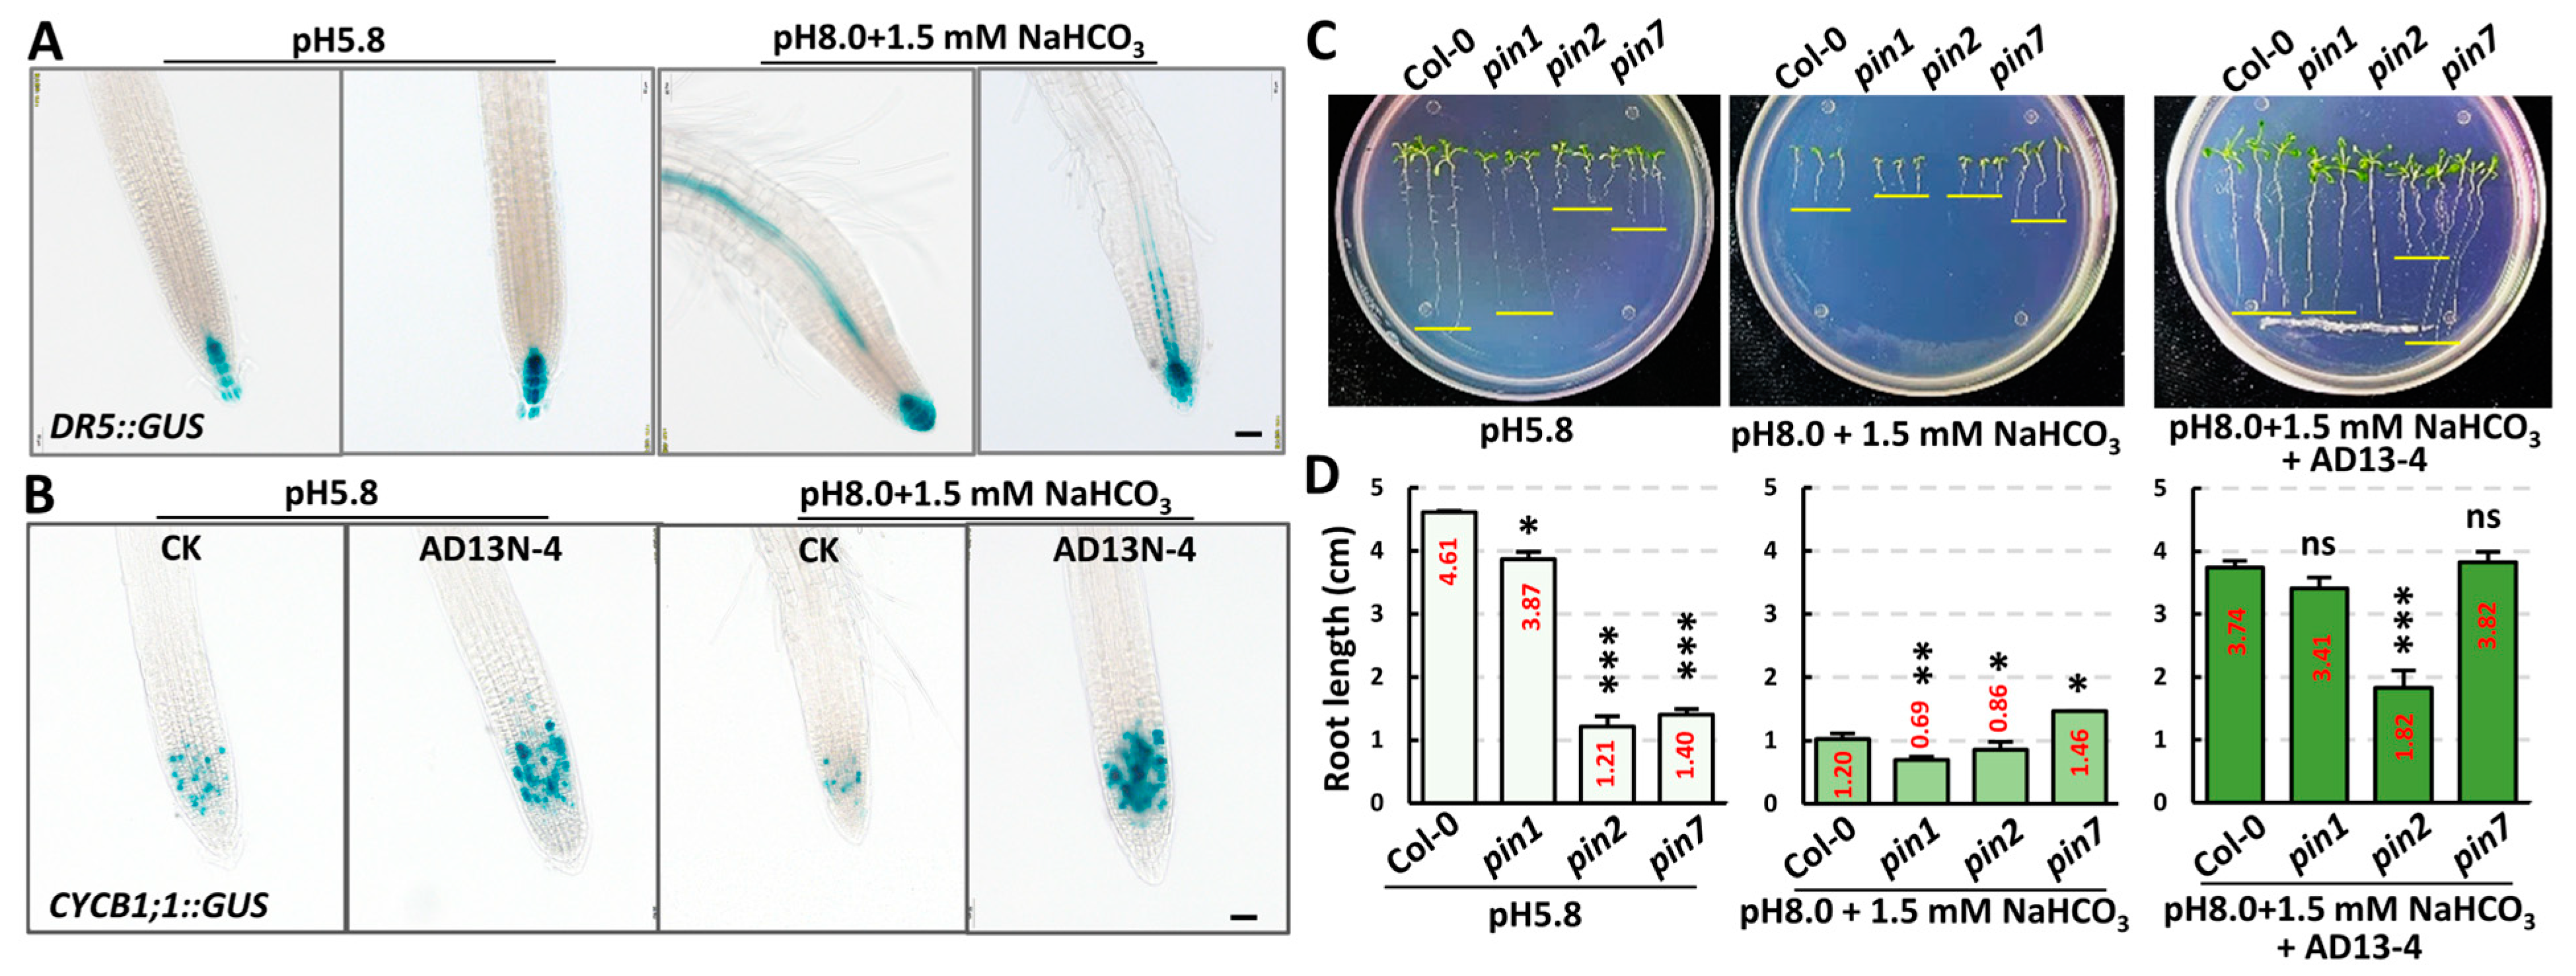
2.1. Bacillus Altitudinis AD13−4 Promoted Plant Growth and Development under Saline–Alkali Stress

To illustrate the growth–promoting mechanisms of PGPR under alkaline–sodic stress, we screened PGPR using carbonate medium (1/2MS, pH 8.0, 1.5 mM NaHCO3) to simulate an alkaline–sodic condition. Using Arabidopsis as the plant material, we obtained over 400 PGPR from the rhizosphere microorganisms of local plants growing in Soda saline–alkali land (Anda, Heilongjiang Province, China) and selected an effective strain, AD13−4, for mechanism investigation. As shown in Figure 1A, under normal conditions (pH 5.8), Arabidopsis seedlings with and without inoculation of strain AD13−4 grew well, with no significance. Under alkaline–sodic conditions (pH 8.0 + 1.5 mM NaHCO3), although Arabidopsis seeds germinated, the roots did not elongate and the cotyledons did not expand, indicating severe inhibition of seedling development. However, after inoculation with the strain AD13−4, the growth of the seedlings was restored, and the development of the aerial parts and roots were similar to those under normal conditions (Figure 1A,B). These results indicated that the strain AD13−4 effectively alleviated the growth inhibition of Arabidopsis seedlings under alkaline–sodic stress.
To confirm the plant growth–promoting effects of strain AD13−4, we conducted soil culture experiments with maize, rice, and alfalfa (the optimal concentration of carbonate solution for maize is 80 mM; for rice, 50 mM; and for alfalfa, 40 mM, respectively). The results showed that under saline–alkali conditions, the fresh weight, dry weight, plant height, root length, and chlorophyll contents significantly decreased (Figure 1C,D; Supplementary Figure S1), indicating inhibition of alkaline–sodic stress on photosynthesis and plant biomass. The activities of antioxidant enzymes (superoxide dismutase, peroxidase, and ascorbate peroxidase) significantly increased (Figure 1F; Supplementary Figure S1F), and consistent with this, the ROS-scavenging capacities significantly increased (Figure 1G), indicating an increase in ROS levels which was induced by saline–alkali stress. The malondialdehyde (MDA) content also significantly increased (Figure 1E), indicating that the increased ROS level caused oxidative damage to the membranes. After inoculation of the strain AD13−4, the fresh weight, dry weight, plant height, and chlorophyll contents of the plants significantly increased (Figure 1D,E), indicating an enhancement of photosynthesis and plant growth and development. The antioxidant enzyme activities and ROS-scavenging capacities also significantly increased, while the content of MDA was significantly reduced (Figure 1F,G), suggesting that the strain AD13−4 improved plant antioxidant capacities, which alleviated oxidative damage to the membranes. The contents of total proteins and sugars significantly increased, while that of proline significantly decreased (Figure 1E), suggesting that plant metabolism was regulated by strain AD13−4 to adapt to saline–alkali condition. All these results indicate that strain AD13−4 regulates plant antioxidant capacities and metabolic processes to adapt to saline–alkali conditions and improves plant growth and development. And the growth-promoting effects of strain AD13−4 are efficient and broad–spectrum.

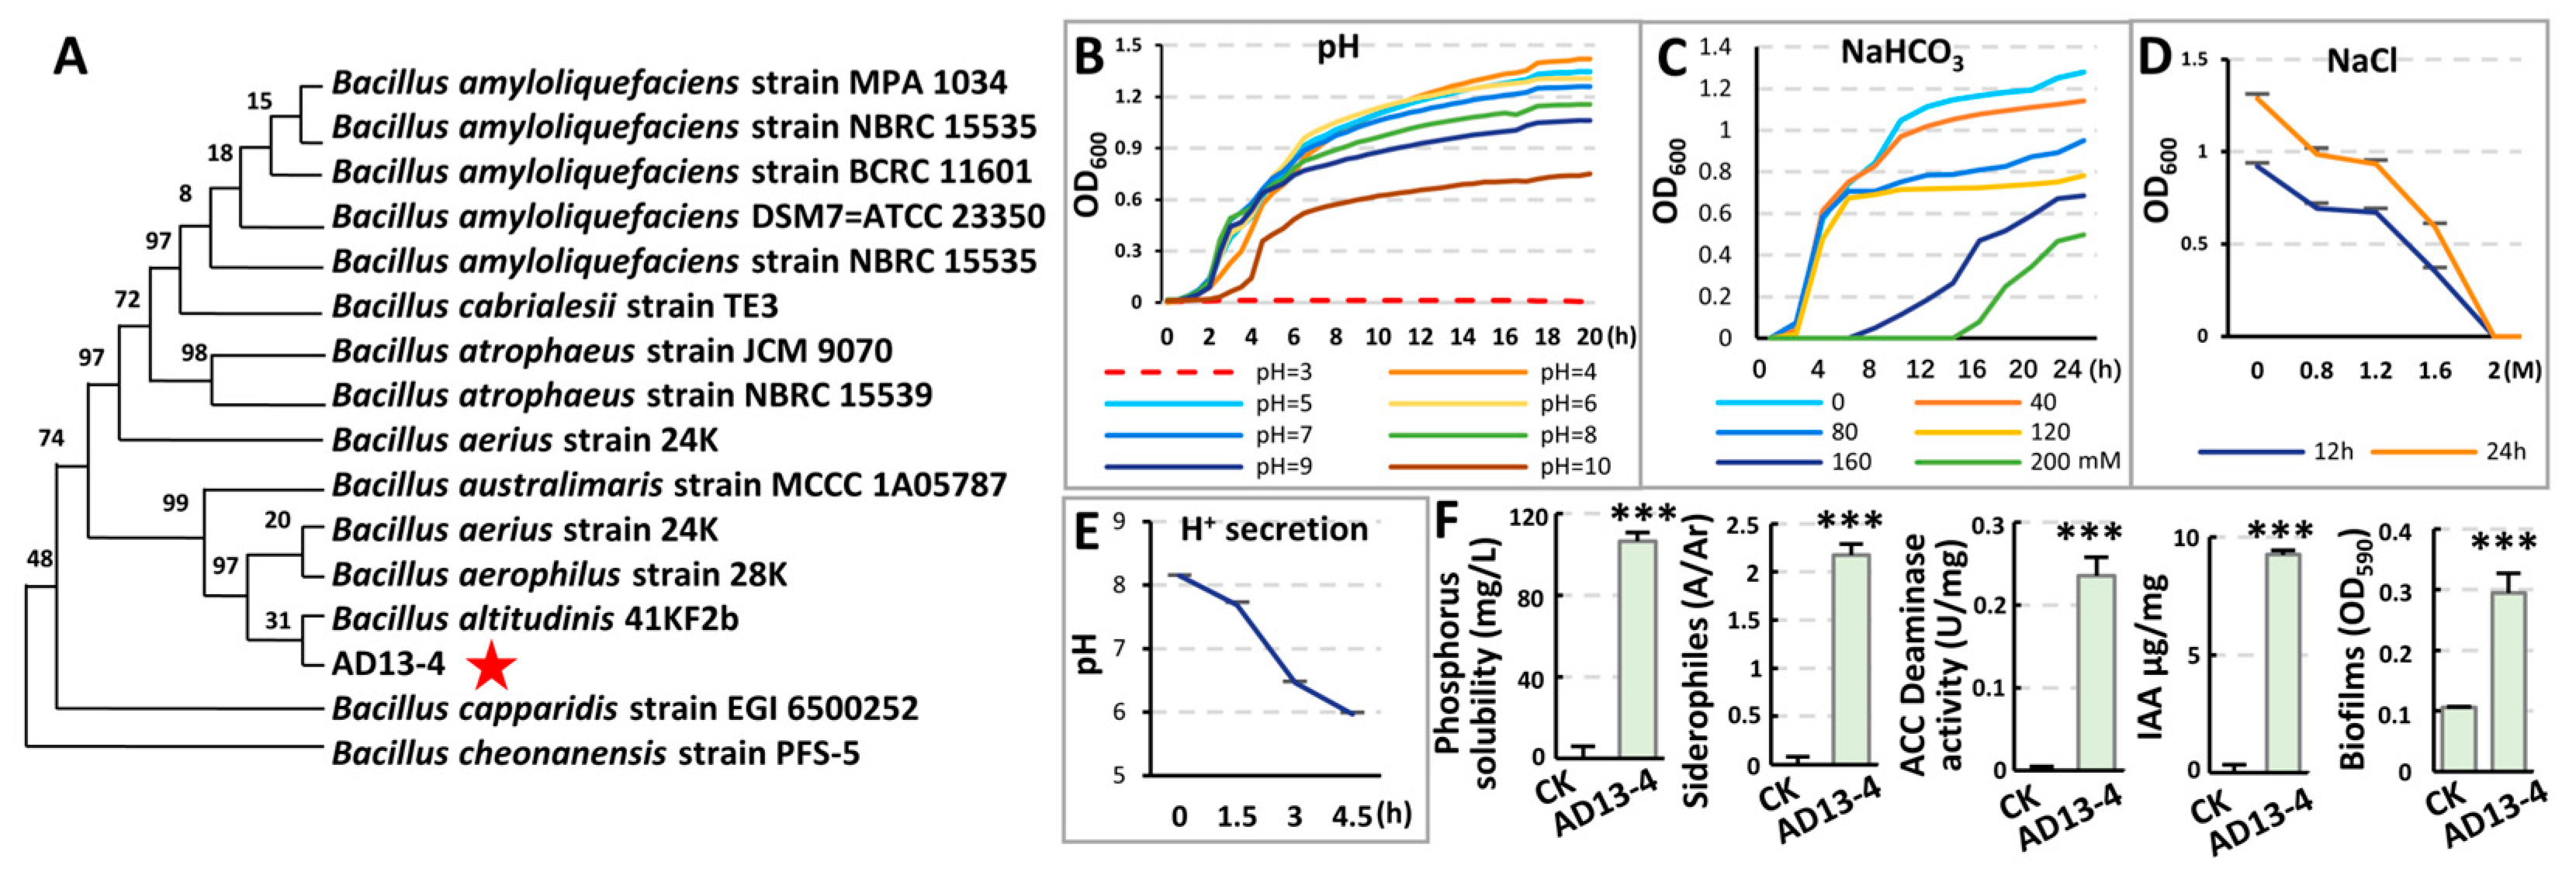
2.2. Identification and Characteristics of Strain AD13−4

To identify the genus of strain AD13−4, the 16S rRNA fragment was amplified and sequenced. By blasting the NCBI database and phylogenetic tree analysis, strain AD13−4 was identified as a bacterium belonging to the genus Bacillus altitudinis, with 99.16% homology with the Bacillus altitudinis 41KF2b (Figure 2A). The AD13−4 colonies on nutrient agar were yellow and transparent, convex with a regular margin, and 2–3 mm in diameter after 14 h incubation. Strain AD13−4 utilized tartrate, Simmons’s citrate, and malonate as the sole carbon sources, respectively (Supplementary Table S2). In summary, strain AD13−4 is a novel bacterium belonging to the genus Bacillus altitudinis.
As a PGPR that functions under saline–alkali conditions, strong salt and alkali tolerance is necessary. First, we checked pH tolerance of strain AD13−4. The OD600 value of the bacterial culture with different pH showed that strain AD13−4 could not survive under the pH 3 condition, but could grow well under pH 4–9 conditions. Under the pH 10 condition, the concentration of bacteria culture after 20 h cultivation was significantly lower than those under pH 4–9 conditions, which was 52.5% of that under the pH 4 condition (Figure 2B). These results indicate that strain AD13−4 has a wide pH adaptation range.
Next, the alkali tolerance of strain AD13−4 was checked. The concentrations of bacterial culture after 24 h cultivation with NaHCO3 indicated no significant difference in the growth of strain AD13−4 under a 40 mM NaHCO3 condition. As the concentration of NaHCO3 increased, the proliferation ability of strain AD13−4 decreased, but it could still maintain a certain degree of growth and reproduction. Even when the NaHCO3 concentration reached 200 mM, strain AD13−4 could still survive (Figure 2C), indicating that strain AD13−4 has a strong tolerance to alkali stress. Then, the salt tolerance of strain AD13−4 was checked. The concentrations of bacterial culture showed that strain AD13−4 could grow and proliferate in a high NaCl concentration of 1.6 M, but could not survive when the NaCl concentration reached a high concentration of 2 M (Figure 2D), indicating that strain AD13−4 has a strong tolerance to salt stress.
To confirm the effects of secretions of strain AD13−4 on plants, Arabidopsis seeds were sown on the regular or carbonate medium containing cell−free fermentation broth of AD13−4. While, the seedlings didn’t show significance compared to those grown with inoculation of strain AD13−4. To investigate the growth−promoting mechanism of strain AD13−4, its secretions were detected. Firstly, the ability of strain AD13−4 to secrete acidic substances was tested. After inoculation of strain AD13−4 into LB medium with pH 8.1, the pH value rapidly decreased to 5.98 after 4.5 h cultivation (Figure 2E), indicating that strain AD13−4 has a strong ability to secrete acidic substances under alkali conditions, which could alleviate the alkalinity of the rhizosphere soil and facilitate root development. Further detection indicated that strain AD13−4 exhibits the activities of solubilizing phosphorus; fixing nitrogen; and producing siderophores, IAA, ACC deaminase, biofilms, and growth-promoting volatile substances (Figure 2F; Supplementary Figure S2A,B). These results indicate that strain AD13−4 can provide available phosphorus, iron ions, and nitrogen sources for plant growth; colonize on the root surface by forming biofilms; regulate plant auxin levels; and alleviate the inhibitory effects of ethylene on plant growth.

2.3. Strain AD13−4 Regulated Endogenous Phytohormone Levels and Cell Division Activity under Alkaline–Sodic Stress

The phytohormone auxin plays a major role in the entire process of plant development and stress response. Auxin enhances plant development by regulating cell division, tissue expansion, stimulus response, etc. [46]. The PIN−FORMED (PIN) auxin exporters redirect auxin fluxes in response to environmental stimuli via their dynamic polar subcellular localizations [47]. Due to the alleviation of root development inhibition by strain AD13−4 under alkaline–sodic stress, we examined its effects on cell division activity using CYCB1;1::GUS, and on the auxin level using DR5::GUS reporter lines, respectively. CYCB1;1 is required for cell division in the M phase, and its expression is significantly induced in response to auxin [48]. On the other hand, cytokinin and auxin jointly regulate plant development [49]. The histochemical staining results indicated that under alkaline–sodic stress, the DR5::GUS signals increased markedly in the stele and columella cells (Figure 3A), while CYCB1;1::GUS signals decreased dramatically in the root apical meristem (RAM) (Figure 3B), suggesting that excessive accumulation of the auxin inhibited cell division and root elongation. After inoculation of strain AD13−4, the auxin level decreased significantly and cell division activity was restored, suggesting that the strain AD13−4 can regulate endogenous phytohormone levels to promote cell division and root elongation. To verify the effects of the strain AD13−4 on plant endogenous hormone levels, we observed the growth phenotypes of the pin mutants after inoculating strain AD13−4 under saline–alkali conditions. As shown in Figure 3C,D, under normal conditions, the root lengths of pin1, pin2 and pin7 were significantly shorter than those of the wild type, especially pin2 and pin7. Under alkaline–sodic conditions (pH 8.0 + 1.5 mM NaHCO3), the root lengths of Col-0, pin1, and pin2 significantly decreased, while that of pin7 did not show significant change and was longer than that of Col-0. After inoculation with strain AD13−4, the root lengths of Col-0 and pin mutants significantly increased. There was no significant difference between Col-0, pin1, and pin7, while root length of pin2 was significantly shorter than these lines. These results indicated that strain AD13−4 significantly affected auxin transport and distribution as well as cell division activity, thereby promoting plant development under saline–alkali stress. The different change patterns in the root length of the pin mutants after the treatments indicated that PIN1, PIN2, and PIN7 have different response mechanisms to alkaline–sodic stress and strain AD13−4.
The outermost layer of cells at the tip of the root cap that are about to detach or have already detached from the root cap are called border cells. The differentiation of border cells is regulated by stem cell activity and auxin [50]. Under alkaline–sodic conditions, the differentiation frequency of border cells with application of strain AD13−4 was significantly higher than that without AD13−4 (Supplementary Figure S2C,D). This result suggested that strain AD13−4 may modulate cell differentiation via affecting root stem cell activity and auxin levels.

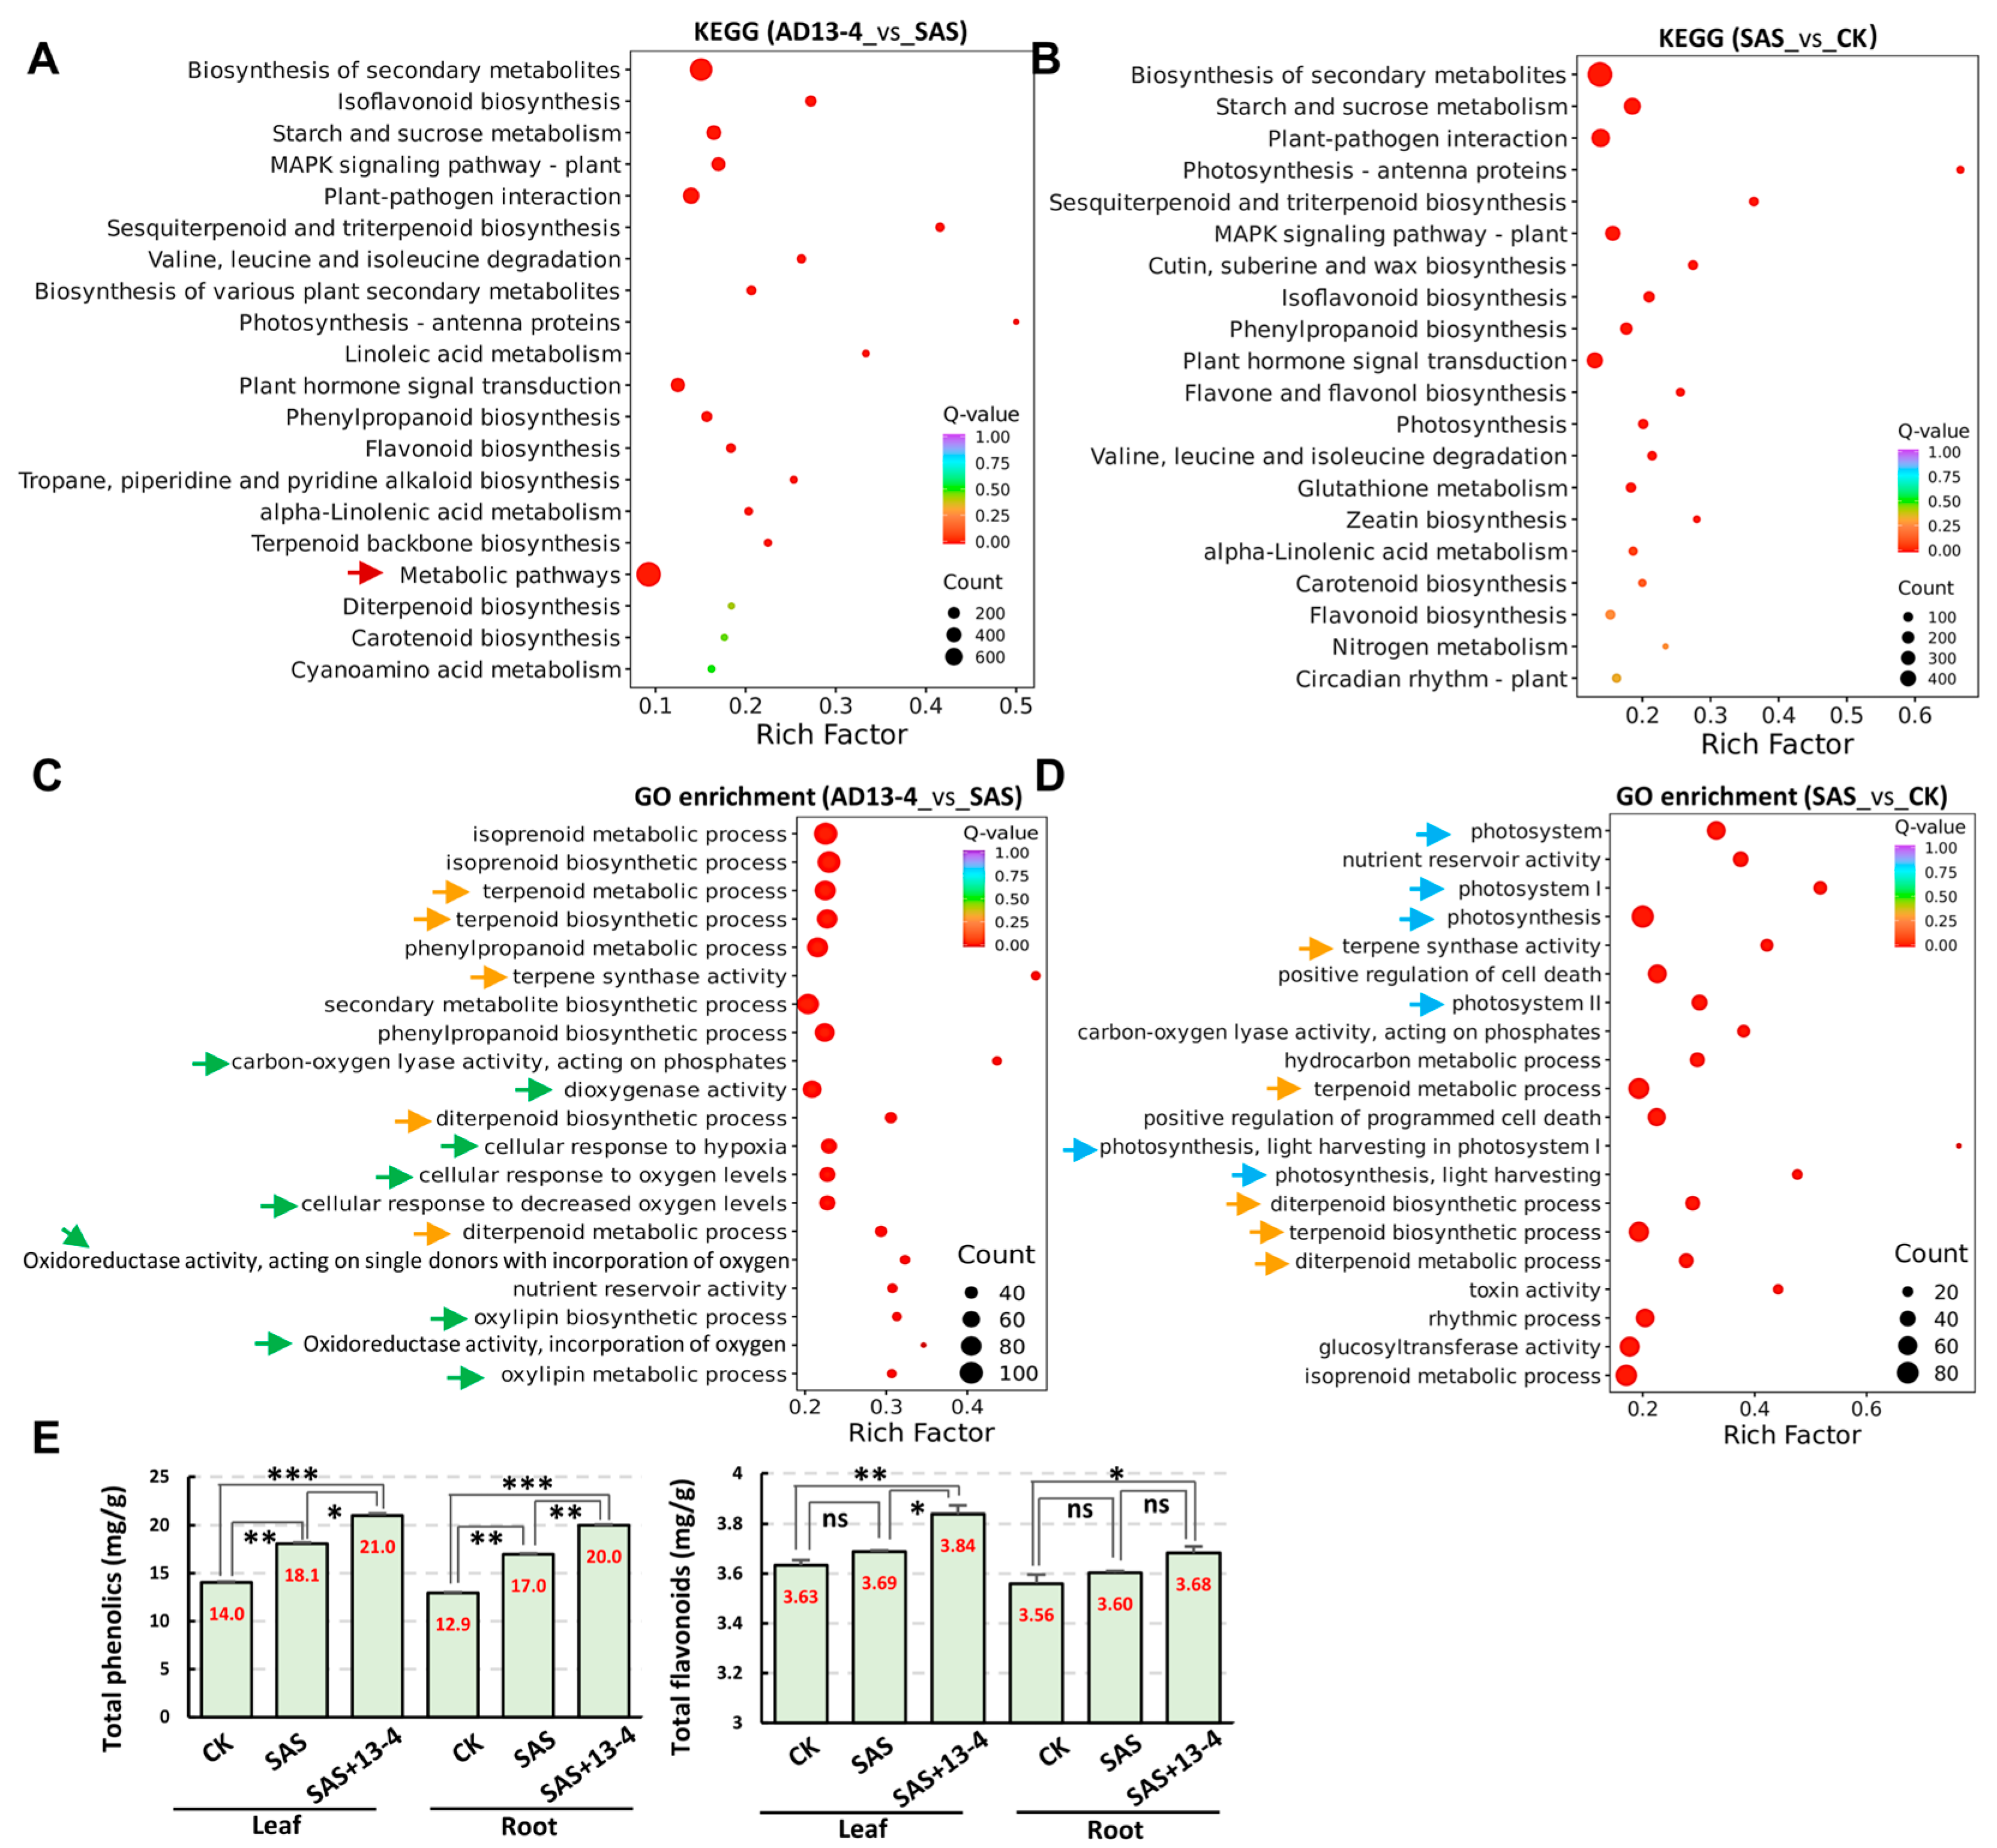
2.4. Transcriptome Analysis of Alfalfa root Response to Strain AD13−4 under Alkaline–Sodic Conditions

To elucidate the molecular mechanisms of plant response to strain AD13−4 under alkaline–sodic stress, we conducted transcriptome analysis using alfalfa roots treated with a 40 mM carbonate solution. The experimental materials were divided into three groups: CK (treated with water), SAS (saline–alkali stress, treated with carbonate solution), and SAS + AD13−4. A total of 599.97 Mb of clean reads were obtained, with a Q30 > 93.5% and GC content ranging from 41.34% to 42.08%. These results confirmed the high quality of the assembled transcripts.
The principal component analysis (PCA) revealed significant differences among the three groups (Figure 4A). The PC1 score plots indicated good cohesion within each group, and the PC2 score plots indicated significant separation between the groups. A total of 6490 differentially expressed genes (DEGs) were identified using DESeq2 R package (v. 1.22.1). In the SAS_vs._CK group, there were 1256 DEGs upregulated and 2455 downregulated, while in AD13−4_vs._SAS group, there were 1710 DEGs upregulated and 2,486 downregulated DEGs (Figure 4B). Venn-diagram analysis indicated that there were 2779 and 2294 DEGs unique to the SAS_vs._CK and AD13−4_vs._SAS groups, respectively, while 1417 DEGs were common to the two groups (Figure 4C).
The comparison of Kyoto Encyclopedia of Genes and Genomes (KEGG) pathways between AD13−4_vs._SAS and SAS_vs._CK groups showed significant changes in many pathways under both AD13−4 and SAS conditions, including secondary metabolism, photosynthesis, signal transduction, plant–pathogen interactions, phenylpropanoid biosynthesis, etc. (Figure 5A,B). In addition, in the AD13−4_vs._SAS group, there were significant changes in metabolic pathways (Figure 5A, arrow). These results indicated that the above pathways responsive to alkaline–sodic stress were also regulated by strain AD13−4, thereby alleviating the impacts of alkaline–sodic stress on alfalfa.
Gene ontology (GO) analysis showed that the DEGs were classified into thirty-two subcategories in three main categories: fifteen subcategories in Biological Processes (BP), two in Cellular Components (CC), and fifteen in Molecular Functions (MF). The DEG distribution patterns in AD13−4_vs._SAS and SAS_vs._CK groups were similar (Supplementary Figure S3). A comparison of GO enrichment pathways between AD13−4_vs._SAS and SAS_vs._CK indicated significant enrichment in the terpenoid biosynthesis and metabolic pathways in both groups (Figure 5C,D, orange arrows), while the redox reaction pathways were specifically enriched in AD13−4_vs._SAS (Figure 5C, green arrows) and the photosynthesis pathways were specifically enriched in SAS_vs._CK (Figure 5D, blue arrows), indicating that these processes were important for plants to adapt to the alkaline–sodic environments, or for strain AD13−4 to alleviate alkaline–sodic stress. We also detected the contents of total phenols and total flavonoids. The results indicated that under alkaline–sodic stress, the total phenolic content significantly increased, but the total flavonoid content had no significance. After inoculation of strain AD13−4, both of them significantly increased (Figure 5E), indicating that strain AD13−4 can regulate secondary metabolic processes, thereby improving plant alkaline–sodic tolerance.
Due to the significant difference in DEG enrichment between AD13−4_vs._SAS and SAS_vs._CK, we analyzed the expression of the common DEGs shown in the Venn plot. The results indicated that 114 of the common genes were downregulated under alkaline–sodic stress and upregulated after inoculation of AD13−4. Conversely, 327 of the common genes were upregulated under alkaline–sodic stress and downregulated after inoculation of strain AD13−4 (Supplementary Figure S4), suggesting that these DEGs were not only specifically regulated by alkaline–sodic stress, but also by strain AD13−4 to improve plant adaptation to alkaline–sodic stress.

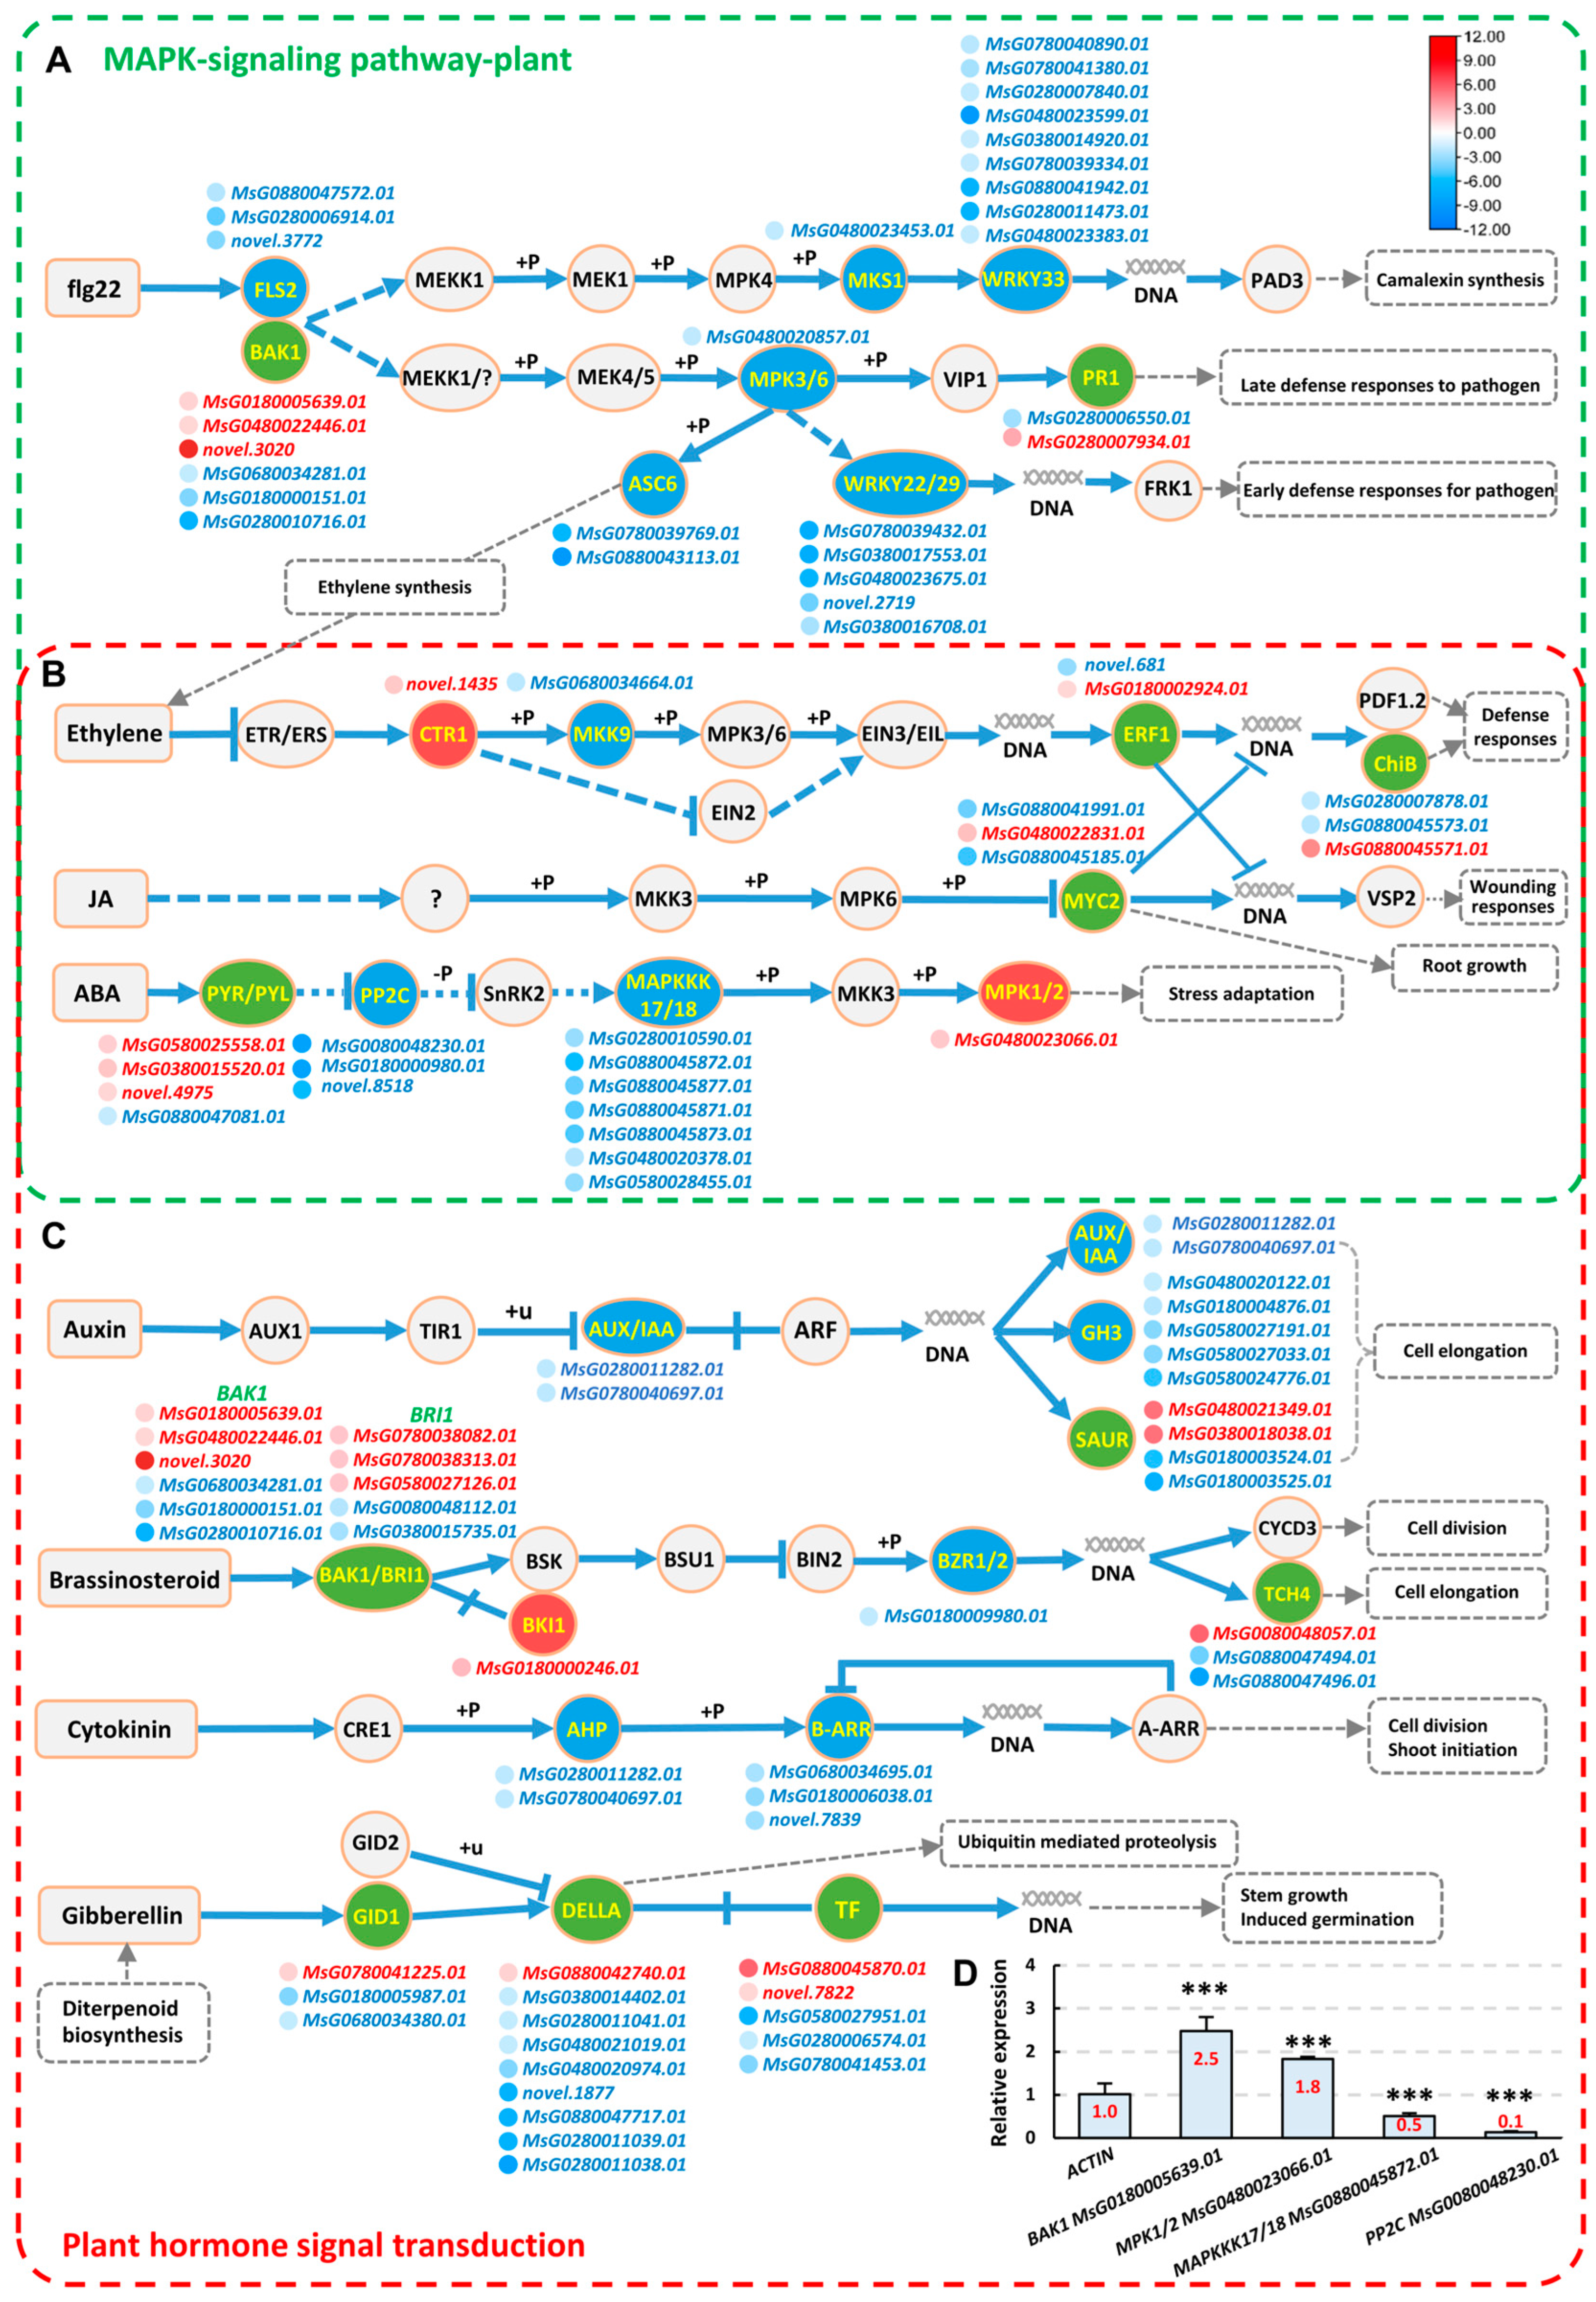
2.5. Analysis of Signaling Pathways Responsive to Strain AD13−4 under Alkaline–Sodic Stress

We conducted an in−depth analysis of the signaling pathways of the AD13−4_vs._SAS group. The signal transduction pathways of alfalfa in response to AD13−4 under alkaline–sodic conditions include two pathways, the MAPK signaling pathway and plant hormone signal transduction. The MAPK signaling pathways included pathogen infection (flg22), pathogen attack (H2O2), phytohormone (JA, ethylene, and ABA), and ROS–related pathways (Figure 6, green frame, part of the pathways; Supplementary Figure S5A). And the plant hormone signal transduction pathways included auxin, cytokinin, gibberellin, ABA, ethylene, JA, SA, and Brassinosteroid–related pathways (Figure 6, red frame, part of the pathways; Supplementary Figure S5B). These two processes had some overlapping parts, such as the ethylene, JA, and SA−related pathways (Figure 6B). Moreover, the flg22−induced pathways were also included in plant–pathogen interaction pathways (Figure 6A). The expression levels of many key genes in these pathways were altered significantly after inoculation of AD13−4, such as FLS2, BAK1, MPK1/2, PR1, MYC2, SAUR, GELLA, PP2C, etc., indicating that strain AD13−4 activated the signaling pathways to enable plants to respond and adapt to alkaline–sodic stress. The RT−qPCR validation results of some of the genes were consistent with those of the transcriptome (Figure 6D). The above results indicate that the strain AD13−4 regulates plant tolerance to alkaline–sodic stress by affecting signal transduction pathways.
In the stress response signaling pathways, transcription factors (TFs) serve as bridges, transmitting stimulus signals by binding to cis–regulatory elements in the promoters of the target genes. A total of 243 differentially expressed TFs were identified. The top five families were AR2/ERF, MYB, NAC, WRKY, and bHLH, which broadly respond to both biotic and abiotic stresses (Supplementary Figure S6). Interestingly, compared to the seven bZIP and eight C2C2–Dof TFs identified in SAS_vs._CK group, only one bZIP and four C2C2–Dof TFs were identified in AD13−4_vs._SAS group. Moreover, the TF number in MYB and bHLH families in SAS_vs._CK group significantly decreased compared to those in SAS_vs._CK group (Supplementary Figure S6B). The bZIP, MYB, and bHLH family TFs are frequently involved in plant stress responses, and the Dof family is also reported to be involved in saline–alkali stress response in rice [1]. The decrease in the number of these TFs in AD13−4_vs._SAS group reflected that the strain AD13−4 alleviated the impacts of alkaline–sodic stress on plants.

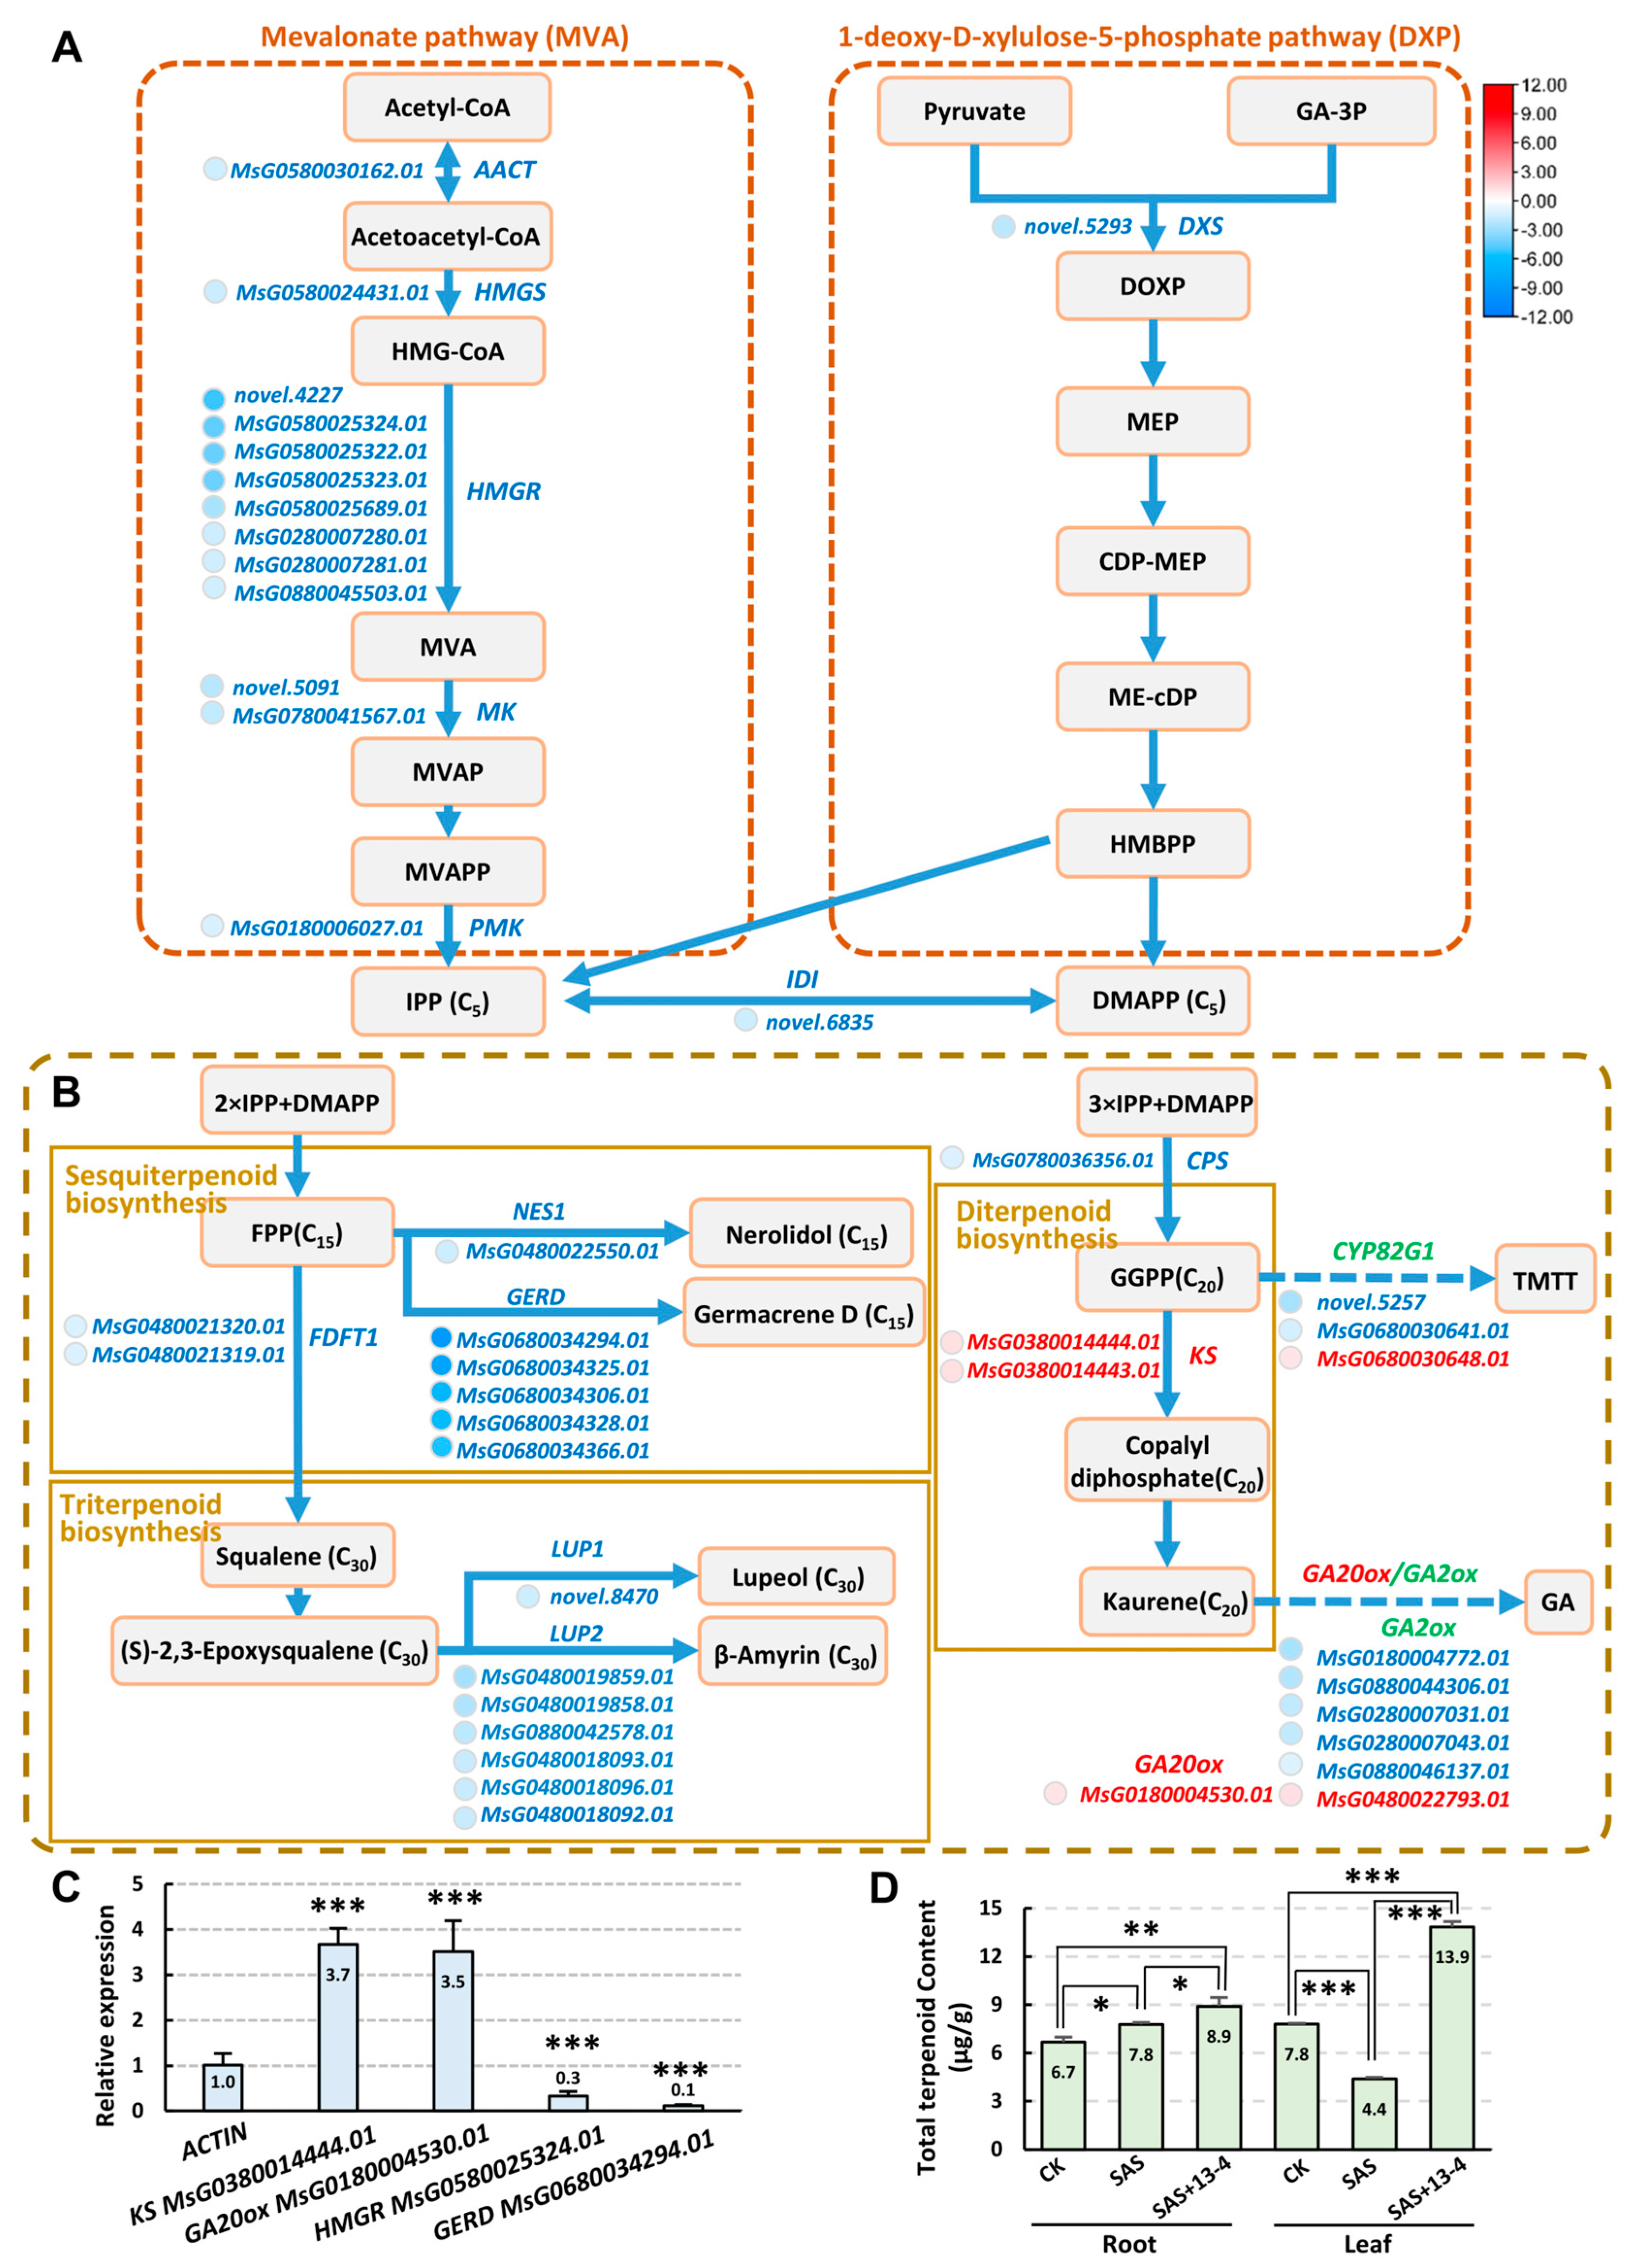
2.6. Analysis of Metabolic Pathways Responded to Alkaline–Sodic Stress

In plants, all terpenoids are derived from isopentenyl diphosphate (IPP) and its enzymatically interconvertible isomer dimethylallyl diphosphate (DMAPP), which are generated from the mevalonate (MVA) and 2−C−methyl−D−erythritol−4−phosphate (MEP/DXP) pathways, respectively [51] (Figure 7A). In the MVA pathway, most of the synthetase genes were downregulated, suggesting a possible reduction in IPP contents. In addition, downregulation of IDI, the IPP–DMAPP converting enzyme gene, may also lead to a decrease in IPP and DMAPP production. In sesquiterpenoid, triterpenoid, and diterpenoid biosynthesis pathways, the expression levels of many synthase genes had significant changes (Figure 7B). The RT−qPCR results of some of the genes were consistent with those of the transcriptome (Figure 7C), suggesting potential changes in the production of terpenoids. To verify the speculation, we determined the contents of total terpenoids. Under alkaline–sodic conditions, the total terpenoids significantly increased in the roots, but sharply decreased in the leaves, while after inoculation of strain AD13−4, the total terpenoids significantly increased in both the roots and leaves, especially in the leaves, and the total terpenoid contents increased by over three times compared to that before inoculation (Figure 7D). These results indicate that the strain AD13−4 regulated the plant secondary metabolism to enable plants to adapt to alkaline–sodic soil.

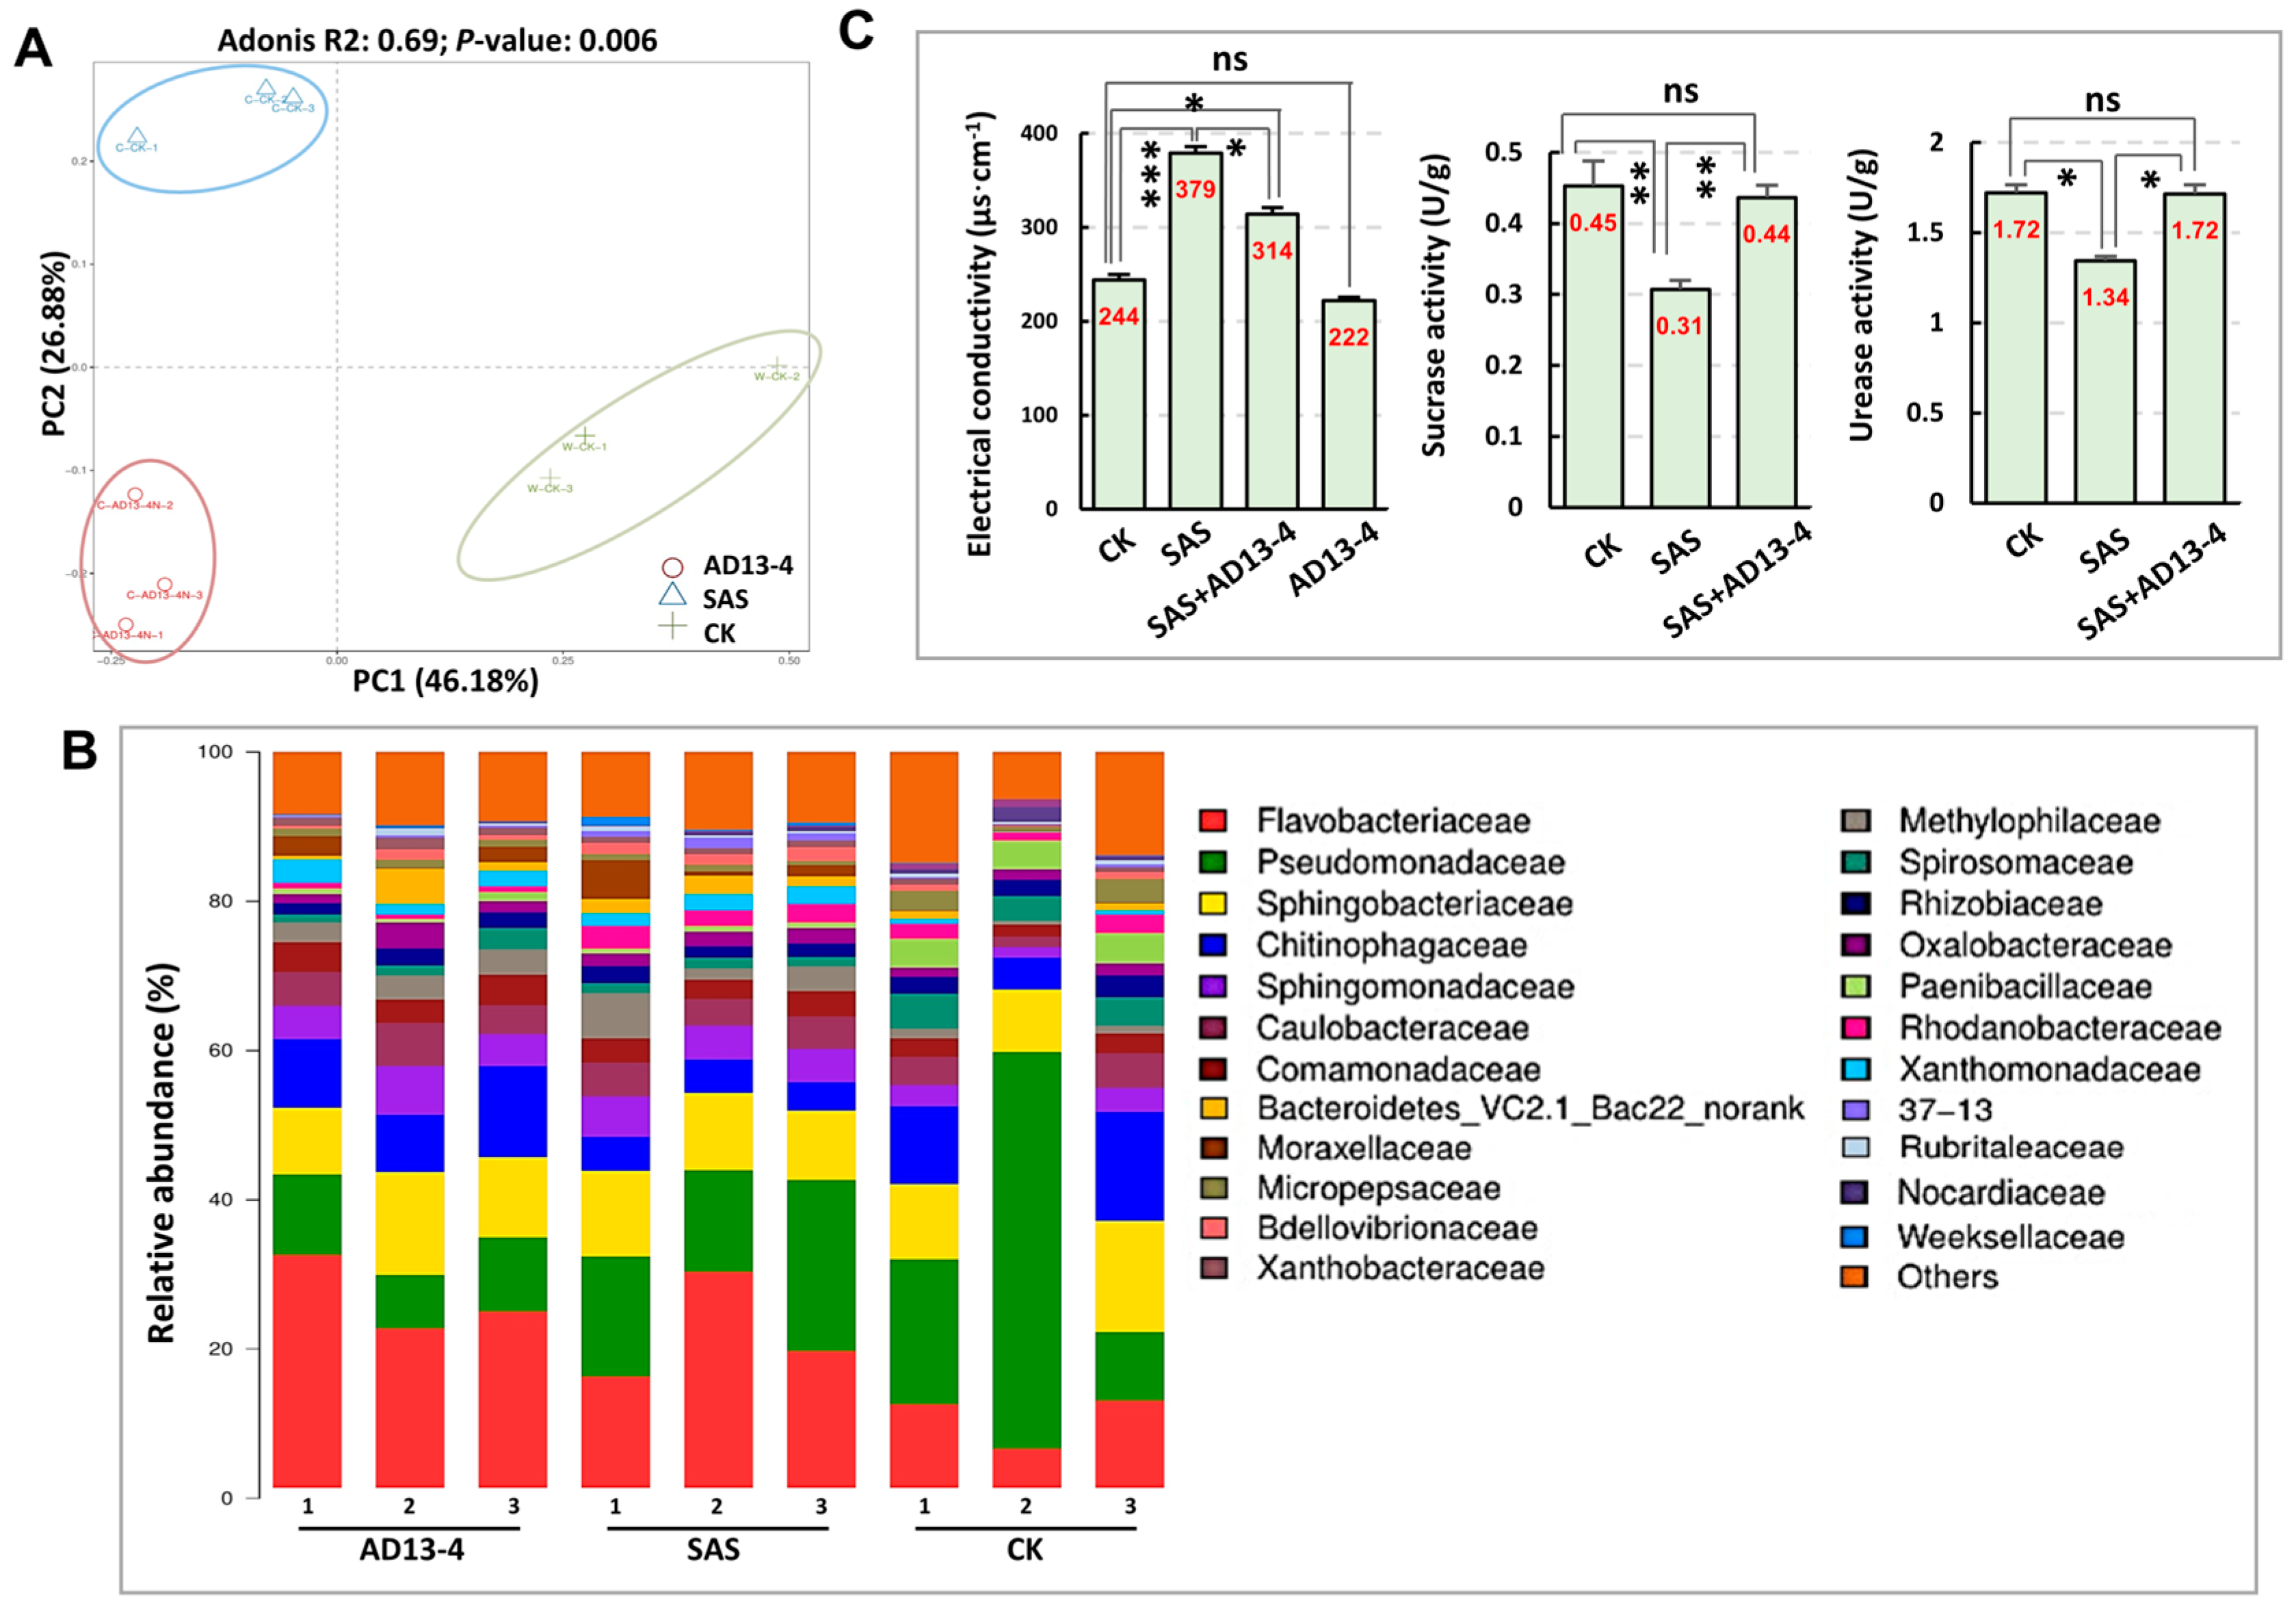
2.7. Impacts of Strain AD13−4 on Rhizosphere Bacterial Community

Since PGPR can promote soil metabolism, which is mainly related to the soil microbial community [52], we conducted 16S rRNA gene sequencing of the alfalfa rhizosphere microbiome. The scatter diagrams of PCA with the first (PC1) and the second component (PC2) indicated that the cumulative contribution rates of CK, SAS, and AD13−4 groups were 46.18%, 26.88%, and 63.56%, respectively (Figure 8A). The PC1 score plots indicated the stability and repeatability of the results within each group, and the PC2 score plots indicated a significant difference between the groups (Figure 8A). Analysis of the 16S rRNA gene sequencing results yielded a total of 584,753 optimized sequences and 246,817,741 bases. The similarity of the operational taxonomic unit (OTU) was 97% with a classification confidence of 70% in the optimized reads (with a length of ≥ 400 bp), and the coverage rate of all samples was above 97%, indicating that the sequencing results were reliable. The inoculation of strain AD13–4 did not significantly affect the alpha diversity of bacteria in alkaline–sodic soil (Supplementary Figure S7A). The dominant bacterial phyla were Bacteroidota, Proteobacteria, Firmicutes, Bdellovibrionota, and Verrucomicrobiota. And the community barplot analysis indicated a significant alteration in the composition and proportion of bacterial families in the rhizosphere soil (Figure 8B). The most abundant bacteria were Flavobacteraceae, Pseudomonadaceae, Sphingobacteriaceae, and Chitinophagaceae. After application of strain AD13−4, the proportions of Flavobacteraceae, Chitinophagaceae, Caulobacteraceae, etc., increased; while those of Pseudomonadaceae, Rhodanobacteraceae, Bdellovibrioneceae, etc., decreased; and 37–13 and Weeksellaceae almost disappeared (Figure 8B). These results indicated that strain AD13−4 had impacts on abundance and composition of rhizosphere microbiota in alkaline–sodic soil.
The cladogram, which explains the evolutionary relationships and biodiversity between species, indicated that the rhizosphere microbiota among AD13−4, SAS, and CK groups had significant differences (Supplementary Figure S7B). Lefse analysis of biomarkers showed that Feruginibacter, Polaromonas, and Nubsella were the biomarkers in strain AD13−4−treated alkaline–sodic soil rather than in alkaline–sodic soil and CK soil (Supplementary Figure S7C), suggesting that these bacteria were recruited to the alfalfa rhizosphere by strain AD13−4.
The activity of soil enzymes, a key indicator of soil fertility and abiotic stress, is significantly affected by the soil microbial community [52]. The determination of alfalfa rhizosphere soil properties showed that the electrical conductivity increased significantly, and the activities of urease and sucrase were seriously inhibited under alkaline–sodic stress. However, after inoculation of strain AD13−4, the electrical conductivity significantly decreased, and the activities of urease and sucrase were restored (Figure 8C), indicating that strain AD13−4 can improve the properties and activities of alkaline–sodic soil.

3. Discussion

The various secretions of strain AD13−4 affect the levels of endogenous phytohormones, which in turn affect plant metabolism; the cell division activity of the meristem; as well as cell differentiation, e.g., root cap and border cell. The root border cells protect continuously growing root tips by secreting compounds such as proteins, polysaccharides, phytoalexins, mucus, organic acids, etc. [50,53]. The border cells are crucial for root growth and plant health, as they contribute to nutrient accumulation around the roots and may cause changes in the rhizosphere microbial population by improving the physical and chemical properties of rhizosphere soil and recruiting beneficial microorganisms, thereby affecting the diversity, abundance and composition of rhizosphere microbiota. The metabolites secreted by border cells also have defensive functions [54]. For example, a certain flavonoid compound in alfalfa roots can inhibit the growth of trichomonas in soil [55]. The detachment frequency of border cells is regulated by a complicated mechanism involving the expression of a series of TFs, quiescent center identity, stem cell activity, and auxin distribution and concentration [50]. In our study, the frequency of boundary cell generation was significantly higher in the present of strain AD13−4 (Supplementary Figure S2C,D), suggesting that AD13−4 may accelerate border cell differentiation by affecting endogenous phytohormone levels. In turn, increased abundance of rhizospheric microbiota rewards vigorous plant growth and stress tolerance, indicating a mutually beneficial interaction between plants and PGPRs [35,55,56]. The increase in the abundance of beneficial microorganisms in rhizosphere soil promotes carbon and nitrogen cycling in soil, which helps to improve the effectiveness of nutrients in the soil [57].
The application of strain AD13−4 affected plant physiological processes, e.g., primary and secondary metabolism. In the secondary metabolic processes, the terpenoid and flavonoid biosynthesis pathways were altered significantly after the application of strain AD13−4. Terpenoids are the most abundant and structurally diverse metabolites in plants, and play a crucial role in plant growth and development and adaptation to environments [56,58,59,60,61]. In plants, all terpenoids are derived from IPP and DMAPP, which are generated from the MVA and MEP/DXP pathways, respectively [51]. The total terpenoid contents in alfalfa roots and leaves showed different change patterns under alkaline–sodic stress (Figure 7D). This phenomenon suggested a different response of roots and leaves to alkaline–sodic stress, or/and a long−distance transport of terpenoids from leaves to roots directly struggling with alkaline–sodic stress. After the application of strain AD13−4, the total terpenoid contents increased significantly in both roots and leaves (Figure 7D), indicating that strain AD13−4 activated the terpenoid biosynthesis pathways in both tissues to improve plant tolerance to stress.
In the MVA pathway, 3–hydroxy–3–methylglutaryl–CoA reductase (HMGR) is the first rate–limiting enzyme, closely related to oxidative stress, proliferation, ER morphogenesis, and plant response to hormones [51]. IPP is not only a precursor of terpenes, but is also used to produce brassinosteroids, cytokinins, and phytosterols, which are crucial for cell membrane fluidity and plant growth and development [62,63]. After the application of strain AD13−4, the HMGR expression levels altered significantly, which may have affected IPP contents and, subsequently, antioxidant capacities, endogenous phytohormone levels, cell activities, etc., in plants. Geranylgeranyl diphosphate (GGPP) is a substrate not only for the synthesis of diterpenoids, but also for several important plant hormones, such as gibberellin, abscisic acid, and strigolactone. In addition, GGPP is a precursor of carotenoids and chlorophyll and an important joint in several important secondary metabolic pathways in plants [58]. The changes in upstream and downstream gene expression levels (Figure 7B,C) may cause changes in GGPP contents, thereby affecting phytohormone levels and photosynthesis. All the changes suggest crucial roles of the strain AD13−4 in the regulation of plant growth and development and adaptation to environmental stresses.
There was also a significant change in phenylpropanoid biosynthesis in KEGG enrichment analyses (Figure 5A,B). Phenylpropanoid metabolites mainly include flavonoid and lignin biosynthesis pathways. Salt stress induces the biosynthesis of flavonoid compounds, which in turn act as antioxidants to reduce salt stress–induced oxidative damage [6]. Studies on tomato roots found a significant increase in phenylpropane synthesis genes and metabolites under salt stress [49]. It was recently reported that, to adapt to high saline–alkali stress, rice leaves accumulate a large amount of lipids, organic acids, organic oxygen compounds, phenylpropanoids, and polyketides [1]. In alfalfa roots, a large amount of DEGs were enriched in Phenylpropanoid biosynthesis pathways after application of strain AD13−4, and the increase in total flavonoid contents once again emphasized the importance of this pathway in plant adaptation to alkaline–sodic environment.
The inoculation of Bacillus altitudinis AD13−4 significantly improved the physical and chemical properties and activities of soil, as well as rhizospheric microbiota composition and abundance, which might contribute to the alleviation of alkaline–sodic stress on plants. At the family level, the relative abundance of Flavobacteraceae and Chitinophagaceae, which belong to Bacteroidota, increased after inoculation of AD13−4. It has been reported that the bacteria in Bacteroidota might enhance soluble phosphorus in soil by secreting phosphorus−solubilizing enzymes. And Bacteroidota and Firmicutes can synergistically degrade rice straw in paddy fields [64]. Furthermore, the relative abundance of some biomarkers, Caulobacteraceae, Feruginibacter, Polaromonas, and Nubsella, increased after applying strain AD13−4. Many strains of Caulobacteraceae, which belongs to Proteobacteria, have the ability to fix nitrogen and participate in the nitrification process to increase soil nutrients [29,65]. Feruginibacter is often found in activated sludge for treating various types of wastewater, secrets a large amount of extracellular polymers, and is related to the formation of sludge flocs and biofilms [66,67,68,69]. Polaromonas has been reported to potentially influence plant acclimation and resilience to cold stress [70]. And Nubsella zeaxanthinifaciens gen. nov., sp. nov. belongs to the family Sphingobacteriaceae and produces Zeaxanthin, the major carotenoid pigment [71]. The carotenoids act as a source of retrograde signals with impacts on plant development and stress responses [72]. Flavobacteriaceae is considered as a key polysaccharide-degrading bacterium [73]. The organic macromolecules in nature can be hydrolyzed by microorganisms, e.g., Flavobacteriaceae strain F89T [19], and used as a source of nutrition and energy, which are beneficial for plant growth and adaptation to the environment. Flavobacterium strain TRM1 can suppress R. solanacearum disease development in a susceptible plant, revealing its role in protecting plants from microbial pathogens [74]. The beneficial bacteria (which could be called PGPR) promote nitrogen, carbon, and phosphorus cycling by increasing soil enzyme activities to increase soil nutrient contents and enhance plant resistance to biotic and abiotic stress. The increase of above bacteria suggest that strain AD13−4 plays a crucial role in recruiting beneficial bacteria to enhance soil activity, plant growth and development, as well as disease resistance. Biofilms facilitate the colonization of PGPRs on the surfaces of roots, thereby achieving a stable growth–promoting function [51]. The strong ability of strain AD13−4 to form biofilms suggests its high affinity to plant roots, thus providing conditions for better functional utilization.
Our reevaluation of the molecular mechanism of alfalfa root response to Bacillus altitudinis AD13−4 provided potential genetic targets for developing alkaline–sodic-tolerant plants. On the other hand, strain AD13−4 can survive well in alkaline–sodic soil, revealing its capacity to colonize and adapt to the interface between soil and plants, which provides a theoretical basis for its application to the improvement of alkaline–sodic land.

4. Materials and Methods

4.1. Plant Materials and Treatments

Arabidopsis seeds (Col-0, DR5::GUS, CYCB1;1::GUS, and pin1/2/7) were surface−sterilized with 75% (v/v) ethanol for 5 min and then washed three times with sterile H2O. The sterilized seeds were sown on regular medium (1/2MS, pH 5.8) or carbonate medium (1/2MS, pH 8.0 + 1.5 mM NaHCO3), which simulated alkaline–sodic conditions. Vertical cultivation was utilized at 22 °C, with 16 h light/8 h dark. To investigate the effects of the secretions of strain AD13−4 on plants, rather than the bacterium itself, Arabidopsis seedlings were photographed before their root tips came into contact with the bacterium. To further confirm the effects of the secretions of strain AD13−4 on plants, its cell−free fermentation broth was used for the germination of Arabidopsis seeds. The bacterium was cultured overnight in 1/2MS liquid medium, and the concentration was adjusted to OD600 = 1, then centrifuged. The supernatant was filtered by a 0.22 μm filter, and then 200 μL of it was applied to the surface of 1/2MS medium or carbonate medium and air−dried. Then, the seeds were sown on the medium with/without the cell−free fermentation broth and vertically cultivated.
For the soil culture, the carbonate solution containing Na2CO3:NaHCO3 = 1:9 (molar ratio) was used to simulate the carbonate composition in Soda saline–alkali land in Northeast China. The treatment was applied once every seven days, a total of three times. Rice (Oryza sativa) seeds germinated at 28 °C for five days were sown in peat soil (PINDSTRUP SUBSTRATE, 5−20 mm, 330 L), with a total of 30 seedlings (three pots per treatment and 10 seedlings per pot). The control group (CK) was treated with water, the SAS group was treated with 50 mM carbonate solution, and the SAS + AD13−4 group was treated with carbonate solution and strain AD13−4. The growth conditions were 26 °C and 10 h light/14 h dark, with a humidity level of 50–70%. Maize seeds (B73, a commercial cultivar in Heilongjiang Province) were sown in peat soil, with a total of 15 seeds (three pots per treatment and 5 seeds per pot). The seeds were treated with water (CK), 80 mM carbonate solution (SAS), or carbonate solution and AD13−4 (SAS + AD13−4). The growth conditions were 22 °C and 16 h light/8 h dark, with a humidity level of 50–70%. Alfalfa (Medicago sativa L.) seeds were sown in peat soil, with a total of 180 seeds (three pots per treatment and 60 seeds per pot). On the fifth day after germination, the seedlings were treated with water (CK), 40 mM carbonate solution (SAS), and carbonate solution and strain AD13−4 (SAS + AD13−4). The growth conditions were 22 °C and 16 h light/8 h dark, with a humidity level of 50−70%. For alkaline–sodic treatment, the rate of carbonate solution:soil (v/v) was about 2:5. Strain AD13−4 (OD600 = 1) was inoculated to the soil [1:50 (v/v)] during the first treatment. For the first treatment, a double volume of carbonate solution was used to thoroughly irrigate the soil.

4.2. Screening of PGPR and Molecular Identification of Strain AD13−4

For isolation of the rhizosphere microorganism, five grams of rhizosphere soil from native plants grown in Soda saline–alkali land in Northeast China (Anda, Heilongjiang Province, China) was added to 45 mL of sterile water, stirred for 15 min, and stewed for 10 min, then 1 mL of the supernatant was taken and added to 9 mL of sterile water and mixed well (the dilution was recorded as 10−1). Then, 1 mL of it was taken, added to 9 mL of sterile water, and mixed well (the dilution was recorded as 10−2), and so on to prepare bacterial suspensions with different dilutions of 10−3, 10−4, 10−5, 10−6, and 10−7. A sample of 0.1 mL of each dilution was evenly spread on LB solid medium and incubated at 30 °C for 2–3 d. Single colonies were selected to separate the bacteria by streaking more than 3 times to obtain a single strain.
To screen PGPR, 1/2MS medium (pH 8.0) containing 1.5 mM NaHCO3 was used to simulate the alkaline–sodic condition, and Arabidopsis Col-0 was used as the plant material. Strains that could significantly promote the growth of Arabidopsis seedlings were considered to be PGPR, including AD13−4. The 16S rRNA gene of AD13−4 was PCR−amplified with specific primers (listed in Supplementary Table S3), and the PCR products were determined by Sanger sequencing. The 16S rRNA sequence was uploaded (gene bank number OR863787, NCBI number SUB14003048) (Supplementary Figure S8). Via blasting in NCBI databases (rRNA/ITS databases), AD13−4 was identified as a bacterium belonging to the genus Bacillus altitudinis. MEGA X was used to construct the phylogenetic tree. Neighbor−joining was used, with 1000 bootstrap replications. The physiological and biochemical identification of Bacillus altitudinis AD13−4 was conducted using Micro−biochemical identification tubes (HOPEBIO, Shanghai, China).

4.3. Physiological Determination and Histochemistry Assay

A quantity of 0.2 g roots of one−month−old alfalfa plants were collected for physiological measurement. Briefly, guaiacol colorimetry was used for the determination of the POD activity, nitro blue tetrazolium photoreduction for SOD activity, and the hydrogen peroxide method for CAT activity, while APX activity was determined according to the reduction in the AsA content [75]. The MDA content was determined using the thiobarbituric acid method, and the proline content using the acidic ninhydrin colorimetry method [1,75]. Three biological replicates per sample were used. Total antioxidant capacity assay kits (Shanghai Enzyme-linked Biotechnology Co., Ltd., Shanghai, China) were used to gauge the radical scavenging capacities of DPPH (515 nm), ABTS (734 nm), and FRAP (593 nm). Three biological replicates per sample were used [76,77]. For the GUS (β–glucuronidase) staining assay, the seedlings were incubated in a GUS staining buffer [80 mM sodium phosphate buffer (pH 7.0), 0.4 mM potassium ferricyanide, 0.4 mM potassium ferrocyanide, 8 mM EDTA, 0.05% Triton X−100, 0.8 mg/mL 5−bromo−4−chloro−3−indolyl−β−D−glucuronide] for 4 h at 37 °C [78]. Three independent experiments per sample were used.

4.4. Determination of Total Phenols, Total Flavonoids, and Total Terpenoids

The root material was the same as that used for physiological determination in 4.3. The procedures for the determination of total flavonoids and total phenolics referred to [75,78]. For determination of total terpenoids, 10 mL of methanol was added to 0.1 g of powder of the tissues, ultrasonicated (80 kW) for 30 min, and left stewing overnight at 4 °C; then, the supernatant was used as a test solution. For standard solution preparation, 25, 50, 100, 150, 200, 300, and 400 μL of 1 mg/mL ursolic acid solution were evaporated dry in an 80 °C water bath, then 200 μL of 5% vanillin ice acetic acid solution and 400 μL of concentrated sulfuric acid were added and incubated in a 60 °C water bath for 15 min, and 5 mL of glacial acetic acid was added. The same volumes of standard solutions were added in the proper order to the test solutions. The absorbance value was determined at 543 nm. The test solutions without addition of ursolic acid were used as control. Three biological replicates per sample were used [79].

4.5. Determination of Salt, Alkali, and pH Tolerance of Strain AD13−4

To investigate the pH tolerance range of strain AD13−4, 1 mL of AD13−4 culture (OD600 = 1) was added to 100 mL of LB liquid medium with different pH values (pH 3−10) and cultured at 30 °C for 20 h. The concentration of the bacterial culture was measured every 2 h and the growth curve was plotted. To investigate the alkali tolerance of strain AD13−4, 1 mL of AD13−4 culture (OD600 = 1) was added to 100 mL LB liquid medium with different concentrations of NaHCO3 (0−200 mM) and cultured at 30 °C for 24 h. The concentration of the bacterial culture was measured every 2 h, and the growth curve was plotted. To investigate the salt tolerance of strain AD13−4, 1 mL of AD13−4 culture (OD600 = 1) was added to 100 mL LB liquid medium with different concentrations of NaCl (0−2 M) and cultured at 30 °C for 24 h. The concentration of the bacterial culture was measured at 12 h and 24 h, and the growth curve was plotted. To determine the H+ secretion ability, 1 mL of AD13−4 culture (OD600 = 1) was added to 100 mL LB liquid medium (pH 8.1) and cultured at 30 °C for 4.5 h. The pH value was measured every 1.5 h.

4.6. Determination of Characteristics of Strain AD13−4

To detect the nitrogen fixation capacity of strain AD13−4, Ashby’s Mannitol Agar medium (10 g/L mannitol, 0.2 g/L KH2PO4, 0.2 g/L MgSO4·7H2O, 0.2 g/L NaCl, 0.1 g/L CaSO4·2H2O, 5 g/L CaCO3) was used. To detect the ability to produce ACC deaminase, DF and ADF medium (T10407, T10408, Saint–bio, Shanghai, China) were used. To detect the ability to produce IAA, the Salkowski colorimetric reaction was conducted. To detect the ability to produce siderophiles, MKB liquid medium (casamino acid 5.0 g, glycerol 15 mL, K2HPO4 2.5 g, MgSO4·7H2O 2.5 g, H2O 1000 mL, pH 7.2) was used. To detect the phosphate solubilization ability, the Molybdenum antimony colorimetric method was employed. To detect the ability to generate biofilms, the Giemsa staining method was used.

4.7. Detection of Rhizospheric Soil Enzymatic Activities

After removing loose soil from the roots, a thin layer of soil attached to the alfalfa root surface was collected as rhizosphere soil. The 3,5−dinitrosalicylate colorimetric method was used to determine sucrase activity at 508 nm. Sodium phenolate was used to determine urease activity at 578 nm [80].
The electrical conductivity (EC) of the saturated soil extract (soil:water = 1:5, w/v) was determined using an EC meter (DDS–11A, Shang Hai Yoke Instrument Co., Ltd., Shanghai, China). The pH values were measured using the saturated soil extract with a pH meter [80]. The rhizosphere soil was the same as that used for 16S rRNA gene sequencing.

4.8. Alfalfa RNA Isolation, Library Construction, RNA Sequencing, and RT−qPCR

The roots used for RNA sequencing were the same as those used for physiological determination in 4.3. The total RNA was extracted using the TRIzol reagent (Invitrogen, Carlsbad, CA, USA) according to the manufacturer’s protocol. The procedures of library construction, RNA sequencing, and RT−qPCR referred to [1]. For RT−qPCR, three independent experiments per sample and three replicates per experiment were used. The primer sequences are listed in Supplementary Table S3. Raw transcriptome reads were deposited in the NCBI Sequence Read Archive (SRA) database (PRJNA1025112).

4.9. Preparation and 16S rRNA Gene Sequencing of Rhizospheric Microbiota

The rhizosphere soils of one−month−old alfalfa plants were collected. The procedure of 16S rRNA gene sequencing referred to [80]. Three replicates per sample were used. Briefly, microbial genomic DNA was extracted using the TruSeqTM DNA Sample Prep Kit (Illumina, San Diego, CA, USA), and the hypervariable region (V3–V4) of the bacterial 16S rRNA genes was amplified using the primers 338F and 806R in an GeneAmp® 9700 PCR thermocycler (Applied Biosystems, CA, USA). The PCR products were purified using an AxyPrep DNA Gel Extraction Kit (Axygen Biosciences, Union City, CA, USA) and quantified using a Quantus™ Fluorometer (Promega, Beijing, China). Purified amplicons were pooled in equimolar amounts and paired−end−sequenced on an Illumina MiSeq PE300 platform (Illumina, San Diego, CA, USA) according to the standard protocols of Majorbio Bio−Pharm Technology Co., Ltd. (Shanghai, China). Raw reads were deposited in the NCBI Sequence Read Archive (SRA) database (PRJNA1028144). The phylogenetic tree was constructed by selecting the Bacillus strains in NCBI database with the highest identity of 16S rRNA sequences to those of AD13−4. MEGA X was used to construct the phylogenetic tree.

4.10. Bioinformatics Analysis

For transcriptomic analysis, alfalfa RNA was extracted according to the protocol using CTAB-PBIOZOL reagent. After identifying and quantifying total RNA using a bioanalyzer (Thermo Fisher Scientific, MA, USA), the mRNA was purified using Oligo(dT) magnetic beads. The cDNA was generated by a reverse transcription kit and then amplified by PCR. The products were purified using Agencourt Ampure XP Beads (A63882, BECKMAN), and then dissolved with EB solution. The double-stranded PCR products were denatured and cycled using a cleaver oligonucleotide sequence. The single-stranded circular DNA (ssCir DNA) format was used for the final library. The library was sequenced on the Illumina HiSeq X Ten platform, and the raw data were filtered using fastp (v 0.23.2), mainly to remove reads with adapters. HISAT was used to locate the clean reads to the alfalfa genome (‘Zhongmu No.1’ alfalfa). FPKM was calculated based on the length of each gene and the number of reads mapped to the genes. The DESeq2 R package (v. 1.22.1, |log2foldchang| ≥ 1 and FDR < 0.05) [81,82] was used to analyze the differential expression between each two groups, and the p value was corrected using the Benjamini and Hochberg method [1]. The enrichment analysis was performed based on the hypergeometric test. For KEGG, the hypergeometric distribution test was performed with the unit of the pathway; for GO, it was performed based on the GO term [1,83].
For rhizospheric microbiota analysis, paired–end reads from the original DNA fragments were merged using FLASH (v 1.2.11, default). Paired-end reads were assigned to each sample according to the unique barcodes. Sequence analysis was performed using the UPARSE software package (v 7.0.1090, http://drive5.com/uparse/, accessed on 20 March 2024) with the UPARSE–OTU and UPARSE–OTUref algorithms. Sequences with ≥97% similarity were assigned to the same OTUs. Representative sequences were picked for OTUs, and the RDP classifier was used to annotate taxonomic information for each representative sequence. In order to compute alpha diversity, we rarified the OTU table and calculated three metrics: Chao1 estimated the species abundance; Observed Species estimated the amount of unique OTUs found in each sample; and the Shannon index was calculated. Cluster analysis was preceded by principal component analysis (PCA), which was applied to reduce the dimensions of the original variables using the QIIME software package (v 1.9.0, default). QIIME was used to calculate both the weighted and unweighted unifrac distance, which are phylogenetic measures of beta diversity. Unweighted unifrac distance was used for principal coordinate analysis (PCoA) and the unweighted pair group method with arithmetic mean (UPGMA) clustering. To confirm differences in the abundances of individual taxonomy between the two groups, Metastats software (v 1.0, default) was utilized. LEfSe was used for the quantitative analysis of biomarkers within different groups to provide biological class explanations to establish statistical significance, biological consistency, and effect–size estimation of the predicted biomarkers [80].

5. Conclusions

Our results show that Bacillus altitudinis AD13−4 can significantly improve plant tolerance to alkaline–sodic stress by improving antioxidant capacities, endogenous phytohormone levels, cell division activity, and cell differentiation. Transcriptome analyses indicate that metabolism/secondary metabolism, signaling, photosynthesis, redox reaction, and plant–pathogen interaction pathways were significantly altered under alkaline–sodic stress and the application of strain AD13−4. Consistent with this, the contents of many metabolites and secondary metabolites, e.g., proline, phenolics, flavonoids, and terpenes, which are crucial for plant development and adaptation to the environment, changed significantly. Our results, to some extent, elucidate the mechanism underlying the interaction between Bacillus altitudinis AD13−4 and alfalfa roots under alkaline–sodic stress and provide clues for improving bacterial strains for biofertilizer.

Supplementary Materials

The following supporting information can be downloaded at: https://www.mdpi.com/article/10.3390/ijms25115785/s1.

Author Contributions

L.L. and C.L. conceived and supervised the project. L.L., M.A.K., Y.H., Z.Z., M.W. and C.L. designed the experiments. M.A.K., Z.Z., Y.H., M.W., Y.Z. and S.L. performed the experiments. M.A.K., M.W., Z.Z., Y.H., G.Q. and S.N.K. analyzed the data. L.L., M.W., C.L., Q.P., M.A.K. and Z.Z. drafted the manuscript. All authors have read and agreed to the published version of the manuscript.

Funding

This work was supported by the National Natural Science Foundation of China (U23A20151 and 32170279), Basic Research Fund for Higher Education Institutions in Heilongjiang Province (145109310), and Fundamental Research Funds for the Central Universities (2572019CT03).

Institutional Review Board Statement

Not applicable.

Informed Consent Statement

Not applicable.

Data Availability Statement

All data are presented in this article.

Acknowledgments

We are grateful for Jiaqi Agricultural Technology Co., Ltd. for providing Jiaqi #3 quinoa seeds.

Conflicts of Interest

The authors declare no conflicts of interest. The funders had no role in the design of the study; the collection, analysis, and interpretation of data; or in writing the manuscript.

References

  1. Qian, G.; Wang, M.; Wang, X.; Liu, K.; Li, Y.; Bu, Y.; Li, L. Integrated transcriptome and metabolome analysis of rice leaves response to high saline–alkali stress. Int. J. Mol. Sci. 2023, 24, 4062. [Google Scholar] [CrossRef] [PubMed]
  2. Kaiwen, G.; Zisong, X.; Yuze, H.; Qi, S.; Yue, W.; Yanhui, C.; Jiechen, W.; Wei, L.; Huihui, Z. Effects of salt concentration, pH, and their interaction on plant growth, nutrient uptake, and photochemistry of alfalfa (Medicago sativa) leaves. Plant Signal. Behav. 2020, 15, 1832373. [Google Scholar] [CrossRef] [PubMed]
  3. Zhang, H.; Yang, H.-Y.; Jiang, C.-J. Root damage under alkaline stress is associated with reactive oxygen species accumulation in rice (Oryza sativa L.). Front. Plant Sci. 2017, 8, 288138. [Google Scholar] [CrossRef] [PubMed]
  4. Gil, T.; Teixeira, R.; Sousa, A.; d’Oliveira Palmeiro, M.A.; Cruz Coimbra de Matos, A.; Niza Costa, M.; Ferrer, M.V.; Rodrígues dos Santos, A.S.; Sequero López, C.; Rebelo Romão, I. Isolation and characterization of culturable osmotolerant microbiota in hypersaline and hypergypsic soils as new treatment for osmotic stress in plants. Soil Syst. 2023, 7, 86. [Google Scholar] [CrossRef]
  5. Misra, S.; Chauhan, P.S. ACC deaminase-producing rhizosphere competent Bacillus spp. mitigate salt stress and promote Zea mays growth by modulating ethylene metabolism. 3 Biotech 2020, 10, 119. [Google Scholar] [CrossRef] [PubMed]
  6. Fan, C. Genetic mechanisms of salt stress responses in halophytes. Plant Signal. Behav. 2020, 15, 1704528. [Google Scholar] [CrossRef] [PubMed]
  7. Zhao, C.; Zhang, H.; Song, C.; Zhu, J.-K.; Shabala, S. Mechanisms of plant responses and adaptation to soil salinity. The Innovation 2020, 1, 100017. [Google Scholar]
  8. Mo, W.; Tang, W.; Du, Y.; Jing, Y.; Bu, Q.; Lin, R. PHYTOCHROME-INTERACTING FACTOR-LIKE14 and SLENDER RICE1 interaction controls seedling growth under salt stress. Plant Physiol. 2020, 184, 506–517. [Google Scholar] [CrossRef] [PubMed]
  9. Nam, M.H.; Huh, S.M.; Kim, K.M.; Park, W.W.; Seo, J.B.; Cho, K.; Kim, D.Y.; Kim, B.G.; Yoon, I.I. Comparative proteomic analysis of early salt stress-responsive proteins in roots of SnRK2 transgenic rice. Proteome Sci. 2012, 10, 25. [Google Scholar] [CrossRef]
  10. Guo, R.; Yang, Z.; Li, F.; Yan, C.; Zhong, X.; Liu, Q.; Xia, X.; Li, H.; Zhao, L. Comparative metabolic responses and adaptive strategies of wheat (Triticum aestivum) to salt and alkali stress. BMC Plant Biol. 2015, 15, 170. [Google Scholar] [CrossRef] [PubMed]
  11. Liu, X.; Fu, L.; Qin, P.; Sun, Y.; Liu, J.; Wang, X. Overexpression of the wheat trehalose 6-phosphate synthase 11 gene enhances cold tolerance in Arabidopsis thaliana. Gene 2019, 710, 210–217. [Google Scholar] [CrossRef] [PubMed]
  12. Song, Q.; Joshi, M.; Joshi, V. Transcriptomic analysis of short-term salt stress response in watermelon seedlings. Int. J. Mol. Sci. 2020, 21, 6036. [Google Scholar] [CrossRef] [PubMed]
  13. Wang, S.; Pei, J.; Li, J.; Tang, G.; Zhao, J.; Peng, X.; Nie, S.; Ding, Y.; Wang, C. Sucrose and starch metabolism during Fargesia yunnanensis shoot growth. Physiol. Plant. 2020, 168, 188–204. [Google Scholar] [CrossRef] [PubMed]
  14. Zhang, K.; Tang, J.; Wang, Y.; Kang, H.; Zeng, J. The tolerance to saline–alkaline stress was dependent on the roots in wheat. Physiol. Mol. Biol. Plants 2020, 26, 947–954. [Google Scholar] [CrossRef] [PubMed]
  15. Pan, Y.-Q.; Guo, H.; Wang, S.-M.; Zhao, B.; Zhang, J.-L.; Bao, A.-K. The photosynthesis, Na+/K+ homeostasis and osmotic adjustment of Atriplex canescens in response to salinity. Front. Plant Sci. 2016, 7, 190901. [Google Scholar] [CrossRef] [PubMed]
  16. Shabala, S.; Shabala, L. Ion transport and osmotic adjustment in plants and bacteria. Biomol. Concepts 2011, 2, 407–419. [Google Scholar] [CrossRef]
  17. Shen, Q.; Yu, J.; Fu, L.; Wu, L.; Dai, F.; Jiang, L.; Wu, D.; Zhang, G. Ionomic, metabolomic and proteomic analyses reveal molecular mechanisms of root adaption to salt stress in Tibetan wild barley. Plant Physiol. Biochem. 2018, 123, 319–330. [Google Scholar] [CrossRef] [PubMed]
  18. Pan, F.; Meng, Q.; Wang, Q.; Luo, S.; Chen, B.; Khan, K.Y.; Yang, X.; Feng, Y. Endophytic bacterium Sphingomonas SaMR12 promotes cadmium accumulation by increasing glutathione biosynthesis in Sedum alfredii Hance. Chemosphere 2016, 154, 358–366. [Google Scholar] [CrossRef] [PubMed]
  19. Wang, X.; Wang, M.; Huang, Y.; Zhu, P.; Qian, G.; Zhang, Y.; Liu, Y.; Zhou, J.; Li, L. Genome-wide identification and analysis of stress response of trehalose-6-phosphate synthase and trehalose-6-phosphate phosphatase genes in quinoa. Int. J. Mol. Sci. 2023, 24, 6950. [Google Scholar] [CrossRef] [PubMed]
  20. Nguyen, H.T.T.; Das Bhowmik, S.; Long, H.; Cheng, Y.; Mundree, S.; Hoang, L.T.M. Rapid accumulation of proline enhances salinity tolerance in Australian wild rice Oryza australiensis Domin. Plants 2021, 10, 2044. [Google Scholar] [CrossRef] [PubMed]
  21. Sagar, A.; Sayyed, R.; Ramteke, P.; Sharma, S.; Marraiki, N.; Elgorban, A.M.; Syed, A. ACC deaminase and antioxidant enzymes producing halophilic Enterobacter sp. PR14 promotes the growth of rice and millets under salinity stress. Physiol. Mol. Biol. Plants 2020, 26, 1847–1854. [Google Scholar] [CrossRef] [PubMed]
  22. Ahemad, M.; Kibret, M. Mechanisms and applications of plant growth promoting rhizobacteria: Current perspective. J. King Saud Univ. Sci. 2014, 26, 1–20. [Google Scholar] [CrossRef]
  23. Gao, H.; Yang, D.; Yang, L.; Han, S.; Liu, G.; Tang, L.; Chen, J.; Wang, D.; Guo, C. Co-inoculation with Sinorhizobium meliloti and Enterobacter ludwigii improves the yield, nodulation, and quality of alfalfa (Medicago sativa L.) under saline-alkali environments. Ind. Crops Prod. 2023, 199, 116818. [Google Scholar] [CrossRef]
  24. Ning, Z.; Lin, K.; Gao, M.; Han, X.; Guan, Q.; Ji, X.; Yu, S.; Lu, L. Mitigation of Salt Stress in Rice by the Halotolerant Plant Growth-Promoting Bacterium Enterobacter asburiae D2. J. Xenobiotics 2024, 14, 333–349. [Google Scholar] [CrossRef] [PubMed]
  25. Zhou, B.; Jia, R.; Chen, X.; Yang, L.; Duan, M.; Xiao, F.; Liang, C.; Zhou, D.; Li, W.; Liu, C. Impact of bacteria-nitrogen coupling on cotton growth and nitrogen utilization under different salt stress. Agric. Water Manag. 2023, 280, 108221. [Google Scholar] [CrossRef]
  26. Liu, J.; Tang, L.; Gao, H.; Zhang, M.; Guo, C. Enhancement of alfalfa yield and quality by plant growth-promoting rhizobacteria under saline-alkali conditions. J. Sci. Food Agric. 2019, 99, 281–289. [Google Scholar] [CrossRef] [PubMed]
  27. Han, H.; Zhang, H.; Qin, S.; Zhang, J.; Yao, L.; Chen, Z.; Yang, J. Mechanisms of Enterobacter bugandensis TJ6 immobilization of heavy metals and inhibition of Cd and Pb uptake by wheat based on metabolomics and proteomics. Chemosphere 2021, 276, 130157. [Google Scholar] [CrossRef] [PubMed]
  28. Zhu, L.; Guo, J.; Sun, Y.; Wang, S.; Zhou, C. Acetic acid-producing endophyte Lysinibacillus fusiformis orchestrates jasmonic acid signaling and contributes to repression of cadmium uptake in tomato plants. Front. Plant Sci. 2021, 12, 670216. [Google Scholar] [CrossRef] [PubMed]
  29. Liu, A.; Wang, W.; Zheng, X.; Chen, X.; Fu, W.; Wang, G.; Ji, J.; Jin, C.; Guan, C. Improvement of the Cd and Zn phytoremediation efficiency of rice (Oryza sativa) through the inoculation of a metal-resistant PGPR strain. Chemosphere 2022, 302, 134900. [Google Scholar] [CrossRef] [PubMed]
  30. Huang, Z.; Wang, C.; Feng, Q.; Liou, R.-M.; Lin, Y.-F.; Qiao, J.; Lu, Y.; Chang, Y. The mechanisms of sodium chloride stress mitigation by salt-tolerant plant growth promoting rhizobacteria in wheat. Agronomy 2022, 12, 543. [Google Scholar] [CrossRef]
  31. Babalola, O.O. Beneficial bacteria of agricultural importance. Biotechnol. Lett. 2010, 32, 1559–1570. [Google Scholar] [CrossRef] [PubMed]
  32. Böhme, L.; Böhme, F. Soil microbiological and biochemical properties affected by plant growth and different long-term fertilisation. Eur. J. Soil Biol. 2006, 42, 1–12. [Google Scholar] [CrossRef]
  33. Kuiper, I.; Lagendijk, E.L.; Bloemberg, G.V.; Lugtenberg, B.J. Rhizoremediation: A beneficial plant-microbe interaction. Mol. Plant-Microbe Interact. 2004, 17, 6–15. [Google Scholar] [CrossRef] [PubMed]
  34. Sharma, P.; Jha, A.B.; Dubey, R.S. Addressing lanthanum toxicity in plants: Sources, uptake, accumulation, and mitigation strategies. Sci. Total Environ. 2024, 929, 172560. [Google Scholar] [CrossRef] [PubMed]
  35. Patel, M.; Vurukonda, S.; Patel, A. Multi-trait halotolerant plant growth-promoting bacteria mitigate induced salt stress and enhance growth of Amaranthus viridis. J. Soil Sci. Plant Nutr. 2023, 23, 1860–1883. [Google Scholar] [CrossRef]
  36. Khan, N.; Ali, S.; Shahid, M.A.; Mustafa, A.; Sayyed, R.; Curá, J.A. Insights into the interactions among roots, rhizosphere, and rhizobacteria for improving plant growth and tolerance to abiotic stresses: A review. Cells 2021, 10, 1551. [Google Scholar] [CrossRef] [PubMed]
  37. Dip, D.P.; Sannazzaro, A.I.; Otondo, J.; Pistorio, M.; Estrella, M.J. Enterobacter and Pseudomonas: Two dominant players in the rhizosphere phosphate-solubilizing bacterial communities of forage grasses adapted to alkaline-sodic soils of the flooding pampa. Res. Sq. 2023; preprint. [Google Scholar]
  38. Curtis, T.P.; Sloan, W.T.; Scannell, J.W. Estimating prokaryotic diversity and its limits. Proc. Natl. Acad. Sci. USA 2002, 99, 10494–10499. [Google Scholar] [CrossRef]
  39. Berendsen, R.L.; Pieterse, C.M.; Bakker, P.A. The rhizosphere microbiome and plant health. Trends Plant Sci. 2012, 17, 478–486. [Google Scholar] [CrossRef] [PubMed]
  40. Zhalnina, K.; Louie, K.B.; Hao, Z.; Mansoori, N.; Da Rocha, U.N.; Shi, S.; Cho, H.; Karaoz, U.; Loqué, D.; Bowen, B.P. Dynamic root exudate chemistry and microbial substrate preferences drive patterns in rhizosphere microbial community assembly. Nat. Microbiol. 2018, 3, 470–480. [Google Scholar] [CrossRef] [PubMed]
  41. Fan, P.; Chen, D.; He, Y.; Zhou, Q.; Tian, Y.; Gao, L. Alleviating salt stress in tomato seedlings using Arthrobacter and Bacillus megaterium isolated from the rhizosphere of wild plants grown on saline–alkaline lands. Int. J. Phytoremediation 2016, 18, 1113–1121. [Google Scholar] [CrossRef] [PubMed]
  42. Liu, X.; Ji, H.; Zhang, C.; Sun, N.; Xia, T.; Wang, Z.; Wang, X. The poly-γ-glutamic acid-producing bacterium Bacillus amyloliquefaciens W25 enhanced the salt tolerance of lettuce by regulating physio-biochemical processes and influencing the rhizosphere soil microbial community. Environ. Exp. Bot. 2024, 220, 105679. [Google Scholar] [CrossRef]
  43. Xun, F.; Xie, B.; Liu, S.; Guo, C. Effect of plant growth-promoting bacteria (PGPR) and arbuscular mycorrhizal fungi (AMF) inoculation on oats in saline-alkali soil contaminated by petroleum to enhance phytoremediation. Environ. Sci. Pollut. Res. 2015, 22, 598–608. [Google Scholar] [CrossRef] [PubMed]
  44. Kumar, V.; Singh, K.; Shah, M.P.; Singh, A.K.; Kumar, A.; Kumar, Y. Application of omics technologies for microbial community structure and function analysis in contaminated environment. In Wastewater Treatment; Elsevier: Amsterdam, The Netherlands, 2021; pp. 1–40. [Google Scholar]
  45. Shahid, M.; Zeyad, M.T.; Syed, A.; Singh, U.B.; Mohamed, A.; Bahkali, A.H.; Elgorban, A.M.; Pichtel, J. Stress-tolerant endophytic isolate Priestia aryabhattai BPR-9 modulates physio-biochemical mechanisms in wheat (Triticum aestivum L.) for enhanced salt tolerance. Int. J. Environ. Res. Public Health 2022, 19, 10883. [Google Scholar] [CrossRef] [PubMed]
  46. Perrot-Rechenmann, C. Cellular responses to auxin: Division versus expansion. Cold Spring Harb. Perspect. Biol. 2010, 2, a001446. [Google Scholar] [CrossRef] [PubMed]
  47. Han, H.; Adamowski, M.; Qi, L.; Alotaibi, S.S.; Friml, J. PIN-mediated polar auxin transport regulations in plant tropic responses. New Phytol. 2021, 232, 510–522. [Google Scholar] [CrossRef] [PubMed]
  48. Torii, K.; Kubota, A.; Araki, T.; Endo, M. Time-series single-cell RNA-seq data reveal auxin fluctuation during endocycle. Plant Cell Physiol. 2020, 61, 243–254. [Google Scholar] [CrossRef] [PubMed]
  49. Jones, B.; Ljung, K. Auxin and cytokinin regulate each other’s levels via a metabolic feedback loop. Plant Signal. Behav. 2011, 6, 901–904. [Google Scholar] [CrossRef] [PubMed]
  50. Dubreuil, C.; Jin, X.; Grönlund, A.; Fischer, U. A local auxin gradient regulates root cap self-renewal and size homeostasis. Curr. Biol. 2018, 28, 2581–2587.e3. [Google Scholar] [CrossRef] [PubMed]
  51. Yin, W.; Wang, Y.; Liu, L.; He, J. Biofilms: The microbial “protective clothing” in extreme environments. Int. J. Mol. Sci. 2019, 20, 3423. [Google Scholar] [CrossRef] [PubMed]
  52. Gao, M.; Dong, Y.; Zhang, Z.; Song, Z. Effect of dibutyl phthalate on microbial function diversity and enzyme activity in wheat rhizosphere and non-rhizosphere soils. Environ. Pollut. 2020, 265, 114800. [Google Scholar] [CrossRef] [PubMed]
  53. Tran, T.M.; MacIntyre, A.; Hawes, M.; Allen, C. Escaping underground nets: Extracellular DNases degrade plant extracellular traps and contribute to virulence of the plant pathogenic bacterium Ralstonia solanacearum. PLoS Pathog. 2016, 12, e1005686. [Google Scholar] [CrossRef] [PubMed]
  54. Hawes, M.; Allen, C.; Turgeon, B.G.; Curlango-Rivera, G.; Minh Tran, T.; Huskey, D.A.; Xiong, Z. Root border cells and their role in plant defense. Annu. Rev. Phytopathol. 2016, 54, 143–161. [Google Scholar] [CrossRef] [PubMed]
  55. Kumar, N.; Iyer-Pascuzzi, A.S. Shedding the last layer: Mechanisms of root cap cell release. Plants 2020, 9, 308. [Google Scholar] [CrossRef] [PubMed]
  56. Roberts, S.C. Production and engineering of terpenoids in plant cell culture. Nat. Chem. Biol. 2007, 3, 387–395. [Google Scholar] [CrossRef] [PubMed]
  57. Lin, H.; Liu, C.; Li, B.; Dong, Y. Trifolium repens L. regulated phytoremediation of heavy metal contaminated soil by promoting soil enzyme activities and beneficial rhizosphere associated microorganisms. J. Hazard. Mater. 2021, 402, 123829. [Google Scholar] [CrossRef] [PubMed]
  58. Bouvier, F.; Rahier, A.; Camara, B. Biogenesis, molecular regulation and function of plant isoprenoids. Prog. Lipid Res. 2005, 44, 357–429. [Google Scholar] [CrossRef] [PubMed]
  59. Gershenzon, J.; Dudareva, N. The function of terpene natural products in the natural world. Nat. Chem. Biol. 2007, 3, 408–414. [Google Scholar] [CrossRef] [PubMed]
  60. Huang, L.-M.; Huang, H.; Chuang, Y.-C.; Chen, W.-H.; Wang, C.-N.; Chen, H.-H. Evolution of terpene synthases in Orchidaceae. Int. J. Mol. Sci. 2021, 22, 6947. [Google Scholar] [CrossRef]
  61. Abbas, F.; Ke, Y.; Yu, R.; Yue, Y.; Amanullah, S.; Jahangir, M.M.; Fan, Y. Volatile terpenoids: Multiple functions, biosynthesis, modulation and manipulation by genetic engineering. Planta 2017, 246, 803–816. [Google Scholar] [CrossRef]
  62. Liao, P.; Hemmerlin, A.; Bach, T.J.; Chye, M.-L. The potential of the mevalonate pathway for enhanced isoprenoid production. Biotechnol. Adv. 2016, 34, 697–713. [Google Scholar] [CrossRef] [PubMed]
  63. Lichtenthaler, H.K. The 1-deoxy-D-xylulose-5-phosphate pathway of isoprenoid biosynthesis in plants. Annu. Rev. Plant Biol. 1999, 50, 47–65. [Google Scholar] [CrossRef] [PubMed]
  64. Huang, J.; Gao, K.; Yang, L.; Lu, Y. Successional action of Bacteroidota and Firmicutes in decomposing straw polymers in a paddy soil. Environ. Microbiome 2023, 18, 76. [Google Scholar] [CrossRef] [PubMed]
  65. Li, J.; Ye, X.; Zhang, Y.; Chen, J.; Yu, N.; Zou, H. Maize straw deep-burying promotes soil bacteria community abundance and improves soil fertility. J. Soil Sci. Plant Nutr. 2021, 21, 1397–1407. [Google Scholar] [CrossRef]
  66. Wang, X.; Hu, M.; Xia, Y.; Wen, X.; Ding, K. Pyrosequencing analysis of bacterial diversity in 14 wastewater treatment systems in China. Appl. Environ. Microbiol. 2012, 78, 7042–7047. [Google Scholar] [CrossRef]
  67. Nikolopoulou, M.; Pasadakis, N.; Norf, H.; Kalogerakis, N. Enhanced ex situ bioremediation of crude oil contaminated beach sand by supplementation with nutrients and rhamnolipids. Mar. Pollut. Bull. 2013, 77, 37–44. [Google Scholar] [CrossRef] [PubMed]
  68. Zhou, Q.; Chen, L.; Wang, Z.; Wang, J.; Ni, S.; Qiu, J.; Liu, X.; Zhang, X.; Chen, X. Fast atrazine degradation by the mixed cultures enriched from activated sludge and analysis of their microbial community succession. Environ. Sci. Pollut. Res. 2017, 24, 22152–22157. [Google Scholar] [CrossRef] [PubMed]
  69. Wang, J.; Liu, Q.; Dong, D.; Hu, H.; Wu, B.; Ren, H. AHLs-mediated quorum sensing threshold and its response towards initial adhesion of wastewater biofilms. Water Res. 2021, 194, 116925. [Google Scholar] [CrossRef] [PubMed]
  70. Gautam, A.; Pandey, A.K. Microbial management of crop abiotic stress: Current trends and prospects. In Mitigation of Plant Abiotic Stress by Microorganisms; Elsevier: Amsterdam, The Netherlands, 2022; pp. 53–75. [Google Scholar]
  71. Asker, D.; Beppu, T.; Ueda, K. Nubsella zeaxanthinifaciens gen. nov., sp. nov., a zeaxanthin-producing bacterium of the family Sphingobacteriaceae isolated from freshwater. Int. J. Syst. Evol. Microbiol. 2008, 58, 601–606. [Google Scholar] [CrossRef] [PubMed]
  72. Sierra, J.; McQuinn, R.P.; Leon, P. The role of carotenoids as a source of retrograde signals: Impact on plant development and stress responses. J. Exp. Bot. 2022, 73, 7139–7154. [Google Scholar] [CrossRef] [PubMed]
  73. Reintjes, G.; Arnosti, C.; Fuchs, B.M.; Amann, R. An alternative polysaccharide uptake mechanism of marine bacteria. ISME J. 2017, 11, 1640–1650. [Google Scholar] [CrossRef] [PubMed]
  74. Kwak, M.-J.; Kong, H.G.; Choi, K.; Kwon, S.-K.; Song, J.Y.; Lee, J.; Lee, P.A.; Choi, S.Y.; Seo, M.; Lee, H.J. Rhizosphere microbiome structure alters to enable wilt resistance in tomato. Nat. Biotechnol. 2018, 36, 1100–1109. [Google Scholar] [CrossRef] [PubMed]
  75. Zhang, H.; Zhou, J.; Kou, X.; Liu, Y.; Qin, G.; Wang, M.; Qian, G.; Li, W.; Huang, Y.; Zhao, Z. Syntaxin of plants71 plays essential roles in plant development and stress response via regulating pH homeostasis. Front. Plant Sci. 2023, 14, 1198353. [Google Scholar] [CrossRef] [PubMed]
  76. Baliyan, S.; Mukherjee, R.; Priyadarshini, A.; Vibhuti, A.; Gupta, A.; Pandey, R.P.; Chang, C.-M. Determination of antioxidants by DPPH radical scavenging activity and quantitative phytochemical analysis of Ficus religiosa. Molecules 2022, 27, 1326. [Google Scholar] [CrossRef] [PubMed]
  77. Liu, Q.; Tang, G.-Y.; Zhao, C.-N.; Feng, X.-L.; Xu, X.-Y.; Cao, S.-Y.; Meng, X.; Li, S.; Gan, R.-Y.; Li, H.-B. Comparison of antioxidant activities of different grape varieties. Molecules 2018, 23, 2432. [Google Scholar] [CrossRef] [PubMed]
  78. Wang, Y.-W.; Wang, X.-H.; Zhang, J.; Du, Z.-J.; Mu, D.-S. Cerina litoralis gen. nov., sp. nov., a novel potential polysaccharide degrading bacterium of the family Flavobacteriaceae, isolated from marine sediment. Antonie Leeuwenhoek 2023, 116, 1447–1455. [Google Scholar] [CrossRef] [PubMed]
  79. Li, X.; Zhu, J.; Wang, T.; Sun, J.; Guo, T.; Zhang, L.; Yu, G.; Xia, X. Antidiabetic activity of Armillaria mellea polysaccharides: Joint ultrasonic and enzyme assisted extraction. Ultrason. Sonochemistry 2023, 95, 106370. [Google Scholar] [CrossRef] [PubMed]
  80. Li, S.; Li, L.; Wang, Z.; Sun, J.; Zhang, H. Impacts of Corn Straw Compost on Rice Growth and Soil Microflora under Saline-Alkali Stress. Agronomy 2023, 13, 1525. [Google Scholar] [CrossRef]
  81. Love, M.I.; Huber, W.; Anders, S. Moderated estimation of fold change and dispersion for RNA-seq data with DESeq2. Genome Biol. 2014, 15, 550. [Google Scholar] [CrossRef] [PubMed]
  82. Varet, H.; Brillet-Guéguen, L.; Coppée, J.-Y.; Dillies, M.-A. SARTools: A DESeq2-and EdgeR-based R pipeline for comprehensive differential analysis of RNA-Seq data. PLoS ONE 2016, 11, e0157022. [Google Scholar] [CrossRef] [PubMed]
  83. Zhang, Y.; Xu, Q.; Wang, G.; Shi, K. Mixed Enterobacter and Klebsiella bacteria enhance soybean biological nitrogen fixation ability when combined with rhizobia inoculation. Soil Biol. Biochem. 2023, 184, 109100. [Google Scholar] [CrossRef]
Figure 1. Strain AD13−4 significantly promoted plant growth. (A) Ten−day−old Arabidopsis seedlings grown on 1/2MS medium (pH 5.8) or 1/2MS medium (pH 8.0) containing 1 mM NaHCO3 (pH 8.0 + 1 mM NaHCO3) with or without inoculation of AD13−4. The yellow lines indicate the root tips. Bars = 1 cm. (B) Statistics of root length of seedlings shown in (A). (C) One−month−old alfalfa plants. SAS, saline–alkali stress. Bars = 5 cm. (D) Statistics of plant height, root length, fresh weight, and chlorophyll content in (C). (E) Statistics of the contents of malondialdehyde (MDA), proline, total protein and soluble sugars in (C). (F) Statistics of activities of antioxidant enzymes in (C). APX, ascorbate peroxidase; SOD, superoxide dismutase; POD, peroxidase. (G) Statistics of total ROS scavenging capacity. ABST, 2,2′−azino−bis (3−ethylbenzothiazoline−6−sulfonicacid); DPPH, 2,2−diphenyl−1−picrylhydrazyl; FRAP, ferric-reducing ability of plasma. For the statistics, three biological replicates per sample were used. *, p < 0.05; **, p < 0.01; ***, p < 0.001; ns, no significance. Student’s t−test. The numbers shown inside each column indicate the statistics value. CK, blank; NC, negative control.
Ijms 25 05785 g001
Figure 2. Identification and characteristics of strain AD13−4. (A) Phylogenetic tree of strain AD13−4. Genus of strain AD13−4 was identified by 16S rDNA sequencing. MEGA X was used to construct the phylogenetic tree. Neighbor–joining was used, bootstrap replications = 1000. (BD) Detection of pH (B), alkali (NaHCO3, (C)), and salt (NaCl, (D)) tolerance of strain AD13−4. (E) Detection of H+ secretion ability of strain AD13−4. The pH value of LB medium (pH 8.1) rapidly decreased after inoculation of strain AD13−4. (F) Determination of strain AD13−4’s abilities to dissolve phosphorus; secrete siderophiles; ACC deaminase, and IAA; and produce biofilms. For the statistics, three biological replicates per sample were used. ***, p < 0.001. ns, no significance. Student’s t−test.
Ijms 25 05785 g002
Figure 3. Bacillus altitudinis AD13−4 affected plant endogenous auxin level and cell division activity. The chemical staining of roots of 7−day−old DR5::GUS (A), CYCB1;1::GUS (B) expressing seedlings. Bars = 50 μm. (C) 12−day−old seedlings of the indicated genotypes. The yellow lines indicate tips of the roots. (D) Statistics of the root length of seedlings in (C). For the statistics, three independent experiments per sample were used. n = 30. *, p < 0.05; **, p < 0.01; ***, p < 0.001. ns, no significance. Student’s t-test. The number shown inside each column indicate the statistical value.
Ijms 25 05785 g003
Figure 4. General overview of differentially expressed genes. (A) PCA diagram. Green, CK; orange, SAS; purple, SAS + AD13−4. X- and Y-axis indicate the first and second principal components (PC1 and PC2), respectively. The score plot of PC1 indicates cohesion within each group and that of PC2 indicates separation between the groups. (B) Volcano map of transcriptome genes for AD13−4_vs._SAS and SAS_vs._CK. Red dots, upregulated genes; green dots, downregulated genes; gray dots, genes with no significance. (C) Venn diagram of DEGs for AD13−4_vs._SAS and SAS_vs._CK.
Ijms 25 05785 g004
Figure 5. Comparative transcriptome analysis of DEGs. KEGG analysis of AD13−4_vs._SAS (A) and SAS_vs._CK (B) and GO enrichment analysis of AD13−4_vs._SAS (C) and SAS_vs._CK (D) indicated significant changes under alkaline–sodic stress and application of strain AD13−4. The color of the circle represents the Q value, and the size of the circle represents the gene number. Orange arrows, terpenoid biosynthesis pathways; green arrows, redox reaction pathways; blue arrows, photosynthesis pathways. (E) Statistics of contents of total phenolics and total flavonoids. For the statistics, three biological replicates per sample. *, p < 0.05; **, p < 0.01; ***, p < 0.001. ns, no significance. Student’s t-test. The numbers shown inside each column indicate the statistics value.
Ijms 25 05785 g005
Figure 6. The signal transduction pathways in AD13−4_vs._SAS group. (AC) MAPK signaling pathways (green frame) and Plant hormone signal transduction pathways (red frame), summarized according to Supplementary Figure S5. The overlapped parts are highlighted in (B). Rectangles, pathways; red circles, upregulated genes; blue circles, downregulated genes; green circles, gene family containing both upregulated and downregulated genes. The dots indicate genes. The colors of the dots indicate significances shown in the color scale. Gray dotted lines and rectangles indicate downstream pathways. (D) Statistics of relative expression of genes (part) in the signaling pathways. Three independent experiments per sample, three replicates per experiment. ***, p < 0.001. Student’s t-test. The number shown inside each column indicate the statistical value. Abbreviations: A−AAR, Arabidopsis type−A activators response regulators; ABA, abscisic acid; ARF, auxin response factor; AHP, histidine−containing phosphotransmitters; B−AAR, Arabidopsis type−B activators response regulators; BAK1, BRI1−associated kinase1; BIN2, BR−insensitive2; BRI1, Brassinosteroid–insensitive1; BSK, Brassinosteroid signaling kinase; BSU1, BR−suppressor1; BZR1, brassinazole resistant1; ChiB, Bacterial chitinase; CRE1, cytokinin response1; CTR1, copper uptake protein1; CYCD3, Arabidopsis cyclin D3; ETR1, Ethylene Receptor1; ERS, ethylene response sensor; EIN3/EIL, Ethylene−insensitive3; ERF1, ethylene response factor1; flg22, Flagellin22; FLS2, flagellin receptor2; FRK1, Fructokinase1; GH3, glycoside hydrolase3; GID2, GA−insensitive Dwarf2; IAA, Indole−3−acetic acid; JA, Jasmonic acid; MEKK1, mitogen−activated protein kinase kinase kinase1; MEK1, mitogen−activated protein kinase1; MPK4, mitogen−activated protein kinase4; MKS1, map kinase substrate1; MYC, myelocytomatosis; PAD3, Peptidylarginine deiminase3; PP2C, protein phosphatases 2C; PR1, pathogenesis−related protein1; PYR, pyrabactin resistance; PYL, pyrabactin resistance−like; SnRK2, sucrose non−fermenting related kinase Group2; TCH4, Arabidopsis plants harboring4; TF, transcription factor; TIR, Toll−like, interleukin−1 receptor, resistance protein; SAUR, small auxin−up RNA; VIP1, VirE2−interacting protein1; VSP2, vegetative storage protein2.
Ijms 25 05785 g006
Figure 7. The terpenoid biosynthesis pathways in AD13−4_vs._SAS group. (A) MVA and MEP pathways which generate IPP and DMAPP, respectively. (B) The sesquiterpenoid, triterpenoid, and diterpenoid biosynthesis pathways. (C) Statistics of relative expression of some of the genes determined by RT−qPCR. Three independent experiments per sample, three replicates per experiment. (D) Statistics of content of total terpenoids. The standard curve is y = 0.0108x + 0.0214, R2 = 0.9995. Three biological replicates per sample. *, p < 0.05; **, p < 0.01; ***, p < 0.001. Student’s t-test. The numbers shown inside each column indicate the statistical value. Abbreviations: CPS, Copalyl di-phosphate synthase; CDP, 2−C−methyl−D−erythritol 2,4−cyclodiphosphate synthase; CDP−ME, 24−(cytidine 5′−diphospho)−2−C−methyl−d−erythritol; DOXP, 1−deoxy−D−xylulose−5−phosphate; DMBPP, 3−(2−Hydroxyphenyl)−3,3−dimethylpropanoate; FDFT1, farnesyl−diphosphate farnesyltransferase; FPP, farnesyl diphosphate; GA−3P, glyceratdehyde−3−phosphate, GGPP, geranylgeranyl diphosphate; HMBPP, (E)−4−hydroxy−3−methyl−but−2−enyl diphosphate; HMG−CoA, 3−hydroxy−3−methylglutaryl−CoA; HMGR, 3−hydroxy−3−methylglutaryl−CoA reductase; IPP, Isopentenyl diphosphate; MVA, mevalonate; MVAP, mevalonate 5−phosphate, MVAPP, 5−pyrophosphomevalonate; MEP, methylerythritol 4−phosphate. NES, nerolidol synthase; TMTT, 4,8,12−trimethyltrideca−1,3,7,11−tetraene.
Ijms 25 05785 g007
Figure 8. The impacts of AD13−4 on the abundance and composition of rhizosphere microbiota. (A) PCA diagram. Red circle, AD13−4; blue circle, SAS; green circle, control (SAS + AD13−4). X- and Y-axis indicate the first and second principal components (PC1 and PC2), respectively. Score plots of PC1 and PC2 show cohesion within each group and separation between the groups, respectively. (B) Analysis of relative abundance of dominant families. (C) Statistics of soil activity indicators, electrical conductivity, and activities of sucrase and urease. For the statistics, three biological replicates per sample were used. *, p < 0.05; **, p < 0.01; ***, p < 0.001. ns, no significance. Student’s t-test. The number shown inside each column indicates the statistical value.
Ijms 25 05785 g008
Disclaimer/Publisher’s Note: The statements, opinions and data contained in all publications are solely those of the individual author(s) and contributor(s) and not of MDPI and/or the editor(s). MDPI and/or the editor(s) disclaim responsibility for any injury to people or property resulting from any ideas, methods, instructions or products referred to in the content.

