Article

Genome-Wide Identification, Molecular Characterization, and Expression Analysis of the HSP70 and HSP90 Gene Families in Thamnaconus septentrionalis

1
College of Fisheries and Life Sciences, Shanghai Ocean University, Shanghai 201306, China
2
State Key Laboratory of Mariculture Biobreeding and Sustainable Goods, Yellow Sea Fisheries Research Institute, Chinese Academy of Fishery Sciences, Qingdao 266071, China
3
Fujian Academy of Agricultural Sciences, Fuzhou 350003, China
*
Authors to whom correspondence should be addressed.
Int. J. Mol. Sci. 2024, 25(11), 5706; https://doi.org/10.3390/ijms25115706
Submission received: 2 April 2024 / Revised: 21 May 2024 / Accepted: 22 May 2024 / Published: 24 May 2024
(This article belongs to the Section Molecular Genetics and Genomics)

Abstract

Heat shock proteins (HSPs) are a class of highly conserved proteins that play an important role in biological responses to various environmental stresses. The mariculture of Thamnaconus septentrionalis, a burgeoning aquaculture species in China, frequently encounters stressors such as extreme temperatures, salinity variations, and elevated ammonia levels. However, systematic identification and analysis of the HSP70 and HSP90 gene families in T. septentrionalis remain unexplored. This study conducted the first genome-wide identification of 12 HSP70 and 4 HSP90 genes in T. septentrionalis, followed by a comprehensive analysis including phylogenetics, gene structure, conserved domains, chromosomal localization, and expression profiling. Expression analysis from RNA-seq data across various tissues and developmental stages revealed predominant expression in muscle, spleen, and liver, with the highest expression found during the tailbud stage, followed by the gastrula, neurula, and juvenile stages. Under abiotic stress, most HSP70 and HSP90 genes were upregulated in response to high temperature, high salinity, and low salinity, notably hspa5 during thermal stress, hspa14 in high salinity, and hsp90ab1 under low salinity conditions. Ammonia stress led to a predominance of downregulated HSP genes in the liver, particularly hspa2, while upregulation was observed in the gills, especially for hsp90b1. Quantitative real-time PCR analysis corroborated the expression levels under environmental stresses, validating their involvement in stress responses. This investigation provides insights into the molecular mechanisms of HSP70 and HSP90 in T. septentrionalis under stress, offering valuable information for future functional studies of HSPs in teleost evolution, optimizing aquaculture techniques, and developing stress-resistant strains.

Graphical Abstract

1. Introduction

Heat shock proteins (HSPs), also known as stress proteins, are synthesized in organisms in response to environmental stress, enhancing cellular resilience to extreme conditions [1]. Furthermore, HSPs serve as highly conserved molecular chaperones, facilitating diverse physiological functions through binding and assisting in the intracellular folding, assembly, transportation, or degradation of peptides [2]. Originally identified in Drosophila melanogaster, subsequent studies have confirmed their widespread presence across the biosphere, from bacteria to humans [3]. Structurally, HSPs are categorized into six major classes based on molecular weight: HSP110, HSP90, HSP70, HSP60, HSP40, and small heat shock protein (sHSP) [4]. For aquatic animals within the vast HSP family, the HSP70 and HSP90 gene families have emerged as focal points of research, given their pivotal roles in modulating stress responses [5,6,7].
Aquatic species, particularly fish, are inherently vulnerable to a spectrum of external environmental pressures [8,9], including thermal extremes, osmotic stress, and ammonia toxicity. The expansion of whole-genome sequencing across various species has paved the way for in-depth studies on genes implicated in environmental stress adaptation, with HSP70 and HSP90 proteins drawing considerable attention. These proteins have been extensively identified, analyzed, and linked to stress response mechanisms in teleosts. For example, in the Lateolabrax maculatus, investigations identified 5 HSP90 genes and 16 HSP70 genes, with their expression significantly upregulated in gills, liver, and muscle following thermal stress, suggesting their critical role in heat stress adaptation [10]. Similarly, in Sebastiscus marmoratus, 15 HSP70 genes were identified, with a majority showing upregulation under thermal stress [11]. Studies have also highlighted the differential expression of HSP70 genes in Boleophthalmus pectinirostris under ammonia stress [12], as well as the distinct expression patterns of HSP70 and HSP90 genes under osmotic and hypoxic stress [13,14]. Notably, in Scophthalmus maximus, the differential expression of identified HSP70 genes under both biotic and abiotic stresses was verified [2]. The above studies illustrate the regulatory functions of HSP70 and HSP90 genes in stress responses and reveal their species-specific functional discrepancy [10].
Thamnaconus septentrionalis, classified within the Tetraodontiformes, Monacanthidae, and Thamnaconus, inhabits offshore demersal zones at depths of 50 to 120 m and is predominantly distributed around the Korean Peninsula, Japan, and Chinese maritime regions [15]. This species also represents a traditional fishery target, ranking as the second-largest conventional fishing catch in China during the 1970s, following Trichiurus japonicus [16]. Since the 1990s, excessive fishing and environmental degradation have significantly reduced the catch volumes of T. septentrionalis, failing to meet market demand [17]. Moreover, its dense flesh, absence of intermuscular bones, and rich nutritional content have made it highly favored by consumers [18], leading to an expansion in aquaculture. T. septentrionalis thrives in salinity levels of 25 to 35 and temperatures of 21 to 24 °C [19]. Cage culture, primarily in Fujian Province, China, is the predominant cultivation method for this species. Summer brings a period of high temperatures lasting 1 to 2 months, while the significant river runoff during the rainy season may impede seawater exchange, leading to abrupt changes in salinity. Additionally, excessive aquaculture density might elevate the concentration of ammonia nitrogen in the water. Consequently, T. septentrionalis in aquaculture settings is susceptible to various environmental stresses, including temperature, salinity, and ammonia nitrogen. Therefore, investigating the HSP70 and HSP90 genes at the molecular level to uncover their molecular response mechanisms under environmental stress conditions holds substantial practical significance for guiding the optimization of aquaculture techniques for T. septentrionalis in adverse environments.
Upon the completion of whole-genome sequencing and assembly for T. septentrionalis [15], our investigation embarked on extensive genomic scrutiny of HSP70 and HSP90 gene families. The research began with an examination of the essential molecular features, covering the proteins’ physicochemical characteristics and subcellular localization. Following this, the evolutionary lineage of these genes was explored through a thorough phylogenetic analysis, gene structure analysis, conserved domain and motif analyses, and chromosomal mapping. To further comprehend the expression profiles of HSP70 and HSP90 genes within T. septentrionalis across a range of tissues, developmental stages, and under various environmental stresses, we analyzed RNA-seq datasets. These datasets encompassed seven distinct tissues (heart, brain, liver, spleen, gill, intestine, and muscle), eight developmental stages (cleavage (Cle), blastocyst (Bla), gastrula stage (Gas), neural embryonic stage (Neu), tail bud stage (Tai), muscle effect stage (Mus), hatchling (Dph0) and 20 days of juvenile (Dph20)), and four environmental stresses, including high temperature, high salt, low salt and ammonia nitrogen stresses. The qPCR analyses of the HSP70 and HSP90 genes under these stress conditions reinforce their expression trends under environmental challenges. This comprehensive approach not only contributes valuable resources to the field of heat shock protein research in teleost but also provides a foundational understanding of the HSPs’ molecular mechanisms under different environmental stresses in T. septentrionalis.

2. Results

2.1. Identification and Characteristics of HSP70 and HSP90 Genes in T. septentrionalis

Utilizing BLASTp alignment and HMM search, this study identified a total of 12 HSP70 genes and 4 HSP90 genes within the genome of T. septentrionalis. Following the nomenclature convention for heat shock proteins in osteichthyes, the members of the HSP70 gene family in T. septentrionalis were designated as hsp70, hspa1b, hspa4, hspa4a, hspa4l, hspa5, hspa8.1, hspa8.2, hspa9, hspa13, hspa14, and hyou1. The HSP90 gene family members were named hsp90aa1, hsp90ab1, hsp90b1, and trap1. Gene accession numbers for HSP70 and HSP90 in teleosts and other animals were detailed in Supplementary Material Table S1, while a comparison of the HSP70 and HSP90 gene counts between T. septentrionalis and other species was presented in Supplementary Material Table S2.
Utilizing the ExPASy online platform, this study conducted a physicochemical property analysis of HSP70 and HSP90 proteins in T. septentrionalis. Details such as gene names and protein physicochemical properties of each gene family member were presented in Table 1. The amino acid lengths of HSP70 proteins ranged from 442 (hspa13) to 945 (hyou1), with molecular weights varying between 47.83 (hspa13) and 106.41 kDa (hyou1) and isoelectric points between 4.97 (hspa5) and 6.24 (hspa9). HSP90 proteins displayed amino acid lengths from 719 (trap1) to 801 (hsp90b1), molecular weights from 81.84 (trap1) to 91.99 kDa (hsp90b1), and isoelectric points from 4.74 (hsp90b1) to 5.99 (trap1). The protein instability index results indicated that out of 16 genes, 9 were classified as stable proteins (instability index < 40), while 7 were identified as unstable (instability index > 40); the aliphatic index ranged from 72.97 (hspa4) to 102.15 (hspa13). Hydrophobicity analysis of HSP70 and HSP90 proteins revealed that apart from hspa13 exhibiting certain hydrophobicity (>0), other HSPs displayed hydrophilic characteristics (<0). All sequences of HSP70 and HSP90 in T. septentrionalis had been submitted to the GenBank database, and their NCBI accession numbers were listed in Table 1.

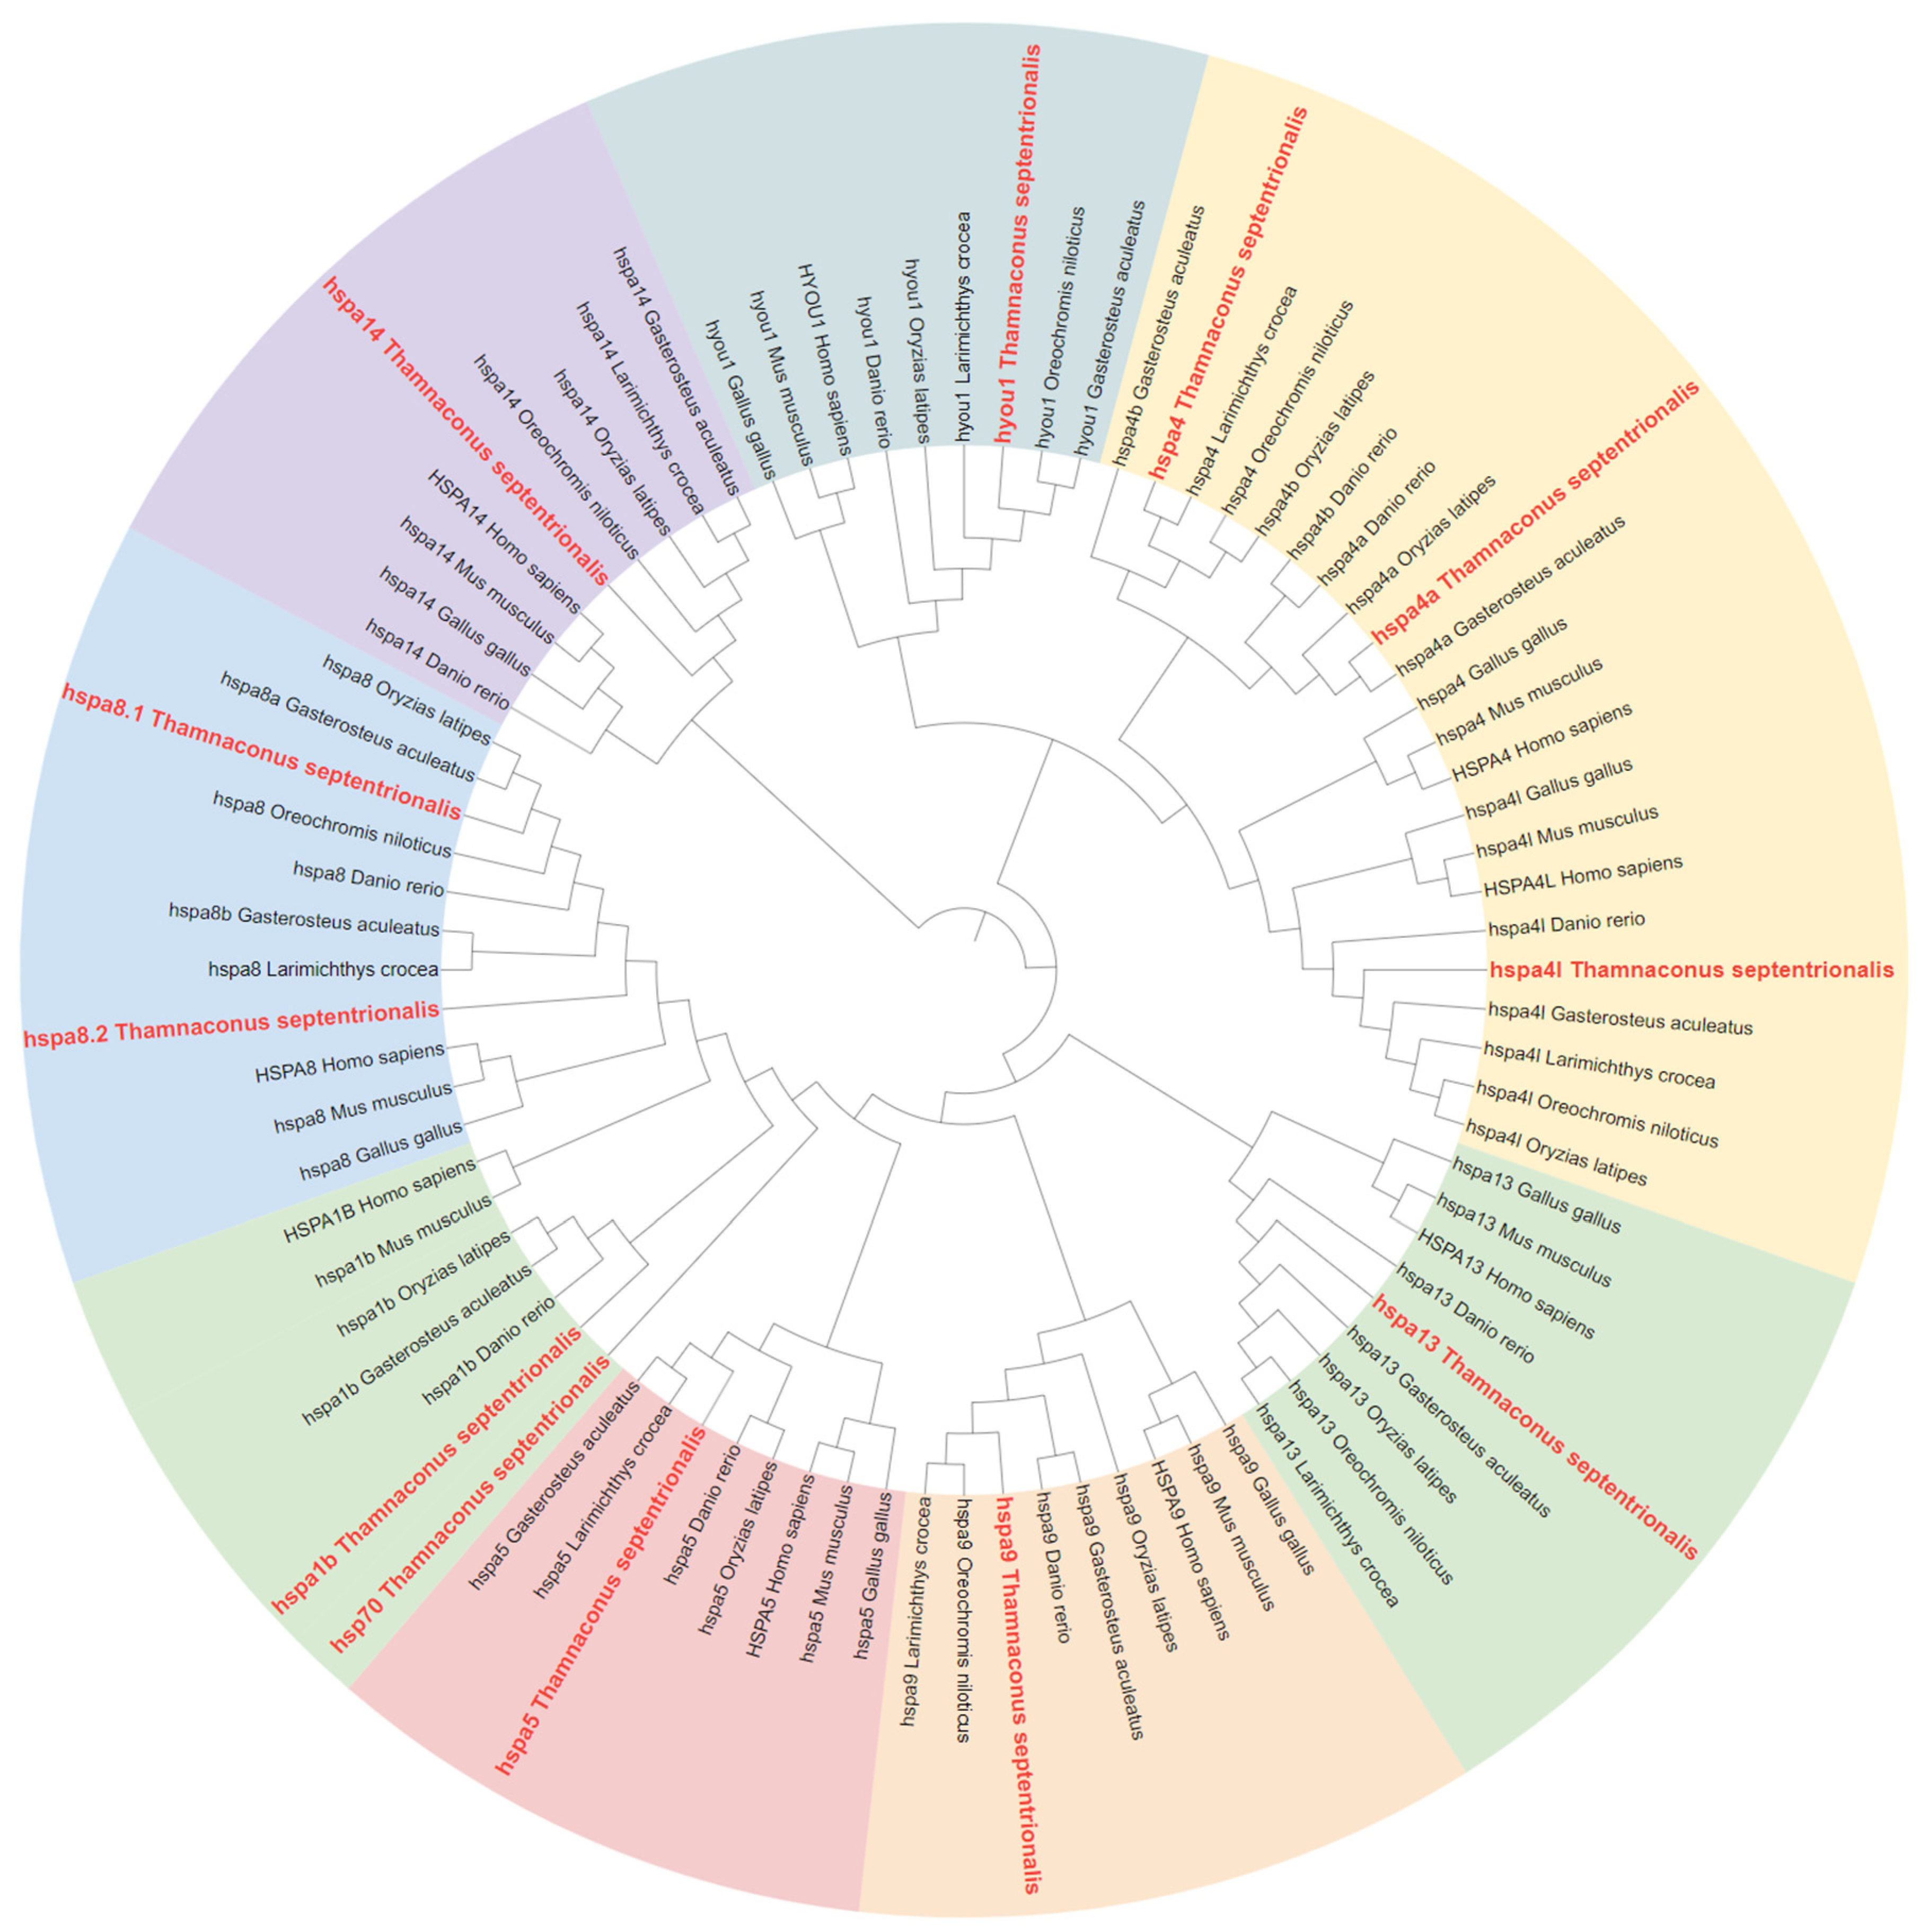
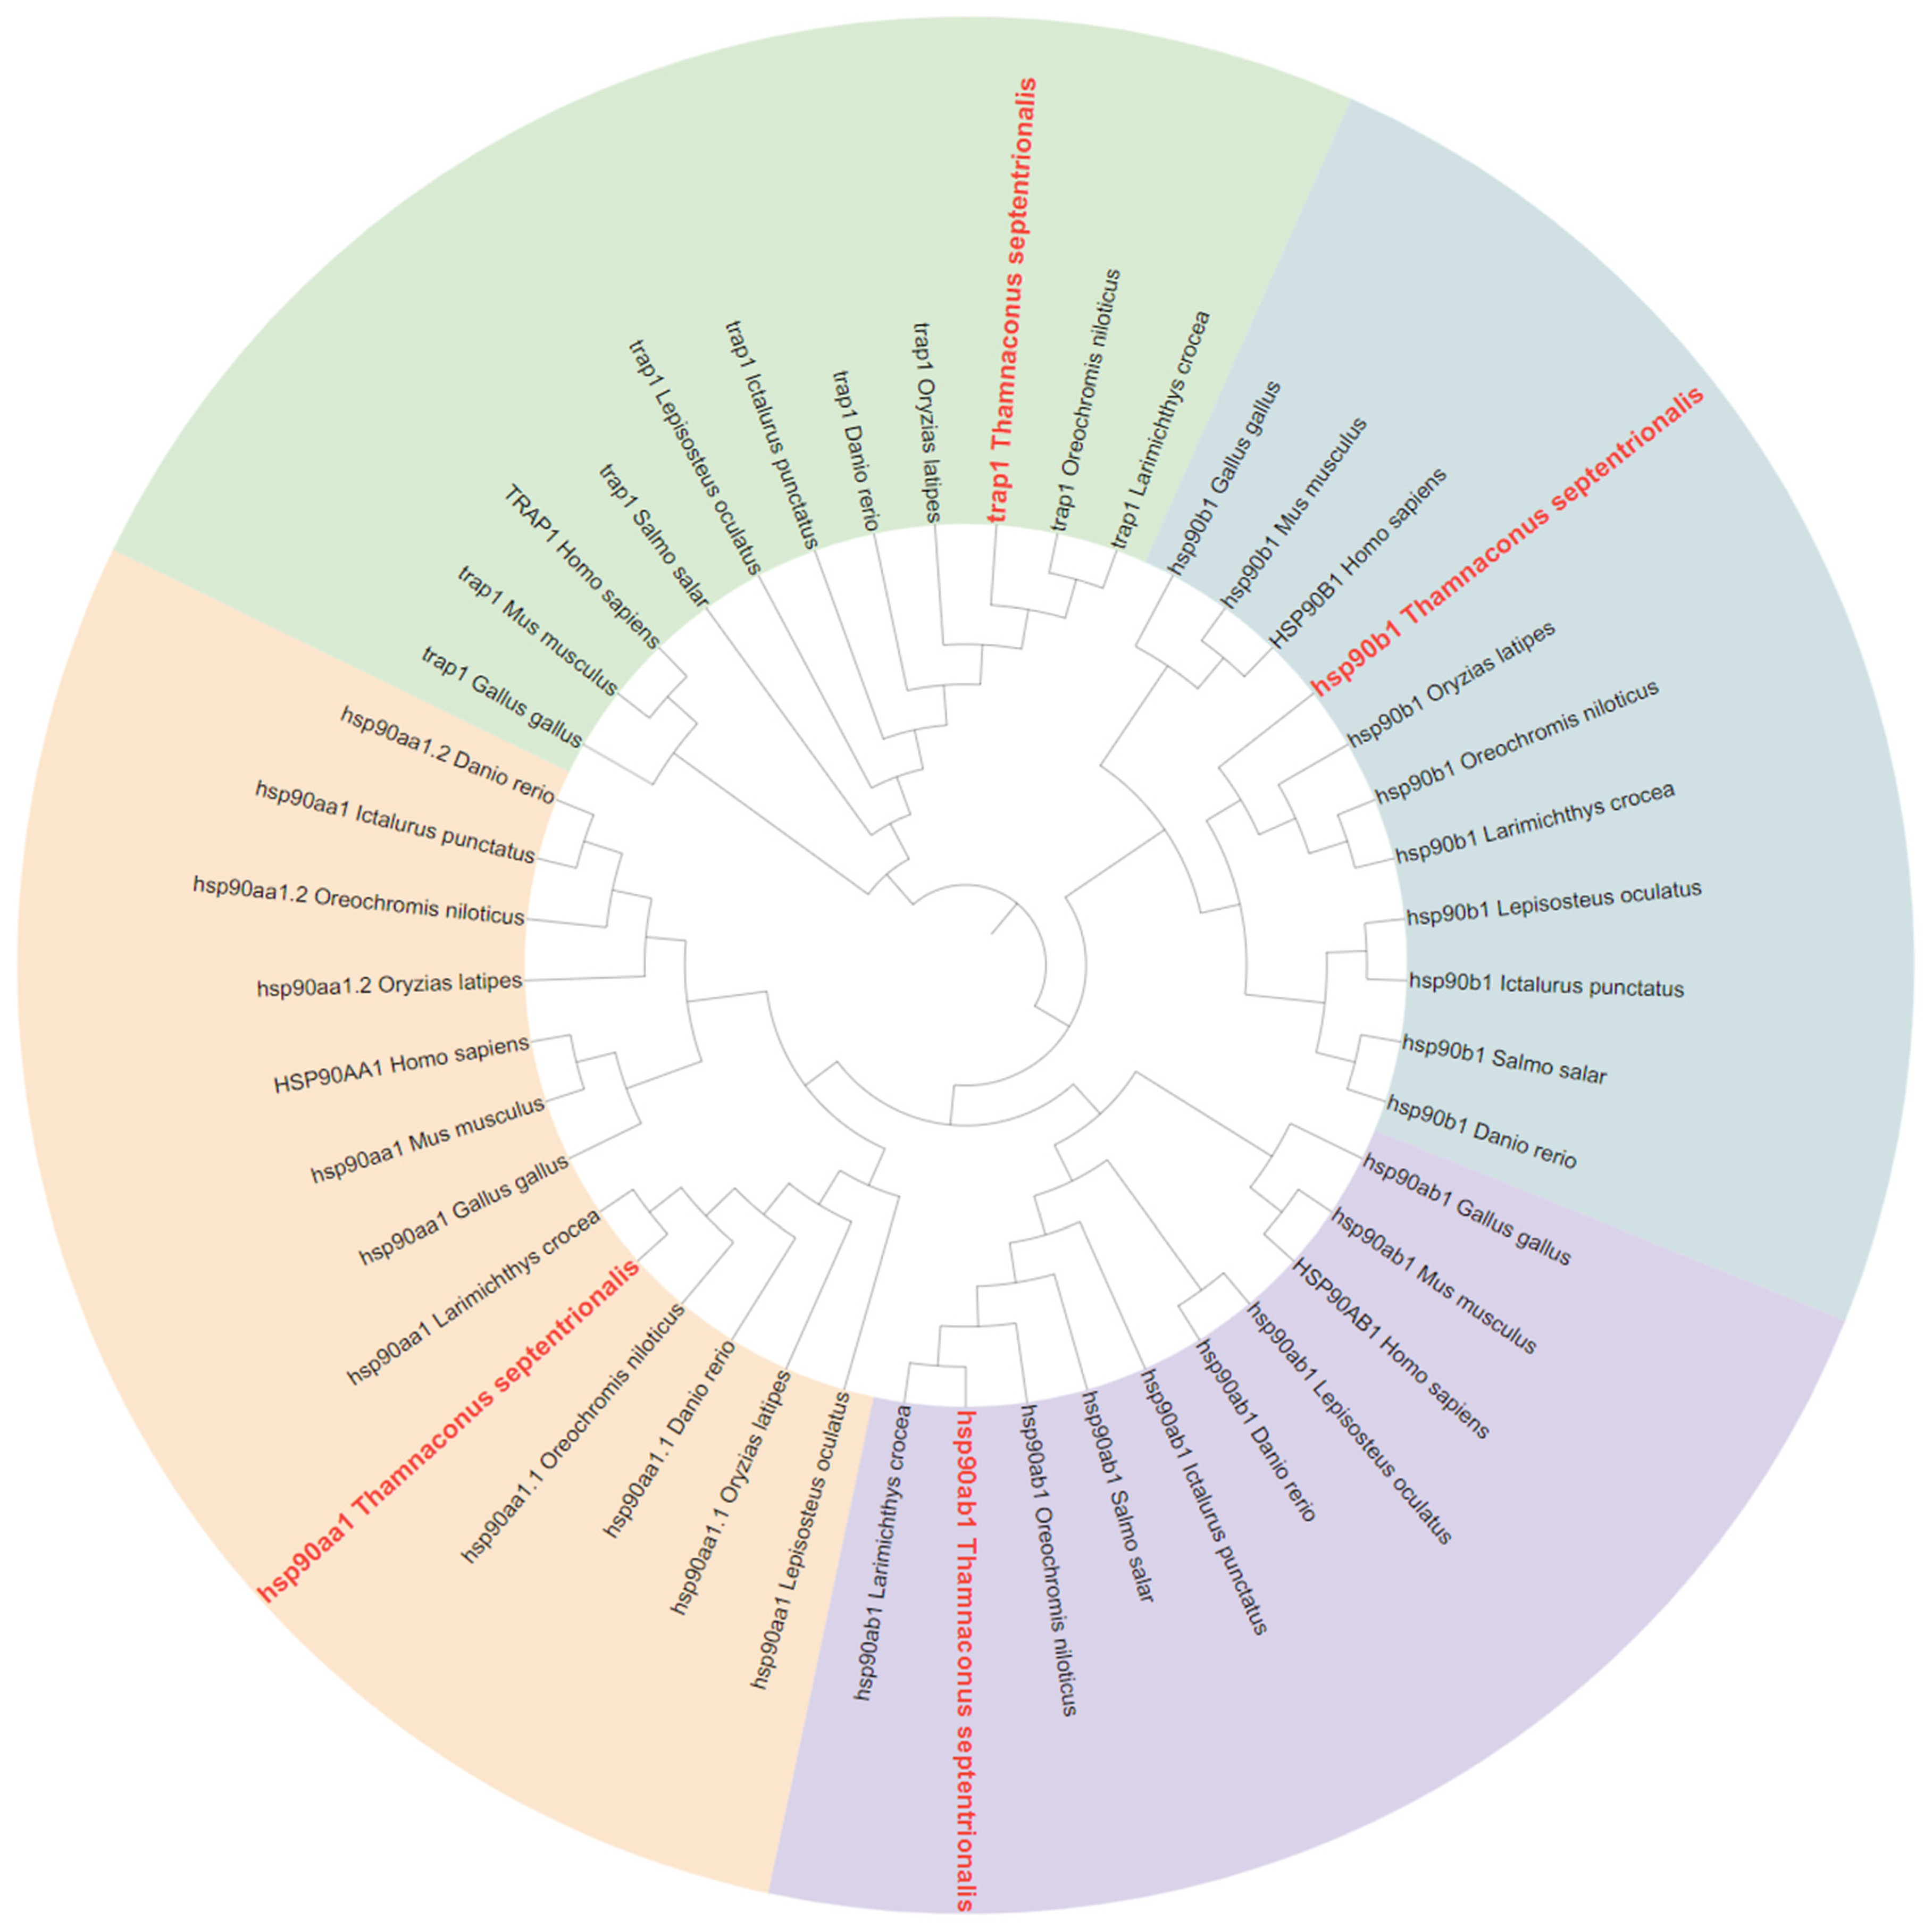
2.2. Phylogenetic Analysis of HSP70 and HSP90 Genes

A phylogenetic tree of the HSP70 gene in T. septentrionalis was constructed based on the identified HSP70 protein sequences in Danio rerio, Oryzias latipes, Gasterosteus aculeatus, Larimichthys crocea, Oreochromis niloticus, Homo sapiens, Mus musculus, and Gallus gallus. As illustrated in Figure 1, the phylogenetic tree of HSP70 was divided into three major branches, with the 12 HSP70 genes categorized into eight clusters: hspa1, hspa4, hspa5, hspa8, hspa9, hspa13, hspa14, and hyou1. Gene duplication events were observed within the branches of hspa1 (hsp70, hspa1b), hspa4 (hspa4, hspa4a, and hspa4l), and hspa8 (hspa8.1 and hspa8.2), while no gene duplication was noted in the branches of hspa5, hspa9, hspa13, hspa14, and hyou1. The 12 genes were grouped with orthologous genes from different species within the eight branches, exhibiting high bootstrap values and indicating robust phylogenetic relationships.
A phylogenetic tree for the HSP90 gene in T. septentrionalis was constructed using identified HSP90 protein sequences from D. rerio, O. latipes, L. crocea, O. niloticus, Salmo salar, Ictalurus punctatus, Lepisosteus oculatus, H. sapiens, M. musculus, G. gallus. As depicted in Figure 2, the phylogenetic tree of HSP90 was divided into three major branches, with the 4 HSP90 genes categorized into four distinct branches: hsp90aa1, hsp90ab1, hsp90b1, and trap1. No gene duplication events were observed within any of the branches. The protein sequences from all species used in constructing the evolutionary trees are available in Supplementary Material Table S3.

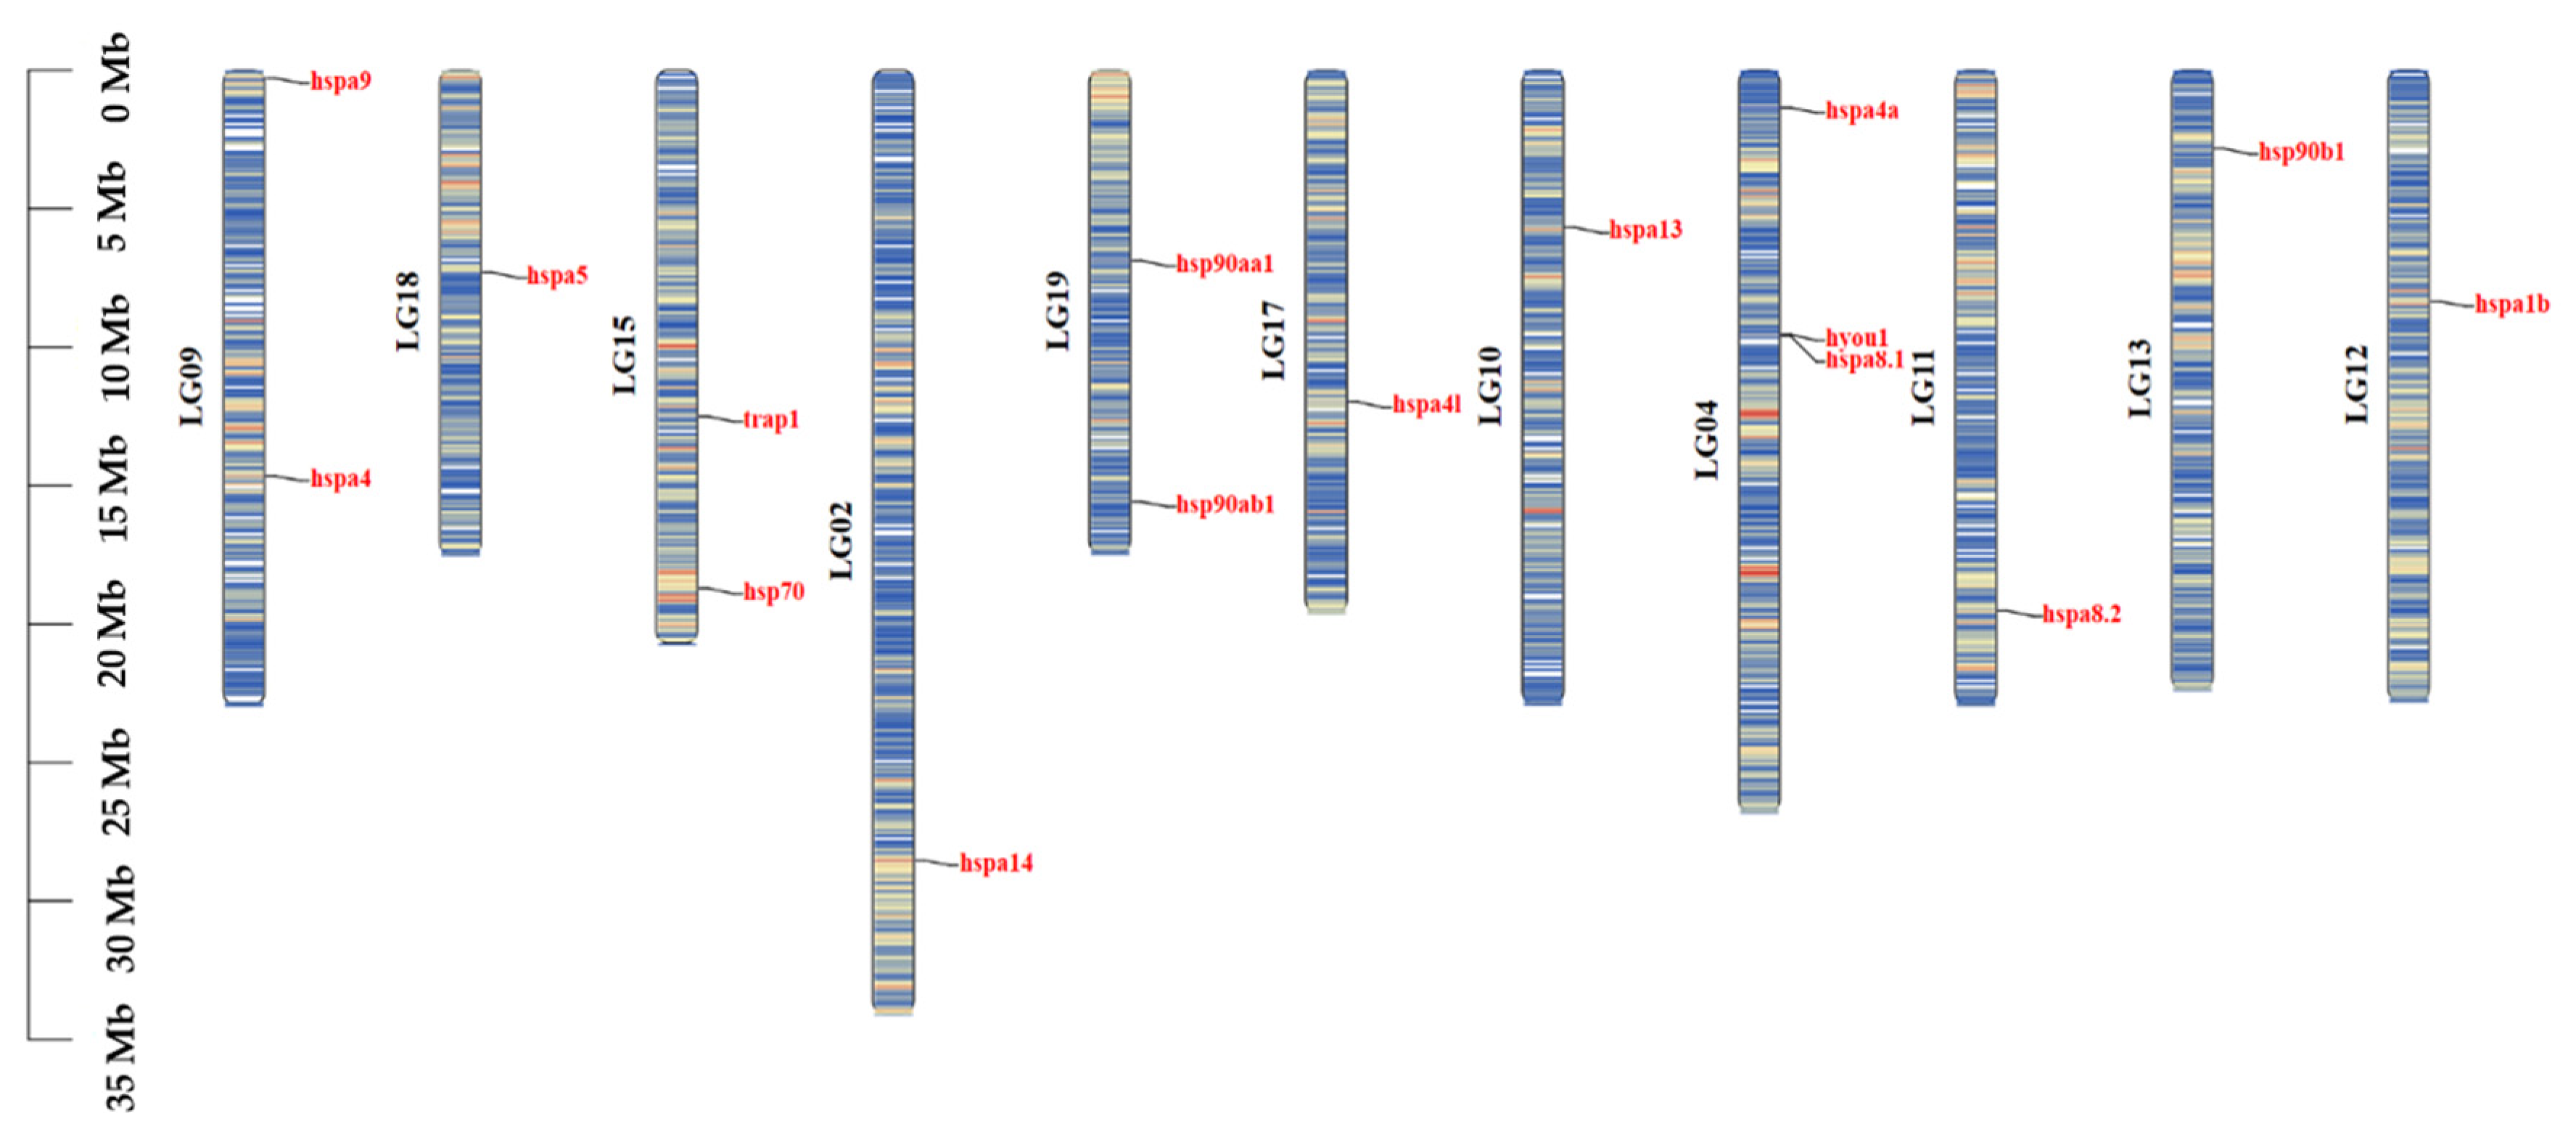
2.3. Gene Structure and Chromosome Distribution Analysis

The gene structures of HSP70 and HSP90 genes in T. septentrionalis were analyzed using TBtools software (version 2.092, Dr. Chengjie Chen, Guangdong, China) [20]. As illustrated in Figure 3, except for hspa1b and hsp70, which contained only one coding sequence (CDS), all other HSP70 and HSP90 genes possessed more than four CDSs. Furthermore, when gene structure was examined in conjunction with phylogenetic relationships using TBtools, genes with homologous relationships exhibited similar gene structures, such as hspa8.1 and hspa8.2, as well as hsp70 and hspa1b. The lengths of HSP70 genes ranged from 2 to 18 kb, while those of HSP90 genes span from 4 to 11 kb.
Chromosomal localization of HSP70 and HSP90 genes in T. septentrionalis was also conducted using TBtools software (version 2.092, Dr. Chengjie Chen, Guangdong, China), as shown in Figure 4. The 12 HSP70 genes were distributed across nine chromosomes, with three genes (hspa4a, hyou1, and hspa8.1) located on chromosome 4 and two genes (hspa4 and hspa9) on chromosome 9. The remaining HSP70 genes were individually located on chromosomes 2, 10, 11, 12, 15, 17, and 18. Among the HSP90 genes, hsp90aa1 and hsp90ab1 were found on chromosome 19, hsp90b1 was on chromosome 13, and trap1 was located on chromosome 15.

2.4. Motif and Conserved Domain Analysis

Conserved motif analysis of HSP70 and HSP90 protein sequences in T. septentrionalis was conducted using the online MEME website, with the number of motifs set to 20. As shown in Figure 5, the detected number of motifs for HSP70 genes ranged from 8 to 14, with the majority of HSP70 genes sharing nine common motifs: motifs 1, 2, 3, 4, 6, 7, 9, 10, and 11. All HSP70 genes shared seven motifs, specifically motifs 1, 3, 4, 6, 7, 9, and 11. The HSP90 genes exhibited a range of 5 to 9 detected motifs, with all HSP90 genes sharing five common motifs: motifs 12, 13, 14, 17, and 18. Overall, the variety of motifs across different genes was relatively consistent, and genes with homologous relationships displayed identical motif patterns, for example, hsp70, hspa8.2, hspa1b, and hspa5; hspa4, hspa4l, and hspa4a.
Conserved Domain Analysis of HSP70 and HSP90 genes in T. septentrionalis was performed using the NCBI website’s Batch CD-Search tool. Subsequently, TBtools software (version 2.092, Dr. Chengjie Chen, Guangdong, China) was employed to integrate the phylogenetic tree, motifs, and conserved domains. As illustrated in Figure 5, among the 12 HSP70 genes, five possessed the PTZ00009 superfamily domain (hspa8.1, hspa8.2, hspa1b, hsp70, and hspa5), three genes were characterized by the NBD_sugar-kinase_HSP70_actin superfamily domain (hspa4a, hspa4, and hspa14), and the remaining domains included dnak (hspa9), HSPA13-like_NBD (hspa13), HYOU1-like_NBD (hyou1), and HSPA4_like_NBD (hspa4l). Furthermore, among the four HSP90 genes, two had the PRK14083 superfamily domain (hsp90aa1 and hsp90ab1), the trap1 gene contained the PRK05218 domain, and the hsp90b1 gene encompassed both the HATPase_HSP90-like domain and the HSP90 domain. A phylogenetic tree was constructed using the HSP70 and HSP90 protein sequences of T. septentrionalis, and TBtools software (version 2.092, Dr. Chengjie Chen, Guangdong, China) facilitated the collective visualization of the phylogenetic tree, motifs, and conserved domains.

2.5. Protein Structure Prediction and Subcellular Localization

As depicted in Table 2 and Figure 6, the secondary structures of HSP70 proteins in T. septentrionalis predominantly comprised alpha helices and random coils, with alpha helices accounting for 33.79% (hspa8.1) to 48.99% (hyou1), Extended Strand ranged from 13.23% (hyou1) to 24.90% (hspa14), Beta Turn from 3.07% (hspa4) to 8.54% (hspa8.1), and Random coil from 28.34% (hspa9) to 40.19% (hspa4). The secondary structures of HSP90 proteins in T. septentrionalis were mainly composed of alpha helices and random coils as well, with alpha helices representing 45.20% (trap1) to 54.68% (hsp90b1), Extended Strand from 12.36% (hsp90b1) to 13.77% (trap1), Beta Turn from 3.75% (hsp90b1) to 5.70% (trap1), and Random coil from 28.41% (hsp90aa1) to 35.33% (trap1). Supplementary Material Table S4 presented the results of assessing the quality of the three-dimensional structure of HSP70 and HSP90 proteins and included the three-dimensional structural quality parameters in Table 2. The value of residues in the most favored regions [A, B, L] is above 90%, indicating that the constructed 3D models of the proteins were of high quality.
Subcellular localization of HSP70 and HSP90 genes in T. septentrionalis was conducted using the online website WOLF PSORT. Predictive results of subcellular localization revealed that 7 out of the 12 HSP70 genes (hspa1b, hspa4, hspa4a, hspa4l, hspa8.1, hspa8.2, and hspa14) were expressed in the Cytosol, 3 genes (hspa5, hspa13, and hyou1) in the endoplasmic reticulum, hsp70 in the Nucleus, and hspa9 in the mitochondrion. Among the HSP90 genes, hsp90aa1 and hsp90ab1 were expressed in the Cytosol, hsp90b1 in the endoplasmic reticulum, and trap1 in the mitochondrion. In summary, HSP70 and HSP90 genes were predominantly expressed in the cytoplasm, endoplasmic reticulum, and mitochondria.

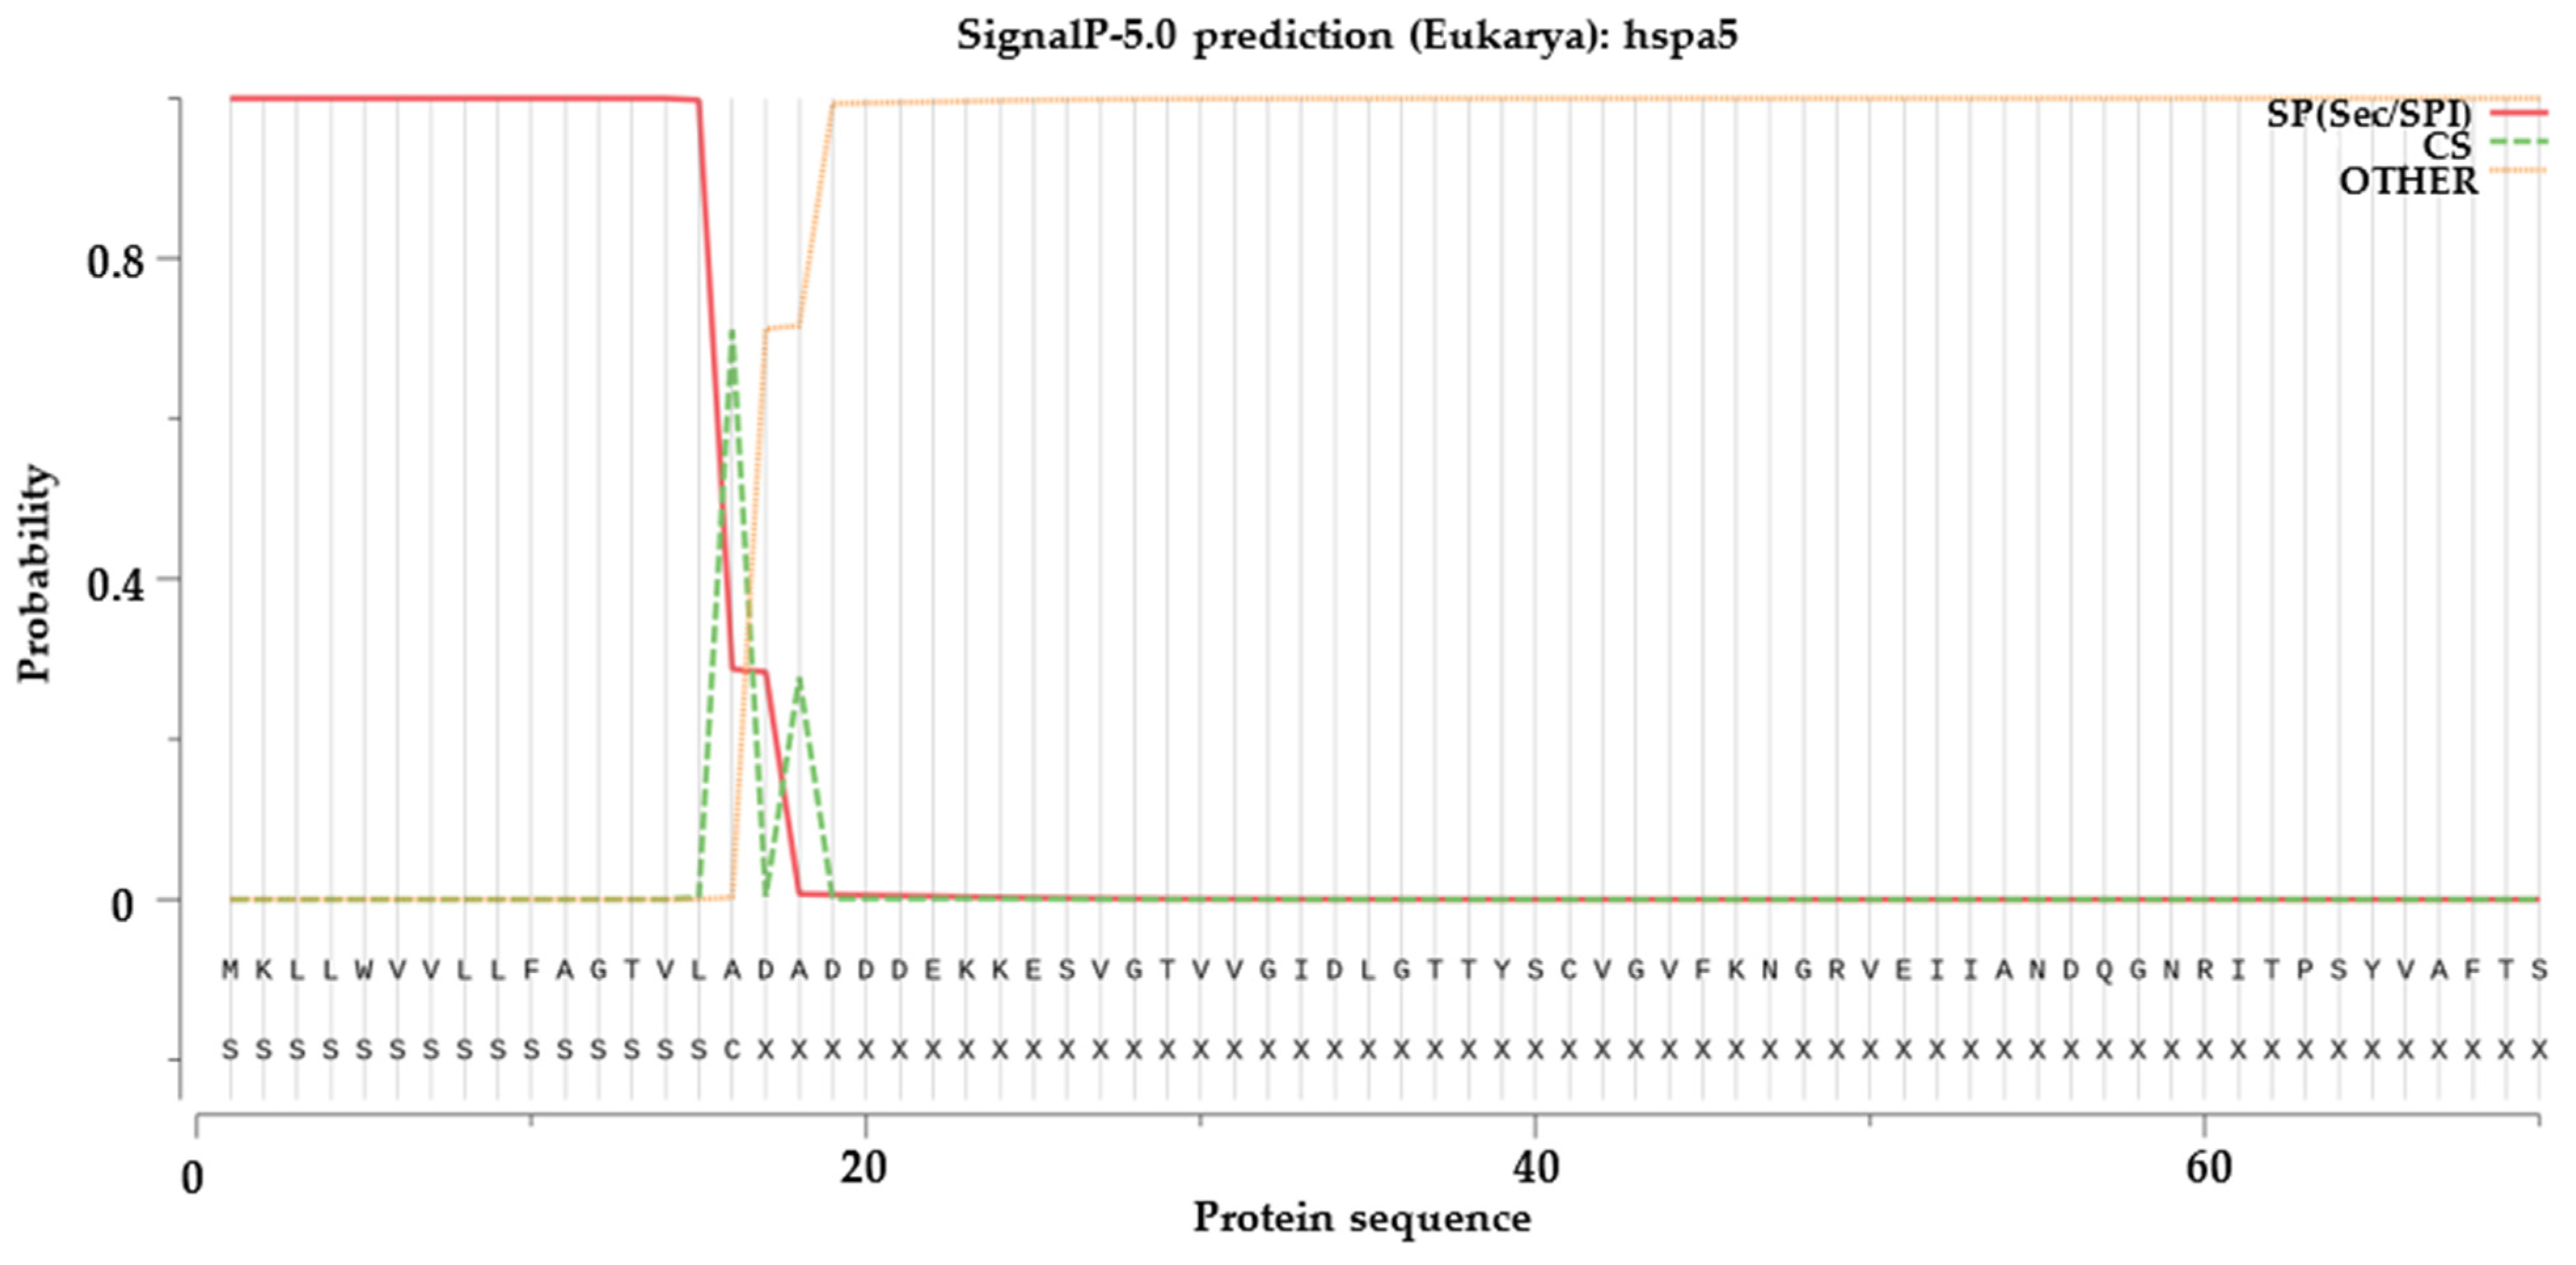
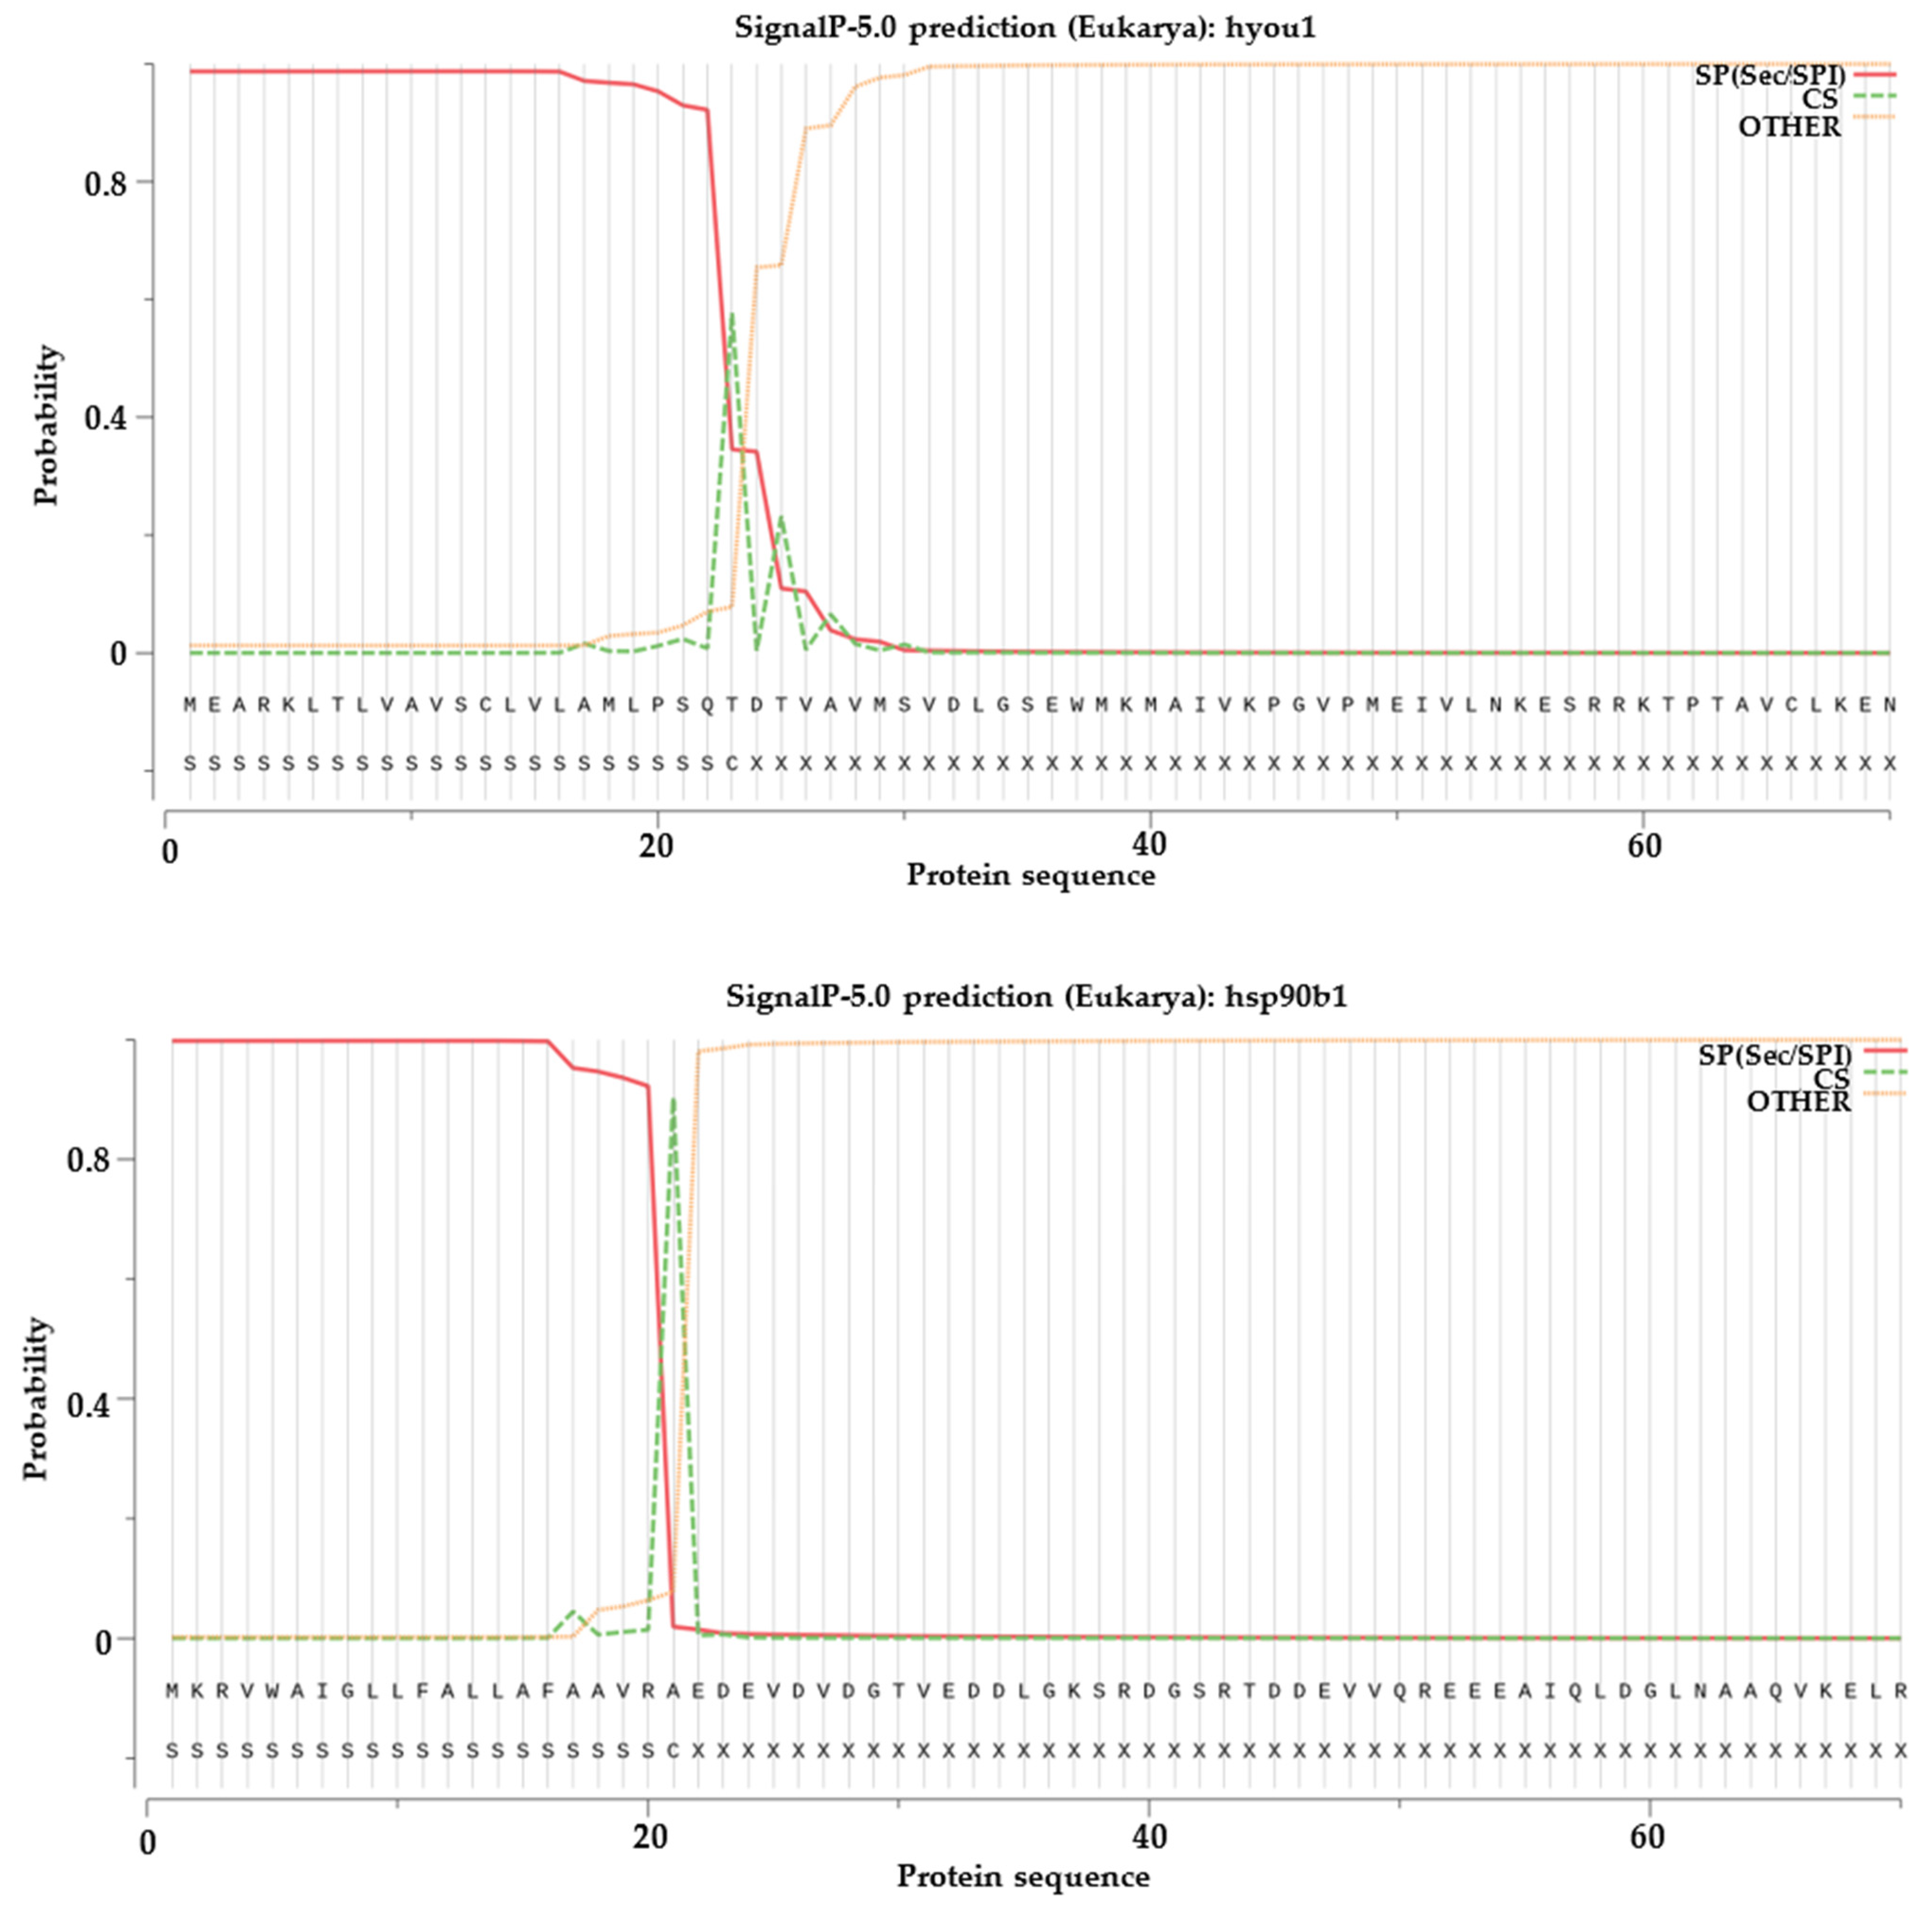
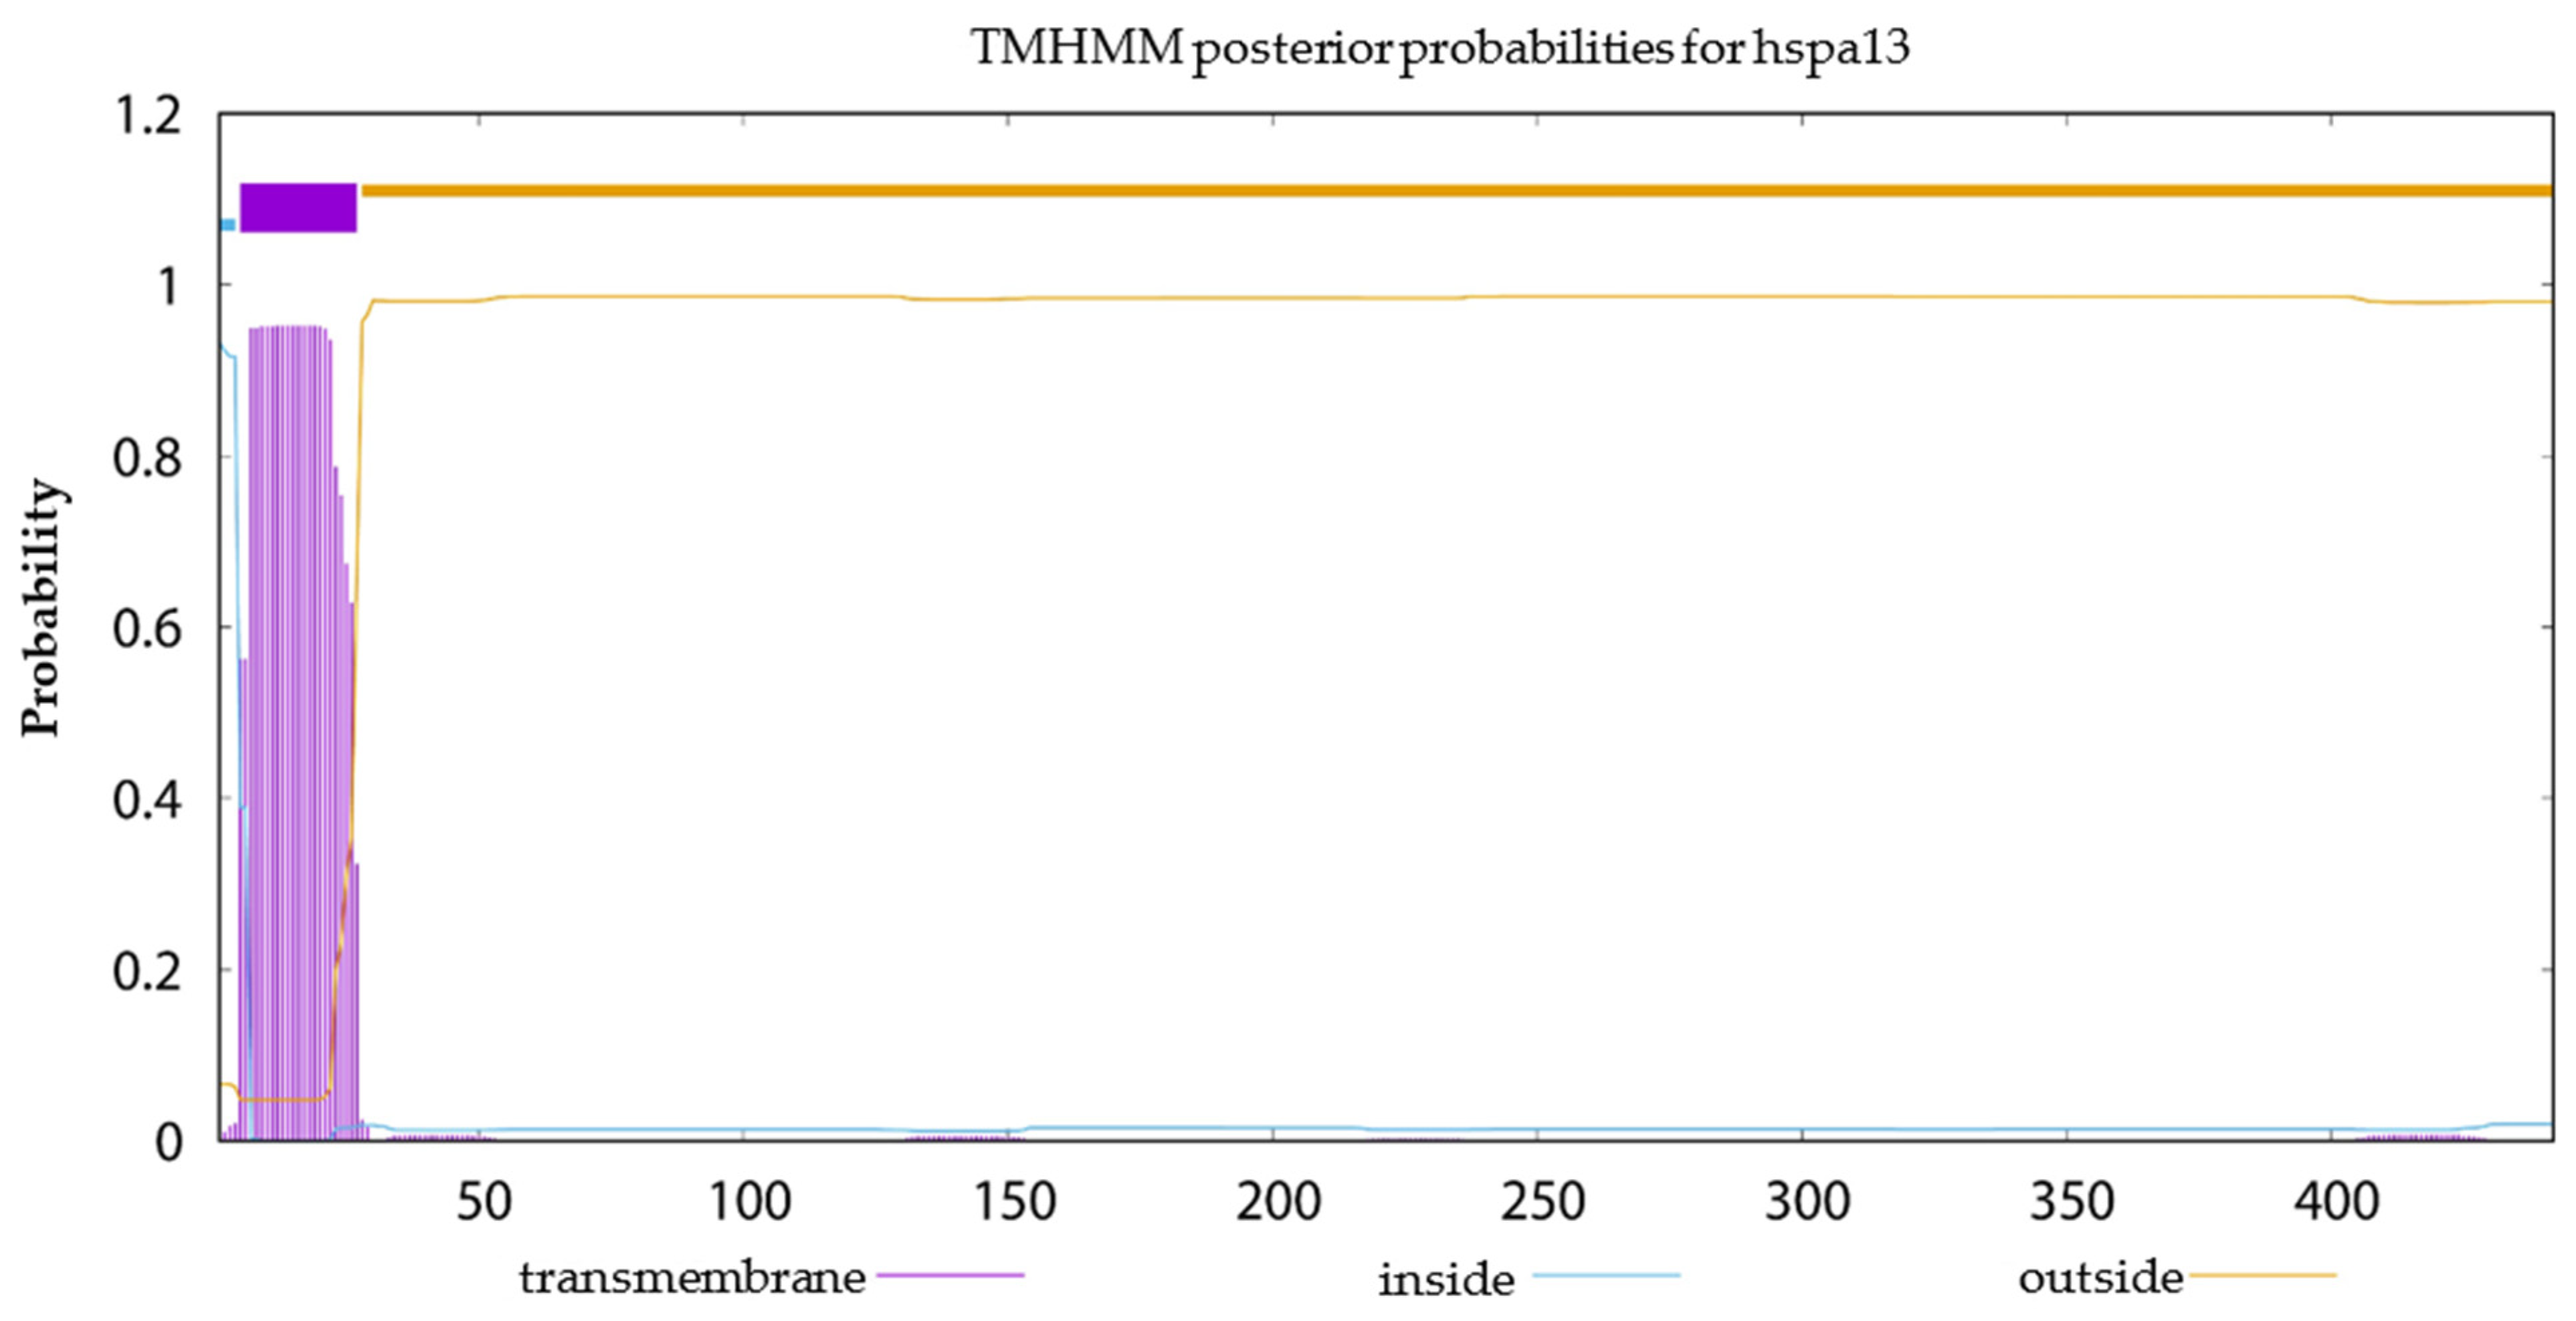
2.6. Signal Peptide Prediction, Transmembrane Structural Domain Prediction and Selection Test on Duplicated HSP70 and HSP90 Gene Pairs

The signal peptide prediction results for HSP70 and HSP90 proteins indicated (Figure 7) that hspa5 and hyou1 from HSP70 and hsp90b1 from HSP90 had been predicted and preliminarily identified as secretory proteins (SP). As shown in Figure 7, the highest cleavage site (CS) score for hspa5 is 0.7102, occurring at the 16th position alanine (A); for hyou1, the highest CS score is 0.5765, found at the 23rd position threonine (T), and for hsp90b1, the highest CS score is 0.9034, at the 21st position alanine (A). Based on the SP values, proteins hspa5, hyou1, and hsp90b1 were all equipped with signal peptides, and the lengths of these signal peptides were approximately 15, 22, and 20, respectively.
The transmembrane domain prediction results (Figure 8) indicated that among the 16 HSP proteins, only the HSP70 family member hspa13 was likely to possess a transmembrane domain, suggesting that hspa13 may function as a membrane protein. In summary, based on the prediction outcomes, none of the 16 HSP proteins exhibited both signal peptides and transmembrane domains.
To investigate the evolutionary constraints and selection pressures on HSP70 and HSP90 genes, TBtools software (version 2.092, Dr. Chengjie Chen, Guangdong, China) was utilized to calculate the nonsynonymous (Ka), synonymous (Ks), and Ka/Ks ratios for five homologous pairs of HSP70 genes and one pair of HSP90 genes. As indicated in Table 3, the Ka/Ks ratios for the HSP70 gene pairs ranged between 0.045851 and 0.182385, while the Ka/Ks ratio for the HSP90 gene pair was 0.115141. The Ka/Ks ratios for all six gene pairs were much below 1.0, suggesting that these genes had undergone strong purifying selection throughout their evolutionary history.

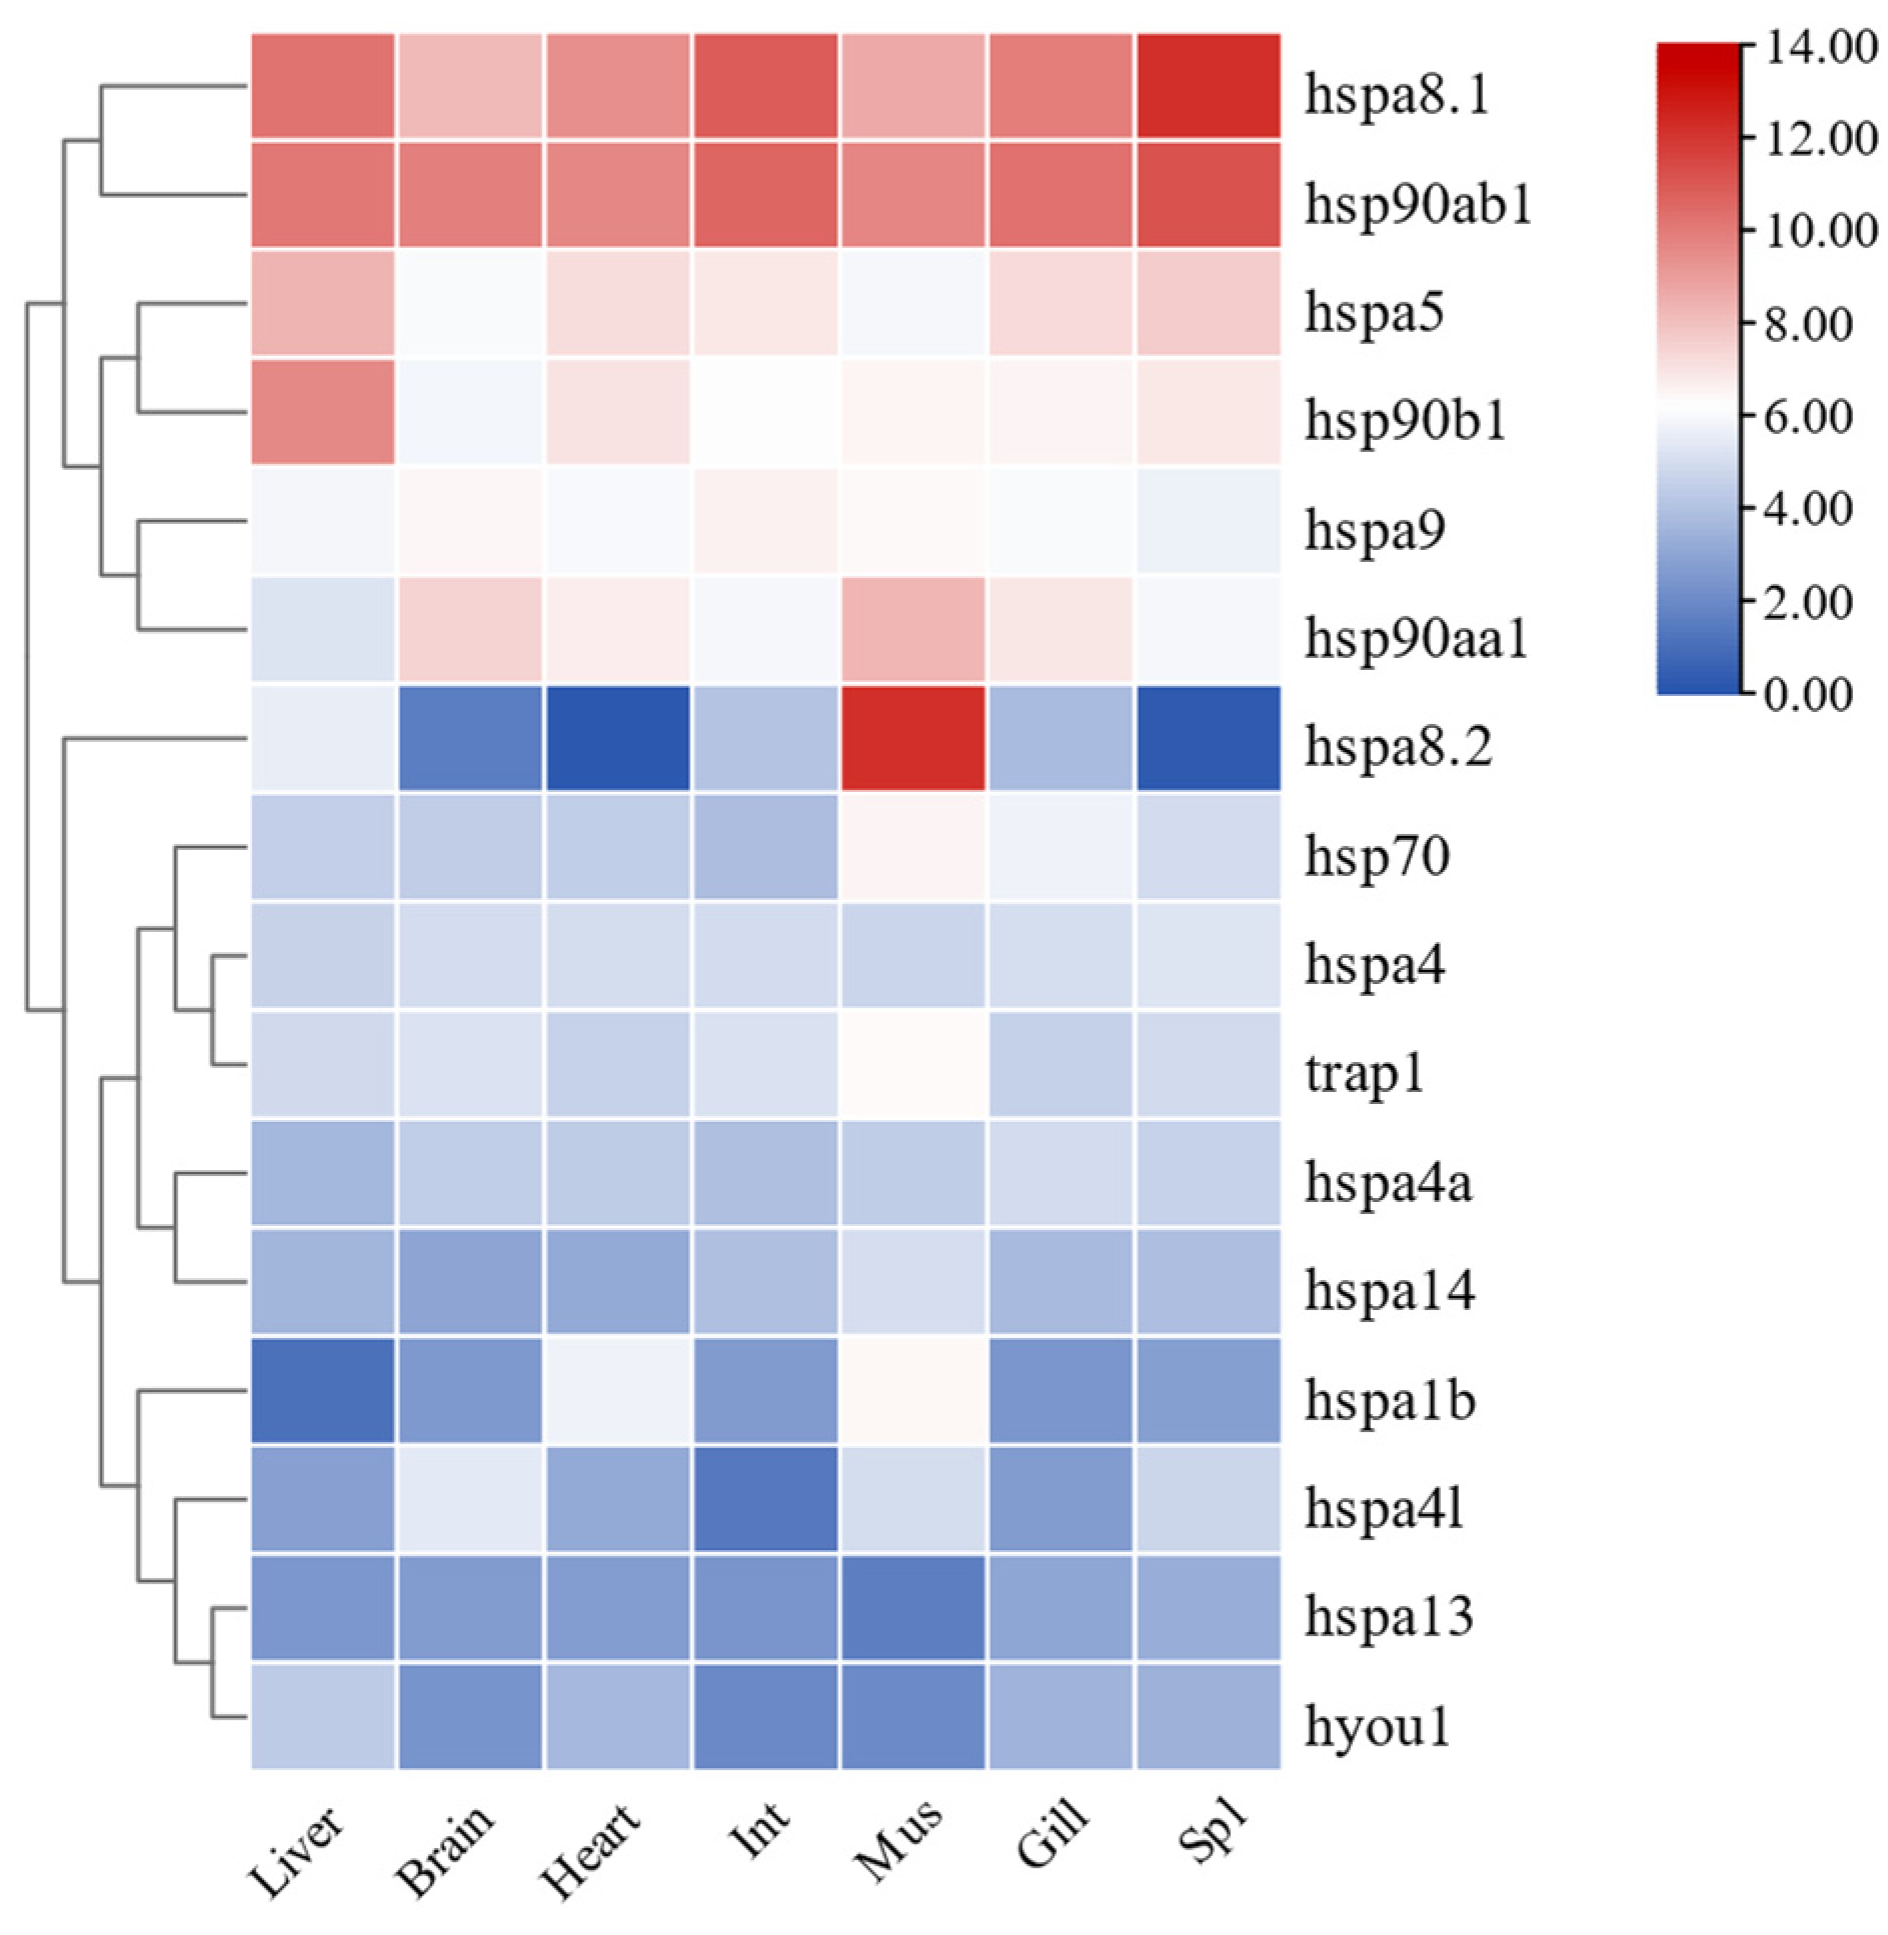
2.7. Expression Patterns of HSP70 and HSP90 Genes in Tissues of T. septentrionalis

To determine the functional expression of HSP70 and HSP90 genes across different tissues in T. septentrionalis, transcriptome results from various tissues of the species were analyzed, with FPKM values processed using TBtools software (version 2.092, Dr. Chengjie Chen, Guangdong, China) to study the expression profiles of HSP70 and HSP90 genes. As depicted in Figure 9, all 12 HSP70 and 4 HSP90 genes were expressed across seven tissues. In the liver, the expression of hspa8.1 was the highest, while hspa1b was the lowest. In both the brain and heart, hsp90ab1 exhibited the highest expression and hspa8.2 the lowest. In the intestine, hspa8.1 showed the highest expression, with hspa4l being the lowest. In muscle, hspa8.2 was the highest, and hspa13 was the lowest. In gills, hsp90ab1 had the highest expression, and hspa1b was the lowest. In the spleen, hspa8.1 was the highest, and hspa8.2 was the lowest. Overall, the three genes with the highest expression across the seven tissues were hspa8.1 (liver, intestine, and spleen), hsp90ab1 (brain, heart, and gills), and hspa8.2 (muscle), whereas the four genes with the lowest expression were hspa8.2 (brain, heart, and spleen), hspa1b (liver and gills), hspa4l (intestine), and hspa13 (muscle).

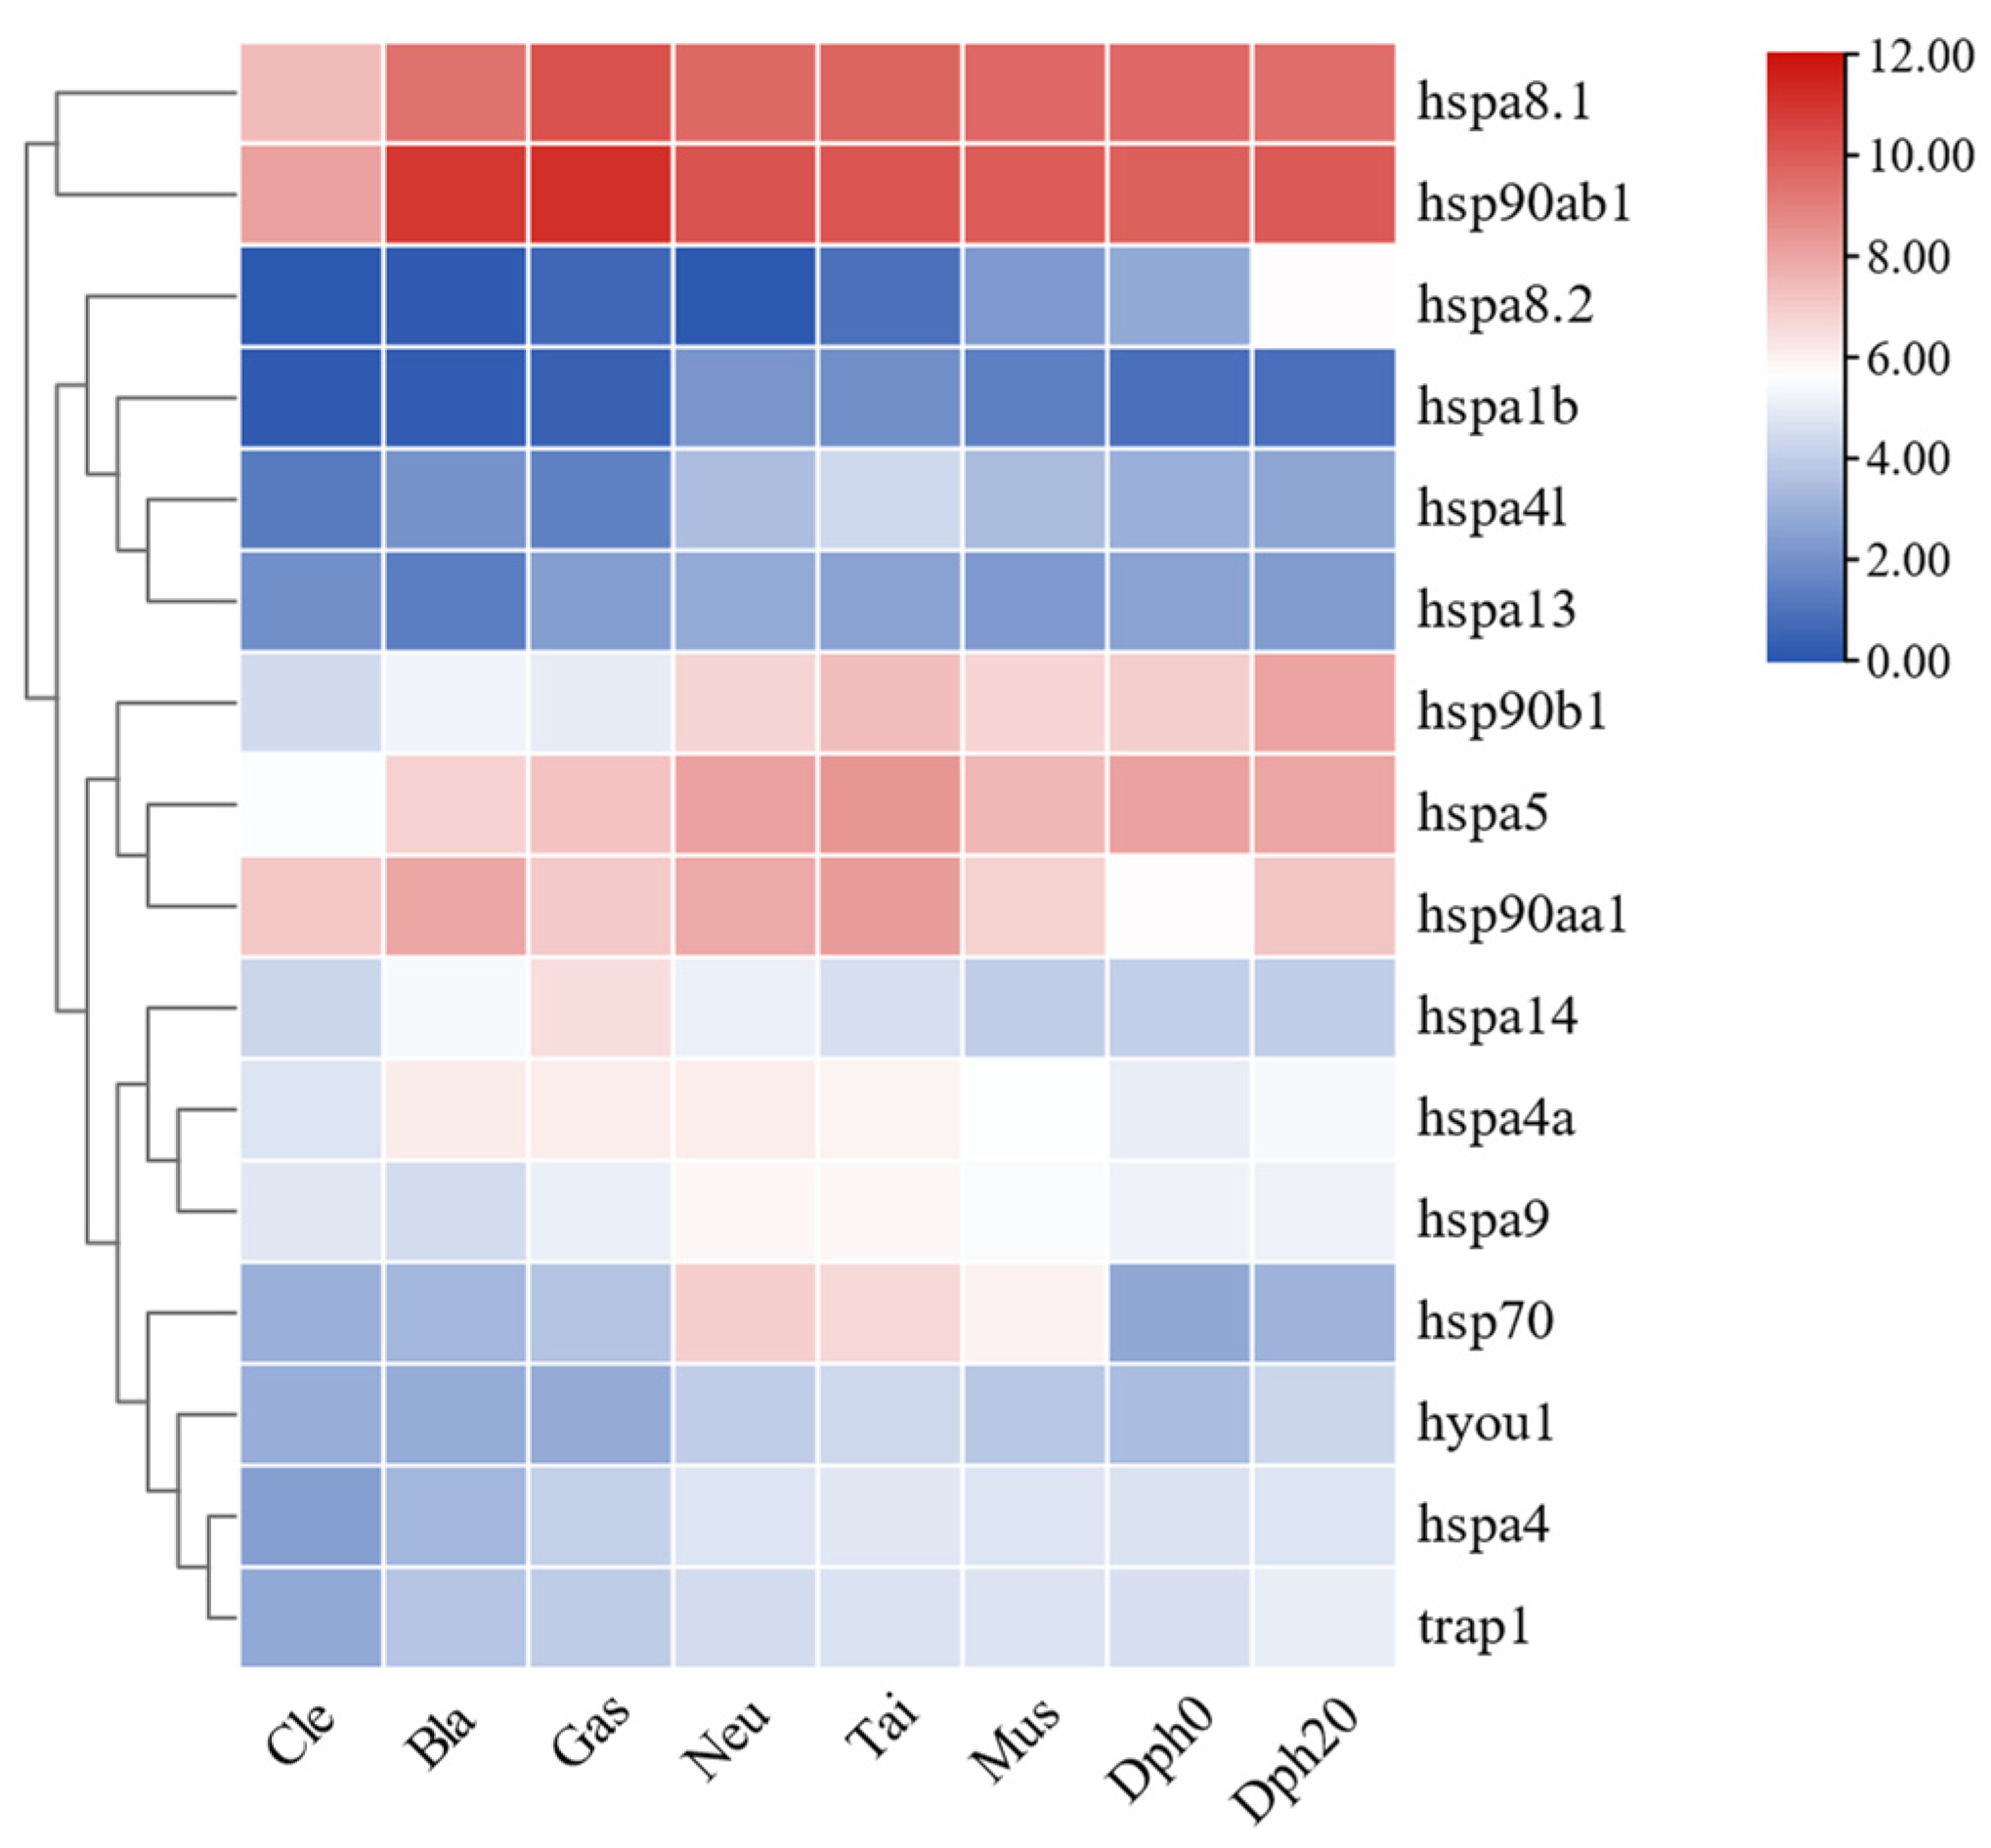
2.8. Expression Patterns of HSP70 and HSP90 Genes during Different Developmental Stages of T. septentrionalis

To ascertain the expression roles of HSP70 and HSP90 genes across different developmental stages in T. septentrionalis, transcriptome data from various developmental stages of the species were analyzed, with FPKM values processed using TBtools software (version 2.092, Dr. Chengjie Chen, Guangdong, China) to explore the expression profiles of HSP70 and HSP90 genes. As shown in Figure 10, all 12 HSP70 and 4 HSP90 genes were expressed across eight developmental stages. During the cleavage, blastocyst, neuroembryonic, and tail bud stages, hsp90ab1 exhibited the highest expression, while hspa8.2 showed the lowest. Throughout the gastrula stage, muscle effect stage, hatch 0-day larvae, and hatch 20-day juvenile, hsp90ab1 again had the highest expression, with hspa1b displaying the lowest. In summary, the hsp90ab1 gene consistently showed the highest expression across all eight developmental stages, while the two genes with the lowest expression throughout these stages were hspa8.2 and hspa1b.

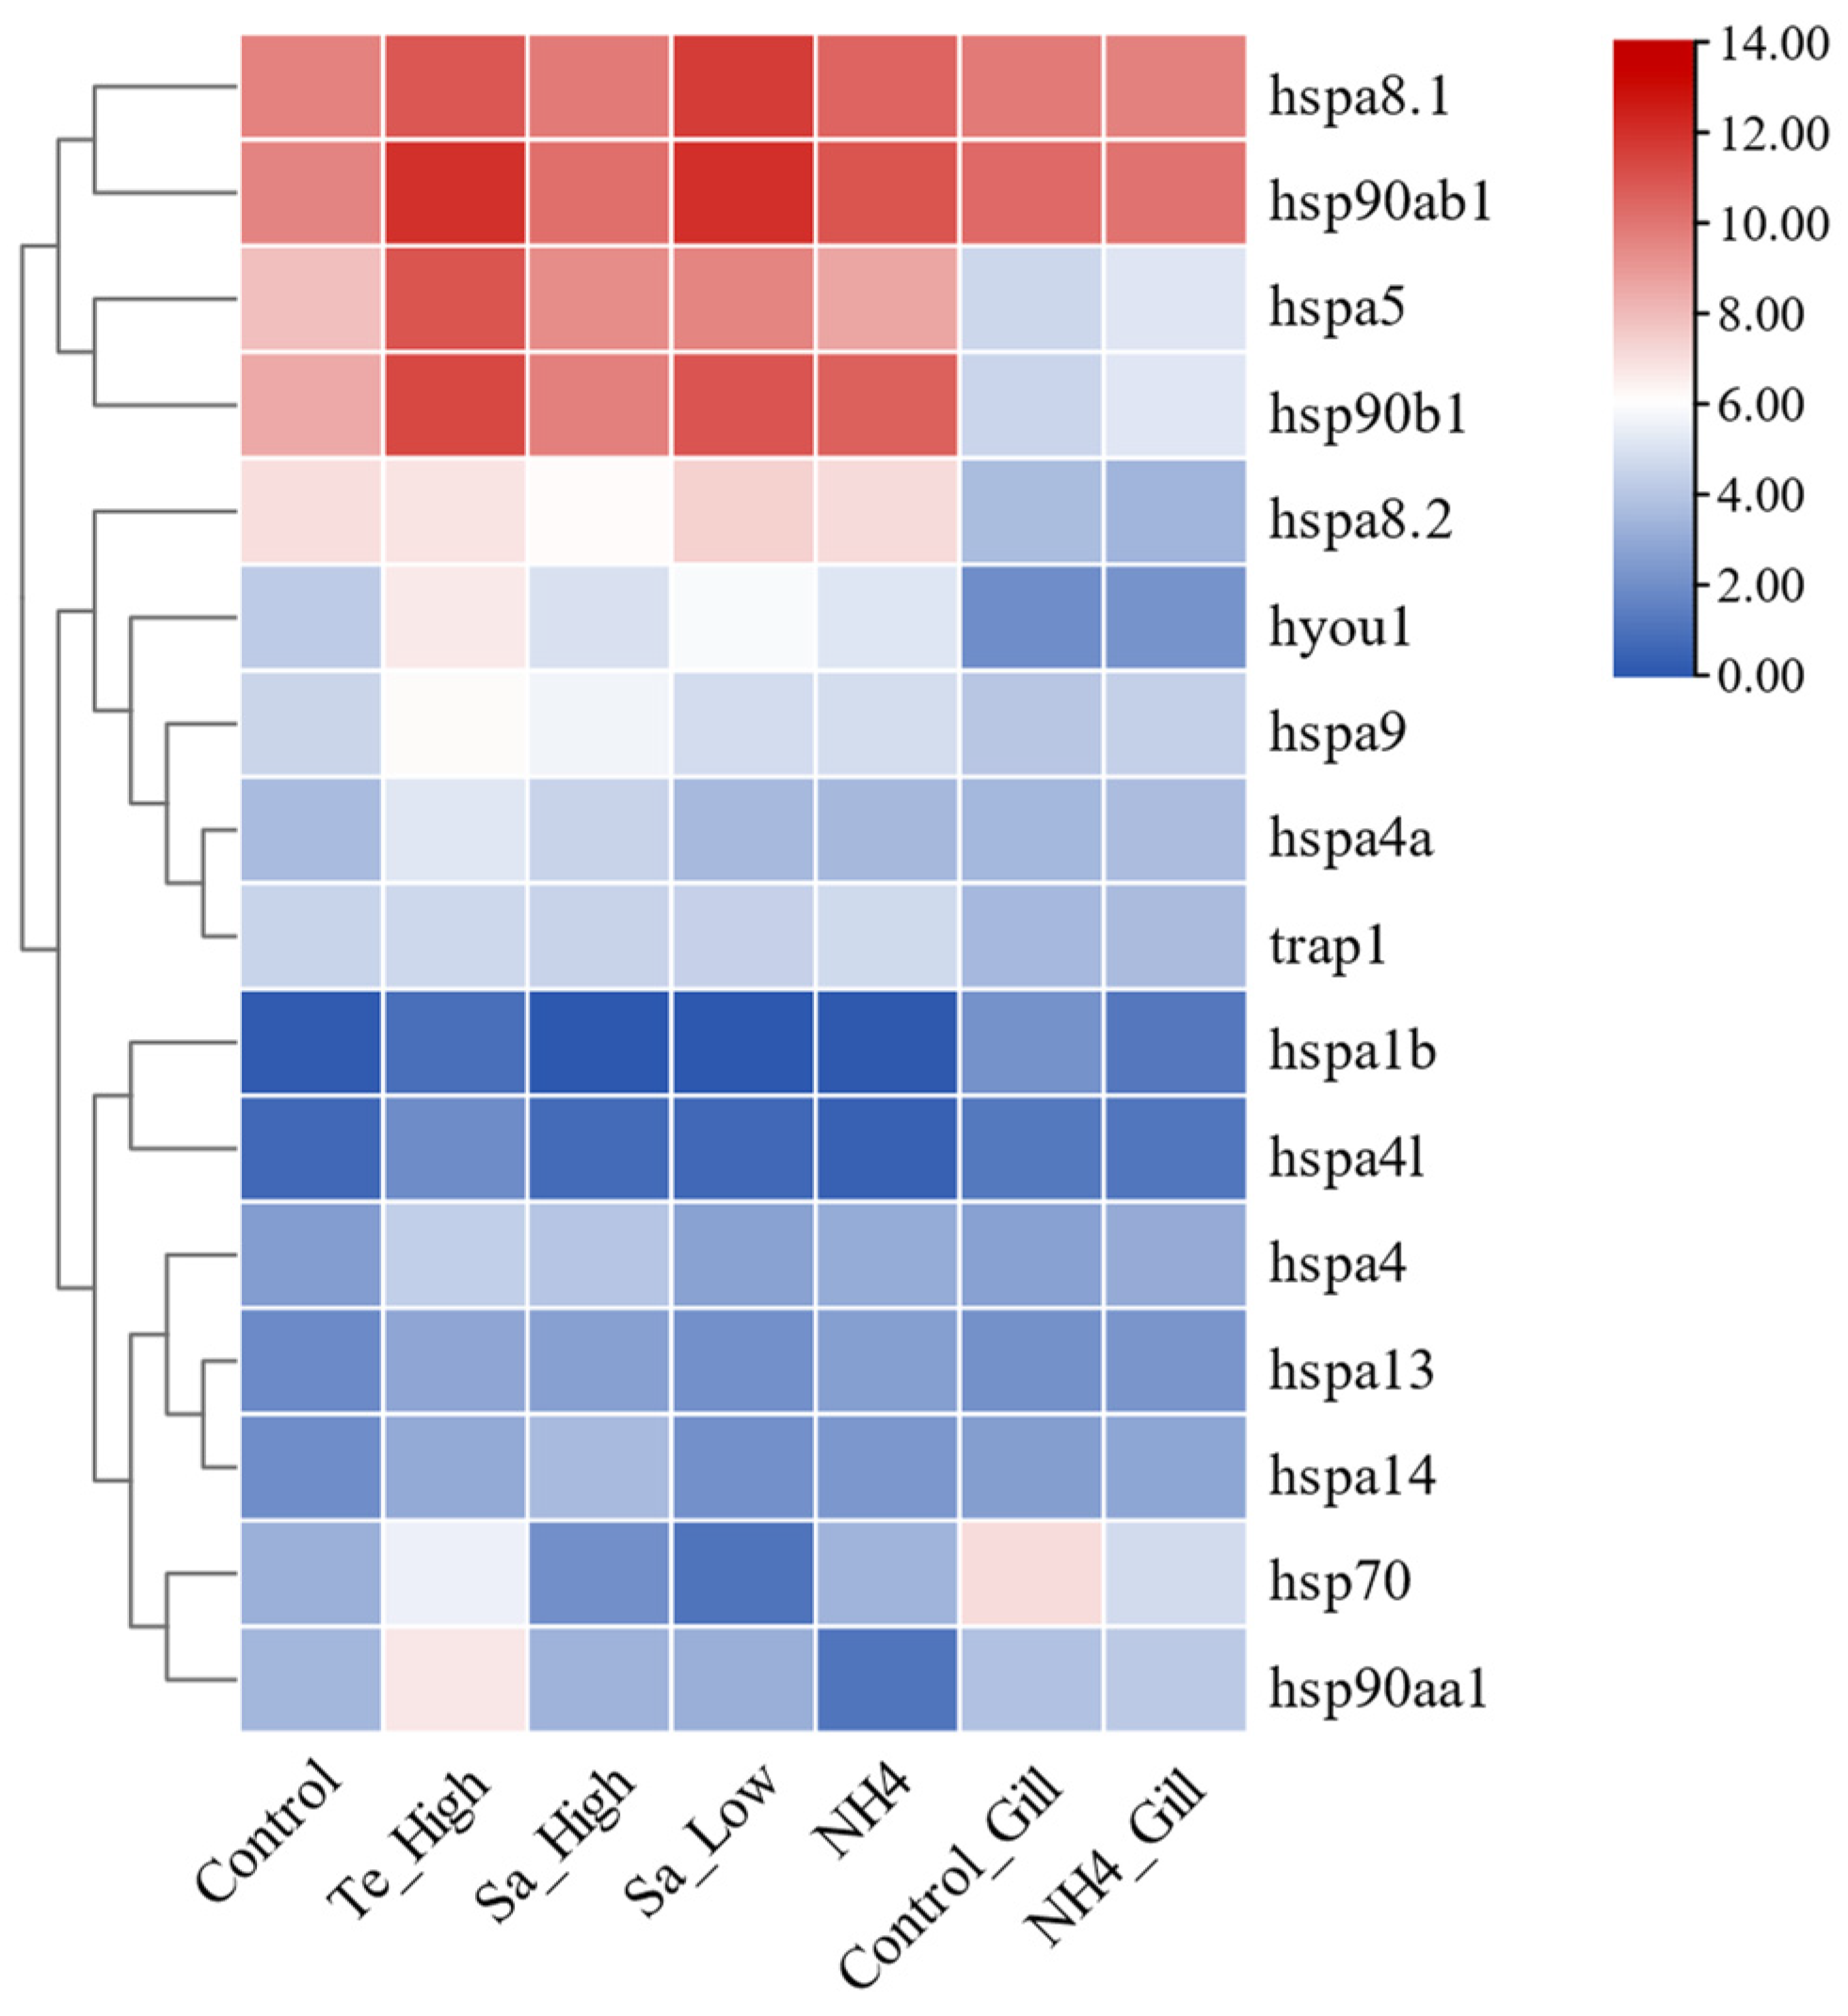
2.9. Expression Patterns of HSP70 and HSP90 Genes in Abiotic Stresses of T. septentrionalis

To determine the expression roles of HSP70 and HSP90 genes in T. septentrionalis under various abiotic stress conditions, transcriptome data from different environmental stresses were analyzed, with FPKM values processed using TBtools software (version 2.092, Dr. Chengjie Chen, Guangdong, China) to investigate the expression profiles of HSP70 and HSP90 genes. As shown in Figure 11, In the liver, compared to the control group, under high-temperature stress, all genes except hspa8.2 were upregulated. Under high salinity stress, 11 genes were upregulated (hspa4, hspa4a, hspa4l, hspa5, hspa8.1, hspa9, hspa13, hspa14, hyou1, hsp90ab1, and hsp90b1), while 5 genes were downregulated (hsp70, hspa1b, hspa8.2, hsp90aa1, and trap1). Under low salinity stress, 10 genes were upregulated (hspa4, hspa5, hspa8.1, hspa8.2, hspa9, hspa13, hspa14, hyou1, hsp90ab1, and hsp90b1), with 6 genes downregulated (hsp70, hspa1b, hspa4a, hspa4l, hsp90aa1, and trap1). Under ammonia stress, 12 genes were upregulated, with 4 genes downregulated (hspa1b, hspa4a, hspa4l, and hsp90aa1). In the gills, compared to the control group, under ammonia stress, 10 genes were upregulated, while 6 genes were downregulated (hsp70, hspa1b, hspa4l, hspa8.1, hspa8.2, and hsp90ab1). In summary, under high temperature, high salinity, low salinity, and ammonia stress, seven genes were consistently upregulated, namely hspa4, hspa5, hspa9, hspa13, hspa14, hyou1, and hsp90b1, with hspa1b being consistently downregulated.

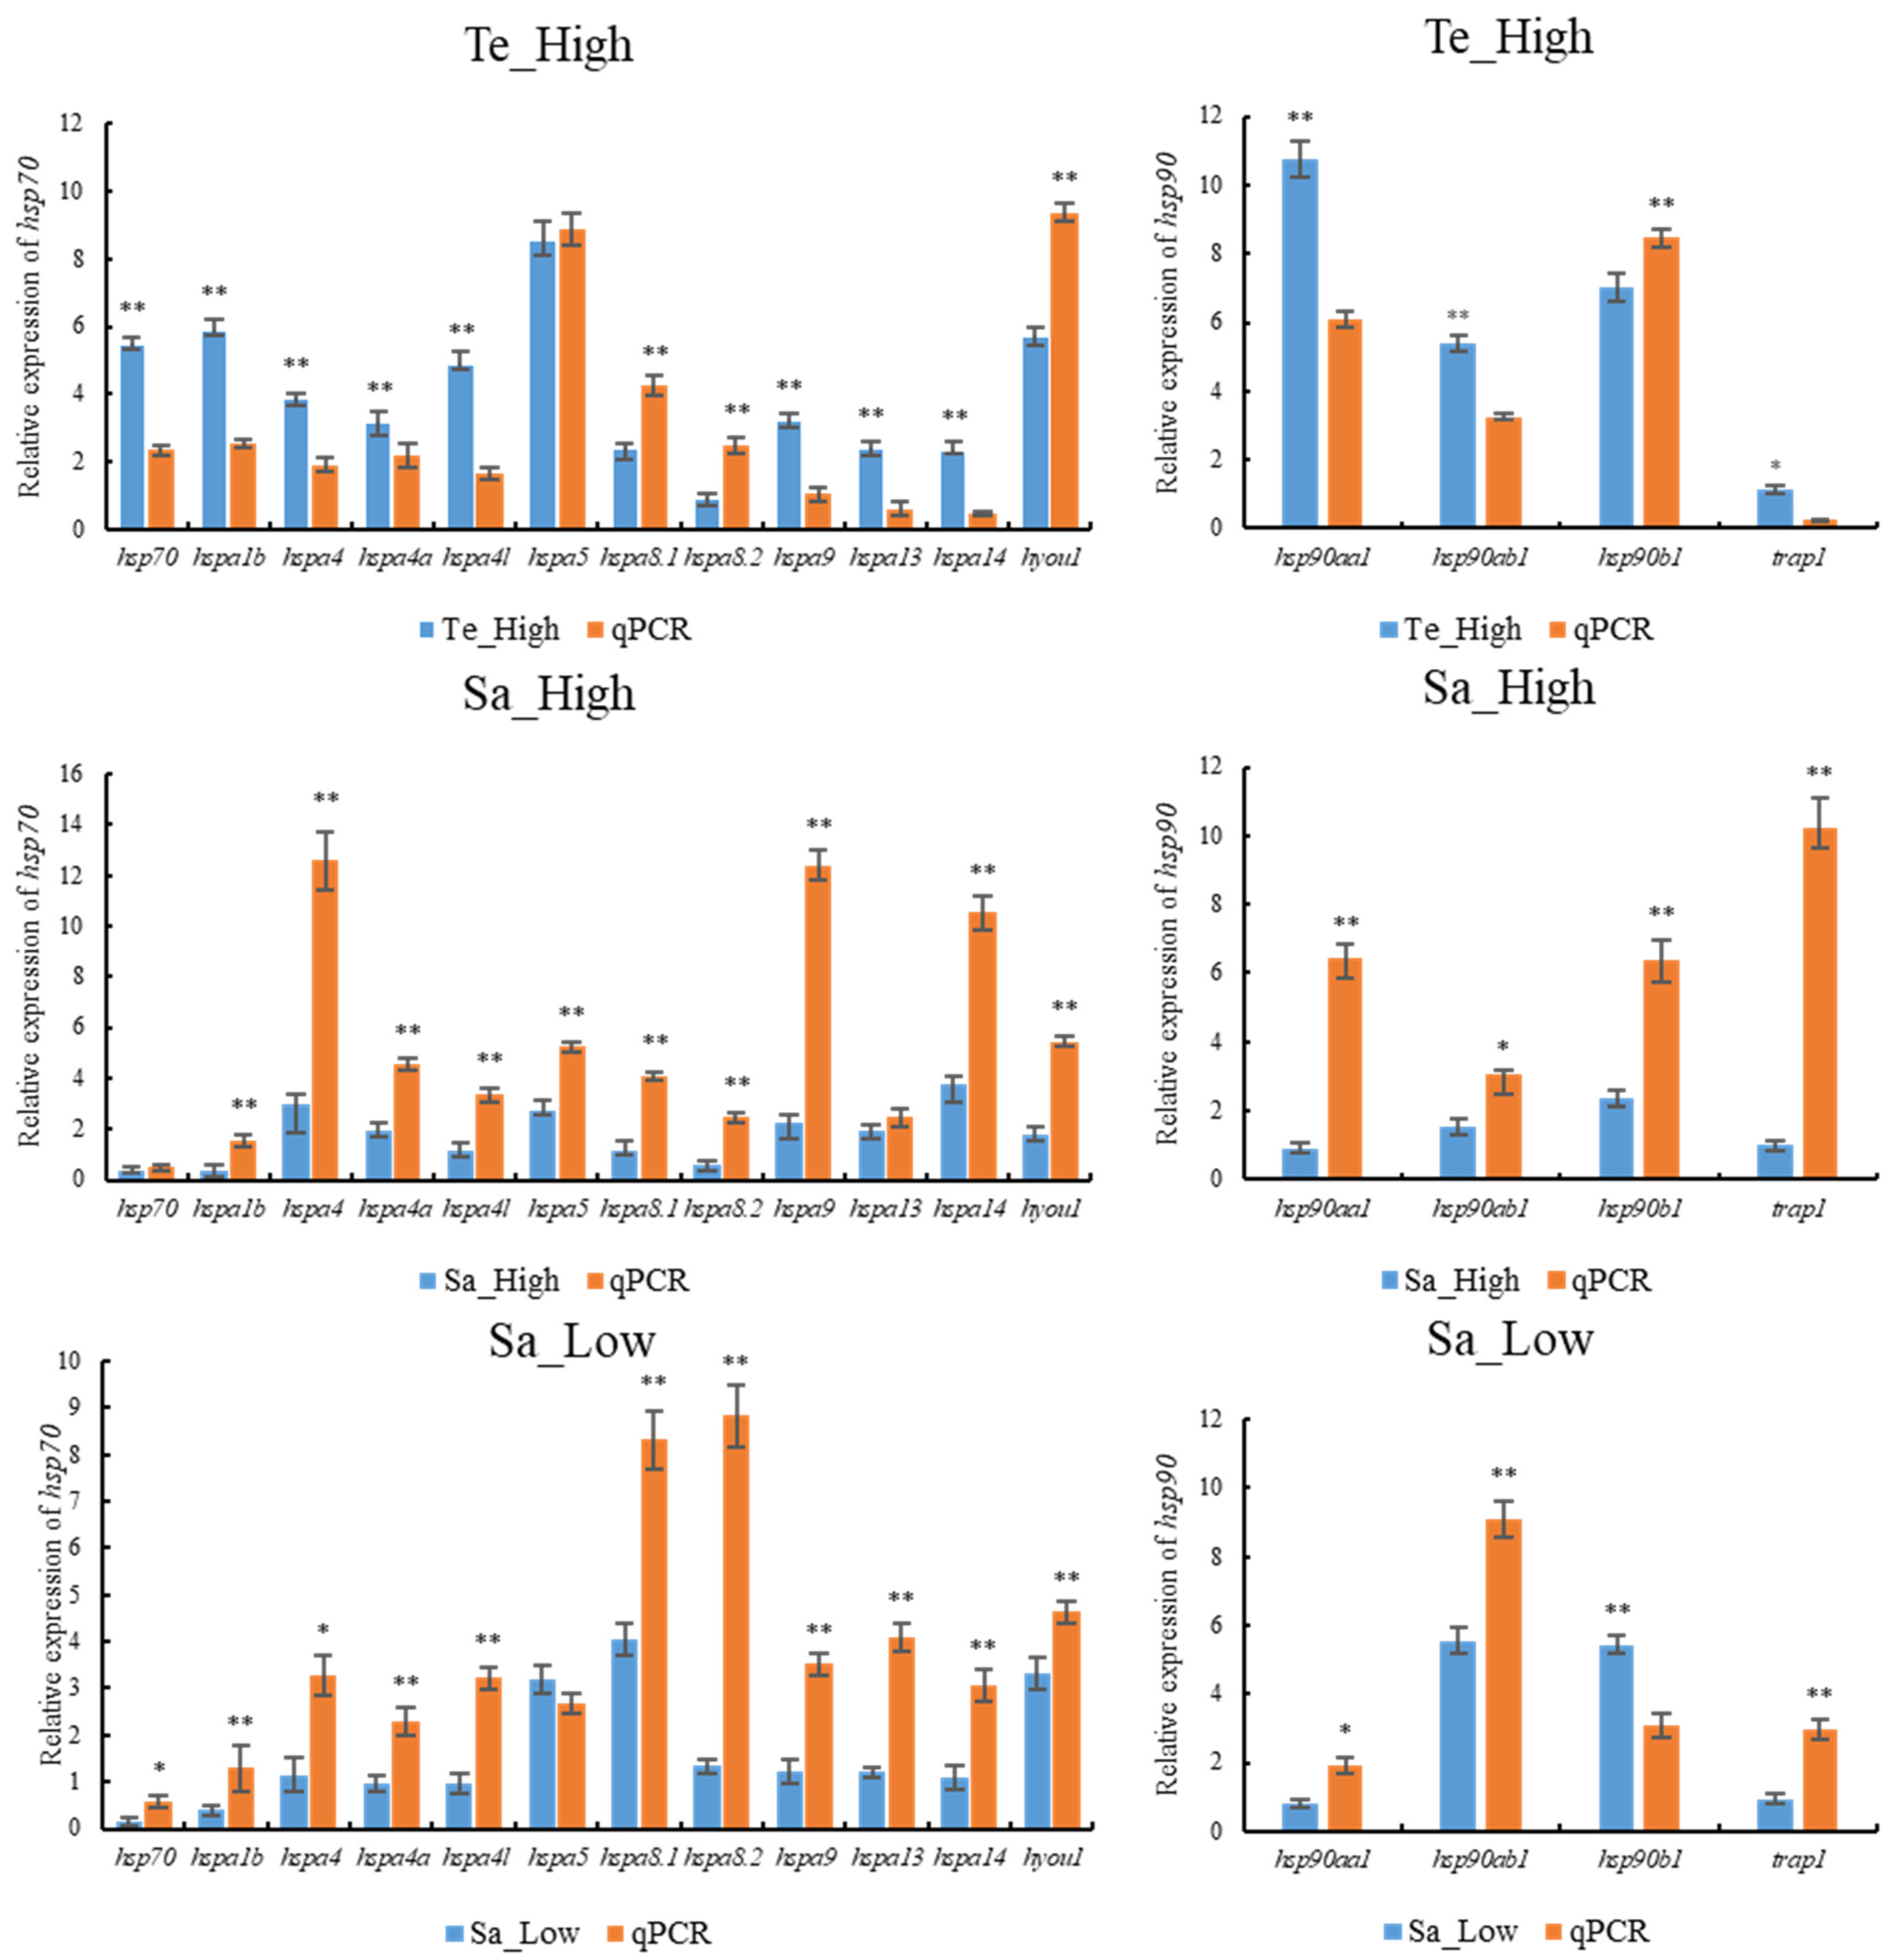
2.10. qPCR Validation of HSP70 and HSP90 Genes Expression Patterns under Abiotic Stresses

To validate the accuracy of the transcriptome results, all 12 HSP70 and 4 HSP90 genes were subjected to qPCR under conditions of high temperature, high salinity, and low salinity stress. As depicted in Figure 12, the qPCR results largely mirrored the trends observed in the RNA-seq data. This concordance indicated the reliability of the transcriptomic data obtained in this study.

3. Discussion

Changes in the external environment can influence the physiological and metabolic activities of fish [8]. At the molecular level, environmental stress can damage proteins, affecting their normal folding. Cellular responses to stress involve specific signaling events and the activation and extensive synthesis of molecular chaperones, many of which are known as heat shock proteins [21]. Heat shock proteins (HSPs) are a highly conserved class of chaperone proteins that can bind to numerous protein molecules, playing multiple physiological roles such as aiding in the correct folding of amino acid chains into their three-dimensional structures, repairing damaged proteins, and degrading misfolded proteins [22]. HSP70 and HSP90 proteins are ubiquitously present in bacteria to mammals, playing crucial roles in maintaining proteostasis, cellular differentiation and development, and protein conformational regulation [23,24,25]. Although recent years have seen increased research on fish HSP70 and HSP90 proteins, a comprehensive genomic identification of the HSP70 and HSP90 gene families in T. septentrionalis has not yet been reported. This study conducted a comprehensive analysis of the HSP70 and HSP90 gene families in T. septentrionalis, providing valuable resources for studying the roles of HSP gene families in stress resistance and fish evolution.
In this study, a total of 12 HSP70 and 4 HSP90 genes were identified in T. septentrionalis. The number of identified HSP70 and HSP90 genes was relatively similar to those found in humans [26] and other teleosts [27,28]. Compared to humans, the gene repertoire lacked hspa1a, hspa1l, hspa2, hspa6, hspa7, hspa12a, hspa12b, and hsph1 genes, among which hspa1l, hspa2, hspa6, hspa7, and hsph1 are also absent in most teleosts. This reflects the high degree of conservation of HSP70 genes throughout the evolution of teleost fish. Moreover, the absence of hspa2, hspa6, and hspa7 genes in teleost fish, but their presence in mammals, suggests these genes likely evolved in higher vertebrates [29,30]. Additionally, except for zebrafish, the hsph1 gene is missing in most teleost genomes, implying a potential loss of the hsph1 gene during evolutionary processes. Similar to most teleosts [10,11], T. septentrionalis exhibits gene duplications within the hspa4 (hspa4, hspa4a, and hspa4l) and hspa8 (hspa8.1 and hspa8.2) genes. The HSP90 gene family members in T. septentrionalis showed no differences compared to other species [10], indicating a high degree of conservation of HSP90 genes in teleost evolution. In summary, despite some variations in the number and members of HSP70 and HSP90 genes among teleost fish, the overall similarity underscores the high degree of conservation of HSP70 and HSP90 genes throughout teleost evolution.
Subcellular localization indicated that (Table 2), among the 12 HSP70 genes, 7 were located in the cytosol, 3 in the endoplasmic reticulum (ER), with the remaining two distributed between the mitochondrion and the nucleus; of the 4 HSP90 genes, 2 were situated in the cytosol, 1 in the ER, and 1 in the mitochondrion. These findings align with subcellular localization results for S. maximus [2] and S. marmoratus [11], where the majority of genes were located in the cytosol, with the rest in the ER, mitochondrion, and nucleus. This suggests a higher functional engagement of HSP genes within the cytosol. Studies have demonstrated the critical role of cytosolic HSP70 genes under stress conditions [31], and the diversity in subcellular localization may correlate with the varied functions of HSP genes [32].
Signal peptide predictions revealed that HSP70′s hspa5 and hyou1 and HSP90′s hsp90b1 proteins possessed signal peptides, indicating their presence in the ER as secretory proteins. The proteins hspa5, hyou1, and hsp90b1, serving as ER chaperones, play crucial roles in the quality control of protein folding and synthesis within the ER [33]. Similar findings in S. maximus studies [2], where hspa5 and hyou1 proteins of the HSP70 gene family also had signal peptides, preliminarily identified as secretory proteins, reflected the high degree of evolutionary conservation within the HSP70 family.
Gene duplication serves as the foundation for gene family expansion, providing the primal material for the formation of new genes and the innovation of gene functions. It plays a crucial role in species evolution [34,35,36], achievable through whole genome duplication (WGD) or small-scale duplication (SSD) [37,38]. In this study, we observed duplicated genes within HSP70, including hspa4 (hspa4, hspa4a, and hspa4l) and hspa8 (hspa8.1 and hspa8.2), while no duplicated genes were identified in HSP90. Chromosomal localization suggested that the duplicated genes hspa4, hspa4a, and hspa4l, as well as hspa8.1 and hspa8.2, were located on different chromosomes, indicating the absence of tandem duplications and suggesting that the amplification of T. septentrionalis HSP70 gene likely occurred after the two rounds of WGD in early vertebrate evolution. However, the hspa8a.1 and hspa8a.2 of S. maximus, located on Chr 2, were identified as tandem duplications, and another hspa8b gene was located on chromosome 11, suggesting SSD events in the evolution of S. maximus posted the two rounds of WGD in early vertebrates [2,39]. Additionally, the Ka/Ks ratios of duplicated gene pairs within T. septentrionalis HSP70 and HSP90 genes were much less than 1, indicating that duplicated genes in T. septentrionalis had undergone strong purifying selection throughout their evolution. Similarly, the Ka/Ks ratios for duplicated gene pairs in S. maximus [2] and S. marmoratus [11] were also less than 1.
Gene structure and motif play crucial roles in the evolution of gene families and provide compelling evidence for their evolutionary trajectories [40]. Motif analysis revealed that the hspa8.2, hspa1b, hsp70, and hspa5 genes shared identical motifs 1~11 as well as motifs 5 and 6, while hspa4 and hspa4l possessed the same motifs 1~4, 6, 7, 9, 10, 11, 15, 16, and 20, with identical types and distributions of motifs. Gene structure diagrams indicated that hspa1b and hsp70 have highly similar gene structure distributions, with variations observed in the structures of other genes. These results, combined with conserved domains and phylogenetic relationships, suggested an exceedingly close kinship between the hspa1b and hsp70 genes. Moreover, all HSP70 genes shared seven motifs (motifs 1, 3, 4, 6, 7, 9, and 11), and all HSP90 genes possessed five motifs (motifs 12, 13, 14, 17, 18). Studies have demonstrated that gene structure and motif patterns were related to the unique biological functions of genes [41,42], indicating that in T. septentrionalis, HSP70 and HSP90 genes not only shared common functions but also possessed their distinct biological roles. This also highlights the high degree of conservation of HSP70 and HSP90 genes throughout the evolution of T. septentrionalis.
The expression profiles of HSP70 and HSP90 genes across different tissues in T. septentrionalis revealed that all 12 HSP70 and 4 HSP90 genes were expressed in seven tissues, indicating the important role HSP70 and HSP90 genes played in the biological activities of T. septentrionalis, being expressed across most organs. The high expression genes across the seven tissues were hspa8.1 (liver, intestine, and spleen), hsp90ab1 (brain, heart, and gills), and hspa8.2 (muscle), suggesting these genes played a broad role in the life activities of T. septentrionalis, with hspa8.1 and hsp90ab1 being the highest expression in these tissues. We speculate that these two genes perform indispensable roles, acting as critical hubs in life activities. Furthermore, studies showed that hspa8 has various cellular functions, mostly through cooperation with chaperones [43], including involvement in protein folding, degradation, and import into organelles. In the liver, the four genes expressed at higher levels were hspa8.1, hsp90ab1, hspa5, and hsp90b1. Given the liver’s role as the primary organ for metabolism and immune defense in fish [44], we speculate the primary functions of these four genes pertain to metabolism or immunity. Furthermore, we observed varying expression patterns of the same genes across different tissues, indicating tissue-specific expression of HSP70 and HSP90 genes. For example, the hspa8.2 gene displays elevated expression levels in muscle tissue, while its expression is notably lower in the heart and spleen, demonstrating a distinct tissue-specific expression profile. Likewise, both zebrafish HSP70 and HSP90 genes during normal development, as well as HSP70 gene expression in turbot under abiotic stress, demonstrated significant tissue-specific expression [2,45]. The expression profiles of HSP70 and HSP90 genes during different developmental stages of T. septentrionalis showed that all 16 HSP70 and HSP90 genes were expressed during eight developmental stages, underlining the universal and crucial role of HSP70 and HSP90 genes in the developmental activities of T. septentrionalis. For example. In zebrafish, the HSP70 and HSP90 genes play roles in promoting cell growth and development, and additionally, they are involved in facilitating cell differentiation [24,45]. The hsp90ab1 gene exhibited the highest expression across all eight developmental stages, and among the top five highly expressed genes (hsp90ab1, hspa8.1, hspa5, hsp90aa1, hsp90b1) during all developmental stages, three were HSP90 genes, highlighting the vital role HSP90 genes played in the developmental activities of T. septentrionalis. Studies have demonstrated [24] that HSP90 genes are involved in fundamental cellular processes and regulatory pathways, such as apoptosis and cell cycle control. Additionally, it was observed that the expression profiles of identical genes vary across different developmental stages, suggesting a developmental stage-specific expression pattern for HSP70 and HSP90 genes. For instance, hsp90b1 displays elevated expression levels in hatch 20-day juveniles compared to the cleavage stage, indicating a pronounced developmental stage-specific expression pattern. Similarly, the HSP70 gene in Paralichthys olivaceus and the HSP90 gene in zebrafish exhibit notable specificity across various developmental stages during normal development [46,47]. The expression profiles of HSP70 and HSP90 genes under abiotic stresses in T. septentrionalis indicated that under the four studied abiotic stresses, most HSP70 and HSP90 genes were upregulated for expression. This suggested that HSP70 and HSP90 genes in T. septentrionalis were broadly involved in environmental stress responses, consistent with studies on Chinese seabass [10]. In the liver, compared to the control group, under high-temperature stress, all genes except hspa8.2 were upregulated; under high salinity stress, 11 genes were upregulated; under low salinity stress, 10 genes were upregulated; and under ammonia stress, 12 genes were upregulated. In the gills, compared to the control group, under ammonia stress, 10 genes were upregulated. In summary, under high temperature, high salinity, low salinity, and ammonia stress, seven genes were consistently upregulated: hspa4, hspa5, hspa9, hspa13, hspa14, hyou1, and hsp90b1, indicating these seven genes were involved in the stress response of T. septentrionalis and played crucial roles in responding to abiotic stress. The qPCR validation experiment demonstrated consistent expression trends for the majority of HSP70 and HSP90 genes with the transcriptomic data, affirming the reliability of our transcriptomic findings and this reaffirms the significant roles of HSP70 and HSP90 in T. septentrionalis’ response to abiotic stresses.

4. Materials and Methods

4.1. Identification and Nomenclature of HSP70 and HSP90 Gene Family Members in T. septentrionalis

To identify the HSP70 and HSP90 gene family members in T. septentrionalis, first, the genome sequences, protein sequences, and annotation files of T. septentrionalis were obtained from our laboratory [15]. Then, to enhance the accuracy of screening gene family members, two methods (BLASTp and HMMER) [48,49] were concurrently employed to query the HSP70 and HSP90 gene family members in T. septentrionalis. Initially, the BLASTp program was used for sequence alignment. Relevant HSP70 and HSP90 protein sequences of H. sapiens, M. musculus, G. gallus, D. rerio, O. latipes, G. aculeatus, L. crocea, O. niloticus, S. salar, I. punctatus, and L. oculatus (Supplementary Material Table S1) published in databases such as NCBI (https://www.ncbi.nlm.nih.gov/, accessed on 10 October 2023), Uniprot (https://www.uniprot.org/, accessed on 10 October 2023), and ENSEMBL (http://ensemblgenomes.org/, accessed on 11 October 2023) were downloaded and used as query sequences. These sequences were aligned against T. septentrionalis HSP70 and HSP90 protein sequences using the TBtools software (version 2.092, Dr. Chengjie Chen, Guangdong, China, accessed on 12 October 2023) with a BLASTp comparison (E-value ≤ e−5). Secondly, the HMMER method was applied for alignment. Hidden Markov models (hmm) of HSP70 (PF00012) and HSP90 (PF00183) genes were downloaded from the Pfam protein database (http://pfam-legacy.xfam.org/, accessed on 13 October 2023) [50], and T. septentrionalis protein sequences were searched against these hmms using HMM search in TBtools software (version 2.092, Dr. Chengjie Chen, Guangdong, China, accessed on 13 October 2023). The intersection of BLASTp and HMMER results yielded candidate gene IDs as the initial identification results for HSP70 and HSP90 gene family members. Next, the target sequences of candidate genes were extracted from T. septentrionalis protein sequences using TBtools software (version 2.092, Dr. Chengjie Chen, Guangdong, China, accessed on 15 October 2023). Additionally, to further validate the accuracy of the results, the identified gene family members were verified using the search function on the online website HMMER (https://www.ebi.ac.uk/Tools/hmmer/search/, accessed on 15 October 2023) [49]. The HSP70 and HSP90 gene family members in T. septentrionalis were named following the nomenclature conventions for teleost fish.

4.2. Physicochemical Property Analysis and Phylogenetic Analysis

The molecular characteristics of HSP70 and HSP90 genes, such as molecular weight, isoelectric point, instability index, aliphatic index, and average hydrophilicity, were predicted using the ProtParam tool on the ExPASy website (https://www.expasy.org/, accessed on 16 October 2023) [51].
To elucidate the phylogenetic relationships of the HSP70 and HSP90 gene families across different species, including T. septentrionalis, teleosts, and mammals, a phylogenetic tree was constructed using the protein sequences of HSP70 and HSP90 from these groups. All protein sequences required for constructing the evolutionary tree from other species are provided in Supplementary Material Table S3. The Clustal W function within MEGA 11 software [52] was used to perform multiple sequence alignments of the HSP70 and HSP90 protein sequences and those identified in the aforementioned species. The phylogenetic trees were built based on the Neighbor-joining (NJ) method, with bootstrap testing repeated 1000 times and other parameters set to default values. The phylogenetic trees were further optimized and displayed using the online website iTOL (https://itol.embl.de/upload.cgi, accessed on 17 October 2023) [53].

4.3. Gene Structure, Chromosome Distribution Analysis, Motif, and Conserved Domain Analysis

To analyze the gene structure of HSP70 and HSP90 in T. septentrionalis, the genome annotation file of T. septentrionalis was utilized, and TBtools software (version 2.092, Dr. Chengjie Chen, Guangdong, China, accessed on 18 October 2023) was employed to construct gene structure diagrams for HSP70 and HSP90, followed by creating a composite illustration combining gene structure with phylogenetic relationships. Based on the annotation information from the T. septentrionalis’s genome, TBtools was also used to draw the chromosomal distribution maps of HSP70 and HSP90 genes, with modifications for gene density on the chromosomal localization diagrams. The MEME Suite online website (https://meme-suite.org/meme/tools/meme, accessed on 18 October 2023) [54] was used to predict and analyze conserved motifs within the protein sequences of T. septentrionalis’s HSP70 and HSP90, setting the number of motifs to 20, with other parameters at their default settings. The Batch CD-Search program on the NCBI website was utilized for conserved domain searches within the HSP70 and HSP90 protein sequences. MEGA11 software (version 11, Mega Limited, Auckland, New Zealand, accessed on 19 October 2023) was used to construct the phylogenetic relationships of T. septentrionalis’s HSP70 and HSP90 genes, and TBtools software (version 2.092, Dr. Chengjie Chen, Guangdong, China, accessed on 19 October 2023) was used to draw a composite illustration depicting motifs, conserved domains, and phylogenetic relationships.

4.4. Protein Structure and Subcellular Localization

The secondary structure of HSP70 and HSP90 proteins was predicted using the online website SOPMA (https://npsa-prabi.ibcp.fr/cgi-bin/npsa_automat.pl?page=/NPSA/npsa_sopma.html, accessed on 21 October 2023) [55]. The tertiary structures of HSP70 and HSP90 proteins were forecasted using the online website SWISS-MODEL (https://swissmodel.expasy.org/, accessed on 22 October 2023) [56], and the quality of the obtained models was assessed using SAVES v.6.0 (https://saves.mbi.ucla.edu/, accessed on 22 October 2023). Subcellular localization of HSP70 and HSP90 genes was performed using the WoLF PSORT website (https://psort.hgc.jp/form2.html, accessed on 22 October 2023) [57].

4.5. Signal Peptides Prediction, Transmembrane Structural Domain Prediction and Selection Test of Duplicated HSP70 and HSP90 Genes

Signal peptides of HSP70 and HSP90 proteins were predicted using the online website SignalP 5.0 (https://services.healthtech.dtu.dk/services/SignalP-5.0/, accessed on 23 October 2023). Transmembrane domains of HSP70 and HSP90 proteins were forecasted using the online website TMHMM 2.0 (https://services.healthtech.dtu.dk/services/TMHMM-2.0/, accessed on 23 October 2023). The Simple Ka/Ks Calculator function of TBtools software (version 2.092, Dr. Chengjie Chen, Guangdong, China) was utilized to calculate the nonsynonymous (Ka), synonymous (Ks), and Ka/Ks ratio for duplicated pairs of HSP70 and HSP90 genes.

4.6. Expression Profiles of HSP70 and HSP90 Genes in Tissues of T. septentrionalis

The specimens of T. septentrionalis for this study were all sourced from Tianyuan Aquatics Co., Ltd., Yantai City, Shandong Province, China.
One-year-old T. septentrionalises were selected for tissue sampling, which included seven types of tissues: heart, brain, liver, spleen, gills, intestine, and muscle. The seawater temperature for culturing T. septentrionalis was maintained at 20~22 °C. Five one-year-old T. septentrionalis were randomly sampled and anesthetized with 50 mg/L MS-222. The entire sampling process was conducted on an ice tray within a sterile operating bench. After dissection, the relevant tissues were rapidly rinsed with 0.9% saline solution, placed into 2 mL cryovials, and immediately stored in liquid nitrogen before being transferred to a −80 °C ultra-low temperature freezer for subsequent RNA-seq transcriptome analysis. The transcriptome library and analysis process are as follows: First, RNA was extracted from tissues using standard extraction methods, and then RNA integrity was evaluated using the RNA Nano 6000 Assay Kit with the Bioanalyzer 2100 system (Agilent Technologies, Santa Clara, CA, USA). Second, library construction was performed using the NEB standard library preparation method. Third, sequencing was carried out on the Illumina Novaseq platform. Fourth, raw sequencing data underwent quality control. Fifth, Clean Reads were aligned to the reference genome using HISAT2 software (version 2.1.0, CCB at JHU, Baltimore, MD, USA) to obtain the positional information of Reads on the reference genome. Additionally, FPKM, which represents the number of Fragments mapped to a gene, divided by the total length of gene exons and then divided by the total length of all genes, was calculated. RNA quality validation charts have been presented in Supplementary Material Table S5.
In the transcriptome result files of seven tissues from T. septentrionalis, the FPKM values for HSP70 and HSP90 gene expressions were retrieved and transformed using log2 (FPKM + 1). TBtools software (version 2.092, Dr. Chengjie Chen, Guangdong, China) was utilized to create a heatmap to study the expression profiles of HSP70 and HSP90 Genes across different tissues in T. septentrionalis.

4.7. Expression Profiles of HSP70 and HSP90 Genes during Different Developmental Stages of T. septentrionalis

Broodstock in gonadal development stage IV or above was selected for spawning, and eggs were collected for microscopic examination and sampling. The developmental staging of T. septentrionalis referred to the study by Guan et al. [58], including the cleavage stage, blastula stage, gastrula stage, neuroembryonic stage, tail bud stage, and muscle effect stage. After filtration through a 60-mesh sieve [59], 30 eggs were collected, and 15 specimens were taken for both newly hatched larvae (Dph0) and 20-day-old juveniles (Dph20). All samples were quickly placed into 2 mL cryovials and then stored in liquid nitrogen before being transferred to a −80 °C ultra-low freezer for subsequent RNA-seq transcriptome analysis.
In the transcriptome result files of T. septentrionalis across different developmental stages, FPKM values for the expression of HSP70 and HSP90 genes were retrieved and transformed using log2 (FPKM + 1). TBtools software (version 2.092, Dr. Chengjie Chen, Guangdong, China) was utilized to create a heatmap to investigate the expression profiles of HSP70 and HSP90 Genes during various developmental stages of T. septentrionalis.

4.8. Expression Profiles of HSP70 and HSP90 Genes under Abiotic Stresses

The abiotic stress experiments included high temperature, high salinity, low salinity, and ammonia nitrogen stress, with the subjects being healthy and vigorous T. septentrionalis adults of similar size (body length 20 ± 0.5 cm, body weight 120 ± 0.5 g). Initially, one high-temperature group (temperature 30 °C), one high-salinity group (40‰), one low-salinity group (15‰), one ammonia nitrogen group (10.60 mg/L), and one blank control group (ambient seawater salinity 30‰, temperature 20 °C, ammonia concentration 0 mg/L) were set up. Subsequently, in the high-temperature and ammonia experiments, subjects acclimated for one week were directly placed into the experimental groups corresponding to the designed stress environments. For the high-salinity and low-salinity experiments, subjects acclimated for one week and were gradually adjusted to the stress environments corresponding to the experimental design, undergoing a 24 h stress culture experiment. During the experiment, feed was administered twice daily at 08:00 and 17:00, with leftover feed removed after feeding. Daily bottom suction and water changes were conducted, along with continuous aeration. Each experimental group had three replicates, with each replicate containing 10 fish.
All samples were collected at the 24th hour of the stress experiment. For the high temperature, high salinity, and low salinity stress experiments, the liver of T. septentrionalis was sampled, while for the ammonia nitrogen stress experiment, both the liver and gills were sampled. In each group, three experimental fish were randomly selected and anesthetized with 50 mg/L MS-222. The entire sampling process was conducted on an ice tray within a sterile operating bench. After dissection, the relevant tissues were quickly rinsed with 0.9% saline solution, placed into 2 mL cryovials, and immediately stored in liquid nitrogen before being transferred to a −80 °C ultra-low freezer for subsequent transcriptome analysis.
FPKM values for the expression of HSP70 and HSP90 genes under abiotic stress were retrieved from the transcriptome result files and transformed using log10 (FPKM + 1). TBtools software (version 2.092, Dr. Chengjie Chen, Guangdong, China) was utilized to create a heatmap to investigate the expression profiles of HSP70 and HSP90 Genes under different environmental stresses. The heatmap data for different tissues, developmental stages, and abiotic stresses are provided in Supplementary Material Table S6.

4.9. Quantitative Real-Time PCR (qPCR)

To further validate the expression levels of HSP70 and HSP90 genes in T. septentrionalis under environmental stress, qPCR was performed. Total RNA from the liver of T. septentrionalis subjected to environmental stress was extracted using the TIANGEN Total RNA Extraction Kit, following the manufacturer’s instructions. The concentration and quality of the extracted total RNA were assessed using a NanoDrop spectrophotometer and agarose gel electrophoresis, respectively. cDNA was synthesized using the HiScript III RT SuperMix for qPCR (+gDNA wiper) (Vazyme) kit. Primers for the HSP70 and HSP90 genes and the internal reference gene β-actin were designed using the Primer-BLAST program on the NCBI website, with all primer sequences provided in Supplementary Material Table S7. qRT-PCR was conducted using the ChamQ SYBR Color qPCR Master Mix (Vazyme) to detect the expression of HSP70 and HSP90 genes in T. septentrionalis in response to different environmental stresses. The 20 μL reaction system included 10 μL of 2 × ChamQ SYBR Color qPCR Master Mix, 0.4 μL of forward primer, 0.4 μL of reverse primer, 0.4 μL of 50 × ROX Reference Dye 1, 2 μL of template, and 6.8 μL of ddH2O. The PCR program was as follows: pre-denaturation at 95 °C for 30 s; 40 cycles of denaturation at 95 °C for 10 s and annealing at 60 °C for 30 s, followed by a melting curve analysis: 95 °C for 15 s, 60 °C for 60 s, 95 °C for 15 s. The relative expression levels of the HSP70 and HSP90 genes were calculated using the 2−ΔΔCT method [60]. Statistical analysis of the relative mRNA expression level between transcriptomic data and qPCR data was performed using Student’s t-test with SPSS 26.0 (v26) software, and the differences were considered significant when the p value < 0.05 (*) and extremely significant when the p value < 0.01 (**).

5. Conclusions

In this study, we identified 12 HSP70 genes (hsp70, hspa1b, hspa4, hspa4a, hspa4l, hspa5, hspa8.1, hspa8.2, hspa9, hspa13, hspa14, and hyou1) and 4 HSP90 genes (hsp90aa1, hsp90ab1, hsp90b1, and trap1) in T. septentrionalis. This study employed bioinformatics methods to conduct a series of analyses of the HSP70 and HSP90 gene families in T. septentrionalis, encompassing phylogenetic analysis, motif analysis, conserved domain analysis, and chromosomal localization. Additionally, a thorough investigation of HSP70 and HSP90 gene expression profiles was conducted across different tissues, developmental stages, and under various abiotic stress conditions in T. septentrionalis, elucidating their roles in normal growth and development processes as well as their responses to abiotic stress. To further validate the accuracy of the transcriptome results, qPCR analysis was performed on the HSP70 and HSP90 genes under three abiotic stress conditions. This research provides fundamental insights into the molecular regulatory mechanisms of the HSP70 and HSP90 gene families in T. septentrionalis under environmental stresses. The identified genes can serve as reference markers for detecting environmental stress in organisms, thereby facilitating the optimization of aquaculture techniques for T. septentrionalis. Building on these findings, future research endeavors will include additional experimental components, such as cellular localization studies, to further explore the functional roles of HSP gene families and validate the in silico data obtained in this study.

Supplementary Materials

The following supporting information can be downloaded at https://www.mdpi.com/article/10.3390/ijms25115706/s1.

Author Contributions

Conceptualization, Q.C.; methodology, Q.F.; software, Y.C.; validation, L.B.; Data curation, Z.Z. and D.W.: writing—original draft preparation, Y.C.; writing—review and editing, S.C. and L.B.; funding acquisition, S.C. All authors have read and agreed to the published version of the manuscript.

Funding

This research was funded by the Fund of Central Public-interest Scientific Institution Basal Research Fund, YSFRI, CAFS (NO. 20603022022014), Shandong Key R&D Program (For Academician team in Shandong) (2023ZLYS02) and Yantai Science and Technology Innovation Development Project (2022XCZX078), Fujian Public-interest Competitive Project (2023R1082).

Institutional Review Board Statement

All of the animal experiments in this study were approved by the Animal Care and Use Committee of the Yellow Sea Fisheries Research Institute, Chinese Academy of Fishery Sciences (IACUC-2023-08).

Informed Consent Statement

Not applicable.

Data Availability Statement

The datasets analyzed for this study can be found in NCBI: https://www.ncbi.nlm.nih.gov/ (accessed on 21 May 2024). The accession numbers can be found below: SRR27393461~SRR27393490 and SRR28205501~SRR28205545.

Acknowledgments

We appreciate the help from Tianyuan Fisheries Co., Ltd. (Qingdao, China) who provided the test subject, Thamnaconus septentrionalis.

Conflicts of Interest

The authors declare that they have no conflicts of interest.

References

  1. Eid, I.I.; Bhassu, S.; Goh, Z.H.; Khoo, L.T.; Tan, G.Y.A. Molecular characterization and gene evolution of the heat shock protein 70 gene in snakehead fish with different tolerances to temperature. Biochem. Syst. Ecol. 2016, 66, 137–144. [Google Scholar] [CrossRef]
  2. Zheng, W.; Xu, X.; Chen, Y.; Wang, J.; Zhang, T.; Zechen, E.; Chen, S.; Liu, Y. Genome-Wide Identification, Molecular Characterization, and Involvement in Response to Abiotic and Biotic Stresses of the HSP70 Gene Family in Turbot (Scophthalmus maximus). Int. J. Mol. Sci. 2023, 24, 6025. [Google Scholar] [CrossRef] [PubMed]
  3. Molina, A.; Biemar, F.; Müller, F.; Iyengar, A.; Prunet, P.; Maclean, N.; Martial, J.A.; Muller, M. Cloning and expression analysis of an inducible HSP70 gene from tilapia fish. FEBS Lett. 2000, 474, 5–10. [Google Scholar] [CrossRef] [PubMed]
  4. Kampinga, H.; Hageman, J.; Vos, M.; Kubota, H.; Tanguay, R.; Bruford, E.; Cheetham, M.; Chen, B.; Hightower, L. Guidelines for the nomenclature of the human heat shock proteins. Cell Stress Chaperones 2009, 14, 105–111. [Google Scholar] [CrossRef] [PubMed]
  5. Genest, O.; Wickner, S.; Doyle, S. Hsp90 and Hsp70 chaperones: Collaborators in protein remodeling. J. Biol. Chem. 2019, 294, 2109–2120. [Google Scholar] [CrossRef] [PubMed]
  6. Gupta, A.; Bansal, A.; Hashimoto-Torii, K. HSP70 and HSP90 in neurodegenerative diseases. Neurosci. Lett. 2020, 716, 134678. [Google Scholar] [CrossRef] [PubMed]
  7. Hangzo, H.; Banerjee, B.; Saha, S.; Saha, N. Ammonia stress under high environmental ammonia induces Hsp70 and Hsp90 in the mud eel, Monopterus Cuchia. Fish Physiol. Biochem. 2017, 43, 77–88. [Google Scholar] [CrossRef] [PubMed]
  8. Padmini, E. Physiological adaptations of stressed fish to polluted environments: Role of heat shock proteins. Rev. Environ. Contam. Toxicol. 2010, 206, 1–27. [Google Scholar] [PubMed]
  9. Ma, F.; Luo, L.; Wang, Q. Hsp60/10 and sHsp families of heat shock protein genes in rainbow trout (Oncorhynchus mykiss) and their expression under heat stress. Aquac. Int. 2022, 30, 1–18. [Google Scholar] [CrossRef]
  10. Sun, Y.; Wen, H.; Tian, Y.; Mao, X.; Li, X.; Li, J.; Hu, Y.; Liu, Y.; Li, J.; Li, Y. HSP90 and HSP70 Families in Lateolabrax maculatus: Genome-Wide Identification, Molecular Characterization, and Expression Profiles in Response to Various Environmental Stressors. Front. Physiol. 2021, 12, 784803. [Google Scholar] [CrossRef] [PubMed]
  11. Han, X.; Jin, S.; Shou, C.; Han, Z. Hsp70 Gene Family in Sebastiscus marmoratus: The Genome-Wide Identification and Transcriptome Analysis under Thermal Stress. Genes 2023, 14, 1779. [Google Scholar] [CrossRef] [PubMed]
  12. Deng, Z.; Sun, S.; Gao, T.; Han, Z. The Hsp70 Gene Family in Boleophthalmus pectinirostris: Genome-Wide Identification and Expression Analysis under High Ammonia Stress. Animals 2019, 9, 36. [Google Scholar] [CrossRef]
  13. Umam, K.; Tang, C.-H.; Lee, T.-H. The roles of heat shock protein 70 (HSP70) and heat shock protein 90 (HSP90) in osmoregulatory and metabolic tissues of milkfish Chanos chanos under osmotic stress. Sci. Bus. Exch. 2013, 6, 1058. [Google Scholar]
  14. Shi, Q.; Yu, C.; Zhu, D.; Li, S.; Wen, X. Effects of dietary Sargassum horneri on resisting hypoxia stress, which changes blood biochemistry, antioxidant status, and hepatic HSP mRNA expressions of juvenile black sea bream Acanthopagrus schlegelii. J. Appl. Phycol. 2020, 32, 3457–3466. [Google Scholar] [CrossRef]
  15. Bian, L.; Li, F.; Ge, J.; Wang, P.; Chang, Q.; Zhang, S.; Li, J.; Liu, C.; Liu, K.; Liu, X.; et al. Chromosome-level genome assembly of the greenfin horse-faced filefish (Thamnaconus septentrionalis) using Oxford Nanopore PromethION sequencing and Hi-C technology. Mol. Ecol. Resour. 2020, 20, 1069–1079. [Google Scholar] [CrossRef] [PubMed]
  16. Kang, K.; Kho, K.; Chen, Z.; Kim, J.; Kim, Y.; Zhang, Z. Cryopreservation of filefish (Thamnaconus septentrionalis Gunther, 1877) sperm. Aquac. Res. 2004, 35, 1429–1433. [Google Scholar] [CrossRef]
  17. Zhan, B.; Lou, D.; Zhong, J. Evaluation of Thamnaconus septentrionalis Resources and their Rational Utilization. Aquac. Fish. 1986, 4, 409–418. (In Chinese) [Google Scholar]
  18. Li, G.; Wang, Q.; Zhang, K. Artificial breeding technology of Thamnaconus septentrionalis. China Fish. 2021, 552, 82–84. (In Chinese) [Google Scholar]
  19. Xue, M. Early Development and Growth of Thamnaconus septentrionali; Shanghai Ocean University: Shanghai, China. (In Chinese)
  20. Chen, C.; Chen, H.; Zhang, Y.; Thomas, H.; Frank, M.; He, Y.; Xia, R. TBtools: An Integrative Toolkit Developed for Interactive Analyses of Big Biological Data. Mol. Plant 2020, 13, 1194–1202. [Google Scholar] [CrossRef]
  21. Szalay, M.; Kovács, I.; Korcsmáros, T.; Böde, C.; Csermely, P. Stress-induced rearrangements of cellular networks: Consequences for protection and drug design. FEBS Lett. 2007, 581, 3675–3680. [Google Scholar] [CrossRef] [PubMed]
  22. Hu, C.; Yang, J.; QI, Z.; Wu, H.; Wang, B.; Zou, F.; Mei, H.; Liu, J.; Wang, W.; Liu, Q. Heat shock proteins: Biological functions, pathological roles, and therapeutic opportunities. MedComm 2022, 3, e161. [Google Scholar] [CrossRef] [PubMed]
  23. Rosenzweig, R.; Nillegoda, N.; Mayer, M.; Bukau, B. The Hsp70 chaperone network. Nat. Rev. Mol. Cell Biol. 2019, 20, 665–680. [Google Scholar] [CrossRef] [PubMed]
  24. Hoter, A.; El-Sabban, M.; Naim, H. The HSP90 Family: Structure, Regulation, Function, and Implications in Health and Disease. Int. J. Mol. Sci. 2018, 19, 2560. [Google Scholar] [CrossRef] [PubMed]
  25. Hernández, M.; Sullivan, W.; Toft, D. The assembly and intermolecular properties of the hsp70-Hop-hsp90 molecular chaperone complex. J. Biol. Chem. 2002, 277, 38294–38304. [Google Scholar] [CrossRef] [PubMed]
  26. Brocchieri, L.; De Macario, E.; Macario, A. hsp70 genes in the human genome: Conservation and differentiation patterns predict a wide array of overlapping and specialized functions. Bmc Evol. Biol. 2008, 8, 19. [Google Scholar] [CrossRef] [PubMed]
  27. Song, L.; Li, C.; Xie, Y.; Liu, S.; Zhang, J.; Yao, J.; Jiang, C.; Li, Y.; Liu, Z. Genome-wide identification of Hsp70 genes in channel catfish and their regulated expression after bacterial infection. Fish Shellfish Immunol. 2016, 49, 154–162. [Google Scholar] [CrossRef] [PubMed]
  28. Xu, K.; Xu, H.; Han, Z. Genome-Wide Identification of Hsp70 Genes in the Large Yellow Croaker (Larimichthys crocea) and Their Regulated Expression Under Cold and Heat Stress. Genes 2018, 9, 590. [Google Scholar] [CrossRef]
  29. Elicker, K.; Hutson, L. Genome-wide analysis and expression profiling of the small heat shock proteins in zebrafish. Gene 2007, 403, 60–69. [Google Scholar] [CrossRef] [PubMed]
  30. Franck, E.; Madsen, O.; Van Rheede, T.; Ricard, G.; Huynen, M.; de Jong, W. Evolutionary diversity of vertebrate small heat shock proteins. J. Mol. Evol. 2004, 59, 792–805. [Google Scholar] [CrossRef] [PubMed]
  31. Jung, K.; Gho, H.; Nguyen, M.; Kim, S.; An, G. Genome-wide expression analysis of HSP70 family genes in rice and identification of a cytosolic HSP70 gene highly induced under heat stress. Funct. Integr. Genom. 2013, 13, 391–402. [Google Scholar] [CrossRef]
  32. Wang, X.; Komatsu, S. Plant subcellular proteomics: Application for exploring optimal cell function in soybean. J. Proteom. 2016, 143, 45–56. [Google Scholar] [CrossRef] [PubMed]
  33. Adams, B.; Canniff, N.; Guay, K.; Hebert, D. The Role of Endoplasmic Reticulum Chaperones in Protein Folding and Quality Control. Prog. Mol. Subcell. Biol. 2021, 59, 27–50. [Google Scholar] [PubMed]
  34. Moore, R.; Purugganan, M. The early stages of duplicate gene evolution. Proc. Natl. Acad. Sci. USA 2003, 100, 15682–15687. [Google Scholar] [CrossRef] [PubMed]
  35. Kulmuni, J.; Wurm, Y.; Pamilo, P. Comparative genomics of chemosensory protein genes reveals rapid evolution and positive selection in ant-specific duplicates. Heredity 2013, 110, 538–547. [Google Scholar] [CrossRef] [PubMed]
  36. Conant, G.; Wolfe, K. Turning a hobby into a job: How duplicated genes find new functions. Nat. Rev. Genet. 2008, 9, 938–950. [Google Scholar] [CrossRef] [PubMed]
  37. Voldoire, E.; Brunet, F.; Naville, M.; Volff, J.; Galiana, D. Expansion by whole genome duplication and evolution of the Sox gene family in teleost fish. PLoS ONE 2017, 12, e0180936. [Google Scholar] [CrossRef] [PubMed]
  38. Li, M.; Ding, N.; Lu, T.; Zhao, J.; Wang, Z.; Jiang, P.; Liu, S.; Wang, X.; Liu, B.; Li, L. Evolutionary Contribution of Duplicated Genes to Genome Evolution in the Ginseng Species Complex. Genome Biol. Evol. 2021, 13, evab051. [Google Scholar] [CrossRef] [PubMed]
  39. Holub, E. The arms race is ancient history in Arabidopsis, the wildflower. Nat. Rev. Genet. 2001, 2, 516–527. [Google Scholar] [CrossRef] [PubMed]
  40. Wang, J.; Pan, C.; Wang, Y.; Ye, L.; Wu, J.; Chen, L.; Zou, T.; Lu, G. Genome-wide identification of MAPK, MAPKK, and MAPKKK gene families and transcriptional profiling analysis during development and stress response in cucumber. Bmc Genom. 2015, 16, 386. [Google Scholar] [CrossRef] [PubMed]
  41. Huang, X.; Li, S.; Gao, Y.; Zhan, A. Genome-Wide Identification, Characterization and Expression Analyses of Heat Shock Protein-Related Genes in a Highly Invasive Ascidian Ciona savignyi. Front. Physiol. 2018, 9, 1043. [Google Scholar] [CrossRef] [PubMed]
  42. Zhang, J.; Li, J.; Liu, B.; Zhang, L.; Chen, J.; Lu, M. Genome-wide analysis of the Populus Hsp90 gene family reveals differential expression patterns, localization, and heat stress responses. Bmc Genom. 2013, 14, 532. [Google Scholar] [CrossRef]
  43. Stricher, F.; Macri, C.; Ruff, M.; Muller, S. HSPA8/HSC70 chaperone protein Structure, function, and chemical targeting. Autophagy 2013, 9, 1937–1954. [Google Scholar] [CrossRef]
  44. Yang, Y.; Han, T.; Xiao, J.; Li, X.; Wang, J. Transcriptome analysis reveals carbohydrate-mediated liver immune responses in Epinephelus akaara. Sci. Rep. 2018, 8, 639. [Google Scholar] [CrossRef]
  45. Krone, P.; Evans, T.; Lechinger, S. Heat shock gene expression and function during zebrafish embryogenesis. Semin. Cell Dev. Biol. 2003, 14, 267–274. [Google Scholar] [CrossRef]
  46. Liu, K.; Hao, X.; Wang, Q.; Hou, J.; Lai, X.; Dong, Z.; Shao, C. Genome-wide identification and characterization of heat shock protein family 70 provides insight into its divergent functions on immune response and development of Paralichthys olivaceus. Peerj 2019, 7, e7781. [Google Scholar] [CrossRef]
  47. Xiao, H.; Wang, H.; He, Q.; Zhou, J.; Du, S. Gene expression and functional analysis of Aha1a and Aha1b in stress response in zebrafish. Comp. Biochem. Physiol. B-BioChemistry Mol. Biol. 2022, 262, 110777. [Google Scholar] [CrossRef]
  48. Marchin, M.; Kelly, P.; Fang, J. Tracker: Continuous HMMER and BLAST searching. Bioinformatics 2005, 21, 388–389. [Google Scholar] [CrossRef]
  49. Yu, D.; Lee, D.; Kim, S.; Lee, C.; Song, J.; Kong, E.; Kim, J. Algorithm for Predicting Functionally Equivalent Proteins from BLAST and HMMER Searches. J. Microbiol. Biotechnol. 2012, 22, 1054–1058. [Google Scholar] [CrossRef]
  50. Bateman, A.; Birney, E.; Durbin, R.; Finn, R.; Hollich, V.; Griffiths-Jones, S.; Khanna, A.; Marshall, M.; Moxon, S.; Sonnhammer, E.; et al. The Pfam protein families database. Nucleic Acids Res. 2000, 28, 263–266. [Google Scholar] [CrossRef]
  51. Gasteiger, E.; Gattiker, A.; Hoogland, C.; Ivanyi, I.; Appel, R.; Bairoch, A. ExPASy: The proteomics server for in-depth protein knowledge and analysis. Nucleic Acids Res. 2003, 31, 3784–3788. [Google Scholar] [CrossRef]
  52. Tamura, K.; Stecher, G.; Kumar, S. MEGA11 Molecular Evolutionary Genetics Analysis Version 11. Mol. Biol. Evol. 2021, 38, 3022–3027. [Google Scholar] [CrossRef]
  53. Letunic, I.; Bork, P. Interactive Tree of Life (iTOL): An online tool for phylogenetic tree display and annotation. Bioinformatics 2007, 23, 127–128. [Google Scholar] [CrossRef]
  54. Bailey, T.; Johnson, J.; Grant, C.; Noble, W. The MEME Suite. Nucleic Acids Res. 2015, 43, W39–W49. [Google Scholar] [CrossRef]
  55. Geourjon, C.; Deleage, G. SOPMA: Significant improvements in protein secondary structure prediction by consensus prediction from multiple alignments. Comput. Appl. Biosci. 1995, 11, 681–684. [Google Scholar] [CrossRef]
  56. Biasini, M.; Bienert, S.; Waterhouse, A.; Arnold, K.; Studer, G.; Schmidt, T.; Kiefer, F.; Gallo Cassarino, T.; Bertoni, M.; Bordoli, L.; et al. SWISS-MODEL: Modelling protein tertiary and quaternary structure using evolutionary information. Nucleic Acids Res. 2014, 42, W252–W258. [Google Scholar] [CrossRef]
  57. Horton, P.; Park, K.; Obayashi, T.; Fujita, N.; Harada, H.; Adams-Collier, C.; Nakai, K. WoLF PSORT: Protein localization predictor. Nucleic Acids Res. 2007, 35, W585–W587. [Google Scholar] [CrossRef]
  58. Guan, J.; Chen, Z.; Zhang, J.; Guan, S.; Zheng, Y.; Wen, H.; Liu, H. Embryonic development of Thamnaconus septentrionali under artificial cultivation conditions. Adv. Mar. Sci. 2011, 29, 498–505. (In Chinese) [Google Scholar]
  59. Jiang, L.; Zhang, Z.; Wang, Z.; Du, R.; Luan, S.; Wu, Y.; Liu, L. Key technology for early factory breeding of Thamnaconus septentrionali. Fish. Sci. 2021, 40, 801–809. (In Chinese) [Google Scholar]
  60. Livak, K.; Schmittgen, T. Analysis of relative gene expression data using real-time quantitative PCR and the 2 −ΔΔCT method. Methods 2001, 25, 402–408. [Google Scholar] [CrossRef]
Figure 1. Phylogenetic tree of the HSP70 gene family from T. septentrionalis and other species (total 9 species). The phylogenetic tree was constructed by the MEGA 11 using the neighbor-joining method, and the statistical robustness of the tree was estimated by bootstrapping with 1000 replicates. The HSP70 genes of T. septentrionalis are marked in red, and its HSP70 gene family is divided into eight groups (hspa1, hspa4, hspa5, hspa8, hspa9, hspa13, hspa14, and hyou1), which are marked with different colors.
Ijms 25 05706 g001
Figure 2. Phylogenetic tree of the HSP90 gene family from T. septentrionalis and other species (total 11 species). The HSP90 genes of T. septentrionalis are marked in red, and its HSP90 gene family is divided into four groups (hsp90aa1, hsp90ab1, hsp90b1, and trap1), which are marked with different colors.
Ijms 25 05706 g002
Figure 3. The combination of phylogenetic tree and gene structure. The left side of the figure shows the phylogenetic tree of the HSP70 and HSP90 genes of T. septentrionalis, and the right side shows the gene structures and gene lengths.
Ijms 25 05706 g003
Figure 4. Chromosomal distribution of HSP70 and HSP90 genes in T. septentrionalis. Genes and chromosomes are labeled in red and black, respectively.
Ijms 25 05706 g004
Figure 5. The combination of phylogenetic tree and motifs and conserved domains. The left side of the figure shows the phylogenetic tree of the HSP70 and HSP90 genes of T. septentrionalis, the middle shows the distribution of the motifs and each colored rectangle represents a motif, the right side shows the identification of conserved domains and each colored rectangle represents a conserved structural domain.
Ijms 25 05706 g005
Figure 6. Three-dimensional structural projection of HSP70 and HSP90 proteins. Blue parts represent α helix and red parts represent β Turn.
Ijms 25 05706 g006
Figure 7. Signal peptide prediction analysis of HSP70 protein (hspa5 and hyou1) and HSP90 protein (hsp90b1).
Ijms 25 05706 g007aIjms 25 05706 g007b
Figure 8. Prediction of protein transmembrane structural domains of HSP70 protein (hspa13).
Ijms 25 05706 g008
Figure 9. Expression profiles of HSP70 and HSP90 genes in different tissues of T. septentrionalis. Cells with different colors correspond to different expression levels, which were normalized into log2 (FPKM + 1). Int, Mus, and Spl represent the intestine, muscle, and spleen, respectively.
Ijms 25 05706 g009
Figure 10. Expression profiles of HSP70 and HSP90 genes in different developmental periods of T. septentrionalis. Cells with different colors correspond to different expression levels, which were normalized into log2 (FPKM + 1). Cle, Bla, Gas, Neu, Tai, Mus, Dph0, and Dph20 represent cleavage stage, blastocyst stage, gastrula stage, neuroembryonic stage, tail bud stage, muscle effect stage, hatch 0-day larvae, and hatch 20 days juvenile, respectively.
Ijms 25 05706 g010
Figure 11. Expression profiles of HSP70 and HSP90 genes in T. septentrionalis under different abiotic stresses (high temperature, high salt, low salt, and ammonia stresses). Cells with different colors correspond to different expression levels, which were normalized into log2 (FPKM + 1). The tissue used in Panel Control, Te_High, Sa_High, and Sa_Low was the liver, The tissue sampled in Panel Control_Gill and NH4_Gill was the gill. Te_High, Sa_High, Sa_Low, and NH4 denote high temperature 30 °C, high Salt 40‰, Low salt 15‰, and ammonia nitrogen 10.60 mg/L, respectively.
Ijms 25 05706 g011
Figure 12. Validation of HSP70 and HSP90 gene expression under different environmental stresses by Quantitative Real-time PCR (qPCR). The tissue used in qPCR was the liver. The left side of the figure shows the relative expression of the HSP70 genes under environmental stress, while the right side of the figure shows the HSP90 genes. Blue bars indicate transcriptome results, and orange bars indicate qPCR results. Te_High, Sa_High, and Sa_Low denote high temperature 30 °C, high Salt 40‰, and Low salt 15‰, respectively. The mRNA expression levels were determined by qPCR analysis using the 2−ΔΔCt method. * and ** indicate the significant differences at p < 0.05 and p < 0.01 between qPCR results and transcriptome results for the same gene, respectively.
Ijms 25 05706 g012
Table 1. Summary of sequence characteristics of HSP70 and HSP90 genes in T. septentrionalis.
Gene NameNCBI
Accession
Number
Number
of Amino Acid
Molecular Weight (Da)Theoretical 
pI
Instability 
Index
Aliphatic 
Index
Grand
Average of
Hydropathicity
hsp70PP34992763970,266.655.4436.4484.98−0.423
hspa1bPP34992663970,106.245.5337.5283.93−0.412
hspa4PP34992884695,013.445.0443.0372.97−0.628
hspa4aPP34992384294,144.845.1743.5476.28−0.534
hspa4lPP34992283292,954.525.4641.2079.68−0.487
hspa5PP34992965672,413.784.9730.5584.39−0.482
hspa8.1PP35744351556,702.915.9036.4581.98−0.405
hspa8.2PP34992564770,877.185.2739.4581.82−0.422
hspa9PP34993068874,170.996.2445.5981.79−0.374
hspa13PP33945344247,831.975.5240.48102.150.082
hspa14PP34992450654,814.525.6638.4994.43−0.052
hyou1PP349931945106,412.406.0345.1479.47−0.527
hsp90aa1PP34993472583,238.605.0635.7082.81−0.625
hsp90ab1PP34993272483,206.204.8739.9182.56−0.640
hsp90b1PP34993380191,991.324.7438.9679.38−0.693
trap1PP34993571981,840.085.9945.5483.99−0.440
Table 2. Secondary structure prediction and subcellular location prediction of HSP70 and HSP90 proteins.
Gene Nameα 
Helix
Extended 
Strand
β 
Turn
Random 
Coil
Subcellular 
Location
Three-Dimensional 
Structural Quality Parameters
hsp7042.10%18.47%5.95%33.49%Nucleus94.0%
hspa1b42.57%18.94%7.20%31.30%Cytosol94.5%
hspa442.55%14.18%3.07%40.19%Cytosol90.6%
hspa4a43.11%14.01%3.09%39.79%Cytosol92.2%
hspa4l43.63%14.06%3.25%39.06%Cytosol91.9%
hspa543.75%18.60%6.71%30.95%Endoplasmic
reticulum
93.6%
hspa8.133.79%23.30%8.54%34.37%Cytosol93.2%
hspa8.241.58%17.77%6.96%33.69%Cytosol93.8%
hspa943.75%19.77%8.14%28.34%mitochondrion92.9%
hspa1340.27%21.27%5.66%32.81%Endoplasmic
reticulum
93.7%
hspa1434.78%24.90%5.14%35.18%Cytosol93.6%
hyou148.99%13.23%3.28%34.50%Endoplasmic
reticulum
89.9%
hsp90aa152.55%13.66%5.38%28.41%Cytosol89.5%
hsp90ab150.14%13.54%4.56%31.77%Cytosol90.4%
hsp90b154.68%12.36%3.75%29.21%Endoplasmic
reticulum
88.2%
trap145.20%13.77%5.70%35.33%mitochondrion88.8%
Table 3. Ka, Ks, and Ka/Ks * ratios of duplicated HSP70 and HSP90 gene pairs.
Gene PairKaKsKa/Ks
hsp70-hspa1b0.1041255230.9184270.113374
hspa4-hspa4a0.1752768491.5085660.116188
hspa4-hspa4l0.3070671941.6836170.182385
hspa4a-hspa4l0.2851182861.7020430.167515
hspa8.1-hspa8.20.067000741.4612760.045851
hsp90aa1-hsp90ab10.1166353931.0129760.115141
* Ka: nonsynonymous substitution rate; Ks: synonymous substitution rate.
Disclaimer/Publisher’s Note: The statements, opinions and data contained in all publications are solely those of the individual author(s) and contributor(s) and not of MDPI and/or the editor(s). MDPI and/or the editor(s) disclaim responsibility for any injury to people or property resulting from any ideas, methods, instructions or products referred to in the content.

