
Matrix Remodeling Enzymes as Potential Fluid Biomarkers of Neurodegeneration in Alzheimer’s Disease
 , ,
, ,  , ,
, ,
Abstract
1. Introduction
2. Results
2.1. Demographic, Clinical, Neuroimaging, and CSF Laboratory Parameters
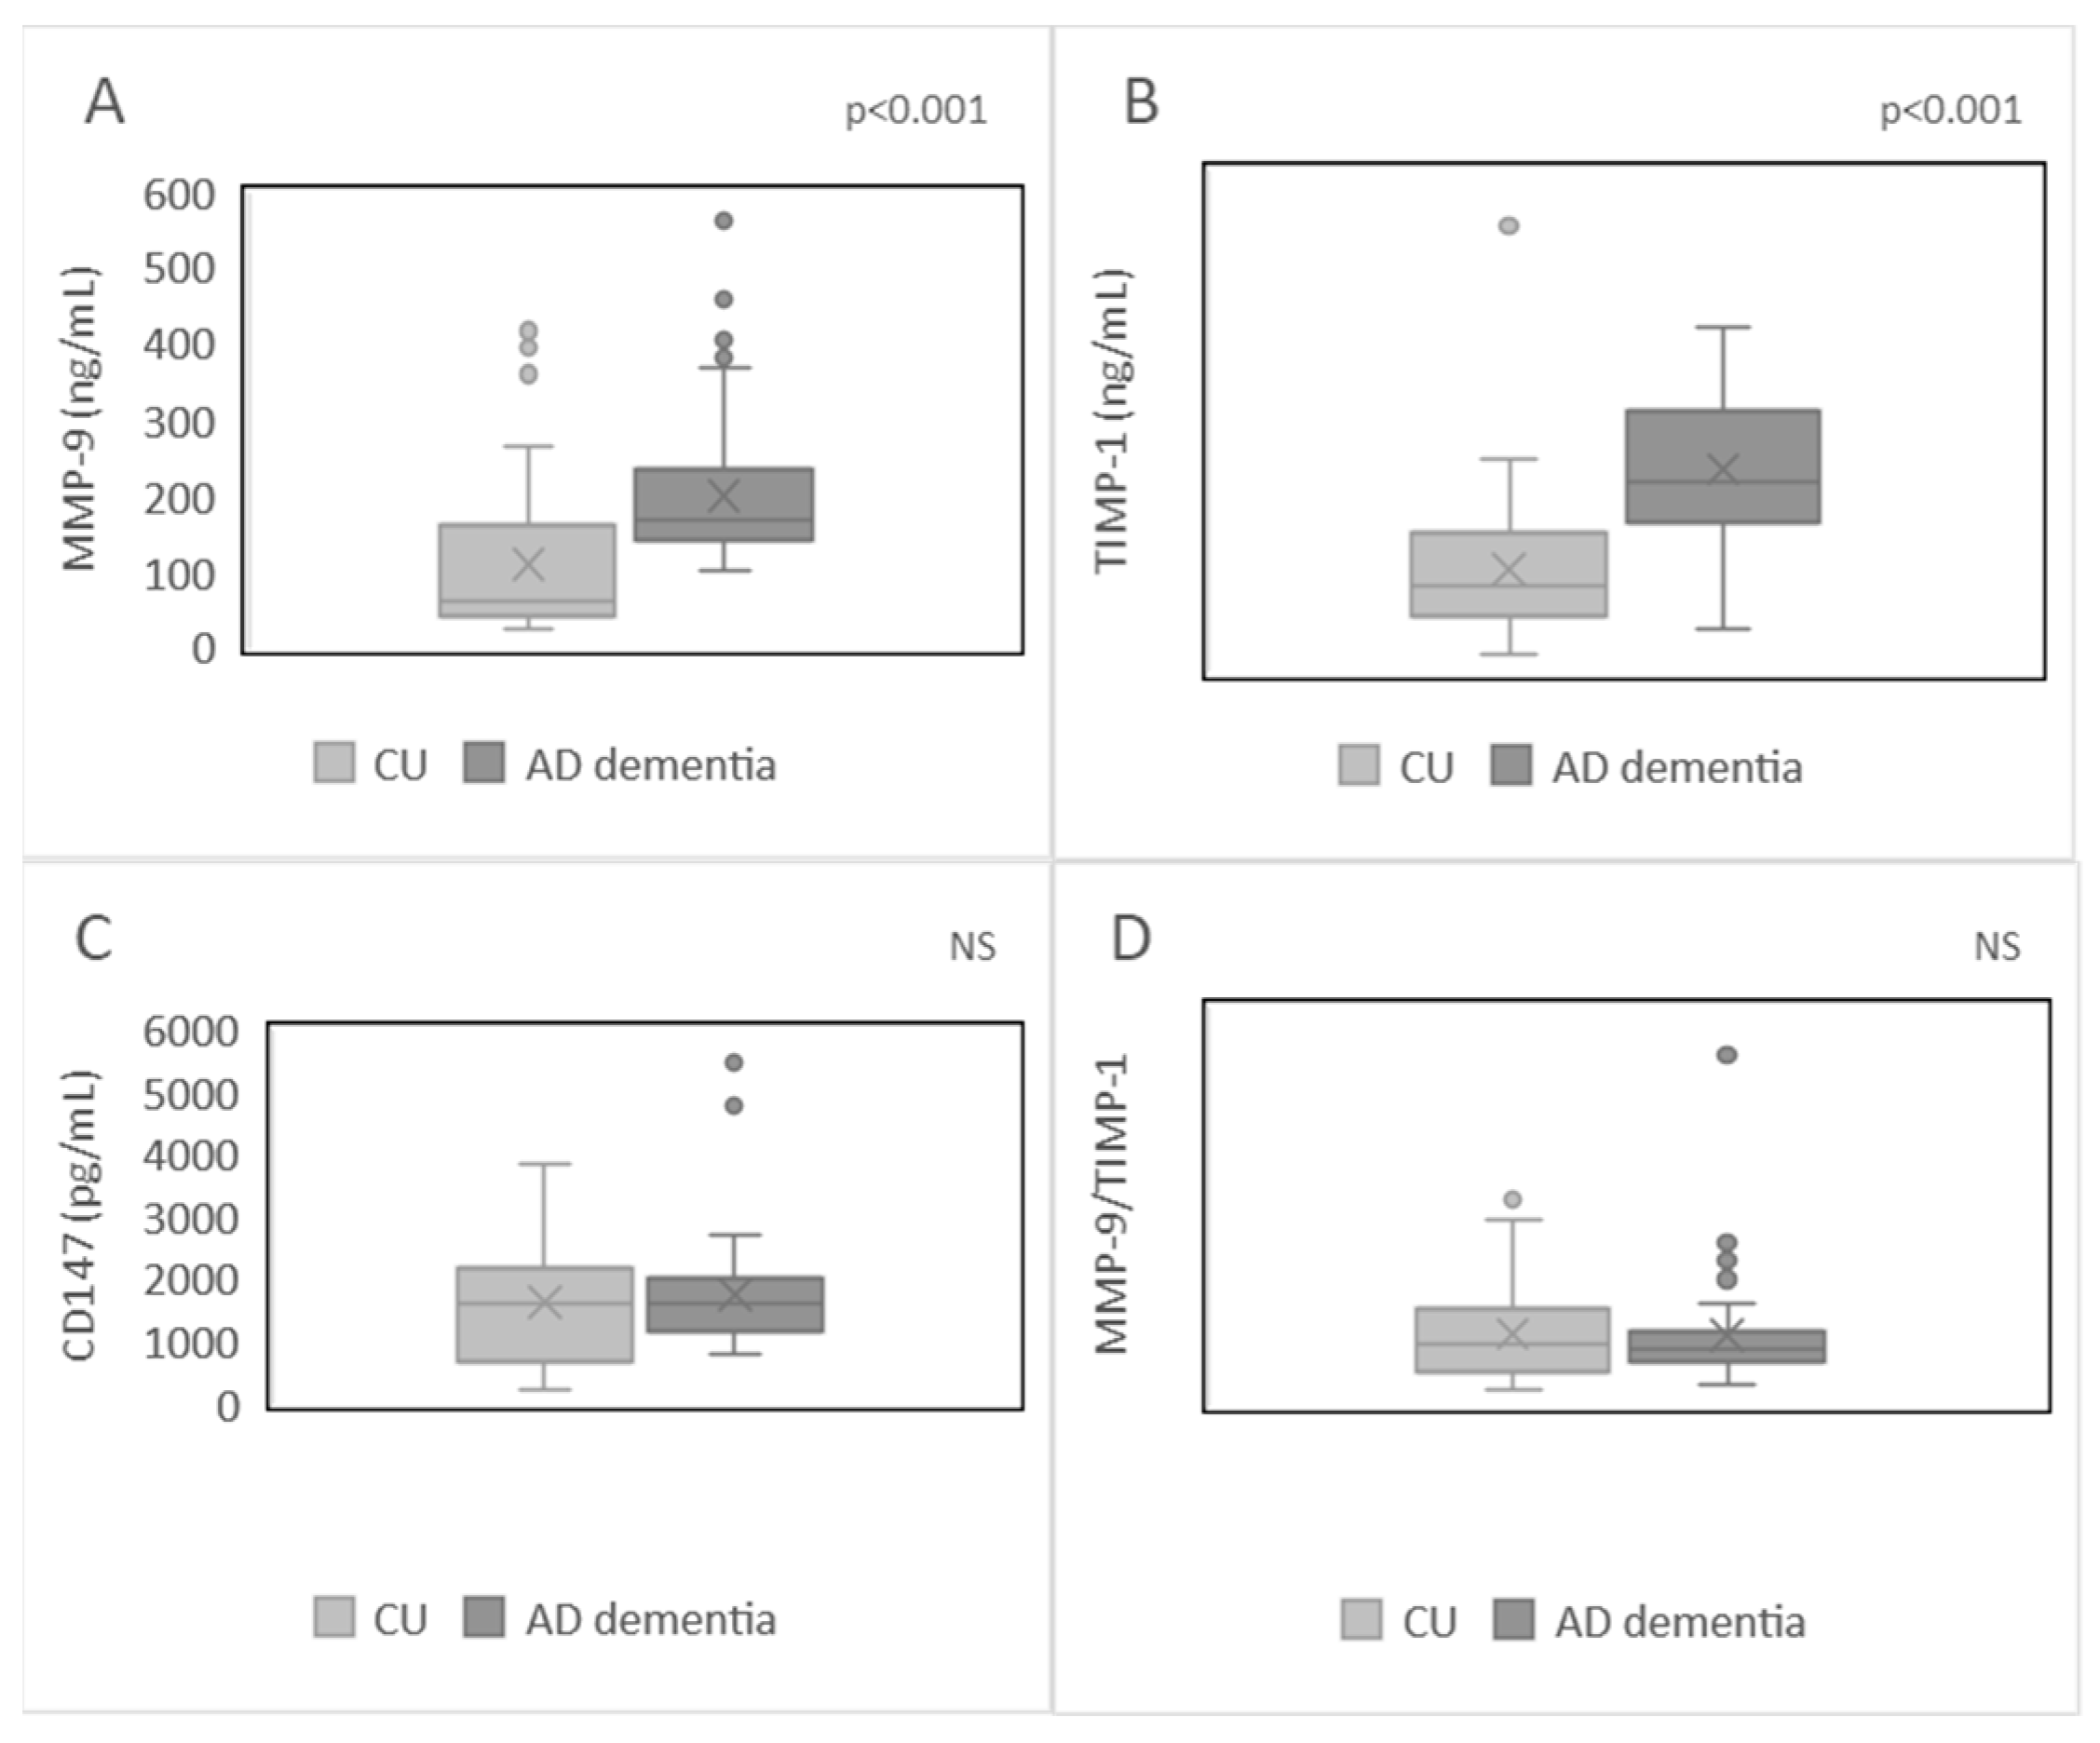
2.2. Plasma Levels of MMP-9, TIMP-1, CD147, and MMP-9/TIMP-1 Ratio in the Studied Population
2.3. Receiver Operating Characteristic (ROC) Curve Analysis
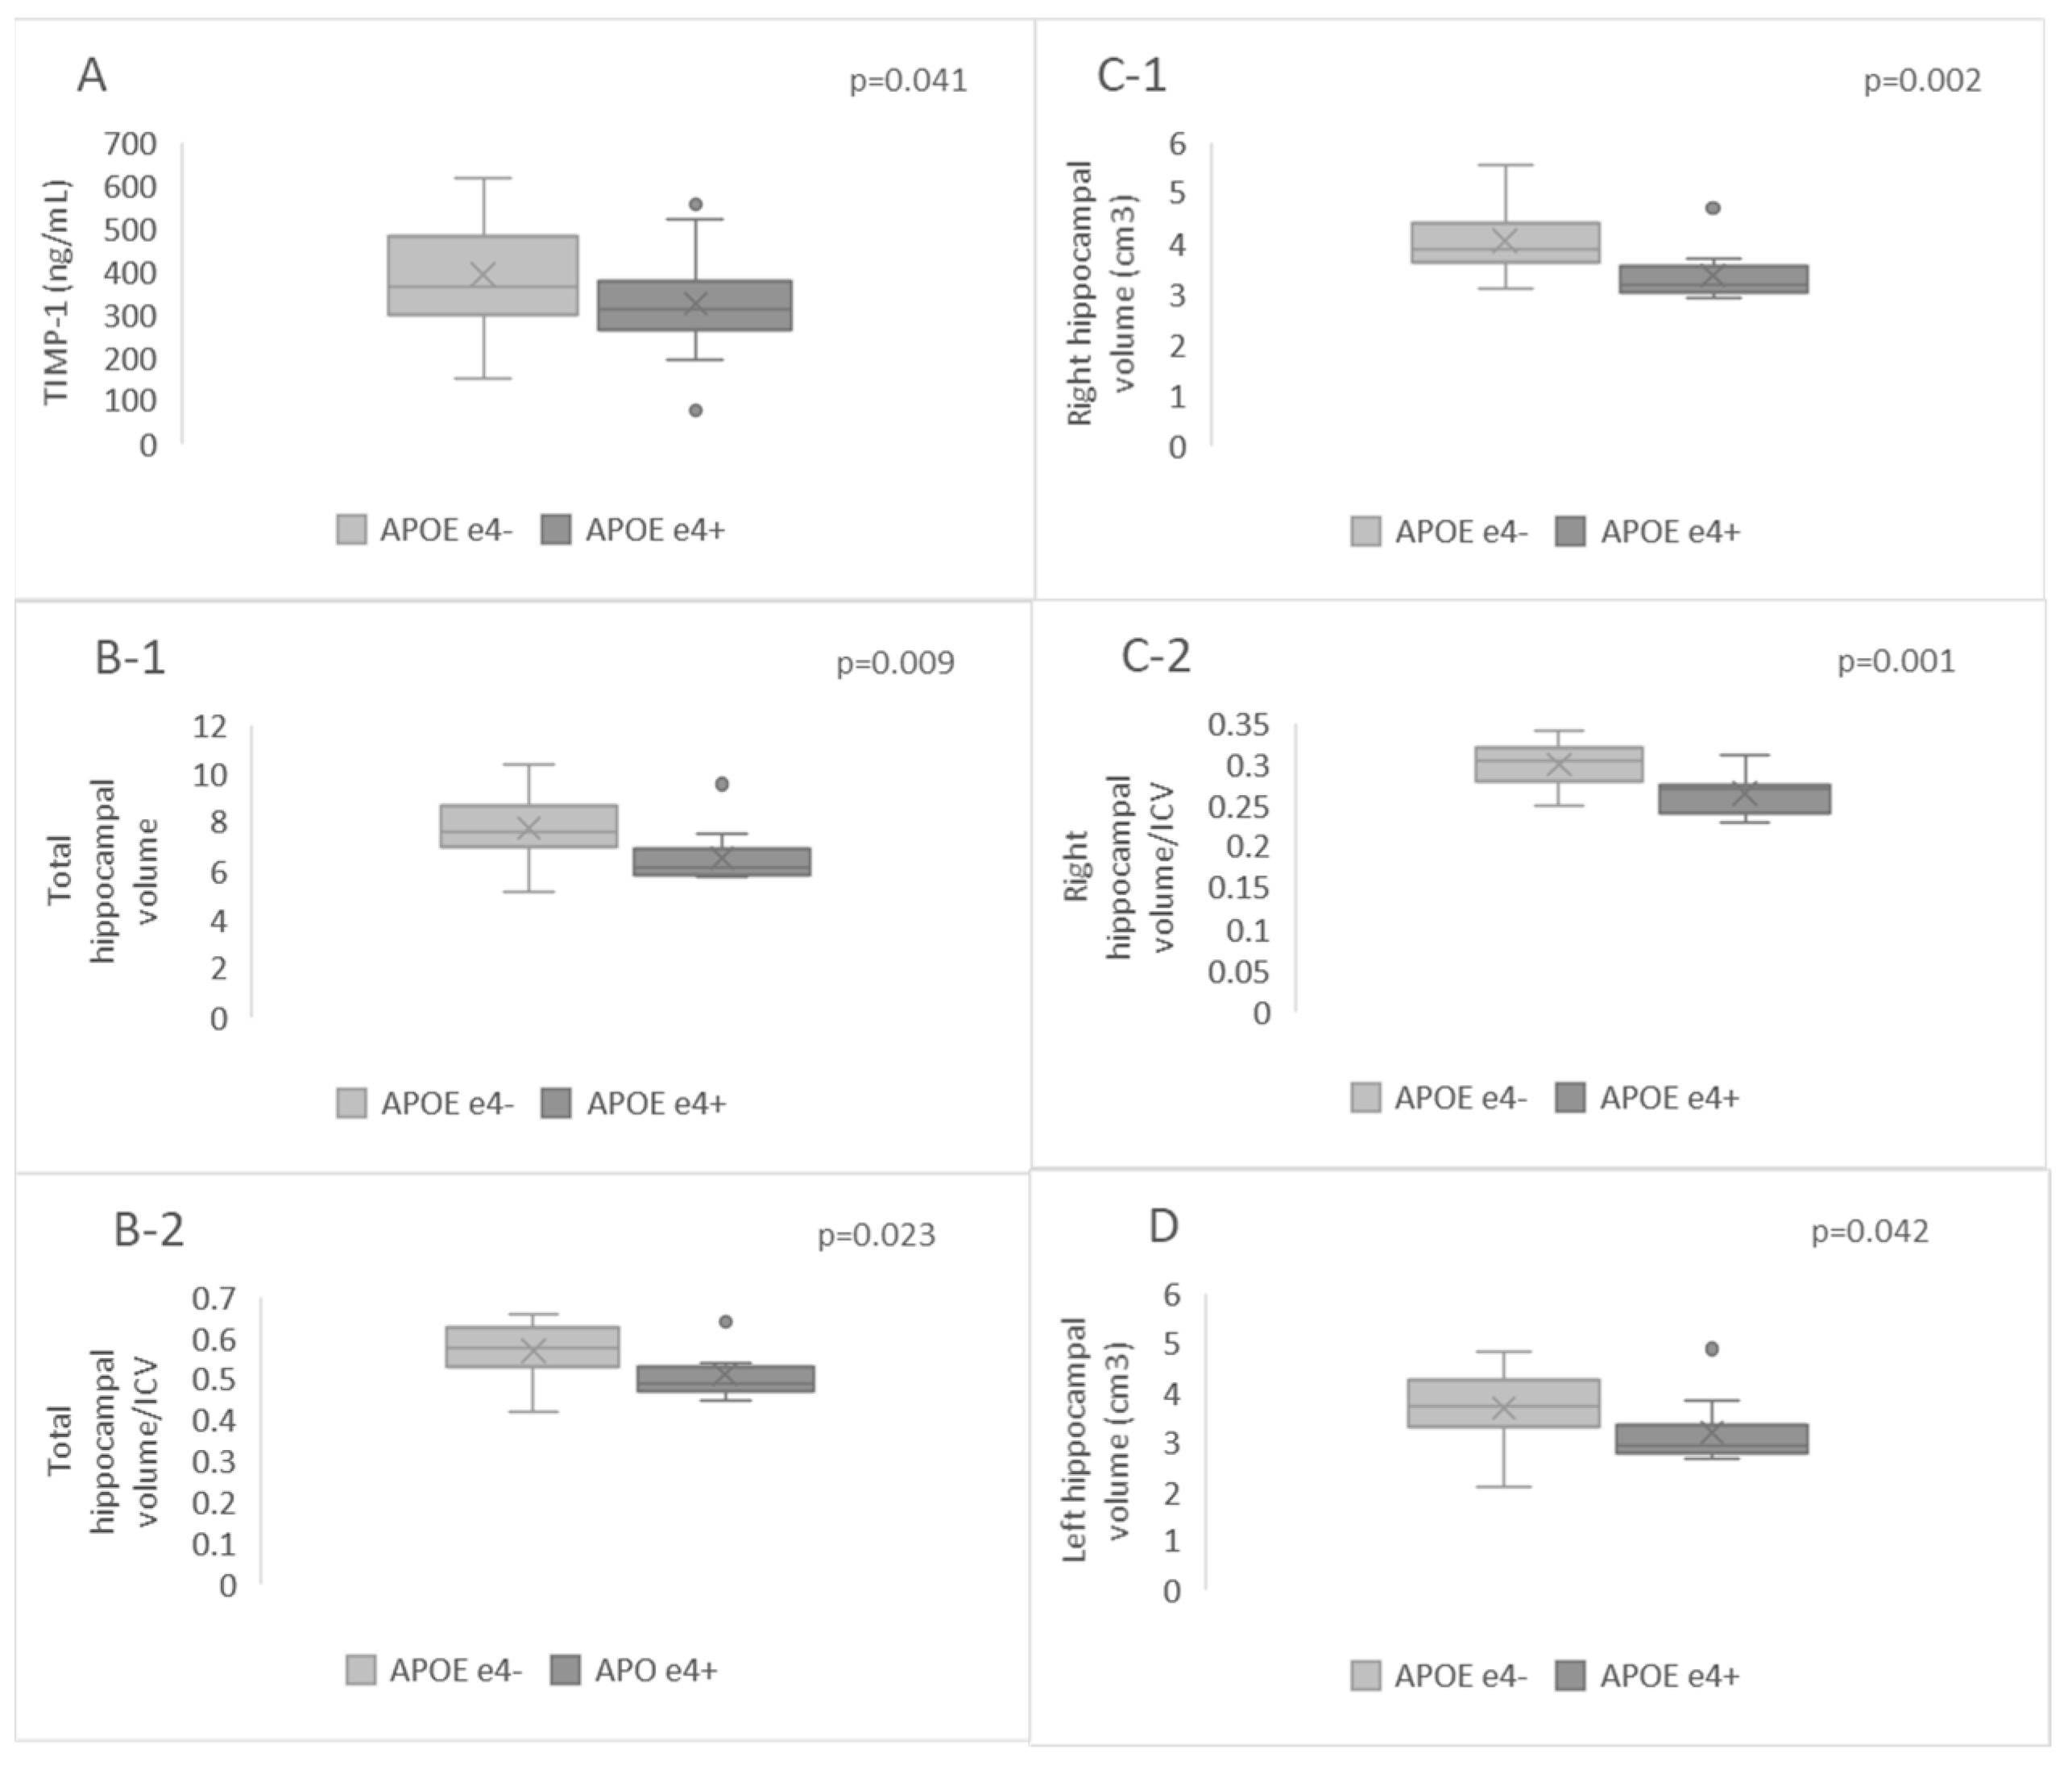
2.4. Hippocampal Volumes and Plasma Levels of MMP-9, TIMP-1, CD147, and MMP-9/TIMP-1 Ratio in APOE-ε4-Positive and APOE-ε4-Negative Patients
2.5. Correlation Analysis between Plasma Biomarkers and Hippocampal Parameters in AD Dementia Patients
3. Discussion
4. Materials and Methods
4.1. Processing of CSF Samples and Subsequent Biomarker Assessments
4.2. Blood Sample Preparation, Genotyping, and Biomarker Analyses
4.3. Neuroradiological Examination
4.4. Volumetric Analysis
Statistical Analysis
5. Conclusions
Author Contributions
Funding
Institutional Review Board Statement
Informed Consent Statement
Data Availability Statement
Conflicts of Interest
References
- Nichols, E.; Szoeke, C.E.; Vollset, S.E.; Abbasi, N.; Abd-Allah, F.; Abdela, J.; Aichour, M.T.E.; Akinyemi, R.O.; Alahdab, F.; Asgedom, S.W. Global, Regional, and National Burden of Alzheimer’s Disease and Other Dementias, 1990–2016: A Systematic Analysis for the Global Burden of Disease Study 2016. Lancet Neurol. 2019, 18, 88–106. [Google Scholar] [CrossRef]
- Nichols, E.; Steinmetz, J.D.; Vollset, S.E.; Fukutaki, K.; Chalek, J.; Abd-Allah, F.; Abdoli, A.; Abualhasan, A.; Abu-Gharbieh, E.; Akram, T.T. Estimation of the Global Prevalence of Dementia in 2019 and Forecasted Prevalence in 2050: An Analysis for the Global Burden of Disease Study 2019. Lancet Public Health 2022, 7, e105–e125. [Google Scholar] [CrossRef] [PubMed]
- Frisoni, G.B.; Altomare, D.; Thal, D.R.; Ribaldi, F.; van der Kant, R.; Ossenkoppele, R.; Blennow, K.; Cummings, J.; van Duijn, C.; Nilsson, P.M. The Probabilistic Model of Alzheimer Disease: The Amyloid Hypothesis Revised. Nat. Rev. Neurosci. 2022, 23, 53–66. [Google Scholar] [CrossRef]
- McKhann, G.M.; Knopman, D.S.; Chertkow, H.; Hyman, B.T.; Jack Jr, C.R.; Kawas, C.H.; Klunk, W.E.; Koroshetz, W.J.; Manly, J.J.; Mayeux, R. The Diagnosis of Dementia Due to Alzheimer’s Disease: Recommendations from the National Institute on Aging-Alzheimer’s Association Workgroups on Diagnostic Guidelines for Alzheimer’s Disease. Alzheimer’s Dement. 2011, 7, 263–269. [Google Scholar] [CrossRef]
- Jack Jr, C.R.; Bennett, D.A.; Blennow, K.; Carrillo, M.C.; Dunn, B.; Haeberlein, S.B.; Holtzman, D.M.; Jagust, W.; Jessen, F.; Karlawish, J. NIA-AA Research Framework: Toward a Biological Definition of Alzheimer’s Disease. Alzheimer’s Dement. 2018, 14, 535–562. [Google Scholar] [CrossRef]
- Jack Jr, C.R.; Albert, M.; Knopman, D.S.; McKhann, G.M.; Sperling, R.A.; Carillo, M.; Thies, W.; Phelps, C.H. Introduction to Revised Criteria for the Diagnosis of Alzheimer’s Disease: National Institute on Aging and the Alzheimer Association Workgroups. Alzheimer’s Dement. J. Alzheimer’s Assoc. 2011, 7, 257–262. [Google Scholar] [CrossRef]
- Milošević, V.; Malobabić, M.; Stojanović, I.; Bašić, J. Importance of a Functional Measure in the Evaluation of Patients in a Memory Clinic: Validation of the Serbian Version of the Amsterdam Instrumental Activities of Daily Living Questionnaire. Clin. Neurol. Neurosurg. 2022, 214, 107165. [Google Scholar] [CrossRef] [PubMed]
- Milošević, V.; Malobabić, M.; Antić, E.; Trenkić, A.A.; Stojanov, D.; Bašić, J. Assessment of The Instrumental Activities of Daily Living in Mild Cognitive Impairment and Dementia due to Alzheimer’s Disease: Diagnostic Accuracy of the Serbian Version of The Amsterdam Iadl Questionnaire. Facta Univ. Ser. Med. Biol. 2022, 24, 35–39. [Google Scholar] [CrossRef]
- Prins, S.; de Kam, M.L.; Teunissen, C.E.; Groeneveld, G.J. Inflammatory Plasma Biomarkers in Subjects with Preclinical Alzheimer’s Disease. Alzheimer’s Res. Ther. 2022, 14, 106. [Google Scholar] [CrossRef]
- Abe, K.; Chiba, Y.; Hattori, S.; Yoshimi, A.; Asami, T.; Katsuse, O.; Suda, A.; Hishimoto, A. Alzheimer’s Disease Neuroimaging Initiative Influence of Plasma Matrix Metalloproteinase Levels on Longitudinal Changes in Alzheimer’s Disease (AD) Biomarkers and Cognitive Function in Patients with Mild Cognitive Impairment Due to AD Registered in the Alzheimer’s Disease Neuroimaging Initiative Database. J. Neurol. Sci. 2020, 416, 116989. [Google Scholar] [CrossRef]
- Tuna, G.; Yener, G.G.; Oktay, G.; İşlekel, G.H.; Kİrkalİ, F.G. Evaluation of Matrix Metalloproteinase-2 (MMP-2) and-9 (MMP-9) and Their Tissue Inhibitors (TIMP-1 and TIMP-2) in Plasma from Patients with Neurodegenerative Dementia. J. Alzheimer’s Dis. 2018, 66, 1265–1273. [Google Scholar] [CrossRef] [PubMed]
- Du, J.; Li, S.; Su, Y.; Wang, H.; Liu, H.; Cui, H. The Role of Extracellular Matrix Metalloproteinase Inducer on the Action of Dihydrotestosterone against the Cellular Damage Induced by Aβ42. Mol. Cell. Endocrinol. 2019, 498, 110536. [Google Scholar] [CrossRef]
- Rivera, S.; García-González, L.; Khrestchatisky, M.; Baranger, K. Metalloproteinases and Their Tissue Inhibitors in Alzheimer’s Disease and Other Neurodegenerative Disorders. Cell. Mol. Life Sci. 2019, 76, 3167–3191. [Google Scholar] [CrossRef]
- Bašić, J.; Milošević, V.; Đorđević, B.; Stefanović, N.; Cvetković, M.; Jevtović-Stoimenov, T.; Stojanović, I. Association of the Apolipoprotein E Ε4 Allele in a Serbian Population with Alzheimer’s Dementia. Arch. Biol. Sci. 2023, 75, 319–325. [Google Scholar] [CrossRef]
- Bašić, J.; Milošević, V.; Đorđević, B.; Stefanović, N.; Stojiljković, V.; Stoimenov, T.J.; Stojanović, I. The Influence of the Apoeε4 Allele on Pro-Inflammatory Cytokine Levels in the Cerebrospinal Fluid of Patients with Alzheimer’s Disease. Facta Univ. Ser. Med. Biol. 2024, 25, 037–041. [Google Scholar] [CrossRef]
- Patel, K.P.; Wymer, D.T.; Bhatia, V.K.; Duara, R.; Rajadhyaksha, C.D. Multimodality Imaging of Dementia: Clinical Importance and Role of Integrated Anatomic and Molecular Imaging. Radiographics 2020, 40, 200–222. [Google Scholar] [CrossRef]
- Park, H.Y.; Suh, C.H.; Heo, H.; Shim, W.H.; Kim, S.J. Diagnostic Performance of Hippocampal Volumetry in Alzheimer’s Disease or Mild Cognitive Impairment: A Meta-Analysis. Eur. Radiol. 2022, 32, 6979–6991. [Google Scholar] [CrossRef]
- Živanović, M.; Trenkić, A.A.; Milošević, V.; Stojanov, D.; Mišić, M.; Radovanović, M.; Radovanović, V. The Role of Magnetic Resonance Imaging in the Diagnosis and Prognosis of Dementia. Biomol. Biomed. 2023, 23, 209–224. [Google Scholar] [CrossRef] [PubMed]
- Lorenzl, S.; Albers, D.S.; Relkin, N.; Ngyuen, T.; Hilgenberg, S.L.; Chirichigno, J.; Cudkowicz, M.E.; Beal, M.F. Increased Plasma Levels of Matrix Metalloproteinase-9 in Patients with Alzheimer’s Disease. Neurochem. Int. 2003, 43, 191–196. [Google Scholar] [CrossRef]
- Lorenzl, S.; Büerger, K.; Hampel, H.; Beal, M.F. Profiles of Matrix Metalloproteinases and Their Inhibitors in Plasma of Patients with Dementia. Int. Psychogeriatr. 2008, 20, 67–76. [Google Scholar] [CrossRef]
- Horstmann, S.; Budig, L.; Gardner, H.; Koziol, J.; Deuschle, M.; Schilling, C.; Wagner, S. Matrix Metalloproteinases in Peripheral Blood and Cerebrospinal Fluid in Patients with Alzheimer’s Disease. Int. Psychogeriatr. 2010, 22, 966–972. [Google Scholar] [CrossRef]
- Lim, N.K.-H.; Villemagne, V.L.; Soon, C.P.; Laughton, K.M.; Rowe, C.C.; McLean, C.A.; Masters, C.L.; Evin, G.; Li, Q.-X. Investigation of Matrix Metalloproteinases, MMP-2 and MMP-9, in Plasma Reveals a Decrease of MMP-2 in Alzheimer’s Disease. J. Alzheimer’s Dis. 2011, 26, 779–786. [Google Scholar] [CrossRef] [PubMed]
- Liu, J.; Li, X.; Qu, J. Plasma MMP-9/TIMP-1 Ratio Serves as a Novel Potential Biomarker in Alzheimer’s Disease. NeuroReport 2023, 34, 767–772. [Google Scholar] [CrossRef] [PubMed]
- Swets, J.A. Measuring the Accuracy of Diagnostic Systems. Science 1988, 240, 1285–1293. [Google Scholar] [CrossRef]
- Morales, I.; Guzmán-Martínez, L.; Cerda-Troncoso, C.; Farías, G.A.; Maccioni, R.B. Neuroinflammation in the Pathogenesis of Alzheimer’s Disease. A Rational Framework for the Search of Novel Therapeutic Approaches. Front. Cell. Neurosci. 2014, 8, 112. [Google Scholar] [CrossRef]
- Troutwine, B.R.; Hamid, L.; Lysaker, C.R.; Strope, T.A.; Wilkins, H.M. Apolipoprotein E and Alzheimer’s Disease. Acta Pharm. Sin. B 2022, 12, 496–510. [Google Scholar] [CrossRef]
- Bachmeier, C.; Shackleton, B.; Ojo, J.; Paris, D.; Mullan, M.; Crawford, F. Apolipoprotein E Isoform-Specific Effects on Lipoprotein Receptor Processing. Neuromolecular Med. 2014, 16, 686–696. [Google Scholar] [CrossRef]
- Wang, C.; Najm, R.; Xu, Q.; Jeong, D.; Walker, D.; Balestra, M.E.; Yoon, S.Y.; Yuan, H.; Li, G.; Miller, Z.A. Gain of Toxic Apolipoprotein E4 Effects in Human iPSC-Derived Neurons Is Ameliorated by a Small-Molecule Structure Corrector. Nat. Med. 2018, 24, 647–657. [Google Scholar] [CrossRef]
- Iannucci, J.; Sen, A.; Grammas, P. Isoform-Specific Effects of Apolipoprotein E on Markers of Inflammation and Toxicity in Brain Glia and Neuronal Cells in Vitro. Curr. Issues Mol. Biol. 2021, 43, 215–225. [Google Scholar] [CrossRef]
- Belloy, M.E.; Napolioni, V.; Greicius, M.D. A Quarter Century of APOE and Alzheimer’s Disease: Progress to Date and the Path Forward. Neuron 2019, 101, 820–838. [Google Scholar] [CrossRef]
- Emrani, S.; Arain, H.A.; DeMarshall, C.; Nuriel, T. APOE4 Is Associated with Cognitive and Pathological Heterogeneity in Patients with Alzheimer’s Disease: A Systematic Review. Alzheimer’s Res. Ther. 2020, 12, 141. [Google Scholar] [CrossRef] [PubMed]
- O’Dwyer, L.; Lamberton, F.; Matura, S.; Tanner, C.; Scheibe, M.; Miller, J.; Rujescu, D.; Prvulovic, D.; Hampel, H. Reduced Hippocampal Volume in Healthy Young ApoE4 Carriers: An MRI Study. PLoS ONE 2012, 7, e48895. [Google Scholar] [CrossRef]
- Rosenich, E.; Bransby, L.; Yassi, N.; Fripp, J.; Laws, S.M.; Martins, R.N.; Fowler, C.; Rainey-Smith, S.R.; Rowe, C.C.; Masters, C.L. Differential Effects of APOE and Modifiable Risk Factors on Hippocampal Volume Loss and Memory Decline in Aβ− and Aβ+ Older Adults. Neurology 2022, 98, e1704–e1715. [Google Scholar] [CrossRef] [PubMed]
- Snellman, A.; Ekblad, L.L.; Tuisku, J.; Koivumäki, M.; Ashton, N.J.; Lantero-Rodriguez, J.; Karikari, T.K.; Helin, S.; Bucci, M.; Löyttyniemi, E. APOE Ε4 Gene Dose Effect on Imaging and Blood Biomarkers of Neuroinflammation and Beta-Amyloid in Cognitively Unimpaired Elderly. Alzheimer’s Res. Ther. 2023, 15, 71. [Google Scholar] [CrossRef] [PubMed]
- Bruno, M.A.; Mufson, E.J.; Wuu, J.; Cuello, A.C. Increased Matrix Metalloproteinase 9 Activity in Mild Cognitive Impairment. J. Neuropathol. Exp. Neurol. 2009, 68, 1309–1318. [Google Scholar] [CrossRef] [PubMed]
- Stomrud, E.; Björkqvist, M.; Janciauskiene, S.; Minthon, L.; Hansson, O. Alterations of Matrix Metalloproteinases in the Healthy Elderly with Increased Risk of Prodromal Alzheimer’s Disease. Alzheimer’s Res. Ther. 2010, 2, 20. [Google Scholar] [CrossRef] [PubMed]
- Abe, K.; Chiba, Y.; Ide, K.; Yoshimi, A.; Asami, T.; Suda, A.; Odawara, T.; Hishimoto, A. Alzheimer’s Disease Neuroimaging Initiative Plasma MMP-9 Levels as the Future Risk of Conversion to Dementia in ApoE4-Positive MCI Patients: Investigation Based on the Alzheimer’s Disease Neuroimaging Initiative Database. J. Prev. Alzheimer’s Dis. 2022, 9, 331–337. [Google Scholar] [CrossRef] [PubMed]
- Dafnis, I.; Tzinia, A.; Tsilibary, E.; Zannis, V.; Chroni, A. An Apolipoprotein E4 Fragment Affects Matrix Metalloproteinase 9, Tissue Inhibitor of Metalloproteinase 1 and Cytokine Levels in Brain Cell Lines. Neuroscience 2012, 210, 21–32. [Google Scholar] [CrossRef] [PubMed]
- Kloske, C.M.; Wilcock, D.M. The Important Interface between Apolipoprotein E and Neuroinflammation in Alzheimer’s Disease. Front. Immunol. 2020, 11, 754. [Google Scholar] [CrossRef]
- Nishitsuji, K.; Hosono, T.; Nakamura, T.; Bu, G.; Michikawa, M. Apolipoprotein E Regulates the Integrity of Tight Junctions in an Isoform-Dependent Manner in an in Vitro Blood-Brain Barrier Model. J. Biol. Chem. 2011, 286, 17536–17542. [Google Scholar] [CrossRef]
- Ringland, C.; Schweig, J.E.; Paris, D.; Shackleton, B.; Lynch, C.E.; Eisenbaum, M.; Mullan, M.; Crawford, F.; Abdullah, L.; Bachmeier, C. Apolipoprotein E Isoforms Differentially Regulate Matrix Metallopeptidase 9 Function in Alzheimer’s Disease. Neurobiol. Aging 2020, 95, 56–68. [Google Scholar] [CrossRef]
- Shackleton, B.; Ringland, C.; Abdullah, L.; Mullan, M.; Crawford, F.; Bachmeier, C. Influence of Matrix Metallopeptidase 9 on Beta-Amyloid Elimination across the Blood-Brain Barrier. Mol. Neurobiol. 2019, 56, 8296–8305. [Google Scholar] [CrossRef] [PubMed]
- Saha, P.; Sarkar, S.; Paidi, R.K.; Biswas, S.C. TIMP-1: A Key Cytokine Released from Activated Astrocytes Protects Neurons and Ameliorates Cognitive Behaviours in a Rodent Model of Alzheimer’s Disease. Brain Behav. Immun. 2020, 87, 804–819. [Google Scholar] [CrossRef]
- Cabral-Pacheco, G.A.; Garza-Veloz, I.; Castruita-De la Rosa, C.; Ramirez-Acuña, J.M.; Perez-Romero, B.A.; Guerrero-Rodriguez, J.F.; Martinez-Avila, N.; Martinez-Fierro, M.L. The Roles of Matrix Metalloproteinases and Their Inhibitors in Human Diseases. Int. J. Mol. Sci. 2020, 21, 9739. [Google Scholar] [CrossRef]
- Behl, T.; Kaur, G.; Sehgal, A.; Bhardwaj, S.; Singh, S.; Buhas, C.; Judea-Pusta, C.; Uivarosan, D.; Munteanu, M.A.; Bungau, S. Multifaceted Role of Matrix Metalloproteinases in Neurodegenerative Diseases: Pathophysiological and Therapeutic Perspectives. Int. J. Mol. Sci. 2021, 22, 1413. [Google Scholar] [CrossRef]
- Greco, G.A.; Rock, M.; Amontree, M.; Lanfranco, M.F.; Korthas, H.; Hong, S.H.; Turner, R.S.; Rebeck, G.W.; Conant, K. CCR5 Deficiency Normalizes TIMP Levels, Working Memory, and Gamma Oscillation Power in APOE4 Targeted Replacement Mice. Neurobiol. Dis. 2023, 179, 106057. [Google Scholar] [CrossRef]
- Chen, Y.-C.; Wu, Y.-R.; Mesri, M.; Chen, C.-M. Associations of Matrix Metalloproteinase-9 and Tissue Inhibitory Factor-1 Polymorphisms with Parkinson Disease in Taiwan. Medicine 2016, 95, e2672. [Google Scholar] [CrossRef] [PubMed]
- Bašić, J.; Milošević, V.; Đorđević, B.; Stojiljković, V.; Živanović, M.; Stoimenov, T.J.; Stojanović, I. Apolipoprotein E and Matrix Remodeling–a Link to Neurodegeneration in Alzheimer’s Disease. Biol. Serbica 2023, 45, 44–51. [Google Scholar] [CrossRef]
- Alvarez-Sanchez, L.; Pena-Bautista, C.; Baquero, M.; Chafer-Pericas, C. Novel Ultrasensitive Detection Technologies for the Identification of Early and Minimally Invasive Alzheimer’s Disease Blood Biomarkers. J. Alzheimer’s Dis. 2022, 86, 1337–1369. [Google Scholar] [CrossRef]
- Ashton, N.J.; Brum, W.S.; Di Molfetta, G.; Benedet, A.L.; Arslan, B.; Jonaitis, E.; Langhough, R.E.; Cody, K.; Wilson, R.; Carlsson, C.M. Diagnostic Accuracy of a Plasma Phosphorylated Tau 217 Immunoassay for Alzheimer Disease Pathology. JAMA Neurol. 2024, 81, 255–263. [Google Scholar] [CrossRef]
- Shir, D.; Graff-Radford, J.; Hofrenning, E.I.; Lesnick, T.G.; Przybelski, S.A.; Lowe, V.J.; Knopman, D.S.; Petersen, R.C.; Jack Jr, C.R.; Vemuri, P. Association of Plasma Glial Fibrillary Acidic Protein (GFAP) with Neuroimaging of Alzheimer’s Disease and Vascular Pathology. Alzheimer’s Dement. : Diagn. Assess. Dis. Monit. 2022, 14, e12291. [Google Scholar] [CrossRef]
- Manjón, J.V.; Coupé, P. volBrain: An Online MRI Brain Volumetry System. Front. Neuroinformatics 2016, 10, 30. [Google Scholar] [CrossRef]
- Manjón, J.V.; Romero, J.E.; Vivo-Hernando, R.; Rubio, G.; Aparici, F.; de la Iglesia-Vaya, M.; Coupé, P. vol2Brain: A New Online Pipeline for Whole Brain MRI Analysis. Front. Neuroinformatics 2022, 16, 862805. [Google Scholar] [CrossRef]
- Youden, W.J. Index for Rating Diagnostic Tests. Cancer 1950, 3, 32–35. [Google Scholar] [CrossRef]
- DeLong, E.R.; DeLong, D.M.; Clarke-Pearson, D.L. Comparing the Areas under Two or More Correlated Receiver Operating Characteristic Curves: A Nonparametric Approach. Biometrics 1988, 44, 837–845. [Google Scholar] [CrossRef]


| Parameters | CU | AD Dementia |
|---|---|---|
| Sex (Female, N (%)) | 23 (57.5) | 35 (58.33) # |
| Age (years, M (SD)) | 59 (4.15) | 70.80 (7.66) * |
| MMSE (M (SD)) | 28.72 (1.01) | 16.51 (6.87) * |
| Hippocampal volumes | ||
| Total (cm3, M (SD)) | - | 7.19 (1.28) |
| Total/ICV (M (SD)) | - | 0.54 (0.06) |
| Right (cm3, (M (SD)) | - | 3.74 (0.64) |
| Right/ICV (M (SD)) | - | 0.28 (0.03) |
| Left (cm3, (M (SD)) | - | 3.45 (0.67) |
| Left/ICV (M (SD)) | - | 0.26 (0.03) |
| APOE status | ||
| APOE ε4 positive (N (%)) | 8 (20) | 25 (41.66) ** # |
| CSF biomarkers | ||
| Aβ42/Aβ40 ratio (M (SD)) | - | 0.07 (0.01) |
| t-Tau (pg/mL, M (SD)) | - | 703.89 (254.86) |
| p-Tau 181 (pg/mL, M (SD)) | - | 162.47 (69.47) |
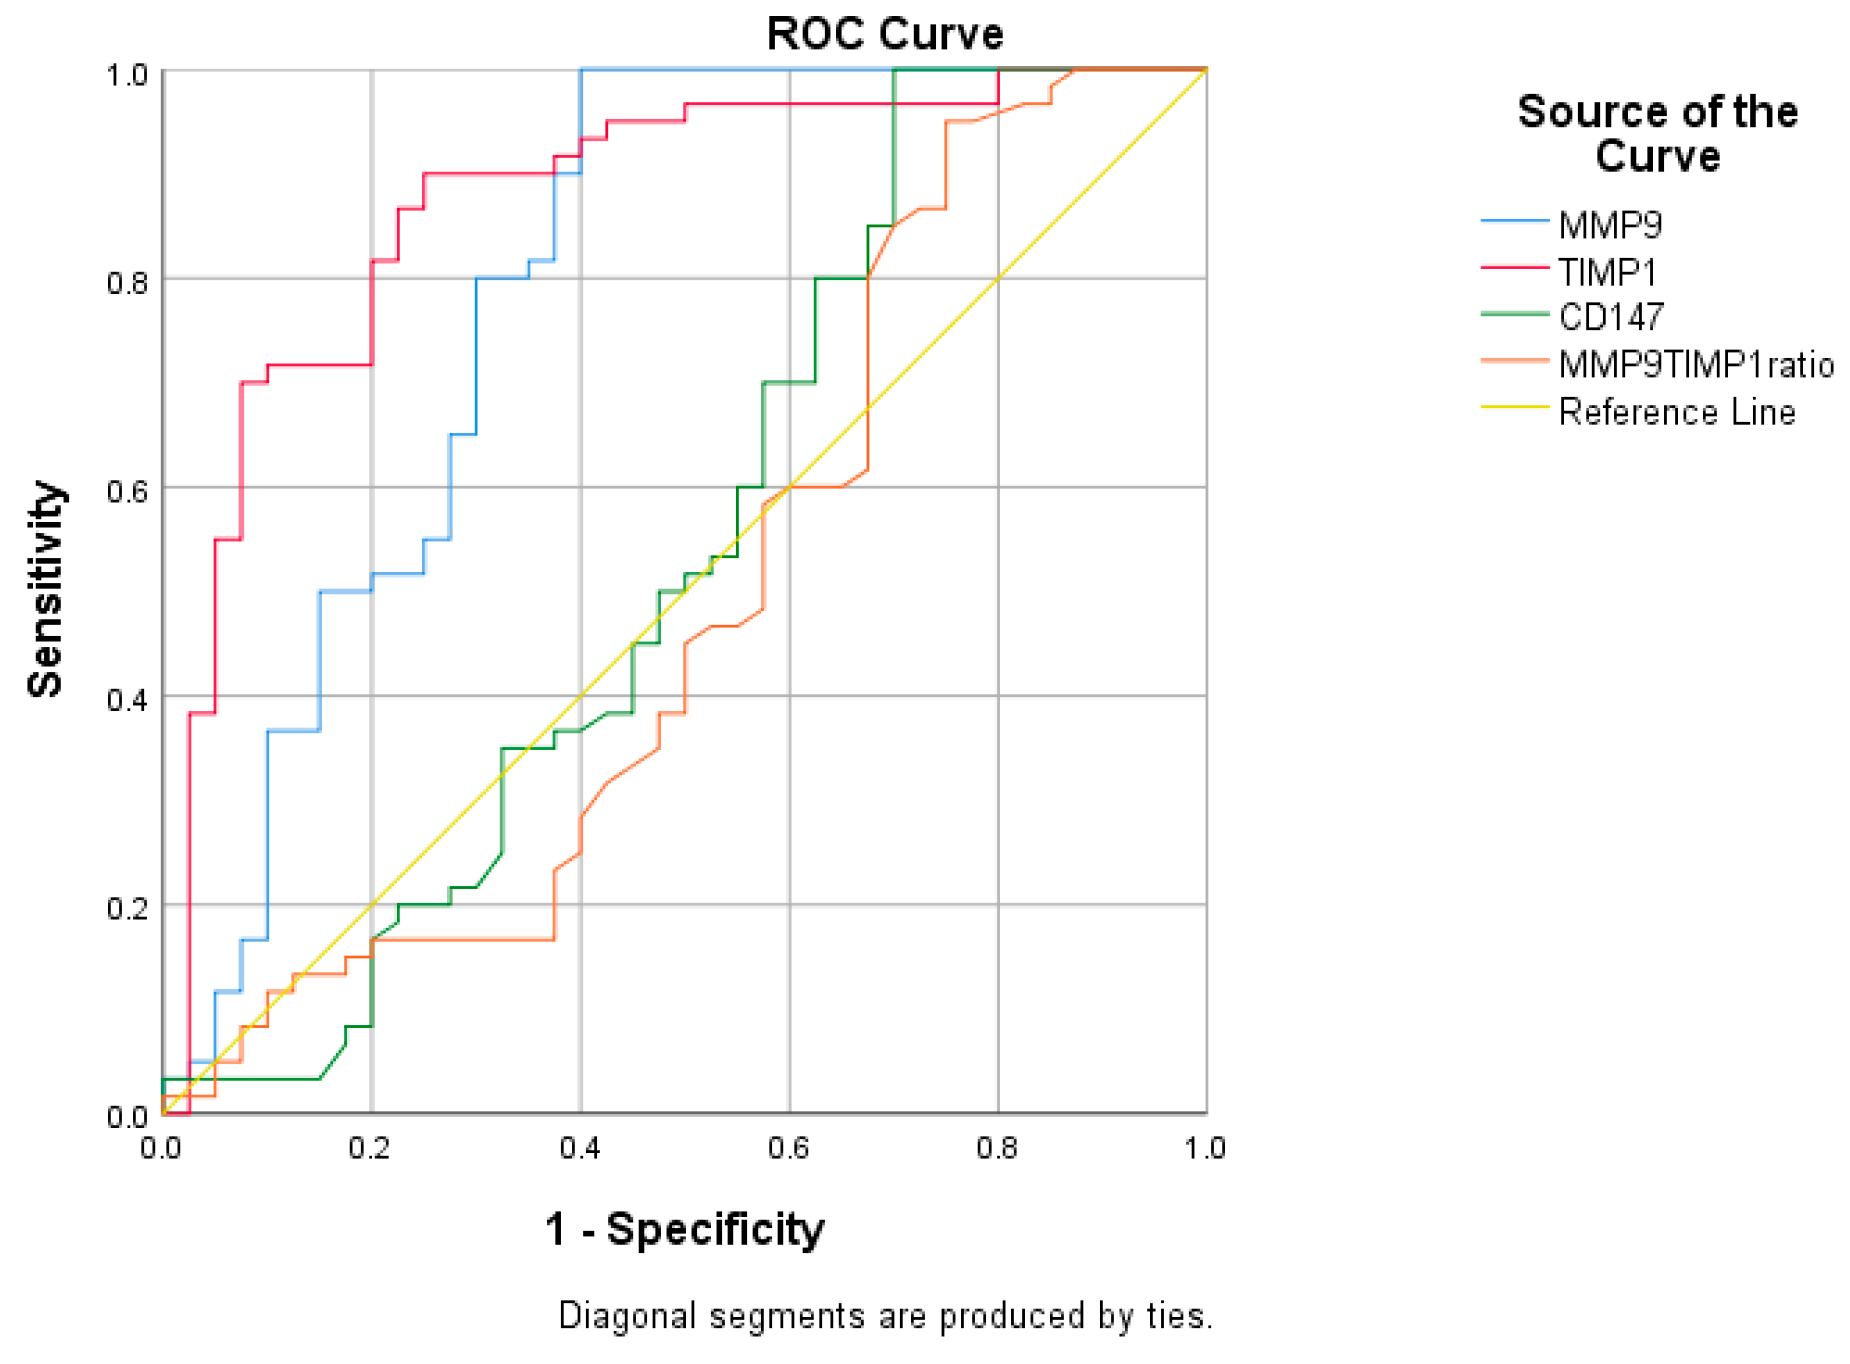
| Biomarker | AUC | 95% CI (LB-UB) | p-Value | Cut-Off | Sensitivity (%) | Specificity (%) | Difference between AUC (p-Value) |
|---|---|---|---|---|---|---|---|
| MMP-9 (ng/mL) | 0.791 | 0.690–0.892 | <0.0001 | 100 | 60 | 0.09 vs. TIMP-1 | |
| 92.14 | 0.0005 vs. CD147 | ||||||
| 0.0049 vs. MMP-9/TIMP-1 | |||||||
| TIMP-1 (ng/mL) | 0.875 | 0.801–0.949 | <0.0001 | 233.80 | 90 | 75 | <0.0001 vs. CD147 |
| <0.0001 vs. MMP-9/TIMP-1 | |||||||
| CD147 (pg/mL) | 0.541 | 0.415–0.667 | 0.490 | / | / | / | 0.6995 vs. MMP-9/TIMP-1 |
| MMP-9/TIMP ratio | 0.491 | 0.366–0.615 | 0.877 | / | / | / | / |
Disclaimer/Publisher’s Note: The statements, opinions and data contained in all publications are solely those of the individual author(s) and contributor(s) and not of MDPI and/or the editor(s). MDPI and/or the editor(s) disclaim responsibility for any injury to people or property resulting from any ideas, methods, instructions or products referred to in the content. |
© 2024 by the authors. Licensee MDPI, Basel, Switzerland. This article is an open access article distributed under the terms and conditions of the Creative Commons Attribution (CC BY) license (https://creativecommons.org/licenses/by/4.0/).
Share and Cite
Bašić, J.; Milošević, V.; Djordjević, B.; Stojiljković, V.; Živanović, M.; Stefanović, N.; Aracki Trenkić, A.; Stojanov, D.; Jevtović Stoimenov, T.; Stojanović, I. Matrix Remodeling Enzymes as Potential Fluid Biomarkers of Neurodegeneration in Alzheimer’s Disease. Int. J. Mol. Sci. 2024, 25, 5703. https://doi.org/10.3390/ijms25115703
Bašić J, Milošević V, Djordjević B, Stojiljković V, Živanović M, Stefanović N, Aracki Trenkić A, Stojanov D, Jevtović Stoimenov T, Stojanović I. Matrix Remodeling Enzymes as Potential Fluid Biomarkers of Neurodegeneration in Alzheimer’s Disease. International Journal of Molecular Sciences. 2024; 25(11):5703. https://doi.org/10.3390/ijms25115703
Chicago/Turabian StyleBašić, Jelena, Vuk Milošević, Branka Djordjević, Vladana Stojiljković, Milica Živanović, Nikola Stefanović, Aleksandra Aracki Trenkić, Dragan Stojanov, Tatjana Jevtović Stoimenov, and Ivana Stojanović. 2024. "Matrix Remodeling Enzymes as Potential Fluid Biomarkers of Neurodegeneration in Alzheimer’s Disease" International Journal of Molecular Sciences 25, no. 11: 5703. https://doi.org/10.3390/ijms25115703
APA StyleBašić, J., Milošević, V., Djordjević, B., Stojiljković, V., Živanović, M., Stefanović, N., Aracki Trenkić, A., Stojanov, D., Jevtović Stoimenov, T., & Stojanović, I. (2024). Matrix Remodeling Enzymes as Potential Fluid Biomarkers of Neurodegeneration in Alzheimer’s Disease. International Journal of Molecular Sciences, 25(11), 5703. https://doi.org/10.3390/ijms25115703