

ULK2 Is a Key Pro-Autophagy Protein That Contributes to the High Chemoresistance and Disease Relapse in FLT3-Mutated Acute Myeloid Leukemia

 , ,
, ,  and
and 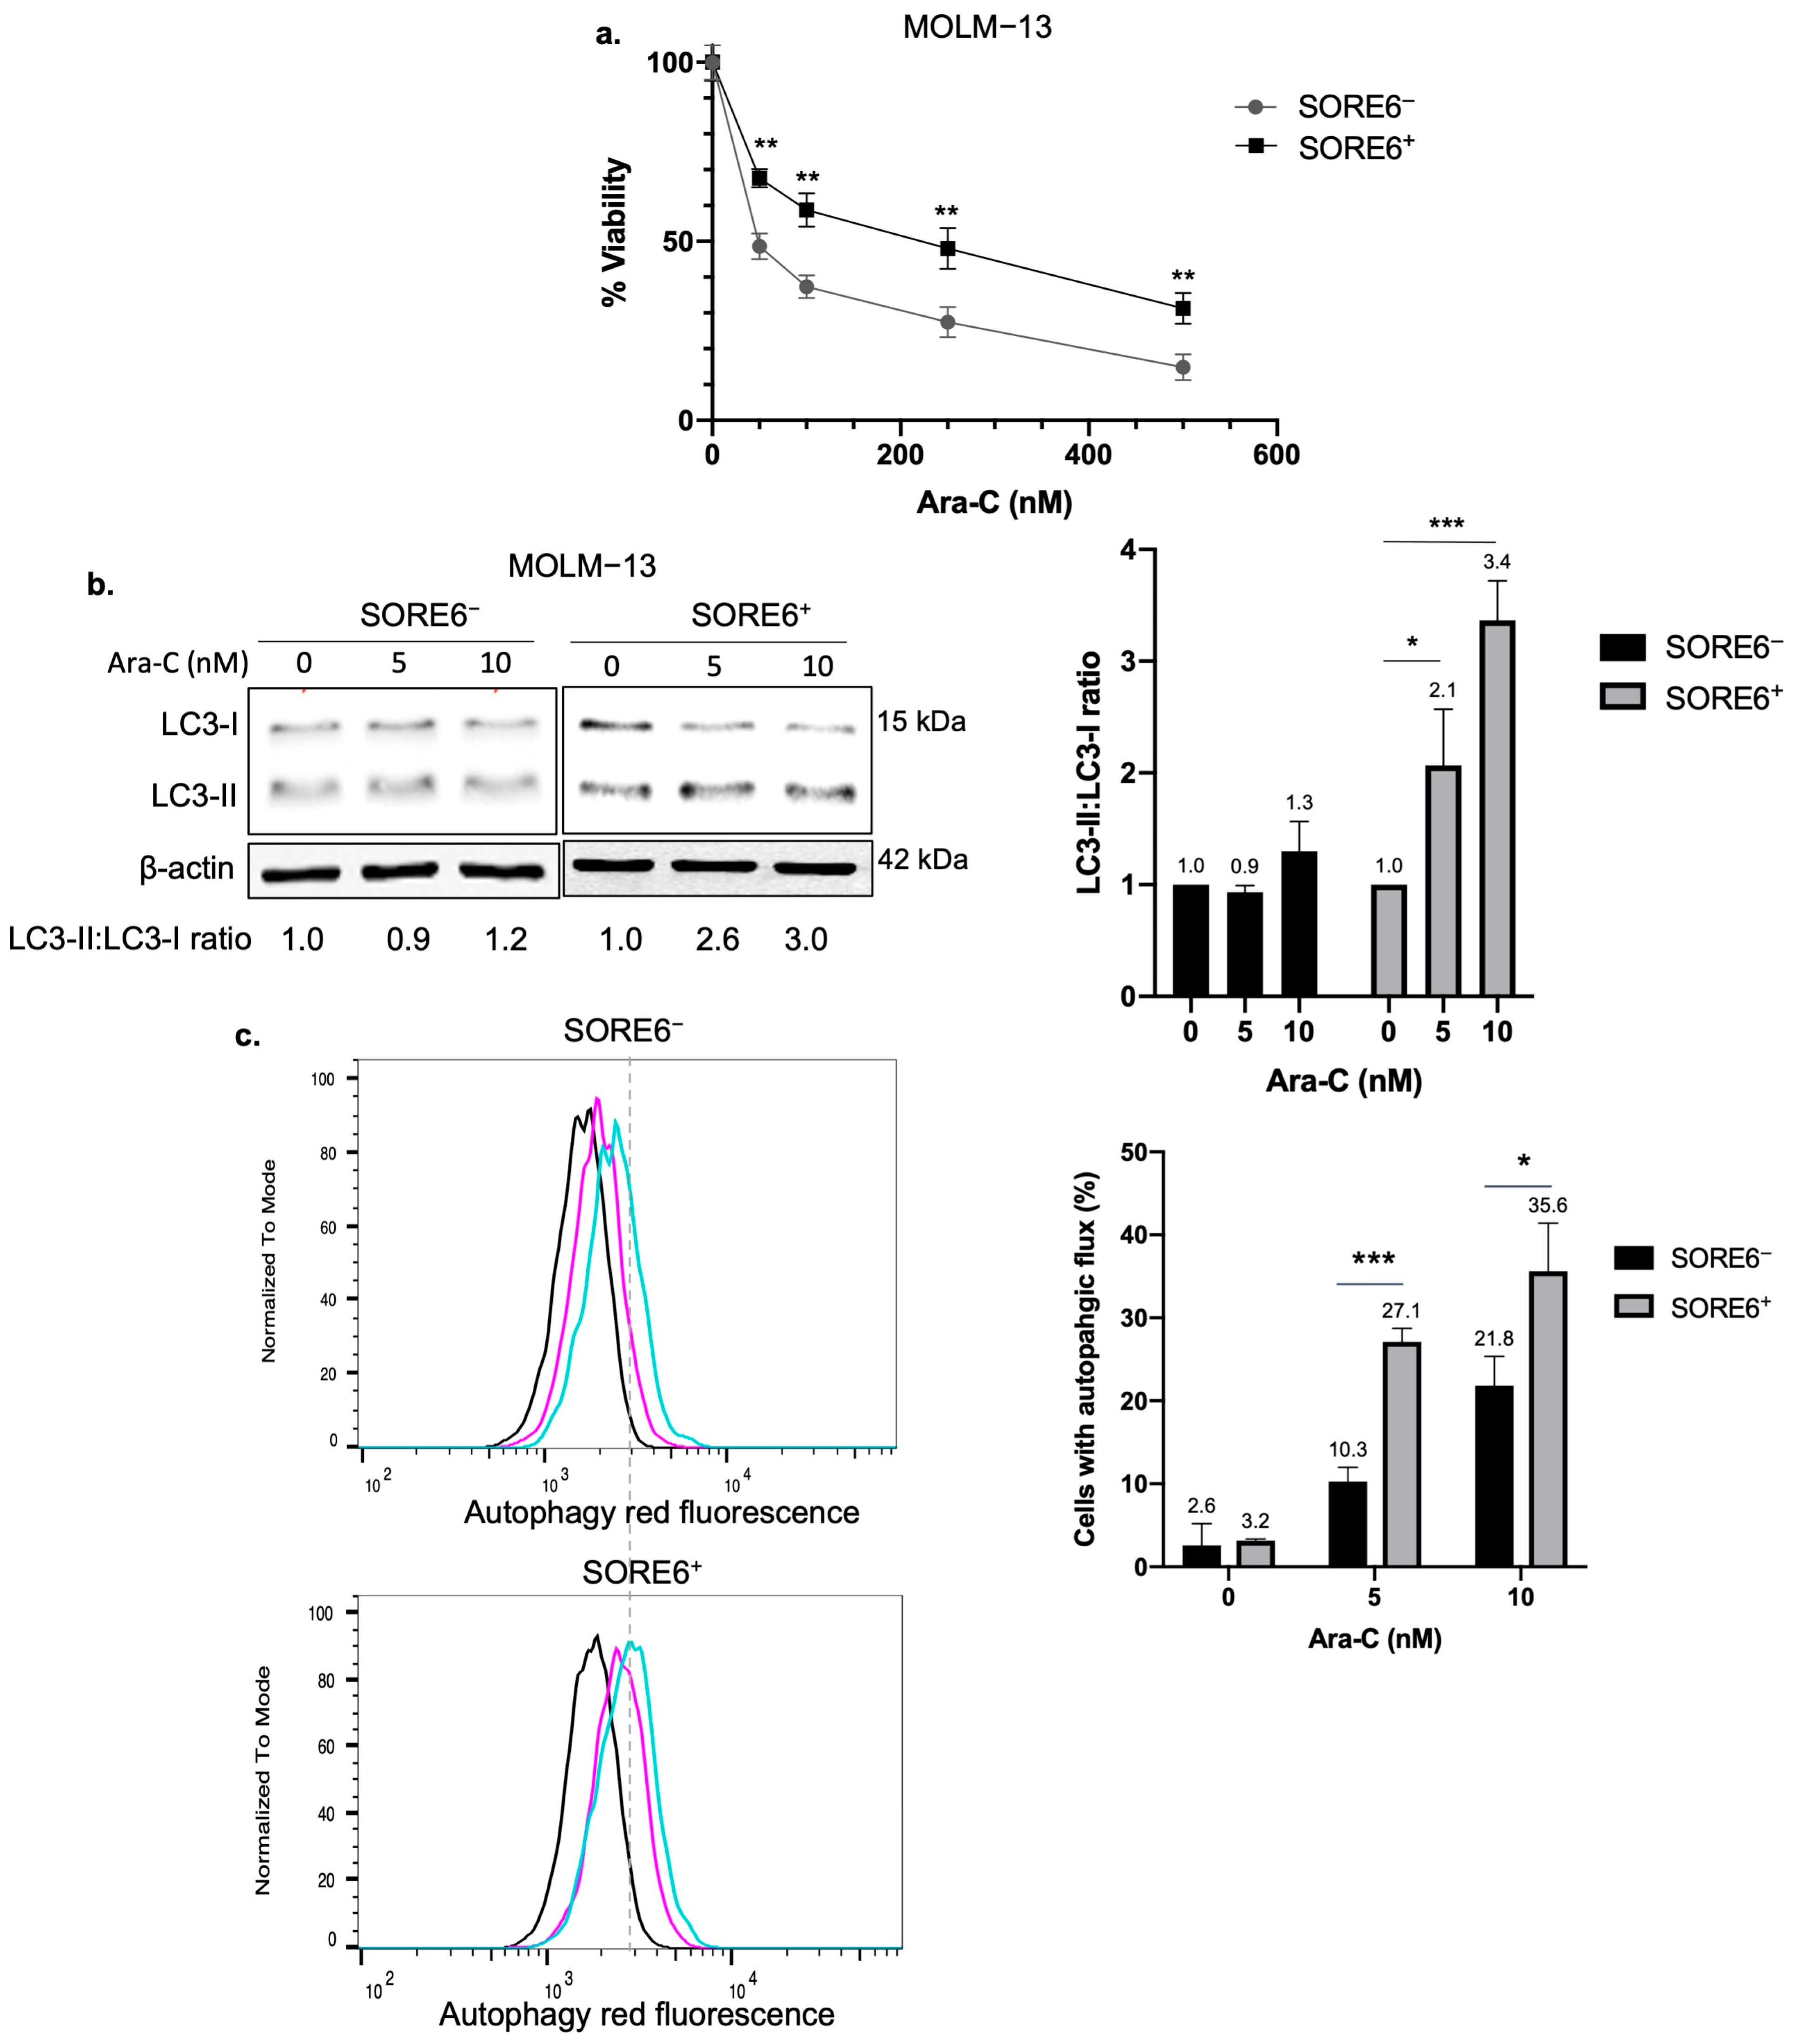
Abstract
1. Introduction
2. Results
2.1. SORE6+ Cells Exhibit Higher Autophagic Flux than SORE6− Cells
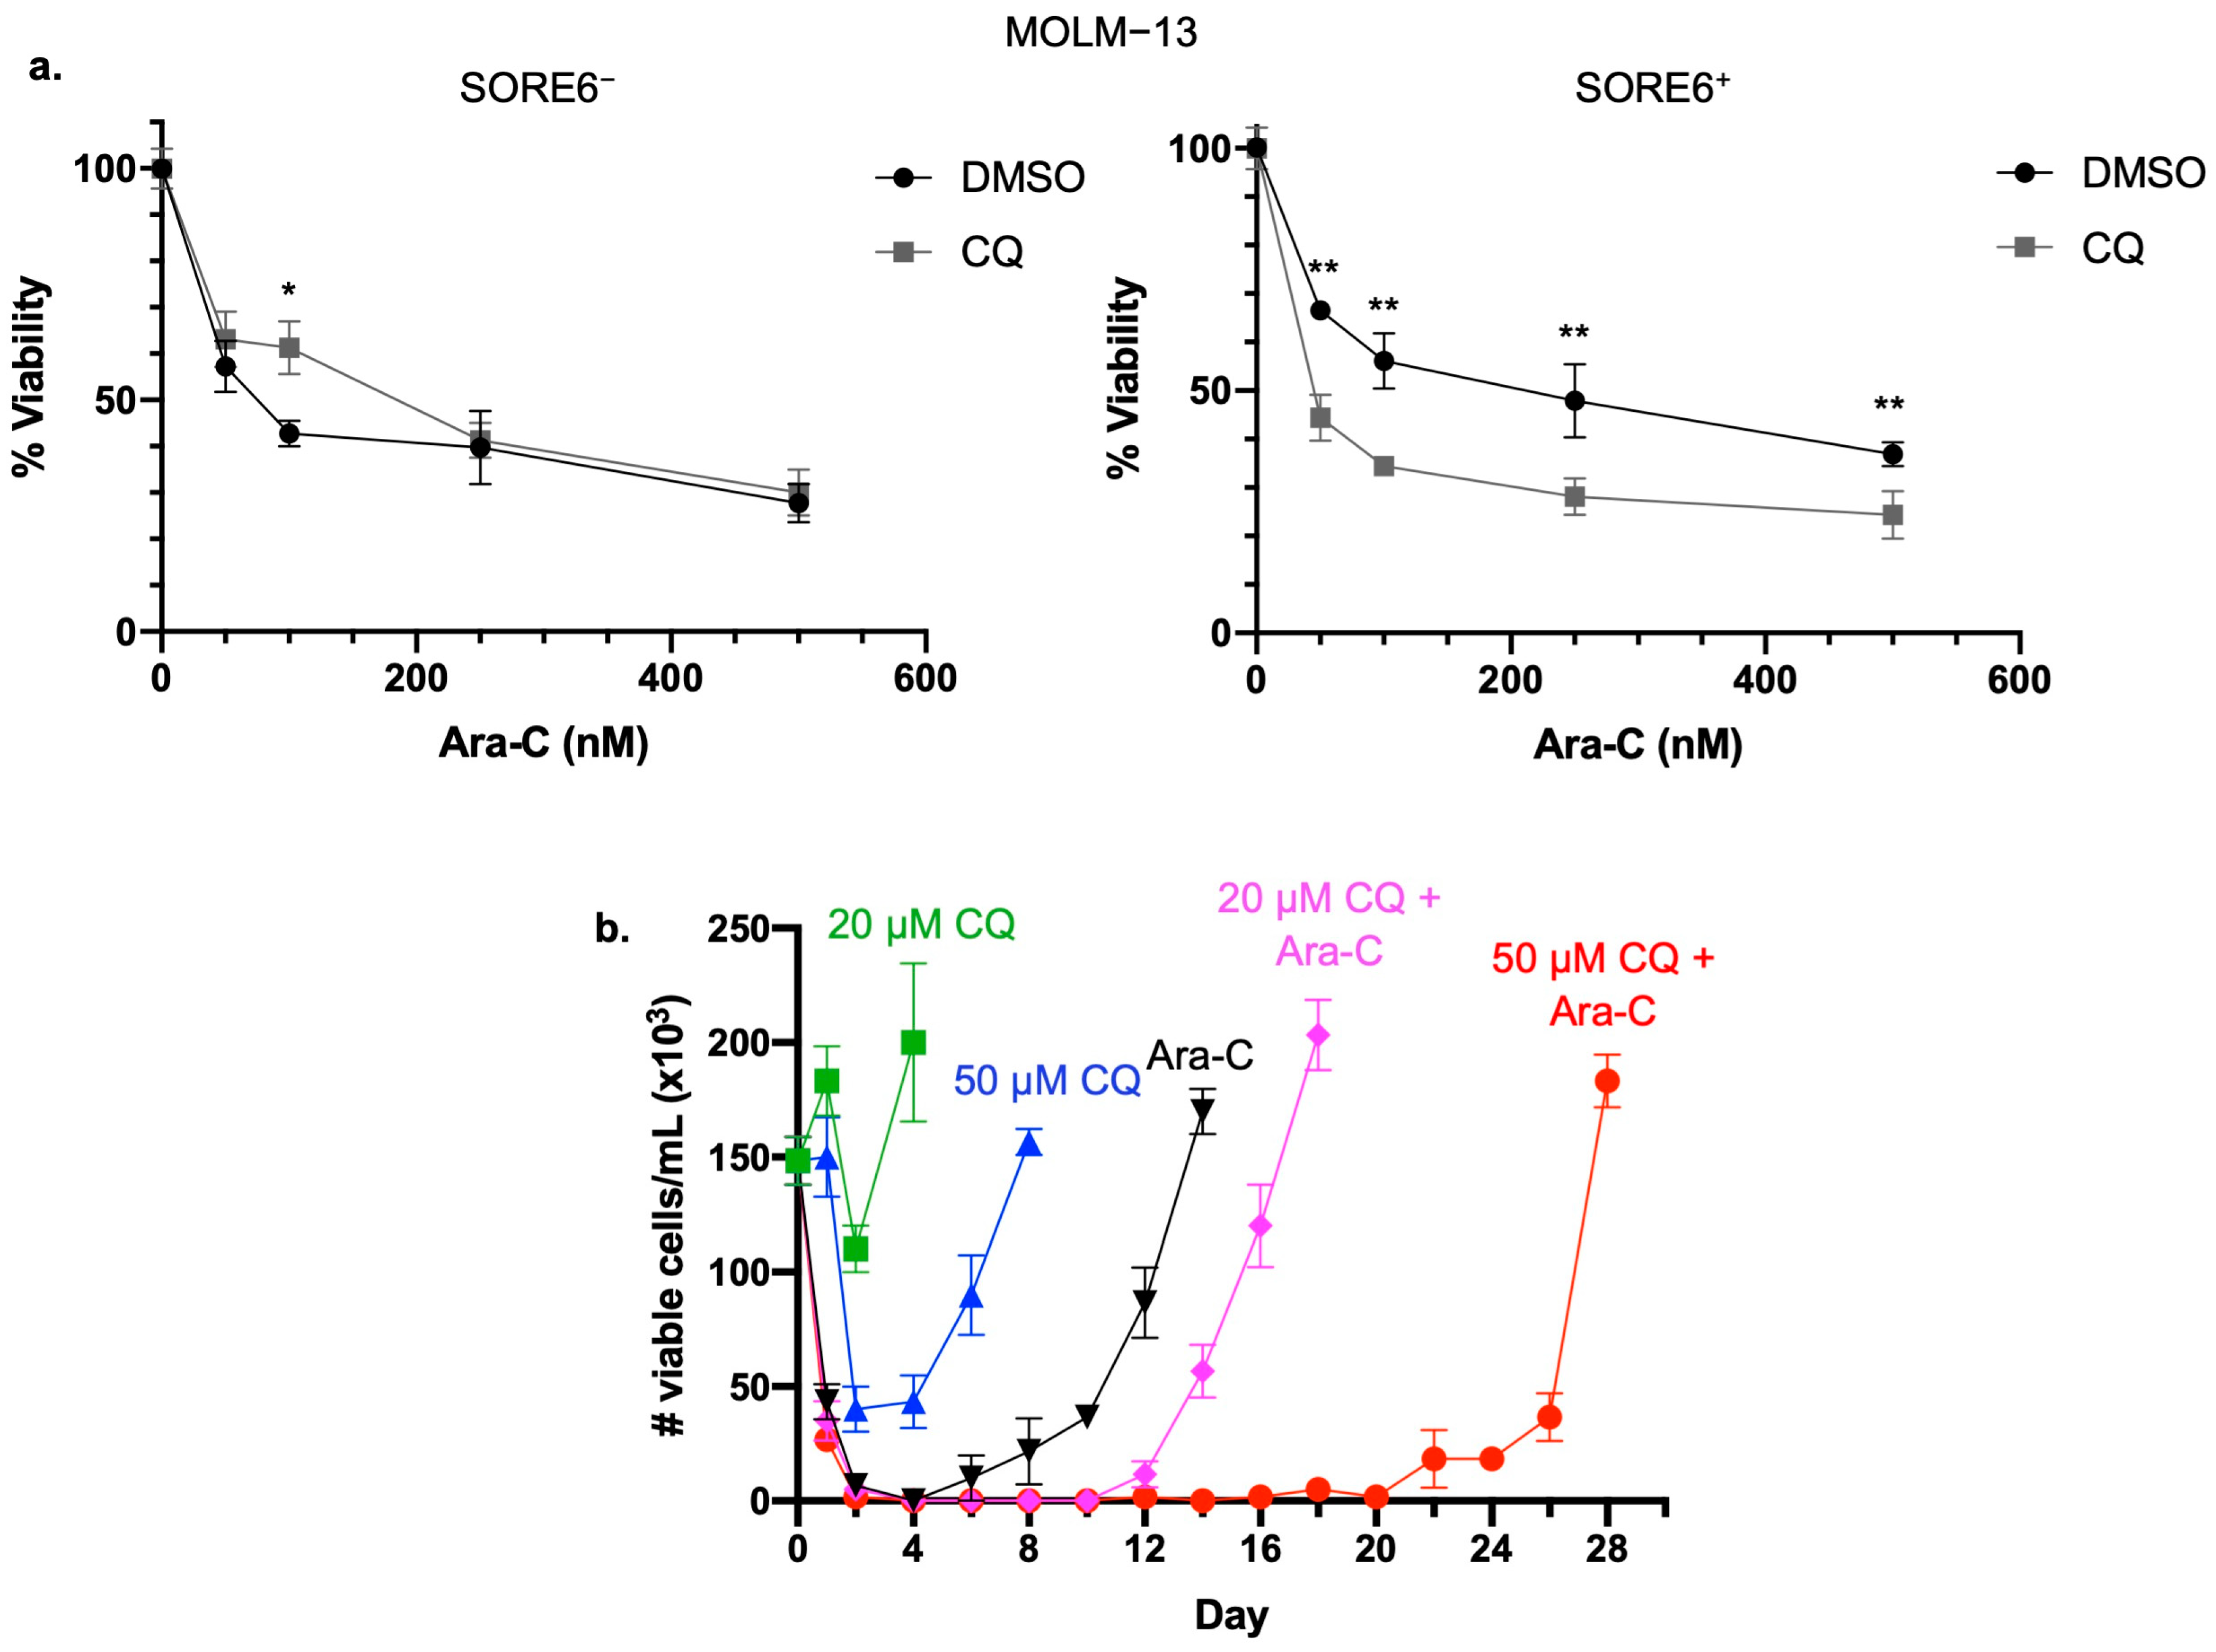
2.2. Inhibition of Autophagy Sensitizes SORE6+ Cells to Ara-C
2.3. Inhibition of Autophagy Prolongs Time to In Vitro Relapse
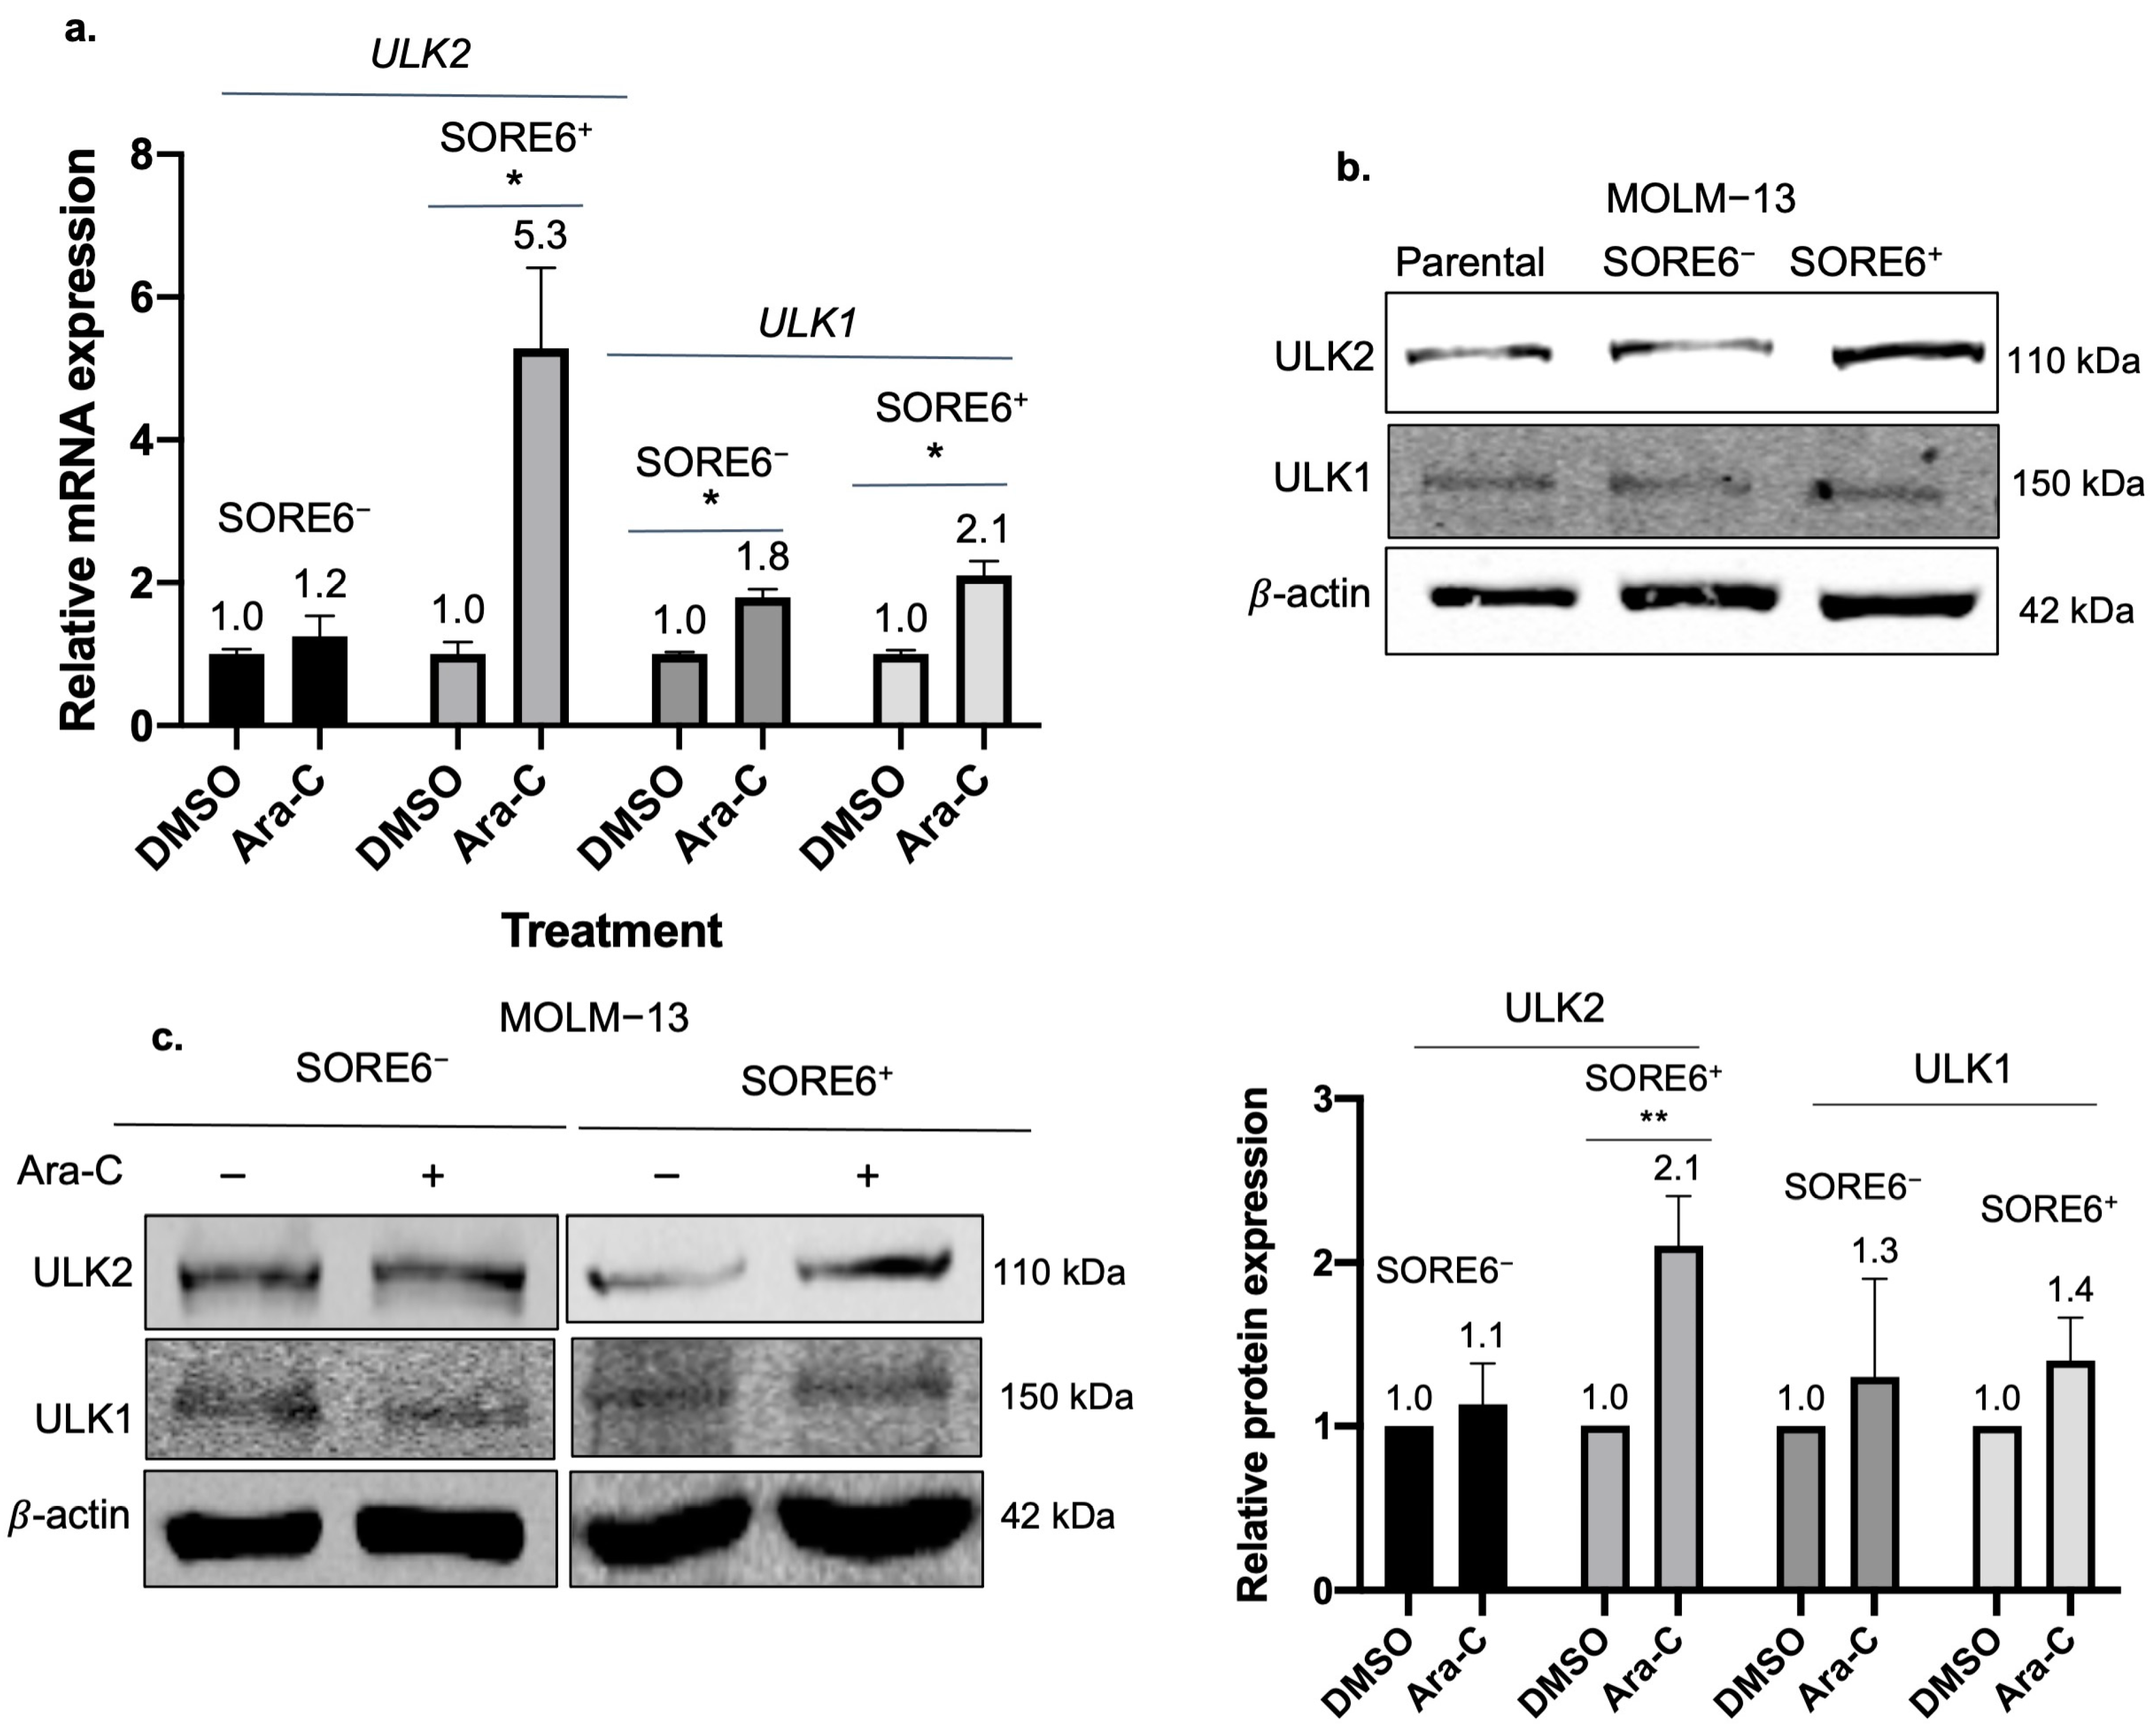
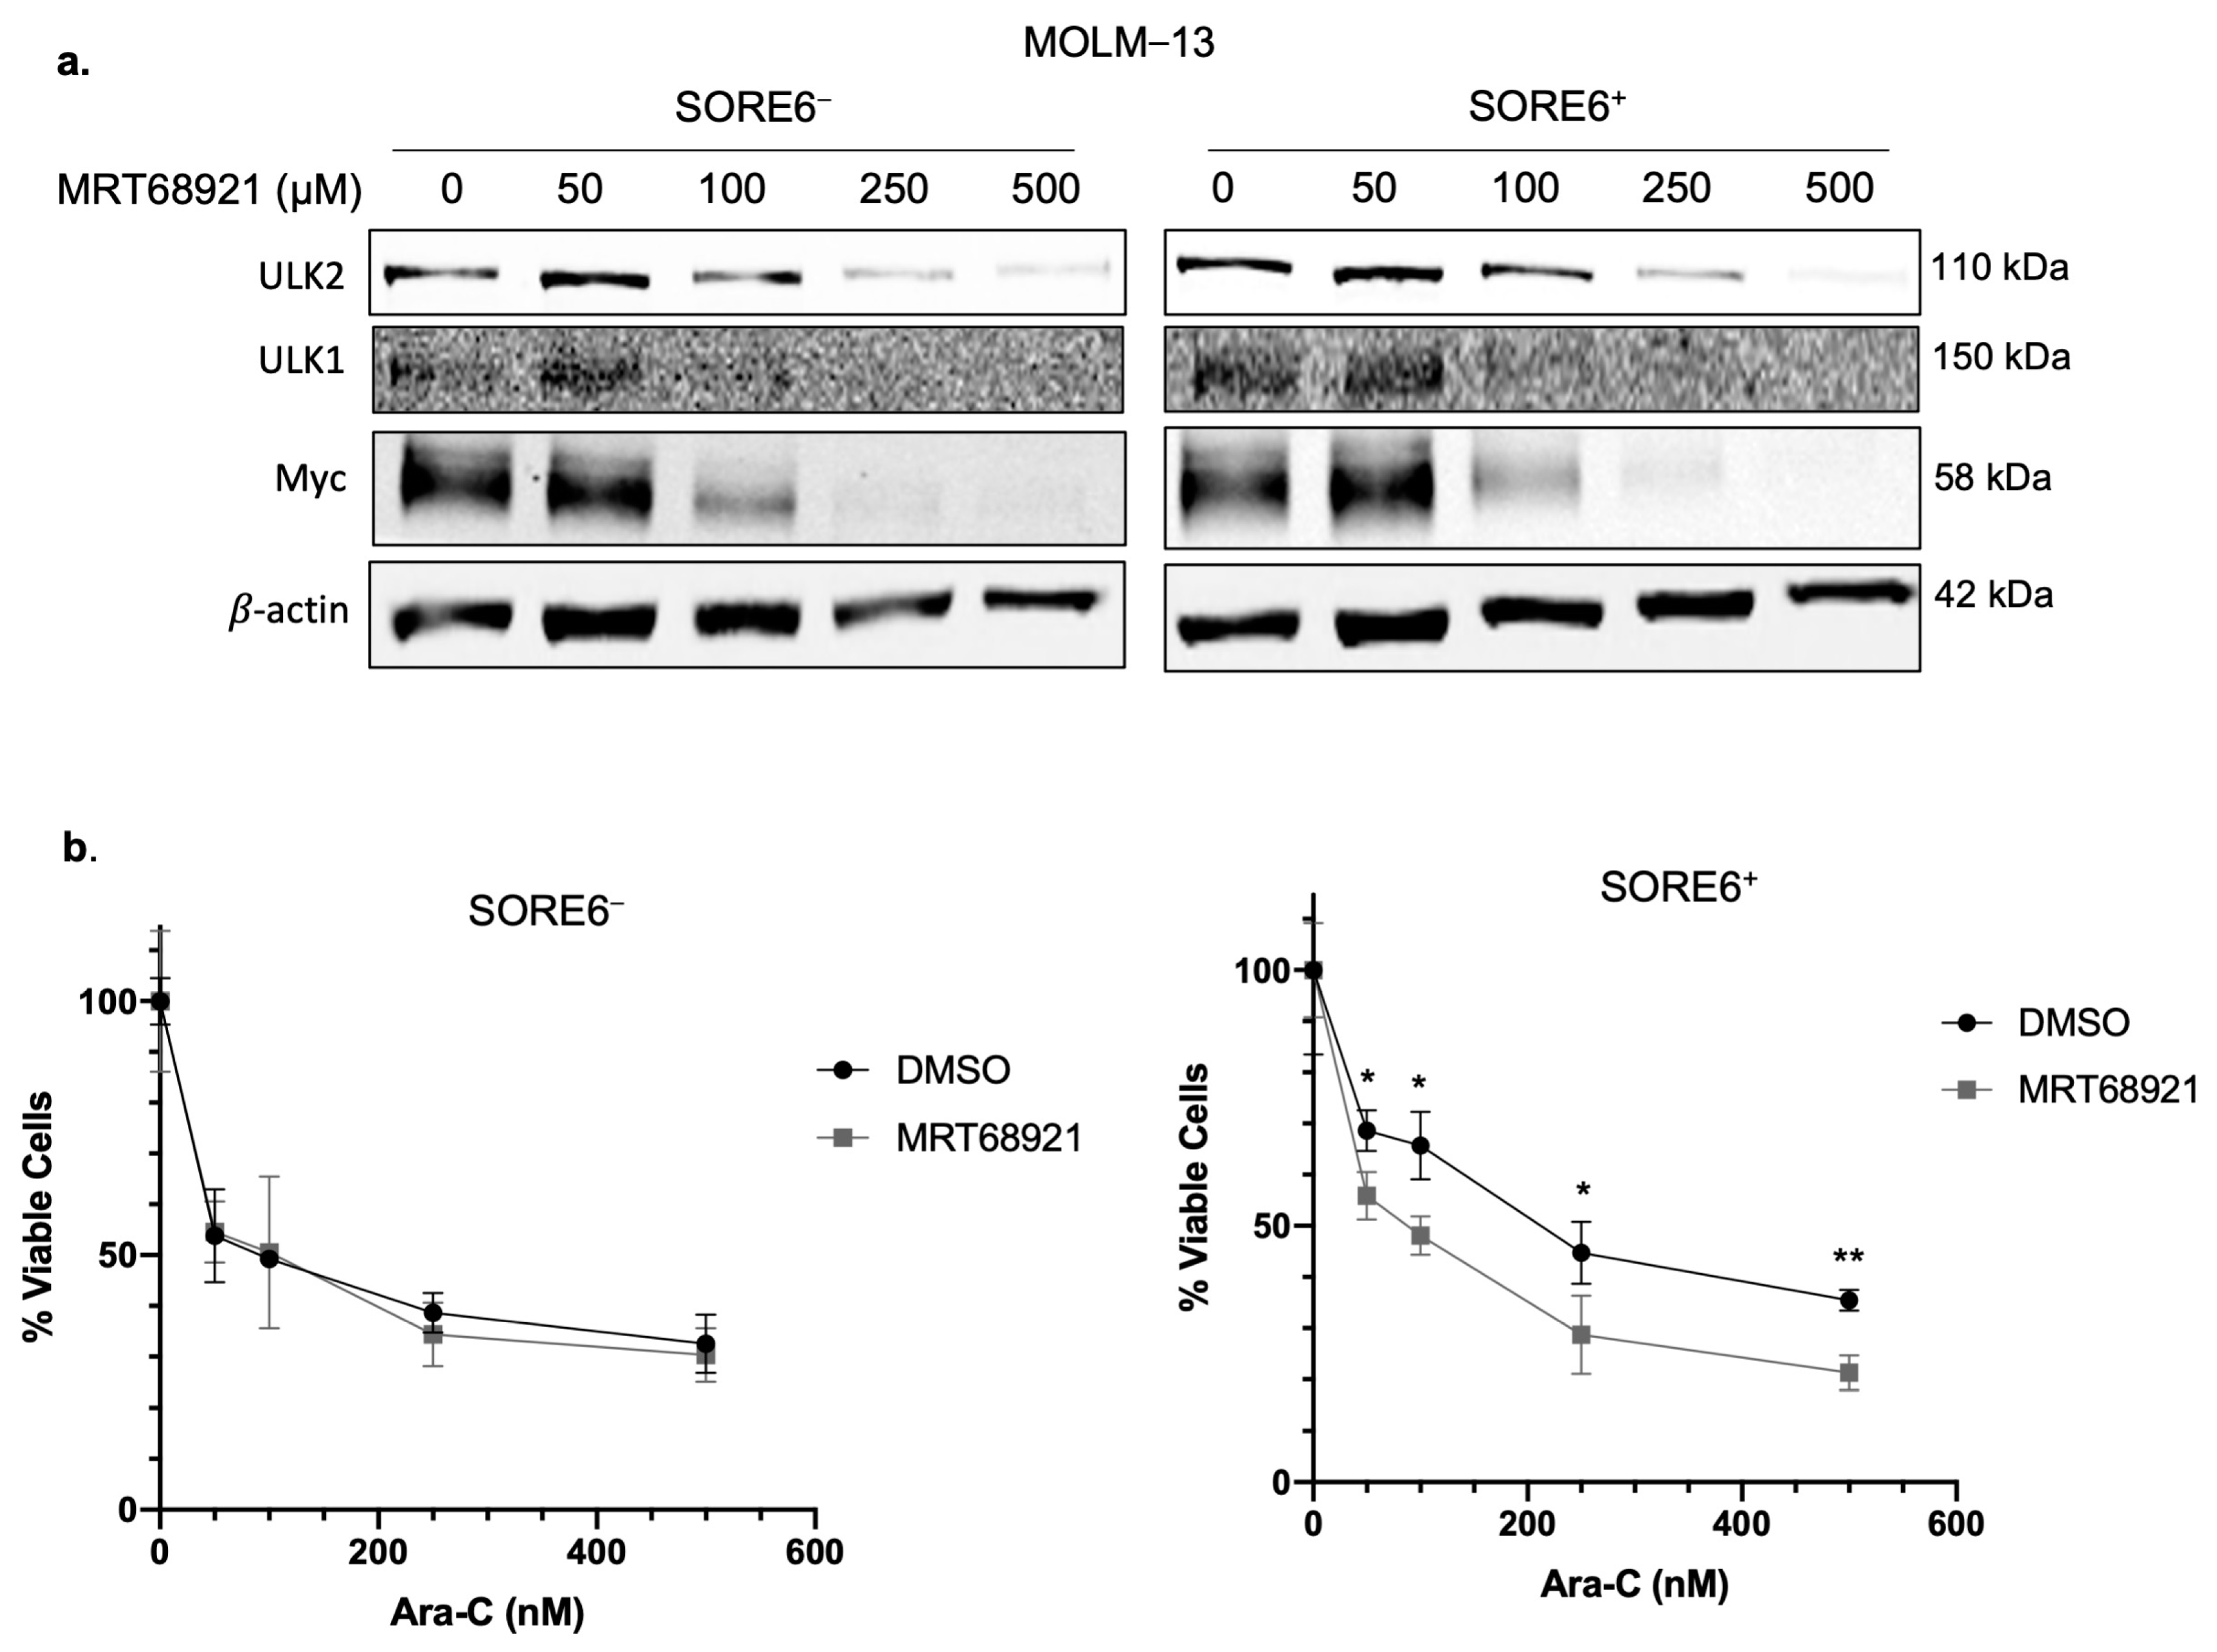
2.4. ULK2 Is a Key Regulator of the Autophagic Flux in SORE6+ Cells
2.5. ULK2 Inhibition Sensitizes SORE6+ Cells to Ara-C Treatment
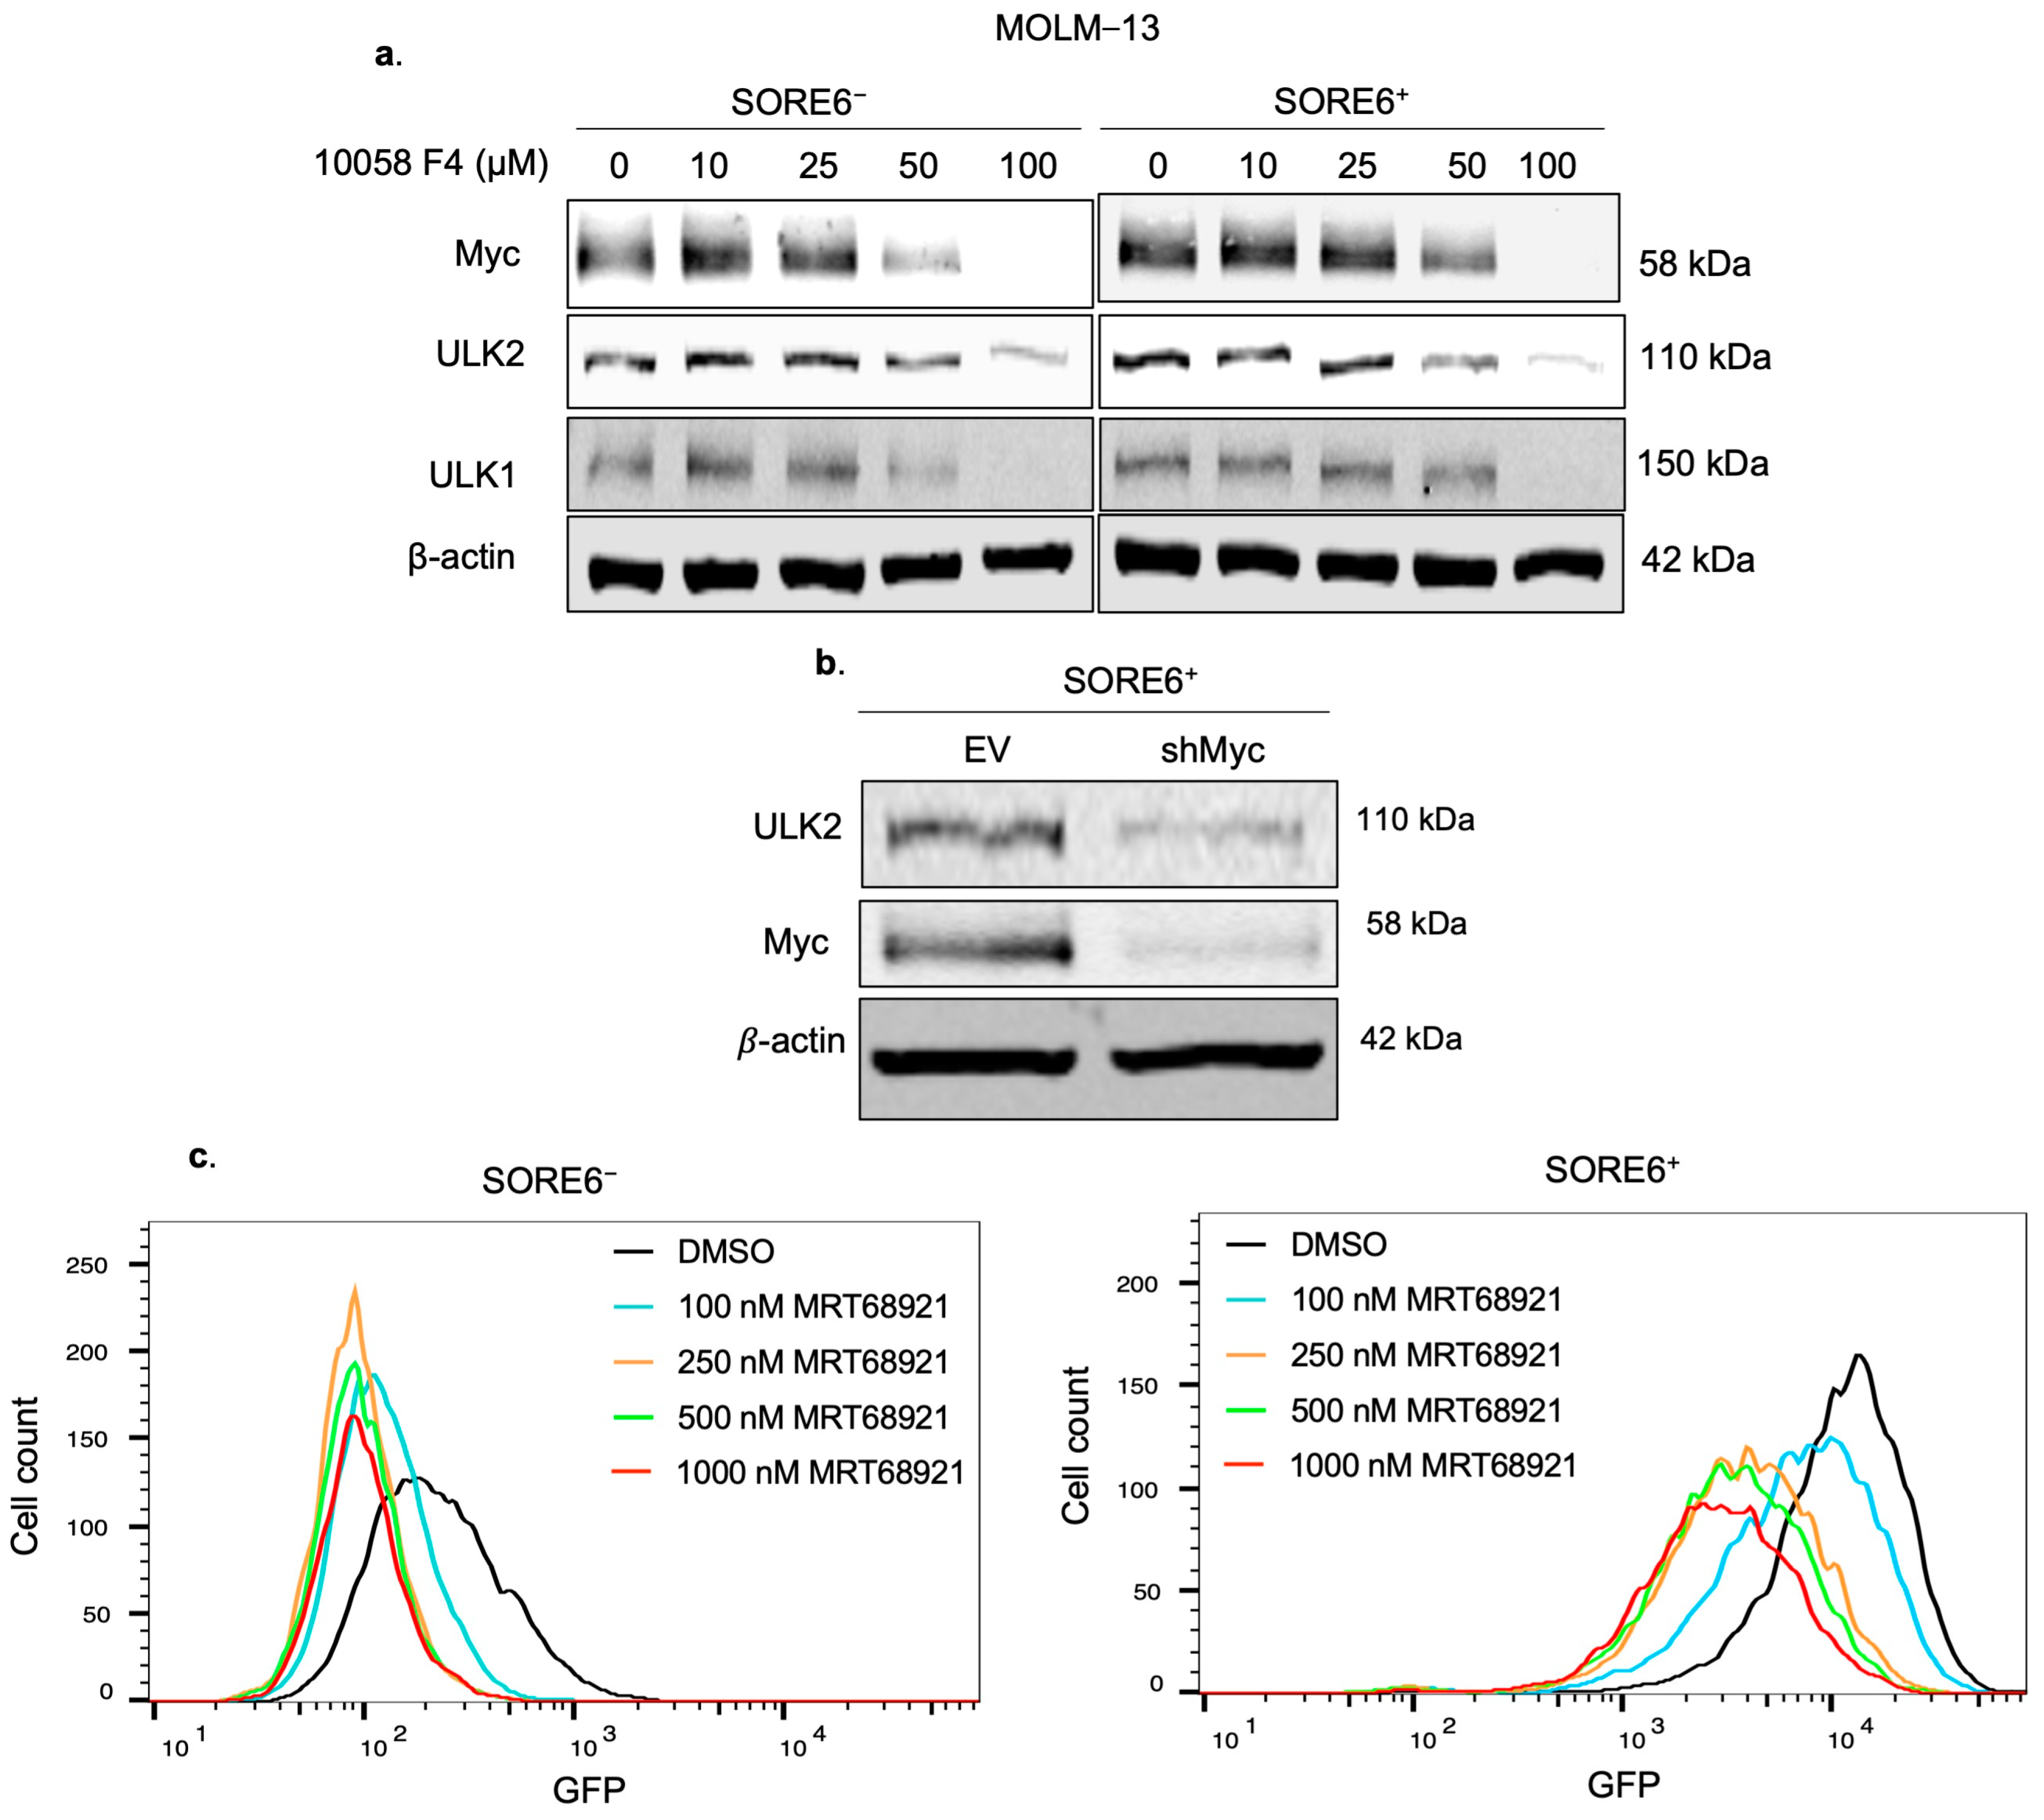
2.6. ULK2 and Myc Form a Positive Feedback Loop
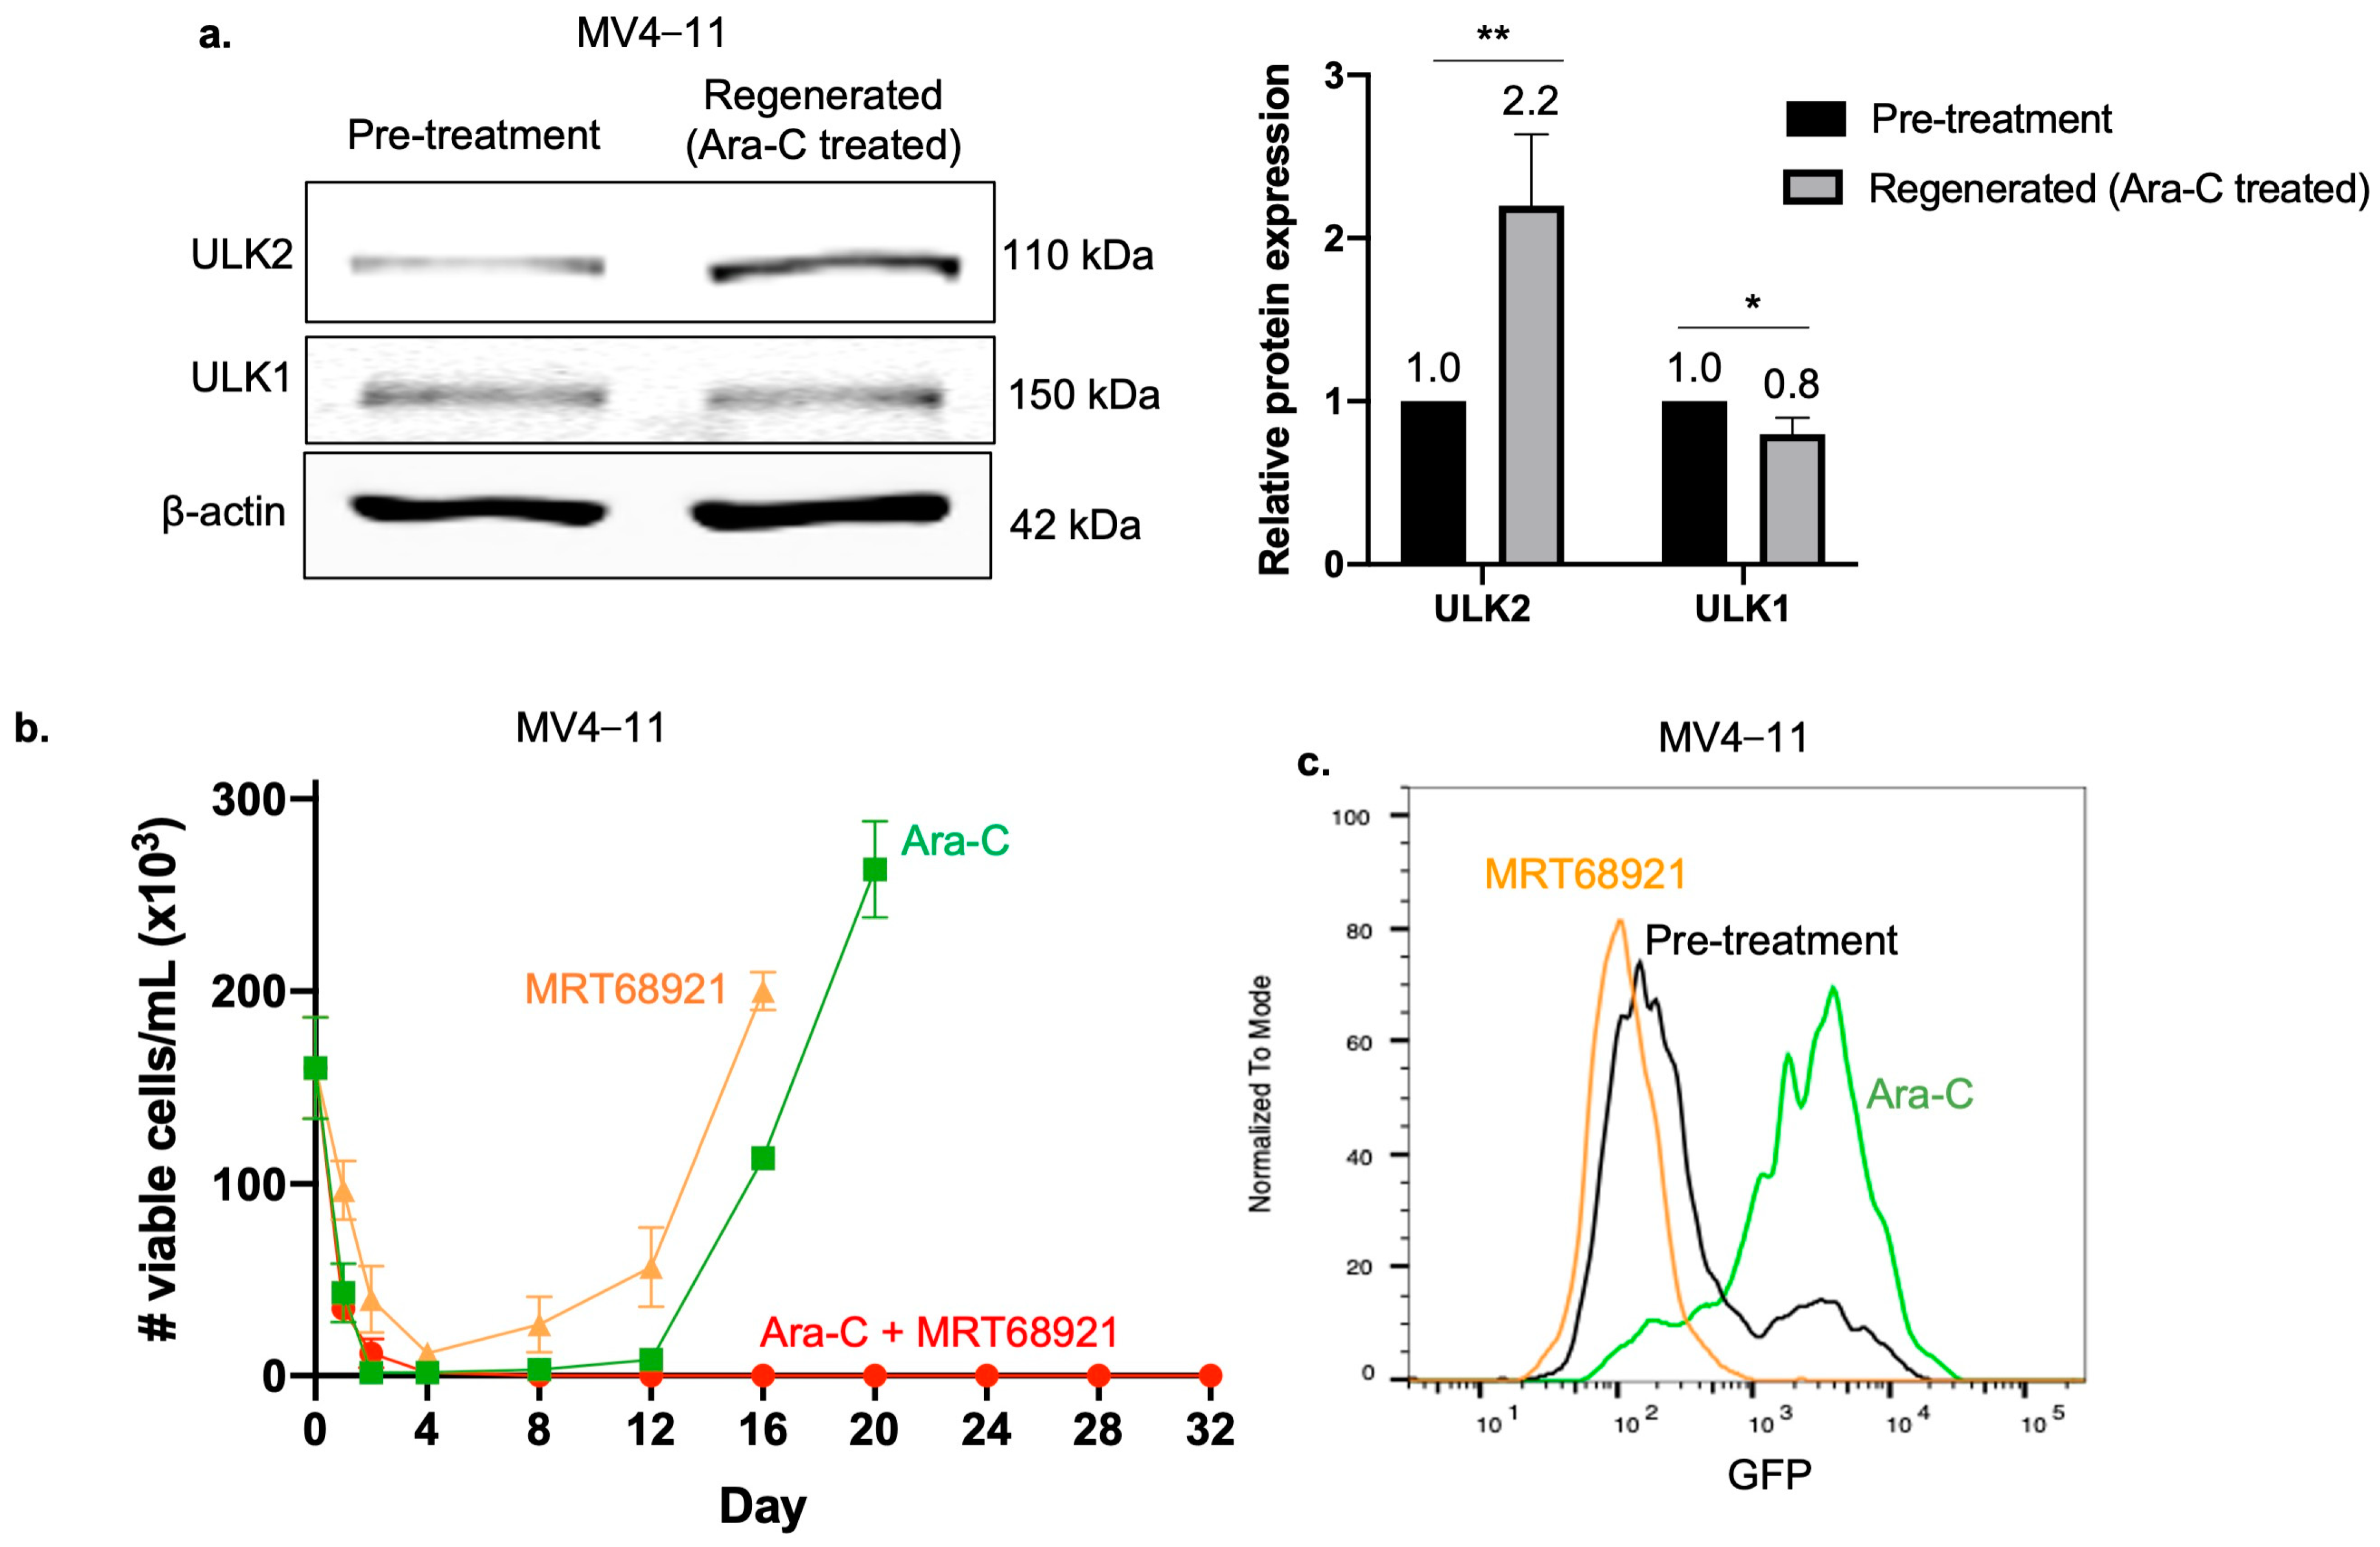
2.7. ULK2 Is Critical for the Regeneration of Ara-C Treated Cells
2.8. Relapsed Bone Marrow Samples Express Higher ULK2 Compared with Initially Diagnosed Specimens
3. Discussion
4. Materials and Methods
4.1. Generation of SORE6− and SORE6+ Cell Clones and Cell Culture
4.2. Antibodies and Drug Treatments
4.3. Western Blot
4.4. Autophagy Assay Red Detection Kit
4.5. Cell Viability Assay
4.6. RNA Extraction and Quantitative Real-Time Polymerase Chain Reaction
- ULK1 F-5-CCTCGCCAAGTCTCAGACGC-3 & R-5-CCCCACCGTTGCAGTACTCC-3
- ULK2 F-5-CTCCTCAGGTTCTCCAGTGC-3 & R-5-TTGGTGGGAGAAGTTCCAAG-3
- GAPDH F-5-GGAGCGAGATCCCTCCAAAAT-3 & R-5-GGCTGTTGTCATACTTCTCATGG-3
4.7. Autophagy Array
4.8. In Vitro AML Relapse Model for Relapses
4.9. Patient Samples
4.10. Statistical Analysis
Supplementary Materials
Author Contributions
Funding
Institutional Review Board Statement
Informed Consent Statement
Data Availability Statement
Acknowledgments
Conflicts of Interest
References
- Vetrie, D.; Helgason, G.V.; Copland, M. The leukaemia stem cell: Similarities, differences and clinical prospects in CML and AML. Nat. Rev. Cancer 2020, 20, 158–173. [Google Scholar] [CrossRef] [PubMed]
- Ram, R.; Scheid, C.; Amit, O.; Chemnitz, J.M.; Moshe, Y.; Hallek, M.; Wolf, D.; Avivi, I.; Holtick, U. Sequential therapy for patients with primary refractory acute myeloid leukemia: A historical prospective analysis of the German and Israeli experience. Haematologica 2019, 104, 1798–1803. [Google Scholar] [CrossRef] [PubMed]
- Dohner, H.; Weisdorf, D.J.; Bloomfield, C.D. Acute Myeloid Leukemia. N. Engl. J. Med. 2015, 373, 1136–1152. [Google Scholar] [CrossRef] [PubMed]
- Li, X.; Lewis, M.T.; Huang, J.; Gutierrez, C.; Osborne, C.K.; Wu, M.F.; Hilsenbeck, S.G.; Pavlick, A.; Zhang, X.; Chamness, G.C.; et al. Intrinsic resistance of tumorigenic breast cancer cells to chemotherapy. J. Natl. Cancer Inst. 2008, 100, 672–679. [Google Scholar] [CrossRef] [PubMed]
- Tang, B.; Raviv, A.; Esposito, D.; Flanders, K.C.; Daniel, C.; Nghiem, B.T.; Garfield, S.; Lim, L.; Mannan, P.; Robles, A.I.; et al. A flexible reporter system for direct observation and isolation of cancer stem cells. Stem Cell Rep. 2015, 4, 155–169. [Google Scholar] [CrossRef] [PubMed]
- Lapidot, T.; Sirard, C.; Vormoor, J.; Murdoch, B.; Hoang, T.; Caceres-Cortes, J.; Mindent, M.; Paterson, B.; Caligiuri, M.A.; Dick, J.E. A cell initiating human acute myeloid leukaemia after transplantation into SCID mice. Nature 1994, 367, 4. [Google Scholar] [CrossRef] [PubMed]
- Ho, J.M.; Dobson, S.M.; Voisin, V.; McLeod, J.; Kennedy, J.A.; Mitchell, A.; Jin, L.; Eppert, K.; Bader, G.; Minden, M.D.; et al. CD200 expression marks leukemia stem cells in human AML. Blood Adv. 2020, 4, 5402–5413. [Google Scholar] [CrossRef] [PubMed]
- Clark, D.W.; Palle, K. Aldehyde dehydrogenases in cancer stem cells: Potential as therapeutic targets. Ann. Transl. Med. 2016, 4, 518. [Google Scholar] [CrossRef]
- Takahashi, K.; Tanabe, K.; Ohnuki, M.; Narita, M.; Ichisaka, T.; Tomoda, K.; Yamanaka, S. Induction of pluripotent stem cells from adult human fibroblasts by defined factors. Cell 2007, 131, 861–872. [Google Scholar] [CrossRef]
- Pádua, D.; Barros, R.; Amaral, A.L.; Mesquita, P.; Freire, A.F.; Sousa, M.; Maia, A.F.; Caiado, I.; Fernandes, H.; Pombinho, A.; et al. A SOX2 Reporter System Identifies Gastric Cancer Stem-Like Cells Sensitive to Monensin. Cancers 2020, 12, 20. [Google Scholar] [CrossRef]
- Vaddi, P.K.; Stamnes, M.A.; Cao, H.; Chen, S. Elimination of SOX2/OCT4-Associated Prostate Cancer Stem Cells Blocks Tumor Development and Enhances Therapeutic Response. Cancers 2019, 11, 1331. [Google Scholar] [CrossRef] [PubMed]
- Li, J.; Haque, M.; Shang, C.; Hassan, B.; Liu, D.; Chen, W.; Lai, R. Identification and Characterization of Cancer Stem-like Cells in ALK-Positive Anaplastic Large Cell Lymphoma Using the SORE6 Reporter. Curr. Issues Mol. Biol. 2021, 43, 543–557. [Google Scholar] [CrossRef] [PubMed]
- Lai, J.; Shang, C.; Chen, W.; Izevbaye, I.; Chu, M.P.; Sandhu, I.; Brandwein, J.; Lai, R.; Wang, P. An In Vitro Model for Acute Myeloid Leukemia Relapse Using the SORE6 Reporter. Int. J. Mol. Sci. 2024, 25, 496. [Google Scholar] [CrossRef]
- Vasconcelos, F.C.; de Souza, P.S.; Hancio, T.; de Faria, F.C.C.; Maia, R.C. Update on drug transporter proteins in acute myeloid leukemia: Pathological implication and clinical setting. Crit. Rev. Oncol. Hematol. 2021, 160, 103281. [Google Scholar] [CrossRef] [PubMed]
- Lagadinou, E.D.; Sach, A.; Callahan, K.; Rossi, R.M.; Neering, S.J.; Minhajuddin, M.; Ashton, J.M.; Pei, S.; Grose, V.; O’Dwyer, K.M.; et al. BCL-2 inhibition targets oxidative phosphorylation and selectively eradicates quiescent human leukemia stem cells. Cell Stem Cell 2013, 12, 329–341. [Google Scholar] [CrossRef] [PubMed]
- Jang, J.E.; Eom, J.I.; Jeung, H.K.; Cheong, J.W.; Lee, J.Y.; Kim, J.S.; Min, Y.H. AMPK-ULK1-Mediated Autophagy Confers Resistance to BET Inhibitor JQ1 in Acute Myeloid Leukemia Stem Cells. Clin. Cancer Res. 2017, 23, 2781–2794. [Google Scholar] [CrossRef]
- Mizushima, N.; Ohsumi, Y.; Yoshimori, T. Autophagosome formation in mammalian cells. Cell Struct. Funct. 2002, 27, 421–429. [Google Scholar] [CrossRef]
- Pagotto, A.; Pilotto, G.; Mazzoldi, E.L.; Nicoletto, M.O.; Frezzini, S.; Pasto, A.; Amadori, A. Autophagy inhibition reduces chemoresistance and tumorigenic potential of human ovarian cancer stem cells. Cell Death Dis. 2017, 8, e2943. [Google Scholar] [CrossRef]
- Folkerts, H.; Hilgendorf, S.; Wierenga, A.T.J.; Jaques, J.; Mulder, A.B.; Coffer, P.J.; Schuringa, J.J.; Vellenga, E. Inhibition of autophagy as a treatment strategy for p53 wild-type acute myeloid leukemia. Cell Death Dis. 2017, 8, e2927. [Google Scholar] [CrossRef]
- Mizushima, N. The role of the Atg1/ULK1 complex in autophagy regulation. Curr. Opin. Cell Biol. 2010, 22, 132–139. [Google Scholar] [CrossRef]
- Wong, P.M.; Puente, C.; Ganley, I.G.; Jiang, X. The ULK1 complex: Sensing nutrient signals for autophagy activation. Autophagy 2013, 9, 124–137. [Google Scholar] [CrossRef] [PubMed]
- Ho, C.J.; Gorski, S.M. Molecular Mechanisms Underlying Autophagy-Mediated Treatment Resistance in Cancer. Cancers 2019, 11, 1775. [Google Scholar] [CrossRef] [PubMed]
- Heydt, Q.; Larrue, C.; Saland, E.; Bertoli, S.; Sarry, J.E.; Besson, A.; Manenti, S.; Joffre, C.; Mansat-De Mas, V. Oncogenic FLT3-ITD supports autophagy via ATF4 in acute myeloid leukemia. Oncogene 2018, 37, 787–797. [Google Scholar] [CrossRef] [PubMed]
- Hwang, D.Y.; Eom, J.I.; Jang, J.E.; Jeung, H.K.; Chung, H.; Kim, J.S.; Cheong, J.W.; Min, Y.H. ULK1 inhibition as a targeted therapeutic strategy for FLT3-ITD-mutated acute myeloid leukemia. J. Exp. Clin. Cancer Res. 2020, 39, 85. [Google Scholar] [CrossRef] [PubMed]
- Qiu, S.; Kumar, H.; Yan, C.; Li, H.; Paterson, A.J.; Anderson, N.R.; He, J.; Yang, J.; Xie, M.; Crossman, D.K.; et al. Autophagy inhibition impairs leukemia stem cell function in FLT3-ITD AML but has antagonistic interactions with tyrosine kinase inhibition. Leukemia 2022, 36, 2621–2633. [Google Scholar] [CrossRef] [PubMed]
- Marzagalli, M.; Fontana, F.; Raimondi, M.; Limonta, P. Cancer Stem Cells-Key Players in Tumor Relapse. Cancers 2021, 13, 376. [Google Scholar] [CrossRef] [PubMed]
- Yang, M.C.; Wang, H.C.; Hou, Y.C.; Tung, H.L.; Chiu, T.J.; Shan, Y.S. Blockade of autophagy reduces pancreatic cancer stem cell activity and potentiates the tumoricidal effect of gemcitabine. Mol. Cancer 2015, 14, 179. [Google Scholar] [CrossRef]
- Zhang, D.; Zhao, Q.; Sun, H.; Yin, L.; Wu, J.; Xu, J.; He, T.; Yang, C.; Liang, C. Defective autophagy leads to the suppression of stem-like features of CD271(+) osteosarcoma cells. J. Biomed. Sci. 2016, 23, 82. [Google Scholar] [CrossRef]
- Ng, S.W.; Mitchell, A.; Kennedy, J.A.; Chen, W.C.; McLeod, J.; Ibrahimova, N.; Arruda, A.; Popescu, A.; Gupta, V.; Schimmer, A.D.; et al. A 17-gene stemness score for rapid determination of risk in acute leukaemia. Nature 2016, 540, 433–437. [Google Scholar] [CrossRef]
- Ho, T.C.; LaMere, M.; Stevens, B.M.; Ashton, J.M.; Myers, J.R.; O’Dwyer, K.M.; Liesveld, J.L.; Mendler, J.H.; Guzman, M.; Morrissette, J.D.; et al. Evolution of acute myelogenous leukemia stem cell properties after treatment and progression. Blood 2016, 128, 1671–1678. [Google Scholar] [CrossRef]
- Shlush, L.I.; Mitchell, A.; Heisler, L.; Abelson, S.; Ng, S.W.K.; Trotman-Grant, A.; Medeiros, J.J.F.; Rao-Bhatia, A.; Jaciw-Zurakowsky, I.; Marke, R.; et al. Tracing the origins of relapse in acute myeloid leukaemia to stem cells. Nature 2017, 547, 104–108. [Google Scholar] [CrossRef] [PubMed]
- Chen, M.B.; Ji, X.Z.; Liu, Y.Y.; Zeng, P.; Xu, X.Y.; Ma, R.; Guo, Z.D.; Lu, J.W.; Feng, J.F. Ulk1 over-expression in human gastric cancer is correlated with patients’ T classification and cancer relapse. Oncotarget 2017, 8, 33704–33712. [Google Scholar] [CrossRef] [PubMed]
- Pike, L.R.; Singleton, D.C.; Buffa, F.; Abramczyk, O.; Phadwal, K.; Li, J.L.; Simon, A.K.; Murray, J.T.; Harris, A.L. Transcriptional up-regulation of ULK1 by ATF4 contributes to cancer cell survival. Biochem. J. 2013, 449, 389–400. [Google Scholar] [CrossRef] [PubMed]
- Demeter, A.; Romero-Mulero, M.C.; Csabai, L.; Olbei, M.; Sudhakar, P.; Haerty, W.; Korcsmaros, T. ULK1 and ULK2 are less redundant than previously thought: Computational analysis uncovers distinct regulation and functions of these autophagy induction proteins. Sci. Rep. 2020, 10, 10940. [Google Scholar] [CrossRef] [PubMed]
- Alers, S.; Loffler, A.S.; Wesselborg, S.; Stork, B. The incredible ULKs. Cell Commun. Signal. 2012, 10, 7. [Google Scholar] [CrossRef] [PubMed]
- Zachari, M.; Ganley, I.G. The mammalian ULK1 complex and autophagy initiation. Essays Biochem. 2017, 61, 585–596. [Google Scholar] [CrossRef] [PubMed]
- Lee, E.J.; Tournier, C. The requirement of uncoordinated 51-like kinase 1 (ULK1) and ULK2 in the regulation of autophagy. Autophagy 2011, 7, 689–695. [Google Scholar] [CrossRef]
- Cheong, H.; Lindsten, T.; Wu, J.; Lu, C.; Thompson, C.B. Ammonia-induced autophagy is independent of ULK1/ULK2 kinases. Proc. Natl. Acad. Sci. USA 2011, 108, 11121–11126. [Google Scholar] [CrossRef]
- Kundu, M.; Lindsten, T.; Yang, C.Y.; Wu, J.; Zhao, F.; Zhang, J.; Selak, M.A.; Ney, P.A.; Thompson, C.B. Ulk1 plays a critical role in the autophagic clearance of mitochondria and ribosomes during reticulocyte maturation. Blood 2008, 112, 1493–1502. [Google Scholar] [CrossRef]
- Cheong, H.; Wu, J.; Gonzales, L.K.; Guttentag, S.H.; Thompson, C.B.; Lindsten, T. Analysis of a lung defect in autophagy-deficient mouse strains. Autophagy 2014, 10, 45–56. [Google Scholar] [CrossRef]
- Ro, S.H.; Jung, C.H.; Hahn, W.S.; Xu, X.; Kim, Y.M.; Yun, Y.S.; Park, J.M.; Kim, K.H.; Seo, M.; Ha, T.Y.; et al. Distinct functions of Ulk1 and Ulk2 in the regulation of lipid metabolism in adipocytes. Autophagy 2013, 9, 2103–2114. [Google Scholar] [CrossRef] [PubMed]
- Petherick, K.J.; Conway, O.J.; Mpamhanga, C.; Osborne, S.A.; Kamal, A.; Saxty, B.; Ganley, I.G. Pharmacological inhibition of ULK1 kinase blocks mammalian target of rapamycin (mTOR)-dependent autophagy. J. Biol. Chem. 2015, 290, 28726. [Google Scholar] [CrossRef]
- Chen, Y.; Xie, X.; Wang, C.; Hu, Y.; Zhang, H.; Zhang, L.; Tu, S.; He, Y.; Li, Y. Dual targeting of NUAK1 and ULK1 using the multitargeted inhibitor MRT68921 exerts potent antitumor activities. Cell Death Dis. 2020, 11, 712. [Google Scholar] [CrossRef] [PubMed]
- Xu, R.; Ji, Z.; Xu, C.; Zhu, J. The clinical value of using chloroquine or hydroxychloroquine as autophagy inhibitors in the treatment of cancers: A systematic review and meta-analysis. Medicine 2018, 97, e12912. [Google Scholar] [CrossRef]


Disclaimer/Publisher’s Note: The statements, opinions and data contained in all publications are solely those of the individual author(s) and contributor(s) and not of MDPI and/or the editor(s). MDPI and/or the editor(s) disclaim responsibility for any injury to people or property resulting from any ideas, methods, instructions or products referred to in the content. |
© 2024 by the authors. Licensee MDPI, Basel, Switzerland. This article is an open access article distributed under the terms and conditions of the Creative Commons Attribution (CC BY) license (https://creativecommons.org/licenses/by/4.0/).
Share and Cite
Lai, J.; Yang, C.; Shang, C.; Chen, W.; Chu, M.P.; Brandwein, J.; Lai, R.; Wang, P. ULK2 Is a Key Pro-Autophagy Protein That Contributes to the High Chemoresistance and Disease Relapse in FLT3-Mutated Acute Myeloid Leukemia. Int. J. Mol. Sci. 2024, 25, 646. https://doi.org/10.3390/ijms25010646
Lai J, Yang C, Shang C, Chen W, Chu MP, Brandwein J, Lai R, Wang P. ULK2 Is a Key Pro-Autophagy Protein That Contributes to the High Chemoresistance and Disease Relapse in FLT3-Mutated Acute Myeloid Leukemia. International Journal of Molecular Sciences. 2024; 25(1):646. https://doi.org/10.3390/ijms25010646
Chicago/Turabian StyleLai, Justine, Claire Yang, Chuquan Shang, Will Chen, Michael P. Chu, Joseph Brandwein, Raymond Lai, and Peng Wang. 2024. "ULK2 Is a Key Pro-Autophagy Protein That Contributes to the High Chemoresistance and Disease Relapse in FLT3-Mutated Acute Myeloid Leukemia" International Journal of Molecular Sciences 25, no. 1: 646. https://doi.org/10.3390/ijms25010646
APA StyleLai, J., Yang, C., Shang, C., Chen, W., Chu, M. P., Brandwein, J., Lai, R., & Wang, P. (2024). ULK2 Is a Key Pro-Autophagy Protein That Contributes to the High Chemoresistance and Disease Relapse in FLT3-Mutated Acute Myeloid Leukemia. International Journal of Molecular Sciences, 25(1), 646. https://doi.org/10.3390/ijms25010646