
Comparative Analysis of Differential Cellular Transcriptome and Proteome Regulation by HIV-1 and HIV-2 Pseudovirions in the Early Phase of Infection


 , , ,
, , ,  ,
,  , and
, and 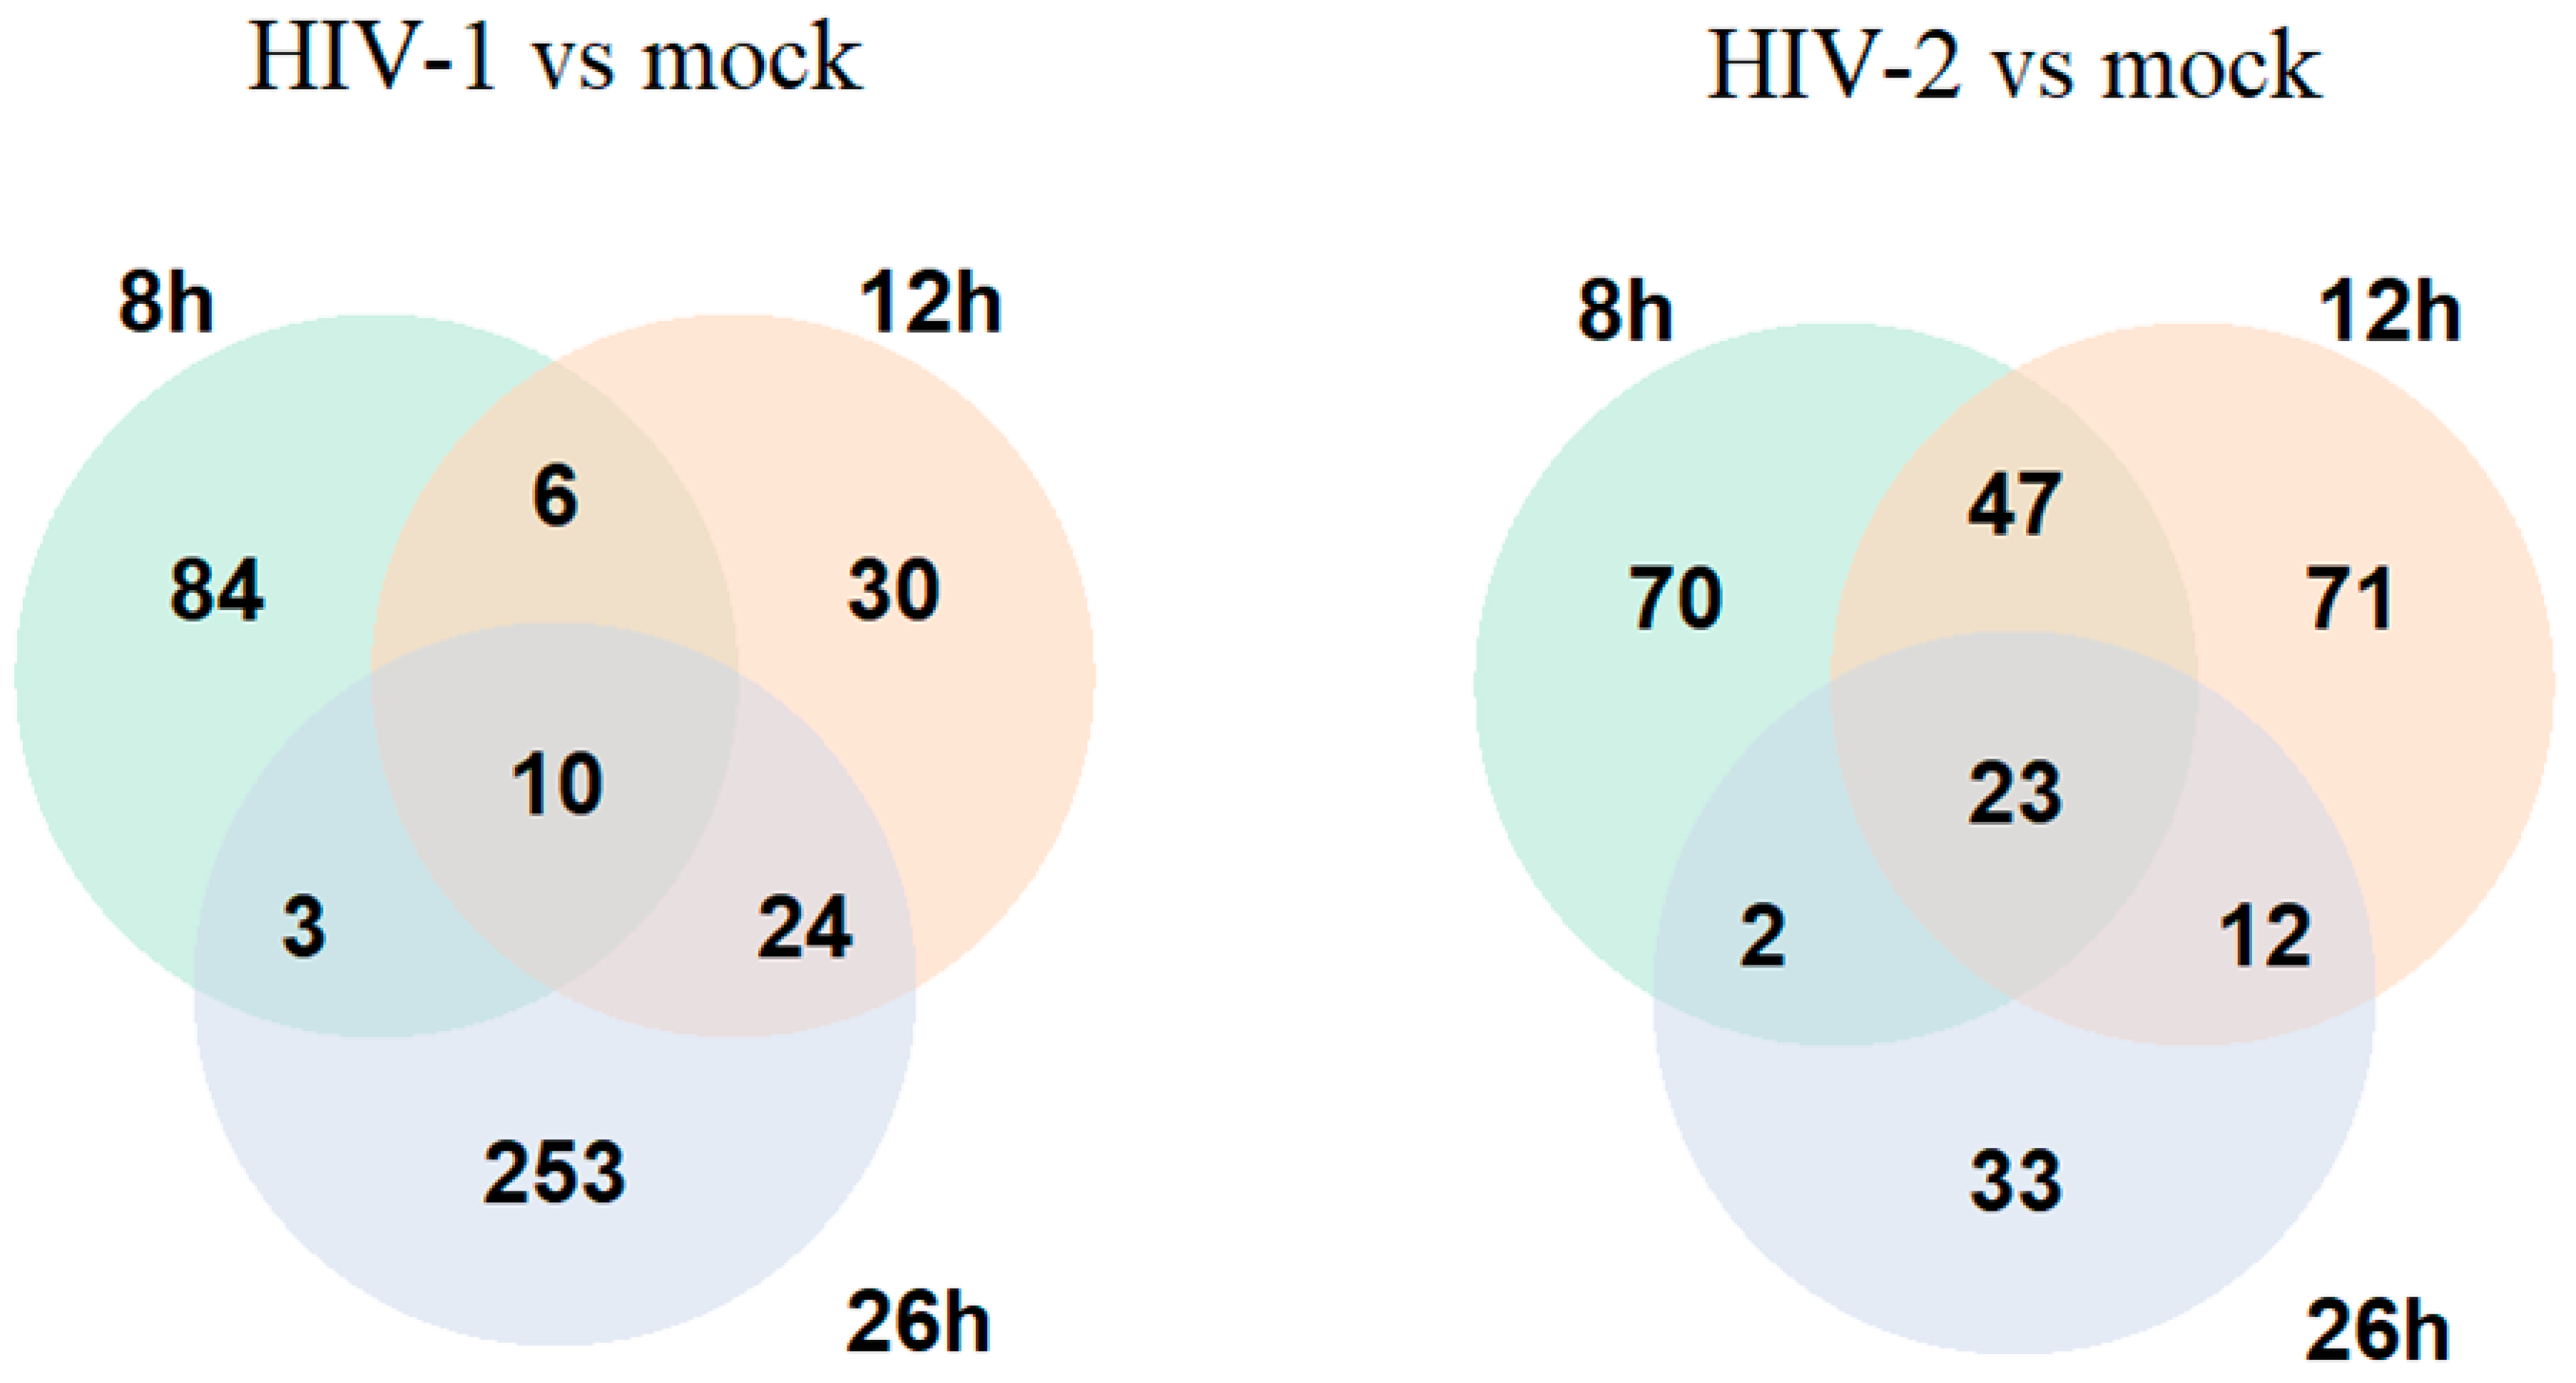
Abstract
:1. Introduction
2. Results
2.1. Transcriptomics
2.1.1. Analysis of Transcriptomic Changes at Different Time-Points Following HIV-1 and -2 Transduction
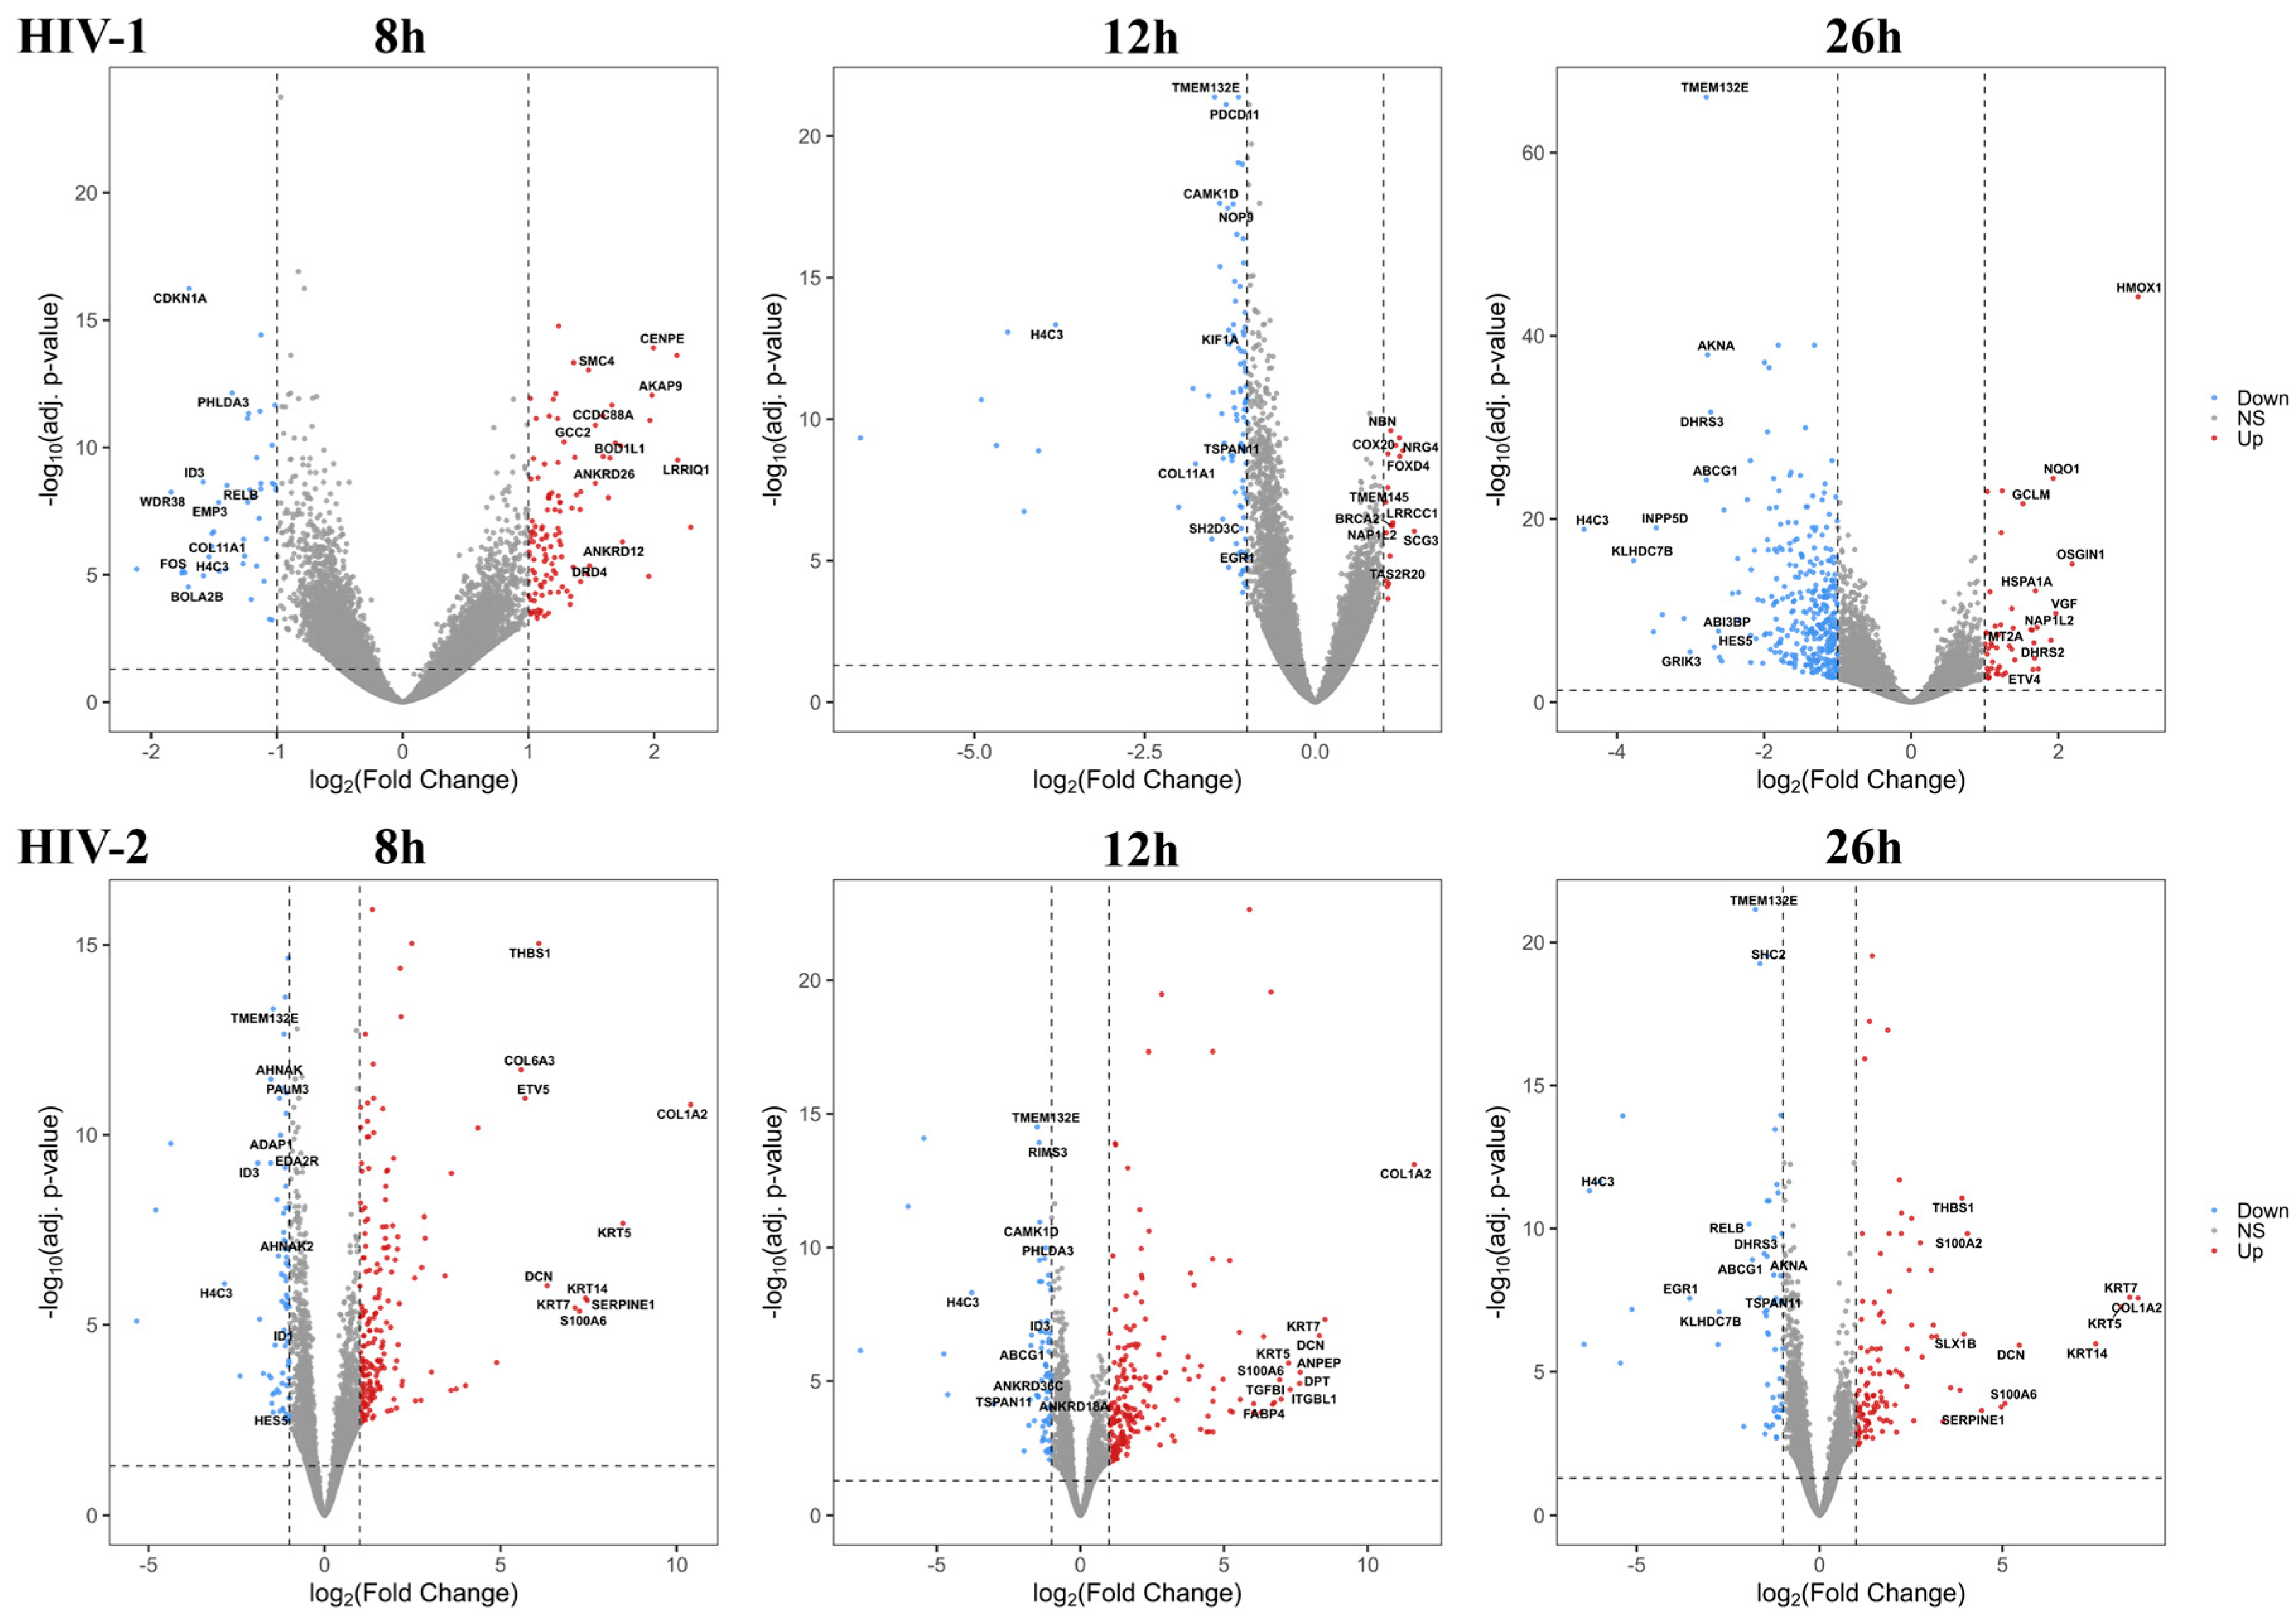
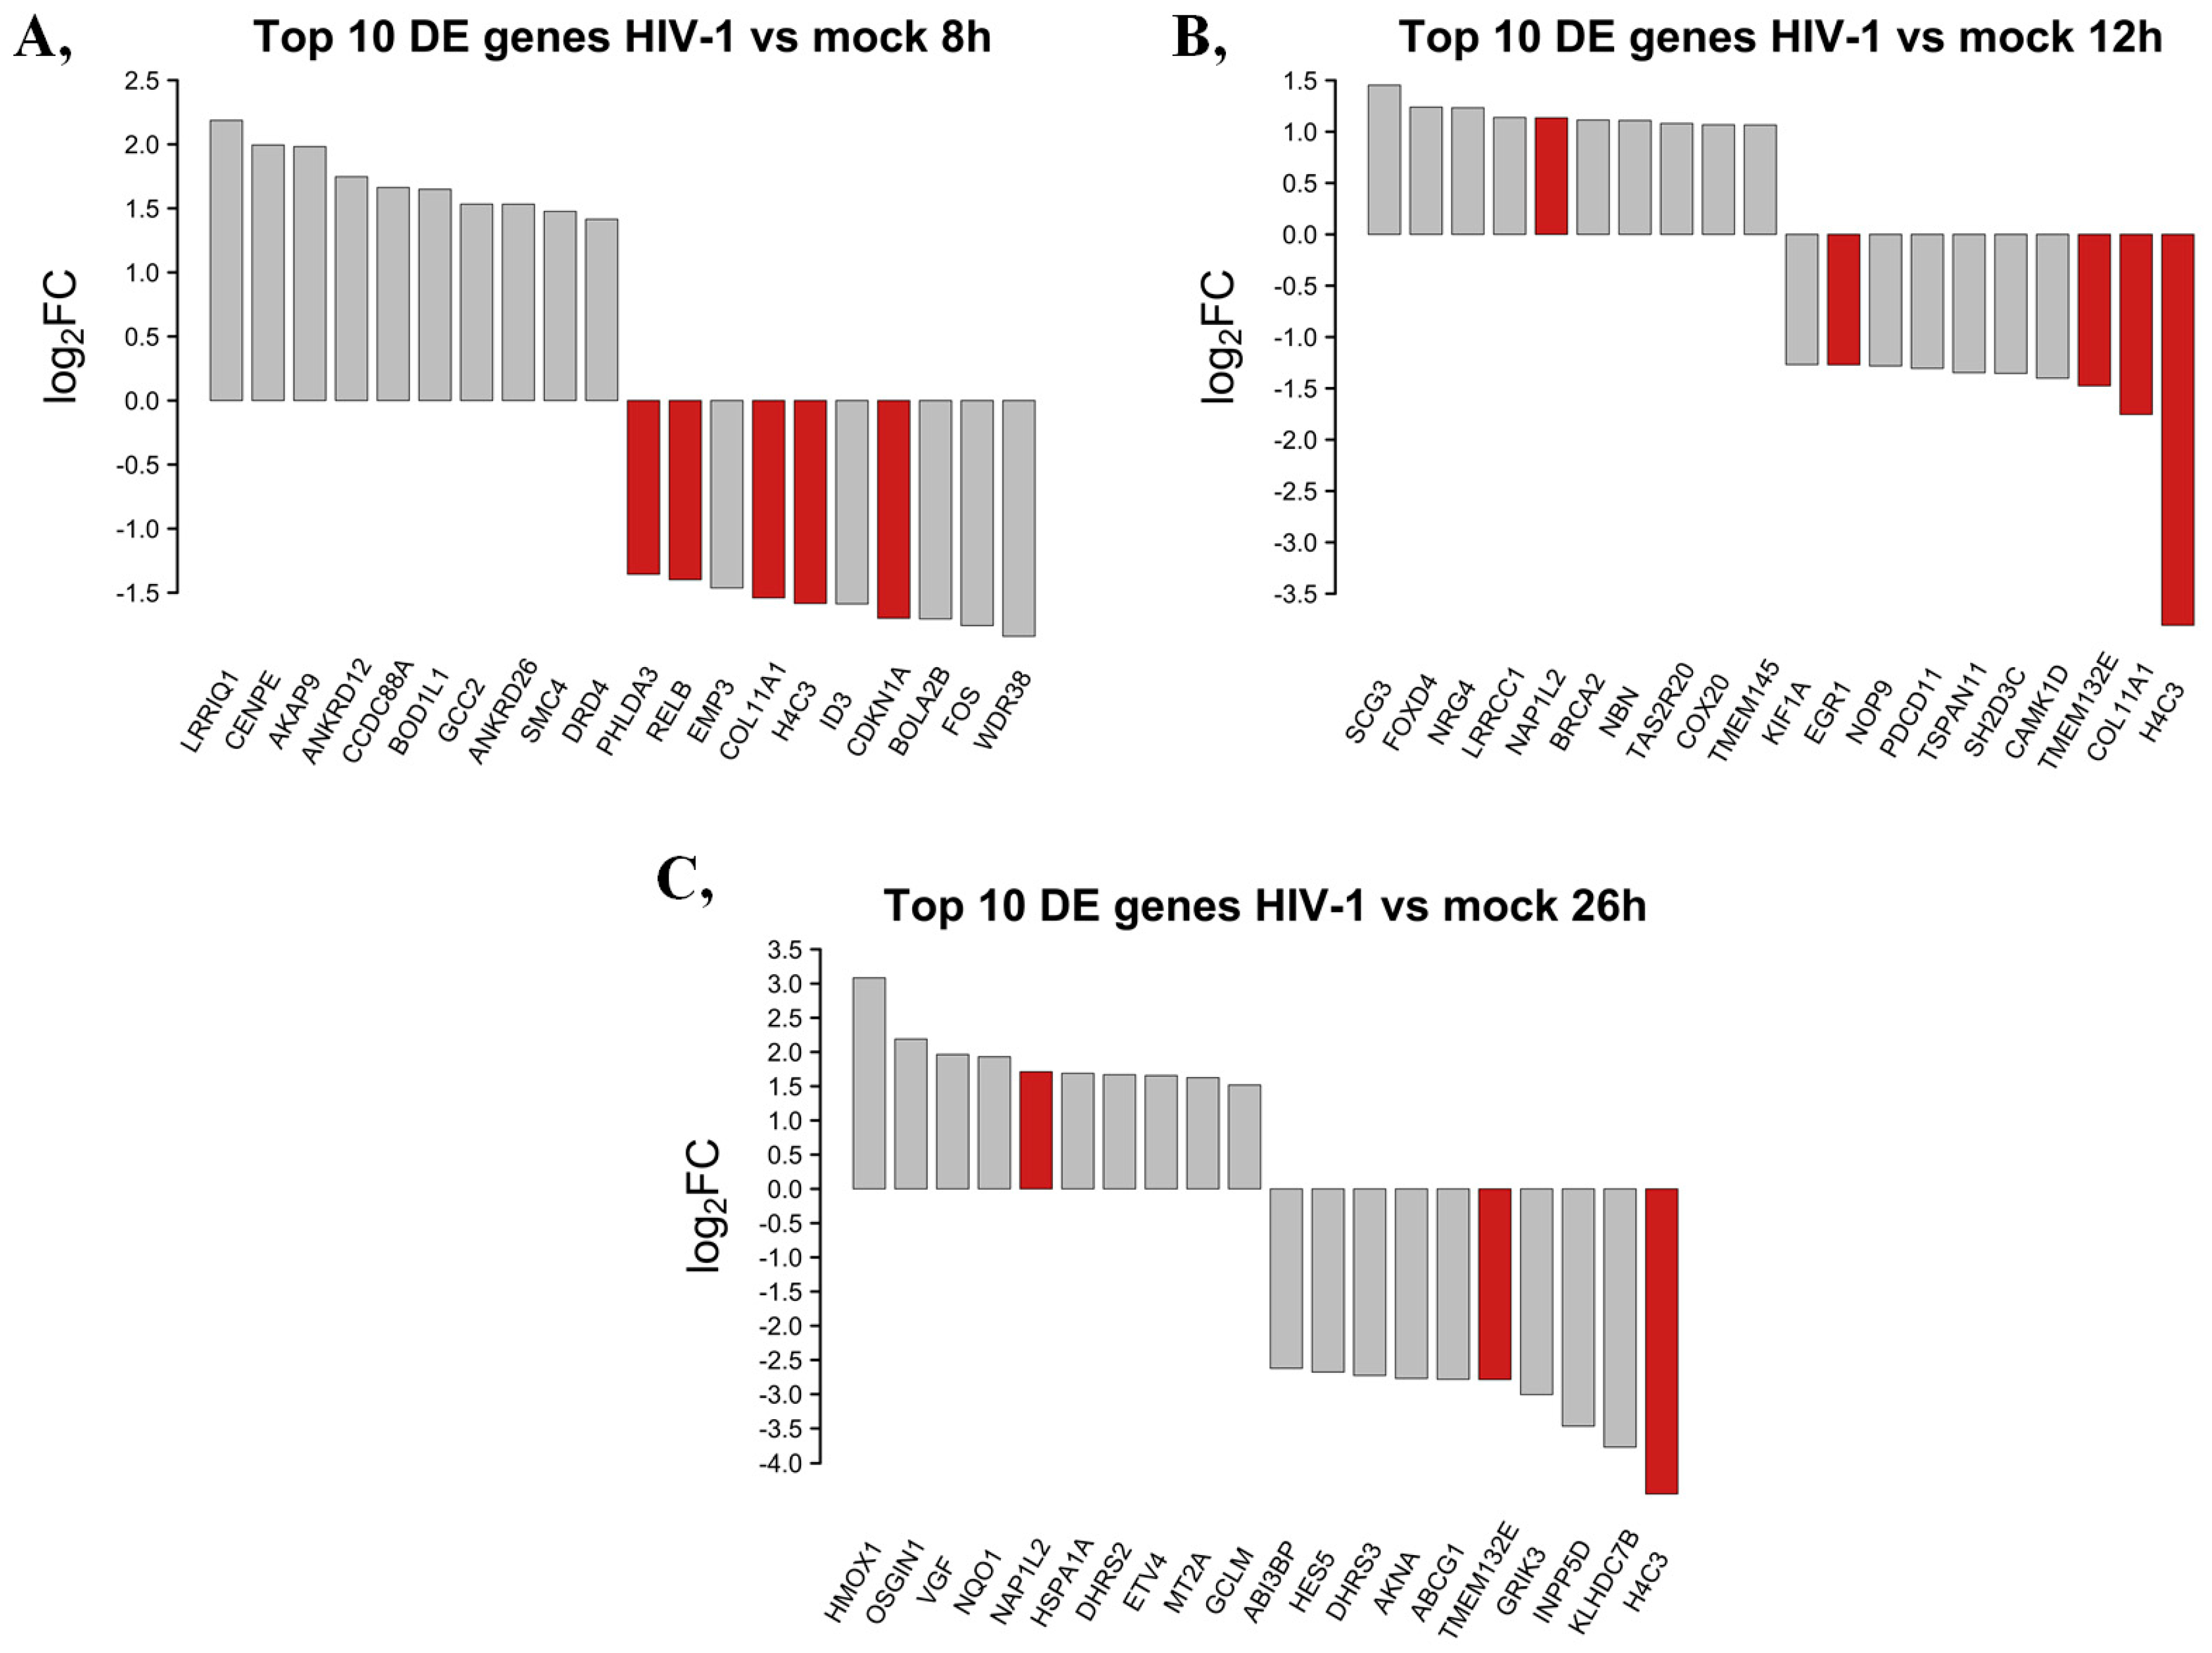
2.1.2. Differentially Induced Genes by HIV-1
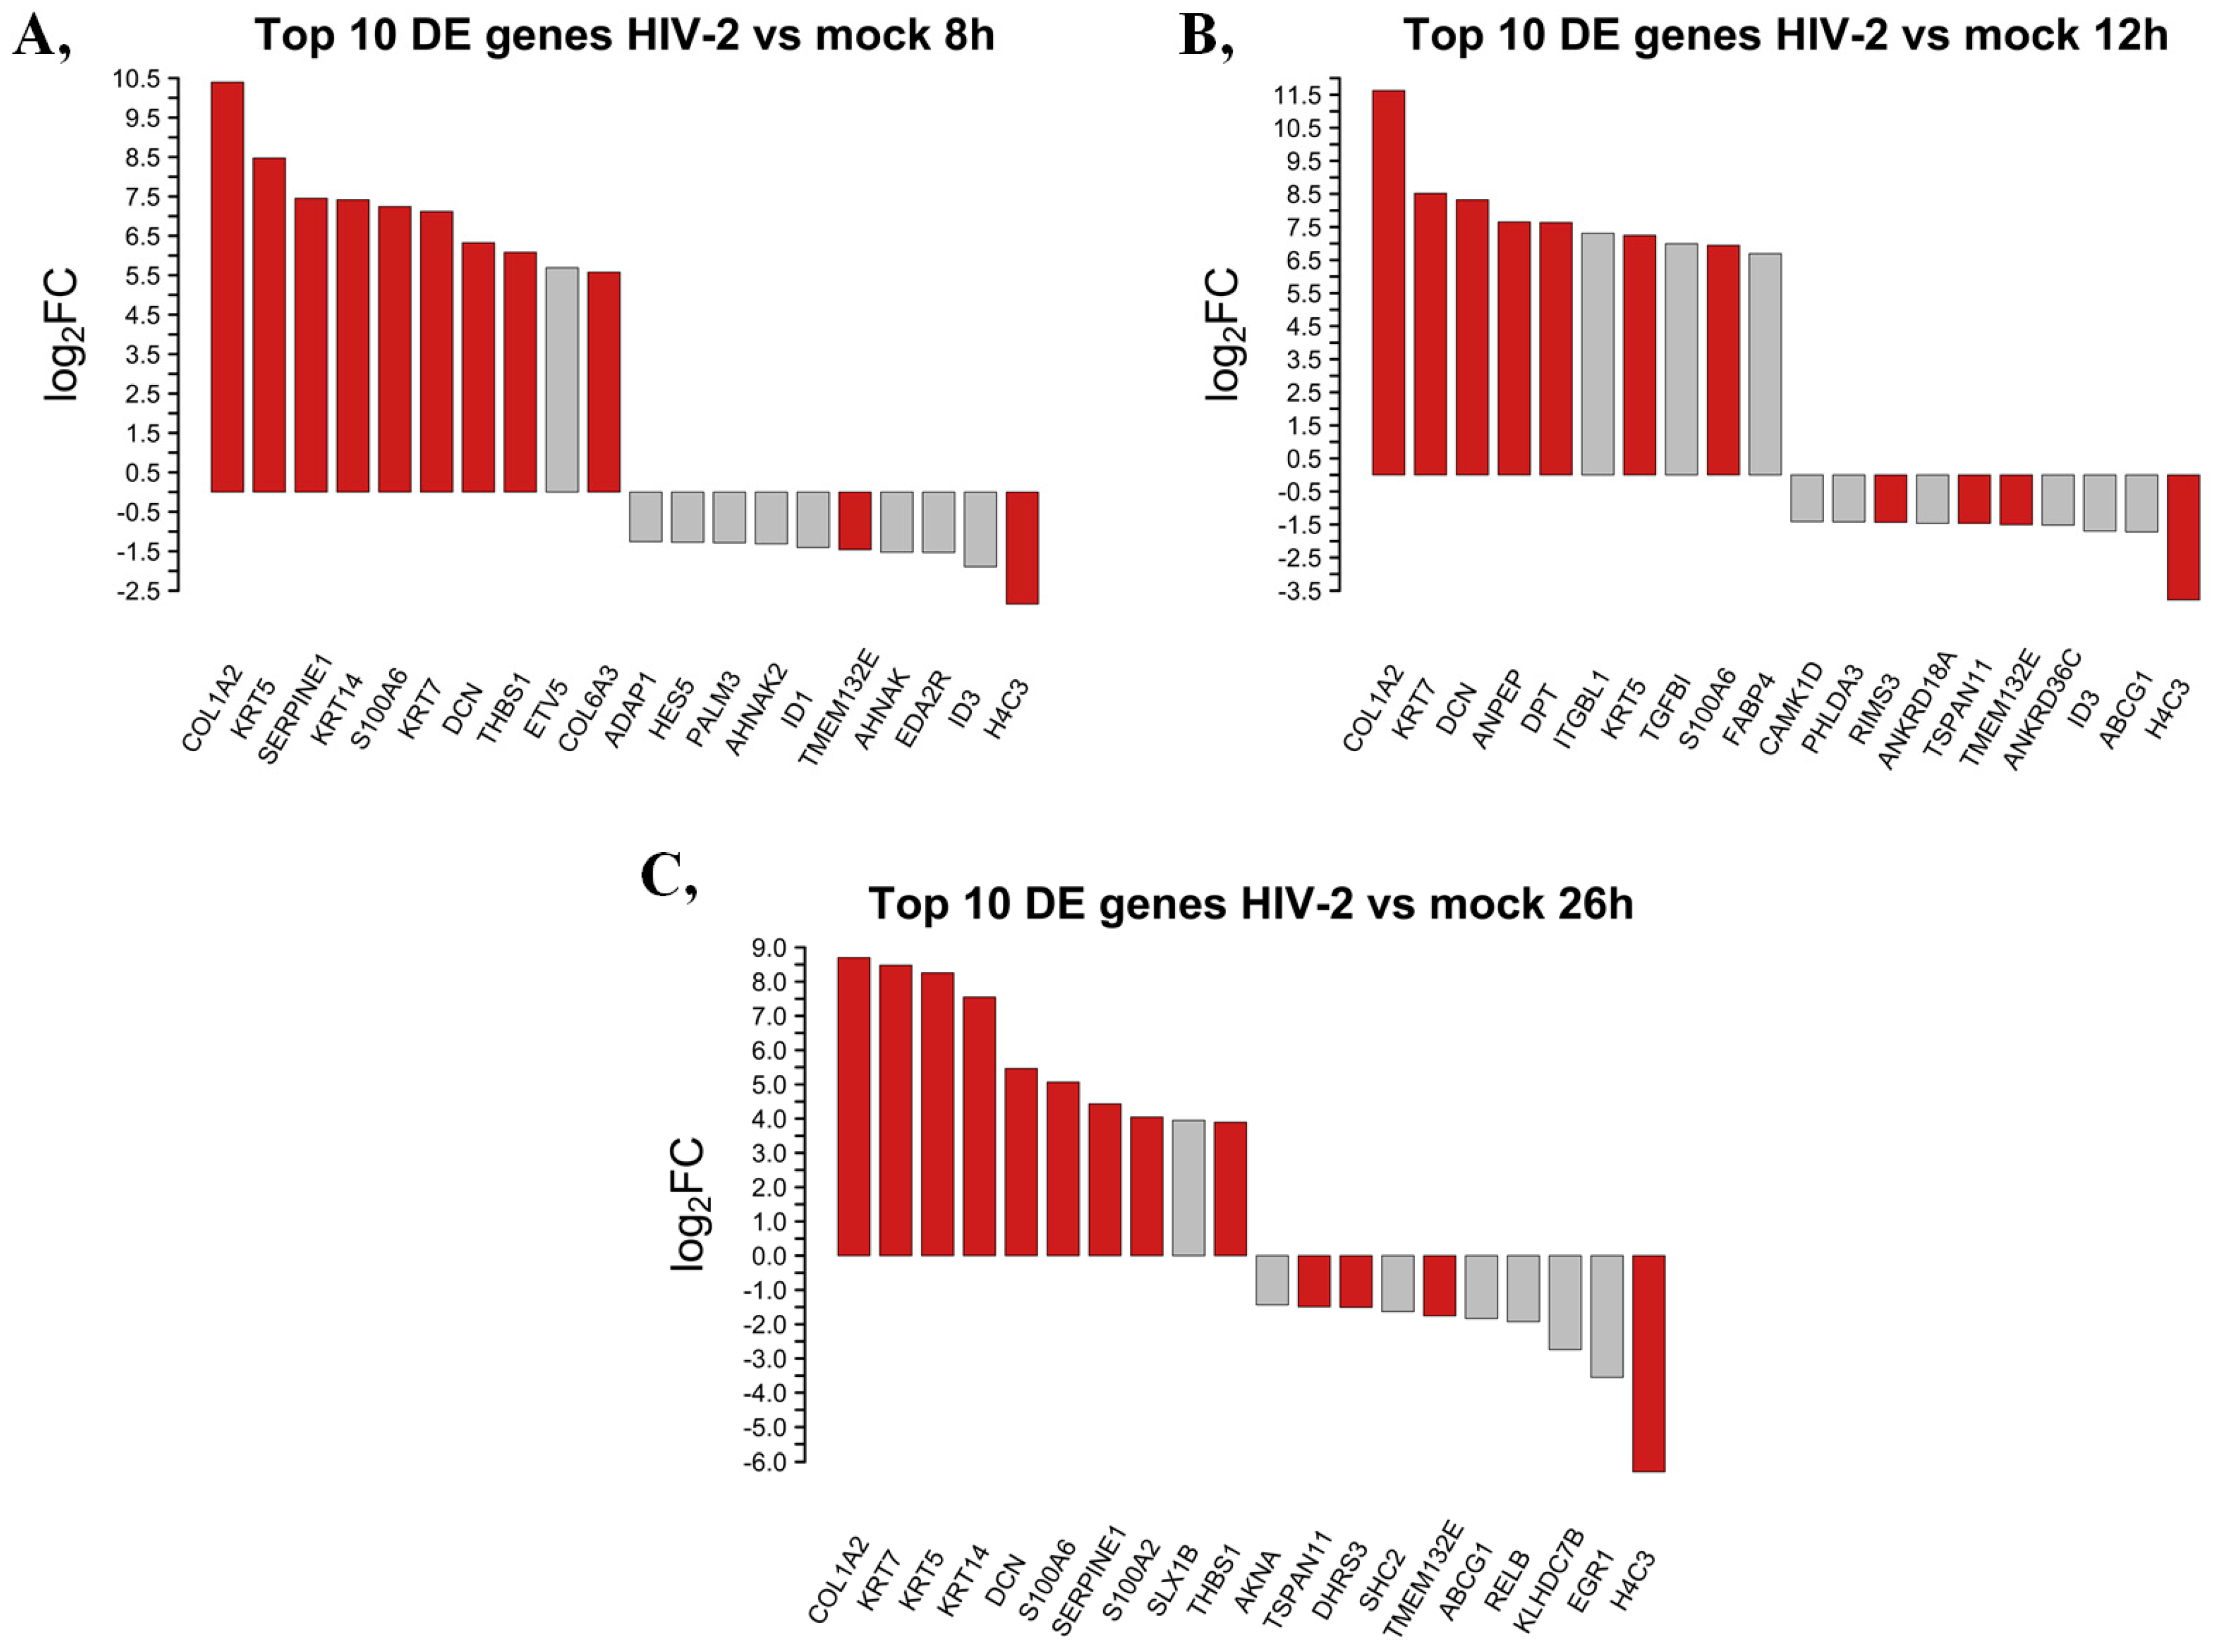
2.1.3. Differentially Induced Genes by HIV-2
2.1.4. Gene Ontology Analysis of the Significantly Altered Transcripts across the Different Time-Points
2.2. Proteomics Analysis
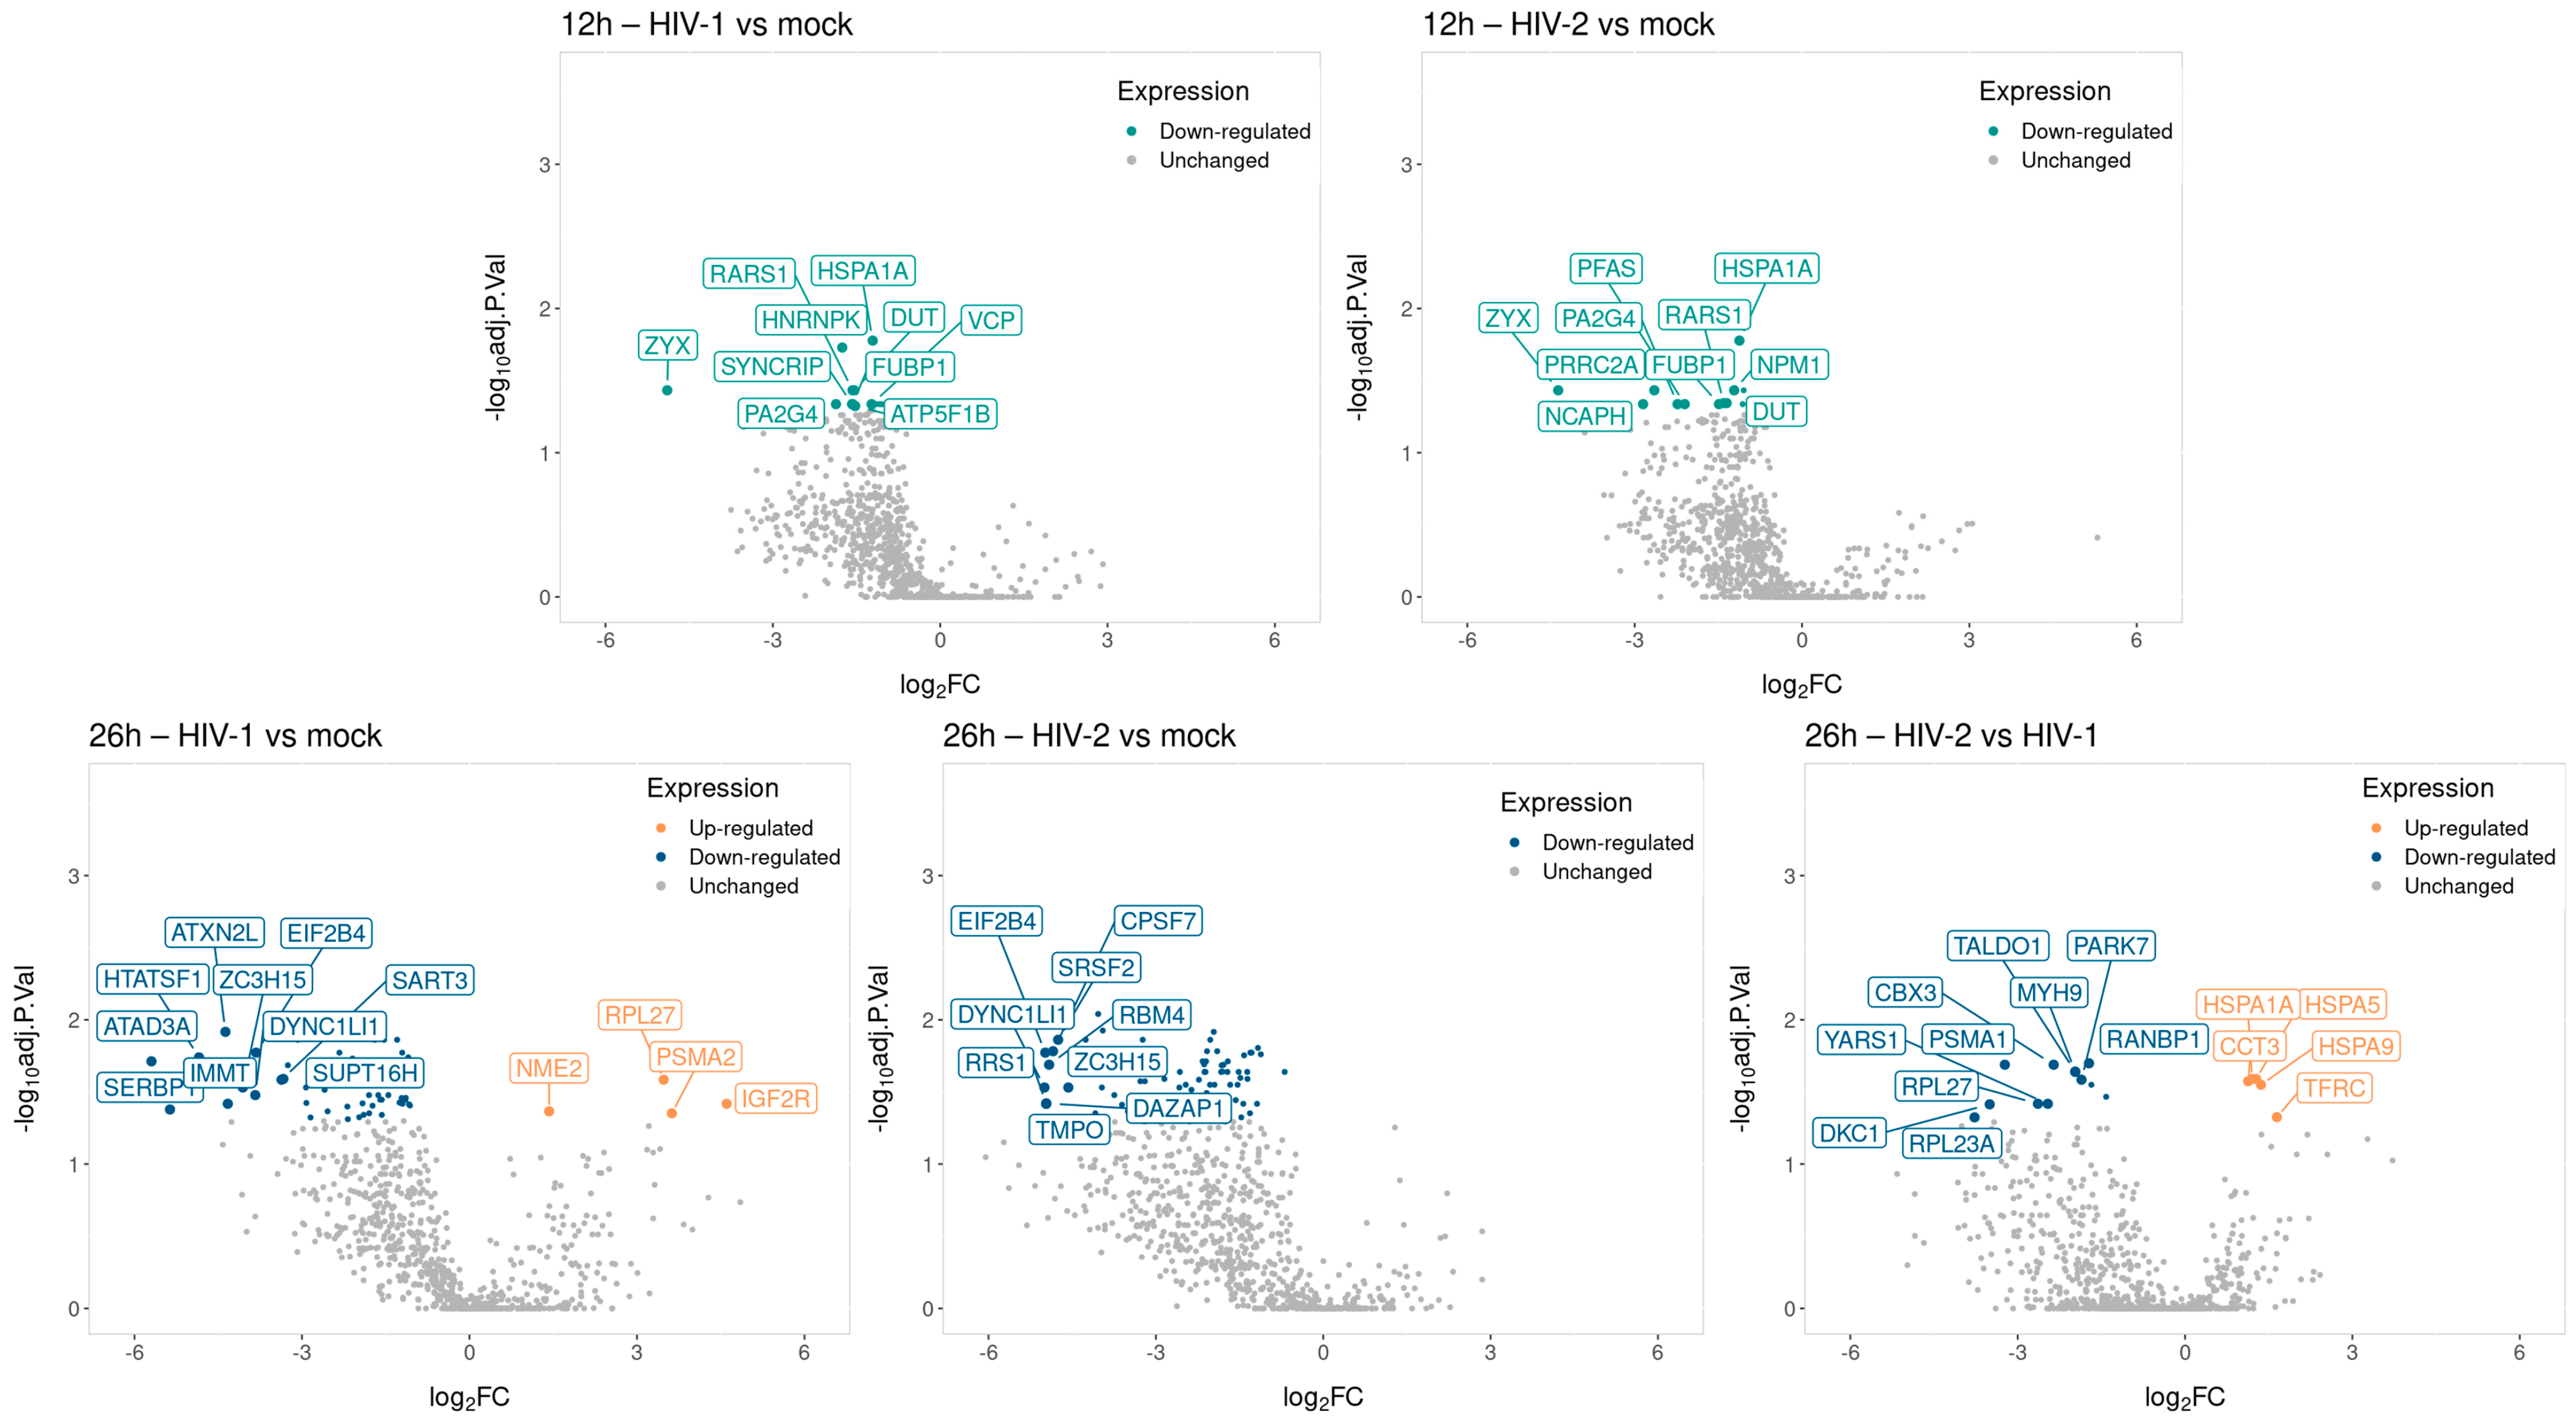
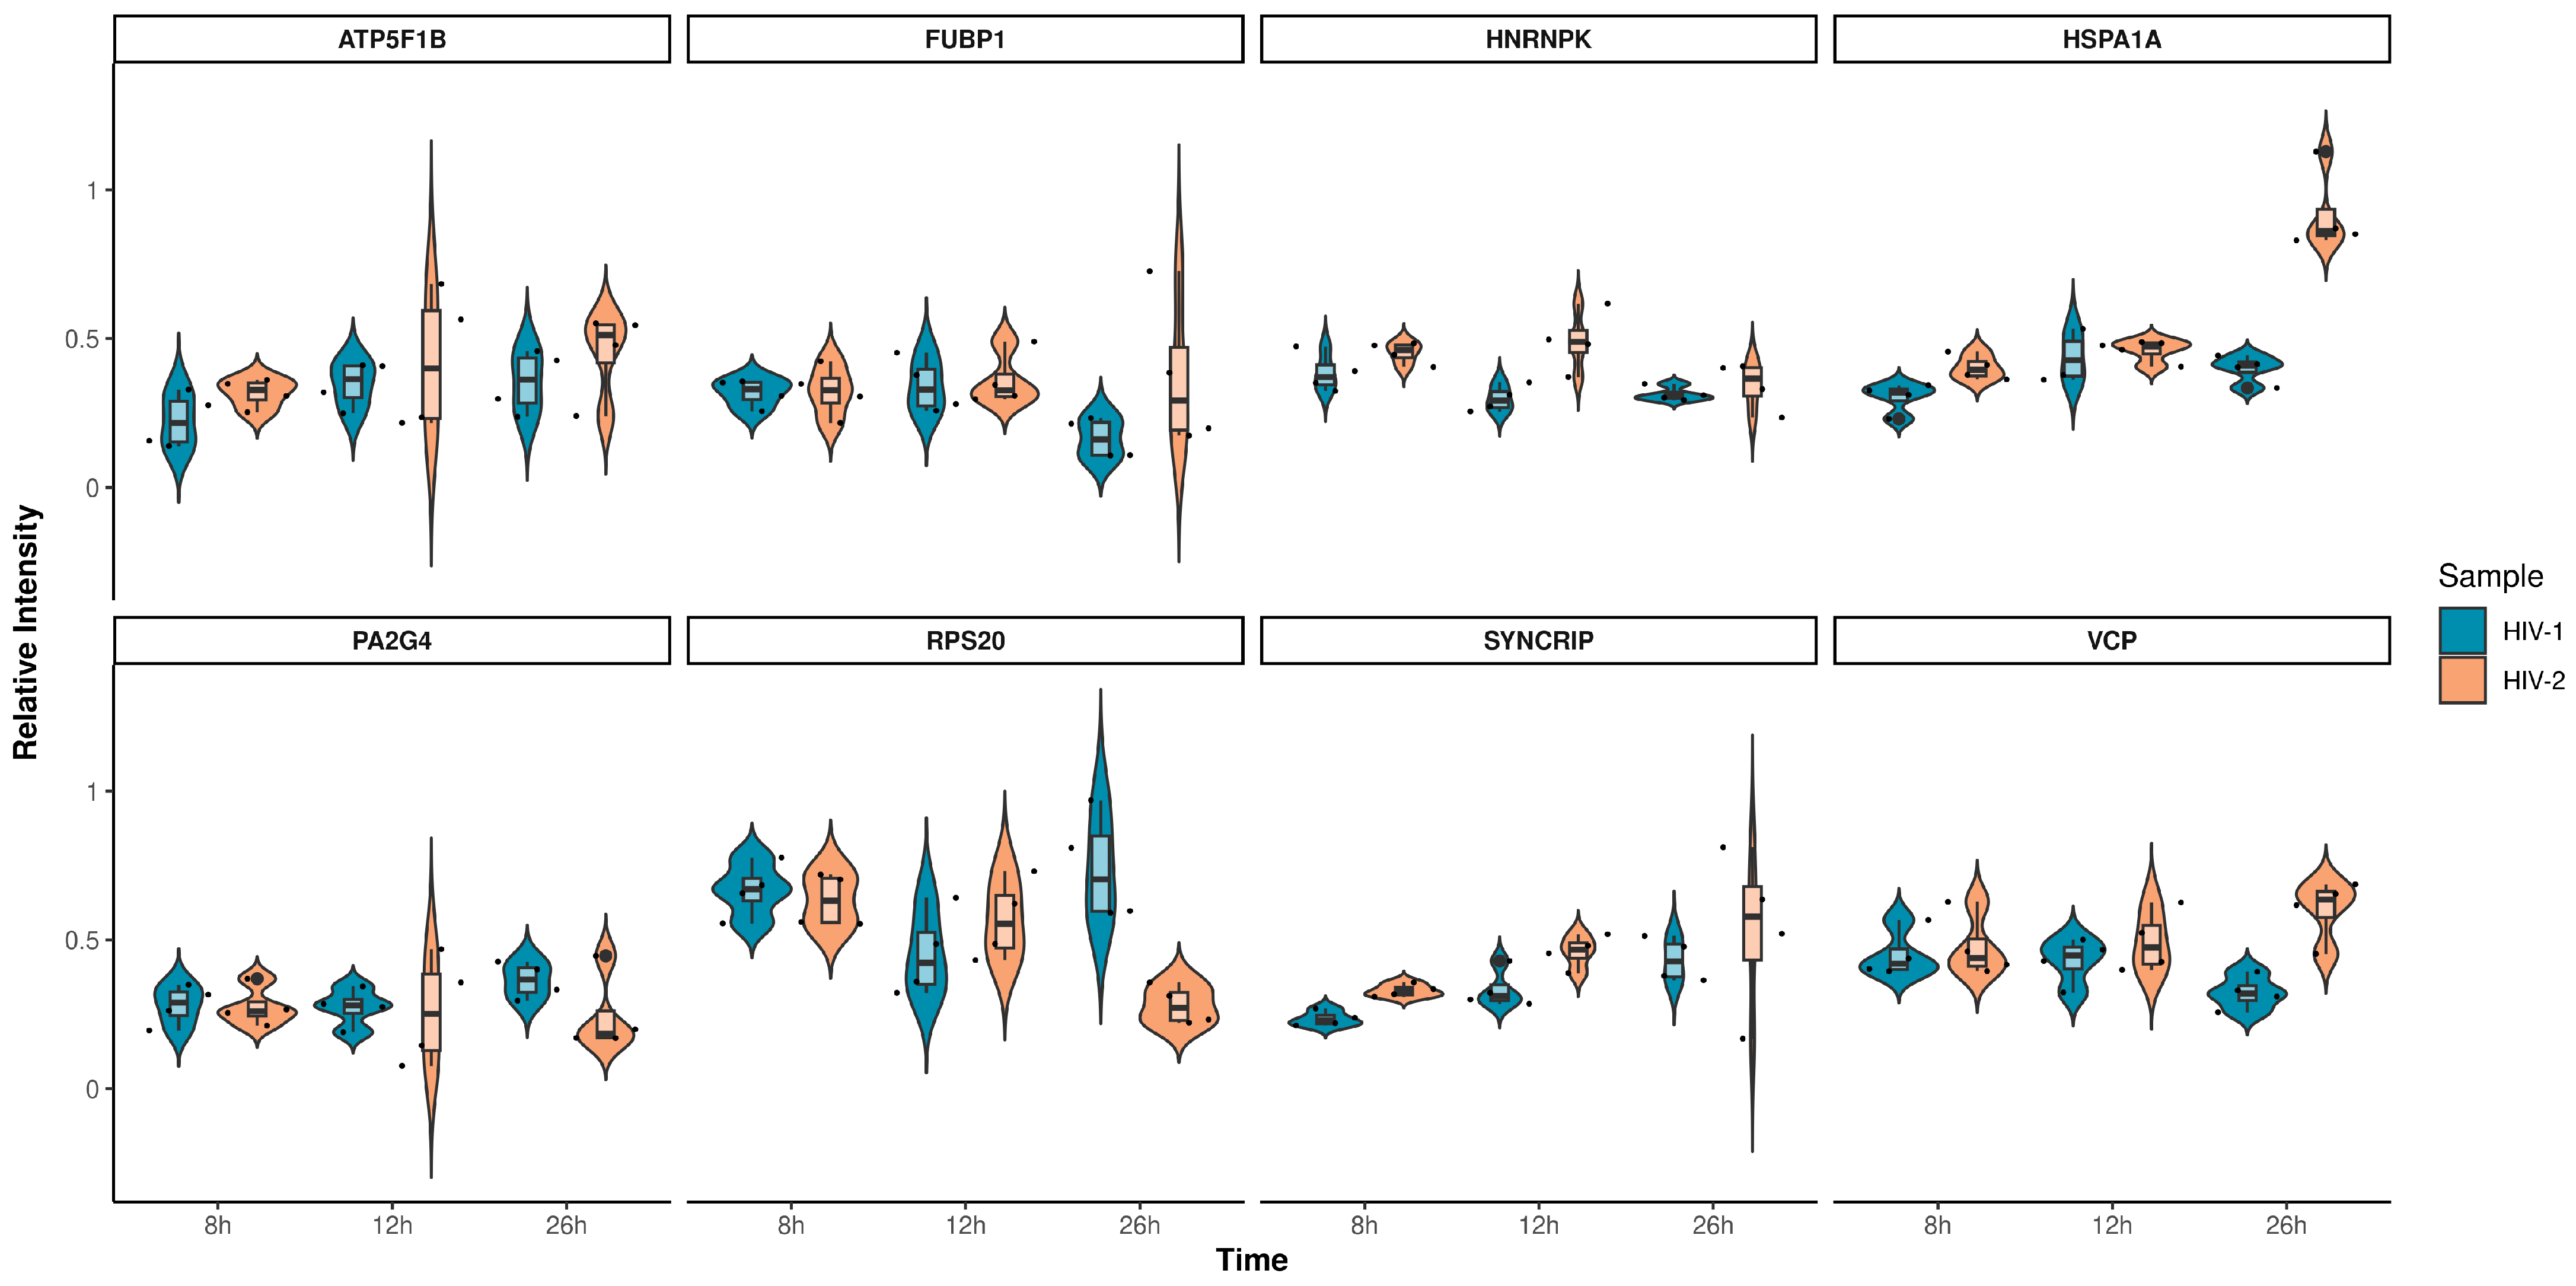
2.2.1. Proteomic Changes Induced by Transduction with HIV-1 and HIV-2
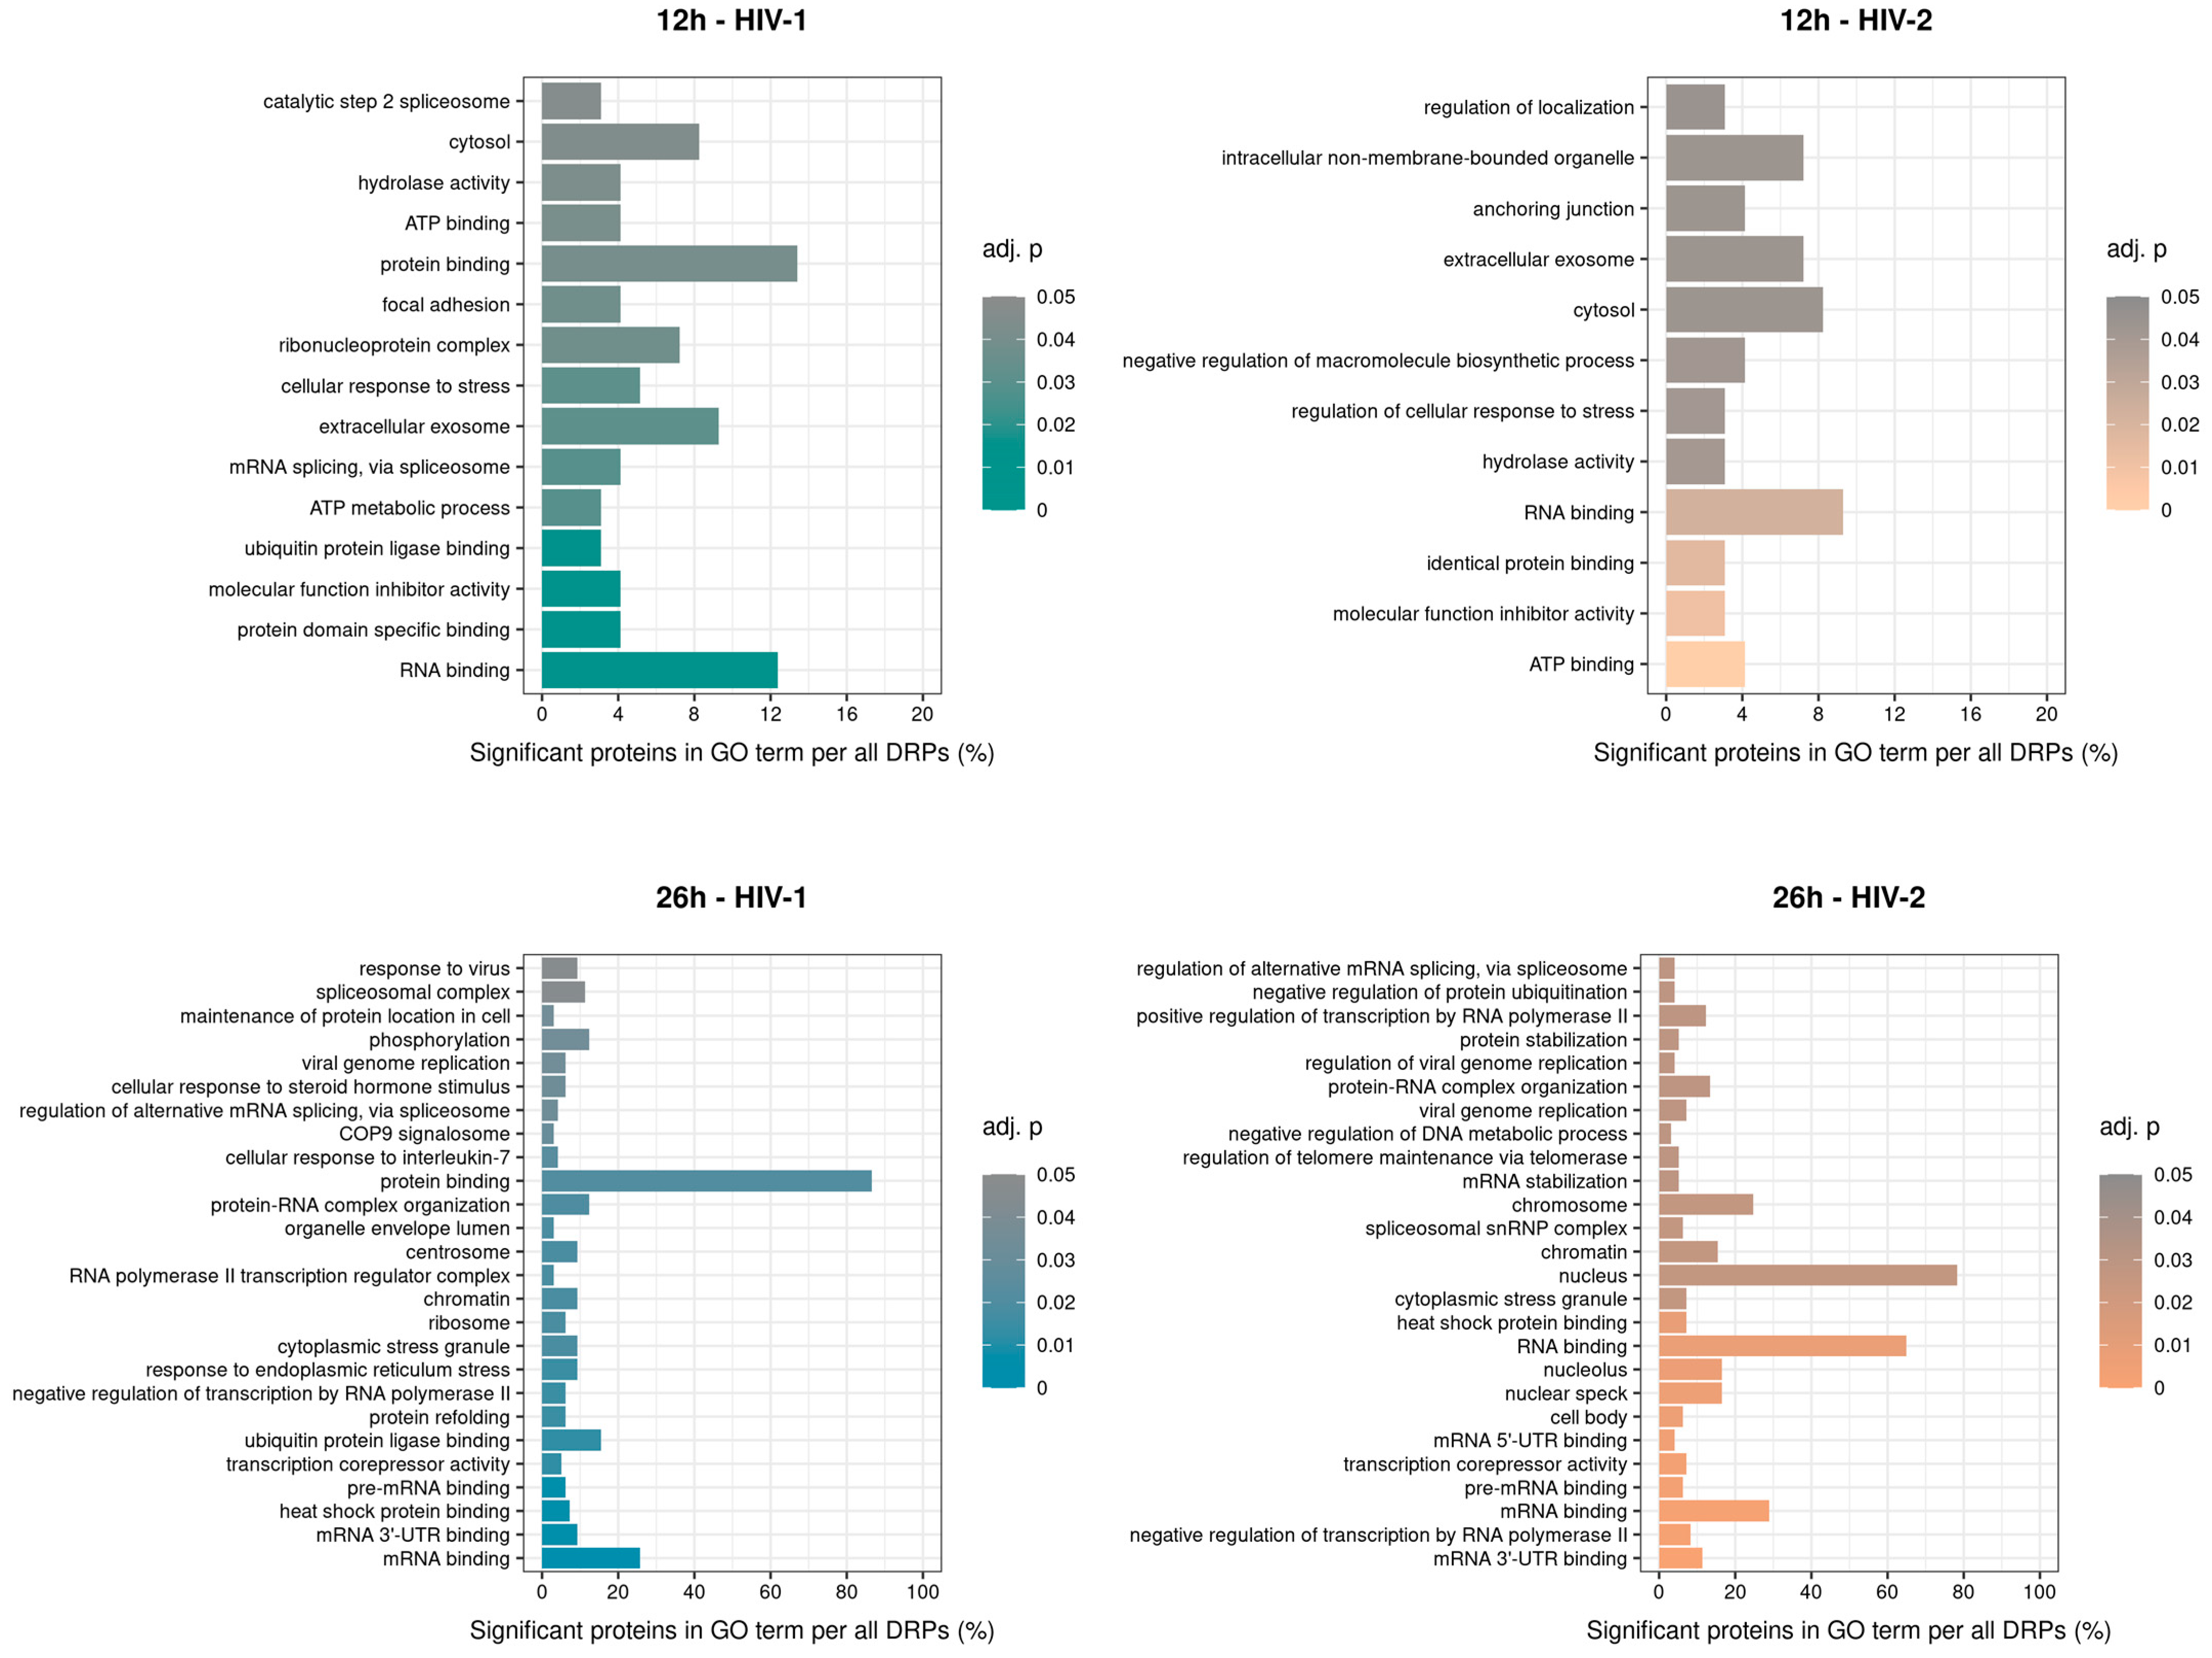
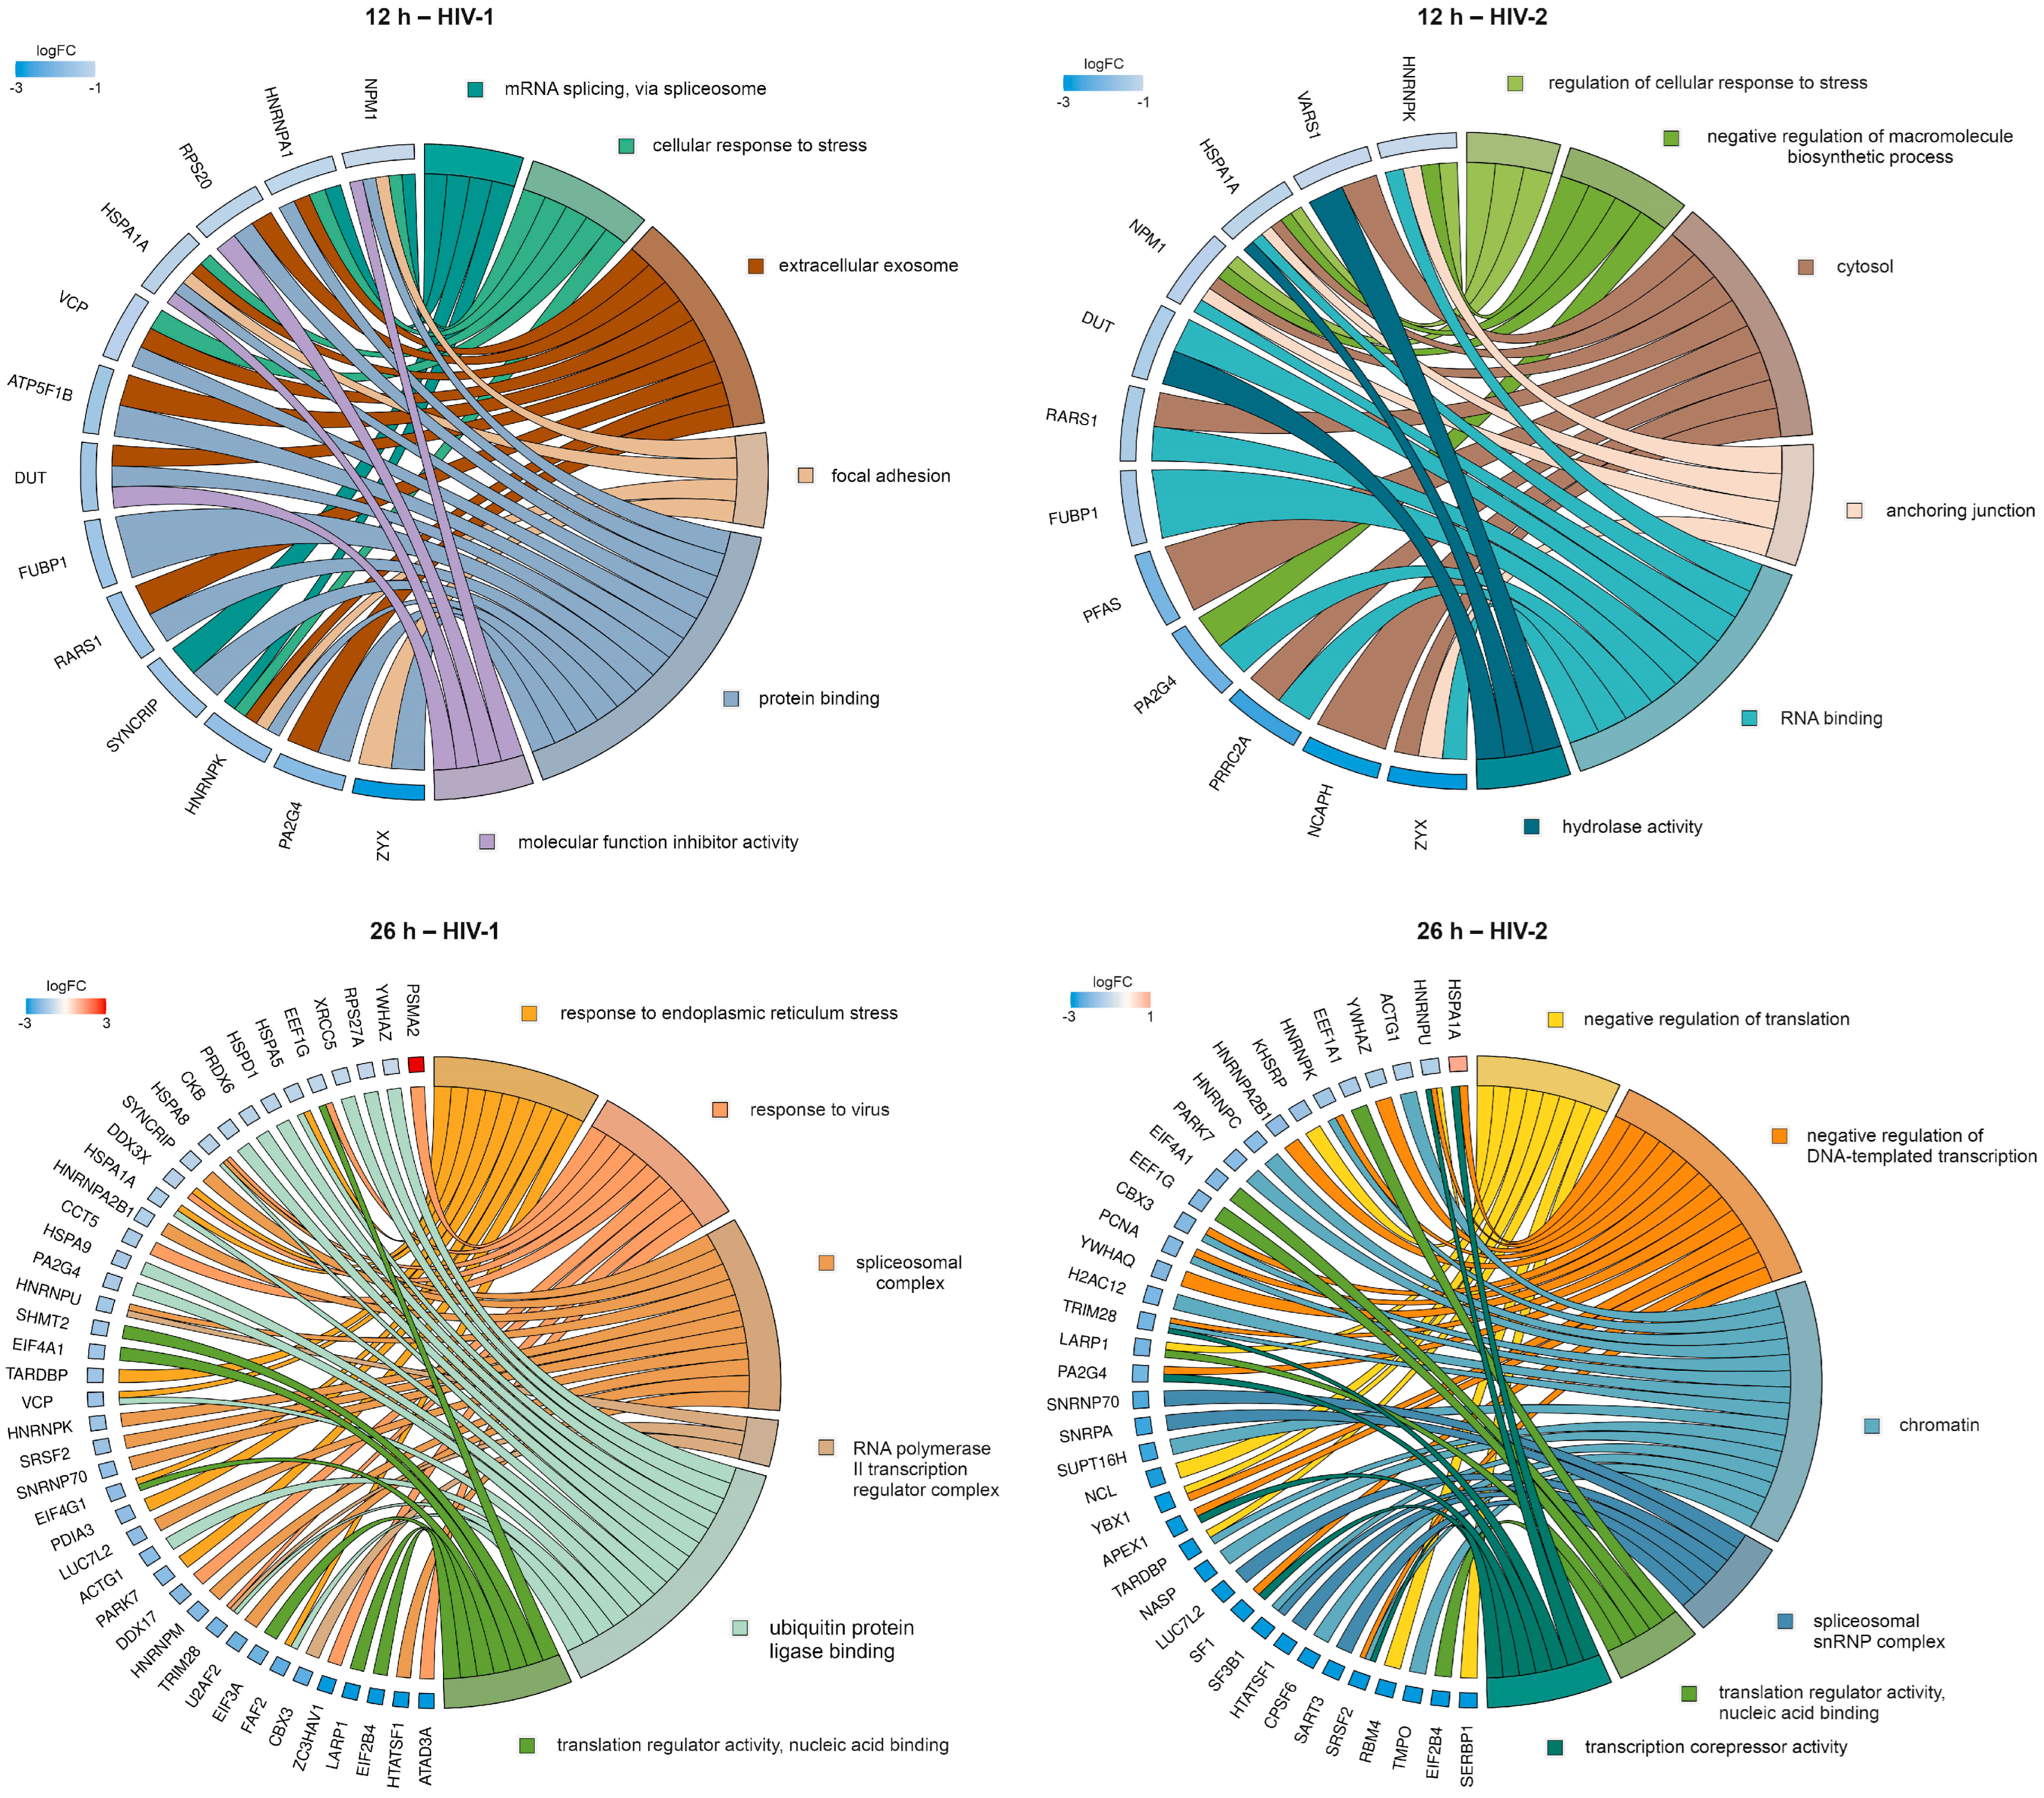
2.2.2. Gene Ontology Analysis of the Significantly Altered Proteins
3. Discussion
4. Materials and Methods
4.1. Plasmids and Vectors
4.2. Production of HIV-1, HIV-2 and “Mock” Pseudovirion Particles
4.3. Transduction of HEK-293T Cells for Transcriptomic Analysis
4.4. Transduction of HEK-293T Cells for Proteomic Analysis
4.5. Transcriptomic Data Analysis
4.6. GeLC-MS/MS Analyis
4.7. Data analysis of Mass Spectrometry
4.8. Proteomic Data Analysis
Supplementary Materials
Author Contributions
Funding
Institutional Review Board Statement
Informed Consent Statement
Data Availability Statement
Acknowledgments
Conflicts of Interest
References
- Campbell-Yesufu, O.T.; Gandhi, R.T. Update on human immunodeficiency virus (HIV)-2 infection. Clin. Infect. Dis. 2011, 52, 780–787. [Google Scholar] [CrossRef]
- Popper, S.J.; Sarr, A.D.; Travers, K.U.; Gueye-Ndiaye, A.; Mboup, S.; Essex, M.E.; Kanki, P.J. Lower human immunodeficiency virus (HIV) type 2 viral load reflects the difference in pathogenicity of HIV-1 and HIV-2. J. Infect. Dis. 1999, 180, 1116–1121. [Google Scholar] [CrossRef]
- Marlink, R.; Kanki, P.; Thior, I.; Travers, K.; Eisen, G.; Siby, T.; Traore, I.; Hsieh, C.C.; Dia, M.C.; Gueye, E.H.; et al. Reduced rate of disease development after HIV-2 infection as compared to HIV-1. Science 1994, 265, 1587–1590. [Google Scholar] [CrossRef]
- Frankel, A.D.; Young, J.A. HIV-1: Fifteen proteins and an RNA. Annu. Rev. Biochem. 1998, 67, 1–25. [Google Scholar] [CrossRef]
- Li, G.; De Clercq, E. HIV genome-wide protein associations: A review of 30 years of research. Microbiol. Mol. Biol. Rev. MMBR 2016, 80, 679–731. [Google Scholar] [CrossRef]
- Reeves, J.D.; Doms, R.W. Human immunodeficiency virus type 2. J. Gen. Virol. 2002, 83, 1253–1265. [Google Scholar] [CrossRef]
- Marchand, C.; Johnson, A.A.; Semenova, E.; Pommier, Y. Mechanisms and inhibition of HIV integration. Drug Discov. Today Dis. Mech. 2006, 3, 253–260. [Google Scholar] [CrossRef]
- Jayappa, K.D.; Ao, Z.; Yao, X. The HIV-1 passage from cytoplasm to nucleus: The process involving a complex exchange between the components of HIV-1 and cellular machinery to access nucleus and successful integration. Int. J. Biochem. Mol. Biol. 2012, 3, 70–85. [Google Scholar]
- Goff, S.P. Intracellular trafficking of retroviral genomes during the early phase of infection: Viral exploitation of cellular pathways. J. Gene Med. 2001, 3, 517–528. [Google Scholar] [CrossRef]
- Ciuffi, A.; Llano, M.; Poeschla, E.; Hoffmann, C.; Leipzig, J.; Shinn, P.; Ecker, J.R.; Bushman, F. A role for ledgf/p75 in targeting HIV DNA integration. Nat. Med. 2005, 11, 1287–1289. [Google Scholar] [CrossRef]
- Craigie, R.; Bushman, F.D. Host factors in retroviral integration and the selection of integration target sites. Microbiol. Spectr. 2014, 2, 1035–1050. [Google Scholar] [CrossRef]
- Engelman, A.; Cherepanov, P. The structural biology of HIV-1: Mechanistic and therapeutic insights. Nat. Rev. Microbiol. 2012, 10, 279–290. [Google Scholar] [CrossRef]
- Liu, R.D.; Wu, J.; Shao, R.; Xue, Y.H. Mechanism and factors that control HIV-1 transcription and latency activation. J. Zhejiang Univ. Sci. B 2014, 15, 455–465. [Google Scholar] [CrossRef]
- Yang, J.; Yang, Z.; Lv, H.; Lou, Y.; Wang, J.; Wu, N. Bridging HIV-1 cellular latency and clinical long-term non-progressor: An interactomic view. PLoS ONE 2013, 8, e55791. [Google Scholar] [CrossRef]
- Lee, D.; Yoon, C.H.; Choi, S.Y.; Kim, J.E.; Cho, Y.K.; Choi, B.S.; Park, J. Transcriptome analysis identifies altered biological processes and novel markers in human immunodeficiency virus-1 long-term non-progressors. Infect. Chemother. 2021, 53, 489–502. [Google Scholar] [CrossRef]
- Inderbitzin, A.; Loosli, T.; Opitz, L.; Rusert, P.; Metzner, K.J. Transcriptome profiles of latently- and reactivated HIV-1 infected primary cd4(+) t cells: A pooled data-analysis. Front. Immunol. 2022, 13, 915805. [Google Scholar] [CrossRef]
- Pollara, J.; Khanal, S.; Edwards, R.W.; Hora, B.; Ferrari, G.; Haynes, B.F.; Bradley, T. Single-cell analysis of immune cell transcriptome during HIV-1 infection and therapy. BMC Immunol. 2022, 23, 48. [Google Scholar] [CrossRef]
- Csosz, E.; Toth, F.; Mahdi, M.; Tsaprailis, G.; Emri, M.; Tozser, J. Analysis of networks of host proteins in the early time points following HIV transduction. BMC Bioinform. 2019, 20, 398. [Google Scholar] [CrossRef]
- Chan, E.Y.; Sutton, J.N.; Jacobs, J.M.; Bondarenko, A.; Smith, R.D.; Katze, M.G. Dynamic host energetics and cytoskeletal proteomes in human immunodeficiency virus type 1-infected human primary cd4 cells: Analysis by multiplexed label-free mass spectrometry. J. Virol. 2009, 83, 9283–9295. [Google Scholar] [CrossRef]
- Ringrose, J.H.; Jeeninga, R.E.; Berkhout, B.; Speijer, D. Proteomic studies reveal coordinated changes in t-cell expression patterns upon infection with human immunodeficiency virus type 1. J. Virol. 2008, 82, 4320–4330. [Google Scholar] [CrossRef]
- MacNeil, A.; Sarr, A.D.; Sankale, J.L.; Meloni, S.T.; Mboup, S.; Kanki, P. Direct evidence of lower viral replication rates in vivo in human immunodeficiency virus type 2 (HIV-2) infection than in HIV-1 infection. J. Virol. 2007, 81, 5325–5330. [Google Scholar] [CrossRef] [PubMed]
- Bock, P.J.; Markovitz, D.M. Infection with HIV-2. Aids 2001, 15 (Suppl. 5), S35–S45. [Google Scholar] [CrossRef] [PubMed]
- Burns, J.C.; Friedmann, T.; Driever, W.; Burrascano, M.; Yee, J.K. Vesicular stomatitis virus g glycoprotein pseudotyped retroviral vectors: Concentration to very high titer and efficient gene transfer into mammalian and nonmammalian cells. Proc. Natl. Acad. Sci. USA 1993, 90, 8033–8037. [Google Scholar] [CrossRef]
- Troger, J.; Moutty, M.C.; Skroblin, P.; Klussmann, E. A-kinase anchoring proteins as potential drug targets. Br. J. Pharmacol. 2012, 166, 420–433. [Google Scholar] [CrossRef] [PubMed]
- Moreno-Fernandez, M.E.; Rueda, C.M.; Velilla, P.A.; Rugeles, M.T.; Chougnet, C.A. Camp during HIV infection: Friend or foe? AIDS Res. Hum. Retroviruses 2012, 28, 49–53. [Google Scholar] [CrossRef] [PubMed]
- Wang, M.; Yang, W.; Chen, Y.; Wang, J.; Tan, J.; Qiao, W. Cellular relb interacts with the transactivator tat and enhance HIV-1 expression. Retrovirology 2018, 15, 65. [Google Scholar] [CrossRef]
- Ge, Q.L.; Liu, S.H.; Ai, Z.H.; Tao, M.F.; Ma, L.; Wen, S.Y.; Dai, M.; Liu, F.; Liu, H.S.; Jiang, R.Z.; et al. Relb/nf-kappab links cell cycle transition and apoptosis to endometrioid adenocarcinoma tumorigenesis. Cell Death Dis. 2016, 7, e2402. [Google Scholar] [CrossRef]
- Kundu, M.; Sharma, S.; De Luca, A.; Giordano, A.; Rappaport, J.; Khalili, K.; Amini, S. HIV-1 tat elongates the g1 phase and indirectly promotes HIV-1 gene expression in cells of glial origin. J. Biol. Chem. 1998, 273, 8130–8136. [Google Scholar] [CrossRef]
- Mlcochova, P.; Sutherland, K.A.; Watters, S.A.; Bertoli, C.; de Bruin, R.A.; Rehwinkel, J.; Neil, S.J.; Lenzi, G.M.; Kim, B.; Khwaja, A.; et al. A g1-like state allows HIV-1 to bypass samhd1 restriction in macrophages. EMBO J. 2017, 36, 604–616. [Google Scholar] [CrossRef]
- Kumari, S.; Kumar, M.; Verma, R.; Ghosh, J.K.; Tripathi, R.K. HIV-1 nef-gcc185 interaction regulates assembly of cellular protein complexes at tgn targeting mhc-i downregulation. Life Sci. 2019, 229, 13–20. [Google Scholar] [CrossRef]
- Zhang, J.; Scadden, D.T.; Crumpacker, C.S. Primitive hematopoietic cells resist HIV-1 infection via p21. J. Clin. Investig. 2007, 117, 473–481. [Google Scholar] [CrossRef]
- Vazquez, N.; Greenwell-Wild, T.; Marinos, N.J.; Swaim, W.D.; Nares, S.; Ott, D.E.; Schubert, U.; Henklein, P.; Orenstein, J.M.; Sporn, M.B.; et al. Human immunodeficiency virus type 1-induced macrophage gene expression includes the p21 gene, a target for viral regulation. J. Virol. 2005, 79, 4479–4491. [Google Scholar] [CrossRef]
- Chowdhury, I.H.; Wang, X.F.; Landau, N.R.; Robb, M.L.; Polonis, V.R.; Birx, D.L.; Kim, J.H. HIV-1 vpr activates cell cycle inhibitor p21/waf1/cip1: A potential mechanism of g2/m cell cycle arrest. Virology 2003, 305, 371–377. [Google Scholar] [CrossRef]
- Li, P.; Guo, D.; Zhang, X.; Ji, K.; Lv, H.; Zhang, Y.; Chen, Z.; Ma, J.; Fang, Y.; Liu, Y. Compound heterozygous cox20 variants impair the function of mitochondrial complex iv to cause a syndrome involving ophthalmoplegia and visual failure. Front. Neurol. 2022, 13, 873943. [Google Scholar] [CrossRef]
- Ogawa, M.; Takemoto, Y.; Sumi, S.; Inoue, D.; Kishimoto, N.; Takamune, N.; Shoji, S.; Suzu, S.; Misumi, S. Atp generation in a host cell in early-phase infection is increased by upregulation of cytochrome c oxidase activity via the p2 peptide from human immunodeficiency virus type 1 gag. Retrovirology 2015, 12, 97. [Google Scholar] [CrossRef]
- Lecoeur, H.; Borgne-Sanchez, A.; Chaloin, O.; El-Khoury, R.; Brabant, M.; Langonne, A.; Porceddu, M.; Briere, J.J.; Buron, N.; Rebouillat, D.; et al. HIV-1 tat protein directly induces mitochondrial membrane permeabilization and inactivates cytochrome c oxidase. Cell Death Dis. 2012, 3, e282. [Google Scholar] [CrossRef]
- De Martini, W.; Rahman, R.; Ojegba, E.; Jungwirth, E.; Macias, J.; Ackerly, F.; Fowler, M.; Cottrell, J.; Chu, T.; Chang, S.L. Kinases: Understanding their role in HIV infection. World J. AIDS 2019, 9, 142–160. [Google Scholar] [CrossRef]
- Zhou, H.; Xu, M.; Huang, Q.; Gates, A.T.; Zhang, X.D.; Castle, J.C.; Stec, E.; Ferrer, M.; Strulovici, B.; Hazuda, D.J.; et al. Genome-scale rnai screen for host factors required for HIV replication. Cell Host Microbe 2008, 4, 495–504. [Google Scholar] [CrossRef]
- Murray, J.M.; Kelleher, A.D.; Cooper, D.A. Timing of the components of the HIV life cycle in productively infected cd4+ t cells in a population of HIV-infected individuals. J. Virol. 2011, 85, 10798–10805. [Google Scholar] [CrossRef]
- Roy, R.; Chun, J.; Powell, S.N. Brca1 and brca2: Different roles in a common pathway of genome protection. Nat. Rev. Cancer 2011, 12, 68–78. [Google Scholar] [CrossRef]
- Varon, R.; Vissinga, C.; Platzer, M.; Cerosaletti, K.M.; Chrzanowska, K.H.; Saar, K.; Beckmann, G.; Seemanova, E.; Cooper, P.R.; Nowak, N.J.; et al. Nibrin, a novel DNA double-strand break repair protein, is mutated in nijmegen breakage syndrome. Cell 1998, 93, 467–476. [Google Scholar] [CrossRef] [PubMed]
- Ivanov, A.V.; Valuev-Elliston, V.T.; Ivanova, O.N.; Kochetkov, S.N.; Starodubova, E.S.; Bartosch, B.; Isaguliants, M.G. Oxidative stress during HIV infection: Mechanisms and consequences. Oxidative Med. Cell. Longev. 2016, 2016, 8910396. [Google Scholar] [CrossRef] [PubMed]
- Linkner, T.R.; Ambrus, V.; Kunkli, B.; Szojka, Z.I.; Kallo, G.; Csosz, E.; Kumar, A.; Emri, M.; Tozser, J.; Mahdi, M. Cellular proteo-transcriptomic changes in the immediate early-phase of lentiviral transduction. Microorganisms 2021, 9, 2207. [Google Scholar] [CrossRef] [PubMed]
- Ke, J.; Wu, R.; Chen, Y.; Abba, M.L. Inhibitor of DNA binding proteins: Implications in human cancer progression and metastasis. Am. J. Transl. Res. 2018, 10, 3887–3910. [Google Scholar] [PubMed]
- Wu, H.; Wang, S.; Xue, A.; Liu, Y.; Liu, Y.; Wang, H.; Chen, Q.; Guo, M.; Zhang, Z. Overexpression of decorin induces apoptosis and cell growth arrest in cultured rat mesangial cells in vitro. Nephrology 2008, 13, 607–615. [Google Scholar] [CrossRef] [PubMed]
- Stander, M.; Naumann, U.; Wick, W.; Weller, M. Transforming growth factor-beta and p-21: Multiple molecular targets of decorin-mediated suppression of neoplastic growth. Cell Tissue Res. 1999, 296, 221–227. [Google Scholar] [PubMed]
- Li, Z.; Tang, M.; Ling, B.; Liu, S.; Zheng, Y.; Nie, C.; Yuan, Z.; Zhou, L.; Guo, G.; Tong, A.; et al. Increased expression of s100a6 promotes cell proliferation and migration in human hepatocellular carcinoma. J. Mol. Med. 2014, 92, 291–303. [Google Scholar] [CrossRef]
- Duan, L.; Wu, R.; Zou, Z.; Wang, H.; Ye, L.; Li, H.; Yuan, S.; Li, X.; Zha, H.; Sun, H.; et al. S100a6 stimulates proliferation and migration of colorectal carcinoma cells through activation of the mapk pathways. Int. J. Oncol. 2014, 44, 781–790. [Google Scholar] [CrossRef]
- Virgilio, M.C.; Collins, K.L. The impact of cellular proliferation on the HIV-1 reservoir. Viruses 2020, 12, 127. [Google Scholar] [CrossRef]
- Sieg, S.F.; Harding, C.V.; Lederman, M.M. HIV-1 infection impairs cell cycle progression of cd4(+) t cells without affecting early activation responses. J. Clin. Investig. 2001, 108, 757–764. [Google Scholar] [CrossRef]
- Baril, J.G.; Junod, P.; Leblanc, R.; Dion, H.; Therrien, R.; Laplante, F.; Falutz, J.; Cote, P.; Hebert, M.N.; Lalonde, R.; et al. HIV-associated lipodystrophy syndrome: A review of clinical aspects. Can. J. Infect. Dis. Med. Microbiol. J. Can. Des Mal. Infect. Et De La Microbiol. Medicale 2005, 16, 233–243. [Google Scholar] [CrossRef]
- Giralt, M.; Domingo, P.; Guallar, J.P.; Rodriguez de la Concepcion, M.L.; Alegre, M.; Domingo, J.C.; Villarroya, F. HIV-1 infection alters gene expression in adipose tissue, which contributes to HIV-1/haart-associated lipodystrophy. Antivir. Ther. 2006, 11, 729–740. [Google Scholar] [CrossRef]
- Coll, B.; Cabre, A.; Alonso-Villaverde, C.; Lazaro, I.; Aragones, G.; Parra, S.; Girona, J.; Masana, L. The fatty acid binding protein-4 (fabp4) is a strong biomarker of metabolic syndrome and lipodystrophy in HIV-infected patients. Atherosclerosis 2008, 199, 147–153. [Google Scholar] [CrossRef]
- Mujawar, Z.; Rose, H.; Morrow, M.P.; Pushkarsky, T.; Dubrovsky, L.; Mukhamedova, N.; Fu, Y.; Dart, A.; Orenstein, J.M.; Bobryshev, Y.V.; et al. Human immunodeficiency virus impairs reverse cholesterol transport from macrophages. PLoS Biol. 2006, 4, e365. [Google Scholar] [CrossRef]
- Yvan-Charvet, L.; Wang, N.; Tall, A.R. Role of hdl, abca1, and abcg1 transporters in cholesterol efflux and immune responses. Arterioscler. Thromb. Vasc. Biol. 2010, 30, 139–143. [Google Scholar] [CrossRef]
- Mastroianni, C.M.; Liuzzi, G.M. Matrix metalloproteinase dysregulation in HIV infection: Implications for therapeutic strategies. Trends Mol. Med. 2007, 13, 449–459. [Google Scholar] [CrossRef]
- Tomlin, H.; Piccinini, A.M. A complex interplay between the extracellular matrix and the innate immune response to microbial pathogens. Immunology 2018, 155, 186–201. [Google Scholar] [CrossRef]
- Matarrese, P.; Malorni, W. Human immunodeficiency virus (HIV)-1 proteins and cytoskeleton: Partners in viral life and host cell death. Cell Death Differ. 2005, 12 (Suppl. 1), 932–941. [Google Scholar] [CrossRef]
- Stolp, B.; Fackler, O.T. How HIV takes advantage of the cytoskeleton in entry and replication. Viruses 2011, 3, 293–311. [Google Scholar] [CrossRef]
- Woodson, C.M.; Kehn-Hall, K. Examining the role of egr1 during viral infections. Front. Microbiol. 2022, 13, 1020220. [Google Scholar] [CrossRef]
- Wong, L.M.; Li, D.; Tang, Y.; Mendez-Lagares, G.; Thompson, G.R., 3rd; Hartigan-O’Connor, D.J.; Dandekar, S.; Jiang, G. Human immunodeficiency virus-1 latency reversal via the induction of early growth response protein 1 to bypass protein kinase c agonist-associated immune activation. Front. Microbiol. 2022, 13, 836831. [Google Scholar] [CrossRef] [PubMed]
- Gupta, A.; Brown, C.T.; Zheng, Y.H.; Adami, C. Differentially-expressed pseudogenes in HIV-1 infection. Viruses 2015, 7, 5191–5205. [Google Scholar] [CrossRef] [PubMed]
- Han, Y.J.; Gack, M.U.; Olopade, O.I. Emerging roles of pseudogene rnas in antitumor and antiviral immunity. J. Cancer Immunol. 2021, 3, 104–110. [Google Scholar]
- Warren, K.; Wei, T.; Li, D.; Qin, F.; Warrilow, D.; Lin, M.H.; Sivakumaran, H.; Apolloni, A.; Abbott, C.M.; Jones, A.; et al. Eukaryotic elongation factor 1 complex subunits are critical HIV-1 reverse transcription cofactors. Proc. Natl. Acad. Sci. USA 2012, 109, 9587–9592. [Google Scholar] [CrossRef] [PubMed]
- Rawle, D.J.; Li, D.; Swedberg, J.E.; Wang, L.; Soares, D.C.; Harrich, D. HIV-1 uncoating and reverse transcription require eef1a binding to surface-exposed acidic residues of the reverse transcriptase thumb domain. mBio 2018, 9, e00316-18. [Google Scholar] [CrossRef]
- Ou, W.; Silver, J. Role of protein disulfide isomerase and other thiol-reactive proteins in HIV-1 envelope protein-mediated fusion. Virology 2006, 350, 406–417. [Google Scholar] [CrossRef] [PubMed]
- Fenouillet, E.; Barbouche, R.; Courageot, J.; Miquelis, R. The catalytic activity of protein disulfide isomerase is involved in human immunodeficiency virus envelope-mediated membrane fusion after cd4 cell binding. J. Infect. Dis. 2001, 183, 744–752. [Google Scholar] [CrossRef]
- Gadad, S.S.; Rajan, R.E.; Senapati, P.; Chatterjee, S.; Shandilya, J.; Dash, P.K.; Ranga, U.; Kundu, T.K. HIV-1 infection induces acetylation of npm1 that facilitates tat localization and enhances viral transactivation. J. Mol. Biol. 2011, 410, 997–1007. [Google Scholar] [CrossRef]
- Taylor, H.E.; Palmer, C.S. Cd4 t cell metabolism is a major contributor of HIV infectivity and reservoir persistence. Immunometabolism 2020, 2, e200005. [Google Scholar] [CrossRef]
- Kang, S.; Tang, H. HIV-1 infection and glucose metabolism reprogramming of t cells: Another approach toward functional cure and reservoir eradication. Front. Immunol. 2020, 11, 572677. [Google Scholar] [CrossRef]
- Rauskolb, C.; Pan, G.; Reddy, B.V.; Oh, H.; Irvine, K.D. Zyxin links fat signaling to the hippo pathway. PLoS Biol. 2011, 9, e1000624. [Google Scholar] [CrossRef] [PubMed]
- Zhang, S.; Zhang, B.; Xu, X.; Wang, L.; Feng, X.; Wang, Q.; Huang, H.; Wu, J.; Li, P.; Wang, J. HIV-1 viral protein r downregulates ebp1 and stabilizes p53 in glioblastoma u87mg cells. Clin. Transl. Oncol. Off. Publ. Fed. Span. Oncol. Soc. Natl. Cancer Inst. Mex. 2014, 16, 293–300. [Google Scholar] [CrossRef] [PubMed]
- Vincendeau, M.; Nagel, D.; Brenke, J.K.; Brack-Werner, R.; Hadian, K. Heterogenous nuclear ribonucleoprotein q increases protein expression from HIV-1 rev-dependent transcripts. Virol. J. 2013, 10, 151. [Google Scholar] [CrossRef] [PubMed]
- Jacquenet, S.; Decimo, D.; Muriaux, D.; Darlix, J.L. Dual effect of the sr proteins asf/sf2, sc35 and 9g8 on HIV-1 rna splicing and virion production. Retrovirology 2005, 2, 33. [Google Scholar] [CrossRef] [PubMed]
- Ma, X.; Yang, T.; Luo, Y.; Wu, L.; Jiang, Y.; Song, Z.; Pan, T.; Liu, B.; Liu, G.; Liu, J.; et al. Trim28 promotes HIV-1 latency by sumoylating cdk9 and inhibiting p-tefb. eLife 2019, 8, e42426. [Google Scholar] [CrossRef] [PubMed]
- Milev, M.P.; Ravichandran, M.; Khan, M.F.; Schriemer, D.C.; Mouland, A.J. Characterization of staufen1 ribonucleoproteins by mass spectrometry and biochemical analyses reveal the presence of diverse host proteins associated with human immunodeficiency virus type 1. Front. Microbiol. 2012, 3, 367. [Google Scholar] [CrossRef]
- Sun, C.; Huang, S.; Wang, H.; Xie, R.; Zhang, L.; Zhou, Q.; He, X.; Ju, W. Non-smc condensin i complex subunit h enhances proliferation, migration, and invasion of hepatocellular carcinoma. Mol. Carcinog. 2019, 58, 2266–2275. [Google Scholar] [CrossRef] [PubMed]
- Tan, X.; Zheng, C.; Zhuang, Y.; Jin, P.; Wang, F. The m6a reader prrc2a is essential for meiosis i completion during spermatogenesis. Nat. Commun. 2023, 14, 1636. [Google Scholar] [CrossRef]
- Bagga, S.; Bouchard, M.J. Cell cycle regulation during viral infection. Methods Mol. Biol. 2014, 1170, 165–227. [Google Scholar]
- Babaahmady, K.; Oehlmann, W.; Singh, M.; Lehner, T. Inhibition of human immunodeficiency virus type 1 infection of human cd4+ t cells by microbial hsp70 and the peptide epitope 407-426. J. Virol. 2007, 81, 3354–3360. [Google Scholar] [CrossRef]
- Sugiyama, R.; Nishitsuji, H.; Furukawa, A.; Katahira, M.; Habu, Y.; Takeuchi, H.; Ryo, A.; Takaku, H. Heat shock protein 70 inhibits HIV-1 vif-mediated ubiquitination and degradation of apobec3g. J. Biol. Chem. 2011, 286, 10051–10057. [Google Scholar] [CrossRef] [PubMed]
- Agostini, I.; Popov, S.; Li, J.; Dubrovsky, L.; Hao, T.; Bukrinsky, M. Heat-shock protein 70 can replace viral protein r of HIV-1 during nuclear import of the viral preintegration complex. Exp. Cell Res. 2000, 259, 398–403. [Google Scholar] [CrossRef]
- Iyer, K.; Chand, K.; Mitra, A.; Trivedi, J.; Mitra, D. Diversity in heat shock protein families: Functional implications in virus infection with a comprehensive insight of their role in the HIV-1 life cycle. Cell Stress Chaperones 2021, 26, 743–768. [Google Scholar] [CrossRef] [PubMed]
- Hong, S.; Choi, G.; Park, S.; Chung, A.S.; Hunter, E.; Rhee, S.S. Type d retrovirus gag polyprotein interacts with the cytosolic chaperonin tric. J. Virol. 2001, 75, 2526–2534. [Google Scholar] [CrossRef] [PubMed]
- Ponka, P.; Lok, C.N. The transferrin receptor: Role in health and disease. Int. J. Biochem. Cell Biol. 1999, 31, 1111–1137. [Google Scholar] [CrossRef] [PubMed]
- Chang, H.C.; Bayeva, M.; Taiwo, B.; Palella, F.J., Jr.; Hope, T.J.; Ardehali, H. Short communication: High cellular iron levels are associated with increased HIV infection and replication. AIDS Res. Hum. Retroviruses 2015, 31, 305–312. [Google Scholar] [CrossRef] [PubMed]
- Madrid, R.; Janvier, K.; Hitchin, D.; Day, J.; Coleman, S.; Noviello, C.; Bouchet, J.; Benmerah, A.; Guatelli, J.; Benichou, S. Nef-induced alteration of the early/recycling endosomal compartment correlates with enhancement of HIV-1 infectivity. J. Biol. Chem. 2005, 280, 5032–5044. [Google Scholar] [CrossRef]
- Koppensteiner, H.; Hohne, K.; Gondim, M.V.; Gobert, F.X.; Widder, M.; Gundlach, S.; Heigele, A.; Kirchhoff, F.; Winkler, M.; Benaroch, P.; et al. Lentiviral nef suppresses iron uptake in a strain specific manner through inhibition of transferrin endocytosis. Retrovirology 2014, 11, 1. [Google Scholar] [CrossRef]
- Mazel-Sanchez, B.; Niu, C.; Williams, N.; Bachmann, M.; Choltus, H.; Silva, F.; Serre-Beinier, V.; Karenovics, W.; Iwaszkiewicz, J.; Zoete, V.; et al. Influenza a virus exploits transferrin receptor recycling to enter host cells. Proc. Natl. Acad. Sci. USA 2023, 120, e2214936120. [Google Scholar] [CrossRef]
- Audia, S.; Brescia, C.; Dattilo, V.; D’Antona, L.; Calvano, P.; Iuliano, R.; Trapasso, F.; Perrotti, N.; Amato, R. Ranbp1 (ran binding protein 1): The missing genetic piece in cancer pathophysiology and other complex diseases. Cancers 2023, 15, 486. [Google Scholar] [CrossRef]
- Zapalska-Sozoniuk, M.; Chrobak, L.; Kowalczyk, K.; Kankofer, M. Is it useful to use several “omics” for obtaining valuable results? Mol. Biol. Rep. 2019, 46, 3597–3606. [Google Scholar] [CrossRef] [PubMed]
- Bolger, A.M.; Lohse, M.; Usadel, B. Trimmomatic: A flexible trimmer for illumina sequence data. Bioinformatics 2014, 30, 2114–2120. [Google Scholar] [CrossRef] [PubMed]
- Andrews, S. Fastqc: A Quality Control Tool for High Throughput Sequence Data. Available online: http://www.bioinformatics.babraham.ac.uk/projects/fastqc/ (accessed on 30 January 2023).
- Langmead, B.; Trapnell, C.; Pop, M.; Salzberg, S.L. Ultrafast and memory-efficient alignment of short DNA sequences to the human genome. Genome Biol. 2009, 10, R25. [Google Scholar] [CrossRef] [PubMed]
- Yates, A.; Akanni, W.; Amode, M.R.; Barrell, D.; Billis, K.; Carvalho-Silva, D.; Cummins, C.; Clapham, P.; Fitzgerald, S.; Gil, L.; et al. Ensembl 2016. Nucleic Acids Res. 2016, 44, D710–D716. [Google Scholar] [CrossRef] [PubMed]
- The R Development Core Team. R: A Language and Environment for Statistical Computing; R Foundation for Statistical Computing: Vienna, Austria; Available online: https://www.R-project.org/ (accessed on 25 May 2023).
- Love, M.I.; Huber, W.; Anders, S. Moderated estimation of fold change and dispersion for rna-seq data with deseq2. Genome Biol. 2014, 15, 550. [Google Scholar] [CrossRef] [PubMed]
- Stephens, M. False discovery rates: A new deal. Biostatistics 2017, 18, 275–294. [Google Scholar] [CrossRef]
- Yu, G.; Wang, L.G.; Han, Y.; He, Q.Y. Clusterprofiler: An r package for comparing biological themes among gene clusters. Omics J. Integr. Biol. 2012, 16, 284–287. [Google Scholar] [CrossRef]
- Dzieciatkowska, M.; Hill, R.; Hansen, K.C. Gelc-ms/ms analysis of complex protein mixtures. Methods Mol. Biol. 2014, 1156, 53–66. [Google Scholar]
- Cox, J.; Mann, M. Maxquant enables high peptide identification rates, individualized p.P.B.-range mass accuracies and proteome-wide protein quantification. Nat. Biotechnol. 2008, 26, 1367–1372. [Google Scholar] [CrossRef]
- Oberg, A.L.; Vitek, O. Statistical design of quantitative mass spectrometry-based proteomic experiments. J. Proteome Res. 2009, 8, 2144–2156. [Google Scholar] [CrossRef]
- Bates, D.; Mächler, M.; Bolker, B.; Walker, S. Fitting Linear Mixed-Effects Models Using lme4. J. Stat. Softw. 2015, 67, 1–48. [Google Scholar] [CrossRef]
- Alexa, A.; Rahnenfuhrer, J.; Lengauer, T. Improved scoring of functional groups from gene expression data by decorrelating go graph structure. Bioinformatics 2006, 22, 1600–1607. [Google Scholar] [CrossRef] [PubMed]
- Elio CampitelliGgnewscale: Multiple Fill and Colour Scales in ‘ggplot2’. R Package Version 0.4.9. Available online: https://CRAN.R-project.org/package=ggnewscale (accessed on 30 January 2023).


Disclaimer/Publisher’s Note: The statements, opinions and data contained in all publications are solely those of the individual author(s) and contributor(s) and not of MDPI and/or the editor(s). MDPI and/or the editor(s) disclaim responsibility for any injury to people or property resulting from any ideas, methods, instructions or products referred to in the content. |
© 2023 by the authors. Licensee MDPI, Basel, Switzerland. This article is an open access article distributed under the terms and conditions of the Creative Commons Attribution (CC BY) license (https://creativecommons.org/licenses/by/4.0/).
Share and Cite
Linkner, T.R.; Ambrus, V.; Kunkli, B.; Szojka, Z.I.; Kalló, G.; Csősz, É.; Kumar, A.; Emri, M.; Tőzsér, J.; Mahdi, M. Comparative Analysis of Differential Cellular Transcriptome and Proteome Regulation by HIV-1 and HIV-2 Pseudovirions in the Early Phase of Infection. Int. J. Mol. Sci. 2024, 25, 380. https://doi.org/10.3390/ijms25010380
Linkner TR, Ambrus V, Kunkli B, Szojka ZI, Kalló G, Csősz É, Kumar A, Emri M, Tőzsér J, Mahdi M. Comparative Analysis of Differential Cellular Transcriptome and Proteome Regulation by HIV-1 and HIV-2 Pseudovirions in the Early Phase of Infection. International Journal of Molecular Sciences. 2024; 25(1):380. https://doi.org/10.3390/ijms25010380
Chicago/Turabian StyleLinkner, Tamás Richárd, Viktor Ambrus, Balázs Kunkli, Zsófia Ilona Szojka, Gergő Kalló, Éva Csősz, Ajneesh Kumar, Miklós Emri, József Tőzsér, and Mohamed Mahdi. 2024. "Comparative Analysis of Differential Cellular Transcriptome and Proteome Regulation by HIV-1 and HIV-2 Pseudovirions in the Early Phase of Infection" International Journal of Molecular Sciences 25, no. 1: 380. https://doi.org/10.3390/ijms25010380
APA StyleLinkner, T. R., Ambrus, V., Kunkli, B., Szojka, Z. I., Kalló, G., Csősz, É., Kumar, A., Emri, M., Tőzsér, J., & Mahdi, M. (2024). Comparative Analysis of Differential Cellular Transcriptome and Proteome Regulation by HIV-1 and HIV-2 Pseudovirions in the Early Phase of Infection. International Journal of Molecular Sciences, 25(1), 380. https://doi.org/10.3390/ijms25010380