Article

Systematic Multiomic Analysis of PKHD1L1 Gene Expression and Its Role as a Predicting Biomarker for Immune Cell Infiltration in Skin Cutaneous Melanoma and Lung Adenocarcinoma

1
Department of Health Industry, Sookmyung Women’s University, Seoul 04310, Republic of Korea
2
Department of Cosmetic Sciences, Sookmyung Women’s University, Seoul 04310, Republic of Korea
3
Department of Biological Sciences, Sookmyung Women’s University, Seoul 04310, Republic of Korea
*
Author to whom correspondence should be addressed.
These authors have contributed equally to this work.
Int. J. Mol. Sci. 2024, 25(1), 359; https://doi.org/10.3390/ijms25010359
Submission received: 8 November 2023 / Revised: 16 December 2023 / Accepted: 21 December 2023 / Published: 26 December 2023
(This article belongs to the Special Issue Cancer Biomarkers and Bioinformatics)

Abstract

:
The identification of genetic factors that regulate the cancer immune microenvironment is important for understanding the mechanism of tumor progression and establishing an effective treatment strategy. Polycystic kidney and hepatic disease 1-like protein 1 (PKHD1L1) is a large transmembrane protein that is highly expressed in immune cells; however, its association with tumor progression remains unclear. Here, we systematically analyzed the clinical relevance of PKHD1L1 in the tumor microenvironment in multiple cancer types using various bioinformatic tools. We found that the PKHD1L1 mRNA expression levels were significantly lower in skin cutaneous melanoma (SKCM) and lung adenocarcinoma (LUAD) than in normal tissues. The decreased expression of PKHD1L1 was significantly associated with unfavorable overall survival (OS) in SKCM and LUAD. Additionally, PKHD1L1 expression was positively correlated with the levels of infiltrating B cells, cluster of differentiation (CD)-8+ T cells, and natural killer (NK) cells, suggesting that the infiltration of immune cells could be associated with a good prognosis due to increased PKHD1L1 expression. Gene ontology (GO) analysis also revealed the relationship between PKHD1L1-co-altered genes and the activation of lymphocytes, including B and T cells. Collectively, this study shows that PKHD1L1 expression is positively correlated with a good prognosis via the induction of immune infiltration, suggesting that PKHD1L1 has potential prognostic value in SKCM and LUAD.

1. Introduction

Despite recent improvements in patient survival, cancer remains one of the leading causes of premature death in all countries of the world [1]. In particular, lung cancer is the leading cause of cancer death in both men and women, with an estimated 1.8 million deaths worldwide in 2020 [2]. In the United States, lung cancer caused approximately 135,000 deaths in 2020, accounting for nearly 25% of all cancer-related deaths [3]. Melanoma, the most aggressive skin cancer, accounts for only 1.7% of all skin cancers; however, it is responsible for 80% of skin cancer-related mortality [4,5]. In recent years, the understanding of cancer biology and new treatments, such as targeted therapy and immunotherapy, have helped reduce mortality; however, the mortality rates for melanoma and lung cancer remain high [5,6].
Oncogenesis is a complex process that includes the accumulation of multiple genetic alterations that cause uncontrolled cell growth, aberrant functions, and the modulation of the tumor microenvironment (TME) [7]. Various immune cells, of which the majority of the TME is comprised, are found in tumor tissues. Tumor-infiltrating lymphocytes (TILs) are tightly associated with the fate, invasiveness, and metastatic ability of tumors, as well as with the clinical outcomes in patients with cancer [8,9]. Therefore, the amount and composition of the TILs in tumor tissues are known to be associated with the prognoses of various malignant tumors [10,11,12]. Indeed, high levels of lymphocyte infiltration in melanoma patients are known to be associated with better prognoses. The presence of CD4+ and CD8+ lymphocytes at the tumor site in melanoma and non-small cell lung cancer has been reported to have good prognostic significance for the OS [13,14,15,16,17]. In particular, tumor-infiltrating B lymphocytes (TIBs) participate in both humoral and cellular immunity and have been shown to play opposing roles in anti-tumor activity and immunosuppressive subtypes [18,19,20]. Therefore, it is necessary to study the TIL population and its role in predicting the potential clinical prognosis.
Recently, various immunotherapies have been developed for the clinical treatment of cancer. Immunotherapy, which is based on the interaction between tumor cells and immune cells, has been effective in only a minority of cancer patients, and its mechanism is still unknown [21,22,23,24]. Because biomarkers can predict the advantages of a patient’s treatment strategy, they can be suggested as alternatives to overcome the selective therapeutic effect of immunotherapy [6].
Polycystic kidney and hepatic disease 1-like protein 1 (PKHD1L1) encodes fibrocystin-L, a transmembrane protein that includes a large extracellular domain (4190 amino acids (AAs)), transmembrane domain (21 AAs), and very small intracellular C-terminal domain (12 AAs) (https://www.uniprot.org/uniprot/Q86WI1: accessed on 15 January 2023) [25]. Its extracellular domain includes 13 Ig-like plexin transcription factor (IPT) domains, 2 G8 domains, and 9 parallel beta helix repeats (PbH1) [26]. These frequently appear in the extracellular domain of membrane proteins and are involved in interactions with possible ligands, such as polysaccharides [27,28,29]. Recent studies have reported an association between PKHD1L1 expression, tumor progression, and genetic modifications. PKHD1L1 is one of the most highly mutated genes in triple-negative breast cancer [30]. The PKHD1L1 expression in thyroid cancer is downregulated compared to that in normal tissues. This downregulation is associated with various clinicopathological features, including the tumor volume, metastasis, the clinical stage, and lymph node metastasis [31,32]. However, the role of the PKHD1L1 gene in various cancers has not yet been discussed. The aim of this study was to investigate the PKHD1L1 expressions in various cancers using multiomic analysis, and to confirm the clinical relevance of PKHD1L1 through the association between PKHD1L1 expression and the survival of melanoma and lung cancer patients.
We comprehensively analyzed various publicly available expression datasets to determine the PKHD1L1 expression levels and their prognostic values. The Gene Expression Profiling Interactive Analysis 2 (GEPIA2) database and Gene Expression database of Normal and Tumor Tissues 2 (GENT2) were used to confirm the mRNA expression of PKHD1L1 in various types of tumors. The Tumor Immune Estimation Resource (TIMER) and TISIDB were utilized to determine the potential correlation between the PKHD1L1 expression levels and TILs. Additionally, co-expression analysis and gene ontology (GO) were used to investigate the potential pathways associated with PKHD1L1 in SKCM and LUAD. Collectively, our findings revealed that the PKHD1L1 expression in SKCM and LUAD is positively correlated with patient survival and the infiltration of immune cells in tumors, including B cells, cluster of differentiation (CD)-8+ T cells, and natural killer (NK) cells. Therefore, we suggest PKHD1L1 and its associated pathways as potential therapeutic targets for SKCM and LUAD.

2. Results

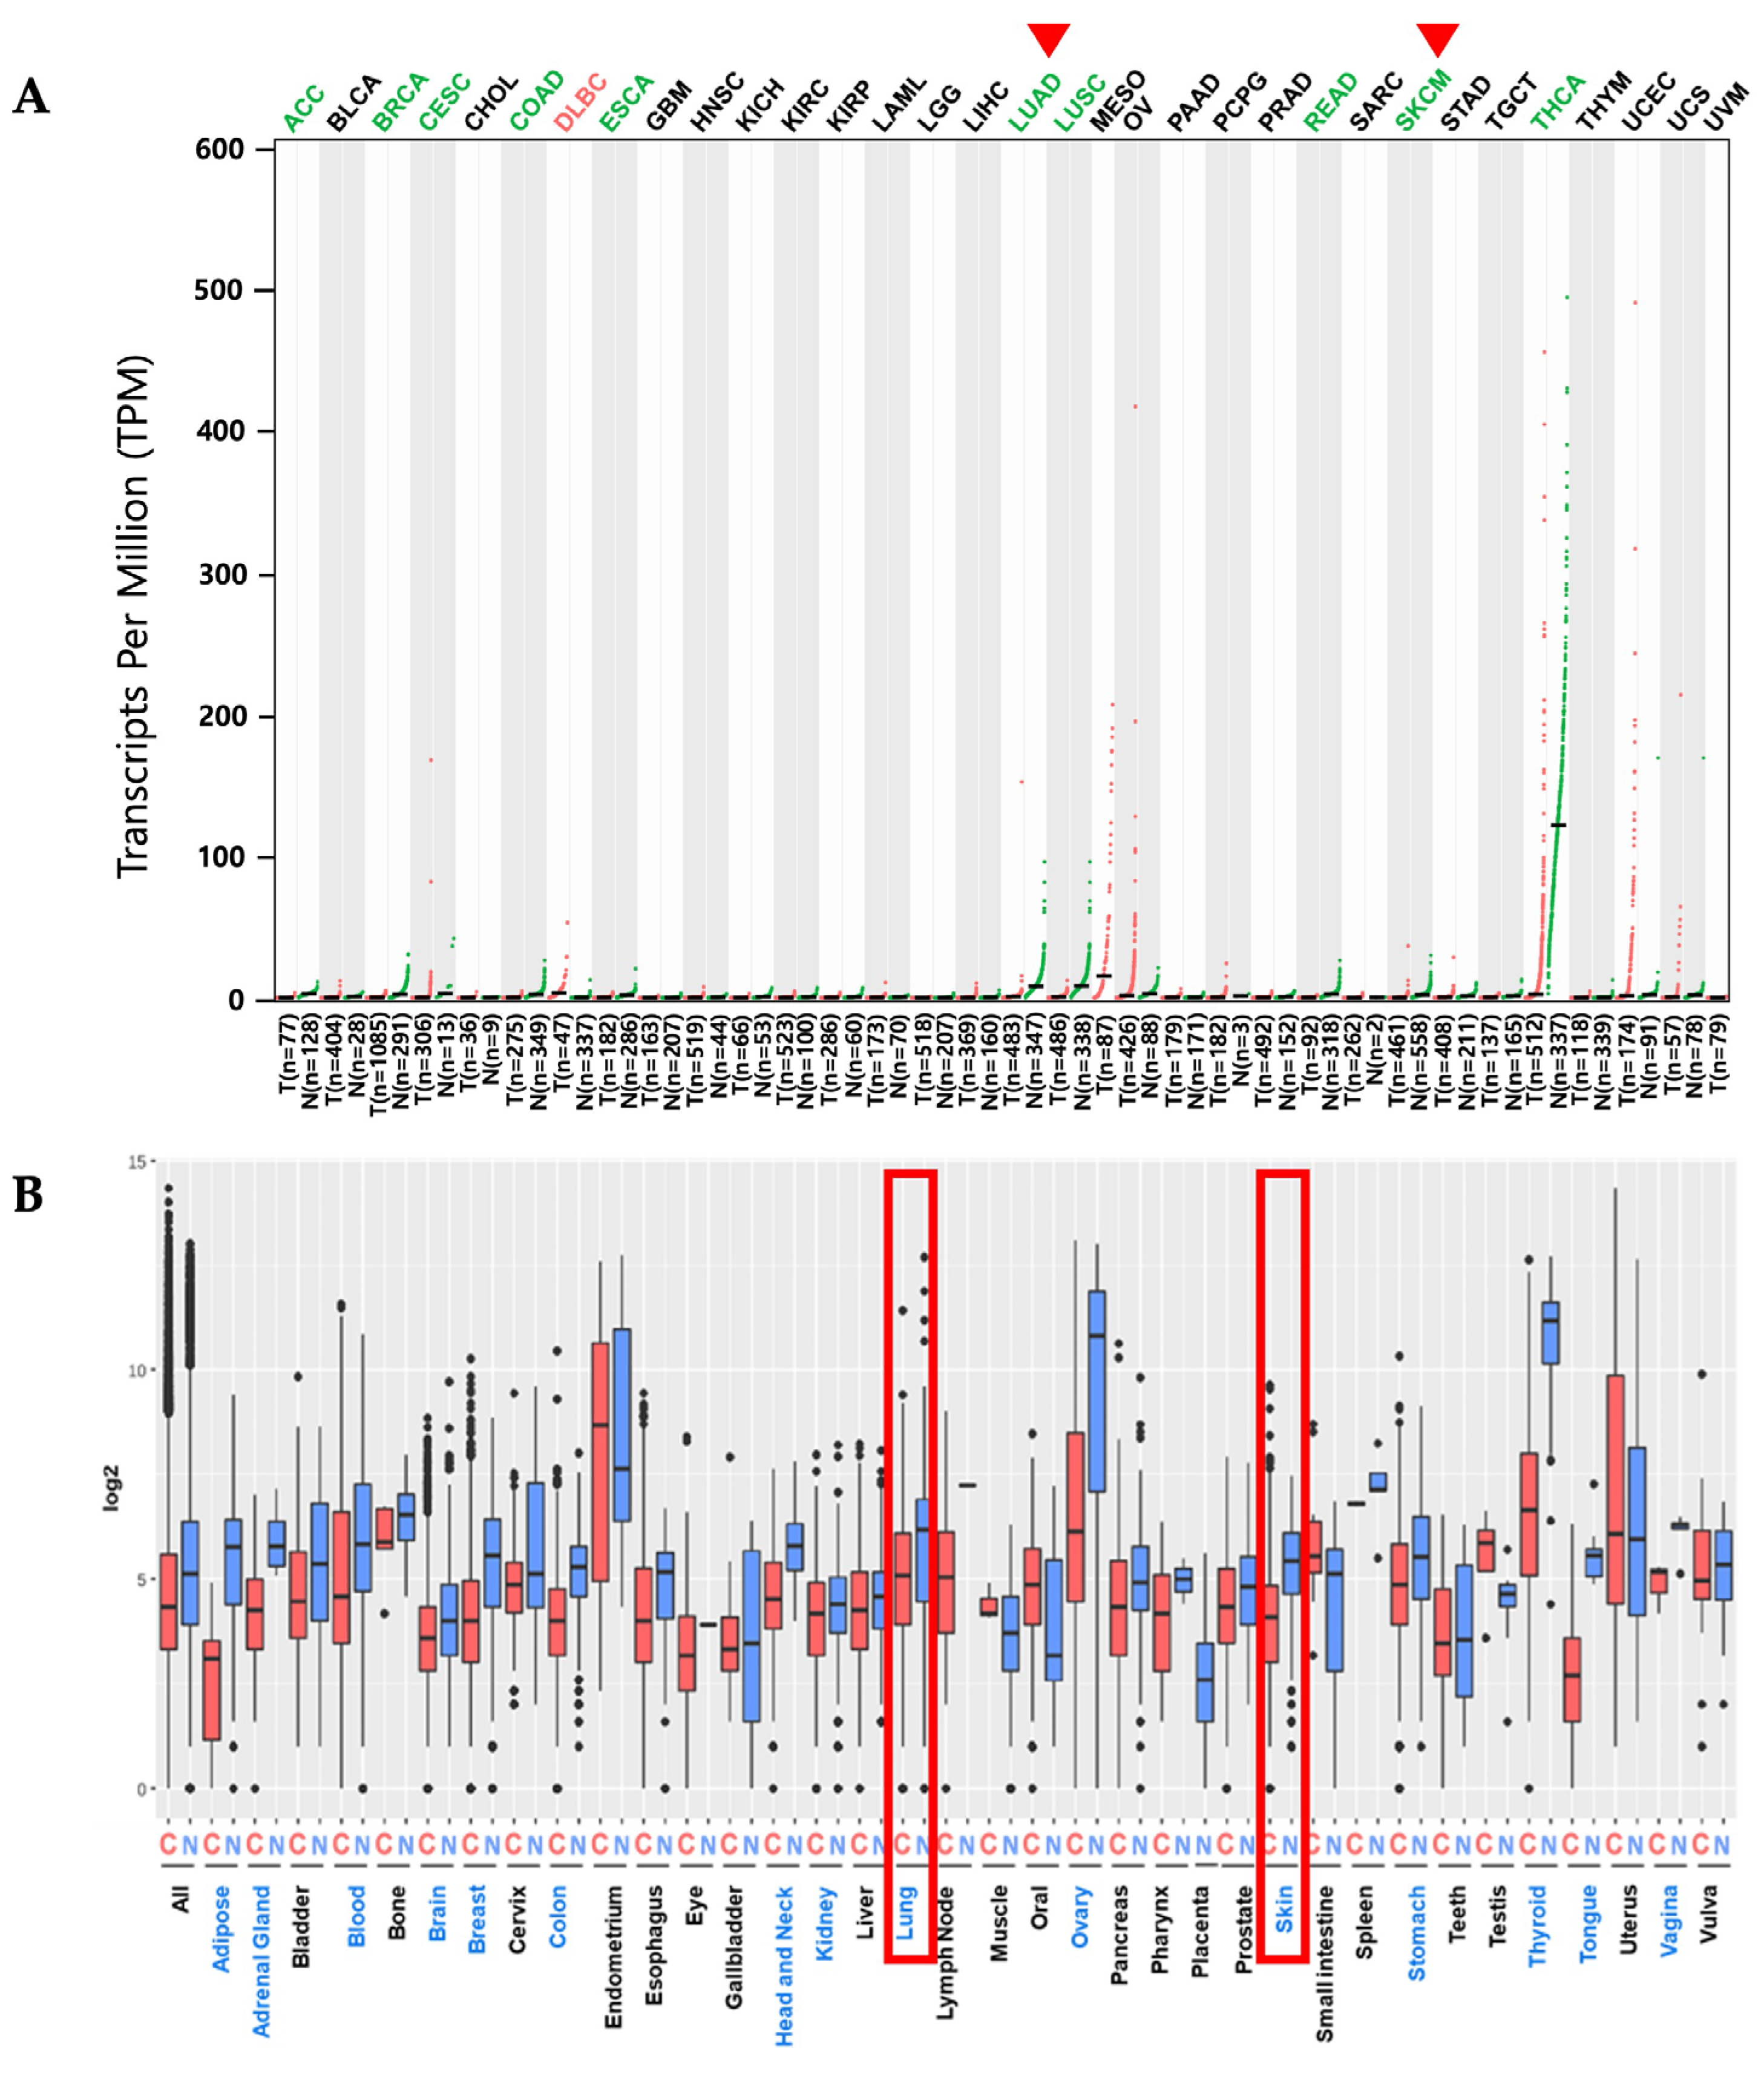
2.1. PKHD1L1 mRNA Expression Levels in Various Cancer Types

We analyzed the differential expression patterns of PKHD1L1 in various cancer types using web-based gene expression analysis tools, such as GEPIA2 and the GENT2. GEPIA2 was used to identify the PKHD1L1 mRNA expressions in various cancers compared to normal tissues in RNA-sequencing data based on TCGA and GTEx datasets. The PKHD1L1 mRNA expression was significantly downregulated in multiple cancers, including adrenocortical carcinoma (ACC), breast invasive carcinoma (BRCA), cervical squamous cell carcinoma and endocervical adenocarcinoma (CESC), esophageal carcinoma (ESCA), LUAD, lung squamous cell carcinoma (LUSC), rectum adenocarcinoma (READ), SKCM, and thyroid carcinoma (THCA), compared with normal tissues (Figure 1A). We used the GENT2 to analyze the expression levels of multiple cancers from the microarray-based gene expression datasets profiled by the Affymetrix u133 platform. Figure 1B shows that the PKHD1L1 mRNA expression was downregulated in 14 cancer types, including skin and lung cancer. Increased PKHD1L1 expression was observed only in lymphoid neoplasm diffuse large B cell lymphoma (DLBCL) in the GEPIA. Collectively, the results of this study showed that the mRNA expression of the PKHD1L1 gene in several types of cancer, including SKCM and LUAD, was significantly lower than that in normal tissues.

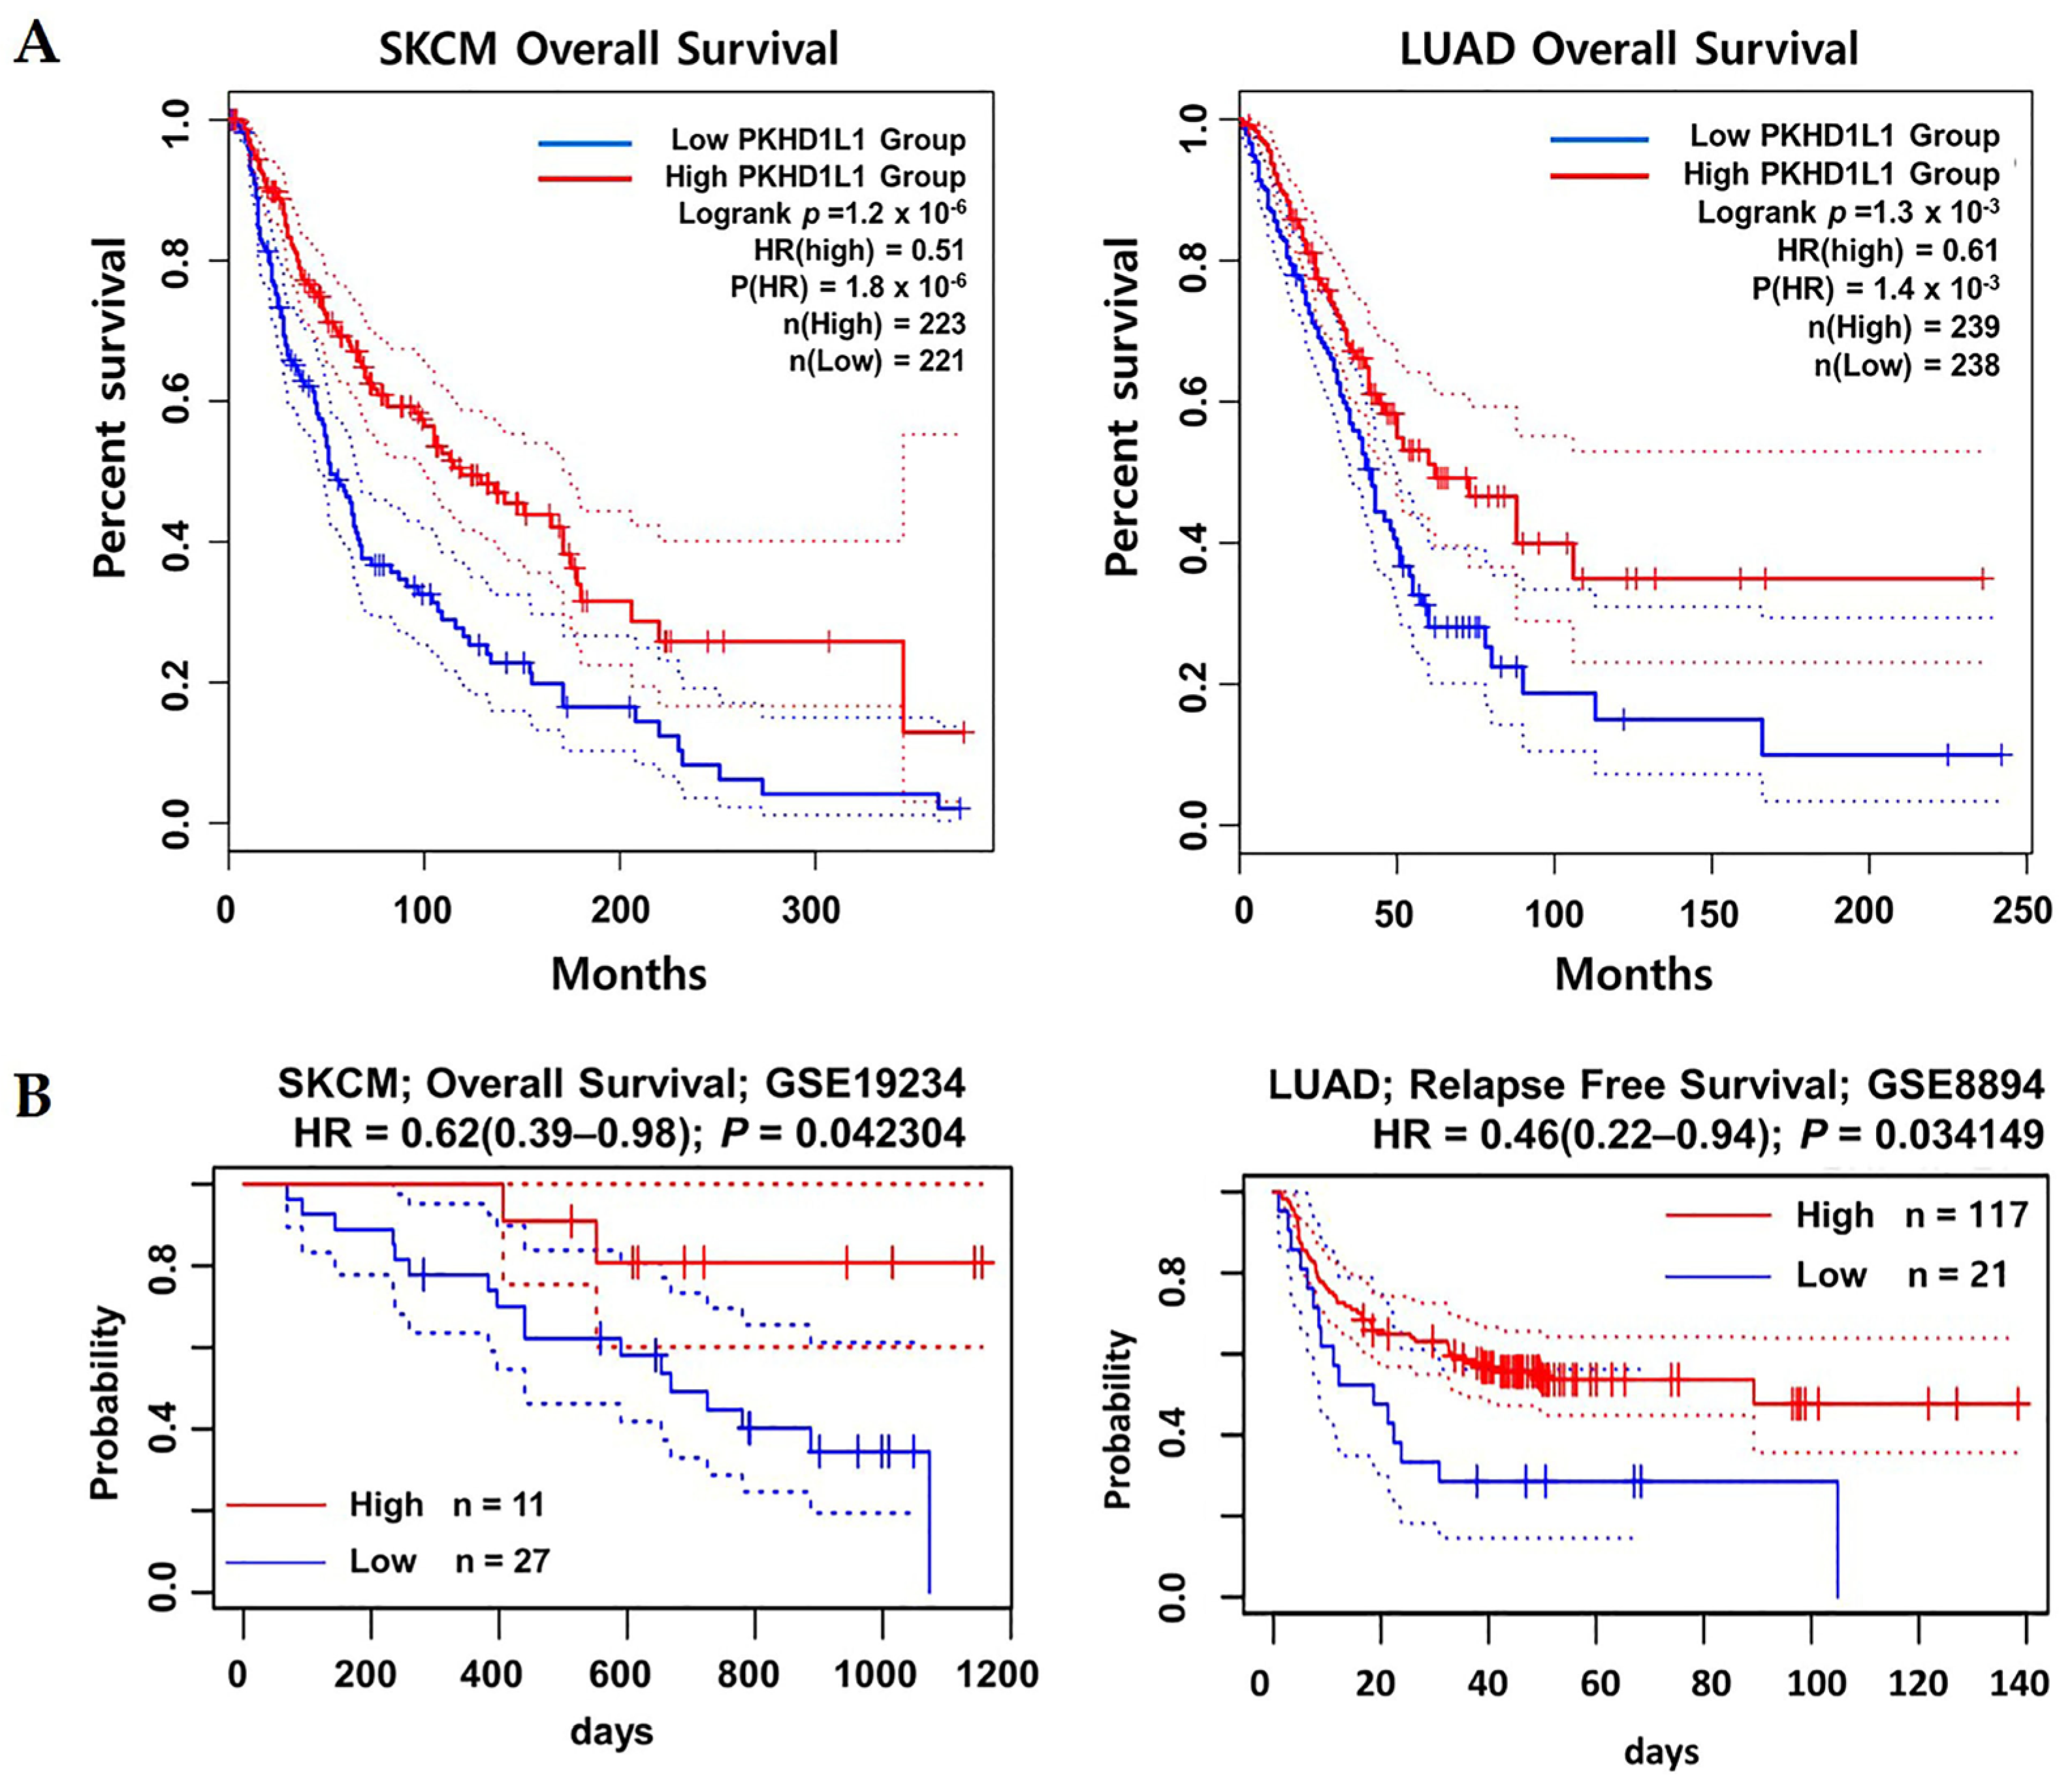
2.2. Prognostic Values of PKHD1L1 mRNA Expression Levels in Various Types of Cancers

To explore the association between the PKHD1L1 mRNA expression and patient prognoses in various cancers, the OS rates were compared between two patient groups with high and low PKHD1L1 expressions in various TCGA datasets using the OncoLnc online tool (http://www.oncolnc.org/: accessed on 3 May 2023). The Cox regression results for the PKHD1L1 expressions in various cancers are presented in Supplementary Table S3. Five cancer types, SKCM, pancreatic adenocarcinoma (PAAD), LUAD, liver hepatocellular carcinoma (LIHC), and stomach adenocarcinoma (STAD), showed significant correlations between the overall patient survival and PKHD1L1 mRNA expression (p < 0.01). Among the five cancer types, SKCM and LUAD showed the highest correlations and decreased PKHD1L1 expressions compared to their normal counterparts (Figure 1). Therefore, we selected SKCM and LUAD for further analyses. Kaplan–Meier survival curves with TCGA datasets were retrieved from the GEPIA2 database for SKCM, LUAD, and other cancer types. The most significant positive correlations between the PKHD1L1 mRNA expression levels and patient survival rates were found in SKCM (log-rank p = 1.2 × 10⁻⁶) and LUAD (log-rank p = 1.3 × 10⁻³), while negative correlations were observed in kidney renal papillary cell carcinoma (KIRP), PAAD, and STAD (Figure 2, Supplementary Figure S2). Additionally, we performed a survival analysis in skin and lung cancer datasets using the PrognoScan database to investigate the prognostic implications of PKHD1L1 expression. The results also showed that PKHD1L1 expression was positively associated with patient survival in the melanoma dataset GSE19234 (OS, hazard ratio (HR) = 0.62 (0.39–0.98), p = 0.042304) and lung cancer dataset GSE8894 (relapse-free survival (RFS), HR = 0.46 (0.22–0.94), p = 0.034149) (Figure 2B). Moreover, the association between the PKHD1L1 expression and OS in the clinicopathological parameters, including sex, age, and tumor stage, was analyzed in the SKCM-TCGA and LUAD-TCGA datasets using the R2 web tool (Supplementary Figure S1). Significantly better patient survival in the high-PKHD1L1-expression group was found in the 30-years-and-older patient age groups in SKCM and in the 50-years-and-older groups in LUAD. A positive correlation between patient survival and PKHD1L1 expression was also observed in cancer stages 1, 2, and 3 in SKCM and LUAD, but not in stage 4 in SKCM. Overall, PKHD1L1 expression was remarkedly positively associated with patient survival in SKCM and LUAD, suggesting its prognostic value in SKCM and LUAD.

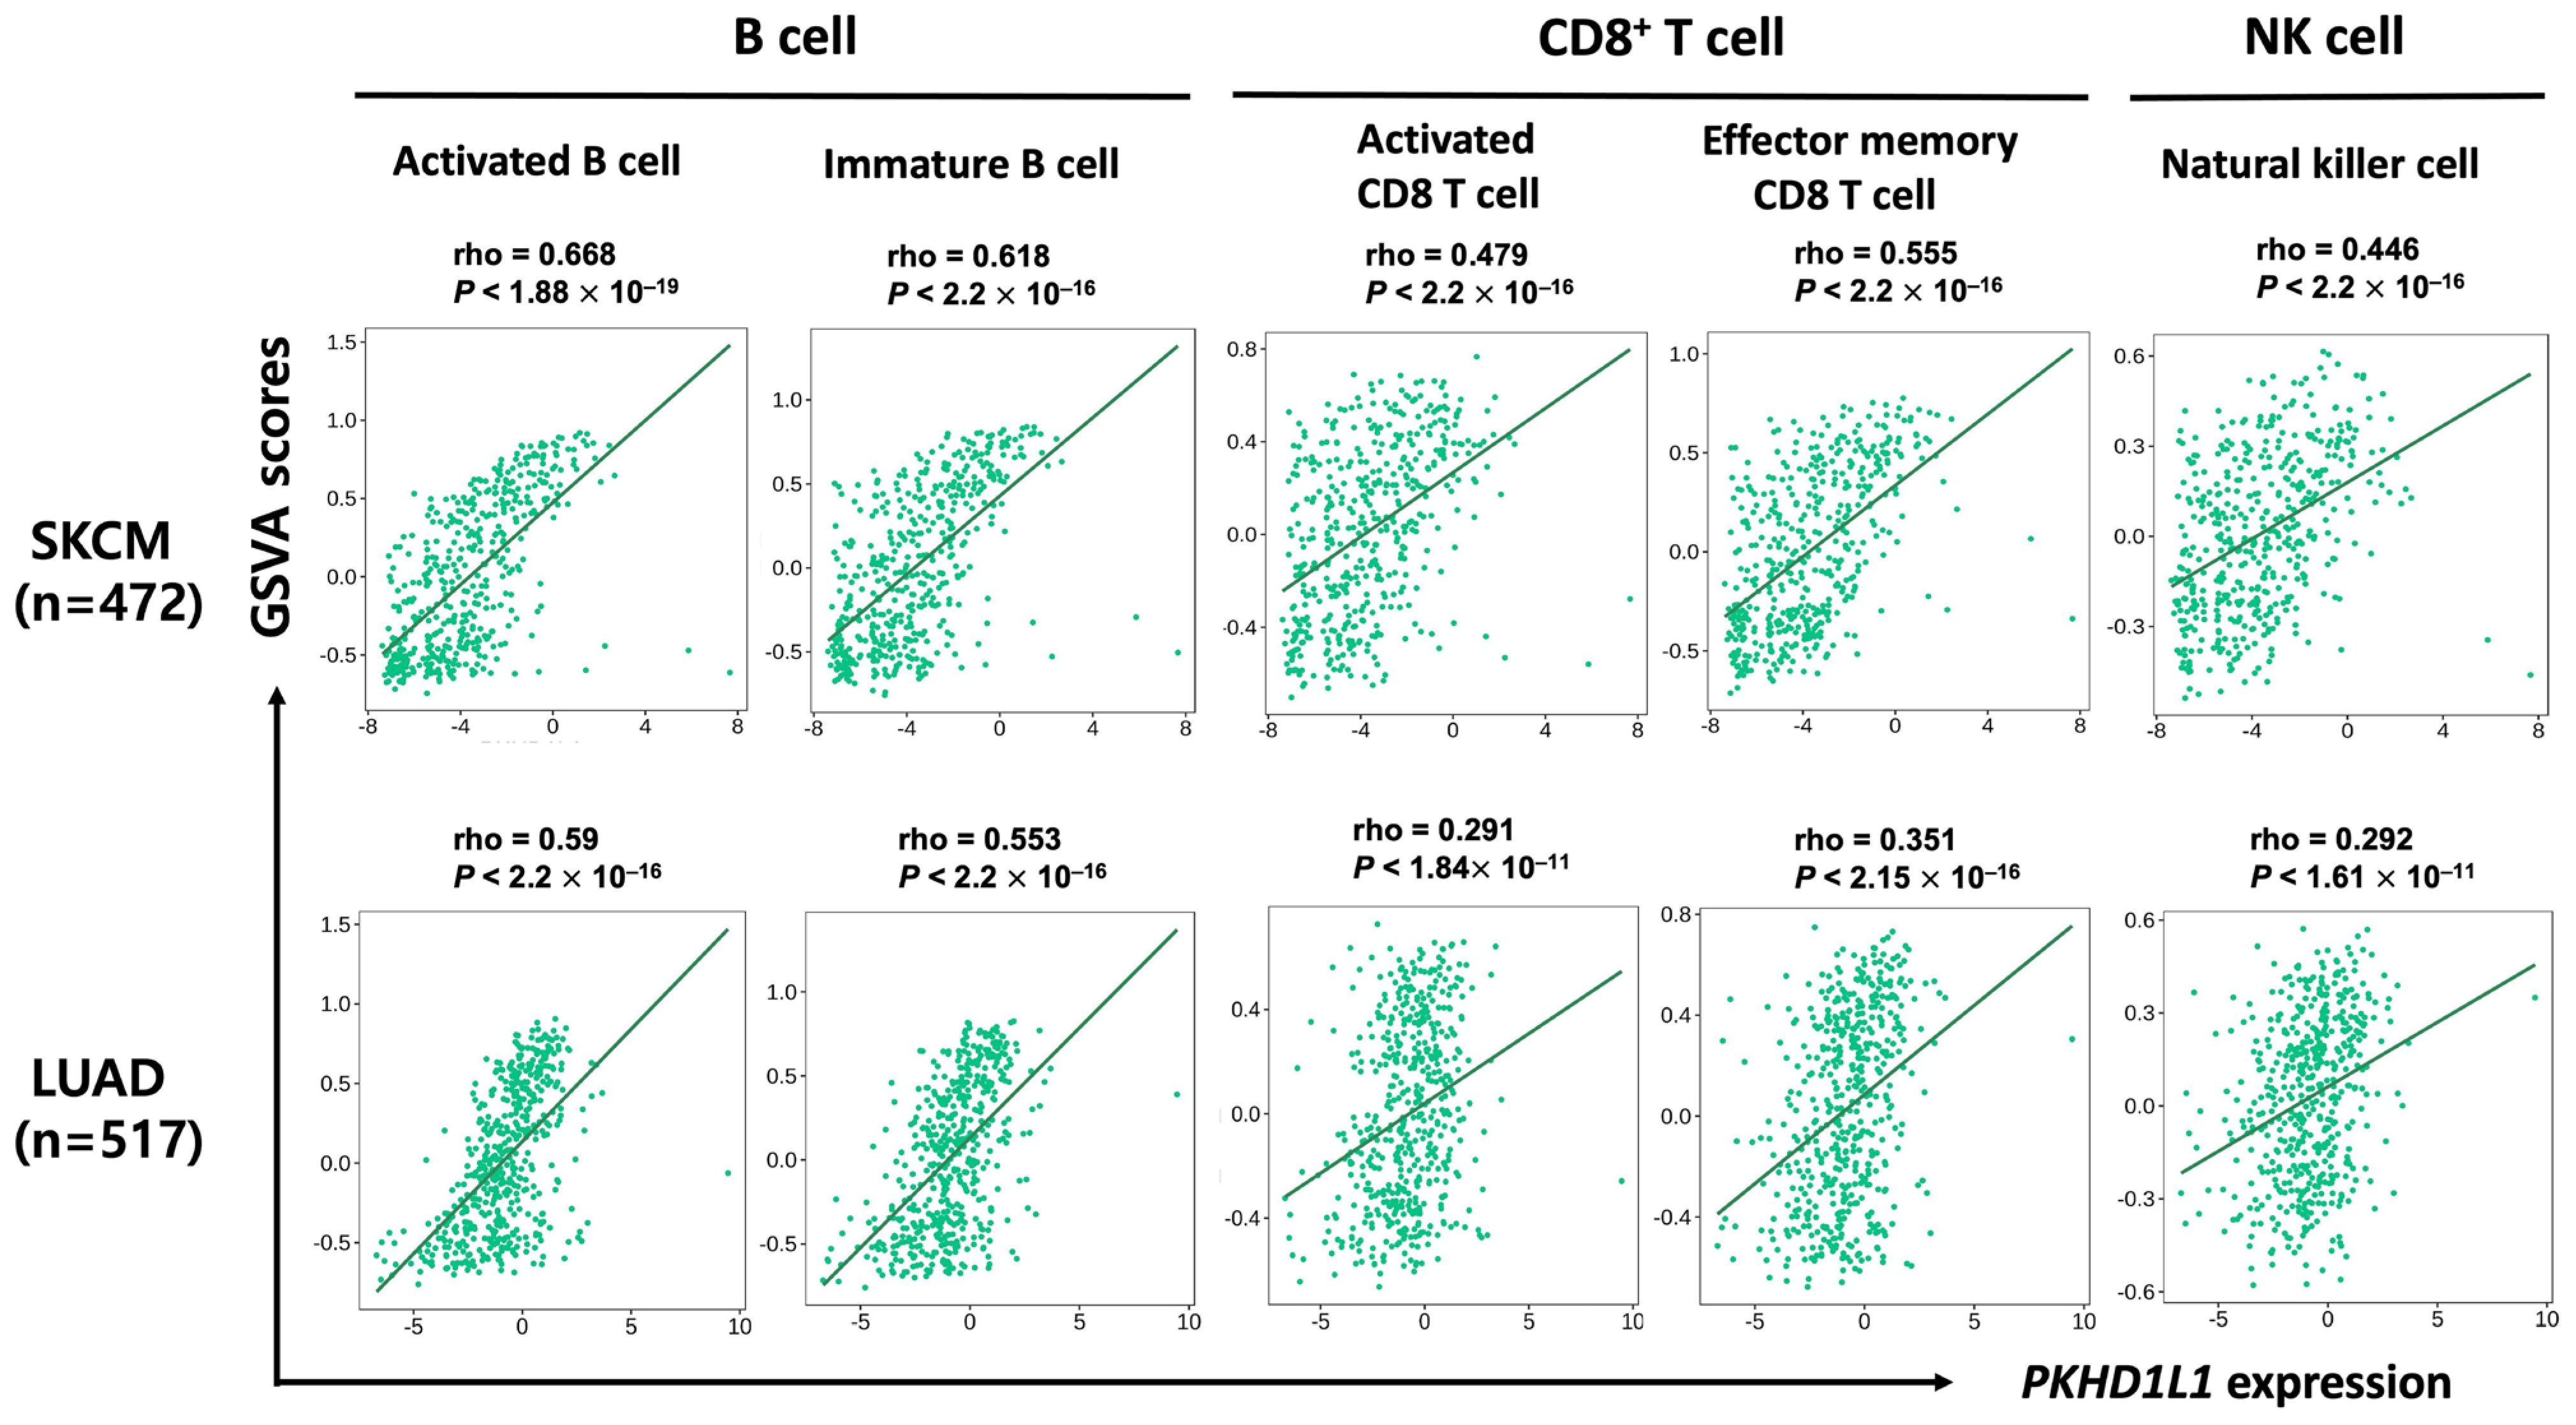
2.3. Correlation of PKHD1L1 Expression and Immune Cell Infiltration

Because SKCM and LUAD are hot tumors with high lymphocyte contents and responsiveness to immune checkpoint inhibitors [33,34], we analyzed the association between the PKHD1L1 expression and infiltrated immune cell types. For this, we used the TIMER version 1.0 database (https://cistrome.shinyapps.io/timer/: accessed on 3 May 2023). The results showed that the PKHD1L1 expression was significantly correlated with B cells and CD8+ T cells in SKCM and LUAD (Table 1). We further analyzed whether the PKHD1L1 expression levels were correlated with the specific immune cell infiltration in SKCM using the TISIDB web tool. The PKHD1L1 expression was significantly positively correlated with the infiltrating levels of activated B cells (r = 0.668, p < 2.2 × 10⁻¹⁶), immature B cells (r = 0.618, p < 2.2 × 10⁻¹⁶), activated CD8+ T cells (r = 0.479, p < 2.2 × 10⁻¹⁶), effector memory CD8+ T cells (r = 0.555, p < 2.2 × 10⁻¹⁶), and NK cells (r = 0.446, p < 2.2 × 10⁻¹⁶). In LUAD, the PKHD1L1 expression was also positively correlated with the infiltration levels of activated B cells (r = 0.59, p < 2.2 × 10⁻¹⁶), immature B cells (r = 0.553, p < 2.2 × 10⁻¹⁶), activated CD8+ T cells (r = 0.291, p < 1.84 × 10⁻¹¹), effector memory CD8+ T cells (r = 0.351, p < 2.15 × 10⁻¹⁶), and NK cells (r = 0.292, p < 1.61 × 10⁻¹¹) (Figure 3). These results demonstrate a positive correlation between PKHD1L1 expression and the immune cell infiltration levels of B cells, CD8+ T cells, and NK cells.
Additionally, to further examine the immune infiltration estimations, we utilized the EPIC, QUANTISEQ, MCP-COUNTER, CIBERSORT, CIBERSORT-ABS, and XCELL algorithms with the TIMER version 2.0 database (http://timer.cistrome.org/: accessed on 3 May 2023). We analyzed the correlation between the PKHD1L1 expression and the immune infiltration levels of B cells, CD8+ T cells, and NK cells after adjusting for the tumor purity. As shown in Table 2, PKHD1L1 was positively correlated with B cells, CD8+ T cells, and NK cells in both SKCM (MCP_COUNTER; B cells (rho = 0.542, p = 2.56 × 10−36), CD8+ T cells (rho = 0.433, p = 7.25 × 10−72), NK cells (rho = 0.433, p = 2.40 × 10⁻²²)) and LUAD (MCP_COUNTER; B cells (rho = 0.551, p = 2.08 × 10−40), CD8+ T cells (rho = 0.279, p = 2.73 × 10⁻¹⁰), NK cells (rho = 0.263, p = 1.47 × 10⁻¹⁰)). Interestingly, PKHD1L1 was positively correlated with the infiltration of activated NK cells (CIBERSORT_ABS; SKCM (rho = 0.326, p = 9.09 × 10⁻¹³) and LUAD (rho = 0.22, p = 8.399 × 10⁻⁷)); however, it had a negative correlation with that of resting NK cells (CIBERSORT_ABS; SKCM (rho = −0.164, p = 4.45 × 10⁻⁴) and LUAD (rho = −0.05, p = 2.68 × 10⁻¹)). Taken together, these results suggest that PKHD1L1 expression is highly correlated with the abundance of infiltrated B, CD8+ T, and NK cells, which may repress cancer progression in SKCM and LUAD.

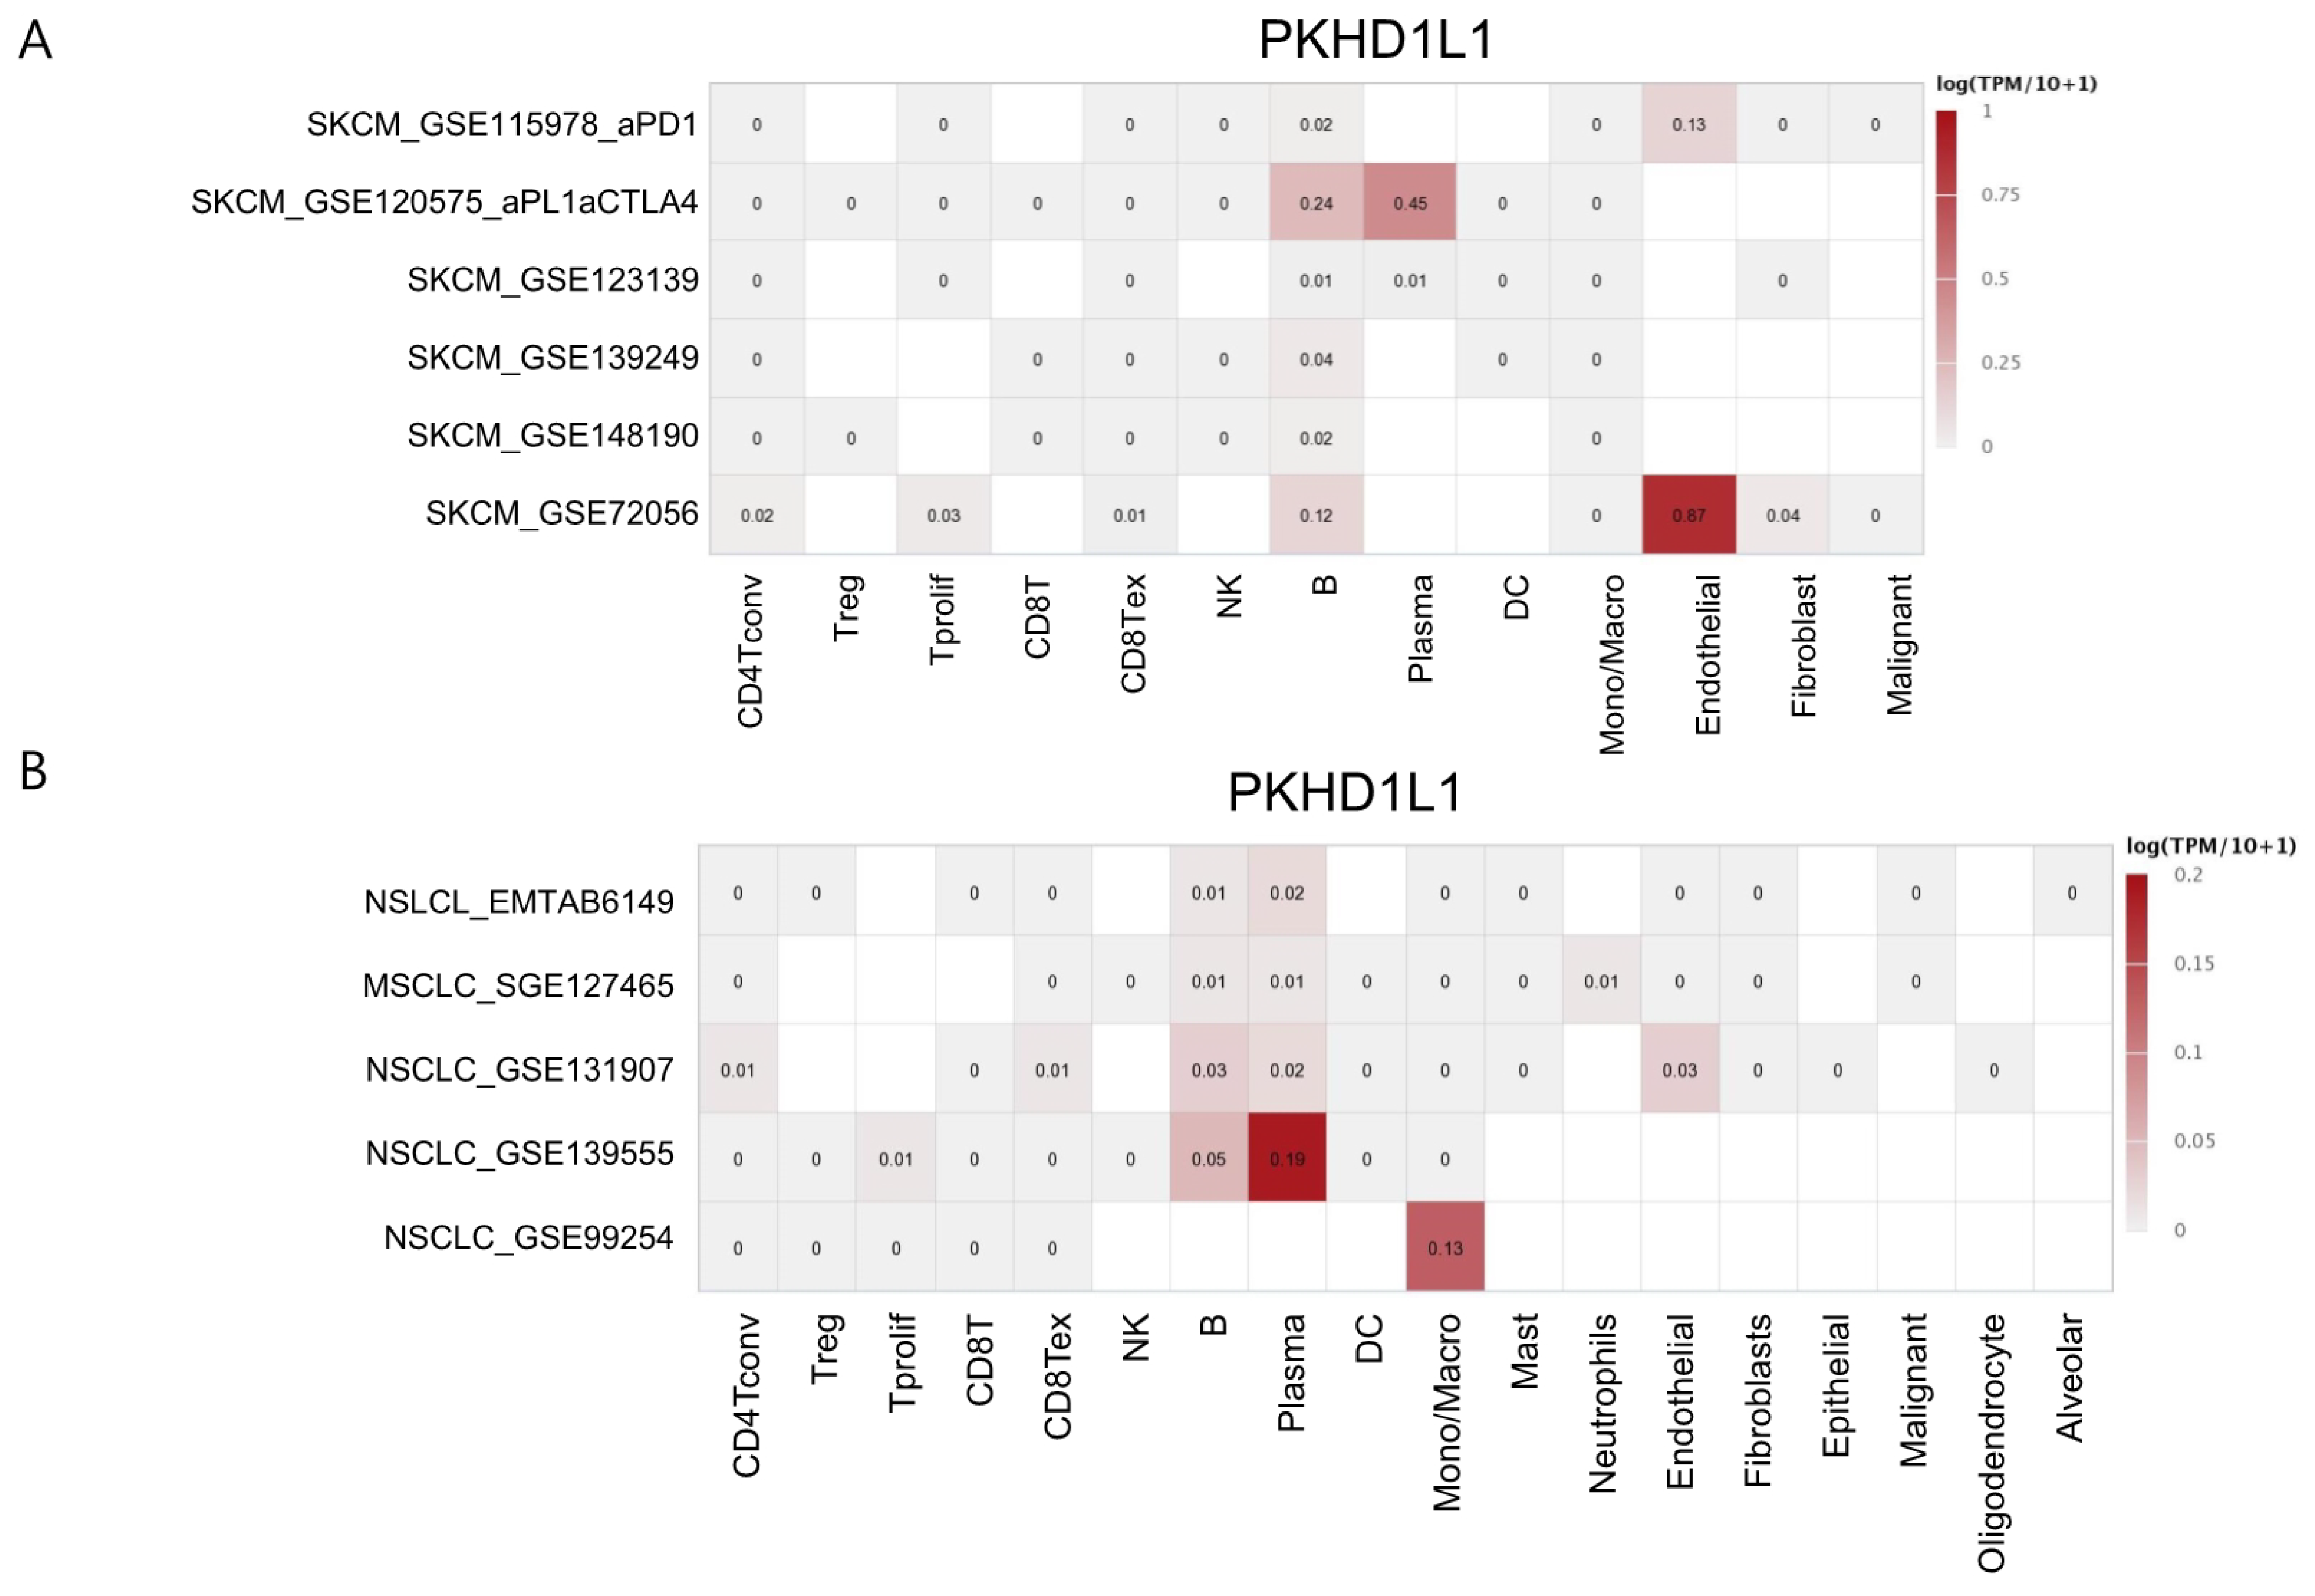
2.4. Expression of PKHD1L1 in Various Types of Immune Cells

The strong correlation between the PKHD1L1 expression and the number of infiltrated B cells, CD8+ T cells, and NK cells suggests that the immune cells in the tumor tissue could express PKHD1L1. We investigated the expression levels of various immune cell types using the DICE database, which provides data on the immune cell gene expression in healthy individuals. As shown in Supplementary Figure S3, the expression levels of PKHD1L1 are exclusively high in naive B cells. We analyzed the PKHD1L1 expression in single-cell RNA-sequencing datasets using the TISCH database to determine the cell types expressing PKHD1L1 in melanoma and NSCLC. As shown in Figure 4, the PKHD1L1 expression was the highest in B cells and plasma cells in most datasets, suggesting that the PKHD1L1 expression is high in these infiltrated cells in melanoma and NSCLC. PKHD1L1 expression was also found in other cell types, including T cells, fibroblasts, and endothelial cells, in some datasets. Additionally, the PKHD1L1 expression was found to be predominantly high in B cells and plasma cells in GSE120575, in which samples were collected from melanoma patients treated with checkpoint inhibitors, anti-programmed death receptor 1 (PD-1), and anti-cytotoxic T-lymphocyte-associated protein-4 (CTLA-4) [35], as shown in Figure 4. Melanoma is highly reactive to checkpoint inhibitors, and CTLA-4 and PD-1 are representative immune checkpoint molecules [36]. Although these molecules target T-cell functions, it has been reported that the maturation and differentiation of B cells are positively correlated with reactivity to these checkpoint inhibitors [37]. Therefore, we propose that the expression of PKHD1L1 in melanoma has a high prognostic value for predicting effective therapeutic outcomes.

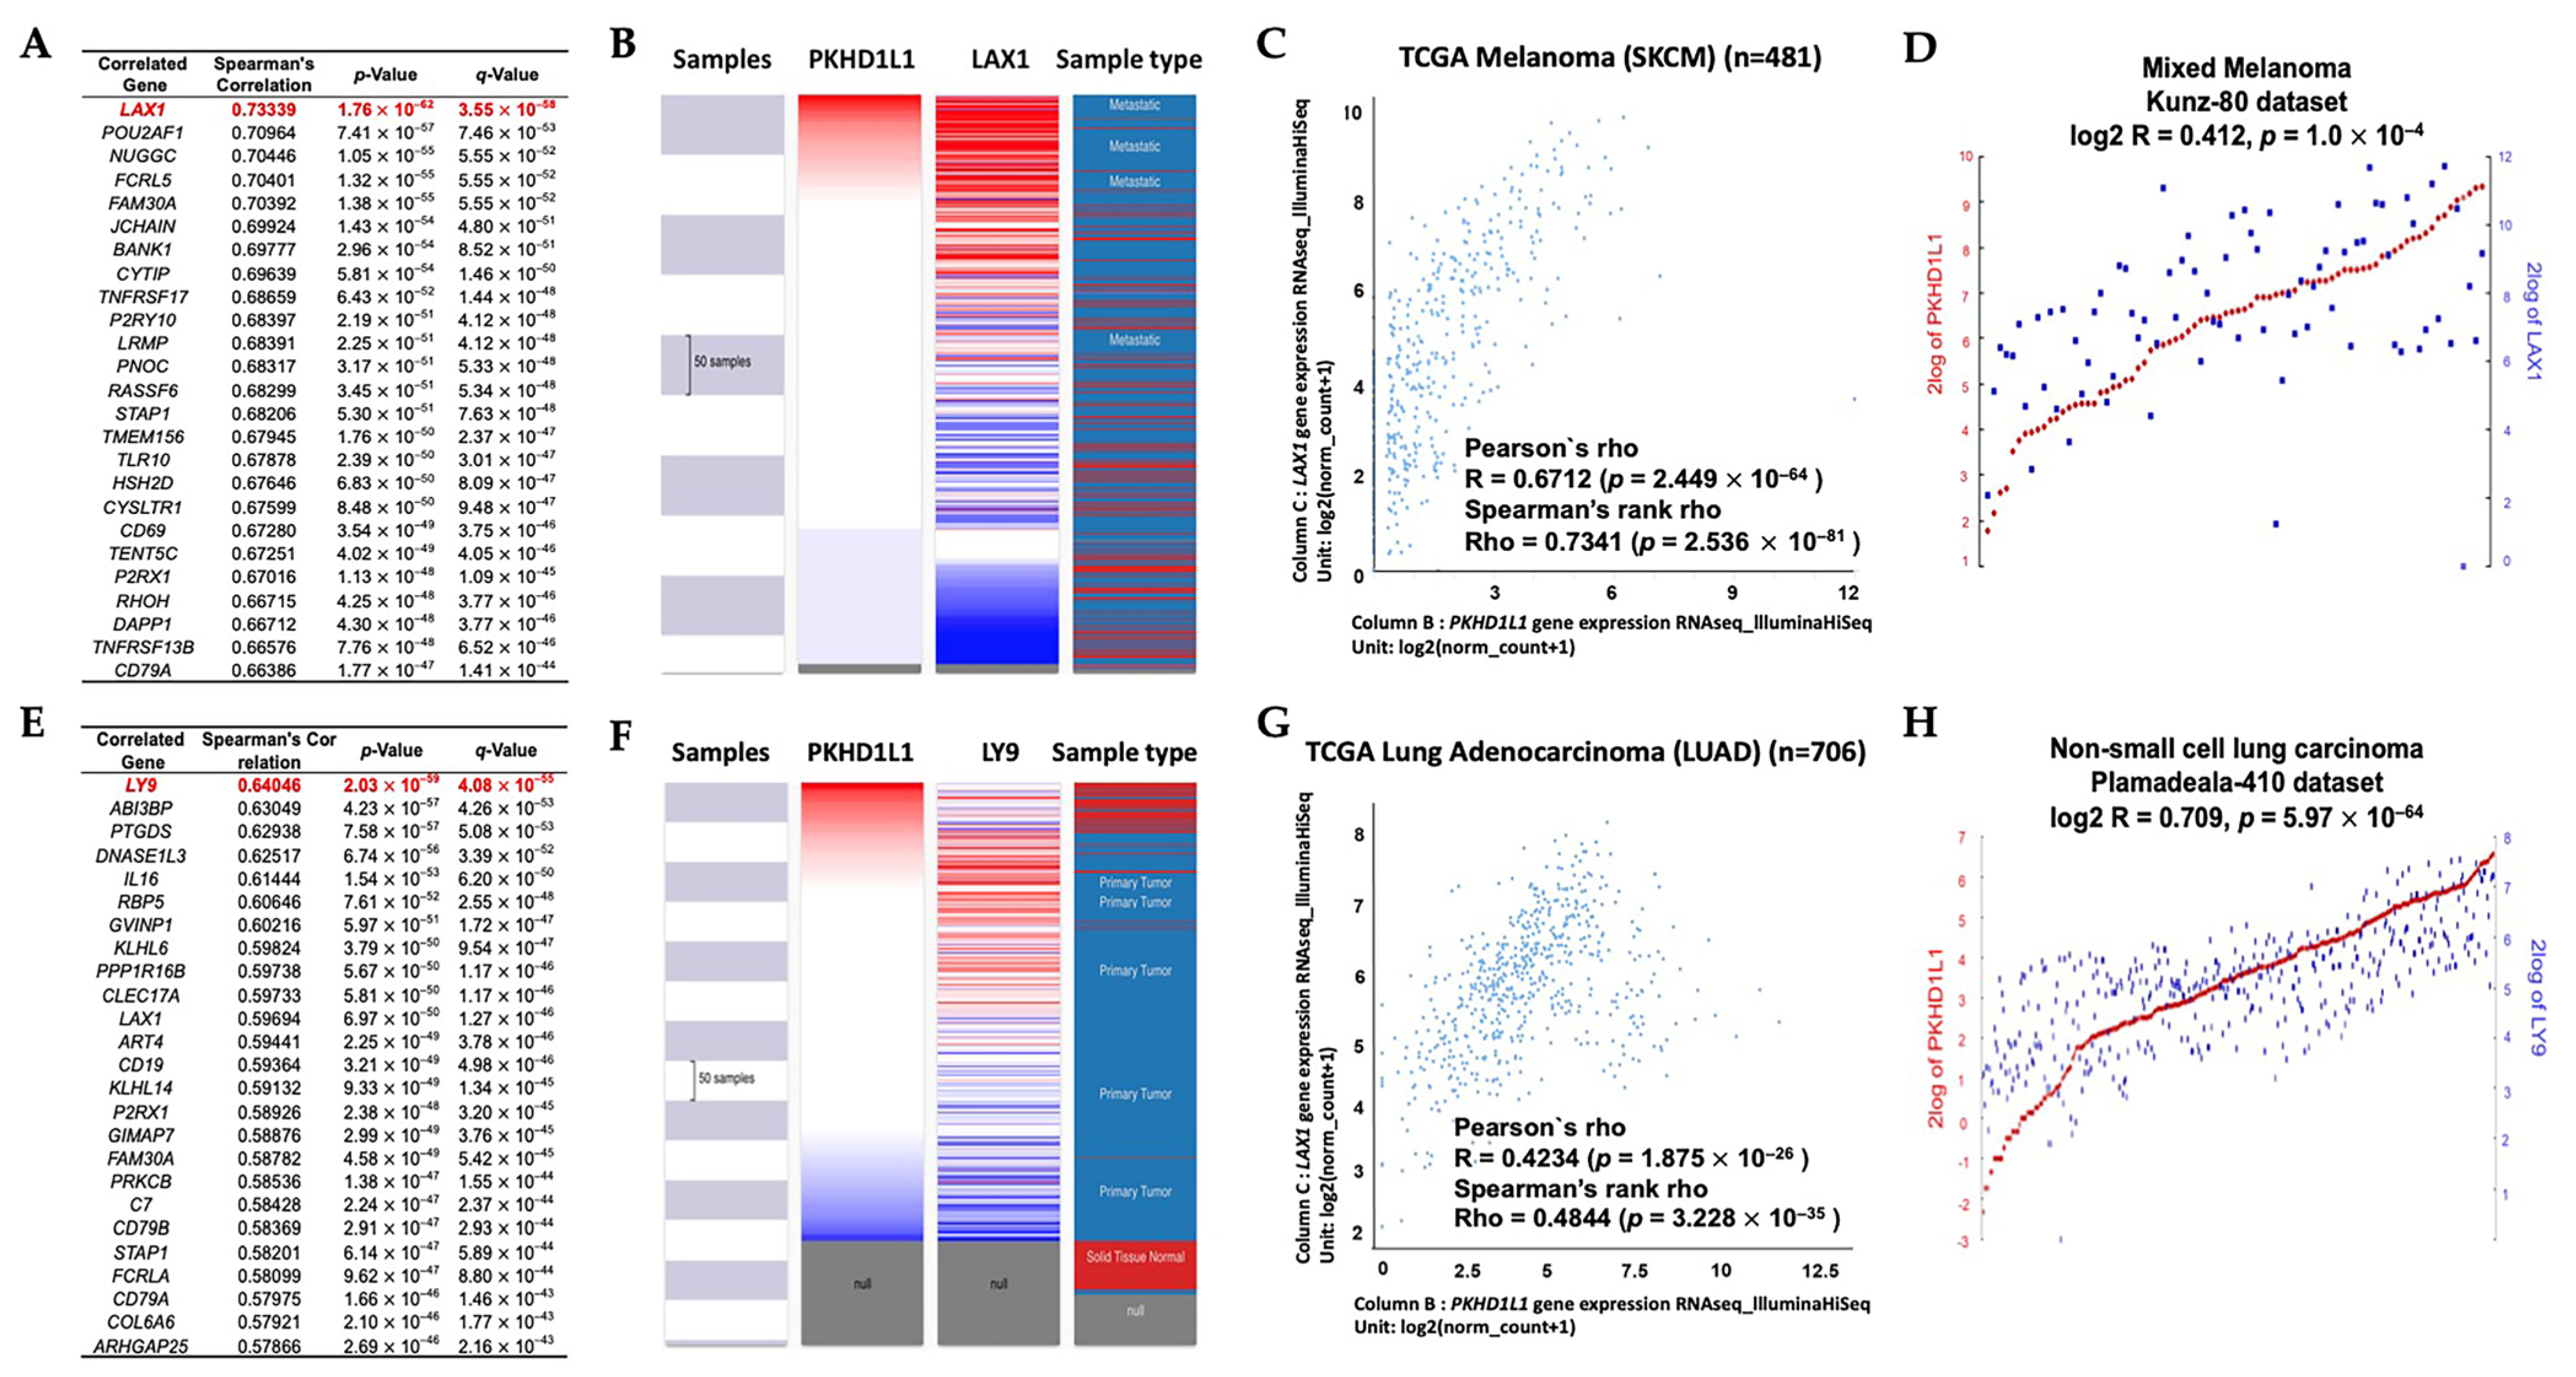
2.5. Analysis of Genes Co-Expressed with PKHD1L1

Next, we investigated genes co-expressed with PKHD1L1 using the cBioPortal database (https://www.cbioportal.org/: accessed on 23 May 2023) in the TCGA-SKCM and TCGA-LUAD datasets. Among these genes, the expression of lymphocyte transmembrane adaptor 1 (LAX1) was the most highly co-expressed in SKCM (R = 0.733, p = 1.0 × 10−62) (Figure 5A). We also confirmed the positive correlation between PKHD1L1 and LAX1 using Pearson (r = 0.6712, p = 2.449 × 10−63) and Spearman (rho = 0.7341, p = 2.536 × 10−81) correlation analyses with TCGA data from SKCM patients using the UCSC Xena web tool (Figure 5B,C). A strong association between the expressions of PKHD1L1 and LAX1 was also confirmed using the Mixed Melanoma-Kunz-80 dataset with the R2 database (R = 0.412, p = 1.0 × 10⁻⁴) (Figure 5D). Additionally, LY9 was the most highly co-expressed in LUAD (R = 0.640, p = 2.0 × 10−59) (Figure 5E). Figure 5F,G shows that the strong association between the PKHD1L1 and LY9 expressions was also confirmed using Pearson (r = 0.4234, p = 1.975 × 10⁻²⁶) and Spearman (rho = 0.4844, p = 3.228 × 10⁻³⁵) correlation analyses in the TCGA-LUAD dataset. In addition, the expressions of PKHD1L1 and LY9 were positively correlated in the NSCLC-Plamadeala-410 dataset (R = 0.709, p = 5.97 × 10−64) (Figure 5H). Our findings suggest that the expression of PKHD1L1 and those of highly co-expressed genes in SKCM and LUAD might be closely correlated.

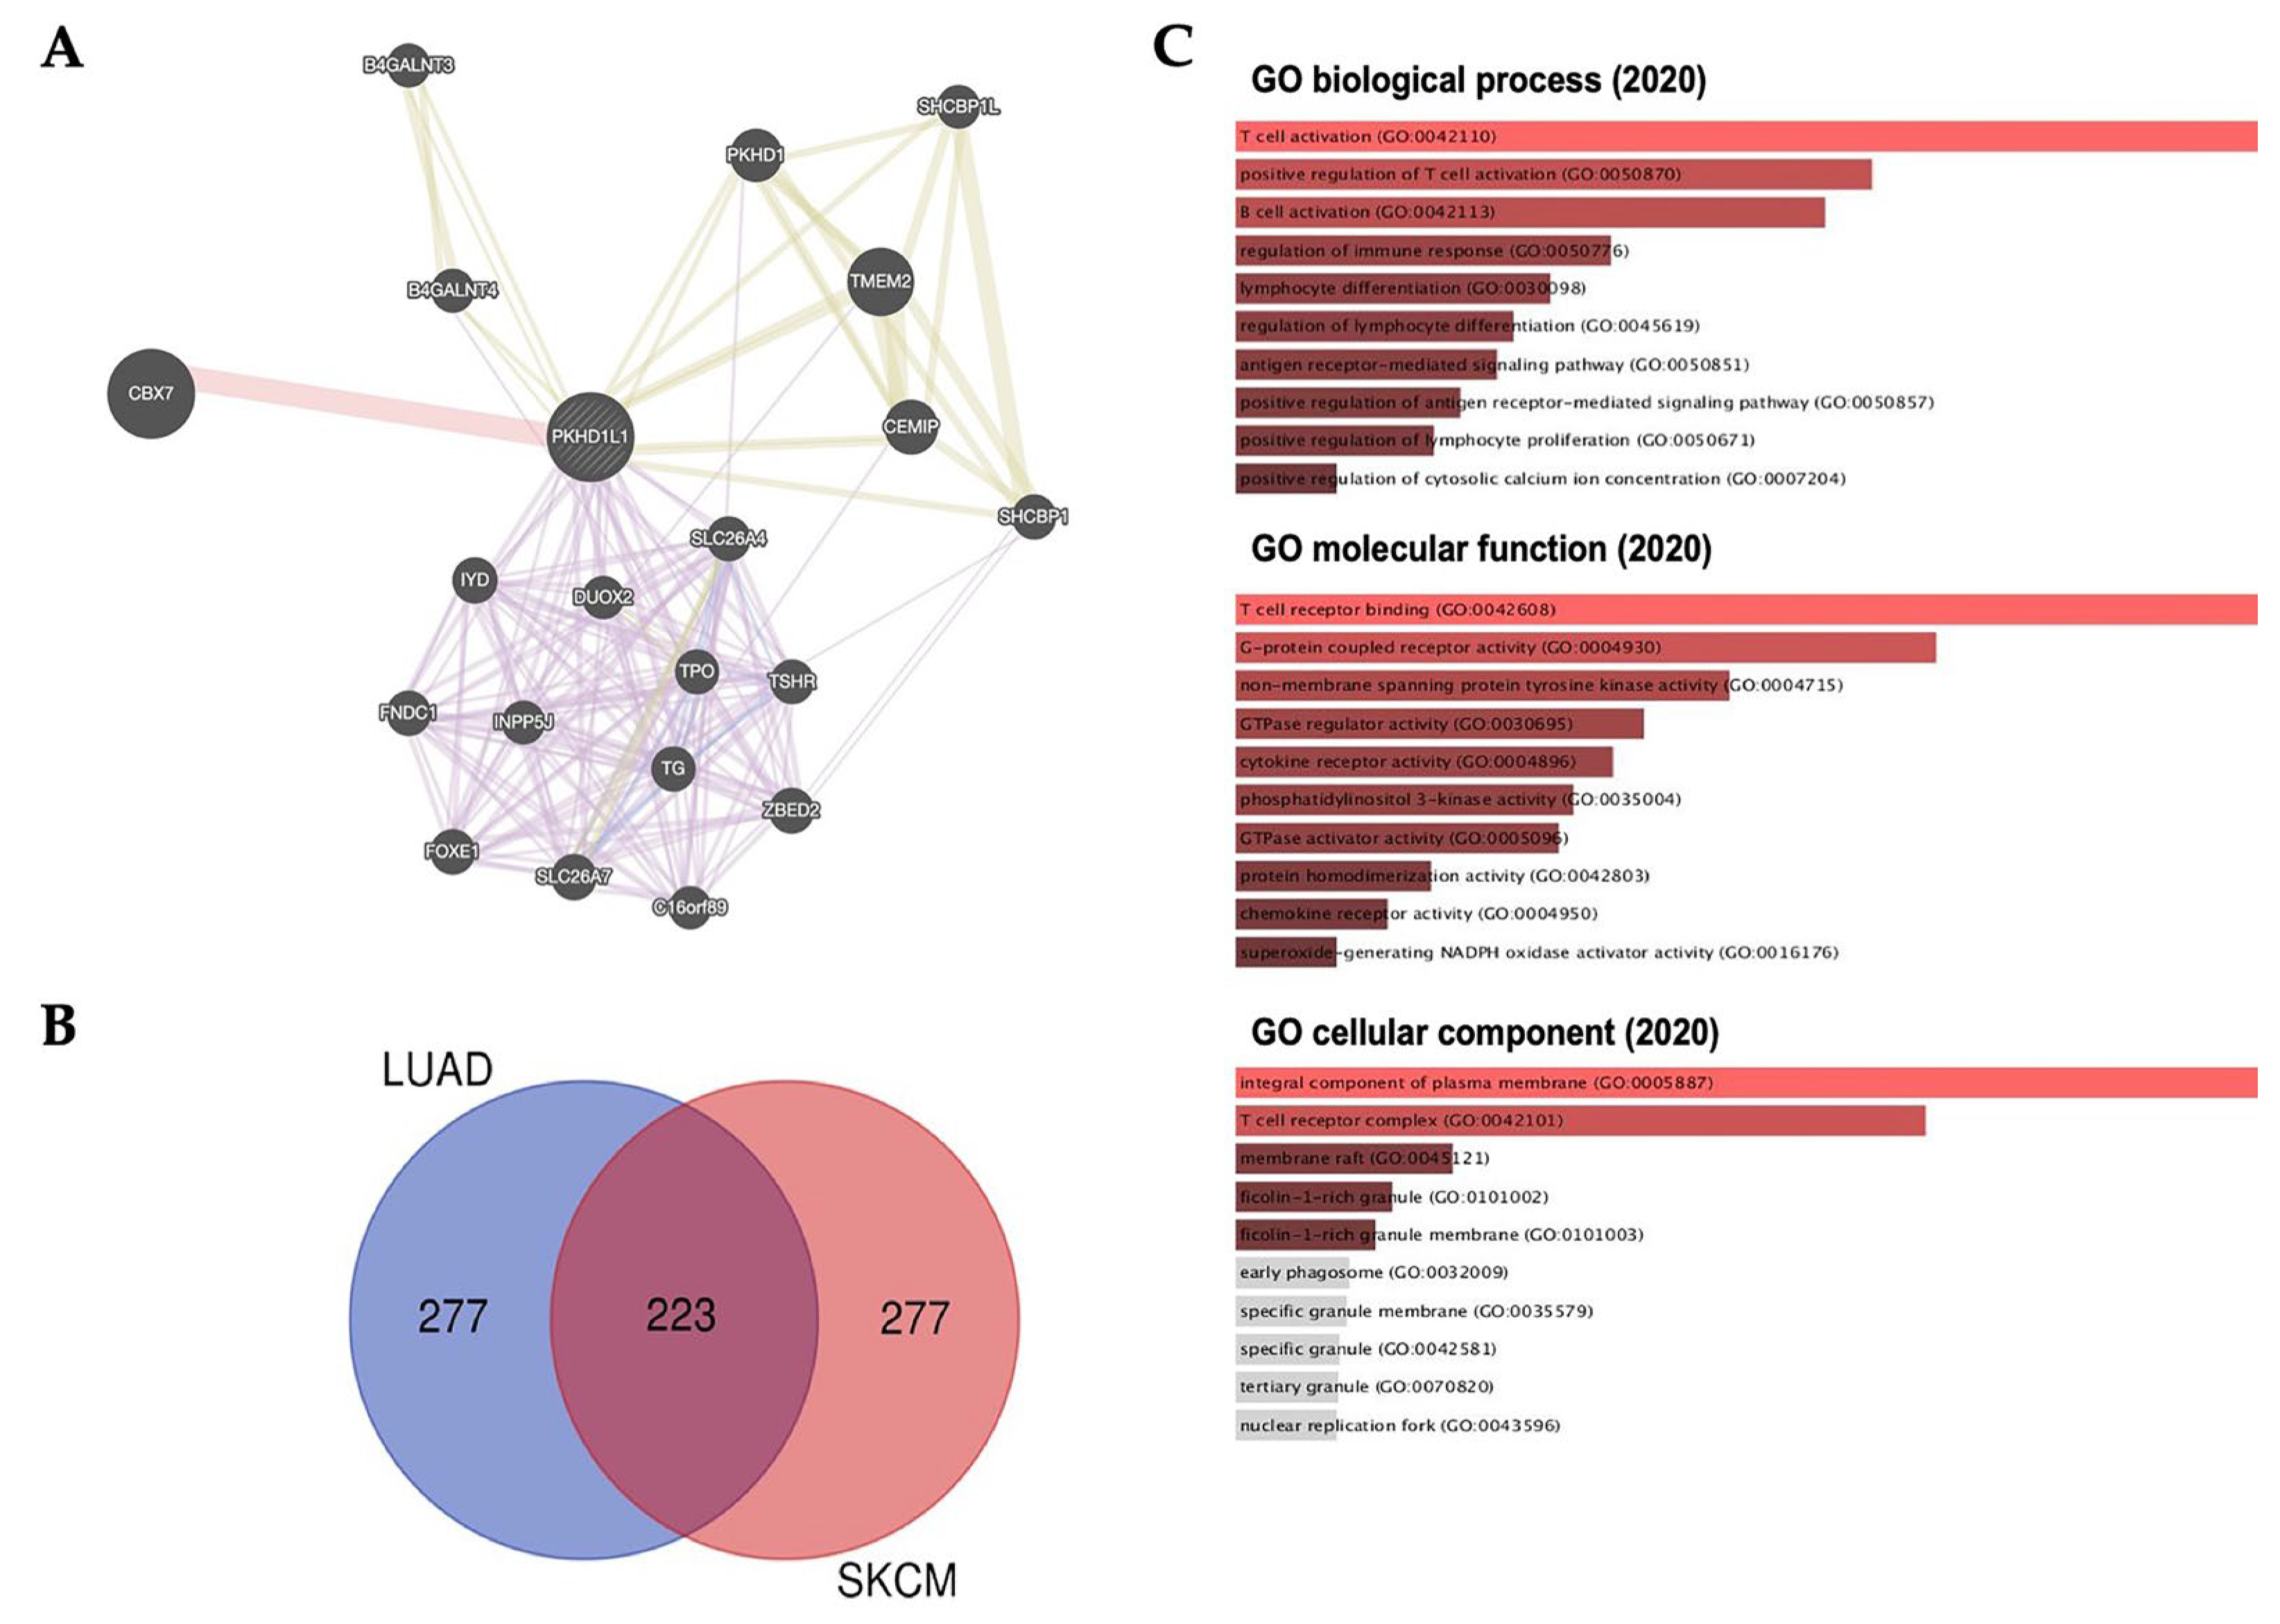
2.6. Prediction of Role of PKHD1L1 Using GeneMANIA and Ontology and Its Co-Expressed Genes

To predict the function of PKHD1L1, we performed a cluster analysis of the interactions involving PKHD1L1 using the GeneMANIA web tool. The predicted protein partners of PKHD1L1 were CBX7 of the physical interactions, TMEM2, CEMIP, PKHD1, SHCBP1, SHCBP1L, and CEMIP of the shared protein domains, and SLC26A7, ZBED2, FOXE1, FNDC1, TG, SHCBP1, TPO, SLC26A4, TSHR, B4GALNT3, B4GALNT4, INPP5J, SHCBP1L, C16orf89, and DUOX2 (Figure 6A). Furthermore, we carried out an ontology analysis of the commonly correlated genes in SKCM and LUAD to identify their potential biological relevance. We identified 223 overlapping genes from the 500 most highly positively correlated genes in SKCM and LUAD by using a Venn diagram (Figure 6B, listed in Supplementary Table S4).
Next, GO analysis was carried out with PKHD1L1 and its positively related genes for biological processes, molecular functions, and cellular components using the Enrichr database. PKHD1L1 and 233 co-altered genes were mainly associated with T- or B-cell activation in the GO biological processes, T-cell receptor binding in the GO molecular functions, and integral components of the plasma membrane in the GO cellular components (Figure 6C). Taken together, the gene enrichment analysis of PKHD1L1 and its co-altered gene set showed that PKHD1L1 could be associated with the lymphocyte activation signaling pathways. Similar to our results, a previous study reported that PKHD1L1 is underexpressed in thyroid cancer and may act as a tumor suppressor gene in the progression of thyroid cancer. However, interestingly, there was no significant relationship between the PKHD1L1 expression and survival in thyroid cancer (Supplementary Table S3).

3. Discussion

PKHD1L1, an extracellular protein with a single transmembrane domain, is known to play an important role in cellular immunity. It is known that PKHD1L1 shows low-level expression in many primary immune cell subtypes; however, its expression tends to be specifically upregulated in activated T cells [32]. In addition, PKHD1L1 transcripts have been detected in organs fully composed of immune cell subtypes, such as the spleen and thymus, as well as activated T cells and B cells [32]. This suggests that PKHD1L1 plays an important role in lymphocyte activation and provides crucial functions in the cellular immunity against cancer cells. Recently, PKHD1L1 was found to be a tumor suppressor associated with thyroid cancer cell progression; however, the clinical relevance of the PKHD1L1 expression in various types of cancers has not yet been studied [31]. Therefore, we systematically analyzed the expression of PKHD1L1 from publicly available cancer expression datasets and determined the relevance of the PKHD1L1 expression and patient survival rates in hot tumors. As shown in Figure 1 and Figure 2 and Supplementary Table S3, PKHD1L1 was lower in most tumor tissues than in normal tissues, and positively correlated with survival rates in SKCM and LUAD, suggesting that PKHD1L1 expression may be a favorable prognostic factor. Similar to our results, a previous study reported that PKHD1L1 is underexpressed in thyroid cancer and may act as a tumor suppressor gene in the progression of thyroid cancer. However, interestingly, there was no significant relationship between the PKHD1L1 expression and survival in thyroid cancer (Supplementary Table S3). Furthermore, our data showed a strong positive correlation between PKHD1L1 expression and immune cell infiltration (Figure 3), suggesting that PKHD1L1 expression has prognostic value through the infiltration of immune cells, such as B cells, CD8+ T cells, and NK cells, into the TMEs of SKCM and LUAD.
Recently, an increasing number of studies have elucidated the role of TILs as prognostic biomarkers for various cancers. TILs are a heterogeneous group of lymphocytes that enhance anti-tumor immune responses or suppress immune responses, and their presence tends to modulate robust immune responses in most TMEs [38,39]. The TME consists of a variety of immune cells, including T and B lymphocytes, NK cells, DCs, and macrophages, as well as a population of cancer cells in the tumor mass [40,41]. Importantly, the composition of immune cells in the TME is known to determine the tumor progression and clinical outcome, and thus immune cell infiltration into the TME is associated with good prognoses in various cancers, such as lung cancer and melanoma [9,42]. TILs are composed of various lymphocytes, including NK cells, CD4+ T cells, CD8+ T cells, B cells, macrophages, and DCs [43]. In particular, in this study, PKHD1L1 was highly expressed in B cells in SKCM and LUAD, and the high positive correlation between the expression of PKHD1L1 and the immune infiltration of B cells was confirmed (Figure 3). Many studies have reported that TIBs can be observed in various solid tumors and are correlated with good prognoses in colorectal cancer, hepatocellular carcinoma, pancreatic ductal adenocarcinoma, and head and neck squamous cell carcinoma [44,45,46]. TIBs are known to regulate antigen presentation, antibody production, and immune homeostasis, and to activate the immune response of T cells [47]. In TMEs, TIBs inhibit tumor progression by promoting T-cell responses and secreting immunoglobulins. In addition, they can directly kill cancer cells by exhibiting cytotoxic activity via the activation of the Fas/Fas L pathway and the secretion of cytolytic molecules, such as granzyme B (GZMB) and tumor necrosis factor-related apoptosis-inducing ligand (TRAIL) [48,49,50]. In fact, B-cell depletion using anti-CD20 antibody in a B16 melanoma murine model led to the development of pulmonary metastasis [51]. Furthermore, recent studies have shown that the activation of B-cell receptor (BCR) signaling could be associated with good prognoses in various cancers, such as breast cancer and lung cancer, by generating humoral immune responses via TIBs, resulting in effective anti-tumor immunity at the tumor site [52,53]. BCR signaling is essential for normal B-cell development and adaptive immunity. Activation mechanisms of BCR signaling include persistent BCR stimulation by various antigens present in TMEs, downstream signaling components, and ligand-independent BCR signaling [54]. The diversity of the BCR repertoire via BCR recombination is an especially favorable prognostic factor in SKCM and LUAD [55,56]. Collectively, we suggest that PKHD1L1 expressed in SKCM and LUAD could be associated with the infiltration of B cells and the activation of TIBs via BCR signaling, resulting in good prognoses in both types of cancer.
In addition to the role of B cells in the TME, tumor-infiltrating CD8+ T cells and NK cells are associated with good clinical outcomes and play an important role in anti-tumor efficacy and survival [57,58,59,60]. Many studies have reported that activated NK and CD8+ T cells play important roles in melanoma and lung cancer [61,62,63]. Both activated CD8+ T cells and NK cells show cytolytic activity against tumor cells by secreting several cytolytic molecules, such as granzyme A (GZMA), GZMB, and perforin (PRF1), showing good prognoses in various types of cancers [61,64]. Our previous study also revealed that genes positively correlated with the infiltration of these effector cells were associated with a good prognosis in SKCM [43,65,66]. Although activated CD8+ T cells and NK cells play important roles in the TME, our data show that in SKCM, the PKHD1L1 expression was the highest in B cells, with little expression in CD8+ T cells and NK cells (Figure 4 and Supplementary Figure S3). However, the PKHD1L1 expression had a strong positive correlation with CD8+ T, NK, and B cells, as shown in Figure 3, implying that the infiltration of CD8+ T and NK cells may be associated with the expressions of other genes regulated by PKHD1L1 in B cells. Moreover, CD4+ and CD8+ T cells activated by APCs induce the upregulation of PKHD1L1, and the PKHD1L1 protein in activated T cells can be secreted or bound to the cell surface as a ligand [32]. The program resulting from the interaction between T cells and antigen-presenting cells (APCs) regulates immune functions, such as T-cell proliferation, cytokine production, and cytotoxicity, which are essential for immune surveillance against tumors [67,68,69]. Therefore, PKHD1L1 may have the potential to play a role in regulating cytokine production and cytotoxicity for immune surveillance within the TME. GO analysis showed that chemokine receptors and activity were positively correlated with PKHD1L1 expression (Figure 6). Therefore, to investigate how the increased expression of PKHD1L1 affects the infiltration of CD8+ T cells and NK cells, we analyzed the correlation between the PKHD1L1 expression and the chemokine genes associated with the infiltration of CD8+ T cells and NK cells into the TME. Supplementary Figure S4 shows that the expressions of several chemokines, such as chemokine (C-C motif) ligand 4 (CCL4), chemokine (C-C motif) ligand 5 (CCL5), chemokine (C-C motif) ligand 19 (CCL19), and chemokine (C-X-C) motif ligand 9 (CXCL9), which are known to induce the migration of CD8+ T cells and NK cells, have highly positive correlations with the PKHD1L1 expression in both SKCM and LUAD. It is well known that the cytolytic activity of NK cells is augmented by CCL4 and CCL5, and CD8+ T cells have their corresponding chemokine receptors [70,71]. In addition, previous studies have shown that the expressions of CCL4 and CCL5 are positively correlated with the infiltration of NK cells and CD8+ T cells in melanoma, and the increased secretion of CCL5 recruits CD8+ T cells to the TME in LUAD [72,73]. In addition to CCL4 and CCL5, NK cells have the chemokine receptor CCR7, which is the receptor for the CCL19 mediation of T-cell recruitment [74,75]. Effector CD8+ T cells and NK cells express CXCR3 as a major receptor that drives their recruitment to the tumor site, and CXCL9 is a known ligand of CXCR3 [76]. In melanoma and lung cancer, CXCL9 is positively correlated with the infiltration of CD8+ T and NK cells for anti-tumor responses [72,77]. As shown in Supplementary Table S4, CCL19 and the chemokine receptors CCR7 and CXCR3 were co-expressed with PKHD1L1 in both SKCM and LUAD. Collectively, the highly correlated expression of PKHD1L1 and chemokines attracting CD8+ T cells and NK cells suggests that an increase in chemokines in PKHD1L1-high tumors could promote the infiltration of CD8+ T cells and NK cells into SKCM and LUAD tissues.
In the present study, we identified the biological processes associated with PKHD1L1 and its co-altered genes in SKCM and LUAD. In SKCM, the LAX1 expression was the most significantly co-altered with PKHD1L1 expression (Figure 5A). LAX1 is associated with BCR signaling, which plays an important role in chronic lymphocytic leukemia pathogenesis, and its expression is highly correlated with B-cell infiltration in periodontitis [78,79]. BCRs are essential for the integration of various signals that induce immune responses and have anti-tumor effects through interactions with various immune cells in the TME. The binding of BCRs and tumor antigens not only increases the secretion of cytokines that induce the activation of CD4+ T cells, CD8+ T cells, and NK cells, but also directly kills tumor cells through the secretion of cytolytic molecules, such as GZMB and TRAIL [49]. Furthermore, LAX1 plays a role in T-cell activation by coupling the TCR ligation at the membrane to signaling cascades and associates with Grb2, Gads, and other signaling molecules [80]. In LUAD, Ly9 was the most significantly co-altered with PKHD1L1 expression (Figure 5E). Lymphocyte antigen 9 (Ly9), otherwise known as CD229, is a member of the signaling lymphocyte activation molecule (SLAM) family [81,82]. SLAM family receptors and SLAM-related protein (SAP) adapters regulate the development and function of T cells, cytokine production, and the main tissue complex-independent cell inhibition of NK cells by activating NK and T lymphocytes [83]. Additionally, as shown in Figure 5A and 5E, FAM30A, STAP1, P2RX1, and CD79A were also co-expressed with PKHD1L1 in SKCM and LUAD. It has been reported that the expression of lncRNA FAM30A is high in B cells and correlates with the expressions of immunoglobulin genes, and the STAP1 protein is mainly expressed in immune tissues, including the thymus, spleen, lymph nodes, and bone marrow, and especially in B cells [84]. P2RX1 can interact closely with naive B cells in LUAD, and CD79a is a signaling component of the pre-B-cell receptor [85,86]. Furthermore, PKHD1L1-co-expressed genes were the most significantly enriched in immune cell activities, such as T-cell receptor binding, the positive regulation of T-cell activation, and B-cell activation. Collectively, our results suggest that PKHD1L1 can enhance the activity of other immune cells through B-cell activation by regulating BCR signaling, especially in SKCM and LUAD, resulting in a good prognosis via effective anti-tumor mechanisms. However, as this study has limitations in predicting the clinical relevance using various multiomic techniques, additional in vitro and in vivo experiments are required to demonstrate the role of PKHD1L1 in the activity and signal transduction of various immune cells.

4. Materials and Methods

4.1. Analysis of PKHD1L1 mRNA Expression Levels in Various Types of Cancers

The mRNA expression levels of PKHD1L1 in various types of cancers and normal tissues were analyzed using Gene Expression Profiling Interactive Analysis 2 (GEPIA2) (http://gepia2.cancer-pku.cn/: accessed on 25 April 2023) and the Gene Expression database of Normal and Tumor Tissues 2 (GENT2) (http://gene2.appex.kr/gent2/: accessed on 25 April 2023) [87]. In GEPIA2, the PKHD1L1 expressions in tumor samples from The Cancer Genome Atlas (TCGA) database were compared to the combined expression data of paired adjacent TCGA and Genotype Tissue Expression project (GTEx) normal tissues [87]. The GENT2 provides microarray-based gene expression profiles across normal tissues and various types of cancers in the Affymetrix U133plus2 of the GPL570 platform. All settings were set to default. The abbreviations for various types of cancer are listed in Supplementary Table S1.

4.2. Analysis of Relationship between PKHD1L1 Expression Levels and Patient Survival Rates

We first screened the types of cancers in which the PKHD1L1 expression was correlated with patient survival using OncoLnc (http://www.oncolnc.org/: accessed on 3 May 2023) across TCGA datasets. The correlation between the PKHD1L1 expression levels and survival rates was analyzed using the GEPIA2 and PrognoScan (http://dan00.bio.kyutech.ac.jp/prognoscan/: accessed on 27 April 2023) databases for skin and lung cancers [87]. Patient samples were split into two groups based on the median values of the PKHD1L1 expression and analyzed using the log-rank test in GEPIA2 and Kaplan–Meier survival curves. PrognoScan is a database that includes prognostic data for various types of cancers [88]. The correlation between the gene expression and patient survival in the GSE19234 and GSE8894 datasets was estimated using PrognoScan with a Cox p-value < 0.05. OS analysis was performed using the SKCM-TCGA (n = 468) and LUAD-TCGA (n = 515) datasets for sex, age, and tumor stage using the R2 database (Supplementary Figure S1) (* p < 0.05).

4.3. Analysis of PKHD1L1 Expression Levels in Various Types of Immune Cells

The databases for immune cell expression, expression quantitative trait loci (eQTLs), and epigenomics (DICE) (https://dice-database.org/landing/: accessed on 15 May 2023) were used to determine the expression levels of PKHD1L1 in various types of immune cells. DICE includes the transcriptomes of common human immune cell types generated via the RNA-sequencing (RNA-seq) analysis of samples from healthy subjects [89]. The number of transcripts per million (TPM) represents the gene expression level in each immune cell type. To examine the detailed expression levels of PKHD1L1 in various tumor-associated cell types in melanoma and non-small cell lung cancer (NSCLC), we employed a tumor immune single-cell hub (TISCH) (http://tisch.comp-genomics.org/: accessed on 15 May 2023). We retrieved the expression characteristics of PKHD1L1 from six melanoma datasets and five NSCLC datasets. TPM counts are presented for each type of immune cell for each dataset.

4.4. Analysis of Correlation of PKHD1L1 Expression Levels with Immune Cell Infiltration

The TIMER v.1.0 database (http://cistrome.shinyapps.io/timer/: accessed on 3 May 2023) was used to analyze the association between the PKHD1L1 expression and immune infiltrates [90]. The correlation between the PKHD1L1 expression levels and the enrichment of each type of immune cell infiltration in the tumor is shown in a scatter plot. TISIDB (http://cis.hku.hk/TISIDB/: accessed on 13 May 2023), a web tool for investigating tumor and immune system interactions [91], was also used to determine the correlation between the PKHD1L1 expression and 28 types of TILs. The correlation coefficient between the expression levels of PKHD1L1 and TILs was determined using the Spearman’s test. The correlation between the expression levels of PKHD1L1 with the genetic signatures of B cells, cluster of differentiation (CD)-8+ T cells, and NK cells was analyzed using Spearman’s correlation test in the TIMER v.2.0 database (http://timer.cistrome.org/: accessed on 3 May 2023) [92]. We also compared the infiltration levels of activated and resting NK cells using CIBERSORT NK signatures in TIMER v.2.0.

4.5. Identification of Co-Expressed Genes with PKHD1L1

The co-expressed gene profile of PKHD1L1 was analyzed using the TCGA-SKCM and TCGA-LUAD datasets with the cBioportal database (https://www.cbioportal.org/: accessed on 23 May 2023) [93]. We used the TCGA database in the UCSC Xena browser to visualize the correlation between the most highly positively correlated genes and PKHD1L1 using heatmaps and dot plots (http://xena.ucsc.edu/: accessed on 17 July 2023) [94]. Scatter plots of the expressions of PKHD1L1 and the most highly positively correlated genes were identified in other lung and skin cancer datasets using R2: Genomics Analysis and Visualization Platform (https://hgserver1.amc.nl/cgi-bin/r2/main.cgi: accessed on 28 July 2023).

4.6. Cluster Analysis of PKHD1L1 and Its Co-Expressed Genes

The GeneMANIA web tool (http://www.enenmania.org/: accessed on 13 August 2023) was used for the protein–protein interaction analysis [95]. We used this database to predict the protein–protein interactions using PKHD1L1 as the query. A Venn diagram was used to identify the common co-expressed genes in SKCM and LUAD. We analyzed the ontology of PKHD1L1 and the common co-expressed genes in SKCM and LUAD using the Enrichr web tool (https://amp.pharm.mssm.edu/Enrichr: accessed on 15 August 2023) [96]. Gene ontology (GO) and pathway analyses were performed using bar diagrams.

4.7. Statistical Analysis

All data were analyzed for the p-values and number of samples using various standard statistical methods in various databases. The detailed statistical tests are presented in Supplementary Table S2.

5. Conclusions

In conclusion, this study showed the downregulation of the PKHD1L1 mRNA expression in SKCM and LUAD compared to normal tissues. Moreover, the PKHD1L1 expression was strongly correlated with a good prognosis and infiltration levels of immune cells, including B, CD8+ T, and NK cells. Therefore, our systematic analysis suggests the clinical relevance and prognostic value of the expression levels of PKHD1L1 in SKCM and LUAD.

Supplementary Materials

The following supporting information can be downloaded at https://www.mdpi.com/article/10.3390/ijms25010359/s1.

Author Contributions

Conceptualization, K.E.K.; methodology, J.Y.K., J.Y., H.L. and M.G.; validation, J.Y.K.; formal analysis, J.Y.K., J.Y., H.L. and K.E.K.; investigation, J.Y.K. and H.L; data curation, K.E.K. and S.P.; writing—original draft preparation, J.Y.K. and J.Y.; writing—review and editing, K.E.K., S.P. and M.G.; visualization, J.Y.K. and H.L.; supervision, K.E.K.; project administration, K.E.K.; funding acquisition, K.E.K. and S.P. All authors have read and agreed to the published version of the manuscript.

Funding

This work was supported by a National Research Foundation of Korea (NRF) grant funded by the Korean government (Ministry of Science and ICT) (NRF-2020R1A2C1101129 and NRF-2021R1A4A1027355).

Institutional Review Board Statement

Not applicable.

Informed Consent Statement

Not applicable.

Data Availability Statement

The datasets presented in this study can be found in online repositories. The names of the repositories and accession number(s) can be found in the article/Supplementary Materials.

Conflicts of Interest

The authors declare no conflicts of interest.

References

  1. Bray, F.; Laversanne, M.; Weiderpass, E.; Soerjomataram, I. The ever-increasing importance of cancer as a leading cause of premature death worldwide. Cancer 2021, 127, 3029–3030. [Google Scholar] [CrossRef] [PubMed]
  2. Thandra, K.C.; Barsouk, A.; Saginala, K.; Aluru, J.S.; Barsouk, A. Epidemiology of lung cancer. Contemp. Oncol. (Pozn) 2021, 25, 45–52. [Google Scholar] [PubMed]
  3. Siegel, R.L.; Miller, K.D.; Jemal, A. Cancer statistics, 2020. CA Cancer J. Clin. 2020, 70, 7–30. [Google Scholar] [CrossRef] [PubMed]
  4. Saginala, K.; Barsouk, A.; Aluru, J.S.; Rawla, P.; Barsouk, A. Epidemiology of Melanoma. Med. Sci. 2021, 9, 63. [Google Scholar] [CrossRef]
  5. Kleczko, E.K.; Kwak, J.W.; Schenk, E.L.; Nemenoff, R.A. Targeting the Complement Pathway as a Therapeutic Strategy in Lung Cancer. Front. Immunol. 2019, 10, 954. [Google Scholar] [CrossRef]
  6. Leonardi, G.C.; Falzone, L.; Salemi, R.; Zanghi, A.; Spandidos, D.A.; McCubrey, J.A.; Candido, S.; Libra, M. Cutaneous melanoma: From pathogenesis to therapy (Review). Int. J. Oncol. 2018, 52, 1071–1080. [Google Scholar] [CrossRef]
  7. Bader, J.E.; Voss, K.; Rathmell, J.C. Targeting Metabolism to Improve the Tumor Microenvironment for Cancer Immunotherapy. Mol. Cell 2020, 78, 1019–1033. [Google Scholar] [CrossRef]
  8. Katsuta, E.; Rashid, O.M.; Takabe, K. Clinical relevance of tumor microenvironment: Immune cells, vessels, and mouse models. Hum. Cell 2020, 33, 930–937. [Google Scholar] [CrossRef]
  9. Giraldo, N.A.; Sanchez-Salas, R.; Peske, J.D.; Vano, Y.; Becht, E.; Petitprez, F.; Validire, P.; Ingels, A.; Cathelineau, X.; Fridman, W.H.; et al. The clinical role of the TME in solid cancer. Br. J. Cancer 2019, 120, 45–53. [Google Scholar] [CrossRef]
  10. Brummel, K.; Eerkens, A.L.; de Bruyn, M.; Nijman, H.W. Tumour-infiltrating lymphocytes: From prognosis to treatment selection. Br. J. Cancer 2023, 128, 451–458. [Google Scholar] [CrossRef]
  11. Lee, K.H.; Kim, E.Y.; Yun, J.S.; Park, Y.L.; Do, S.I.; Chae, S.W.; Park, C.H. The prognostic and predictive value of tumor-infiltrating lymphocytes and hematologic parameters in patients with breast cancer. BMC Cancer 2018, 18, 938. [Google Scholar] [CrossRef] [PubMed]
  12. Maibach, F.; Sadozai, H.; Seyed Jafari, S.M.; Hunger, R.E.; Schenk, M. Tumor-Infiltrating Lymphocytes and Their Prognostic Value in Cutaneous Melanoma. Front. Immunol. 2020, 11, 2105. [Google Scholar] [CrossRef] [PubMed]
  13. Letca, A.F.; Ungureanu, L.; Senila, S.C.; Grigore, L.E.; Pop, S.; Fechete, O.; Vesa, S.C.; Cosgarea, R. Regression and Sentinel Lymph Node Status in Melanoma Progression. Med. Sci. Monit. 2018, 24, 1359–1365. [Google Scholar] [CrossRef] [PubMed]
  14. de Moll, E.H.; Fu, Y.; Qian, Y.; Perkins, S.H.; Wieder, S.; Gnjatic, S.; Remark, R.; Bernardo, S.G.; Moskalenko, M.; Yao, J.; et al. Immune biomarkers are more accurate in prediction of survival in ulcerated than in non-ulcerated primary melanomas. Cancer Immunol. Immunother. 2015, 64, 1193–1203. [Google Scholar] [CrossRef]
  15. Uryvaev, A.; Passhak, M.; Hershkovits, D.; Sabo, E.; Bar-Sela, G. The role of tumor-infiltrating lymphocytes (TILs) as a predictive biomarker of response to anti-PD1 therapy in patients with metastatic non-small cell lung cancer or metastatic melanoma. Med. Oncol. 2018, 35, 25. [Google Scholar] [CrossRef]
  16. Eberst, G.; Vernerey, D.; Laheurte, C.; Meurisse, A.; Kaulek, V.; Cuche, L.; Jacoulet, P.; Almotlak, H.; Lahourcade, J.; Gainet-Brun, M.; et al. Prognostic value of CD4+ T lymphopenia in non-small cell lung Cancer. BMC Cancer 2022, 22, 529. [Google Scholar] [CrossRef]
  17. Giatromanolaki, A.; Anestopoulos, I.; Panayiotidis, M.I.; Mitrakas, A.; Pappa, A.; Koukourakis, M.I. Prognostic Relevance of the Relative Presence of CD4, CD8 and CD20 Expressing Tumor Infiltrating Lymphocytes in Operable Non-small Cell Lung Cancer Patients. Anticancer Res. 2021, 41, 3989–3995. [Google Scholar] [CrossRef]
  18. Wang, S.S.; Liu, W.; Ly, D.; Xu, H.; Qu, L.; Zhang, L. Tumor-infiltrating B cells: Their role and application in anti-tumor immunity in lung cancer. Cell. Mol. Immunol. 2019, 16, 6–18. [Google Scholar] [CrossRef]
  19. Laumont, C.M.; Banville, A.C.; Gilardi, M.; Hollern, D.P.; Nelson, B.H. Tumour-infiltrating B cells: Immunological mechanisms, clinical impact and therapeutic opportunities. Nat. Rev. Cancer 2022, 22, 414–430. [Google Scholar] [CrossRef]
  20. Leong, T.L.; Bryant, V.L. B cells in lung cancer-not just a bystander cell: A literature review. Transl. Lung Cancer Res. 2021, 10, 2830–2841. [Google Scholar] [CrossRef]
  21. Ma, C.; Kang, W.; Yu, L.; Yang, Z.; Ding, T. AUNIP Expression Is Correlated with Immune Infiltration and Is a Candidate Diagnostic and Prognostic Biomarker for Hepatocellular Carcinoma and Lung Adenocarcinoma. Front. Oncol. 2020, 10, 590006. [Google Scholar] [CrossRef] [PubMed]
  22. Ventola, C.L. Cancer Immunotherapy, Part 3: Challenges and Future Trends. Pharm. Ther. 2017, 42, 514–521. [Google Scholar]
  23. Lauriola, A.; Davalli, P.; Marverti, G.; Santi, S.; Caporali, A.; D’Arca, D. Targeting the Interplay of Independent Cellular Pathways and Immunity: A Challenge in Cancer Immunotherapy. Cancers 2023, 15, 3009. [Google Scholar] [CrossRef] [PubMed]
  24. Park, W.; Heo, Y.J.; Han, D.K. New opportunities for nanoparticles in cancer immunotherapy. Biomater. Res. 2018, 22, 24. [Google Scholar] [CrossRef] [PubMed]
  25. UniprotKB_PKHD1L1. Available online: https://www.uniprot.org/uniprot/Q86WI1 (accessed on 15 January 2023).
  26. Wu, X.; Ivanchenko, M.V.; Al Jandal, H.; Cicconet, M.; Indzhykulian, A.A.; Corey, D.P. PKHD1L1 is a coat protein of hair-cell stereocilia and is required for normal hearing. Nat. Commun. 2019, 10, 3801. [Google Scholar] [CrossRef] [PubMed]
  27. Bork, P.; Doerks, T.; Springer, T.A.; Snel, B. Domains in plexins: Links to integrins and transcription factors. Trends Biochem. Sci. 1999, 24, 261–263. [Google Scholar] [CrossRef] [PubMed]
  28. He, Q.Y.; Liu, X.H.; Li, Q.; Studholme, D.J.; Li, X.W.; Liang, S.P. G8: A novel domain associated with polycystic kidney disease and non-syndromic hearing loss. Bioinformatics 2006, 22, 2189–2191. [Google Scholar] [CrossRef]
  29. Jenkins, J.; Mayans, O.; Pickersgill, R. Structure and evolution of parallel beta-helix proteins. J. Struct. Biol. 1998, 122, 236–246. [Google Scholar] [CrossRef]
  30. Saravia, C.H.; Flores, C.; Schwarz, L.J.; Bravo, L.; Zavaleta, J.; Araujo, J.; Neciosup, S.; Pinto, J.A. Patterns of Mutation Enrichment in Metastatic Triple-Negative Breast Cancer. Clin. Med. Insights Oncol. 2019, 13, 1179554919868482. [Google Scholar] [CrossRef]
  31. Zheng, C.; Quan, R.; Xia, E.J.; Bhandari, A.; Zhang, X. Original tumour suppressor gene polycystic kidney and hepatic disease 1-like 1 is associated with thyroid cancer cell progression. Oncol. Lett. 2019, 18, 3227–3235. [Google Scholar] [CrossRef]
  32. Hogan, M.C.; Griffin, M.D.; Rossetti, S.; Torres, V.E.; Ward, C.J.; Harris, P.C. PKHDL1, a homolog of the autosomal recessive polycystic kidney disease gene, encodes a receptor with inducible T lymphocyte expression. Hum. Mol. Genet. 2003, 12, 685–698. [Google Scholar] [CrossRef] [PubMed]
  33. Sadelain, M.; Riviere, I.; Riddell, S. Therapeutic T cell engineering. Nature 2017, 545, 423–431. [Google Scholar] [CrossRef] [PubMed]
  34. Thorsson, V.; Gibbs, D.L.; Brown, S.D.; Wolf, D.; Bortone, D.S.; Ou Yang, T.H.; Porta-Pardo, E.; Gao, G.F.; Plaisier, C.L.; Eddy, J.A.; et al. The Immune Landscape of Cancer. Immunity 2018, 48, 812–830.e14. [Google Scholar] [CrossRef] [PubMed]
  35. Sade-Feldman, M.; Yizhak, K.; Bjorgaard, S.L.; Ray, J.P.; de Boer, C.G.; Jenkins, R.W.; Lieb, D.J.; Chen, J.H.; Frederick, D.T.; Barzily-Rokni, M.; et al. Defining T Cell States Associated with Response to Checkpoint Immunotherapy in Melanoma. Cell 2018, 175, 998–1013.e20. [Google Scholar] [CrossRef] [PubMed]
  36. Willsmore, Z.N.; Coumbe, B.G.T.; Crescioli, S.; Reci, S.; Gupta, A.; Harris, R.J.; Chenoweth, A.; Chauhan, J.; Bax, H.J.; McCraw, A.; et al. Combined anti-PD-1 and anti-CTLA-4 checkpoint blockade: Treatment of melanoma and immune mechanisms of action. Eur. J. Immunol. 2021, 51, 544–556. [Google Scholar] [CrossRef] [PubMed]
  37. Willsmore, Z.N.; Harris, R.J.; Crescioli, S.; Hussein, K.; Kakkassery, H.; Thapa, D.; Cheung, A.; Chauhan, J.; Bax, H.J.; Chenoweth, A.; et al. B Cells in Patients with Melanoma: Implications for Treatment with Checkpoint Inhibitor Antibodies. Front. Immunol. 2020, 11, 622442. [Google Scholar] [CrossRef] [PubMed]
  38. Lee, N.; Zakka, L.R.; Mihm, M.C., Jr.; Schatton, T. Tumour-infiltrating lymphocytes in melanoma prognosis and cancer immunotherapy. Pathology 2016, 48, 177–187. [Google Scholar] [CrossRef]
  39. Salas-Benito, D.; Vercher, E.; Conde, E.; Glez-Vaz, J.; Tamayo, I.; Hervas-Stubbs, S. Inflammation and immunity in ovarian cancer. EJC Suppl. 2020, 15, 56–66. [Google Scholar] [CrossRef]
  40. Binnewies, M.; Roberts, E.W.; Kersten, K.; Chan, V.; Fearon, D.F.; Merad, M.; Coussens, L.M.; Gabrilovich, D.I.; Ostrand-Rosenberg, S.; Hedrick, C.C.; et al. Understanding the tumor immune microenvironment (TIME) for effective therapy. Nat. Med. 2018, 24, 541–550. [Google Scholar] [CrossRef]
  41. Zhang, Y.; Yang, M.; Ng, D.M.; Haleem, M.; Yi, T.; Hu, S.; Zhu, H.; Zhao, G.; Liao, Q. Multi-omics Data Analyses Construct TME and Identify the Immune-Related Prognosis Signatures in Human LUAD. Mol. Ther. Nucleic Acids 2020, 21, 860–873. [Google Scholar] [CrossRef]
  42. Jin, S.; Deng, Y.; Hao, J.W.; Li, Y.; Liu, B.; Yu, Y.; Shi, F.D.; Zhou, Q.H. NK cell phenotypic modulation in lung cancer environment. PLoS ONE 2014, 9. [Google Scholar] [CrossRef] [PubMed]
  43. Gil, M.; Kim, K.E. Interleukin-18 Is a Prognostic Biomarker Correlated with CD8(+) T Cell and Natural Killer Cell Infiltration in Skin Cutaneous Melanoma. J. Clin. Med. 2019, 8, 1993. [Google Scholar] [CrossRef] [PubMed]
  44. Katoh, H.; Komura, D.; Konishi, H.; Suzuki, R.; Yamamoto, A.; Kakiuchi, M.; Sato, R.; Ushiku, T.; Yamamoto, S.; Tatsuno, K.; et al. Immunogenetic Profiling for Gastric Cancers Identifies Sulfated Glycosaminoglycans as Major and Functional B Cell Antigens in Human Malignancies. Cell Rep. 2017, 20, 1073–1087. [Google Scholar] [CrossRef] [PubMed]
  45. van Herpen, C.M.; van der Voort, R.; van der Laak, J.A.; Klasen, I.S.; de Graaf, A.O.; van Kempen, L.C.; de Vries, I.J.; Boer, T.D.; Dolstra, H.; Torensma, R.; et al. Intratumoral rhIL-12 administration in head and neck squamous cell carcinoma patients induces B cell activation. Int. J. Cancer 2008, 123, 2354–2361. [Google Scholar] [CrossRef]
  46. Liao, S.F.; Liang, C.H.; Ho, M.Y.; Hsu, T.L.; Tsai, T.I.; Hsieh, Y.S.; Tsai, C.M.; Li, S.T.; Cheng, Y.Y.; Tsao, S.M.; et al. Immunization of fucose-containing polysaccharides from Reishi mushroom induces antibodies to tumor-associated Globo H-series epitopes. Proc. Natl. Acad. Sci. USA 2013, 110, 13809–13814. [Google Scholar] [CrossRef] [PubMed]
  47. Patel, A.J.; Richter, A.; Drayson, M.T.; Middleton, G.W. The role of B lymphocytes in the immuno-biology of non-small-cell lung cancer. Cancer Immunol. Immunother. CII 2020, 69, 325–342. [Google Scholar] [CrossRef]
  48. Tokunaga, R.; Naseem, M.; Lo, J.H.; Battaglin, F.; Soni, S.; Puccini, A.; Berger, M.D.; Zhang, W.; Baba, H.; Lenz, H.J. B cell and B cell-related pathways for novel cancer treatments. Cancer Treat. Rev. 2019, 73, 10–19. [Google Scholar] [CrossRef]
  49. Kinker, G.S.; Vitiello, G.A.F.; Ferreira, W.A.S.; Chaves, A.S.; Cordeiro de Lima, V.C.; Medina, T.D.S. B Cell Orchestration of Anti-tumor Immune Responses: A Matter of Cell Localization and Communication. Front. Cell Dev. Biol. 2021, 9, 678127. [Google Scholar] [CrossRef]
  50. Tao, H.; Lu, L.; Xia, Y.; Dai, F.; Wang, Y.; Bao, Y.; Lundy, S.K.; Ito, F.; Pan, Q.; Zhang, X.; et al. Antitumor effector B cells directly kill tumor cells via the Fas/FasL pathway and are regulated by IL-10. Eur. J. Immunol. 2015, 45, 999–1009. [Google Scholar] [CrossRef]
  51. DiLillo, D.J.; Yanaba, K.; Tedder, T.F. B cells are required for optimal CD4+ and CD8+ T cell tumor immunity: Therapeutic B cell depletion enhances B16 melanoma growth in mice. J. Immunol. 2010, 184, 4006–4016. [Google Scholar] [CrossRef]
  52. Garaud, S.; Buisseret, L.; Solinas, C.; Gu-Trantien, C.; de Wind, A.; Van den Eynden, G.; Naveaux, C.; Lodewyckx, J.N.; Boisson, A.; Duvillier, H.; et al. Tumor infiltrating B-cells signal functional humoral immune responses in breast cancer. JCI Insight 2019, 5, e129641. [Google Scholar] [CrossRef] [PubMed]
  53. Cui, C.; Wang, J.; Fagerberg, E.; Chen, P.M.; Connolly, K.A.; Damo, M.; Cheung, J.F.; Mao, T.; Askari, A.S.; Chen, S.; et al. Neoantigen-driven B cell and CD4 T follicular helper cell collaboration promotes anti-tumor CD8 T cell responses. Cell 2021, 184, 6101–6118. [Google Scholar] [CrossRef] [PubMed]
  54. Burger, J.A.; Wiestner, A. Targeting B cell receptor signalling in cancer: Preclinical and clinical advances. Nat. Rev. Cancer 2018, 18, 148–167. [Google Scholar] [CrossRef] [PubMed]
  55. Selitsky, S.R.; Mose, L.E.; Smith, C.C.; Chai, S.; Hoadley, K.A.; Dittmer, D.P.; Moschos, S.J.; Parker, J.S.; Vincent, B.G. Prognostic value of B cells in cutaneous melanoma. Genome Med. 2019, 11, 36. [Google Scholar] [CrossRef] [PubMed]
  56. Tu, Y.N.; Tong, W.L.; Callahan, B.M.; Chobrutskiy, B.I.; Blanck, G. B-cell Receptor Recombinations in Lung Adenocarcinoma Exome Files Correlate with a Higher Overall Survival Rate. Anticancer Res. 2020, 40, 2043–2051. [Google Scholar] [CrossRef] [PubMed]
  57. Melero, I.; Rouzaut, A.; Motz, G.T.; Coukos, G. T-cell and NK-cell infiltration into solid tumors: A key limiting factor for efficacious cancer immunotherapy. Cancer Discov. 2014, 4, 522–526. [Google Scholar] [CrossRef]
  58. Fridman, W.H.; Pages, F.; Sautes-Fridman, C.; Galon, J. The immune contexture in human tumours: Impact on clinical outcome. Nat. Rev. Cancer 2012, 12, 298–306. [Google Scholar] [CrossRef]
  59. Seo, A.N.; Lee, H.J.; Kim, E.J.; Kim, H.J.; Jang, M.H.; Lee, H.E.; Kim, Y.J.; Kim, J.H.; Park, S.Y. Tumour-infiltrating CD8+ lymphocytes as an independent predictive factor for pathological complete response to primary systemic therapy in breast cancer. Br. J. Cancer 2013, 109, 2705–2713. [Google Scholar] [CrossRef]
  60. Skuciova, V.; Drahosova, S.; Vybohova, D.; Cigerova, V.; Adamkov, M. The relationships between PD-L1 expression, CD8+ TILs and clinico-histomorphological parameters in malignant melanomas. Pathol. Res. Pract. 2020, 216, 153071. [Google Scholar] [CrossRef]
  61. Paul, S.; Lal, G. The Molecular Mechanism of Natural Killer Cells Function and Its Importance in Cancer Immunotherapy. Front. Immunol. 2017, 8, 1124. [Google Scholar] [CrossRef]
  62. Jassar, A.S.; Suzuki, E.; Kapoor, V.; Sun, J.; Silverberg, M.B.; Cheung, L.; Burdick, M.D.; Strieter, R.M.; Ching, L.M.; Kaiser, L.R.; et al. Activation of tumor-associated macrophages by the vascular disrupting agent 5,6-dimethylxanthenone-4-acetic acid induces an effective CD8+ T-cell-mediated antitumor immune response in murine models of lung cancer and mesothelioma. Cancer Res. 2005, 65, 11752–11761. [Google Scholar] [CrossRef] [PubMed]
  63. Russick, J.; Joubert, P.E.; Gillard-Bocquet, M.; Torset, C.; Meylan, M.; Petitprez, F.; Dragon-Durey, M.A.; Marmier, S.; Varthaman, A.; Josseaume, N.; et al. Natural killer cells in the human lung tumor microenvironment display immune inhibitory functions. J. Immunother. Cancer 2020, 8, e001054. [Google Scholar] [CrossRef] [PubMed]
  64. Martinez-Lostao, L.; Anel, A.; Pardo, J. How Do Cytotoxic Lymphocytes Kill Cancer Cells? Clin. Cancer Res. 2015, 21, 5047–5056. [Google Scholar] [CrossRef] [PubMed]
  65. Kang, J.Y.; Kim, K.E. Prognostic Value of Interleukin-32 Expression and Its Correlation with the Infiltration of Natural Killer Cells in Cutaneous Melanoma. J. Clin. Med. 2021, 10, 4691. [Google Scholar] [CrossRef] [PubMed]
  66. Gil, M.; Kim, K.E. Systematic Multiomic Analysis of Ly75 Gene Expression and Its Prognostic Value Through the Infiltration of Natural Killer (NK) Cells in Skin Cutaneous Melanoma. J. Clin. Med. 2020, 9, 1383. [Google Scholar] [CrossRef] [PubMed]
  67. Lanzavecchia, A.; Sallusto, F. Dynamics of T lymphocyte responses: Intermediates, effectors, and memory cells. Science 2000, 290, 92–97. [Google Scholar] [CrossRef] [PubMed]
  68. von Andrian, U.H.; Mackay, C.R. T-cell function and migration. Two sides of the same coin. N. Engl. J. Med. 2000, 343, 1020–1034. [Google Scholar] [CrossRef]
  69. Janeway, C.A., Jr. How the immune system works to protect the host from infection: A personal view. Proc. Natl. Acad. Sci. USA 2001, 98, 7461–7468. [Google Scholar] [CrossRef]
  70. Robertson, M.J. Role of chemokines in the biology of natural killer cells. J. Leukoc. Biol. 2002, 71, 173–183. [Google Scholar] [CrossRef]
  71. Harlin, H.; Meng, Y.; Peterson, A.C.; Zha, Y.; Tretiakova, M.; Slingluff, C.; McKee, M.; Gajewski, T.F. Chemokine expression in melanoma metastases associated with CD8+ T-cell recruitment. Cancer Res. 2009, 69, 3077–3085. [Google Scholar] [CrossRef]
  72. Huang, B.; Han, W.; Sheng, Z.F.; Shen, G.L. Identification of immune-related biomarkers associated with tumorigenesis and prognosis in cutaneous melanoma patients. Cancer Cell Int. 2020, 20, 195. [Google Scholar] [CrossRef] [PubMed]
  73. Li, L.; Yang, L.; Cheng, S.; Fan, Z.; Shen, Z.; Xue, W.; Zheng, Y.; Li, F.; Wang, D.; Zhang, K.; et al. Lung adenocarcinoma-intrinsic GBE1 signaling inhibits anti-tumor immunity. Mol. Cancer 2019, 18, 108. [Google Scholar] [CrossRef] [PubMed]
  74. Yao, X.; Matosevic, S. Chemokine networks modulating natural killer cell trafficking to solid tumors. Cytokine Growth Factor Rev. 2021, 59, 36–45. [Google Scholar] [CrossRef] [PubMed]
  75. Baekkevold, E.S.; Yamanaka, T.; Palframan, R.T.; Carlsen, H.S.; Reinholt, F.P.; von Andrian, U.H.; Brandtzaeg, P.; Haraldsen, G. The CCR7 ligand elc (CCL19) is transcytosed in high endothelial venules and mediates T cell recruitment. J. Exp. Med. 2001, 193, 1105–1112. [Google Scholar] [CrossRef] [PubMed]
  76. Karin, N. Chemokines and cancer: New immune checkpoints for cancer therapy. Curr. Opin. Immunol. 2018, 51, 140–145. [Google Scholar] [CrossRef] [PubMed]
  77. Ramachandran, S.; Verma, A.K.; Dev, K.; Goyal, Y.; Bhatt, D.; Alsahli, M.A.; Rahmani, A.H.; Almatroudi, A.; Almatroodi, S.A.; Alrumaihi, F.; et al. Role of Cytokines and Chemokines in NSCLC Immune Navigation and Proliferation. Oxid. Med. Cell. Longev. 2021, 2021, 5563746. [Google Scholar] [CrossRef]
  78. Johnston, H.E.; Carter, M.J.; Larrayoz, M.; Clarke, J.; Garbis, S.D.; Oscier, D.; Strefford, J.C.; Steele, A.J.; Walewska, R.; Cragg, M.S. Proteomics Profiling of CLL Versus Healthy B-cells Identifies Putative Therapeutic Targets and a Subtype-independent Signature of Spliceosome Dysregulation. Mol. Cell. Proteom. 2018, 17, 776–791. [Google Scholar] [CrossRef]
  79. Gao, X.; Jiang, C.; Yao, S.; Ma, L.; Wang, X.; Cao, Z. Identification of hub genes related to immune cell infiltration in periodontitis using integrated bioinformatic analysis. J. Periodontal. Res. 2022, 57, 392–401. [Google Scholar] [CrossRef]
  80. Zhu, M.; Rhee, I.; Liu, Y.; Zhang, W. Negative regulation of Fc epsilonRI-mediated signaling and mast cell function by the adaptor protein LAX. J. Biol. Chem. 2006, 281, 18408–18413. [Google Scholar] [CrossRef]
  81. Alari-Pahissa, E.; Grandclement, C.; Jeevan-Raj, B.; Leclercq, G.; Veillette, A.; Held, W. Activation by SLAM Family Receptors Contributes to NK Cell Mediated “Missing-Self” Recognition. PLoS ONE 2016, 11, e0153236. [Google Scholar] [CrossRef]
  82. Margraf, S.; Garner, L.I.; Wilson, T.J.; Brown, M.H. A polymorphism in a phosphotyrosine signalling motif of CD229 (Ly9, SLAMF3) alters SH2 domain binding and T-cell activation. Immunology 2015, 146, 392–400. [Google Scholar] [CrossRef]
  83. Chen, S.; Yang, M.; Du, J.; Li, D.; Li, Z.; Cai, C.; Ma, Y.; Zhang, L.; Tian, Z.; Dong, Z. The Self-Specific Activation Receptor SLAM Family Is Critical for NK Cell Education. Immunity 2016, 45, 292–304. [Google Scholar] [CrossRef] [PubMed]
  84. de Lima, D.S.; Cardozo, L.E.; Maracaja-Coutinho, V.; Suhrbier, A.; Mane, K.; Jeffries, D.; Silveira, E.L.V.; Amaral, P.P.; Rappuoli, R.; de Silva, T.I.; et al. Long noncoding RNAs are involved in multiple immunological pathways in response to vaccination. Proc. Natl. Acad. Sci. USA 2019, 116, 17121–17126. [Google Scholar] [CrossRef] [PubMed]
  85. Ma, C.; Luo, H.; Cao, J.; Zheng, X.; Zhang, J.; Zhang, Y.; Fu, Z. Identification of a Novel Tumor Microenvironment-Associated Eight-Gene Signature for Prognosis Prediction in Lung Adenocarcinoma. Front. Mol. Biosci. 2020, 7, 571641. [Google Scholar] [CrossRef] [PubMed]
  86. Lenk, L.; Carlet, M.; Vogiatzi, F.; Spory, L.; Winterberg, D.; Cousins, A.; Vossen-Gajcy, M.; Ibruli, O.; Vokuhl, C.; Cario, G.; et al. CD79a promotes CNS-infiltration and leukemia engraftment in pediatric B-cell precursor acute lymphoblastic leukemia. Commun. Biol. 2021, 4, 73. [Google Scholar] [CrossRef] [PubMed]
  87. Tang, Z.; Kang, B.; Li, C.; Chen, T.; Zhang, Z. GEPIA2: An enhanced web server for large-scale expression profiling and interactive analysis. Nucleic Acids Res. 2019, 47, W556–W560. [Google Scholar] [CrossRef] [PubMed]
  88. Cerami, E.; Gao, J.; Dogrusoz, U.; Gross, B.E.; Sumer, S.O.; Aksoy, B.A.; Jacobsen, A.; Byrne, C.J.; Heuer, M.L.; Larsson, E.; et al. The cBio cancer genomics portal: An open platform for exploring multidimensional cancer genomics data. Cancer Discov. 2012, 2, 401–404. [Google Scholar] [CrossRef] [PubMed]
  89. Schmiedel, B.J.; Singh, D.; Madrigal, A.; Valdovino-Gonzalez, A.G.; White, B.M.; Zapardiel-Gonzalo, J.; Ha, B.; Altay, G.; Greenbaum, J.A.; McVicker, G.; et al. Impact of Genetic Polymorphisms on Human Immune Cell Gene Expression. Cell 2018, 175, 1701–1715.e16. [Google Scholar] [CrossRef]
  90. Li, T.; Fan, J.; Wang, B.; Traugh, N.; Chen, Q.; Liu, J.S.; Li, B.; Liu, X.S. TIMER: A Web Server for Comprehensive Analysis of Tumor-Infiltrating Immune Cells. Cancer Res. 2017, 77, e108–e110. [Google Scholar] [CrossRef]
  91. Ru, B.; Wong, C.N.; Tong, Y.; Zhong, J.Y.; Zhong, S.S.W.; Wu, W.C.; Chu, K.C.; Wong, C.Y.; Lau, C.Y.; Chen, I.; et al. TISIDB: An integrated repository portal for tumor-immune system interactions. Bioinformatics 2019, 35, 4200–4202. [Google Scholar] [CrossRef]
  92. Li, T.; Fu, J.; Zeng, Z.; Cohen, D.; Li, J.; Chen, Q.; Li, B.; Liu, X.S. TIMER2.0 for analysis of tumor-infiltrating immune cells. Nucleic Acids Res. 2020, 48, W509–W514. [Google Scholar] [CrossRef] [PubMed]
  93. Gao, J.; Aksoy, B.A.; Dogrusoz, U.; Dresdner, G.; Gross, B.; Sumer, S.O.; Sun, Y.; Jacobsen, A.; Sinha, R.; Larsson, E.; et al. Integrative analysis of complex cancer genomics and clinical profiles using the cBioPortal. Sci. Signal. 2013, 6, pl1. [Google Scholar] [CrossRef] [PubMed]
  94. Vivian, J.; Rao, A.A.; Nothaft, F.A.; Ketchum, C.; Armstrong, J.; Novak, A.; Pfeil, J.; Narkizian, J.; Deran, A.D.; Musselman-Brown, A.; et al. Toil enables reproducible, open source, big biomedical data analyses. Nat. Biotechnol. 2017, 35, 314–316. [Google Scholar] [CrossRef] [PubMed]
  95. Franz, M.; Rodriguez, H.; Lopes, C.; Zuberi, K.; Montojo, J.; Bader, G.D.; Morris, Q. GeneMANIA update 2018. Nucleic Acids Res. 2018, 46, W60–W64. [Google Scholar] [CrossRef]
  96. Kuleshov, M.V.; Jones, M.R.; Rouillard, A.D.; Fernandez, N.F.; Duan, Q.; Wang, Z.; Koplev, S.; Jenkins, S.L.; Jagodnik, K.M.; Lachmann, A.; et al. Enrichr: A comprehensive gene set enrichment analysis web server 2016 update. Nucleic Acids Res. 2016, 44, W90–W97. [Google Scholar] [CrossRef]
Figure 1. Polycystic kidney and hepatic disease 1-like protein 1 (PKHD1L1) mRNA expression levels in different types of cancers and their normal tissues. (A) PKHD1L1 mRNA expression profiles across various tumor tissues and paired normal tissues were determined using the Gene Expression Profiling Interactive Analysis 2 (GEPIA2) database (https://gepia2.cancer-pku.cn: accessed on 25 April 2023). The green-dot plots in the graph represent the normal samples and the red-dot plots indicate the tumor samples. LUAD: T: n = 483; N: n = 347; SKCM: T: n = 461; N: n = 558. In GEPIA 2.0, the gene expression levels are expressed as log2 (TPM+1) (TPM: transcripts per million). The PKHD1L1 expression in 33 cancer types was assessed via the log2-fold change. The p-value cutoff was 0.05, and the log2-fold change cutoff was 1. Red arrows represent the target cancers (LUAD, SKCM). Abbreviations of the names of various cancer types are listed in Supplementary Table S1. (B) PKHD1L1 mRNA expression levels in various types of cancers were obtained from the Gene Expression database of Normal and Tumor Tissues 2 (GENT2) (https://medical-genomics.krib.re.kr/GENT2/: accessed on 25 April 2023). In the gene expression boxplot, the red plots represent the tumor tissues and the blue plots represent the normal tissues. Gene expression profiles of tumor samples and normal tissues of the target cancers (LUAD, SKCM) are shown in red frames. For statistics, this tool used two-sample t-tests. A p-value of <0.05 was considered statistically significant. Detailed statistical tests are shown in Supplementary Table S2. T: tumor N: normal.
Ijms 25 00359 g001
Figure 2. Correlation between PKHD1L1 expression levels and prognoses of skin cutaneous melanoma (SKCM) and lung adenocarcinoma (LUAD). (A) Kaplan–Meier plots of the relationship between the PKHD1L1 gene expression levels and survival rates of patients with SKCM and LUAD. The survival curves were used to determine the survival rates of the patients with high (red) and low (blue) PKHD1L1 expression levels in SKCM and LUAD using the GEPIA2 web tool (http://gepia2.cancer-pku.cn/: accessed on 25 April 2023). (B) Kaplan–Meier survival curves retrieved from PrognoScan (http://www.prognoscan.org/: accessed on 27 April 2023) for PKHD1L1 mRNA expression levels with the SKCM dataset GSE 19234 and LUAD dataset GSE 8894. The log-rank p-value, p-value of the HR, Cox proportional hazard ratio (HR), and number of patient groups are included. The 95% confidence intervals are shown with dotted lines.
Ijms 25 00359 g002
Figure 3. Correlation between PKHD1L1 expression and immune cell infiltration in SKCM and LUAD. The correlation of the PKHD1L1 expression with TILs in SKCM and LUAD was investigated using the TISIDB web tool (http://cis.hku.hk/TISIDB/index.php/: accessed on 13 May 2023). The PKHD1L1 expression had significant positive correlations with activated B cells (rho = 0.668), immature B cells (rho = 0.618), activated CD8+ T cells (rho = 0.479), effector memory CD8+ T cells (rho = 0.555), and NK cells (rho = 0.446) in SKCM. The PKHD1L1 expression had positive correlations with activated B cells (rho = 0.59), immature B cells (rho = 0.553), activated CD8+ T cells (rho = 0.291), effector memory CD8+ T cells (rho = 0.351), and NK cells (rho = 0.292) in LUAD.
Ijms 25 00359 g003
Figure 4. Single-cell RNA-sequencing analysis of PKHD1L1 in various cell types in (A) melanoma and (B) lung cancer. Number in each box indicates the TPM of PKHD1L1 transcript from single-cell sequencing data.
Ijms 25 00359 g004
Figure 5. Profiling of co-expressed genes with PKHD1L1. Co-expression profile of the PKHD1L1 gene in SKCM and LUAD. (A) The top 25 genes positively associated with the PKHD1L1 transcript level based on TCGA with SKCM. (B) A heatmap revealed the PKHD1L1 and LAX1 mRNA expression levels using the UCSC Xena Browser (https://xena.ucsc.edu/: accessed on 17 July 2023). (C) Dot plot of PKHD1L1 and LAX1 mRNA expressions in the TCGA-SKCM dataset. (D) The correlation module showed the expression scatterplots between PKHD1L1 mRNA and LAX1 in the Mixed Melanoma-Kunz-80 dataset via the R2 platform (https://hgserver1.amc.nl/cgi-bin/r2/main.cgi: accessed on 28 July 2023). (E) The LY9 genes with the highest positively correlation with PKHD1L1 transcript level in LUAD. (F) A heatmap revealed the PKHD1L1 and LY9 mRNA expression levels. (G) Dot plot of PKHD1L1 and LY9 mRNA expressions in the TCGA-LUAD dataset. (H) Correlation between LY9 and PKHD1L1 mRNA expressions in the tumor non-small cell lung carcinoma-Plamadeala-410 dataset, as determined using the R2 database.
Ijms 25 00359 g005
Figure 6. Cluster and gene ontology (GO) analysis of the PKHD1L1 gene in SKCM and LUAD. (A) Protein–protein interaction (PPI) network of PKHD1L1 using GeneMANIA (https://genemania.org/: accessed on 13 August 2023). PPI network analysis revealed the gene sets that interact closely with PKHD1L1. Various networks, such as co-expressions, pathways, physical or genetic interactions, and shared protein domains, are shown in different colors. (B) The Venn Diagram was used for the number of specific common genes between SKCM (n = 277) and LUAD (n = 277) correlated with PKHD1L1 (n = 223). (C) Co-expressed gene profiles with the PKHD1L1 gene involved in signaling pathways between SKCM and LUAD. Gene ontology (GO) analysis was performed using the PKHD1L1 gene and its 223 common co-expressed genes via the Enrichr web tool (https://amp.pharm.mssm.edu/Enrichr: accessed on 15 August 2023) for GO biological processes (2020), molecular functions (2020), and cellular components (2020).
Ijms 25 00359 g006
Table 1. Infiltration levels of PKHD1L1 using the Tumor Immune Estimation Resource (TIMER), v.1.0.
CancerSKCMLUAD
CorrelationpCorrelationp
Purity−0.404451.88 × 10−19−0.357262.56 × 10−16
B cells0.3709974.58 × 10−160.4199734.2 × 10−22
CD8+ T cells0.3907971.97 × 10−170.3351723 × 10⁻¹⁴
CD4+ T cells0.3546571.15 × 10−140.1995439.73 × 10−6
Macrophages0.213924.35 × 10−60.1966831.28 × 10−5
Neutrophils0.4092281.12 × 10−190.2525141.84 × 10−8
Dendritic Cells0.343518.49 × 10−140.2089053.25 × 10−6
SKCM, skin cutaneous melanoma; LUAD, lung adenocarcinoma.
Table 2. Correlation between PKHD1L1 expression and immune cell infiltration using TIMER 2.0.
Immune CellsStatistical Test
Method
SKCM (n = 471)LUAD (n = 515)
RhopRhop
B cellsEPIC0.5125.83 × 10−320.5192.32 × 10−35
QUANTISEQ0.5311.30 × 10−340.4974.44 × 10−32
MCP_COUNTER0.5422.56 × 10−360.5512.08 × 10−40
CIBERSORT_ABS0.4032.53 × 10−120.4031.01 × 10−20
CD8+ T cellsMCP_COUNTER0.4337.25 × 10−720.2792.73 × 10−10
CIBERSORT_ABS0.4363.49 × 10−500.3653.49 × 10−50
QUANTISEQ0.366.91 × 10−140.2876.91 × 10−14
XCELL0.3476.91 × 10−140.2596.91 × 10−14
NK cellsMCP_COUNTER0.4332.40 × 10−220.2631.47 × 10−10
Activated CIBERSORT_ABS0.3269.09 × 10−130.228.399 × 10−7
Resting CIBERSORT−0.1962.50 × 10−5−0.1962.16 × 10−1
Resting CIBERSORT_ABS−0.1644.45 × 10−4−0.052.68 × 10−1
SKCM, skin cutaneous melanoma; LUAD, lung adenocarcinoma; NK, natural killer. Positive correlation (p < 0.05, rho > 0), negative correlation (p < 0.05, rho < 0), not significant (p > 0.05).
Disclaimer/Publisher’s Note: The statements, opinions and data contained in all publications are solely those of the individual author(s) and contributor(s) and not of MDPI and/or the editor(s). MDPI and/or the editor(s) disclaim responsibility for any injury to people or property resulting from any ideas, methods, instructions or products referred to in the content.

