Article

Diagnostic Algorithm to Subclassify Atypical Spitzoid Tumors in Low and High Risk According to Their Methylation Status

by
Jose Francisco González-Muñoz
1,
Beatriz Sánchez-Sendra
1 and
Carlos Monteagudo
1,2,*
1
Skin Cancer Research Group, Biomedical Research Institute INCLIVA, 46010 Valencia, Spain
2
Department of Pathology, University of Valencia, 46010 Valencia, Spain
*
Author to whom correspondence should be addressed.
Int. J. Mol. Sci. 2024, 25(1), 318; https://doi.org/10.3390/ijms25010318
Submission received: 13 November 2023 / Revised: 20 December 2023 / Accepted: 21 December 2023 / Published: 25 December 2023
(This article belongs to the Special Issue Molecular Research on Skin Disease: From Pathology to Therapy)

Abstract

:
Current diagnostic algorithms are insufficient for the optimal clinical and therapeutic management of cutaneous spitzoid tumors, particularly atypical spitzoid tumors (AST). Therefore, it is crucial to identify new markers that allow for reliable and reproducible diagnostic assessment and can also be used as a predictive tool to anticipate the individual malignant potential of each patient, leading to tailored individual therapy. Using Reduced Representation Bisulfite Sequencing (RRBS), we studied genome–wide methylation profiles of a series of Spitz nevi (SN), spitzoid melanoma (SM), and AST. We established a diagnostic algorithm based on the methylation status of seven cg sites located in TETK4P2 (Tektin 4 Pseudogene 2), MYO1D (Myosin ID), and PMF1-BGLAP (PMF1-BGLAP Readthrough), which allows the distinction between SN and SM but is also capable of subclassifying AST according to their similarity to the methylation levels of Spitz nevi or spitzoid melanoma. Thus, our epigenetic algorithm can predict the risk level of AST and predict its potential clinical outcomes.

1. Introduction

Cutaneous spitzoid tumors constitute a heterogeneous subgroup of melanocytic neoplasms with variable malignant potential, ranging from benign Spitz nevus (SN) to spitzoid melanoma (SM), with potential metastatic dissemination [1]. However, there is a challenging intermediate diagnostic group called Spitz melanocytomas/atypical Spitzoid Tumors (AST) [2]. SN are melanocytic neoplasms composed of large epithelioid and/or spindled melanocytes with a regular architecture, usually symmetrical, sharply circumscribed, and typically less than 6 mm in diameter [2]. SM is a melanoma with an initiating genomic alteration characteristic of SN, larger than 6 mm and often greater than 10 mm, more deeply invasive, and showing greater cellular atypia with asymmetry, color variegation, or ulceration [2]. AST is a melanocytic neoplasms characterized by one or more atypical features (at least 5 mm and often greater than 10 mm in diameter, may be asymmetric, with irregular borders, and not well circumscribed) and is genetically intermediate between SN and SM [2].
Current diagnostic algorithms are insufficient for the proper diagnosis and prognosis of AST, which affects the optimal clinical and therapeutic management of these patients. In fact, clinicians often overdiagnose malignancy, resulting in unnecessary use of resources and treatment, with severe emotional and physical impacts on the patients and their relatives [3]. Therefore, predicting the metastatic potential of AST and the clinical outcome of these patients is a major challenge for clinicians [4].
Various approaches have been used over the years to correctly categorize and prognosticate ASTs, including immunohistochemical techniques (p16, ki67 or HMB45) [4]; analysis of copy number variations (CNV) by comparative genomic hybridization (CGH) [5]; fluorescence in situ hybridization (FISH) [6,7]; genetic point mutations [8] in genes, such as HRAS [9,10], NRAS [9], BRAF [11] or TERT [12,13]; and kinase fusions [14] in genes such as ROS1 [15], ALK [16] and NTRK1 [17]. In fact, a diagnostic algorithm for ASTs based on the combination of immunohistochemical techniques, FISH and CGH has been described [18], although the diagnostic value of FISH for AST tumors is limited due to their heterogeneity; and lower than for SN and SM [4,6,19].
However, these molecular techniques are not capable of predicting the clinical behavior of AST and are insufficient for optimal clinical and therapeutic management. It has been proposed that epigenetic changes, which are heritable and reversible events that modify gene expression without changing the DNA sequence, can be used as new biomarkers [6,8,20]. DNA methylation is an epigenetic event that involves the addition of a methyl group to the fifth carbon of a cytosine nucleotide. It is typically associated with stable transcriptional silencing and plays an important role in several biological processes associated with development and disease, such as cell differentiation and regulation of gene expression [21]. In fact, in conventional melanoma, DNA methylation changes have been described to serve as diagnostic, prognostic, and therapeutic biomarkers, and it has been noted that DNA methylation is involved in tumor progression and prognosis [22,23,24]. These DNA methylation changes can be used as epigenetic biomarkers to diagnose and classify spitzoid tumors.
Although the methylation profiles of genes commonly affected in melanoma have been studied using the multiple ligand–dependent probe amplification (MLPA) technique, these limited methylation studies have not been able to identify relevant genes for AST classification [25,26]. As MLPA only allows the methylation study of single genes, it is necessary to assess the global genome methylation status of cutaneous spitzoid melanocytic tumors. Recently, global methylation profiles have been described to discriminate benign spitzoid tumors from conventional nevi and melanomas [27]. Here, using a methylation array, we found that genome–wide methylation levels of SN were similar to those of benign conventional nevi, but the Leukocyte UnMethylation for Purity (LUMP) score of SN was comparable to that of conventional melanoma. The LUMP score was used to estimate the leukocyte content in tumor samples and is a surrogate marker of leukocyte/lymphocyte infiltration [28]. In addition, SN showed homogeneous methylation in comparison to conventional melanoma, which presented a heterogeneous profile that was suggested to be related to its malignant behaviour [27]. However, the latter study only compared SN with conventional melanomas and did not include other spitzoid lesions such as AST and SM. We aimed to diagnose and classify all spitzoid tumors correctly.
Therefore, we used reduced representation bisulfite sequencing (RRBS) to determine the genome–wide methylation profile of the full spectrum of spitzoid lesions. Chatterjee et al. previously used RRBS to identify DNA methylation changes that could serve as progression markers [23] or their relationship with PD-L1 expression [29] but only used primary and metastatic melanoma cell lines. In this way, we found differences between them and constructed a molecular algorithm to classify AST according to their similarity to benign or malignant spitzoid lesions.

2. Results

2.1. Differential Methylation Analysis

When comparing the methylation status of SN, AST, and SM samples at the same time, there were no differences between the groups (Figure 1).
Only hypermethylated sites (214 sites) were detected in some chromosomes with a significance of q-value < 0.05 and a methylation difference higher than 10%. The heatmap of the significant sites showed that there was no separation between SN and SM (Figure 2) because ASTs included samples of unknown malignant potential. By studying only the methylation status of SN and SM tumors, differences between them were defined (Figure 3), and 224 sites were detected, including hypomethylation and hypermethylation.

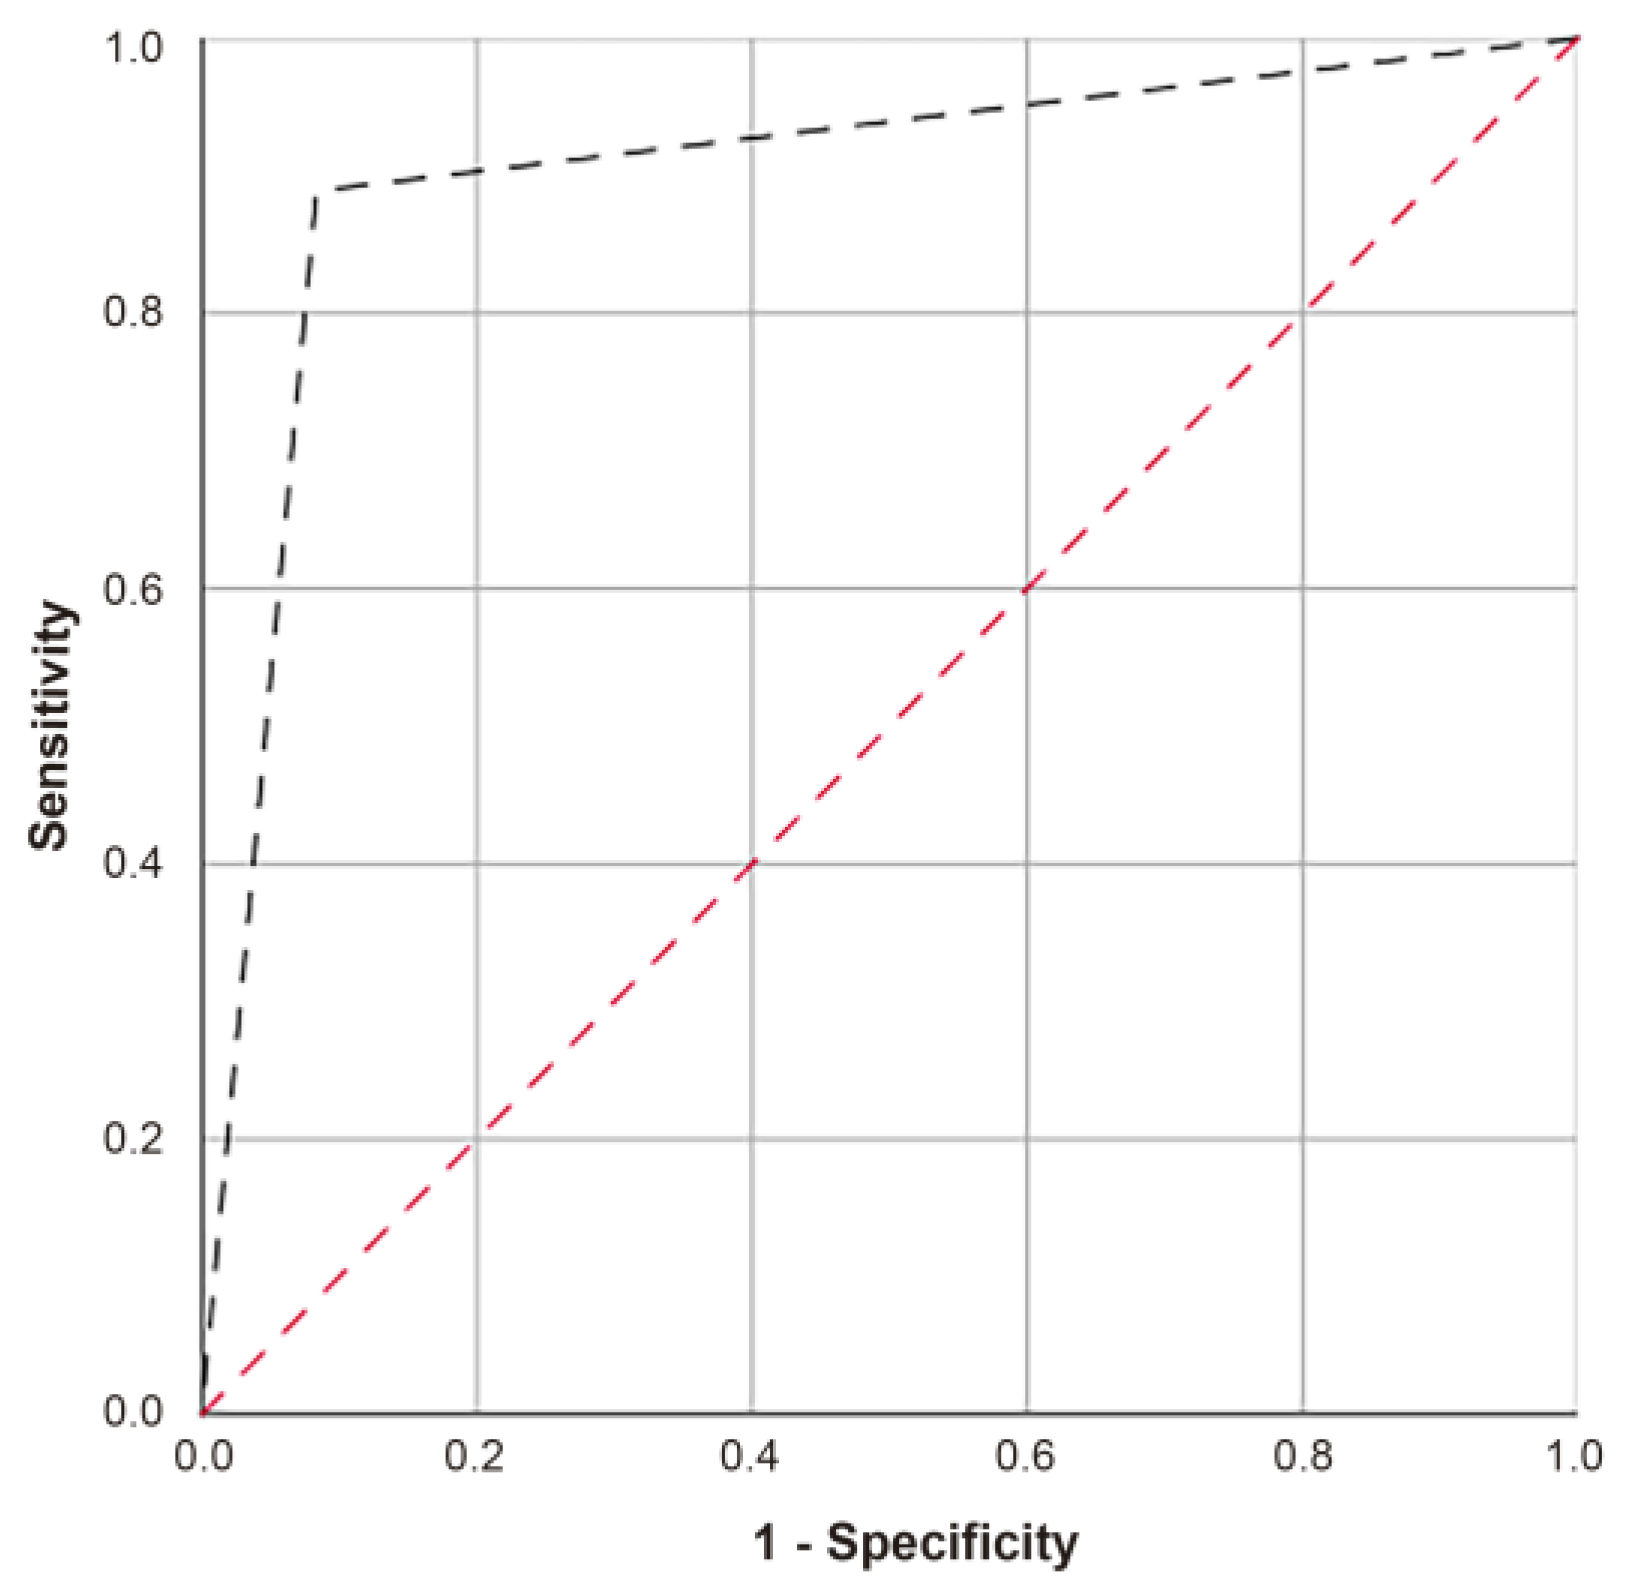
2.2. Predictive Equations

To predict the clinical behavior of the AST group, the results obtained from the differential methylation analysis between the SN and SM were used to build the prediction algorithms.
Modeling using binary logistic regression was performed for each of the 224 CpG sites. This analysis resulted in the selection of seven CpGs (p-value < 0.02) for the construction of the predictive algorithms: cg9825862, cg9825882, cg9826034, cg9826086, cg31149610, cg31149858, and cg156186376 (Figure 4), located in the genes MYO1D (Myosin ID), TEKT4P2 (Tektin 4 Pseudogene 2), and PMF1-BGLAP (PMF1-BGLAP Readthrough) (Table 1).
Receiver operating characteristic (ROC) curve analysis was performed to determine the predictive ability of each of the seven methylation sites (Figure 5), yielding an area under the curve (AUC) rank of 0.833–0.861 (minimum specificity of 0.667 and a minimum sensitivity of 0.833) (Table 2).
We observed that the methylation levels of the seven CpGs were significantly higher in SM than in SN (Figure 6), whereas the methylation status of the ASTs was scattered.
The first predictive algorithm was built with an equation that calculates the probability of being classified as melanoma Equation (1), where the indices from A to G are the percentages of methylation found in each of the seven sites included in the equation (A: cg9825862, B: cg9825882, C: cg9826034, D: cg9826086, E: cg31149610, F: cg31149858, G: cg156186376).
P M e l a n o m a = 1 1 + e x p 342.3 + 3.4 A 10.3 B + 3.4 C + 8.9 D + 8.0 E + 11.0 F 8.7 G
A second prediction algorithm Equation (2) was constructed using the glmulti R package version 1.0.7 to obtain the best predictive combination of the seven CpGs, resulting in cg31149610 (index E) and cg9826086 (index D) (Figure 7):
P M e l a n o m a = 1 1 + e x p 0.16 0.012 E + 0.014 D

2.3. Risk Prediction of the Samples

For both algorithms, we obtained a probability value named P(melanoma). If P(melanoma) < 0.4, the spitzoid tumor is classified as benign (SN) and therefore has no risk of clinical aggressiveness. Conversely, if P(melanoma) is ≥0.4, the spitzoid tumor is classified as having a high risk of clinical aggressiveness (SM).
Hence, a conservative false-positive characteristic is assumed because the model would rather err by saying that a spitzoid lesion would behave as an SM when it is not than classify a true SM as an SN.
Regarding the correct classification of the samples used for the construction of the predictive algorithms, Equation (1) was capable of classifying 100% of the samples in the correct group (SN and SM) with a p-value of 0.0002. In other words, the identified epigenetic signature makes it possible to classify melanoma cases with 100% sensitivity and Spitz nevi cases with 100% specificity. A total of 52.63% of AST cases were classified as SN (10/19), whereas 47.37% were classified as SM (9/19).
A ROC curve was obtained to evaluate the ability of the second algorithm to correctly classify spitzoid tumors, showing an AUC of 0.903 (IC 95% 0.75–1.00) with a p-value of 0.002, sensitivity of 88.9%, and a specificity of 91.7% (Figure 8). Equation (2) failed to classify one SN and SM (Table 3). Here, 36.84% of the ASTs were classified as SN (7/19) and 63.16% as SM (12/19).
Although both algorithms coincided in the prediction of 84.21% of our samples, three AST values predicted as SN in Equation (1) were classified as SM in Equation (2) (Table 4).

3. Discussion

Although several biomarkers, techniques, and molecular algorithms (based on immunohistochemistry, FISH, and CGH [18]) have been proposed in recent decades to correctly classify, diagnose, and predict the clinical behavior of spitzoid tumors, there is still no widely accepted and effective clinical procedure to accomplish this task, largely due to the heterogeneity of AST tumors [4,6].
As previously described [27], SN lesions showed a different methylation profile compared to benign and malignant conventional melanocytic tumors, but the differences within the whole spitzoid tumor spectrum have not been investigated. Global methylation patterns and LUMP scores have been used to distinguish SN from conventional melanocytic tumors, but these tumors already have clear histological differences and are routinely correctly diagnosed by pathologists. In our study, we focused on the differences between SN, AST, and SM.
RBBS was performed because it can be applied to FFPE samples with small amounts of DNA and has a large genomic coverage. In addition, RBBS does not have batch effects compared with microarrays. Whole genome bisulfite sequencing (WGBS) was discarded because of its high sequencing costs and DNA requirements.
Here, we demonstrated a differential methylation status between SN and SM by observing 224 cg sites that were differentially methylated using RRBS. We found seven CpGs with a methylation difference higher than 10% and a q-value < 0.02 between Spitzoid samples located in MYO1D (2 sites), TEKT4P2 (4 sites) and PMF1-BGLAP (1 site) genes.
Using this information, we created two predictive bioinformatics models based on methylation status to first distinguish SN and SM and additionally to subclassify AST according to their potential risk of clinical aggressiveness as a function of the probability value we called P(melanoma). Low risk means that the tumor has a low probability of behaving like an SM, i.e., SN lesion behavior is predicted when P(Melanoma) is less than 0.4. Conversely, if P(melanoma) is greater than or equal to 0.4, the lesion has a high risk of behaving like an SM lesion. In this way, a conservative false–positive character is adopted; that is, the model prefers to err by saying that a spitzoid lesion would behave as SM and not really before it would be a real SM and classify it as an SN.
Although the sensitivity and specificity of predictive Equation (2) (88.9% and 91.7%, respectively) were lower than those of Equation (1) (sensitivity and specificity of 100%), this improved the classification of each of the seven sites individually. Although the AUC of Equation (2) was 0.903, the AUC values of the individual sites ranged from 0.833 to 0.861.
Considering the classification power of Equation (1) for the known samples, we conclude that the two CpG sites from Equation (2) explain most of the variance in the predictive model, and the five additional CpG sites from Equation (1) improve the classification.
The TEKT4P2, MYO1D, and PMF1-BGLAP genes, which are involved in Equation (1), have been described in several tumors, but there is no information related to spitzoid lesions.
TEKT4P2 is a pseudogen that has been described as a progression biomarker in cutaneous conventional melanoma [30]. It has been seen that TEKT4P2 levels decrease as the stages increase (I/II and III/IV compared with stage 0), and additionally, TEKT4P2 interacts with several miRNAs associated with the development of cutaneous melanoma, such as miR-193-3p, miR-194-3p or miR-194-5p [30]. Therefore, similar to conventional cutaneous melanoma, methylation of the non–coding RNA TEKT4P2 could cause gene silencing and regulate other epigenetic markers, such as miRNAs in SM.
MYO1D encodes an unconventional myosin protein involved in actin filament organization. High levels of MYO1D have been described as a poor prognostic biomarker in urothelial cancer but as a good prognostic biomarker in renal cancer [31]. Thus, MYO1D may have dual activity. In fact, although a low expression of MYO1D is related to progression in prostate cancer due to hyperactivation of histone H3K27me3 [32], an overexpression of MYO1D levels in colorectal cancer and acute myeloid leukemia causes an increase in EGFR expression, activating oncogenic pathways, and therefore promoting tumor progression [33,34]. Although it has been described that H3K27me expression is associated with melanocytic lesions, there is no information regarding its role in spitzoid tumors and its relationship with MYO1D methylation [8,35].
The locus PMF1-BGLAP is the read-through transcription site between PMF1 and BGLAP. Its expression has been described as an unfavorable prognostic marker in liver cancer and renal cancer [31]. PMF1-BGLAP encodes PMF1 (polyamine-modulated factor 1), a protein regulated by polyamines involved in chromosome alignment and segregation during mitosis [36]. The methylation of PMF1 in bladder cancer patients has been associated with poor clinical outcomes [37]. Because PMF1-BGLAP is important during mitosis, increased PMF1-BGLAP methylation in SM may be associated with a higher mitotic ratio [2].
Previous studies using RRBS or WGBS in melanoma cell lines described that methylation differences between primary and metastatic melanomas at TBC1D16 and EBF3 were associated with tumor progression [23,38,39]. However, among the 224 cg differentially methylated sites, when comparing spitzoid tumors, we did not find differences in TBC1D16 and EBF3 methylation levels.
Thus, the predictive algorithms disclosed herein have high predictive power and offer a solution in the field of personalized precision medicine [40] to the current clinical challenge posed by patients with spitzoid melanocytic tumors currently classified as “of uncertain malignant potential,” thus providing a precise, clear and personalized answer to the diagnosis and prognosis of these patients [4,8,41]. In fact, despite the cost of RRBS and the difficulty of using this technology in health centers, using this algorithm in clinical practice may help pathologists properly diagnose spitzoid tumors regardless of their experience with these lesions. This epigenetic algorithm could avoid the use of invasive, expensive, and/or time-consuming techniques for both diagnosis and therapy (such as sentinel lymph node studies, PET, or adjuvant therapies) for lesions with a low risk of clinical aggressiveness while minimizing psychosocial and emotional distress to patients [42,43,44].
Nevertheless, it is recommended that a molecular approach that is more accessible to the current healthcare system than RRBS is found to determine the methylation status of the seven cg sites. Due to the complexity of the regions where these cg are located, cytosine and guanine are enriched; thus, at this moment, it is not possible to design primers for direct bisulfite pyrosequencing, methylation-specific PCR (MS-PCR) or MassARRAY (combination of competitive PCR with MALDI-TOF). It is possible that the technical and economic requirements for RRBS or WGBS will soon become lower and more affordable in routine clinical practice. Other approaches could be used, such as anchor-based bisulfite sequencing (ABBS) [45] and nanopore sequencing [46].
In conclusion, our newly identified epigenetic biomarkers and associated algorithms, whether or not combined with immunohistochemistry [18], FISH [7], NGS [47], or even other epigenetic markers [48,49], will improve the diagnosis and prediction of clinical outcomes in challenging ambiguous spitzoid tumors [50].

4. Materials and Methods

4.1. Human Samples

For this study, 40 formalin–fixed paraffin–embedded (FFPE) tumor samples from patients with spitzoid lesions were selected and classified according to the 5th Edition of the World Health Organization (WHO) Classification of Skin Tumor [2] as 12 SN, 19 AST, and 9 SM. Tumor specimens were collected at the time of surgery and reported to the Department of Anatomic Pathology of the Hospital Clínico Universitario, Valencia (Spain) from 1990 to 2018. The Ethical and Scientific Committees of the Hospital Clínico Universitario approved this protocol. Written informed consent was obtained from all the patients. The essential clinicopathological features are shown in Table 5.

4.2. Nucleic Acid Extraction

The pathologist selected the most representative tumor areas of each lesion from hematoxylin–eosin stained slides. These areas were manually punched from paraffin blocks to achieve at least 90% tumor cellularity.
Genomic DNA and total RNA (including small RNAs) from the same punch were simultaneously extracted using AllPrep DNA/RNA FFPE (Qiagen Cat# 80234, Hilden, Germany), following the manufacturer’s recommendations. The main advantage of this kit is its ability to simultaneously obtain genomic DNA and RNA from the same tumor region. This allows different techniques to be performed on small and rare lesions such as spitzoid tumors.
Briefly, deparaffinization was performed efficiently using a commercial solution (Qiagen Cat# 19093, Hilden, Germany), avoiding further washing steps. After solubilization, both nucleic acids were treated separately to remove formaldehyde crosslinks and then purified automatically using the QIAcube nucleic acid purification system (Qiagen Cat# 9002864, Hilden, Germany). RNA and DNA were eluted using 30 µL nuclease–free water and low-EDTA buffer and stored at −80 and −20 °C, respectively.
Both DNA and RNA were quantified using a Nanodrop One (Thermo Fisher Scientific, Waltham, MA, USA). DNA was isolated for the RRBS study, and RNA was extracted for future studies. As required for RRBS, the DNA concentration of the samples was also measured using the Qubit dsDNA BR Assay Kit (Thermo Fisher Scientific, Waltham, MA, USA), and the quality was assessed using the Fragment Analyzer and the DNF-487 Standard Sensitivity or the DNF-488 High Sensitivity Genomic DNA Analysis Kit (Advanced Analytical, Ames, USA), according to the sample concentration.

4.3. Reduced Representation Bisulfite Sequencing (RRBS)

RRBS enables genome–wide DNA methylation mapping with good resolution and theoretical coverage of 3.5 and 4 million CpG dinucleotides in the human genome. This methodology covers CpG islands, promoter regions, and other functional elements, including enhancers, CpG island boundaries, and non–coding RNAs.
DNA methylation profiling (RRBS Service) (Diagenode Cat# G02020000, Seraign, Belgium) was performed. The service workflow includes DNA quality control (QC), preparation of RRBS libraries, deep sequencing, and primary bioinformatics analysis [51].
RRBS libraries were prepared using the Premium Reduced Representation Bisulfite Sequencing Kit, according to the manufacturer’s protocol (Diagenode Cat# C02030033, Seraign, Belgium) [52]. First, DNA was digested with the restriction enzyme MspI, which recognizes CCGG sites, resulting in genomic fragments that start and end with a CpG dinucleotide, regardless of DNA methylation status. For library preparation, the ends were prepared, adaptors were ligated, and samples were selected by size.
Following library preparation, samples were pooled together into groups of eight and treated with bisulfite. Bisulfite converts non–methylated cytosines into uracils, which are then read as timines. Bisulfite treatment was performed under minimum DNA degradation conditions and maximum conversion efficacy of non-methylated cytosines. Next, the library was enriched by amplification via PCR, and a clean-up was performed using 1.45x beads: sample ratio of Agencourt® AMPure® XP (Beckman Coulter, Pasadena, CA, USA).
The Qubit dsDNA HS Assay Kit (Thermo Fisher Scientific, Waltham, MA, USA) was used to measure the DNA pool concentration, and their profiles were checked using the High Sensitivity DNA chip for 2100 Bioanalyzer (Agilent). In case of too high adapter dimer peaks, the pools were size selected one more time using 1.45x beads: sample ratio of Agencourt® AMPure® XP (Beckman Coulter, Pasadena, CA, USA), and quality control steps were performed again. RRBS library pools were sequenced on a HiSeq3000 (Illumina, San Diego, CA, USA) using 50 bp single-read sequencing (SR50).

4.4. Bioinformatics Analysis

Quality control of the sequencing was performed using FastQC version 0.11.8 (Babraham Bioinformatics, Babraham Institute, Cambridge, UK). Trim Galore! Version 0.4.1 was used to remove the adapters (Babraham Bioinformatics, Babraham Institute, Cambridge, UK). Reads were then aligned to the human reference genome hg19 using Bismak v0.16.1, followed by methylation calling using the corresponding Bismark functionality [53]. These quality controls were performed using the Diagenode RRBS Service (Diagenode, Seraign, Belgium).
In addition, other quality controls were performed using FastQC and BAM files using three independent programs: Bismark v0.22.1 [53], MultiQC V1.7 [54], and Qualimap v2.2.1 [55]. Normalization was performed using the normalizeCoverage function of the methylKit R package version 1.20.0 [56].
Differential methylation analysis was performed using the methylKit R package, applying Fisher’s exact test to obtain the p–value and q–value for each cg site. Predictive models were executed by independent logistic regression with the glm function of the R Stats package and the glmulti (version 1.0.7) function to find the best combination of the seven methylation sites of Equation (1) to build Equation (2) [57].

4.5. Statistical Analysis

Statistical analyses were performed using GraphPad Prism V.6.01 (GraphPad Prism Software, Inc., San Diego, CA, USA) and R 4.2.1. The following R packages were used: Stats for heatmap graphs, ROC curves and Kruskal–Wallis rank. A p–value of <0.05 was considered statistically significant.

5. Conclusions

In conclusion, we propose an algorithm with high predictive power for spitzoid tumors according to the methylation status of the seven CpGs described, which may be a key factor to classifying spitzoid tumors and predicting the risk of AST in the challenging group in a reliable and reproducible manner, and consequently to anticipate their potential clinical outcome.

6. Patents

Results from this work have been patented with an European Patent Application (application number 21382569.8) and an International Patent Application (application number PCT/EP2022/067556) entitled “Molecular tools for the diagnosis and prognosis of melanocytic Spitzoid tumors”, whose inventors are the authors of this manuscript.

Author Contributions

Conceptualization, J.F.G.-M. and C.M.; methodology, J.F.G.-M., B.S.-S. and C.M.; validation, J.F.G.-M., B.S.-S. and C.M.; formal analysis, J.F.G.-M., B.S.-S. and C.M.; investigation, J.F.G.-M., B.S.-S. and C.M.; resources, J.F.G.-M., B.S.-S. and C.M.; data curation, J.F.G.-M., B.S.-S. and C.M.; writing—original draft preparation, J.F.G.-M. and C.M.; writing—review and editing, J.F.G.-M., B.S.-S. and C.M.; visualization, J.F.G.-M., B.S.-S. and C.M.; supervision, C.M.; project administration, C.M.; funding acquisition, C.M. All authors have read and agreed to the published version of the manuscript.

Funding

This research was funded by the Instituto de Salud Carlos III, Spain; FEDER European funds, grant numbers PI17/02019 and PI20/00094 (to C.M.); and “Reto Everest” from the Asociación Española Contra el Cáncer (AECC).

Institutional Review Board Statement

This study was conducted in accordance with the guidelines of the Declaration of Helsinki and was supervised and approved by the Ethical and Scientific Committees of the Hospital Clínico Universitario of Valencia (CEIC02017.302, 22 June 2017).

Informed Consent Statement

Informed consent was obtained from all the subjects involved in the study.

Data Availability Statement

The data presented in this study are available from the corresponding author upon reasonable request.

Conflicts of Interest

The authors declare no conflicts of interest. The funders had no role in the design of the study design; in the collection, analyses, or interpretation of data; in the writing of the manuscript; or in the decision to publish the results.

References

  1. Abboud, J.; Stein, M.; Ramien, M.; Malic, C. The diagnosis and management of the Spitz nevus in the pediatric population: A systematic review and meta-analysis protocol. Syst. Rev. 2017, 6, 81. [Google Scholar] [CrossRef] [PubMed]
  2. WHO. Classification of Tumours Editorial Board, Skin Tumours, 5th ed.; WHO Classification of Tumours Series; WHO: Geneva, Switzerland, 2023; Volume 12.
  3. Tom, W.L.; Hsu, J.W.; Eichenfield, L.F. Pediatric “STUMP” lesions: Evaluation and management of difficult atypical Spitzoid lesions in children. J. Am. Acad. Dermatol. 2011, 64, 572–599. [Google Scholar] [CrossRef] [PubMed]
  4. Hillen, L.M.; Van den Oord, J.; Geybels, M.S.; Becker, J.C.; Hausen, A.Z.; Winnepenninckx, V. Genomic landscape of spitzoid neoplasms impacting patient management. Front. Med. 2018, 5, 344. [Google Scholar] [CrossRef] [PubMed]
  5. Mesbah Ardakani, N.; Thomas, C.; Robinson, C.; Mina, K.; Harvey, N.T.; Amanuel, B.; Wood, B.A. Detection of copy number variations in melanocytic lesions utilising array based comparative genomic hybridisation. Pathology 2017, 49, 285–291. [Google Scholar] [CrossRef] [PubMed]
  6. Wiesner, T.; Kutzner, H.; Cerroni, L.; Mihm, M.C.; Busam, K.J.; Murali, R. Genomic aberrations in spitzoid melanocytic tumours and their implications for diagnosis, prognosis and therapy. Pathology 2016, 48, 113–131. [Google Scholar] [CrossRef] [PubMed]
  7. Gerami, P.; Scolyer, R.A.; Xu, X.; Elder, D.E.; Abraham, R.M.; Fullen, D.; Prieto, V.G.; Leboit, P.E.; Barnhill, R.L.; Cooper, C.; et al. Risk assessment for atypical spitzoid melanocytic neoplasms using FISH to identify chromosomal copy number aberrations. Am. J. Surg. Pathol. 2013, 37, 676–684. [Google Scholar] [CrossRef] [PubMed]
  8. Dimonitsas, E.; Liakea, A.; Sakellariou, S.; Thymara, I.; Giannopoulos, A.; Stratigos, A.; Soura, E.; Saetta, A.; Korkolopoulou, P. An update on molecular alterations in melanocytic tumors with emphasis on Spitzoid lesions. Ann. Transl. Med. 2018, 6, 249. [Google Scholar] [CrossRef] [PubMed]
  9. Raghavan, S.S.; Peternel, S.; Mully, T.W.; North, J.P.; Pincus, L.B.; LeBoit, P.E.; McCalmont, T.H.; Bastian, B.C.; Yeh, I. Spitz melanoma is a distinct subset of spitzoid melanoma. Mod. Pathol. 2020, 33, 1122–1134. [Google Scholar] [CrossRef]
  10. van Engen-van Grunsven, A.C.; van Dijk, M.C.; Ruiter, D.J.; Klaasen, A.; Mooi, W.J.; Blokx, W.A. HRAS-mutated spitz tumors: A subtype of spitz tumors with distinct features. Am. J. Surg. Pathol. 2010, 34, 1436–1441. [Google Scholar] [CrossRef]
  11. Tetzlaff, M.T.; Reuben, A.; Billings, S.D.; Prieto, V.G.; Curry, J.L. Toward a Molecular-Genetic Classification of Spitzoid Neoplasms. Clin. Lab. Med. 2017, 37, 431–448. [Google Scholar] [CrossRef]
  12. Lee, S.; Barnhill, R.L.; Dummer, R.; Dalton, J.; Wu, J.; Pappo, A.; Bahrami, A. TERT Promoter Mutations Are Predictive of Aggressive Clinical Behavior in Patients with Spitzoid Melanocytic Neoplasms. Sci. Rep. 2015, 5, 11200. [Google Scholar] [CrossRef] [PubMed]
  13. Requena, C.; Heidenreich, B.; Kumar, R.; Nagore, E. TERT promoter mutations are not always associated with poor prognosis in atypical spitzoid tumors. Pigment Cell Melanoma Res. 2017, 30, 265–268. [Google Scholar] [CrossRef] [PubMed]
  14. Wiesner, T.; He, J.; Yelensky, R.; Esteve-Puig, R.; Botton, T.; Yeh, I.; Lipson, D.; Otto, G.; Brennan, K.; Murali, R.; et al. Kinase fusions are frequent in Spitz tumours and spitzoid melanomas. Nat. Commun. 2014, 5, 3116. [Google Scholar] [CrossRef] [PubMed]
  15. Quan, V.L.; Panah, E.; Zhang, B.; Shi, K.; Mohan, L.S.; Gerami, P. The role of gene fusions in melanocytic neoplasms. J. Cutan. Pathol. 2019, 46, 878–887. [Google Scholar] [CrossRef] [PubMed]
  16. Yeh, I.; de la Fouchardiere, A.; Pissaloux, D.; Mully, T.W.; Garrido, M.C.; Vemula, S.S.; Busam, K.J.; LeBoit, P.E.; McCalmont, T.H.; Bastian, B.C. Clinical, histopathologic, and genomic features of Spitz tumors with ALK fusions. Am. J. Surg. Pathol. 2015, 39, 581–591. [Google Scholar] [CrossRef]
  17. Amin, S.M.; Haugh, A.M.; Lee, C.Y.; Zhang, B.; Bubley, J.A.; Merkel, E.A.; Verzì, A.E.; Gerami, P. A comparison of morphologic and molecular features of BRAF, ALK, and NTRK1 fusion spitzoid neoplasms. Am. J. Surg. Pathol. 2017, 41, 491–498. [Google Scholar] [CrossRef]
  18. Cho-Vega, J.H. A diagnostic algorithm for atypical spitzoid tumors: Guidelines for immunohistochemical and molecular assessment. Mod. Pathol. 2016, 29, 656–670. [Google Scholar] [CrossRef]
  19. Lee, C.Y.; Gerami, P. Molecular techniques for predicting behaviour in melanocytic neoplasms. Pathology 2016, 48, 142–146. [Google Scholar] [CrossRef]
  20. Schinke, C.; Mo, Y.; Yu, Y.; Amiri, K.; Sosman, J.; Greally, J.; Verma, A. Aberrant DNA methylation in malignant melanoma. Melanoma Res. 2010, 20, 253–265. [Google Scholar] [CrossRef]
  21. Rivera, R.M.; Bennett, L.B. Epigenetics in humans: An overview. Curr. Opin. Endocrinol. Diabetes Obes. 2010, 17, 493–499. [Google Scholar] [CrossRef]
  22. Micevic, G.; Theodosakis, N.; Bosenberg, M. Aberrant DNA methylation in melanoma: Biomarker and therapeutic opportunities. Clin. Epigenetics 2017, 9, 34. [Google Scholar] [CrossRef] [PubMed]
  23. Chatterjee, A.; Stockwell, P.A.; Ahn, A.; Rodger, E.J.; Leichter, A.L.; Eccles, M.R. Genome-wide methylation sequencing of paired primary and metastatic cell lines identifies common DNA methylation changes and a role for EBF3 as a candidate epigenetic driver of melanoma metastasis. Oncotarget 2017, 8, 6085–6101. [Google Scholar] [CrossRef] [PubMed]
  24. Wouters, J.; Vizoso, M.; Martinez-Cardus ACarmona, F.J.; Govaere, O.; Laguna, T.; Joseph, J.; Dynoodt, P.; Aura, C.; Foth, M.; Cloots, R.; et al. Comprehensive DNA methylation study identifies novel progression-related and prognostic markers for cutaneous melanoma. BMC Med. 2017, 15, 1–16. [Google Scholar] [CrossRef] [PubMed]
  25. Martinez-Ciarpaglini, C.; Gonzalez, J.; Sanchez, B.; Agusti, J.; Navarro, L.; Nieto, G.; Monteagudo, C. The amount of melanin influences p16 Loss in spitzoid melanocytic lesions: Correlation with CDKN2A Status by FISH and MLPA. Appl. Immunohistochem. Mol. Morphol. 2019, 27, 423–429. [Google Scholar] [CrossRef] [PubMed]
  26. Takata, M.; Lin, J.; Takayanagi, S.; Suzuki, T.; Ansai, S.; Kimura, T.; Cerroni, L.; Saida, T. Genetic and epigenetic alterations in the differential diagnosis of malignant melanoma and spitzoid lesion. Br. J. Dermatol. 2007, 156, 1287–1294. [Google Scholar] [CrossRef] [PubMed]
  27. Zaremba, A.; Jansen, P.; Murali, R.; Mayakonda, A.; Riedel, A.; Philip, M.; Rose, C.; Schaller, J.; Müller, H.; Kutzner, H.; et al. Genetic and methylation profiles distinguish benign, malignant and spitzoid melanocytic tumors. Int. J. Cancer 2022, 151, 1542–1554. [Google Scholar] [CrossRef] [PubMed]
  28. Aran, D.; Sirota, M.; Butte, A.J. Systematic pan-cancer analysis of tumour purity. Nat. Commun. 2015, 6, 8971. [Google Scholar] [CrossRef]
  29. Chatterjee, A.; Rodger, E.J.; Ahn, A.; Stockwell, P.A.; Parry, M.; Motwani, J.; Gallagher, S.J.; Shklovskaya, E.; Tiffen, J.; Eccles, M.R.; et al. Marked global DNA hypomethylation is associated with constitutive PD-L1 expression in melanoma. iScience 2018, 4, 312–325. [Google Scholar] [CrossRef]
  30. Xu, S.; Sui, J.; Yang, S.; Liu, Y.; Wang, Y.; Liang, G. Integrative analysis of competing endogenous RNA network focusing on long noncoding RNA associated with progression of cutaneous melanoma. Cancer Med. 2018, 7, 1019–1029. [Google Scholar] [CrossRef]
  31. Pontén, F.; Jirström, K.; Uhlen, M. The Human Protein Atlas—A tool for pathology. J. Pathol. 2008, 216, 387–393. [Google Scholar] [CrossRef]
  32. Ngollo, M.; Lebert, A.; Daures, M.; Judes, G.; Rifai, K.; Dubois, L.; Kemeny, J.L.; Penault-Llorca, F.; Bignon, Y.J.; Guy, L.; et al. Global analysis of H3K27me3 as an epigenetic marker in prostate cancer progression. BMC Cancer 2017, 17, 261. [Google Scholar] [CrossRef] [PubMed]
  33. Ko, Y.S.; Bae, J.A.; Kim, K.Y.; Kim, S.J.; Sun, E.G.; Lee, K.H.; Kim, N.; Kang, H.; Seo, Y.W.; Kim, H.; et al. MYO1D binds with kinase domain of the EGFR family to anchor them to plasma membrane before their activation and contributes carcinogenesis. Oncogene 2019, 38, 7416–7432. [Google Scholar] [CrossRef] [PubMed]
  34. Mu, J.; Yuan, P.; Luo, J.; Chen, Y.; Tian, Y.; Ding, L.; Zhao, B.; Wang, X.; Wang, B.; Liu, L. Upregulated SPAG6 promotes acute myeloid leukemia progression through MYO1D that regulates the EGFR family expression. Blood Adv. 2022, 6, 5379–5394. [Google Scholar] [CrossRef] [PubMed]
  35. Jin, S.G.; Xiong, W.; Wu, X.; Yang, L.; Pfeifer, G.P. The DNA methylation landscape of human melanoma. Genomics 2015, 106, 322–330. [Google Scholar] [CrossRef] [PubMed]
  36. Rutten-Jacobs LC, A.; Rost, N.S. Emerging Insights from the Genetics of Cerebral Small Vessel Disease. Ann. N. Y. Acad. Sci. 2020, 1471, 5–17. [Google Scholar] [CrossRef] [PubMed]
  37. Ye, F.; Liang, Y.; Hu, J.; Hu, Y.; Liu, Y.; Cheng, Z.; Ou, Y.; Xu, C.; Jiang, H. DNA Methylation Modification Map to Predict Tumor Molecular Subtypes and Efficacy of Immunotherapy in Bladder Cancer. Front. Cell Dev. Biol. 2021, 9, 760369. [Google Scholar] [CrossRef] [PubMed]
  38. Vizoso, M.; Ferreira, H.J.; Lopez-Serra, P.; Carmona, F.J.; Martínez-Cardús, A.; Girotti, M.R.; Villanueva, A.; Guil, S.; Moutinho, C.; Liz, J.; et al. Epigenetic activation of a cryptic TBC1D16 transcript enhances melanoma progression by targeting EGFR. Nat. Med. 2015, 21, 741–750. [Google Scholar] [CrossRef] [PubMed]
  39. Rodger, E.J.; Chatterjee, A.; Stockwell, P.A.; Eccles, M.R. Characterisation of DNA methylation changes in EBF3 and TBC1D16 associated with tumour progression and metastasis in multiple cancer types. Clin Epigenet. 2019, 11, 114. [Google Scholar] [CrossRef]
  40. Werner, R.J.; Kelly, A.D.; Issa, J.J. Epigenetics and Precision Oncology. Cancer J. 2017, 23, 262–269. [Google Scholar] [CrossRef]
  41. Broganelli, P.; Ribero, S.; Castagno, I.; Ricceri, F.; Deboli, T.; Marra, E.; Tomasini, C.; Sacerdote, C.; Osella-Abate, S.; Sanlorenzo, M.; et al. The large spectrum of Spitzoid tumors: A retrospective survival study. G. Ital. Dermatol. Venereol. 2019, 154, 315–320. [Google Scholar] [CrossRef]
  42. Kelley, S.W.; Cockerell, C.J. Sentinel lymph node biopsy as an adjunct to management of histologically difficult to diagnose melanocytic lesions: A proposal. J. Am. Acad. Dermatol. 2000, 42, 527–530. [Google Scholar] [CrossRef] [PubMed]
  43. Dieng, M.; Cust, A.E.; Kasparian, N.A.; Mann, G.J.; Morton, R.L. Economic evaluations of psychosocial intervention in cancer: A systematic review. Psychooncology 2016, 25, 1380–1392. [Google Scholar] [CrossRef] [PubMed]
  44. Bares, C.B.; Trask, P.C.; Schwartz, S.M. An exercise in cost-effectiveness analysis: Treating emotional distress in melanoma patients. J. Clin. Psychol. Med. Settings 2002, 91, 193–200. [Google Scholar] [CrossRef]
  45. Chapin, N.; Fernandez, J.; Poole, J.; Delatte, B. Anchor-based bisulfite sequencing determines genome-wide DNA methylation. Commun. Biol. 2022, 5, 596. [Google Scholar] [CrossRef] [PubMed]
  46. Gershman, A.; Sauria ME, G.; Guitart, X.; Vollger, M.R.; Hook, P.W.; Hoyt, S.J.; Jain, M.; Shumate, A.; Razaghi, R.; Koren, S.; et al. Epigenetic patterns in a complete human genome. Science 2022, 376, abj5089. [Google Scholar] [CrossRef] [PubMed]
  47. Chen, X.; Cao, W.; Zhuang, Y.; Chen, S.; Li, X. Integrative analysis of potential biomarkers and immune cell infiltration in Parkinson’s disease. Brain Res. Bull. 2021, 177, 53–63. [Google Scholar] [CrossRef] [PubMed]
  48. Latchana, N.; del Campo, S.E.; Grignol, V.P.; Clark, J.R.; Albert, S.P.; Zhang, J.; Wei, L.; Aldrink, J.H.; Nicol, K.K.; Ranalli, M.A.; et al. Classification of Indeterminate Melanocytic Lesions by MicroRNA Profiling. Ann. Surg. Oncol. 2017, 24, 347–354. [Google Scholar] [CrossRef] [PubMed]
  49. Latchana, N.; Regan, K.; Howard, J.H.; Aldrink, J.H.; Ranalli, M.A.; Peters, S.B.; Zhang, X.; Gru, A.; Payne PR, O.; Sua-rez-Kelly, L.P.; et al. Global microRNA profiling for diagnostic appraisal of melanocytic Spitz tumors. J. Surg. Res. 2016, 205, 350–358. [Google Scholar] [CrossRef]
  50. Pappo, A.S.; McPherson, V.; Pan, H.; Wang, F.; Wang, L.; Wright, T.; Hussong, M.; Hawkins, D.; Kaste, S.C.; Davidoff, A.M.; et al. A prospective, comprehensive registry that integrates the molecular analysis of pediatric and adolescent mela-nocytic lesions. Cancer 2021, 127, 3825–3831. [Google Scholar] [CrossRef]
  51. Veillard, A.-C.; Datlinger, P.; Laczik, M.; Squazzo, S.; Bock, C. Diagenode® Premium RRBS technology: Cost-effective DNA methylation mapping with superior coverage. Nat. Methods 2016, 13, i–ii. [Google Scholar] [CrossRef]
  52. Zhao, S.; Li, J.; Zhang, H.; Qi, L.; Du, Y.; Kogiso, M.; Braun, F.K.; Xiao, S.; Huang, Y.; Li, J.; et al. Epigenetic Alterations of Repeated Relapses in Patient-matched Childhood Ependymomas. Nat. Commun. 2022, 13, 6689. [Google Scholar] [CrossRef] [PubMed]
  53. Krueger, F.; Andrews, S.R. Bismark: A flexible aligner and methylation caller for Bisulfite-Seq applications. Bioinformatics 2011, 27, 1571–1572. [Google Scholar] [CrossRef] [PubMed]
  54. Ewels, P.; Magnusson, M.; Lundin, S.; Käller, M. MultiQC: Summarize analysis results for multiple tools and samples in a single report. Bioinformatics 2016, 32, 3047–3048. [Google Scholar] [CrossRef] [PubMed]
  55. Okonechnikov, K.; Conesa, A.; García-Alcalde, F. Qualimap 2: Advanced multi-sample quality control for high-throughput sequencing data. Bioinformatics 2016, 32, 292–294. [Google Scholar] [CrossRef]
  56. Akalin, A.; Kormaksson, M.; Li, S.; Garrett-Bakelman, F.E.; Figueroa, M.E.; Melnick, A.; Mason, C.E. MethylKit: A comprehensive R package for the analysis of genome-wide DNA methylation profiles. Genome Biol. 2012, 13, R87. [Google Scholar] [CrossRef]
  57. Calcagno, V.; de Mazancourt, C. glmulti: An R package for easy automated model selection with (generalized) linear models. J. Stat. Softw. 2010, 34, 29. [Google Scholar] [CrossRef]
Figure 1. PCA from CpG methylation analysis of the three experimental groups.
Ijms 25 00318 g001
Figure 2. Heatmap showing the sites (214) with more than 10% methylation difference with respect to the control (SN) (q-value < 0.05 when comparing the three experimental groups). There is a histogram in the color key showing the number of cg sites (count) and the methylation percentage (value).
Ijms 25 00318 g002
Figure 3. Heatmap showing the sites (214) with more than 10% methylation difference with respect to the control (SN) (q-value < 0.05 when comparing the Spitzoid nevi and melanoma groups). There is a histogram in the color key showing the number of cg sites (count) and the methylation percentage (value).
Ijms 25 00318 g003
Figure 4. Heatmap showing the methylation levels of the seven methylation sites with p-value < 0.02 (Spitzoid nevi and melanoma groups). There is a histogram in the color key showing the number of cg sites (count) and the methylation percentage (value).
Ijms 25 00318 g004
Figure 5. Individual ROC curve of (a) cg31149610, (b) cg9826086, (c) cg9825862, (d) cg9825882, (e) cg9826034, (f) cg31149858 and (g) cg156186376.
Ijms 25 00318 g005aIjms 25 00318 g005b
Figure 6. Methylation levels of individual CpG according to diagnosis. * = (p-value < 0.05); ** = (p-value < 0.01).
Ijms 25 00318 g006
Figure 7. Heatmap showing the methylation levels of the two methylation sites from Equation (2) (Spitzoid nevi and melanoma groups). There is a histogram in the color key showing the number of cg sites (count) and the methylation percentage (value).
Ijms 25 00318 g007
Figure 8. ROC curve of Equation (2).
Ijms 25 00318 g008
Table 1. Differentially methylated CpGs were selected for the construction of the predictive algorithms.
Position (cg)ChromosomeGeneTranscript
3114961017MYO1DNM_015194
3114985817MYO1DNM_015194
982608621TEKT4P2NR_038327
982586221TEKT4P2NR_038327
982588221TEKT4P2NR_038327
982603421TEKT4P2NR_038327
1561863761PMF1-BGLAPNM_001199662
Table 2. Specificity, sensitivity, and area under the curve (AUC) of the 7 cg differentially methylated.
Position (cg)GeneSpecificitySensitivityAUCCut-Off
31149610MYO1D0.750.8890.86117.163
31149858MYO1D0.750.8890.85210.554
9826086TEKT4P20.750.8890.86121.219
9825862TEKT4P20.8330.7780.85211.014
9825882TEKT4P20.66710.83310.007
9826034TEKT4P20.9170.7780.86121.041
156186376PMF1-BGLAP0.750.8890.85215.235
Table 3. Prediction of Equations (1) and (2) of SN and SM tumor samples.
SampleDiagnosisPrediction 1Prediction 2
1SMSMSM
2SMSMSM
3SMSMSN
4SMSMSM
5SMSMSM
6SMSMSM
7SMSMSM
8SMSMSM
9SNSNSN
10SNSNSN
11SNSNSN
12SNSNSN
13SNSNSN
14SNSNSN
15SNSNSN
16SNSNSM
17SNSNSN
18SMSMSM
19SNSNSN
20SNSNSN
21SNSNSN
Table 4. Prediction of Equations (1) and (2) of AST samples.
SampleDiagnosisPrediction 1Prediction 2
22ASTSNSN
23ASTSNSN
24ASTSNSM
25ASTSMSM
26ASTSNSN
27ASTSMSM
28ASTSNSN
29ASTSMSM
30ASTSMSM
31ASTSMSM
32ASTSNSN
33ASTSMSM
34ASTSMSM
35ASTSMSM
36ASTSMSM
37ASTSNSN
38ASTSNSM
39ASTSNSM
40ASTSNSN
Table 5. Clinicopathologic characteristics of the three subgroups of spitzoid tumors.
DiagnosisnAge (Years) at
Diagnosis
(Median ± SD #)
GenderLocationDiameter
(mm)
(Median ± SD #)
Mitosis/mm2
(Median ± SD #)
SN12 24.08 ± 18.33Male: 25%
Female: 75%
Lower limb: 4
Trunk: 2
Upper limb: 4
Head & neck: 1
Not specified: 1
6.14 ± 3.180.33 ± 0.65
AST1920.6 ± 14.84Male: 37.5%
Female: 62.5%
Lower limb: 2
Trunk: 3
Upper limb: 3
Head & neck: 2
Not specified: 9
5.22 ± 2.481.53 ± 1.07
SM947.22 ± 20.31Male: 66.67%
Female: 33.33%
Lower limb: 1
Trunk: 1
Upper limb: 4
Head & neck: 0
Not specified: 3
5.16 ± 1.315 ± 2.83
SN, Spitz nevus; AST, Atypical Spitzoid Tumor; SM, Spitzoid melanoma. # SD, standard deviation.
Disclaimer/Publisher’s Note: The statements, opinions and data contained in all publications are solely those of the individual author(s) and contributor(s) and not of MDPI and/or the editor(s). MDPI and/or the editor(s) disclaim responsibility for any injury to people or property resulting from any ideas, methods, instructions or products referred to in the content.

