

Nutri-PEITC Jelly Significantly Improves Progression-Free Survival and Quality of Life in Patients with Advanced Oral and Oropharyngeal Cancer: A Blinded Randomized Placebo-Controlled Trial


Abstract
1. Introduction
2. Results
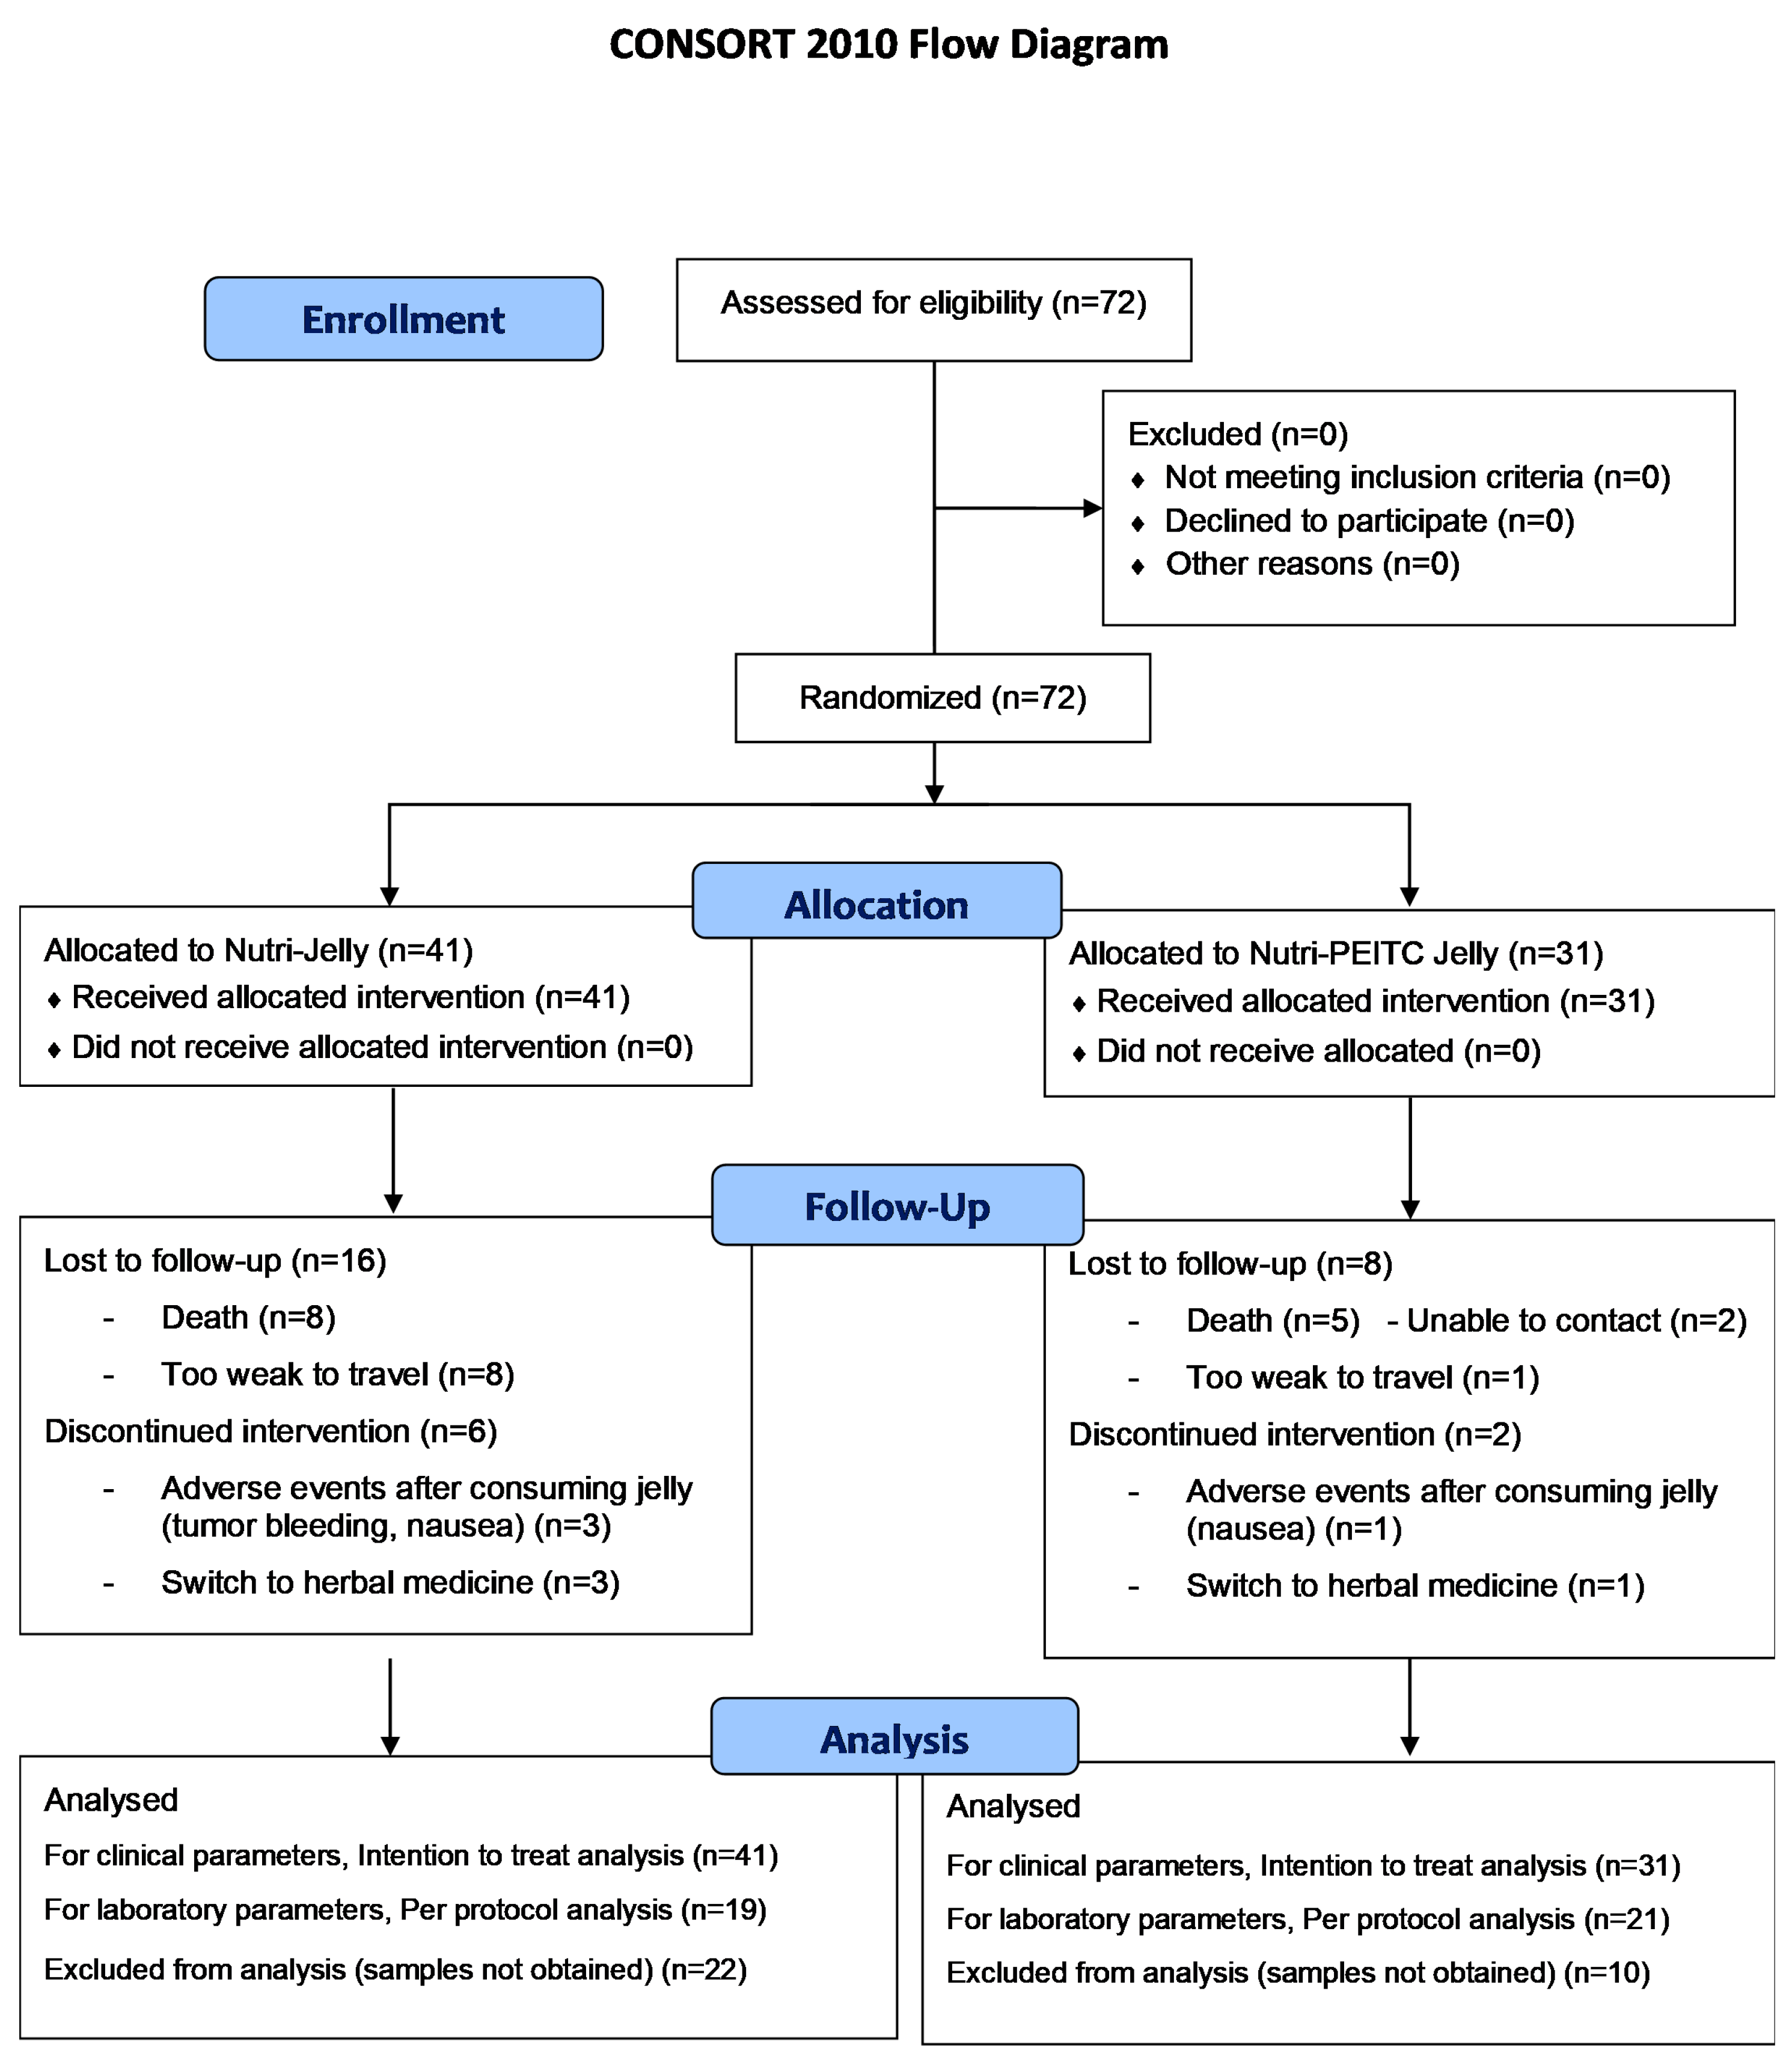
2.1. Participant Flow Chart
2.2. Characteristics of Participants
2.3. Adverse Events
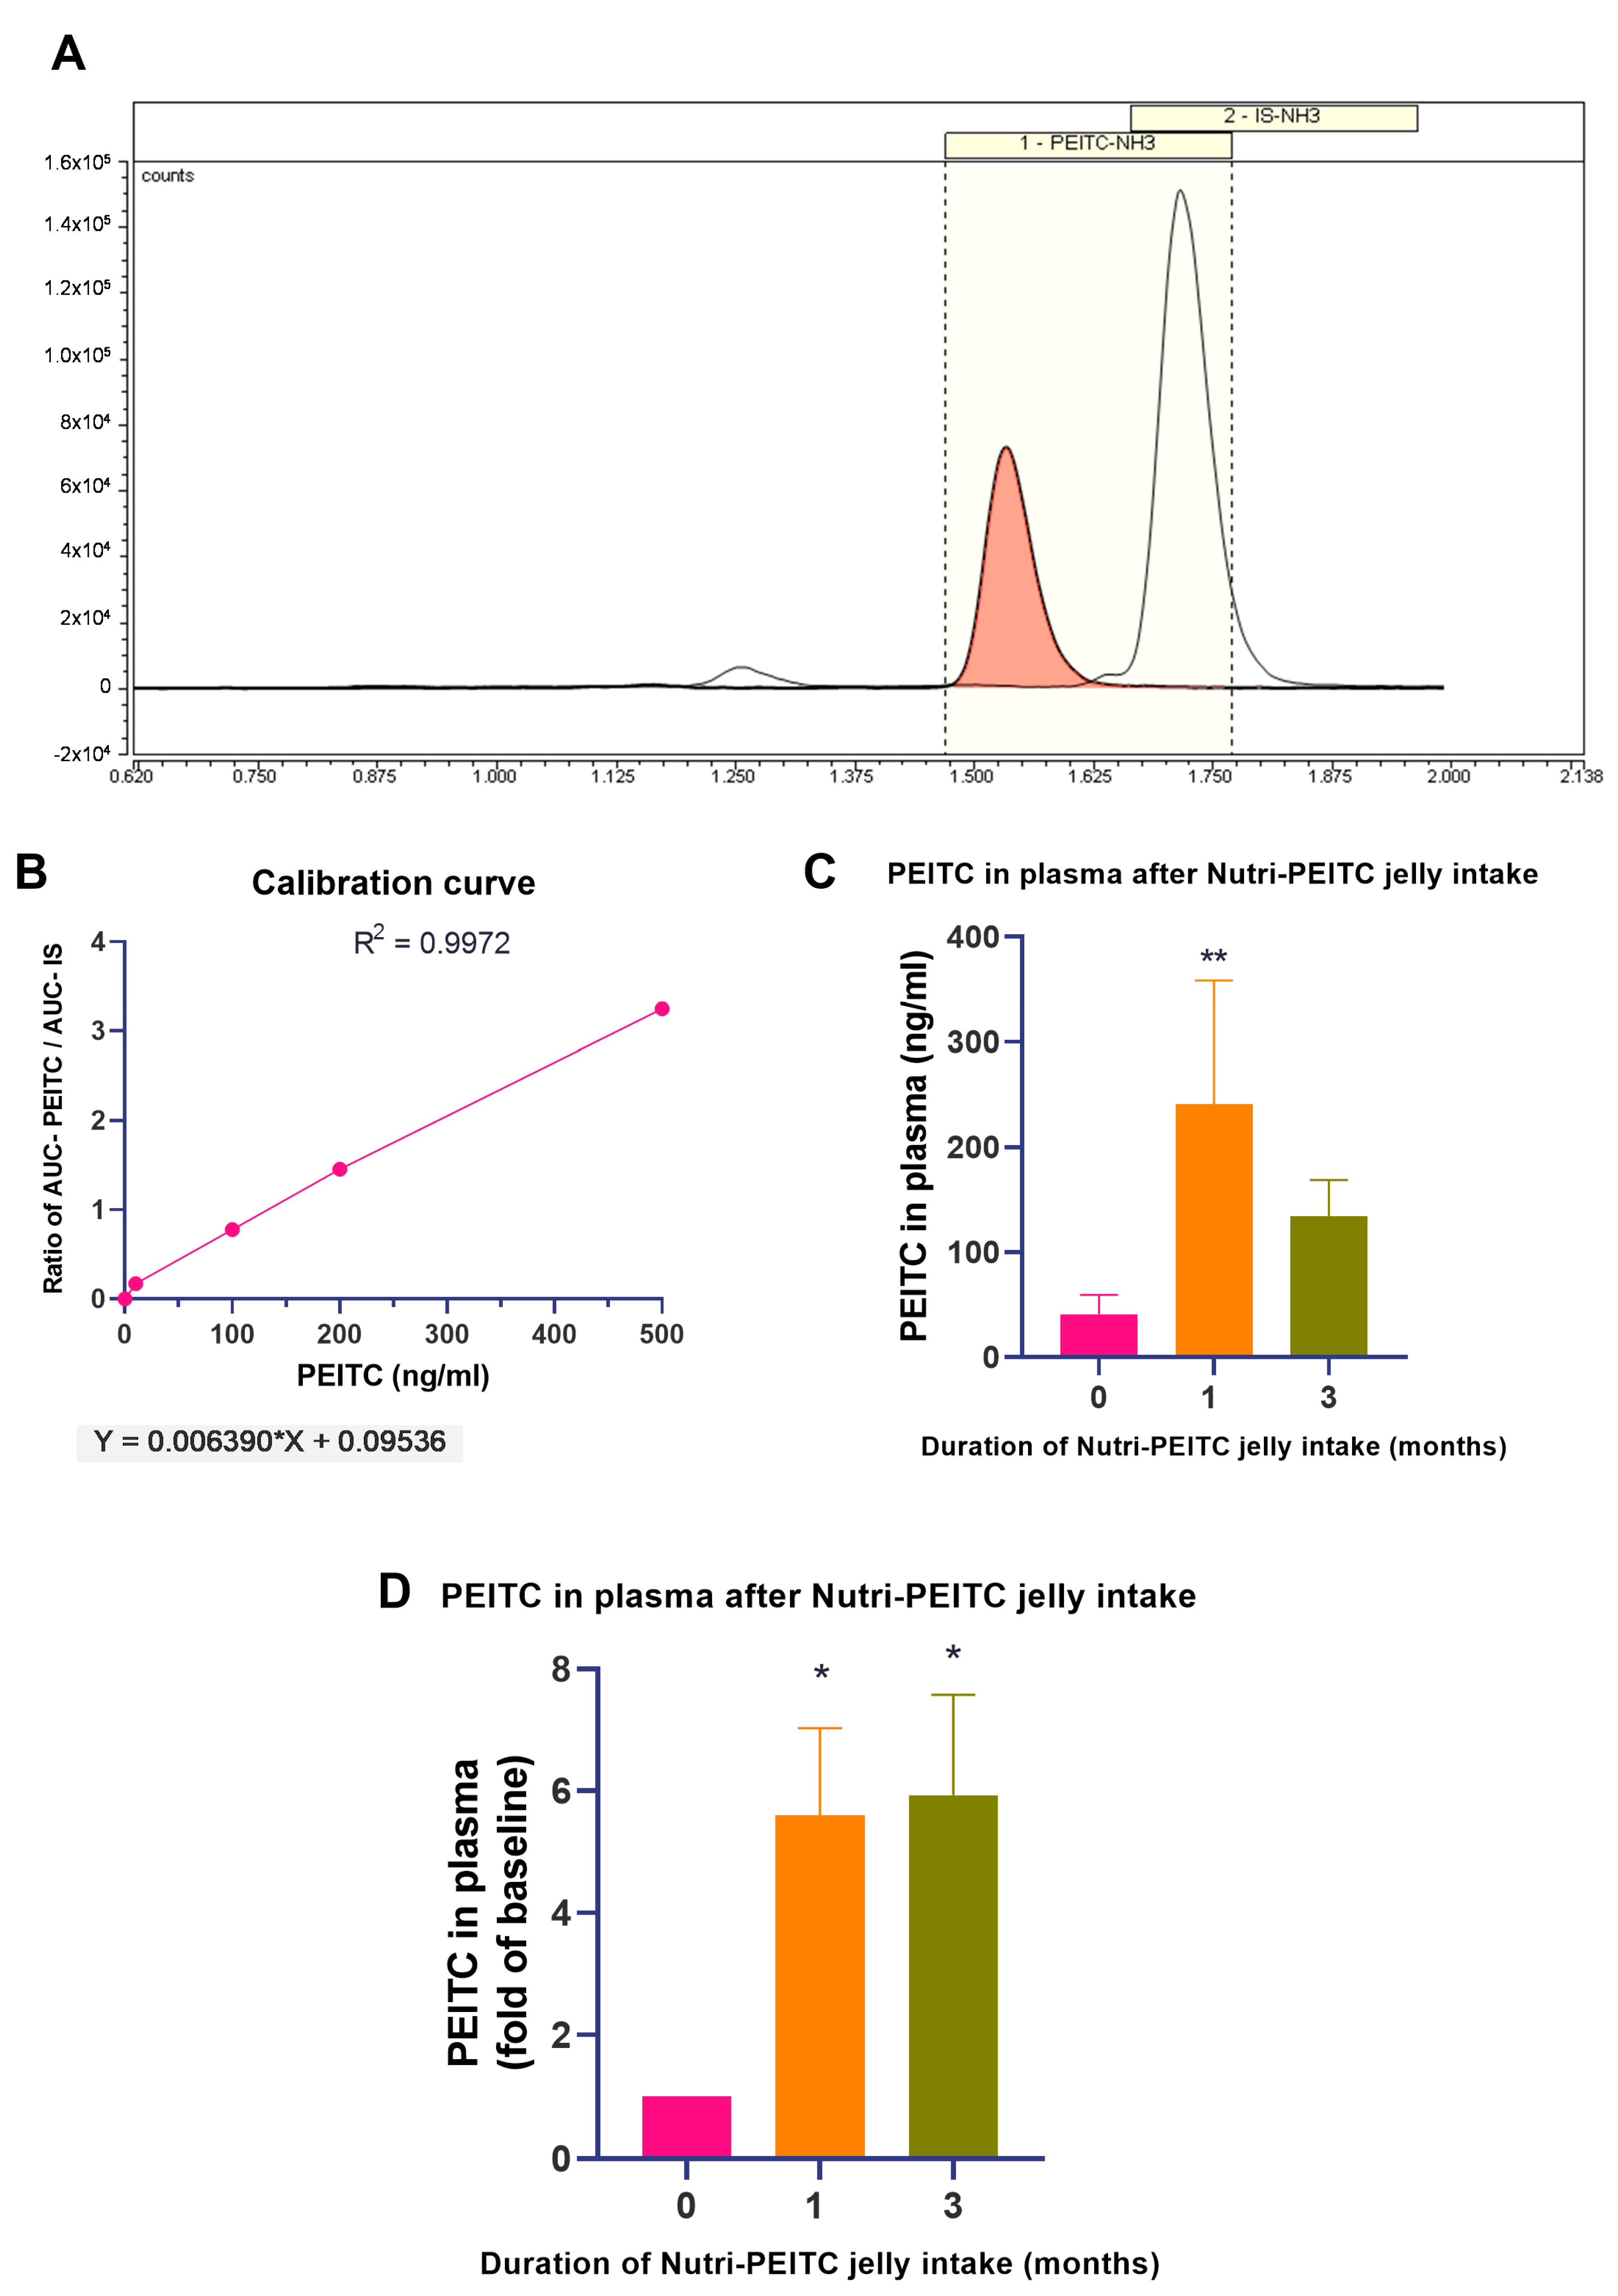
2.4. Monitoring Plasma PEITC Levels
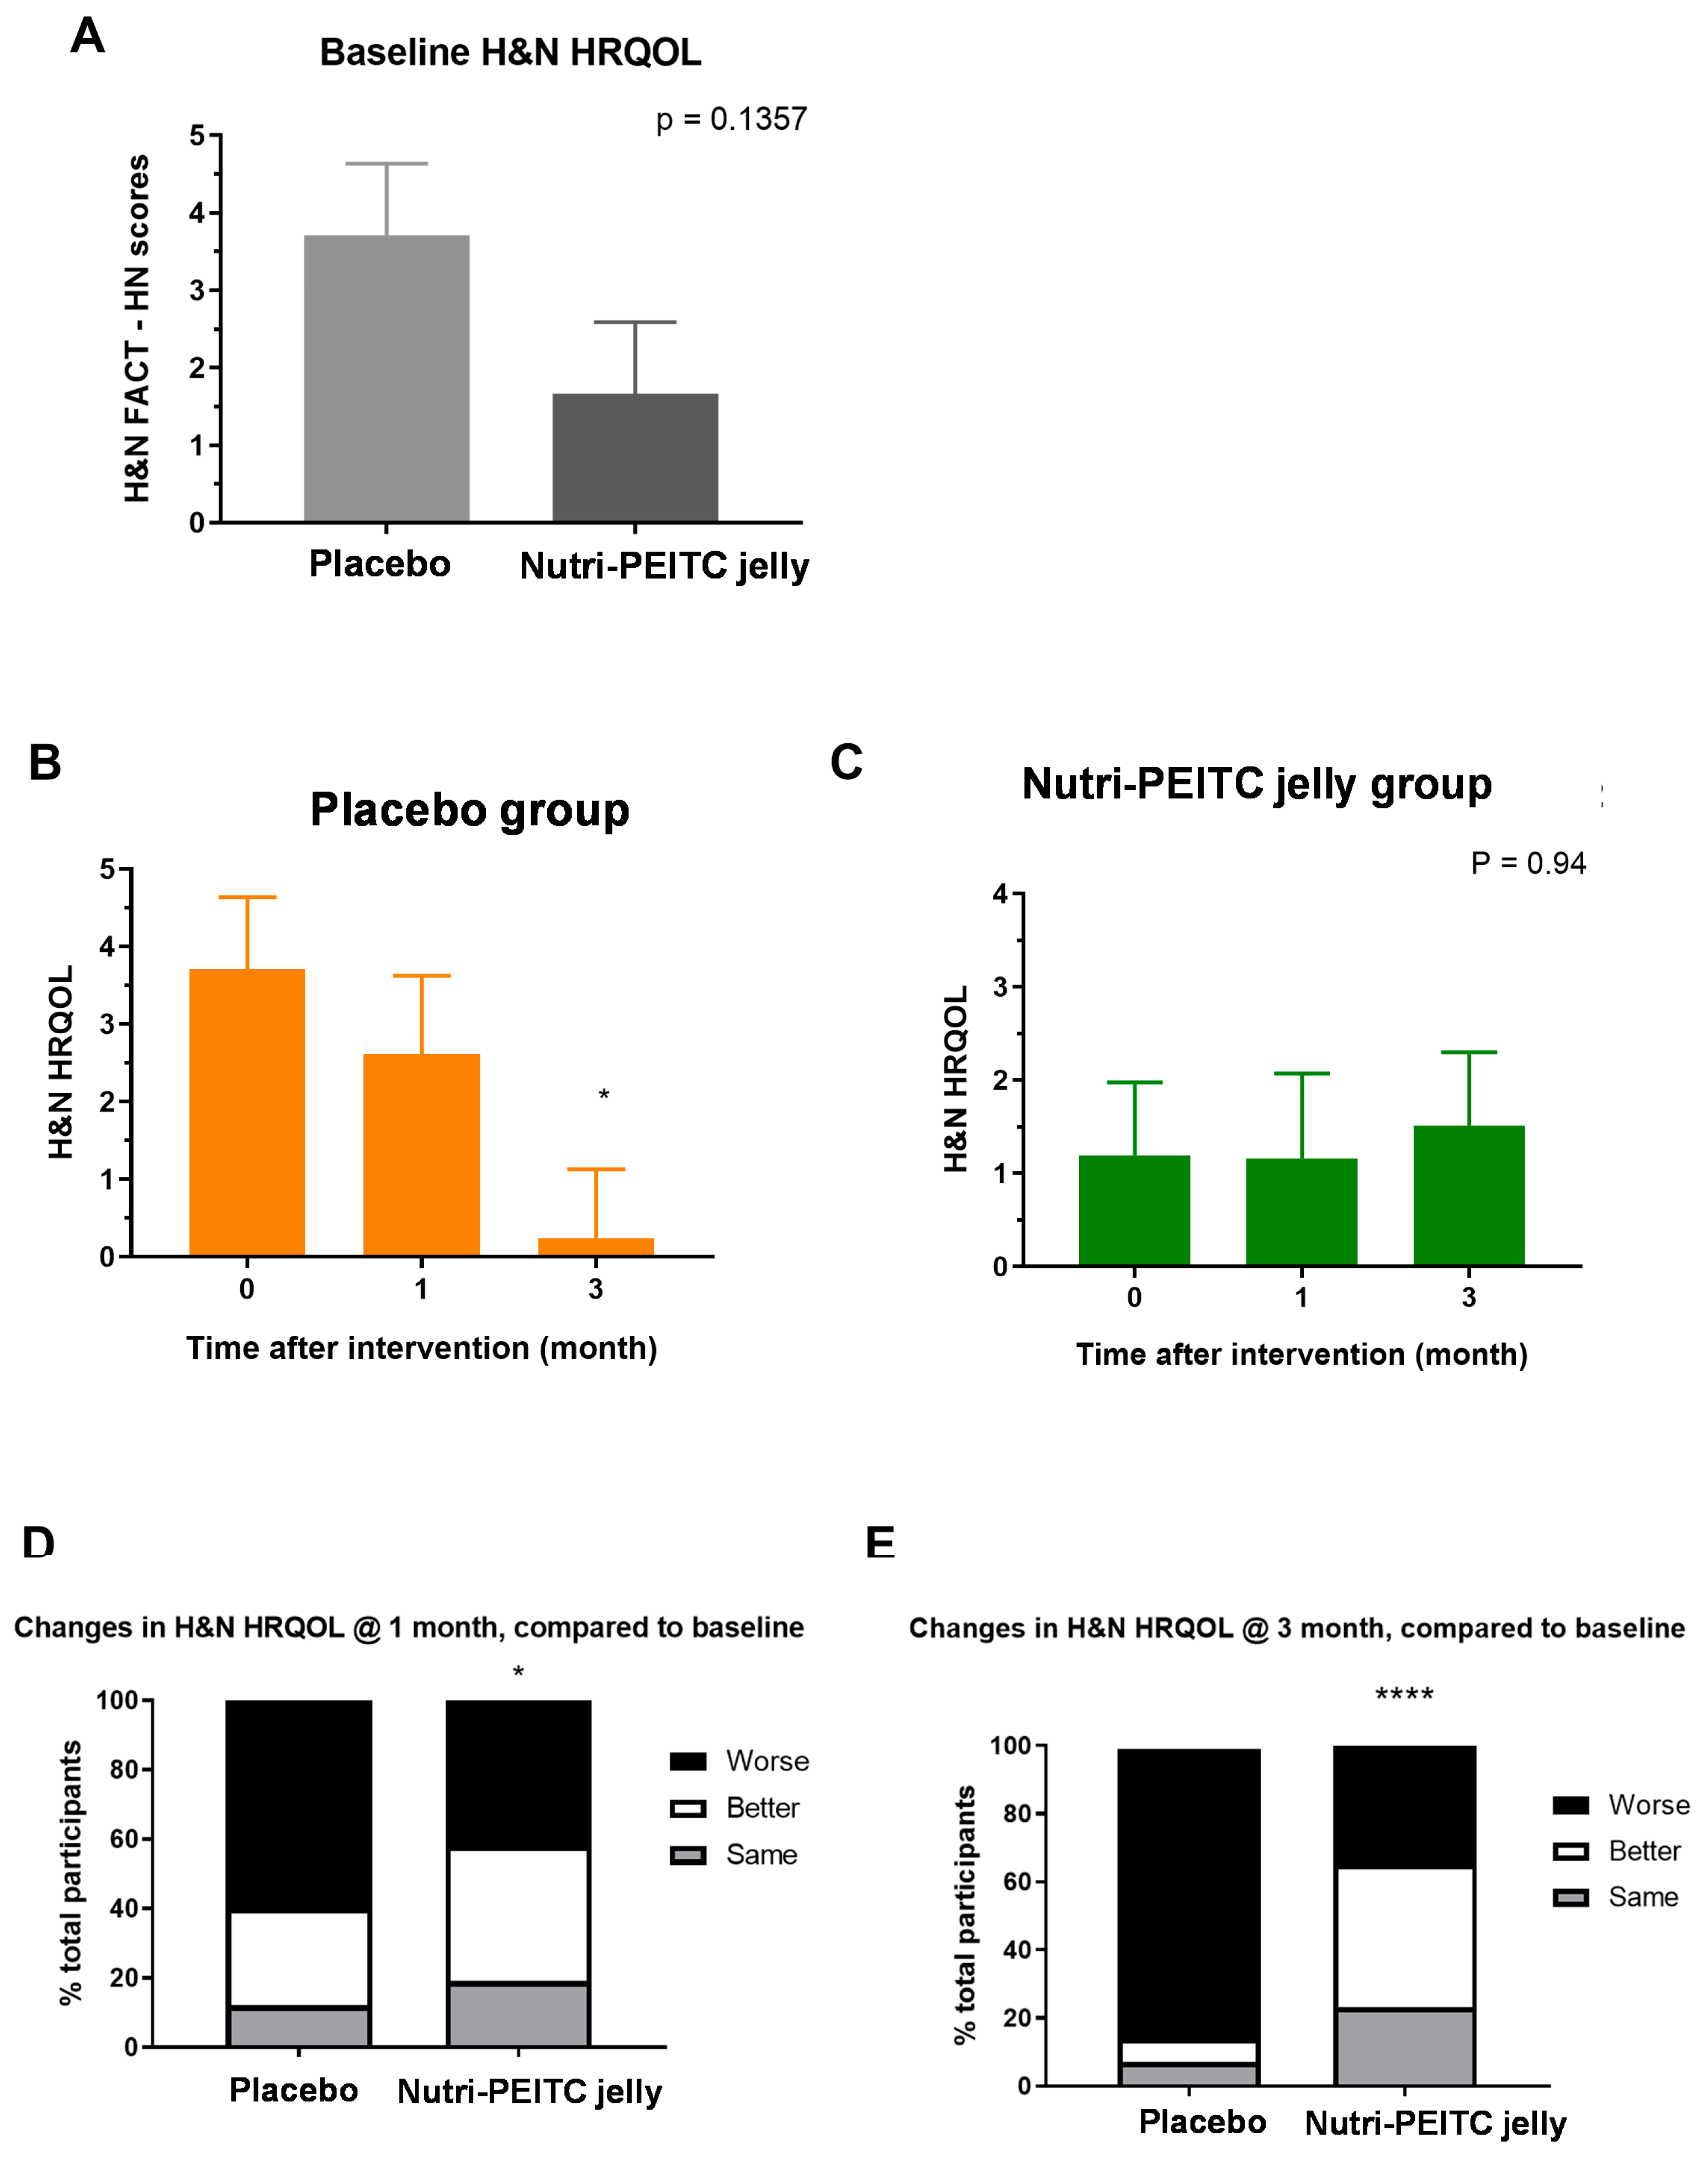
2.5. Effects of Nutri-PEITC Jelly on Health-Related Quality of Life (HRQoL)
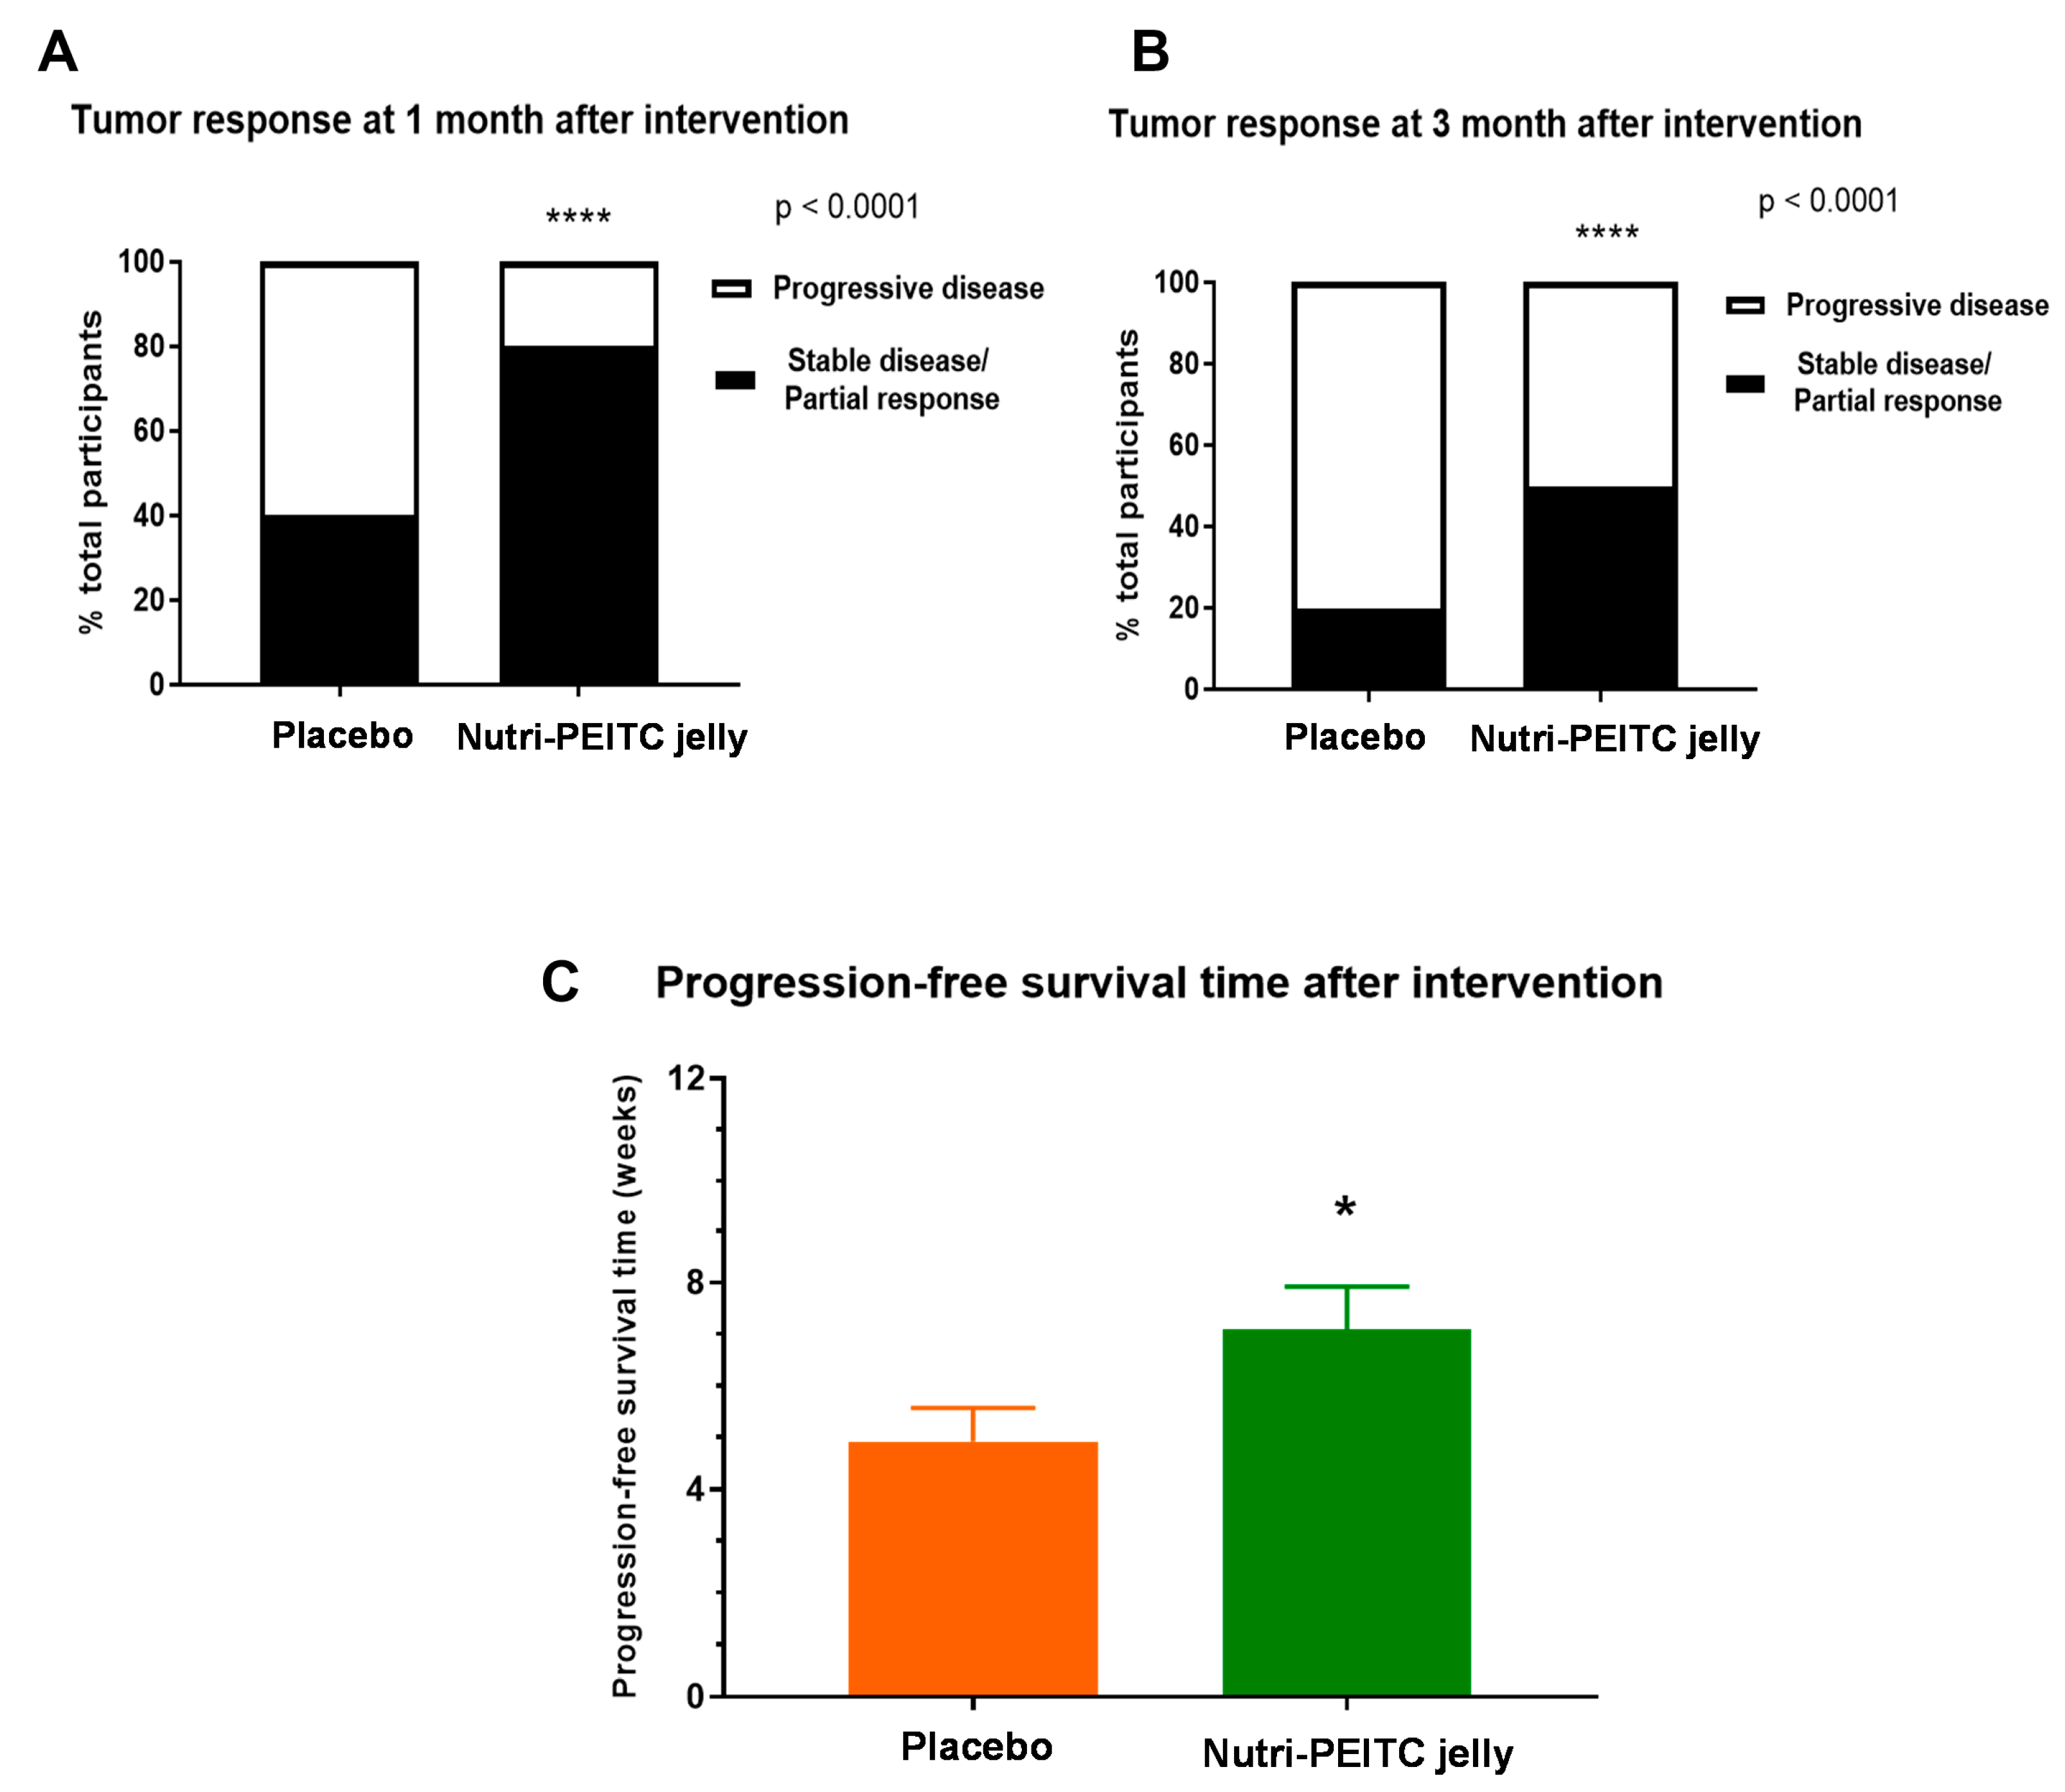
2.6. Effects of Nutri-PEITC Jelly on Tumor Response and Progression-Free Survival Time
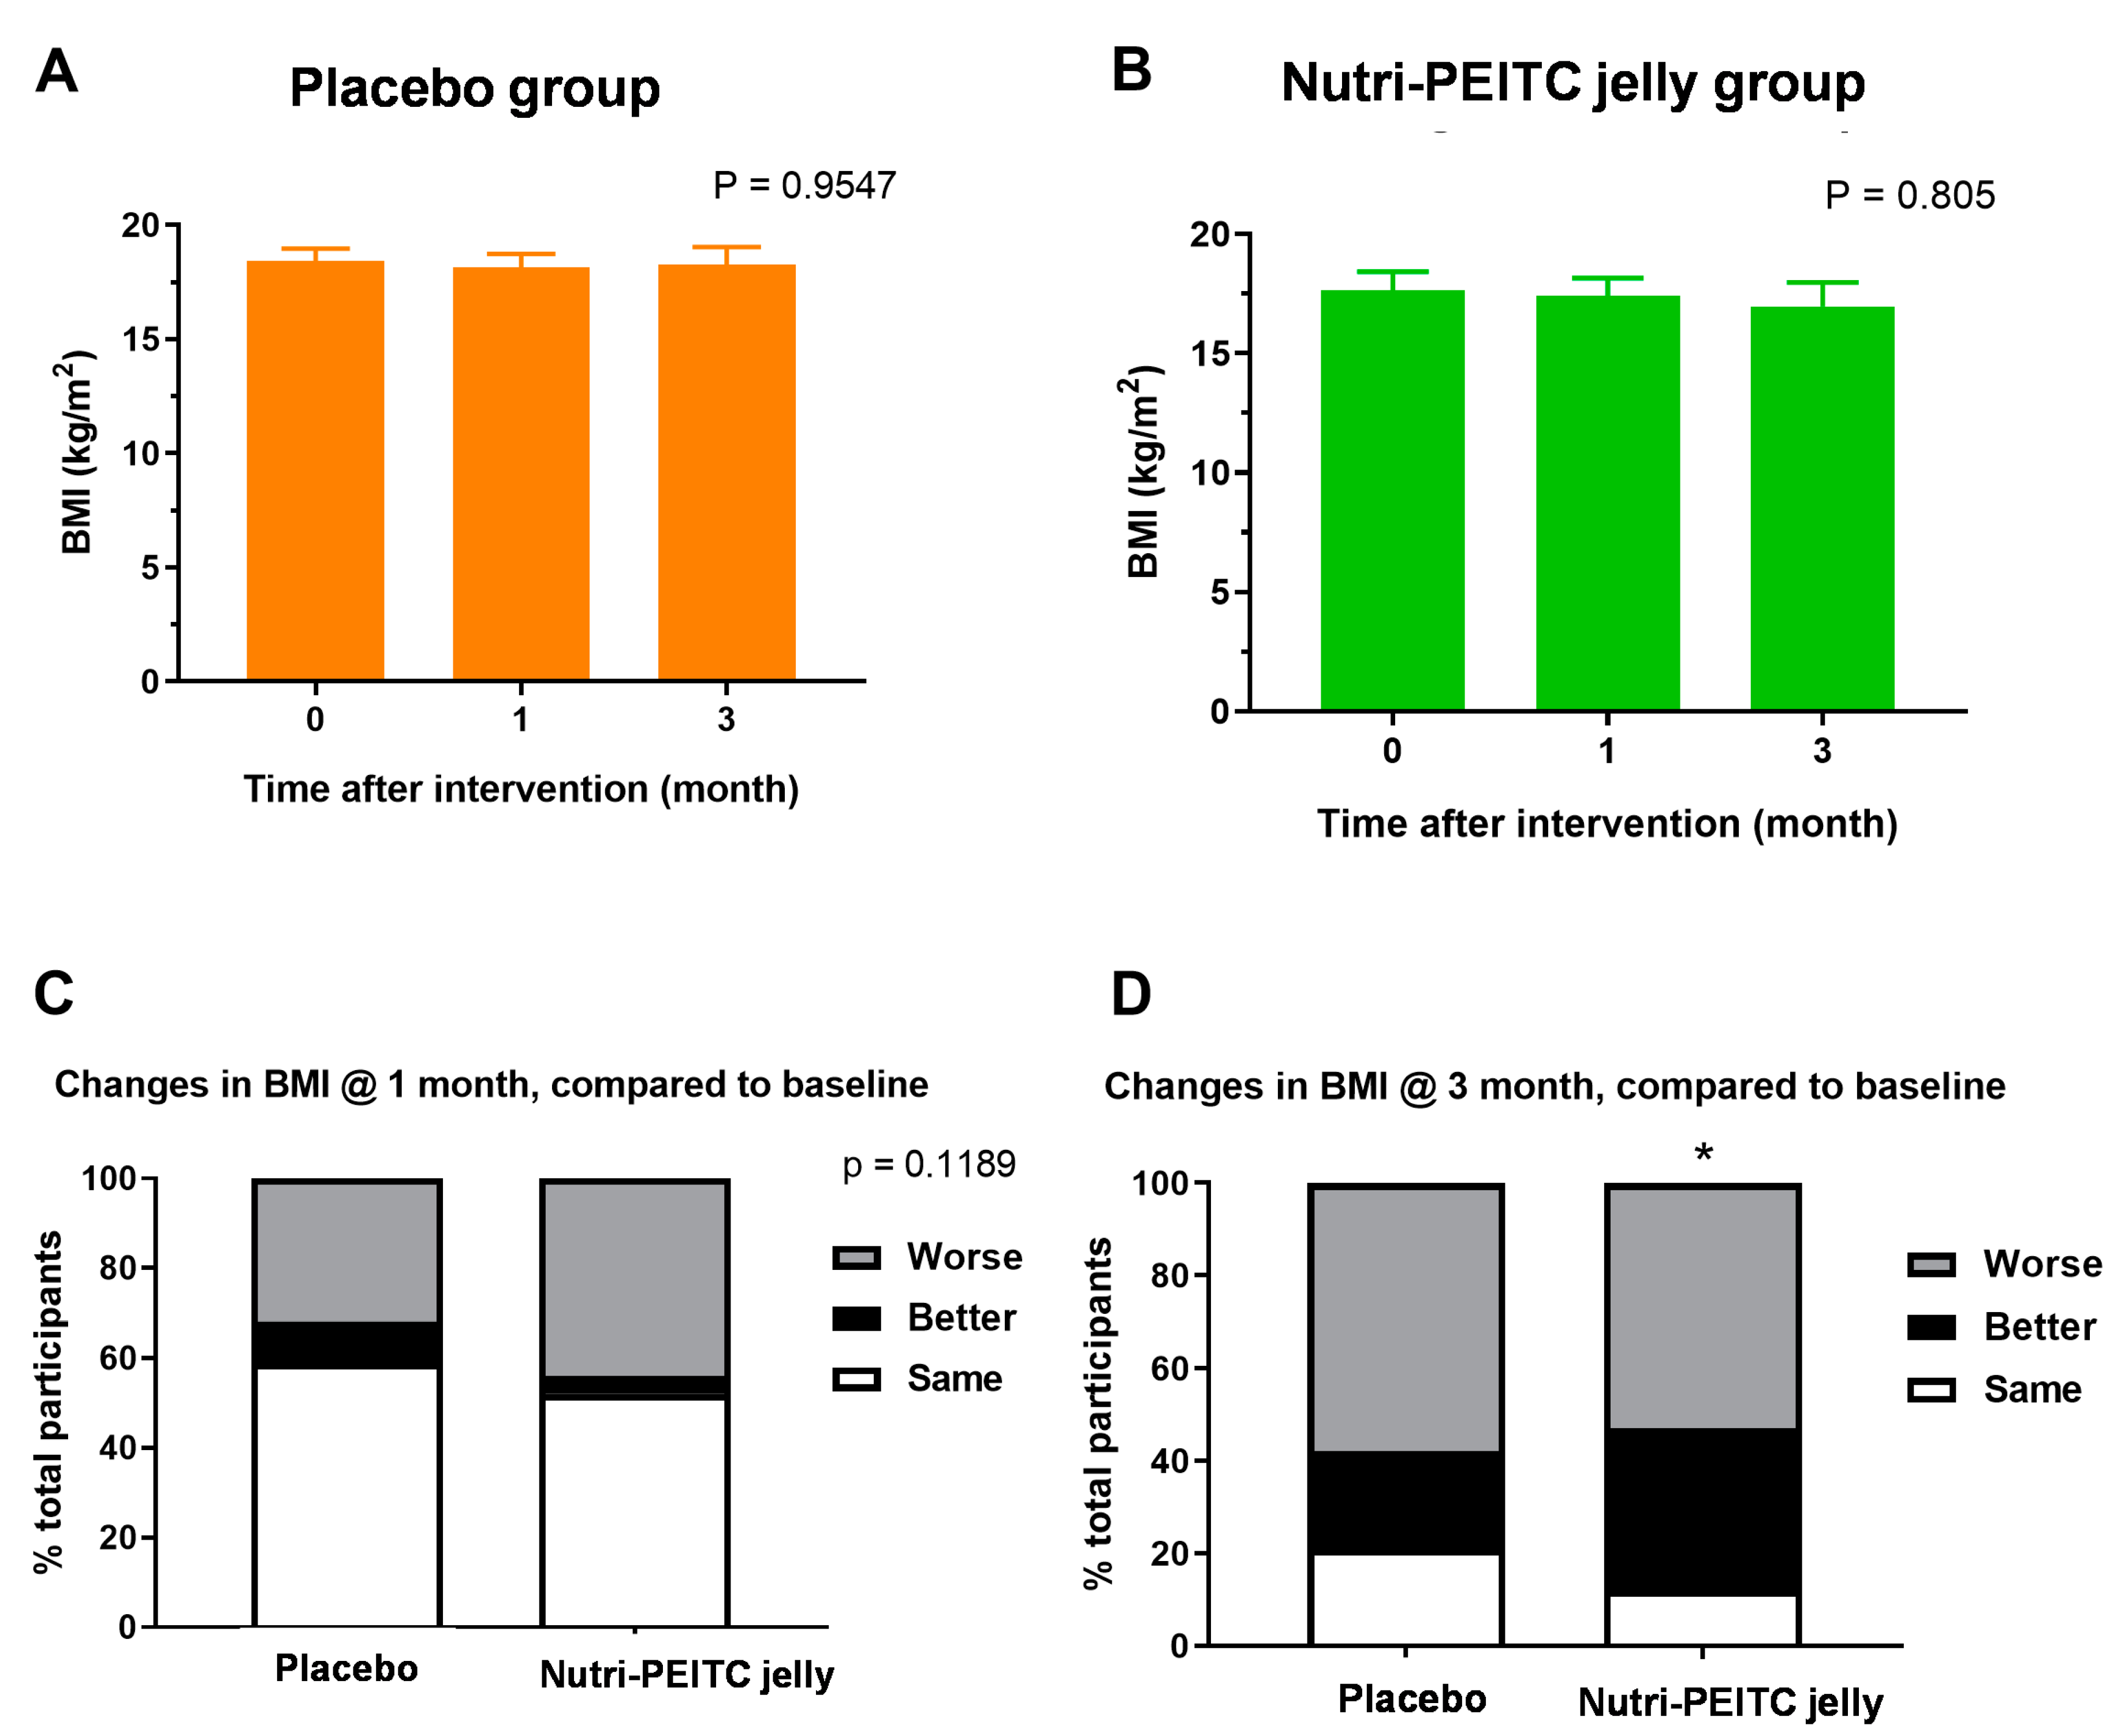
2.7. Effects of Nutri-PEITC Jelly on Body Mass Index
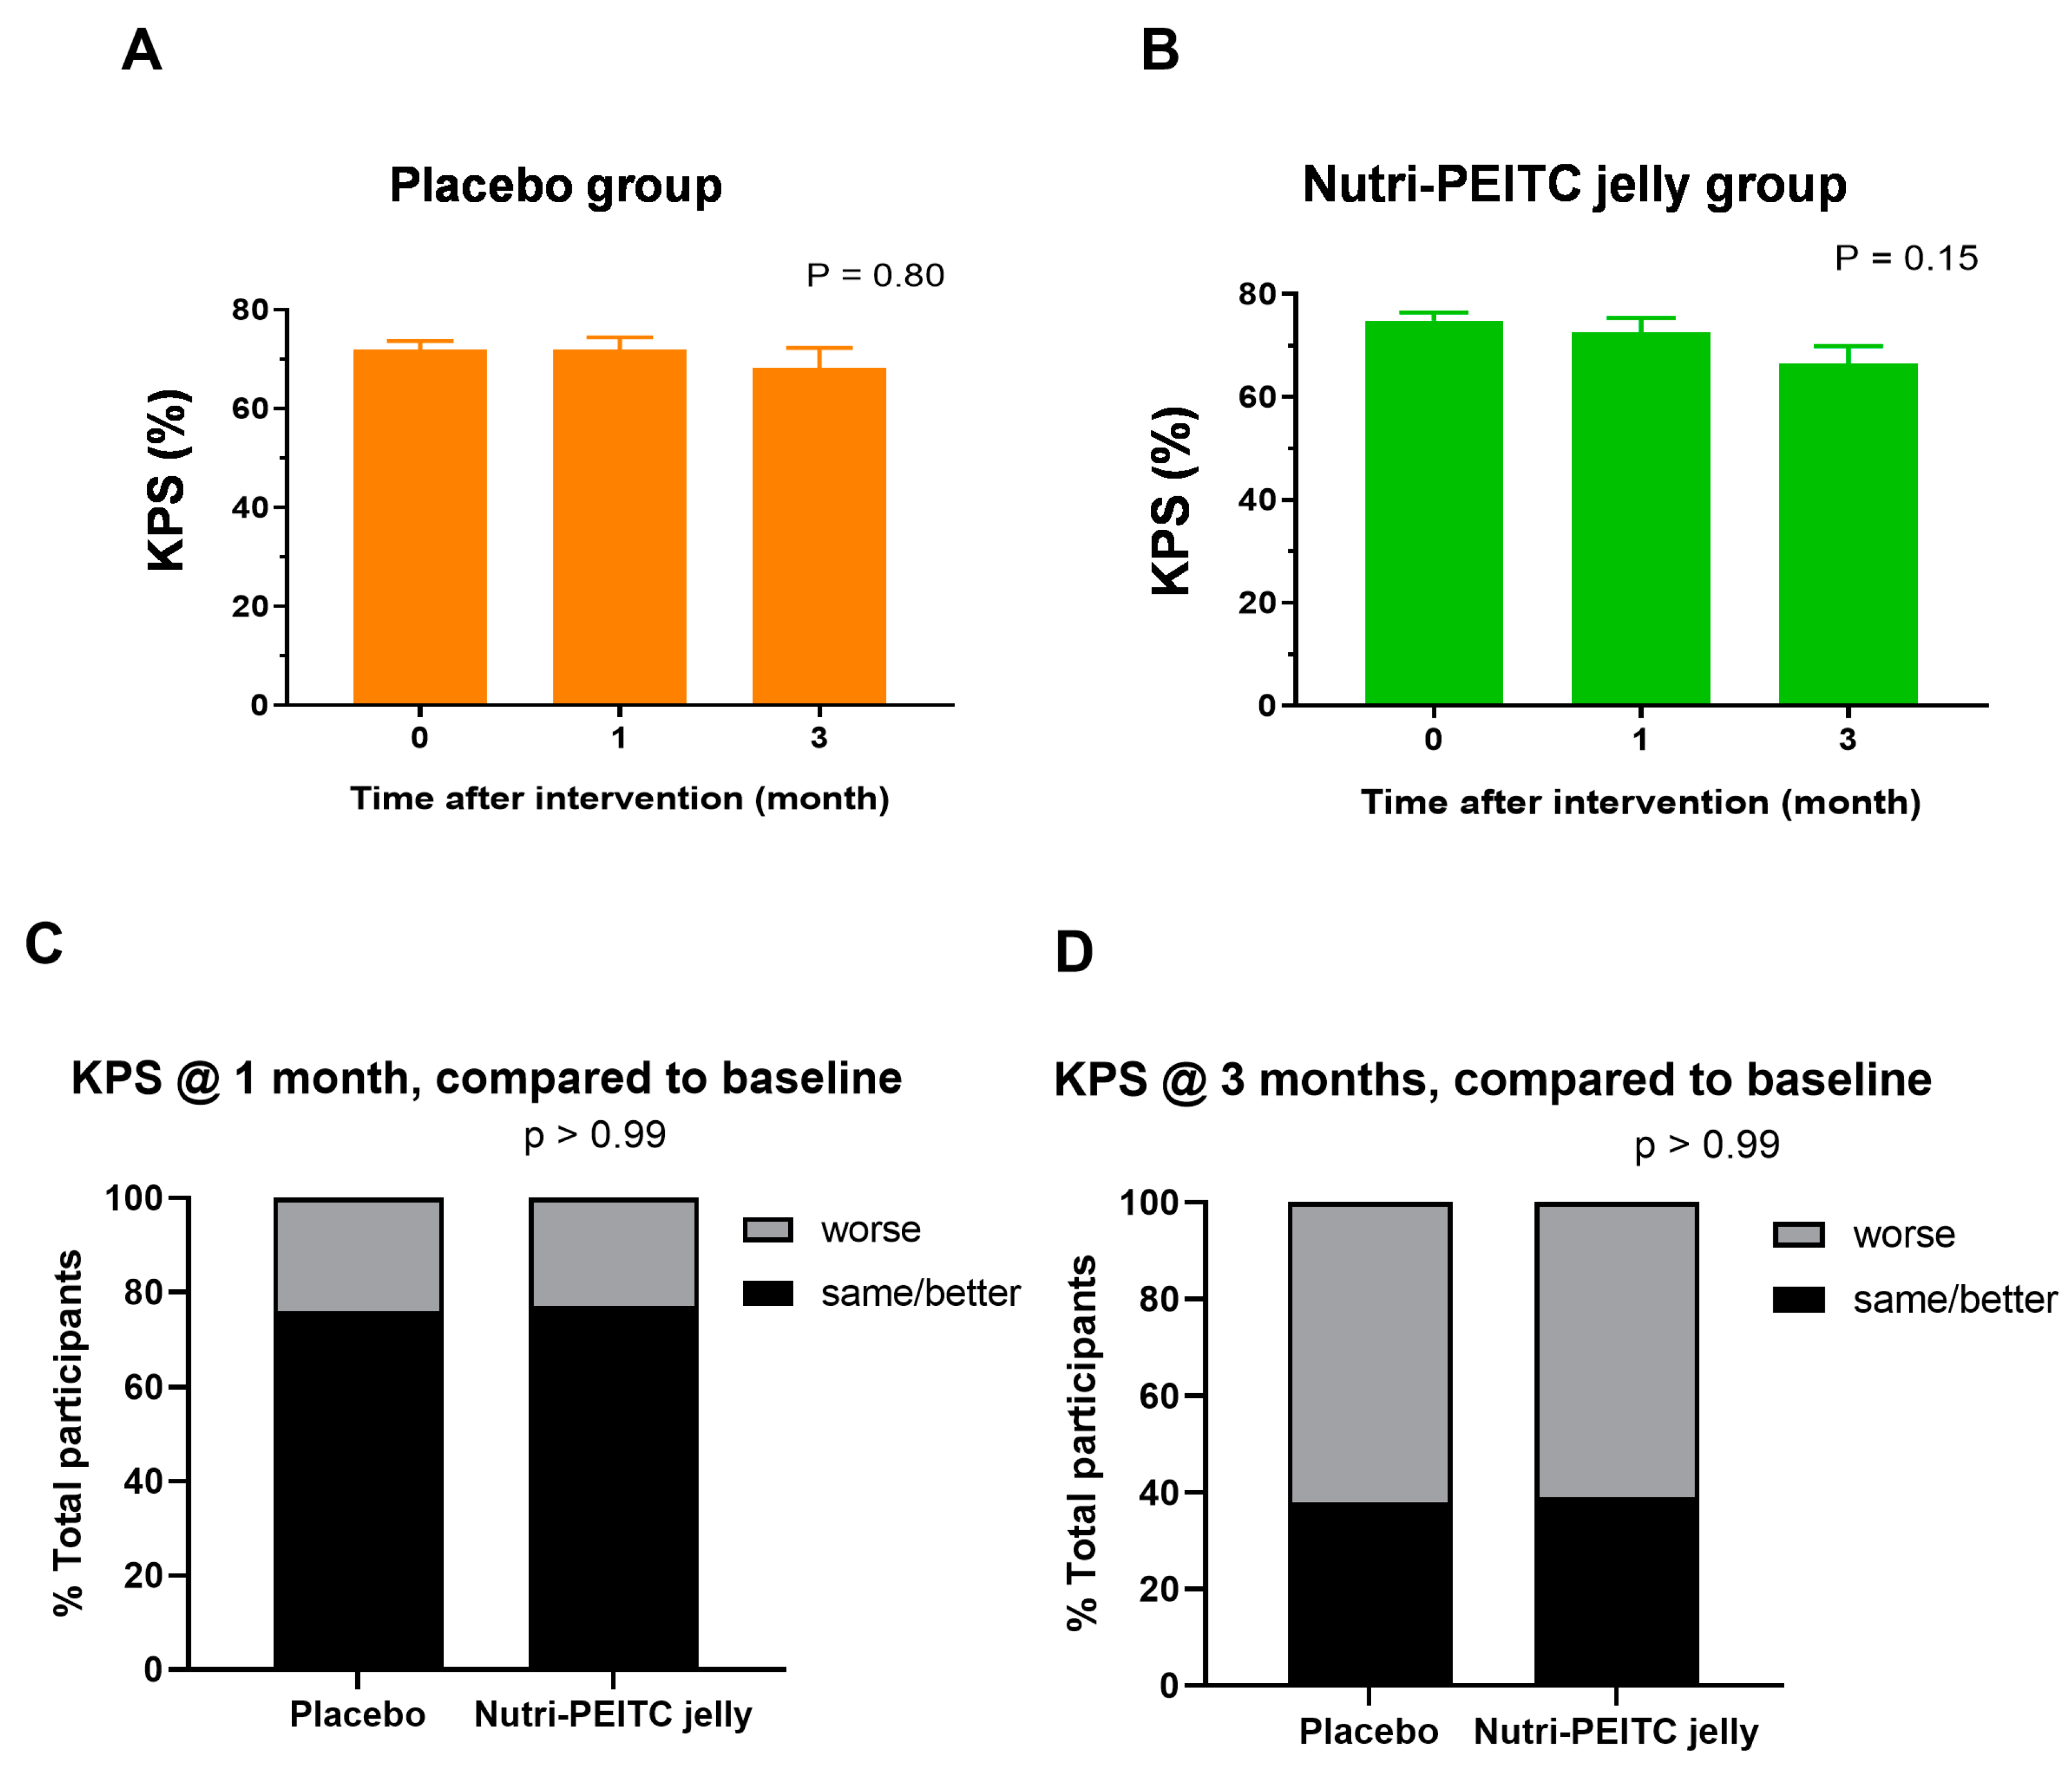
2.8. Effects of Nutri-PEITC Jelly on Karnofsky Performance Status Scale (KPS)
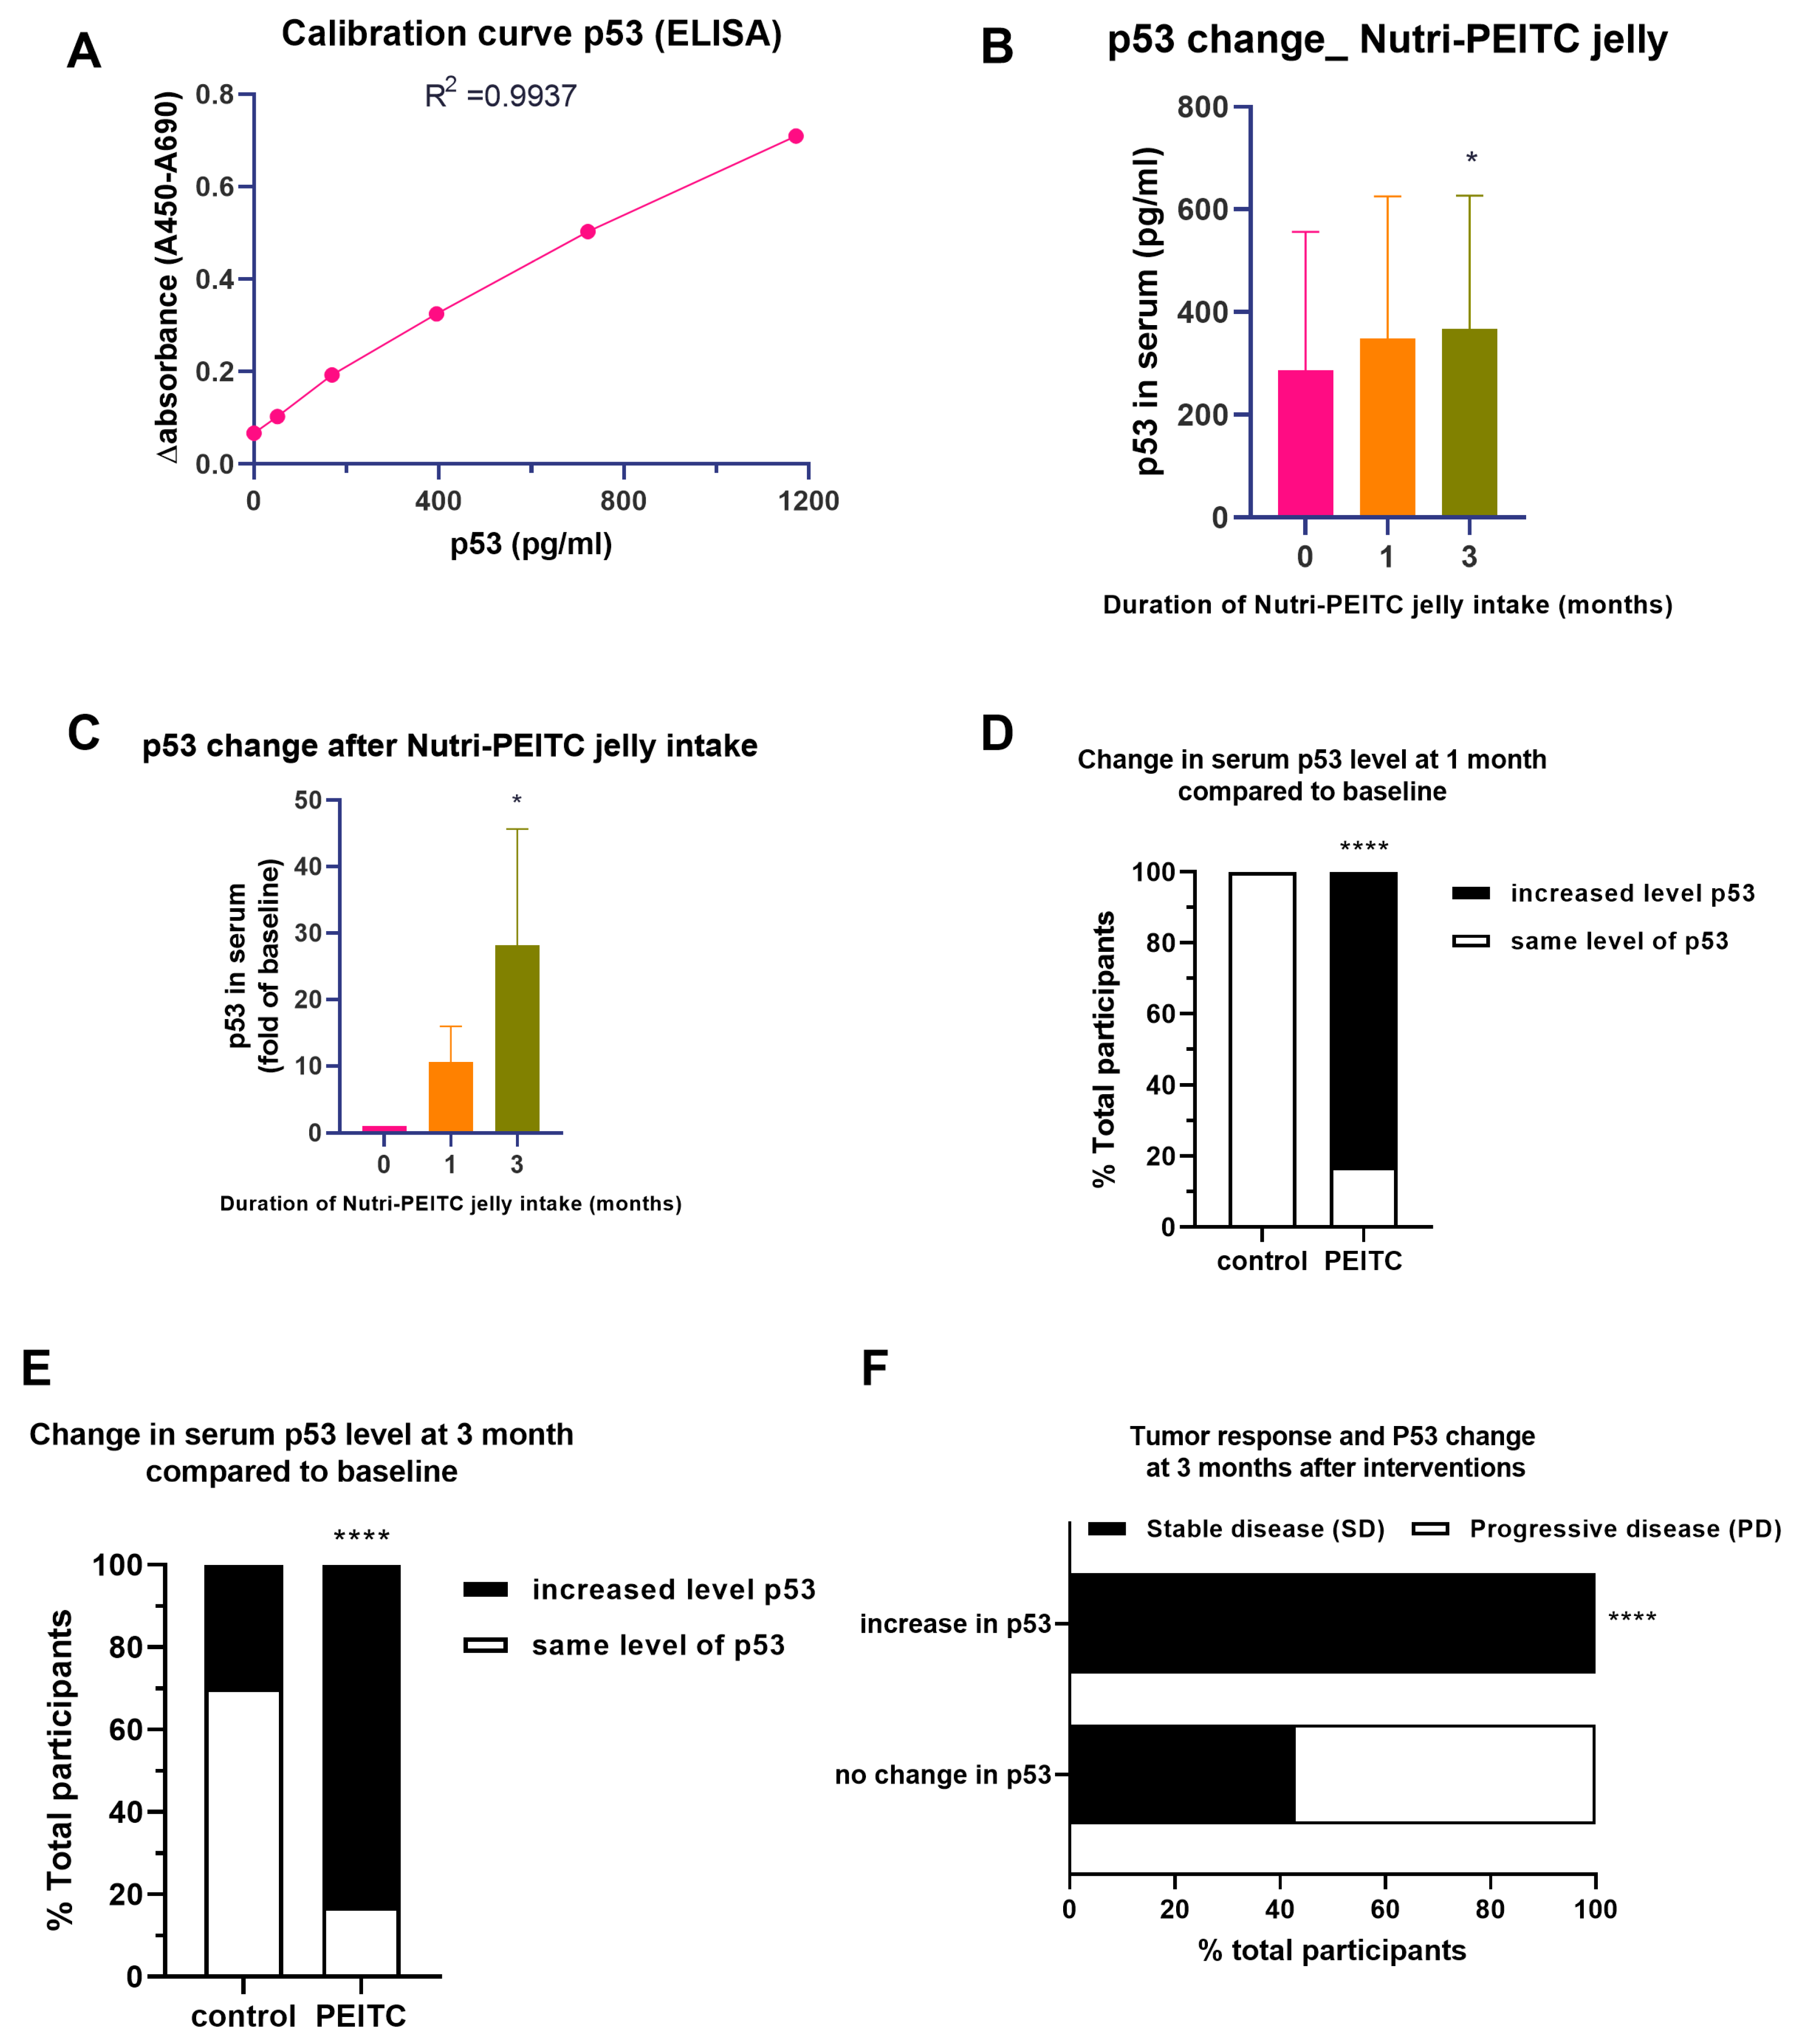
2.9. Effects of Nutri-PEITC Jelly on Serum p53 Levels and Disease Progression
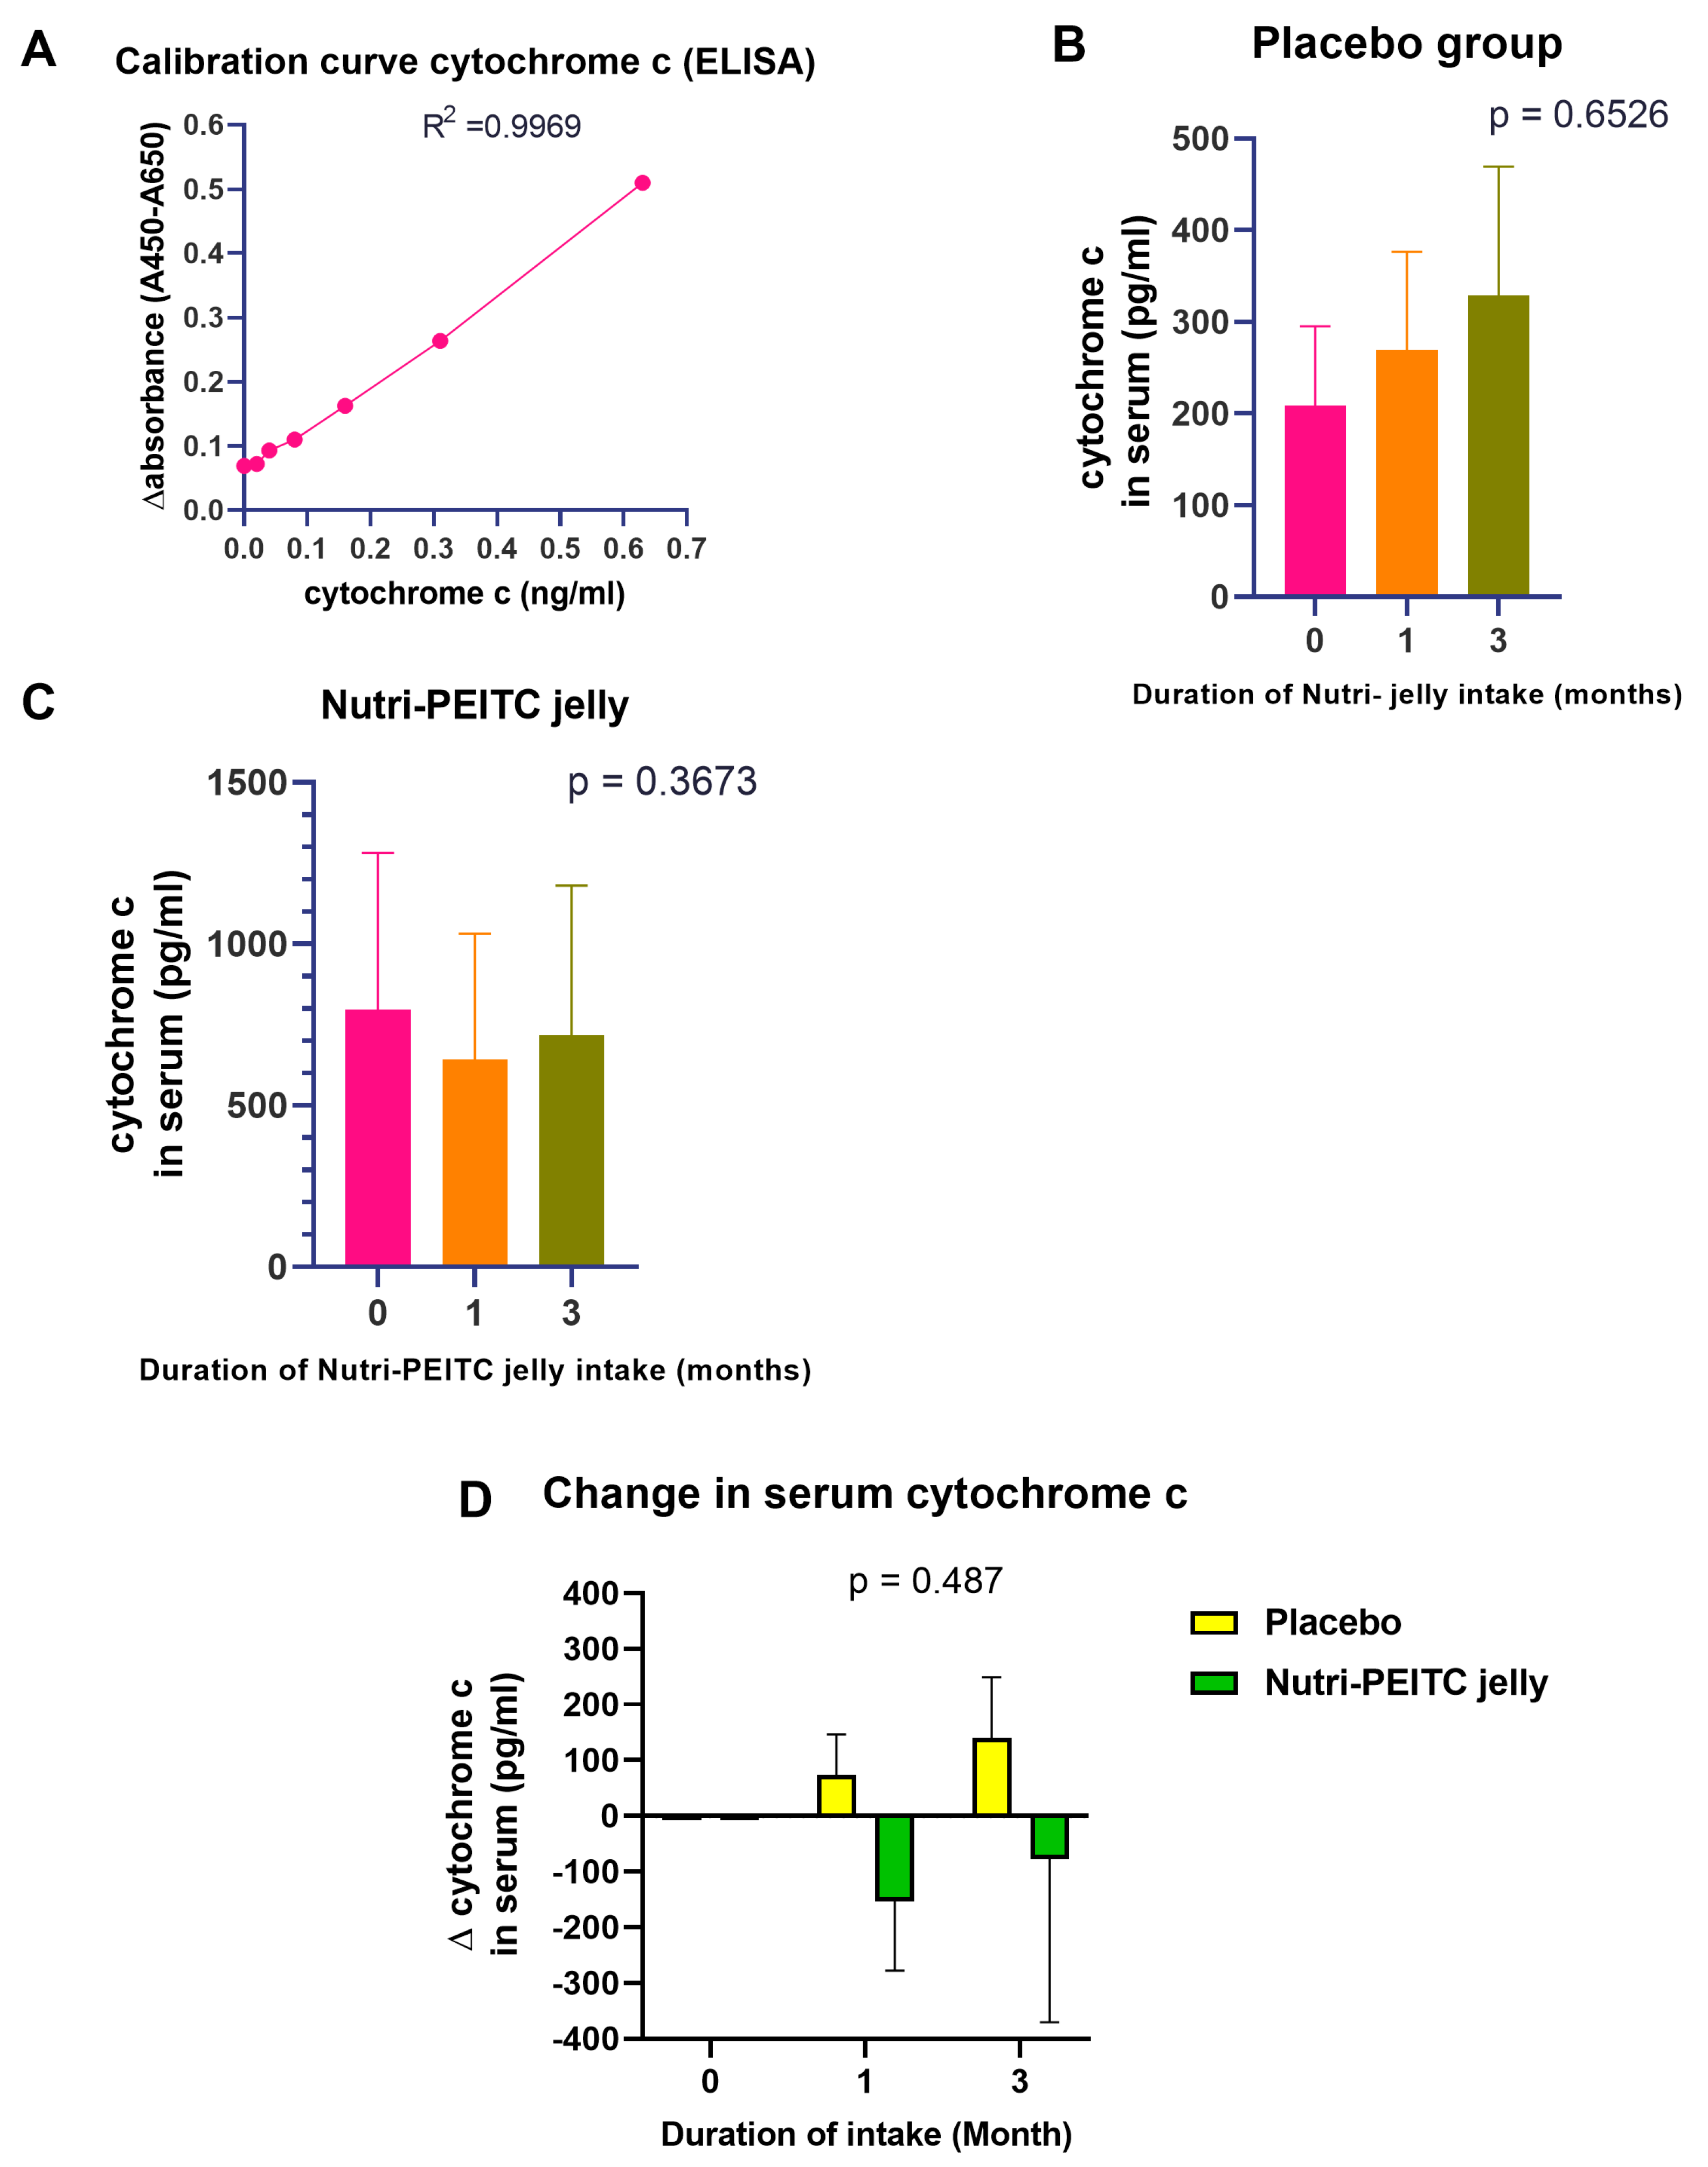
2.10. Effects of Nutri-PEITC Jelly on Serum Cytochrome c Levels
3. Discussion
4. Materials and Methods
4.1. Ethical Aspects and Setting
4.2. Study Design, Blinding, Random Allocation, and Concealment
4.3. Participants
4.4. Sample Size
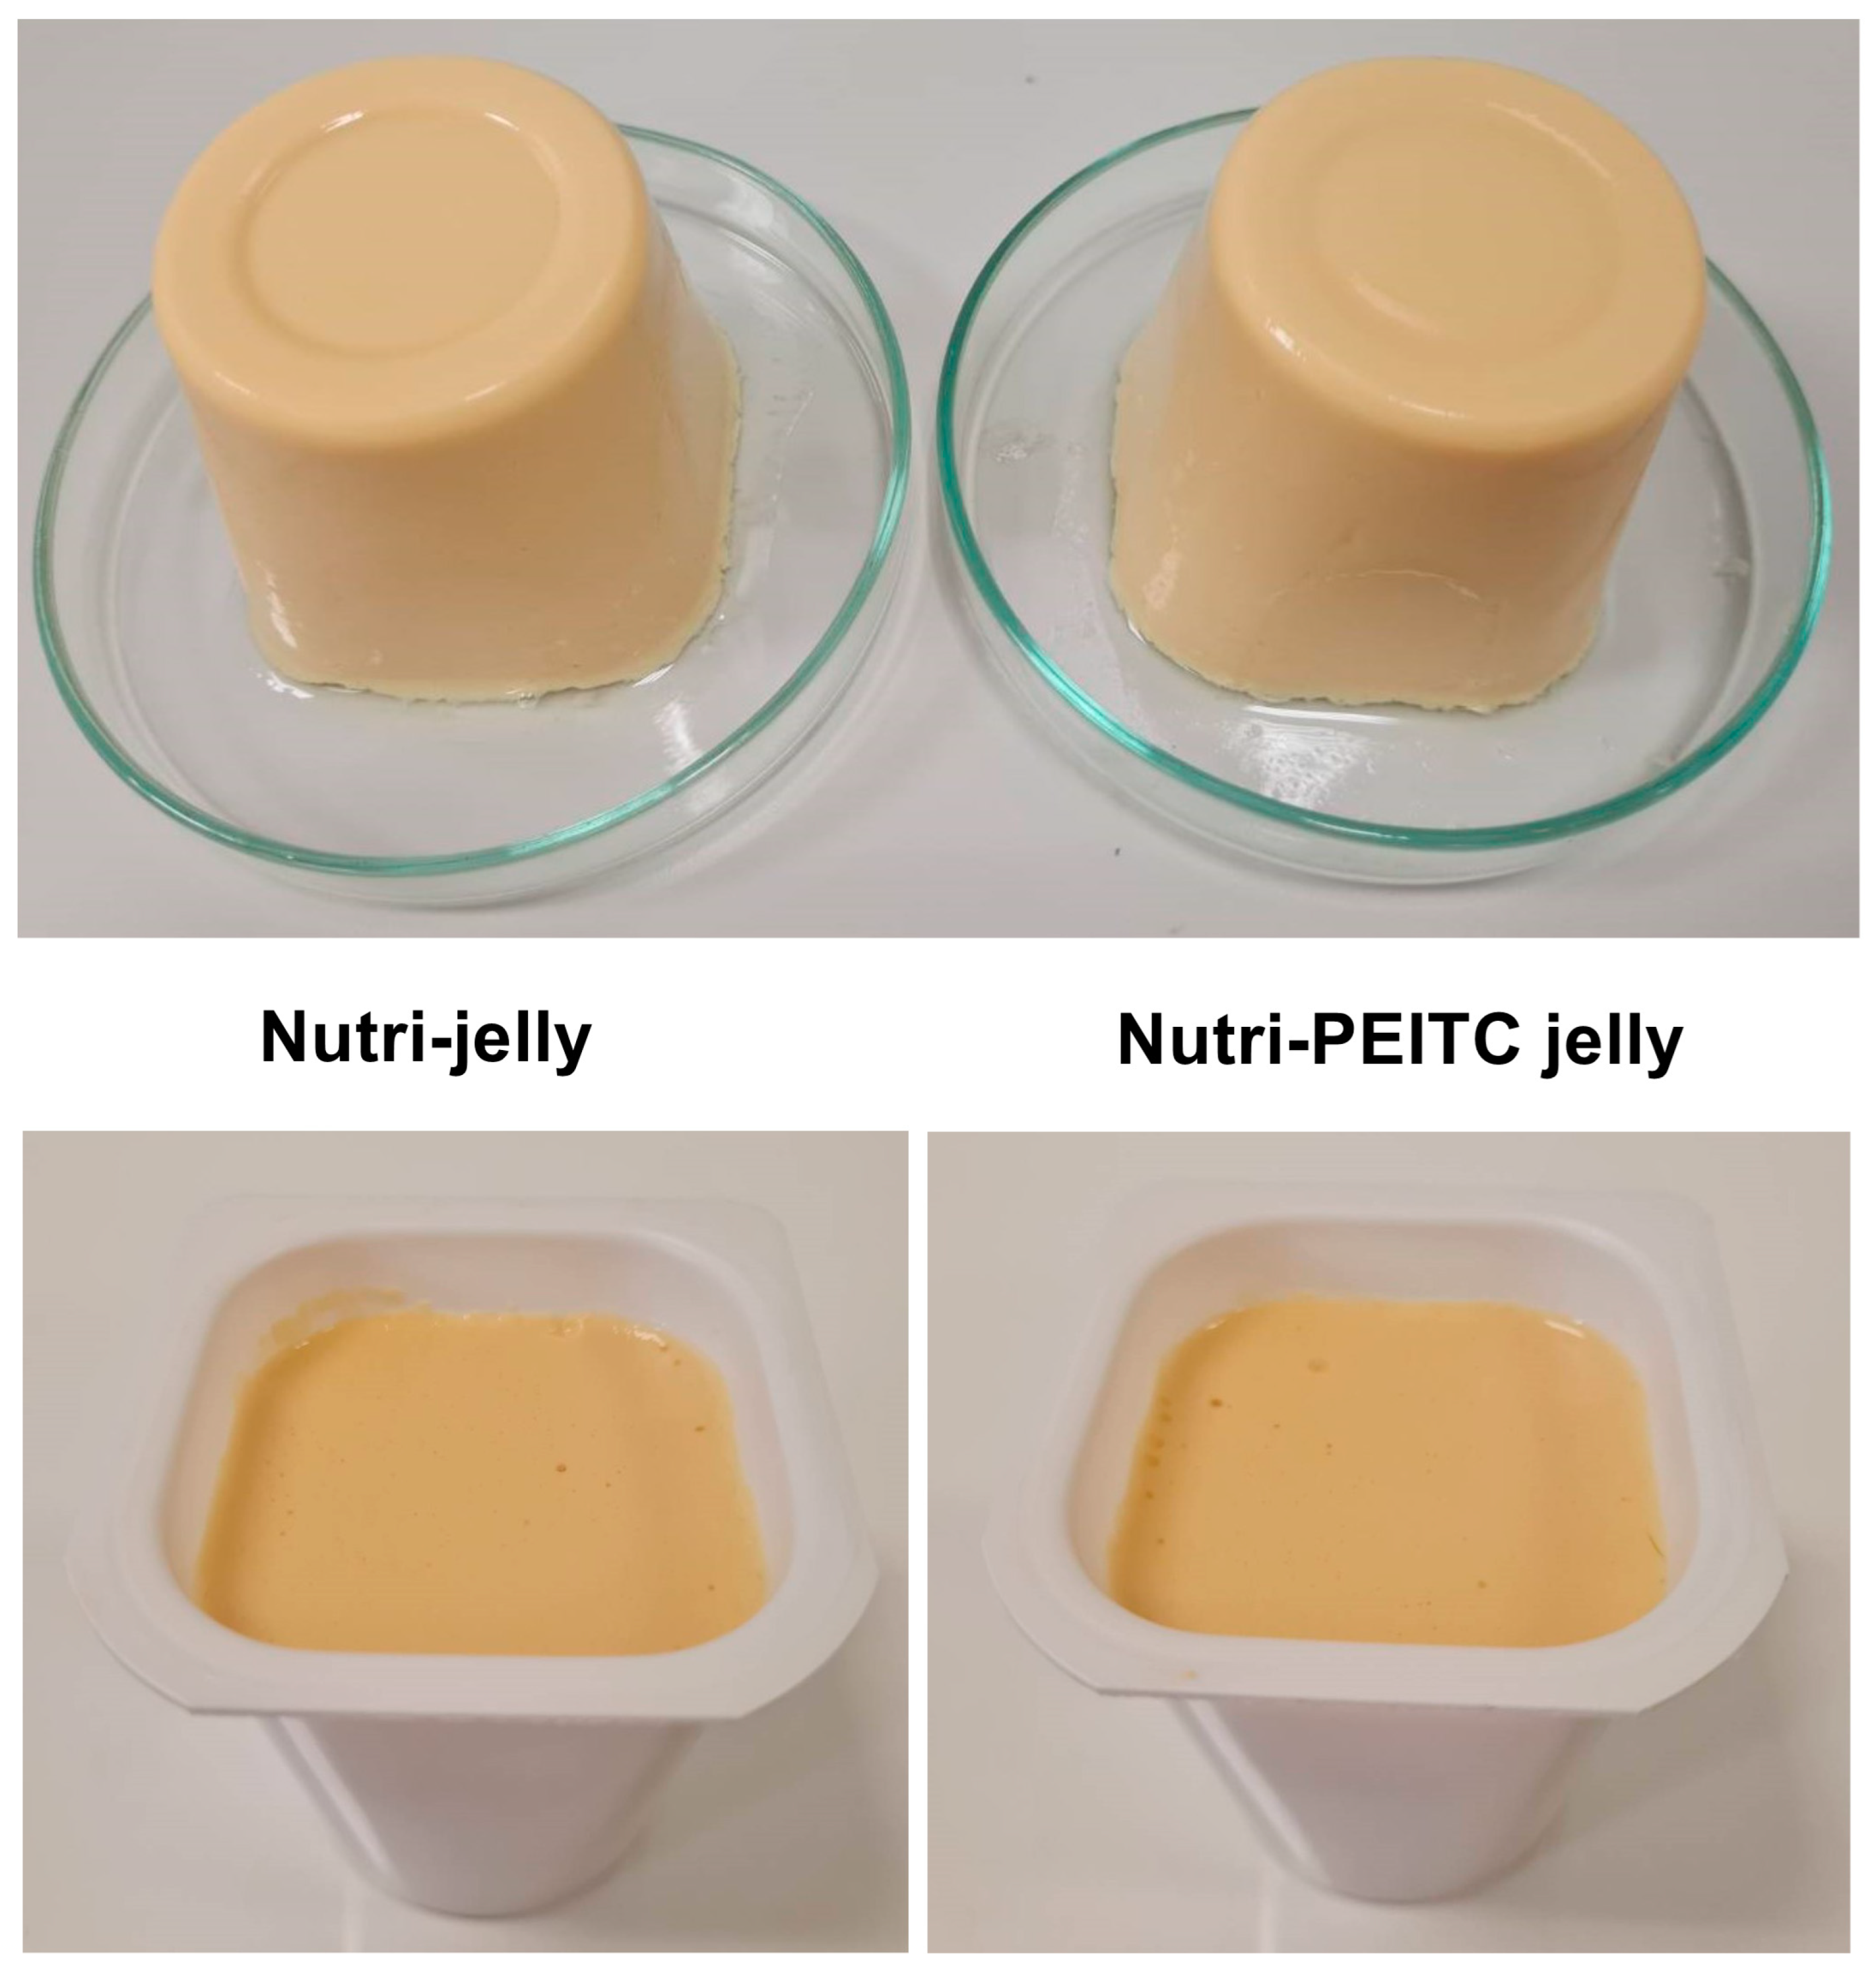
4.5. Interventions
4.6. Study Procedure
4.7. Outcomes
4.7.1. Adverse Events
4.7.2. Health-Related Quality of Life and Karnofsky Performance STATUS Scale
4.7.3. Nutritional Status
4.7.4. Tumor Responses and Progression-Free Survival Time
4.7.5. Serum Levels of p53 and Cytochrome c
4.7.6. Plasma Level of PEITC
4.8. Statistical Analysis
5. Conclusions
Author Contributions
Funding
Institutional Review Board Statement
Informed Consent Statement
Data Availability Statement
Acknowledgments
Conflicts of Interest
References
- Zhu, G.; Pan, C.; Bei, J.X.; Li, B.; Liang, C.; Xu, Y.; Fu, X. Mutant p53 in Cancer Progression and Targeted Therapies. Front. Oncol. 2020, 10, 595187. [Google Scholar] [CrossRef] [PubMed]
- Mantovani, F.; Collavin, L.; Del Sal, G. Mutant p53 as a guardian of the cancer cell. Cell Death Differ. 2019, 26, 199–212. [Google Scholar] [CrossRef]
- Zhang, C.; Liu, J.; Xu, D.; Zhang, T.; Hu, W.; Feng, Z. Gain-of-function mutant p53 in cancer progression and therapy. J. Mol. Cell Biol. 2020, 12, 674–687. [Google Scholar] [CrossRef] [PubMed]
- Athar, M.; Elmets, C.A.; Kopelovich, L. Pharmacological activation of p53 in cancer cells. Curr. Pharm. Des. 2011, 17, 631–639. [Google Scholar] [CrossRef]
- Selivanova, G.; Wiman, K.G. Reactivation of mutant p53: Molecular mechanisms and therapeutic potential. Oncogene 2007, 26, 2243–2254. [Google Scholar] [CrossRef]
- Wang, X.; Di Pasqua, A.J.; Govind, S.; McCracken, E.; Hong, C.; Mi, L.; Mao, Y.; Wu, J.Y.C.; Tomita, Y.; Woodrick, J.C.; et al. Selective depletion of mutant p53 by cancer chemopreventive isothiocyanates and their structure-activity relationships. J. Med. Chem. 2011, 54, 809–816. [Google Scholar] [CrossRef] [PubMed]
- Aggarwal, M.; Saxena, R.; Sinclair, E.; Fu, Y.; Jacobs, A.; Dyba, M.; Wang, X.; Cruz, I.; Berry, D.; Kallakury, B.; et al. Reactivation of mutant p53 by a dietary-related compound phenethyl isothiocyanate inhibits tumor growth. Cell Death Differ. 2016, 23, 1615–1627. [Google Scholar] [CrossRef]
- Yeh, Y.T.; Yeh, H.; Su, S.H.; Lin, J.S.; Lee, K.J.; Shyu, H.W.; Chen, Z.F.; Huang, S.Y.; Su, S.J. Phenethyl isothiocyanate induces DNA damage-associated G2/M arrest and subsequent apoptosis in oral cancer cells with varying p53 mutations. Free Radic. Biol. Med. 2014, 74, 1–13. [Google Scholar] [CrossRef]
- Lam-Ubol, A.; Fitzgerald, A.L.; Ritdej, A.; Phonyiam, T.; Zhang, H.; Myers, J.N.; Huangh, P.; Trachootham, D. Sensory acceptable equivalent doses of β-phenylethyl isothiocyanate (PEITC) induce cell cycle arrest and retard the growth of p53 mutated oral cancer in vitro and in vivo. Food Funct. 2018, 9, 3640–3656. [Google Scholar] [CrossRef]
- Wu, S.J.; Ng, L.T.; Lin, C.C. Effects of antioxidants and caspase-3 inhibitor on the phenylethyl isothiocyanate-induced apoptotic signaling pathways in human PLC/PRF/5 cells. Eur. J. Pharmacol. 2005, 518, 96–106. [Google Scholar] [CrossRef]
- Aggarwal, M.; Saxena, R.; Asif, N.; Sinclair, E.; Tan, J.; Cruz, I.; Berry, D.; Kallakury, B.; Pham, Q.; Wang, T.T.Y.; et al. p53 mutant-type in human prostate cancer cells determines the sensitivity to phenethyl isothiocyanate induced growth inhibition. J. Exp. Clin. Cancer Res. 2019, 38, 307. [Google Scholar] [CrossRef] [PubMed]
- Liu, J.; Chen, G.; Pelicano, H.; Liao, J.; Huang, J.; Feng, L.; Keating, M.J.; Huang, P. Targeting p53-deficient chronic lymphocytic leukemia cells in vitro and in vivo by ROS-mediated mechanism. Oncotarget 2016, 7, 71378–71389. [Google Scholar] [CrossRef]
- Nachat, A.; Turoff-Ortmeyer, S.; Liu, C.; Mcculloch, M. PEITC in End-Stage B-Cell Prolymphocytic Leukemia: Case Report of Possible Sensitization to Salvage R-CHOP. Perm. J. 2016, 20, 74–80. [Google Scholar] [CrossRef] [PubMed]
- Aupérin, A. Epidemiology of head and neck cancers: An update. Curr. Opin. Oncol. 2020, 32, 178–186. [Google Scholar] [CrossRef] [PubMed]
- Yuwanati, M.; Gondivkar, S.; Sarode, S.C.; Gadbail, A.; Desai, A.; Mhaske, S.; Pathak, S.K.; Khatib, M.N. Oral health-related quality of life in oral cancer patients: Systematic review and meta-analysis. Future Oncol. 2021, 17, 979–990. [Google Scholar] [CrossRef]
- Hoesseini, A.; Offerman, M.P.J.; van de Wall-Neecke, B.J.; Sewnaik, A.; Wieringa, M.H.; Baatenburg de Jong, R.J. Physicians’ clinical prediction of survival in head and neck cancer patients in the palliative phase. BMC Palliat. Care 2020, 19, 176. [Google Scholar] [CrossRef]
- Sasahira, T.; Kirita, T. Hallmarks of Cancer-Related Newly Prognostic Factors of Oral Squamous Cell Carcinoma. Int. J. Mol. Sci. 2018, 19, 2413. [Google Scholar] [CrossRef]
- Zhou, G.; Liu, Z.; Myers, J.N. TP53 Mutations in Head and Neck Squamous Cell Carcinoma and Their Impact on Disease Progression and Treatment Response. J. Cell Biochem. 2016, 117, 2682–2692. [Google Scholar] [CrossRef]
- Lindemann, A.; Takahashi, H.; Patel, A.A.; Osman, A.A.; Myers, J.N. Targeting the DNA Damage Response in OSCC with TP53 Mutations. J. Dent. Res. 2018, 97, 635–644. [Google Scholar] [CrossRef]
- Kubrak, C.; Martin, L.; Gramlich, L.; Scrimger, R.; Jha, N.; Debenham, B.; Chua, N.; Walker, J.; Baracos, V.E. Prevalence and prognostic significance of malnutrition in patients with cancers of the head and neck. Clin. Nutr. 2020, 39, 901–909. [Google Scholar] [CrossRef]
- Terrell, J.E.; Ronis, D.L.; Fowler, K.E.; Bradford, C.R.; Chepeha, D.B.; Prince, M.E.; Teknos, T.N.; Wolf, G.T.; Duffy, S.A. Clinical predictors of quality of life in patients with head and neck cancer. Arch. Otolaryngol. Head Neck Surg. 2004, 130, 401–408. [Google Scholar] [CrossRef] [PubMed]
- Trachootham, D.; Songkaew, W.; Hongsachum, B.; Wattana, C.; Changkluengdee, N.; Karapoch, J.; Thirdsuttironnapumi, S.; Meennuch, E.; Klaitong, C.; Sinthusek, T.; et al. Nutri-jelly may improve quality of life and decrease tube feeding demand in head and neck cancer patients. Support. Care Cancer 2015, 23, 1421–1430. [Google Scholar] [CrossRef] [PubMed]
- Amornsil, P.; Trachootham, D. PEITC: Functional Compound for Primary and Tertiary Chemoprevention of Cancer. Thai J. Toxicol. 2019, 34, 75–93. [Google Scholar]
- Gupta, P.; Wright, S.E.; Kim, S.H.; Srivastava, S.K. Phenethyl isothiocyanate: A comprehensive review of anti-cancer mechanisms. Biochim. Biophys. Acta 2014, 1846, 405–424. [Google Scholar] [CrossRef] [PubMed]
- Kaewsit, N.; Winuprasith, T.; Trachootham, D. Detoxification of Heterocyclic Aromatic Amines from Grilled Meat by PEITC-rich Vegetable Sauce: A Randomized Crossover Controlled Trial. Food Funct. 2021, 12, 10411–10422. [Google Scholar] [CrossRef] [PubMed]
- Trachootham, D.; Alexandre, J.; Huang, P. Targeting cancer cells by ROS-mediated mechanisms: A radical therapeutic approach? Nat. Rev. Drug Discov. 2009, 8, 579–591. [Google Scholar] [CrossRef]
- Chen, G.; Wang, F.; Trachootham, D.; Huang, P. Preferential killing of cancer cells with mitochondrial dysfunction by natural compounds. Mitochondrion 2010, 10, 614–625. [Google Scholar] [CrossRef]
- Jutooru, I.; Guthrie, A.S.; Chadalapaka, G.; Pathi, S.; Kim, K.; Burghardt, R.; Jin, U.H.; Safe, S. Mechanism of action of phenethylisothiocyanate and other reactive oxygen species-inducing anticancer agents. Mol. Cell Biol. 2014, 34, 2382–2395. [Google Scholar] [CrossRef]
- Sutthisawas, N.; Trachootham, D.; Wattanavijitkul, T. Pharmacokinetic, safety and tolerability studies after single and multiple oral administration of Phenethyl isothiocyanate in Nutri Jelly. Chula. Med. J. 2015, 59, 631. [Google Scholar]
- Liebes, L.; Conaway, C.C.; Hochster, H.; Mendoza, S.; Hecht, S.S.; Crowell, J.; Chung, F.L. High-performance liquid chromatography-based determination of total isothiocyanate levels in human plasma: Application to studies with 2-phenethyl isothiocyanate. Anal. Biochem. 2001, 291, 279–289. [Google Scholar] [CrossRef]
- Lam-ubol, A.; Wongcheunsoontorn, C.; Trachootham, D. Clinical Safety of Nutri-PEITC Jelly: A Pre-Post Study in Healthy Volunteers. Thai J. Toxicol. 2022, 37, 1–15. [Google Scholar]
- Abdel-Magid, A.F. Reactivation of the Guardian of the Genome P53: A Promising Strategy for Treatment of Cancer. ACS Med. Chem. Lett. 2021, 12, 331–333. [Google Scholar] [CrossRef] [PubMed]
- Duffy, M.J.; Tang, M.; Rajaram, S.; O’Grady, S.; Crown, J. Targeting Mutant p53 for Cancer Treatment: Moving Closer to Clinical Use? Cancers 2022, 14, 4499. [Google Scholar] [CrossRef] [PubMed]
- Barczyk, K.; Kreuter, M.; Pryjma, J.; Booy, E.P.; Maddika, S.; Ghavami, S.; Berdel, W.E.; Roth, J.; Los, M. Serum cytochrome c indicates in vivo apoptosis and can serve as a prognostic marker during cancer therapy. Int. J. Cancer 2005, 116, 167–173. [Google Scholar] [CrossRef] [PubMed]
- Murphy, B.A.; Ridner, S.; Wells, N.; Dietrich, M. Quality of life research in head and neck cancer: A review of the current state of the science. Crit. Rev. Oncol. Hematol. 2007, 62, 251–267. [Google Scholar] [CrossRef]
- Jalili, S.; Ghasemi Shayan, R. A comprehensive evaluation of health-related life quality assessment through head and neck, Prostate, Breast, Lung, and Skin Cancer in Adults. Front. Public Health 2022, 10, 789456. [Google Scholar] [CrossRef]
- Andreassen, R.; Jönsson, B.; Hadler-Olsen, E. Oral health-related quality of life in long-term survivors of head and neck cancer compared to a general population from the seventh Tromsø study. BMC Oral Health 2022, 22, 100. [Google Scholar] [CrossRef]
- Martino, R.; Ringash, J. Evaluation of quality of life and organ function in head and neck squamous cell carcinoma. Hematol. Oncol. Clin. N. Am. 2008, 22, 1239–1256. [Google Scholar] [CrossRef]
- Johnson, D.E.; Burtness, B.; Leemans, C.R.; Lui, V.W.Y.; Bauman, J.E.; Grandis, J.R. Head and neck squamous cell carcinoma. Nat. Rev. Dis. Prim. 2020, 6, 92. [Google Scholar] [CrossRef]
- Shang, C.; Feng, L.; Gu, Y.; Hong, H.; Hong, L.; Hou, J. Impact of Multidisciplinary Team Management on the Survival Rate of Head and Neck Cancer Patients: A Cohort Study Meta-analysis. Front. Oncol. 2021, 11, 630906. [Google Scholar] [CrossRef]
- Yuan, J.M.; Stepanov, I.; Murphy, S.E.; Wang, R.; Allen, S.; Jensen, J.; Strayer, L.; Adams-Haduch, J.; Upadhyaya, P.; Le, C.; et al. Clinical Trial of 2-Phenethyl Isothiocyanate as an Inhibitor of Metabolic Activation of a Tobacco-Specific Lung Carcinogen in Cigarette Smokers. Cancer Prev. Res. 2016, 9, 396–405. [Google Scholar] [CrossRef] [PubMed]
- Aghajanpour, M.; Nazer, M.R.; Obeidavi, Z.; Akbari, M.; Ezati, P.; Kor, N.M. Functional foods and their role in cancer prevention and health promotion: A comprehensive review. Am. J. Cancer Res. 2017, 7, 740–769. [Google Scholar] [PubMed]
- Trachootham, D. Chapter 7: Research and development of functional foods for specific type of cancer. In Functional Foods and Cancer: Functional Foods in Integrative Oncology, 1st ed.; Martirosyan, D.M., Zhou, J.R., Eds.; Functional Food Center: Dallas, TX, USA, 2017; Volume 5, pp. 135–156. ISBN 978-1976255342. [Google Scholar]
- Mallery, S.R.; Wang, D.; Santiago, B.; Pei, P.; Bissonnette, C.; Jayawardena, J.A.; Schwendeman, S.P.; Spinney, R.; Lang, J. Fenretinide, Tocilizumab, and Reparixin Provide Multifaceted Disruption of Oral Squamous Cell Carcinoma Stem Cell Properties: Implications for Tertiary Chemoprevention. Mol. Cancer Ther. 2019, 18, 2308–2320. [Google Scholar] [CrossRef] [PubMed]
- Parkar, S.M.; Shah, M.N. A relationship between quality-of-life and head and neck cancer: A systemic review. South Asian J. Cancer 2015, 4, 179–182. [Google Scholar] [CrossRef]
- Tarsitano, A.; Pizzigallo, A.; Ballone, E.; Marchetti, C. Health-related quality of life as a survival predictor for patients with localized head and neck cancer treated with radiation therapy. Oral Surg. Oral Med. Oral Pathol. Oral Radiol. 2012, 114, 756–763. [Google Scholar] [CrossRef]
- Fang, F.M.; Liu, Y.T.; Tang, Y.; Wang, C.J.; Ko, S.F. Quality of life as a survival predictor for patients with advanced head and neck carcinoma treated with radiotherapy. Cancer 2004, 100, 425–432. [Google Scholar] [CrossRef]
- Balogh, G.A.; Mailo, D.A.; Corte, M.M.; Roncoroni, P.; Nardi, H.; Vincent, E.; Martinez, E.; Cafasso, M.E.; Frizza, A.; Ponce, G.; et al. Mutant p53 protein in serum could be used as a molecular marker in human breast cancer. Int. J. Oncol. 2006, 28, 995–1002. [Google Scholar] [CrossRef]
- Balogh, G.A.; Mailo, D.; Nardi, H.; Corte, M.M.; Vincent, E.; Barutta, E.; GLizarraga; Lizarraga, P.; Montero, H.; Gentiliet, R. Serological levels of mutated p53 protein are highly detected at early stages in breast cancer patients. Exp. Ther. Med. 2010, 1, 357–361. [Google Scholar] [CrossRef]
- Barbati, A.; Mariani, L.; Porpora, M.G.; Anceschi, M.; Collini, P.; Lauro, V.; EV, C. Serum evaluation of P53 protein in patients with gynaecological cancer. Anticancer Res. 2000, 20, 1033–1035. [Google Scholar]
- Luo, J.C.; Zehab, R.; Anttila, S.; Ridanpaa, M.; Husgafvel-Pursiainen, K.; Vainio, H.; Carney, W.; DeVivo, I.; Milling, C.; Brandt-Rauf, P.W. Detection of serum p53 protein in lung cancer patients. J. Occup. Med. 1994, 36, 155–160. [Google Scholar] [CrossRef]
- Mostaid, M.S.; Mumu, S.B.; Haque, M.A.; Sharmin, S.; Jamiruddin, M.R.; Sayedur Rahman, G.M.; Reza, H.M. Elevated serum expression of p53 and association of TP53 codon 72 polymorphisms with risk of cervical cancer in Bangladeshi women. PLoS ONE 2021, 16, e0261984. [Google Scholar] [CrossRef] [PubMed]
- McVean, M.; Xiao, H.; Isobe, K.; Pelling, J.C. Increase in wild-type p53 stability and transactivational activity by the chemopreventive agent apigenin in keratinocytes. Carcinogenesis 2000, 21, 633–639. [Google Scholar] [CrossRef]
- Butera, G.; Manfredi, M.; Fiore, A.; Brandi, J.; Pacchiana, R.; De Giorgis, V.; Barberis, E.; Vanella, V.; Galasso, M.; Scupoli, M.; et al. Tumor Suppressor Role of Wild-Type P53-Dependent Secretome and Its Proteomic Identification in PDAC. Biomolecules 2022, 12, 305. [Google Scholar] [CrossRef]
- Klimovich, B.; Meyer, L.; Merle, N.; Neumann, M.; König, A.M.; Ananikidis, N.; Keber, C.U.; Elmshäuser, S.; Timofeev, O.; Stiewe, T.; et al. Partial p53 reactivation is sufficient to induce cancer regression. J. Exp. Clin. Cancer Res. 2022, 41, 80. [Google Scholar] [CrossRef] [PubMed]
- Roszkowska, K.A.; Piecuch, A.; Sady, M.; Gajewski, Z.; Flis, S. Gain of Function (GOF) Mutant p53 in Cancer-Current Therapeutic Approaches. Int. J. Mol. Sci. 2022, 23, 13287. [Google Scholar] [CrossRef] [PubMed]
- Mathibe, L.J. Drop-out rates of cancer patients participating in longitudinal RCTs. Contemp. Clin. Trials 2007, 28, 340–342. [Google Scholar] [CrossRef] [PubMed]
- Bell, M.L.; Kenward, M.G.; Fairclough, D.L.; Horton, N.J. Differential dropout and bias in randomized controlled trials: When it matters and when it may not. BMJ 2013, 346, e8668. [Google Scholar] [CrossRef]
- Trachootham, D.; Zhou, Y.; Zhang, H.; Demizu, Y.; Chen, Z.; Pelicano, H.; Chiao, P.J.; Achanta, G.; Arlinghaus, R.B.; Liu, J.; et al. Selective killing of oncogenically transformed cells through a ROS-mediated mechanism by beta-phenylethyl isothiocyanate. Cancer Cell 2006, 10, 241–252. [Google Scholar] [CrossRef]
- Trachootham, D.; Zhang, H.; Zhang, W.; Feng, L.; Du, M.; Zhou, Y.; Chen, Z.; Pelicano, H.; Plunkett, W.; Wierda, W.G.; et al. Effective elimination of fludarabine-resistant CLL cells by PEITC through a redox-mediated mechanism. Blood 2008, 112, 1912–1922. [Google Scholar] [CrossRef]
- Kang, R.; Kroemer, G.; Tang, D. The tumor suppressor protein p53 and the ferroptosis network. Free Radic. Biol. Med. 2019, 133, 162–168. [Google Scholar] [CrossRef]
- Shoaib, S.; Ansari, M.A.; Ghazwani, M.; Hani, U.; Jamous, Y.F.; Alali, Z.; Wahab, S.; Ahmad, W.; Weir, S.A.; Alomary, M.N.; et al. Prospective Epigenetic Actions of Organo-Sulfur Compounds against Cancer: Perspectives and Molecular Mechanisms. Cancers 2023, 15, 697. [Google Scholar] [CrossRef] [PubMed]
- Cykowiak, M.; Kleszcz, R.; Kucińska, M.; Paluszczak, J.; Szaefer, H.; Plewiński, A.; Piotrowska-Kempisty, H.; Murias, M.; Krajka-Kuźniak, V. Attenuation of Pancreatic Cancer In Vitro and In Vivo via Modulation of Nrf2 and NF-κB Signaling Pathways by Natural Compounds. Cells 2021, 10, 3556. [Google Scholar] [CrossRef] [PubMed]
- Cykowiak, M.; Krajka-Kuźniak, V.; Kleszcz, R.; Kucińska, M.; Szaefer, H.; Piotrowska-Kempisty, H.; Plewiński, A.; Murias, M.; Baer-Dubowska, W. Comparison of the Impact of Xanthohumol and Phenethyl Isothiocyanate and Their Combination on Nrf2 and NF-κB Pathways in HepG2 Cells In Vitro and Tumor Burden In Vivo. Nutrients 2021, 13, 3000. [Google Scholar] [CrossRef] [PubMed]
- Xiao, J.; Zhou, N.; Li, Y.; Xiao, Y.; Chen, W.; Ye, J.; Ma, T.; Zhang, Y. PEITC inhibits the invasion and migration of colorectal cancer cells by blocking TGF-β-induced EMT. Biomed. Pharmacother. 2020, 130, 110743. [Google Scholar] [CrossRef]
- Brasili, E.; Filho, V.C. Metabolomics of cancer cell cultures to assess the effects of dietary phytochemicals. Crit. Rev. Food Sci. Nutr. 2017, 57, 1328–1339. [Google Scholar] [CrossRef]
- FACIT. Functional Assessment of Cancer Therapy—Head & Neck (FACT-HN) Version 4. Available online: https://www.facit.org/measures/FACT-HN (accessed on 5 February 2023).
- List, M.A.; D’Antonio, L.L.; Cella, D.F.; Siston, A.; Mumby, P.; Haraf, D.; Vokes, E. The Performance Status Scale for Head and Neck Cancer Patients and the Functional Assessment of Cancer Therapy-Head and Neck Scale. A study of utility and validity. Cancer 1996, 77, 2294–2301. [Google Scholar] [CrossRef]
- Weiss, J.; Gilbert, J.; Deal, A.M.; Weissler, M.; Hilliard, C.; Chera, B.; Murphy, B.; Hackman, T.; Liao, J.J.; Olson, J.G.; et al. Induction chemotherapy with carboplatin, nab-paclitaxel, and cetuximab for at least N2b nodal status or surgically unresectable squamous cell carcinoma of the head and neck. Oral Oncol. 2018, 84, 46–51. [Google Scholar] [CrossRef]
- Chumachote, A. Quality of life in Head and Neck Cancer Patients Received Radiotherapy. J. Thai Assoc. Rad. Oncol. 2016, 22, 24–33. [Google Scholar]
- The National Palliative Care Research Center (NPCRC). Karnofsky Performance Status Scale Definitions Rating (%) Criteria. Available online: http://www.npcrc.org/files/news/karnofsky_performance_scale.pdf (accessed on 5 February 2023).
- Gyawali, B.; Eisenhauer, E.; Tregear, M.; Booth, C.M. Progression-free survival: It is time for a new name. Lancet Oncol. 2022, 23, 328–330. [Google Scholar] [CrossRef]
- National Cancer Institute, USA. Response Evaluation Criteria in Solid Tumors. Available online: https://www.cancer.gov/publications/dictionaries/cancer-terms/def/response-evaluation-criteria-in-solid-tumors (accessed on 1 April 2023).
- Eisenhauer, E.A.; Therase, P.; Bogaerts, J.; Schwartz, L.H.; Sargent, D.; Ford, R.; Dancey, J.; Arbuck, S.; Gwyther, S.; Mooney, M.; et al. New response evaluation criteria in solid tumours: Revised RECIST guideline (version 1.1). Eur. J. Cancer 2009, 45, 228–247. [Google Scholar] [CrossRef]
- Ji, Y.; Morris, M.E. Determination of phenethyl isothiocyanate in human plasma and urine by ammonia derivatization and liquid chromatography-tandem mass spectrometry. Anal. Biochem. 2003, 323, 39–47. [Google Scholar] [CrossRef] [PubMed]
- Zheng, L.; Zheng, F. Development and validation of an LC-APCI-MS/MS method for the determination of phenethyl isothiocyanate in human plasma. Biomed. Chromatogr. 2015, 29, 619–625. [Google Scholar] [CrossRef] [PubMed]


| Characteristics | Control Group (N = 41) | Study Group (N = 31) | |
|---|---|---|---|
| N (%) | N (%) | p-Value | |
Gender
| 24 (59) 17 (41) | 25 (81) 6 (19) | 0.07 † |
Occupation
| 14 (34) 16 (39) 11 (27) | 11(35) 12 (39) 8 (26) | 0.99 ‡ |
Location of primary cancer
| 24 (59) 11 (27) 6 (15) | 18 (58) 7 (23) 6 (19) | 0.83 ‡ |
Staging T (tumor size)
| 14 (34) 27 (66) | 9 (29) 22 (71) | 0.79 † |
Staging N (lymph node involvement)
| 20 (49) 21 (51) | 16 (52) 15 (48) | >0.99 † |
Staging M (distant metastasis)
| 40 (98) 1 (2) | 31 (100) 0 (0) | >0.99 † |
| mean ± SD | mean ± SD | p-value | |
| BMI (kg/m2) | 18.3 ± 3.3 | 17.2 ± 3.6 | 0.15 § |
| Age (years) | 63.3 ± 13.8 | 62.5 ± 12.1 | 0.67 § |
| KPS score (%) | 69.5 ± 10.5 | 72.6 ± 10.3 | 0.22 § |
| HRQoL | 3.7 ± 5.9 | 1.2 ± 4.3 | 0.14 § |
| Characteristics | Control Group (N = 41) | Study Group (N = 31) | p-Value |
|---|---|---|---|
| Hemoglobin (gm/dL) | 11 ± 1.5 | 10.4 ± 1.4 | 0.09 † |
| Hematocrit (%) | 33.5 ± 4.3 | 31.8 ± 4.0 | 0.08 † |
| WBC count (cells/mm3) | 8737 ± 3364 | 10,035 ± 5082 | 0.73 ‡ |
| RBC (cells/mm3) | 4114 ± 669.1 | 3959 ± 774.3 | 0.34 ‡ |
| MCV (fL) | 82.3 ± 10.7 | 81.1 ± 9.6 | 0.37 ‡ |
| MCH (pg) | 27 ± 3.7 | 26.7 ± 3.2 | 0.43 ‡ |
| MCHC (g/dL) | 32.8 ± 1.0 | 32.9 ± 1.0 | 0.63 ‡ |
| Platelets (cells/mm3) | 325,863 ± 136,124 | 357,355 ± 162,560 | 0.59 ‡ |
| BUN (mg/dL) | 12.8 ± 4.8 | 12.8 ± 4.9 | 0.94 † |
| Creatinine (mg/dL) | 0.7 ± 0.2 | 0.8 ± 0.2 | 0.09 ‡ |
| Cholesterol (mg/dL) | 165.4 ± 42.3 | 174.2 ± 60.6 | 0.65 † |
| LDL (mg/dL) | 100.2 ± 37 | 102.9 ± 49 | 0.87 † |
| HDL (mg/dL) | 45.2 ± 14.4 | 48.4 ± 10.1 | 0.27 ‡ |
| SGOT (U/L) | 22.3 ± 8.8 | 24.7 ± 9.9 | 0.24 ‡ |
| SGPT (U/L) | 15.8 ± 11.4 | 17.6 ± 12.8 | 0.39 ‡ |
| Bilirubin (mg/dL) | 0.4 ± 0.2 | 0.4 ± 0.2 | 0.55 ‡ |
| Adverse Events | Control Group (N = 41) | Study Group (N = 31) | Details |
|---|---|---|---|
| N (%) | N (%) | ||
| Nausea and vomiting | 4 (9.8) | 7 (22.6) | Two participants in the control group and one participant in the study group discontinued the product, the rest had transient symptoms that disappeared without treatment |
| Burning sensation in the mouth | 4 (9.8) | 5 (16.1) | Transient symptoms that disappeared without treatment |
| Constipation | 4 (9.8) | 2 (6.5) | One participant in the study group received laxatives for 3 days. The rest had transient symptoms that disappeared without treatment |
| Dry mouth and throat | 3 (7.3) | 3 (9.7) | Transient, the symptom disappeared without treatment |
| Itchy sensation in the mouth | 1 (2.4) | 1 (3.2) | Transient symptoms that disappeared without treatment |
| Diarrhea | 1 (2.4) | 0 | Transient symptoms that disappeared without treatment |
| Tumor bleeding after food consumption | 1 | 0 | One participant in the control group discontinued the product |
| Baseline | 1 Month Follow-Up | 3 Months Follow-Up | p-Value † | ||||
|---|---|---|---|---|---|---|---|
| Parameters | Control Group | Study Group | Control Group | Study Group | Control Group | Study Group | |
| Hemoglobin (gm/dL) | 11 ± 1.5 | 10.4 ± 1.4 | 10.9 ± 1.5 | 10.4 ± 1.5 | 10.5 ± 1.2 | 9.8 ± 1.7 | 0.96 |
| Hematocrit (%) | 33.5 ± 4.3 | 31.8 ± 4.0 | 31.7 ± 4.7 | 33.3 ± 4.5 | 32.2 ± 3.6 | 29.8 ± 5.1 | 0.75 |
| WBC count (×103 cells/mm3) | 8.7 ± 3.4 | 10.0 ± 5.1 | 9.8 ± 6.1 | 9.8 ± 3.6 | 9.8 ± 5.0 | 10.0 ± 4.0 | 0.68 |
| RBC (103 cells/mm3) | 4.1 ± 0.7 | 3.9 ± 0.8 | 4.0 ± 0.7 | 4.0 ± 0.7 | 3.9 ± 0.5 | 3.8 ± 0.8 | 0.87 |
| Platelets ×105cells/mm3) | 3.2 ± 1.4 | 3.5 ± 1.6 | 3.5 ± 1.4 | 3.3 ± 1.4 | 3.5 ± 1.4 | 3.5 ± 1.7 | 0.88 |
| BUN (mg/dL) | 12.8 ± 4.9 | 12.8 ± 4.7 | 13.7 ± 4.5 | 14.9 ± 9.2 | 12.6 ± 6.1 | 13.4 ± 5.5 | 0.63 |
| Creatinine (mg/dL) | 0.8 ± 0.2 | 0.8 ± 0.2 | 0.7 ± 0.2 | 0.9 ± 0.3 | 0.8 ± 0.4 | 0.9 ± 0.2 | 0.36 |
| Cholesterol (mg/dL) | 165.4 ± 41.7 | 174.2 ± 59.1 | 162.4 ± 40.6 | 171.6 ± 41.7 | 165.7 ± 51.0 | 157.1 ± 31.2 | 0.09 |
| SGOT (U/L) | 22.3 ± 8.8 | 24.7 ± 9.8 | 22.25 ± 9.1 | 25.6 ± 9.9 | 23.0 ± 11.5 | 26.9 ± 14.8 | 0.96 |
| SGPT (U/L) | 15.8 ± 11.4 | 17.6 ± 12.7 | 15.7 ± 12.7 | 18.1 ± 8.8 | 18.8 ± 18.8 | 18.8 ± 15.1 | 0.98 |
| Bilirubin (mg/dL) | 0.4 ± 0.2 | 0.4 ± 0.2 | 0.5 ± 0.2 | 0.6 ± 0.6 | 0.5 ± 0.3 | 0.5 ± 0.3 | 0.82 |
| Nutri-Jelly | Nutri-PEITC Jelly | |
|---|---|---|
| Total energy (kcal) | 130 | 110 |
| Energy from fat (kcal) | 35 | 30 |
| Total fat (g) | 4 | 3 |
| Saturated fat (g) | 2 | 2 |
| Cholesterol (mg) | 15 | 15 |
| Protein (g) | 5 | 5 |
| Total carbohydrate (g) | 18 | 16 |
| Dietary fiber (g) | 2 | <1 |
| Sugar (g) | 12 | 9 |
| Sodium (mg) | 45 | 45 |
| Vitamin A (μg RE) | 64 | 64 |
| Vitamin B1 (mg) | 0 | 0 |
| Vitamin B2 (mg) | 0.17 | 0.34 |
| Calcium (mg) | 120 | 120 |
| Iron (mg) | 0.3 | 1.5 |
Disclaimer/Publisher’s Note: The statements, opinions and data contained in all publications are solely those of the individual author(s) and contributor(s) and not of MDPI and/or the editor(s). MDPI and/or the editor(s) disclaim responsibility for any injury to people or property resulting from any ideas, methods, instructions or products referred to in the content. |
© 2023 by the authors. Licensee MDPI, Basel, Switzerland. This article is an open access article distributed under the terms and conditions of the Creative Commons Attribution (CC BY) license (https://creativecommons.org/licenses/by/4.0/).
Share and Cite
Lam-Ubol, A.; Sukhaboon, J.; Rasio, W.; Tupwongse, P.; Tangshewinsirikul, T.; Trachootham, D. Nutri-PEITC Jelly Significantly Improves Progression-Free Survival and Quality of Life in Patients with Advanced Oral and Oropharyngeal Cancer: A Blinded Randomized Placebo-Controlled Trial. Int. J. Mol. Sci. 2023, 24, 7824. https://doi.org/10.3390/ijms24097824
Lam-Ubol A, Sukhaboon J, Rasio W, Tupwongse P, Tangshewinsirikul T, Trachootham D. Nutri-PEITC Jelly Significantly Improves Progression-Free Survival and Quality of Life in Patients with Advanced Oral and Oropharyngeal Cancer: A Blinded Randomized Placebo-Controlled Trial. International Journal of Molecular Sciences. 2023; 24(9):7824. https://doi.org/10.3390/ijms24097824
Chicago/Turabian StyleLam-Ubol, Aroonwan, Jirasak Sukhaboon, Withee Rasio, Peerawitch Tupwongse, Thapana Tangshewinsirikul, and Dunyaporn Trachootham. 2023. "Nutri-PEITC Jelly Significantly Improves Progression-Free Survival and Quality of Life in Patients with Advanced Oral and Oropharyngeal Cancer: A Blinded Randomized Placebo-Controlled Trial" International Journal of Molecular Sciences 24, no. 9: 7824. https://doi.org/10.3390/ijms24097824
APA StyleLam-Ubol, A., Sukhaboon, J., Rasio, W., Tupwongse, P., Tangshewinsirikul, T., & Trachootham, D. (2023). Nutri-PEITC Jelly Significantly Improves Progression-Free Survival and Quality of Life in Patients with Advanced Oral and Oropharyngeal Cancer: A Blinded Randomized Placebo-Controlled Trial. International Journal of Molecular Sciences, 24(9), 7824. https://doi.org/10.3390/ijms24097824