Article

Comparative Transcriptome Analysis Reveals the Effect of the DHN Melanin Biosynthesis Pathway on the Appressorium Turgor Pressure of the Poplar Anthracnose-Causing Fungus Colletotrichum gloeosporioides

1
The Key Laboratory for Silviculture and Conservation of Ministry of Education, College of Forestry, Beijing Forestry University, Beijing 100083, China
2
Beijing Key Laboratory for Forest Pest Control, College of Forestry, Beijing Forestry University, Beijing 100083, China
*
Author to whom correspondence should be addressed.
Int. J. Mol. Sci. 2023, 24(8), 7411; https://doi.org/10.3390/ijms24087411
Submission received: 2 March 2023 / Revised: 13 April 2023 / Accepted: 16 April 2023 / Published: 18 April 2023
(This article belongs to the Special Issue Biotechnology and Crop Breeding)

Abstract

:
Anthracnose of poplar caused by Colletotrichum gloeosporioides is a leaf disease that seriously affects poplar growth. The pathogen invades the host in the form of adherent cells, which generate turgor pressure through the metabolism of intracellular substances prior to penetrating the epidermis of poplar leaves. In this study, the expansion-related pressure of the mature appressorium of the wild-type C. gloeosporioides was approximately 13.02 ± 1.54 MPa at 12 h, whereas it was 7.34 ± 1.23 MPa and 9.34 ± 2.22 MPa in the melanin synthesis-related gene knockout mutants ΔCgCmr1 and ΔCgPks1, respectively. The CgCmr1 and CgPks1 genes were highly expressed at 12 h in the wild-type control, implying that the DHN melanin biosynthesis pathway may play an important role in the mature appressorium stage. The transcriptome sequencing analysis indicated that the upregulated melanin biosynthesis genes in C. gloeosporioides, such as CgScd1, CgAyg1, CgThr1, CgThr2, and CgLac1, are involved in specific KEGG pathways (i.e., fatty acid biosynthesis, fatty acid metabolism, and biotin metabolism). Therefore, we speculate that the melanin synthesis-related genes and fatty acid metabolism pathway genes contribute to the regulation of the turgor pressure in the mature C. gloeosporioides appressorium, ultimately leading to the formation of infection pegs that enter plant tissues. These observations may reflect the co-evolution of C. gloeosporioides and its host.

1. Introduction

Poplar anthracnose is caused by Colletotrichum gloeosporioides [1] and is an extremely destructive disease. Among the species in the genus Colletotrichum, C. gloeosporioides is the pathogen with the widest host range and is responsible for causing the most severe damage. In addition to infecting poplar trees, C. gloeosporioides can also infect walnut, mango, rubber, and other economically valuable forest tree species (occurrence area exceeding 60,000 hectares), as well as a variety of cultivated plants, resulting in rotted leaves, branches, or fruits and substantial losses in agriculture and forestry industries [2,3]. Poplar trees in Ningxia, Beijing, Henan, Hebei, Shanxi, and other regions in China have been damaged to varying degrees. Wind, rain, and insects are the main vectors of C. gloeosporioides, with wind serving as the primary vector for the infection of poplar trees.
When conidia attach to the surface of poplar leaves, they germinate and form a bud tube. The tip of the bud tube expands to form an initial appressorium. The metabolism of substances in the appressorium results in swelling. When the swelling is converted to a mechanical force, the base of the appressorium produces fine infection pegs that penetrate the epidermis of poplar leaves, leading to the successful invasion of the underlying cells. The formation of a functional appressorium is critical for the interaction between C. gloeosporioides and different resistant hosts. Therefore, the regulated metabolism of specific substances in the adherent cells of C. gloeosporioides is crucial for appressorium formation and the completion of the infection process [4,5,6].
The swelling of appressoria produced by pathogenic fungi has been investigated. More specifically, Magnaporthe oryzae, which is a model pathogenic fungus, has been thoroughly studied in terms of its infection structure (appressorium) function and the mechanism underlying its swelling. There are two factors mediating the increase in pressure of the appressorium of the rice blast fungus. First, 1,8-dihydroxynaphthalene (1,8-DHN) melanin functions as an effective permeability barrier to increase the cell solute concentration. Second, whether the osmotic pressure in the cytoplasm can increase sufficiently depends on the characteristics of cytosol [7]. Previous research has confirmed that melanin may serve as a rigid structural barrier that prevents solute efflux, which is crucial for the formation of turgor pressure [8,9,10]. However, there is relatively little melanin deposited in the appressorial cell wall adhering to the plant surface, and a pore eventually forms that allows small molecules (e.g., water) to pass through, but not organic molecules (e.g., glycerol) [11]. The infection peg extending from this aperture penetrates the epidermal cells because of the considerable swelling-related pressure and then enters the adjacent cells through plasmodesmata, ultimately resulting in the widespread distribution of the pathogenic fungus, which proceeds to the necrotic growth stage and to the development of disease symptoms [3]. The highest turgor pressure of the attached cells can exceed 8.0 Mpa.
Relevant studies have been conducted to clarify the molecular mechanism underlying C. gloeosporioides appressorium formation and the subsequent infection of plant hosts, but they have been relatively rare and mainly focused on the functional annotation of genes involved in appressorium formation and regulation [12,13,14]. Previous studies on poplar anthracnose have shown that the C. gloeosporioides adherent cells must metabolize certain materials and the turgor pressure needs to increase in order to facilitate entry into the host tissues. During their maturation, the translucent adherent cells continuously accumulate melanin to enhance the strength of their cell wall, enabling them to withstand the increase in turgor pressure [15,16]. The C. gloeosporioides genes encoding the regulators of melanin synthesis have been identified. Moreover, mutants in which DHN melanin synthesis genes are silenced have been generated [16]. A recent study indicated that among the melanin synthesis-related genes in C. gloeosporioides, the deletion of CgPks1 will lead to a lack of melanin production, whereas the deletion of CgCmr1 results in delayed and limited melanin synthesis in the appressorium [16]. In addition, ΔCgCmr1 and ΔCgPks1 mutants were also found to be sensitive to H2O2 oxidative stress, but not to other abiotic stresses, which suggests that CgCmr1 and CgPks1 may play a key role in DHN melanin biosynthesis. However, the results of Wang et al. [16] did not reveal the effect of the DHN melanin biosynthesis pathway on appressorium turgor pressure.
In this study, we analyzed the C. gloeosporioides transcriptome to reveal differences in the expression profiles of the genes associated with the DHN melanin biosynthesis pathway during the increase in turgor pressure in the appressorium.

2. Results

2.1. Appressorium Morphology in Different Developmental Stages

Appressorium morphogenesis was analyzed at the following time points: 0 h (conidia), 3 h (germ tube), 5 h (initial appressorium), 7 h, and 9 h (gradually maturing appressorium), and 12 h (mature appressorium) (Figure 1).

2.2. Changes in the Appressorium Turgor Pressure in the Wild-Type Control and Mutants and CgCmr1 and CgPks1 Expression in the Wild-Type Control at Different Time Points

The analysis of the adherent cell turgor pressure of the C. gloeosporioides WT control and two mutants revealed an increase in the adherent cell turgor pressure of the WT control over time. More specifically, it was 9.60 ± 1.04 MPa at 5 h, 10.29 ± 0.53 MPa at 7 h, 11.38 ± 0.65 MPa at 9 h, and 13.02 ± 1.54 MPa at 12 h. The adherent cell turgor pressure of ΔCgCmr1 was 2.26 ± 0.58 MPa at 5 h, 4.91 ± 0.98 MPa at 7 h, 6.6 ± 0.67 MPa at 9 h, and 7.34 ± 1.23 MPa at 12 h. The adherent cell turgor pressure of ΔCgPks1 was 5.26 ± 1.31 MPa at 5 h, 5.91 ± 0.55 MPa at 7 h, 8.60 ± 1.00 MPa at 9 h, and 9.34 ± 2.22 MPa at 12 h (Figure 2). The qRT-PCR analysis showed that CgCmr1 and CgPks1 were highly expressed in the WT control at 12 h (Figure 3), indicative of the importance of the DHN melanin biosynthesis pathway in the mature appressorium stage.

2.3. Transcriptome Sequencing and Data Assembly

On the basis of the above-mentioned results, we sequenced the transcriptome of the conidia (0 h) and mature appressorium (12 h) of the C. gloeosporioides WT strain to explore the effect of the DHN melanin biosynthesis pathway on the appressorium turgor pressure. The raw reads generated for the C. gloeosporioides CgWT0h and CgWT12h samples comprised 7,534,480,292 and 6,803,953,388 bp, respectively (Table 1). The adapter sequences, reads with ambiguous nucleotides, and low-quality reads were eliminated to obtain the clean reads for the CgWT0h and CgWT12h samples. More than 85% of the reads in all six samples had a quality score exceeding Q30 and the Q30 percentage for all samples was not less than 93.94% (Table 1), reflecting the high quality of the sequencing data. Additionally, more than 5.53 Gb clean bases were obtained per library.

2.4. Differentially Expressed Genes among the Transcriptomes

The CgWT0h and CgWT12h transcriptome profiles were compared to identify the DEGs. Of the 380 DEGs between CgWT0h and CgWT12h, 231 and 149 were upregulated and downregulated, respectively. The DEG distribution is presented in Figure 4; the significant DEGs were identified on the basis of an adjusted fold-change ≥2 and a corrected p < 0.01. The GO molecular function category included 10 upregulated DEGs (CgWT12h) that were assigned to subcategories, among which five may be involved in metabolic activities regulating the generation of turgor pressure (i.e., lipid transport and metabolism activity; energy production and conversion activity; secondary metabolite biosynthesis, transport, and catabolism activity; posttranslational modification activity; and amino acid transport and metabolism activity) (Table 2). In addition, the 10 downregulated DEGs (CgWT12h) included genes related to carbohydrate transport and metabolism activity, inorganic ion transport and metabolism activity, short chain dehydrogenase activity, and glycosyl hydrolase activity (Table 2).

2.5. GO Enrichment Analysis of the DEGs

A GO enrichment analysis was performed to functionally annotate and classify the DEGs. The upregulated and downregulated genes were assigned GO IDs and categories (Figure 5). The main GO categories were the cellular component, molecular function, and biological process. For the CgWT12h sample, the GO analysis revealed the following. In the biological process category, 25.81% and 21.77% of the DEGs were annotated with the metabolic process (GO:0008152) and cellular metabolic process (GO:0044237), respectively. In the molecular function category, 20.93% and 18.02% of the DEGs were annotated with the catalytic activity (GO:0003824) and oxidoreductase activity (GO:0016491), respectively. In the cellular component category, 33.93% and 27.68% of the DEGs were annotated with the cell (GO:0005623) and intracellular organelle (GO:0043229), respectively.

2.6. Enriched KEGG Pathways among the DEGs

A total of 67 KEGG pathways were enriched among 136 DEGs in the CgWT12h sample (Table 3). The major enriched metabolic pathways included the following: carbon metabolism; biosynthesis of amino acids; tryptophan metabolism; glycine, serine, and threonine metabolism; fatty acid metabolism; phenylpropanoid biosynthesis; tyrosine metabolism; arginine and proline metabolism; glycerophospholipid metabolism; and carotenoid biosynthesis.
Both CgCmr1 and CgPks1 encode regulators of melanin biosynthesis in C. gloeosporioides. In the current study, CgScd1 (EVM0006990), CgAyg1 (EVM0012797), CgThr1 (EVM0003085), CgThr2 (EVM0013226), and CgLac1 (EVM0011157) were detected as upregulated genes associated with the KEGG pathways fatty acid biosynthesis (ko00061; Supplementary Figure S1), fatty acid metabolism (ko01212; Supplementary Figure S2), and biotin metabolism (ko00780; Supplementary Figure S3).

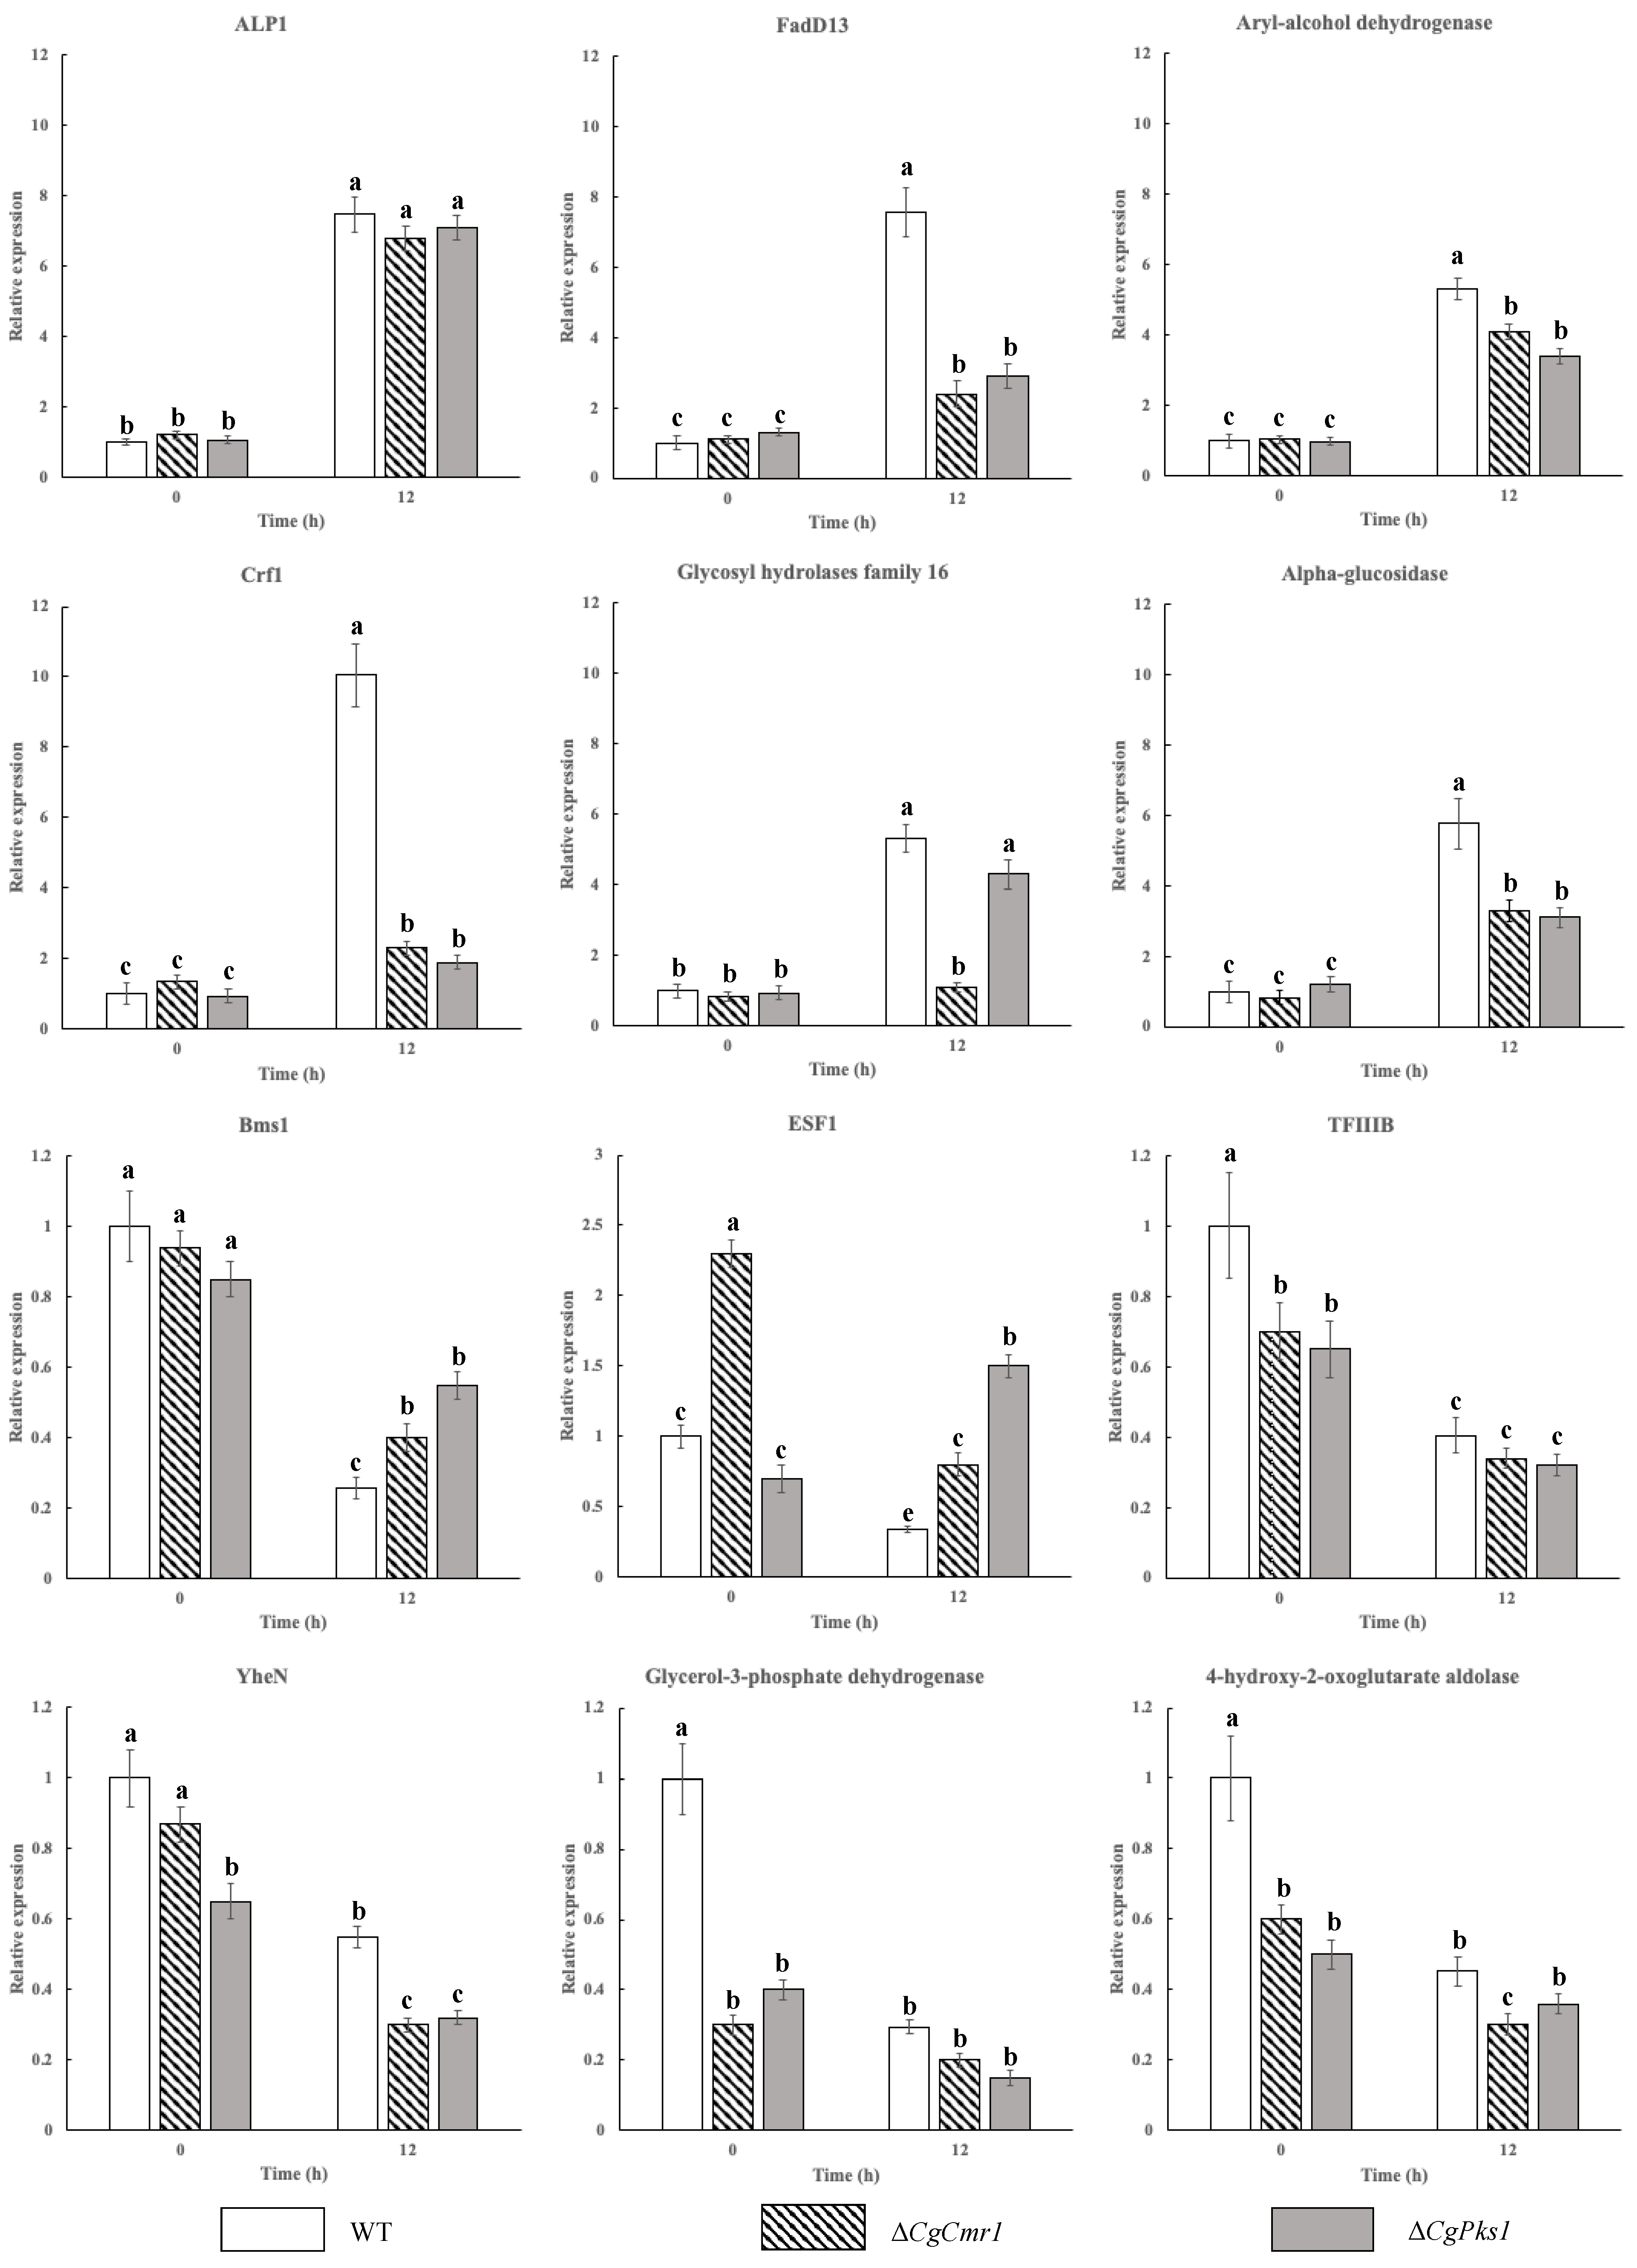
2.7. Verification of Gene Expression by qRT-PCR

To verify the accuracy of the transcriptome data, we selected a few potentially key DEGs identified in the WT, ΔCgCmr1, and ΔCgPks1 transcriptomes at 0 and 12 h for qRT-PCR analysis. More specifically, DEGs encoding proteins contributing to fatty acid biosynthesis, fatty acid metabolism, and biotin metabolism were analyzed. The qRT-PCR data were consistent with the corresponding RNA-seq data for the 12 selected genes encoding the following proteins: long-chain-fatty-acid—CoA ligase (FadD13), aryl-alcohol dehydrogenase, transcription factor Crf1, glycosyl hydrolase family 16 member, alpha-glucosidase, alkali-sensitive linkage protein (ALP1), polysaccharide deacetylase (YheN), glycerol-3-phosphate dehydrogenase, 4-hydroxy-2-oxoglutarate aldolase, ribosome biogenesis protein (Bms1), pre-rRNA-processing protein (ESF1), and transcription factor (TFIIIB). Thus, the qRT-PCR analysis confirmed the RNA-seq data were reliable and accurate (Figure 6). Furthermore, the expression levels of the genes encoding FadD13, Crf1, and alpha-glucosidase, which influence fatty acid biosynthesis and fatty acid metabolism, were significantly downregulated at 12 h in the ΔCgCmr1 and ΔCgPks1 mutants.

3. Discussion

When C. gloeosporioides infects poplar trees, its conidia attach to the leaf surface and germinate to form a bud tube. The tip of the bud tube expands to form an initial appressorium. The metabolic activities in the appressorium lead to swelling and an increase in turgor pressure. Next, infection pegs at the appressorium base penetrate the poplar leaf epidermis and invade the underlying cells [4,5,6]. A functional appressorium mediates C. gloeosporioides–host interactions.
After the C. gloeosporioides appressorium forms, certain materials are metabolized and the appressorium swells, thereby enabling it to invade the host tissue. During its maturation, the translucent appressorium accumulates melanin to strengthen its cell wall, which is necessary because of the increased pressure due to swelling [16]. By measuring the expansion-related pressure as the C. gloeosporioides appressorium morphology changed, we revealed that the turgor pressure of the mature appressorium (i.e., at 12 h) was greater for the WT C. gloeosporioides (13.02 ± 1.54 MPa) than for the ΔCgCmr1 (7.34 ± 1.23 MPa) and ΔCgPks1 (9.34 ± 2.22 MPa) mutants.
The qRT-PCR analysis showed that CgCmr1 and CgPks1 were expressed at high levels in the WT control at 12 h, suggestive of the importance of the DHN melanin biosynthesis pathway in the mature appressorium. We constructed transcriptome sequencing libraries using the total RNA extracted from the C. gloeosporioides samples collected from the GelBond membrane surface at 0 h (conidia) and 12 h (mature appressorium). The enriched KEGG pathways among the upregulated C. gloeosporioides melanin biosynthesis-related genes, such as CgScd1 (EVM0006990), CgAyg1 (EVM0012797), CgThr1 (EVM0003085), CgThr2 (EVM0013226), and CgLac1 (EVM0011157), were fatty acid biosynthesis (ko00061), fatty acid metabolism (ko01212), and biotin metabolism (ko00780). Polyketide synthase is one of the initial enzymes in the DHN melanin biosynthesis pathway [17]. Mutations to Pks1 genes result in a complete lack of melanin biosynthesis in many fungi, including Verticillium dahliae [18], Botrytis cinerea [19], Colletotrichum falcatum [20], and Colletotrichum orbiculare [21]. The Cmr1 transcription factor gene, which is involved in DHN melanin biosynthesis, has also been widely studied in several fungi, including M. oryzae (Pig1) [22] and V. dahliae (VdCmr1) [23]. Moreover, Wang et al. [16] found that the deletion of CgPks1 will lead to a lack of melanin production, whereas the deletion of CgCmr1 results in delayed and limited melanin synthesis in the appressorium, which suggests that CgCmr1 and CgPks1 may play a key role in DHN melanin biosynthesis. Based on the transcriptome data of this study, we speculate that the melanin synthesis-related genes and fatty acid metabolism pathway genes in the mature C. gloeosporioides appressorium encode proteins that coordinately modulate the turgor pressure, which enables the formation of the infection pegs needed to invade host tissues.
It has been reported that the upstream transcription factors may regulate DHN melanin biosynthesis [16]. The results of the current study show that the expression of the transcription factor gene Crf1 was upregulated at 12 h (mature appressorium stage) in the WT strain, but downregulated in the ΔCgCmr1 and ΔCgPks1 mutants. The transcription factors downstream of cAMP–PKA (e.g., Crf1) can regulate multiple metabolic pathways in M. oryzae, which may affect appressorium formation. The silencing of Crf1 will delay the transfer and transformation of lipids and carbon materials in the appressorium, resulting in a decrease in the turgor pressure and the abnormal formation of infection pegs [24]. The transcription factor Crf1 has a basic helix–loop–helix domain. In M. oryzae, the deletion or mutation of Crf1 may lead to the defective use of lipids, glycerol, arabinose, and other substances, some of which are involved in lipolysis, as well as the downregulated expression of genes associated with oxidation, glucose metabolism, gluconeogenesis, and glycerol metabolism, which decreases the turgor pressure in the adherent cells [25]. Hence, we speculate that the silencing of melanin synthesis genes may inhibit intracellular signaling and decrease the expression of specific genes, including CgCrf1, resulting in lipolysis. Moreover, the expression levels of important genes contributing to oxidation, glucose metabolism, gluconeogenesis, and glycerol metabolism were downregulated, which affected the appressorium turgor pressure.
The infection of poplar by C. gloeosporioides and the infection of rice by the rice blast fungus involve a similar process. In both cases, conidia germinate and produce a bud tube and appressorium. However, because of the differences in physiological structures and the growth environment at the leaf surface of woody and herbaceous plants, the formation of a mature rice blast fungus appressorium (turgor pressure of approximately 8 MPa) following the germination of conidia requires 24 h [26,27,28], whereas only 12 h is needed for the formation of the mature C. gloeosporioides appressorium (turgor pressure of approximately 13 MPa). The change in the turgor pressure during appressorium formation is primarily due to the regulated metabolism of specific materials. Accordingly, during the development of a mature appressorium, there are dynamic changes to metabolic products in the cell. Although the overall process mediating the formation of different types of appressorium may be similar, there are also specific differences. For example, there is a clear species-specificity in the compounds involved in the swelling of the appressorium. The rapid swelling of the C. gloeosporioides appressorium may be related to a particular molecular mechanism regulating the formation of turgor pressure via the metabolism of compounds in C. gloeosporioides cells adhering to the host, suggestive of the co-evolution of C. gloeosporioides and its host [29].
In conclusion, the findings of our study show that the DHN melanin biosynthesis pathway may play an important role in the appressorium turgor pressure generation of C. gloeosporioides. Meanwhile, the melanin synthesis-related genes and fatty acid metabolism pathway genes may also contribute to the regulation of turgor pressure in the mature C. gloeosporioides appressorium, which may provide the foundation for future research conducted to verify the functions of C. gloeosporioides genes encoding proteins modulating the turgor pressure in developing appressoria prior to the invasion of poplar tissues.

4. Materials and Methods

4.1. Materials

The wild-type (WT) C. gloeosporioides strain CFCC80308 used in this study was isolated from Populus × beijingensis in Beijing, China. The ΔCgCmr1 and ΔCgPks1 mutants were generated in a previous study [16]. All of the strains were cultured on potato dextrose agar (PDA, Oxoid, UK) medium in plates at 25 °C.

4.2. Determination of the Turgor Pressure in WT, ΔCgCmr1, and ΔCgPks1 Appressoria at Different Time Points

The conidia of the WT and mutant strains were harvested from 5-day-old cultures growing on PDA medium in plates and then washed three times in sterile water. The conidia were maintained on the artificial hydrophobic surface of the GelBond membrane (LONZA, Basel, Switzerland) at 25 °C in darkness to induce appressorium formation. To promote germination, the conidia were diluted in sterile water (2 × 10⁵ conidia/mL) on the artificial hydrophobic surface of the GelBond membrane. The GelBond membrane surface was scraped using a cell shovel at 3, 5, 7, and 12 h for the examination using a light microscope. The analysis was performed using different PEG-2000 concentrations. Specifically, the GelBond membrane containing conidia was transferred to a glass slide, after which the water was removed and PEG-2000 solutions at different concentrations were added dropwise. Each treatment was repeated five times. After 10 min, statistical counts were performed using the light microscope. The osmotic pressure of the solution that caused 50% of the appressoria to collapse was recorded as the estimated value for the appressorium.

4.3. Total RNA Isolation and cDNA Synthesis

The samples were collected from the GelBond membrane surface at 0 h (conidia) and 12 h (mature appressorium). They were immediately frozen in liquid nitrogen and then stored at −80 °C. The total RNA was extracted from the treated C. gloeosporioides samples (see previous section) using the TRIzol reagent (Invitrogen, Carlsbad, CA, USA) according to the manufacturer’s instructions. The RNA integrity (minimum RNA integrity number of 8) was confirmed using the Agilent 2100 Bioanalyzer (Agilent, Mainz, Germany). At least 3 μg total RNA was obtained from each sample. For the transcriptome analysis, samples were prepared using reagents from an Illumina TruSeqTM RNA sample preparation Kit (San Diego, CA, USA) following the manufacturer’s instructions. Briefly, mRNA was purified from the total RNA samples using oligo-(dT) magnetic beads and then fragmented into short sequences in a fragmentation buffer. The obtained mRNA fragments were used as the template to synthesize the first and second cDNA strands, which were synthesized using a SuperScript double-stranded cDNA synthesis kit (Invitrogen, Carlsbad, CA, USA) with random hexamer primers (Illumina, San Diego, CA, USA). The cDNA was purified using AMPure XP beads. Synthesized cDNAs were subjected to end-repair, phosphorylation, and “A” base addition according to Illumina’s library construction protocol. This was followed by a PCR amplification to complete the construction of the sequencing library. A quantitative real-time polymerase chain reaction (qRT-PCR) analysis was performed to accurately quantify the effective concentration of the library and to ensure its quality was sufficient for sequencing.

4.4. Sequencing and Assembly of the C. gloeosporioides Transcriptome

Three replicates were prepared for each sample (six cDNA libraries) and the average data for the raw reads were recorded. The six cDNA libraries were sequenced using the Illumina HiSeq 2000 platform at the Beijing Genome Institute (Shenzhen, China). The retained reads were aligned to the C. gloeosporioides genome to identify new genes. In addition, the retained reads were aligned to the reference transcriptome and the gene expression was stratified and indexed using the Hierarchical Indexing for Spliced Alignment of Transcripts 2 (HISAT2) software (v.2.0.4) [30]. StringTie was used to analyze the data (reads with a mapping quality greater than 30) [31], resulting in a standardized count for each gene (expressed in terms of fragments per kilobase per million mapped fragments). Raw Illumina reads were trimmed and filtered to remove low-quality reads using Trimmomatic (v.0.33). The filtered reads were aligned to the reference genome using TopHat (v.2.0.13). The Htseq-count function of HTSeq (v.0.6.1) was used to calculate the gene counts. Because the Htseq-count excluded the mapped reads generated by TopHat with more than one reported alignment, only the unique mapped reads were used for the downstream analysis. The differentially expressed genes (DEGs) among the samples were identified on the basis of negative binomial distribution using the DESeq R package (1.10.1) [32]. The resulting p-values were adjusted according to the Benjamini–Hochberg method and then set (adjusted p < 0.05) as the threshold for detecting significant differences in expression [33]. Translated transcript sequences were used as queries for the Blastx (http://blast.ncbi.nlm.nih.gov/Blast.cgi, accessed on 13 October 2022) search of the nonredundant (nr), Swiss-Prot, and Kyoto Encyclopedia of Genes and Genomes (KEGG) protein databases to identify functionally annotated proteins with the most similar sequences. The nr annotations, Gene Ontology (GO) annotations, and functional classification of the transcripts were determined using Blast2GO [34,35] and WEGO [36]. Pearson’s correlation coefficient was used to evaluate the correlations between the transcripts and each GO term and KEGG biological pathway for the three transcriptomes.

4.5. Identification of Enriched GO Terms and KEGG Pathways

The hypergeometric test was used to identify the significantly enriched GO terms in the target gene groups (compared with the control) [37,38]. The following formula was used to assess significance: p = 1 i = 0 m 1 M i N M n i N n , where N is the number of all of the genes annotated with a GO term, n is the number of DEGs in N, M is the number of genes that are annotated with a specific GO term, and m is the number of DEGs in M. The threshold for identifying significantly enriched GO terms was p < 0.005. In addition, to identify the enriched KEGG pathways, the hypergeometric test was used in a similar manner to determine the relative coverage of the annotated KEGG orthologous groups of pathways in the background. The threshold for identifying significantly enriched pathways was p < 0.005 [39].

4.6. Quantitative Real-Time PCR

Equal amounts of each RNA sample were used for the qRT-PCR and transcriptome sequencing analyses. The primer pairs (Supplementary Table S1) for the candidate genes were designed using Primer Premier 6.0. The total RNA was reverse transcribed using the Hifair® II 1st Strand cDNA Synthesis SuperMix for qPCR (with gDNA digester plus) (Yeasen Biotechnology, Shanghai, China). The qRT-PCR analysis was performed using the CFX Connect Real-Time PCR instrument (Bio-Rad, Berkeley, CA, USA) and the Hieff UNICON® Universal Blue qPCR SYBR Green Master Mix (Yeasen Biotechnology). The PCR program was as follows: 95 °C for 60 s, 40 cycles of 95 °C for 15 s, and 60 °C for 35 s. Relative gene expression levels were calculated according to the 2−ΔΔCt method [40].

4.7. Statistical Analysis

All of the experiments were independently performed three times with each treatment replicated five times. The qRT-PCR analysis of each sample was replicated three times. Data were analyzed using SPSS 17.0 (SPSS Inc., Chicago, IL, USA) and Origin 8.0 (OriginLab, Northampton, MA, USA). A one-way analysis of variance (t-test) was completed to determine the significance of any differences among the treatments (p < 0.05).

Supplementary Materials

The following supporting information can be downloaded at: https://www.mdpi.com/article/10.3390/ijms24087411/s1.

Author Contributions

Experimental design: F.M. Experimental implementation: X.Q. Material contribution: C.T. Data analysis and manuscript writing: X.Q. and F.M. All authors have read and agreed to the published version of the manuscript.

Funding

The present research was funded by the National Natural Science Foundation of China (32201564) and the Beijing Undergraduate Training Programs for Innovation and Entrepreneurship (S202110022014).

Institutional Review Board Statement

Not applicable.

Informed Consent Statement

Not applicable.

Data Availability Statement

Data are contained within the article or Supplementary Material.

Conflicts of Interest

The authors declare no conflict of interest.

References

  1. Li, X.; Sun, H.; Pei, J.; Dong, Y.; Wang, F.; Chen, H.; Sun, Y.; Wang, N.; Li, H.; Li, Y. De novo sequencing and comparative analysis of the blueberry transcriptome to discover putative genes related to antioxidants. Gene 2012, 511, 54–61. [Google Scholar] [CrossRef]
  2. Wang, M.; Zhou, Z.; Wu, J.; Ji, Z.; Zhang, J. Comparative transcriptome analysis reveals significant differences in gene expression between appressoria and hyphae in Colletotrichum gloeosporioides. Gene 2018, 670, 63–69. [Google Scholar] [CrossRef] [PubMed]
  3. Wu, J.; Ji, Z.; Wang, N.; Chi, F.; Xu, C.; Zhou, Z.; Zhang, J. Identification of conidiogenesis-associated genes in Colletotrichum gloeosporioides by Agrobacterium tumefaciens-mediated transformation. Curr. Microbiol. 2016, 73, 802–810. [Google Scholar] [CrossRef] [PubMed]
  4. Barhoom, S.; Sharon, A. cAMP regulation of “pathogenic” and “saprophytic” fungal spore germination. Fungal Genet. Biol. 2004, 41, 317–326. [Google Scholar] [CrossRef] [PubMed]
  5. Pereira, I.S.; Abreu, M.S.; Alves, E.; Ferreira, J.B. Histopathological studies of the interaction Colletotrichum gloeosporioides: Coffee tree. Bragantia 2009, 68, 117–123. [Google Scholar] [CrossRef]
  6. Zhang, X.; Zhang, J.; He, H.; Wang, X.; Tian, C. Histopathology study of poplar leaves infected by Colletotrichum gloeosporioides. J. Beijing For. Univ. 2018, 40, 101–109. [Google Scholar]
  7. Lin, F.C. Cell biology of appressorium formation of Magnapothe grisea. Acta Phytopathol. Sin. 2001, 2, 97–101. [Google Scholar]
  8. Wang, Z.Y.; Jenkinson, J.M.; Holcombe, L.J.; Soanes, D.M.; Veneault-Fourrey, C.; Bhambra, G.K.; Talbot, N.J. The molecular biology of appressorium turgor generation by the rice blast fungus Magnaporthe grisea. Biochem. Soc. Trans. 2005, 33, 384–388. [Google Scholar] [CrossRef]
  9. Ryder, L.S.; Talbot, N.J. Regulation of appressorium development in pathogenic fungi. Curr. Opin. Plant Biol. 2015, 26, 8–13. [Google Scholar] [CrossRef]
  10. He, P.H.Z.; Wang, Y.L.; Wang, X.L.; Zhang, X.; Tian, C. The mitogen-activated protein kinase CgMK1 governs appressorium formation, melanin synthesis, and plant infection of Colletotrichum gloeosporioides. Front. Microbiol. 2017, 8, 2216. [Google Scholar] [CrossRef]
  11. Wang, K.; Wang, W.; Zheng, F. Advance research on appressorium of Colletotrichum. Chin. Agric. Sci. Bull. 2007, 1, 265–270. [Google Scholar]
  12. Fang, Y.L.; Xia, L.M.; Wang, P.; Zhu, L.-H.; Ye, J.-R.; Huang, L. The MAPKKK CgMck1 is required for cell wall integrity, appressorium development, and pathogenicity in Colletotrichum gloeosporioides. Genes 2018, 9, 543. [Google Scholar] [CrossRef] [PubMed]
  13. Wang, P.; Li, B.; Pan, Y.T.; Zhang, Y.Z.; Li, D.W.; Huang, L. Calcineurin-responsive transcription factor CgCrzA is required for cell wall integrity and infection-related morphogenesis in Colletotrichum gloeosporioides. Plant Pathol. J. 2020, 36, 385–397. [Google Scholar] [CrossRef] [PubMed]
  14. Liu, N.; Meng, F.L.; Tian, C.M. Transcriptional network in Colletotrichum gloeosporioides mutants lacking Msb2 or Msb2 and Sho1. J. Fungi 2022, 8, 207. [Google Scholar] [CrossRef]
  15. Li, Y.F.; He, P.H.Z.; Tian, C.M.; Wang, Y. CgHog1 controls the adaptation to both sorbitol and fludioxonil in Colletotrichum gloeosporioides. Fungal Genet. Biol. 2020, 135, 103289. [Google Scholar] [CrossRef]
  16. Wang, X.L.; Lu, D.X.; Tian, C.M. Analysis of melanin biosynthesis in the plant pathogenic fungus Colletotrichum gloeosporioides. Fungal Biol. 2021, 125, 679–692. [Google Scholar] [CrossRef]
  17. Henson, J.M.; Butler, M.J.; Day, A.W. The dark side of the mycelium: Melanins of phytopathogenic fungi. Annu. Rev. Phytopathol. 1999, 37, 447–471. [Google Scholar] [CrossRef]
  18. Zhang, T.; Zhang, B.; Hua, C.; Meng, P.; Wang, S.; Chen, Z.; Du, Y.; Gao, F.; Huang, J. VdPKS1 is required for melanin formation and virulence in a cotton wilt pathogen Verticillium dahliae. Sci. China Life Sci. 2017, 60, 868–879. [Google Scholar] [CrossRef]
  19. Schumacher, J. DHN melanin biosynthesis in the plant pathogenic fungus Botrytis cinerea is based on two developmentally regulated key enzyme (PKS)-encoding genes. Mol. Microbiol. 2016, 99, 729–748. [Google Scholar] [CrossRef]
  20. Scindiya, M.; Malathi, P.; Kaverinathan, K.; Sundar, A.R.; Viswanathan, R. RNA-mediated silencing of PKS1 gene in Colletotrichum falcatum causing red rot in sugarcane. Eur. J. Plant Pathol. 2019, 153, 371–384. [Google Scholar] [CrossRef]
  21. Takano, Y.; Kubo, Y.; Shimizu, K.; Mise, K.; Okuno, T.; Furusawa, I. Structural analysis of PKS1, a polyketide synthase gene involved in melanin biosynthesis in Colletotrichum lagenarium. Mol. Gen. Genet. 1995, 249, 162–167. [Google Scholar] [CrossRef] [PubMed]
  22. Tsuji, G.; Kenmochi, Y.; Takano, Y.; Sweigard, J.; Farrall, L.; Furusawa, I.; Horino, O.; Kubo, Y. Novel fungal transcriptional activators, Cmr1p of Colletotrichum lagenarium and Pig1p of Magnaporthe grisea, contain Cys2His2 zinc finger and Zn (II) 2Cys6 binuclear cluster DNA-binding motifs and regulate transcription of melanin biosynthesis genes in a developmentally specific manner. Mol. Microbiol. 2000, 38, 940–954. [Google Scholar]
  23. Wang, Y.; Hu, X.; Fang, Y.; Anchieta, A.; Goldman, P.H.; Hernandez, G.; Klosterman, S.J. Transcription factor VdCmr1 is required for pigment production, protection from UV irradiation, and regulates expression of melanin biosynthetic genes in Verticillium dahliae. Microbiology 2018, 164, 685. [Google Scholar] [CrossRef] [PubMed]
  24. Nishimura, M.; Fukada, J.; Moriwaki, A.; Fujikawa, T.; Ohashi, M.; Hibi, T.; Hayashi, N. Mstu1, an APSES transcription factor, is required for appressorium-mediated infection in Magnaporthe grisea. Biosci. Biotechnol. Biochem. 2009, 73, 1779–1786. [Google Scholar] [CrossRef]
  25. Cao, H.J.; Huang, P.Y.; Yan, Y.X.; Shi, Y.; Dong, B.; Liu, X.; Ye, L.; Lin, F.; Lu, J. The basic helix-loop-helix transcription factor Crf1 is required for development and pathogenicity of the rice blast fungus by regulating carbohydrate and lipid metabolism. Environ. Microbiol. 2018, 20, 3427–3441. [Google Scholar] [CrossRef] [PubMed]
  26. Thines, E.; Weber, R.W.; Talbot, N.J. MAP kinase and protein kinase A-dependent mobilization of triacylglycerol and glycogen during appressorium turgor generation by Magnaporthe grisea. Plant Cell 2000, 12, 1703–1718. [Google Scholar]
  27. Wilson, R.; Talbot, N. Under pressure: Investigating the biology of plant infection by Magnaporthe oryzae. Nat. Rev. Microbiol. 2009, 7, 185–195. [Google Scholar] [CrossRef]
  28. Liu, X.H.; Liang, S.; Wei, Y.Y.; Zhu, X.M.; Li, L.; Liu, P.P.; Zheng, Q.X.; Zhou, H.N.; Zhang, Y.; Mao, L.J.; et al. Metabolomics analysis identifies sphingolipids as key signaling moieties in appressorium morphogenesis and function in Magnaporthe oryzae. mBio 2019, 10, e01467-19. [Google Scholar] [CrossRef]
  29. Ferreira, R.B.; Monteiro, S.; Freitas, R.; Santos, C.N.; Chen, Z.; Batista, L.M.; Duarte, J.; Borges, A.; Teixeira, A.R. Fungal pathogens: The battle for plant infection. Crit. Rev. Plant Sci. 2006, 25, 505–524. [Google Scholar] [CrossRef]
  30. Kim, D.; Langmead, B.; Salzberg, S.L. HISAT: A fast spliced aligner with low memory requirements. Nat. Methods 2015, 12, 357–360. [Google Scholar] [CrossRef]
  31. Pertea, M.; Pertea, G.M.; Antonescu, C.M.; Chang, T.C.; Mendell, J.T.; Salzberg, S.L. StringTie enables improved reconstruction of a transcriptome from RNA-seq reads. Nat. Biotechnol. 2015, 33, 290–295. [Google Scholar] [CrossRef]
  32. Wang, L.; Feng, Z.; Wang, X.; Wang, X.; Zhang, X. DEGseq: An R package for identifying differentially expressed genes from RNA-seq data. Bioinformatics 2010, 26, 136–138. [Google Scholar] [CrossRef] [PubMed]
  33. Storey, J.D.; Tibshirani, R. Statistical significance for genomewide studies. Proc. Natl. Acad. Sci. USA 2003, 100, 9440–9445. [Google Scholar] [CrossRef] [PubMed]
  34. Conesa, A.; Götz, S. Blast2GO: A comprehensive suite for functional analysis in plant genomics. Int. J. Plant Genom. 2008, 2008, 619832. [Google Scholar] [CrossRef] [PubMed]
  35. Conesa, A.; Götz, S.; García-Gómez, J.M.; Terol, J.; Talón, M.; Robles, M. Blast2GO: A universal tool for annotation, visualization and analysis in functional genomics research. Bioinformatics 2005, 21, 3674–3676. [Google Scholar] [CrossRef]
  36. Ye, J.; Fang, L.; Zheng, H.; Zhang, Y.; Chen, J.; Zhang, Z.; Wang, J.; Li, S.; Li, R.; Bolund, L.; et al. WEGO: A web tool for plotting GO annotations. Nucleic Acids Res. 2006, 34, 293–297. [Google Scholar] [CrossRef]
  37. Su, Y.L.; Li, J.M.; Li, M.; Luan, J.B.; Ye, X.D.; Wang, X.W.; Liu, S.S. Transcriptomic analysis of the salivary glands of an invasive whitefly. PLoS ONE 2012, 7, e39303. [Google Scholar] [CrossRef]
  38. Yin, Y.; Martin, J.; Abubucker, S.; Scott, A.L.; McCarter, J.P.; Wilson, R.K.; Jasmer, D.P.; Mitreva, M. Intestinal transcriptomes of nematodes: Comparison of the parasites Ascaris suum and Haemonchus contortus with the free-living Caenorhabditis elegans. PLoS Negl. Trop. Dis. 2008, 2, e269. [Google Scholar] [CrossRef]
  39. Li, Z.; Liang, Y.M.; Tian, C.M. Characterization of the causal agent of poplar anthracnose occurring in the Beijing region. Mycotax 2012, 120, 277–286. [Google Scholar] [CrossRef]
  40. Livak, K.J.; Schmittgen, T.D. Analysis of relative gene expression data using real-time quantitative PCR and the 2−ΔΔCT method. Methods 2001, 25, 402–408. [Google Scholar] [CrossRef]
Figure 1. Morphological characteristics of the Colletotrichum gloeosporioides appressorium on a hydrophobic surface at different time points (scale = 10 μm).
Ijms 24 07411 g001
Figure 2. Appressorium turgor pressure for the wild-type (WT) control (A) and ΔCgCmr1 (B) and ΔCgPks1 (C) mutants at different time points.
Ijms 24 07411 g002
Figure 3. Relative expression of CgCmr1 (A) and CgPks1 (B) in the wild-type control at different time points. * Significant differences among time points as determined by the t-test (p < 0.05).
Ijms 24 07411 g003
Figure 4. Number of DEGs in the CgWT12h sample. Red and green indicate upregulated and downregulated expression, respectively.
Ijms 24 07411 g004
Figure 5. GO term annotation of the DEGs in the CgWT12h transcriptome. The DEGs in the CgWT12h sample were assigned GO terms from the following three main categories: cellular component (A), molecular function (B), and biological process (C).
Ijms 24 07411 g005
Figure 6. Results of the qRT-PCR analysis performed to validate key candidate DEGs in the wild-type (WT) control and ΔCgCmr1 and ΔCgPks1 mutants at 0 and 12 h. The qRT-PCR data represent the mean of three replicates. Bars indicate the standard error. Different letters indicate significant differences among treatments, as determined by Duncan’s test (p < 0.05).
Ijms 24 07411 g006
Table 1. Quality of the sequencing data for the CgWT0h and CgWT12h samples. Note: CgWT0h, C. gloeosporioides wild-type conidia; CgWT12h, C. gloeosporioides wild-type mature appressorium.
SampleData (bp)Clean ReadsQ30 (%)Total Mapping (%)Uniquely Mapping (%)
CgWT0h7,534,480,29225,188,44794.4691.7691.38
CgWT12h6,803,953,38822,770,08294.8193.1192.85
Table 2. Upregulated and downregulated C. gloeosporioides genes between the conidia and mature appressorium.
ConditionIDlog2FCp-ValueAnnoation
CgWT0h-CgWT12h-upEVM00075826.39318.68 × 10−7Fum1, highly reducing polyketide synthase
EVM00020715.35598.20 × 10−5Acyl-CoA-binding protein
EVM00078915.23859.51 × 10−5AtmM, FAD-dependent monooxygenase
EVM00016285.18971.13 × 10−4Asl1, alkali-sensitive linkage protein
EVM00118454.84212.75 × 10−4FadD13, long-chain-fatty-acid-CoA ligase
EVM00015484.49049.39 × 10−4ApdG, acyl-CoA dehydrogenase
EVM00111864.44687.35 × 10−4Nrk1, nicotinamide riboside kinase
EVM00055204.33418.93 × 10−4Fkr-3, FK506-binding protein
EVM00012824.19991.41 × 10−34-hydroxy-2-oxoglutarate aldolase
EVM00064814.04812.77 × 10−3Multifunctional cytochrome P450 monooxygenase
CgWT0h-CgWT12h-downEVM00082575.68602.04 × 10−5PelA, pectate trisaccharide-lyase
EVM00089995.09291.84 × 10−4Presilphiperfolan-8-beta-ol synthase
EVM00015674.56561.06 × 10−3DIT1, spore wall maturation protein
EVM00092874.44081.40 × 10−3Nmral1, NmrA-like family domain-containing protein
EVM00077864.41651.33 × 10−3Sodium transport ATPase 5
EVM00059784.33151.66 × 10−3Xyn1, endo-1,4-beta-xylanase
EVM00064984.29921.67 × 10−3SDH-4, L-sorbose-1-dehydrogenase
EVM00132744.28951.75 × 10−3Transporter
EVM00018003.84925.65 × 10−3Sulfoquinovose-1-dehydrogenase
EVM00111573.84575.28 × 10−3Multicopper oxidase
Table 3. Top 10 enriched KEGG pathways among the DEGs in the CgWT12h sample.
KEGG (KO) TermNo. Genes
Carbon metabolism201
Biosynthesis of amino acids198
Tryptophan metabolism153
Glycine, serine and threonine metabolism138
Fatty acid metabolism130
Phenylpropanoid biosynthesis126
Tyrosine metabolism121
Arginine and proline metabolism111
Glycerophospholipid metabolism99
Carotenoid biosynthesis96
Disclaimer/Publisher’s Note: The statements, opinions and data contained in all publications are solely those of the individual author(s) and contributor(s) and not of MDPI and/or the editor(s). MDPI and/or the editor(s) disclaim responsibility for any injury to people or property resulting from any ideas, methods, instructions or products referred to in the content.

