
Tff3−/− Knock-Out Mice with Altered Lipid Metabolism Exhibit a Lower Level of Inflammation following the Dietary Intake of Sodium Chloride for One Week

 ,
,  , , ,
, , ,  and
and
Abstract
1. Introduction
2. Results
2.1. Influence of High-Salt Diet on Inflammatory Markers in Tff3 Knock-Out Mice and Their Wild-Type Control, C57BL/6N Mice
2.2. Influence of High-Salt Diet on the Rates of CD25 and γδTCR-Expressing T Cells in Tff3 Knock-Out Mice and Their WT Control, C57BL/6N Mice
2.3. Influence of a High-Salt Diet on LFA-1 and VLA-4 Expressions on Peripheral Blood Leukocytes and/or Mesenteric Lymph Nodes in Tff3 Knock-Out Mice and Their Wild-Type Control, C57BL/6N Mice
2.4. Genotype and Treatment Interaction Analysis
3. Discussion
4. Materials and Methods
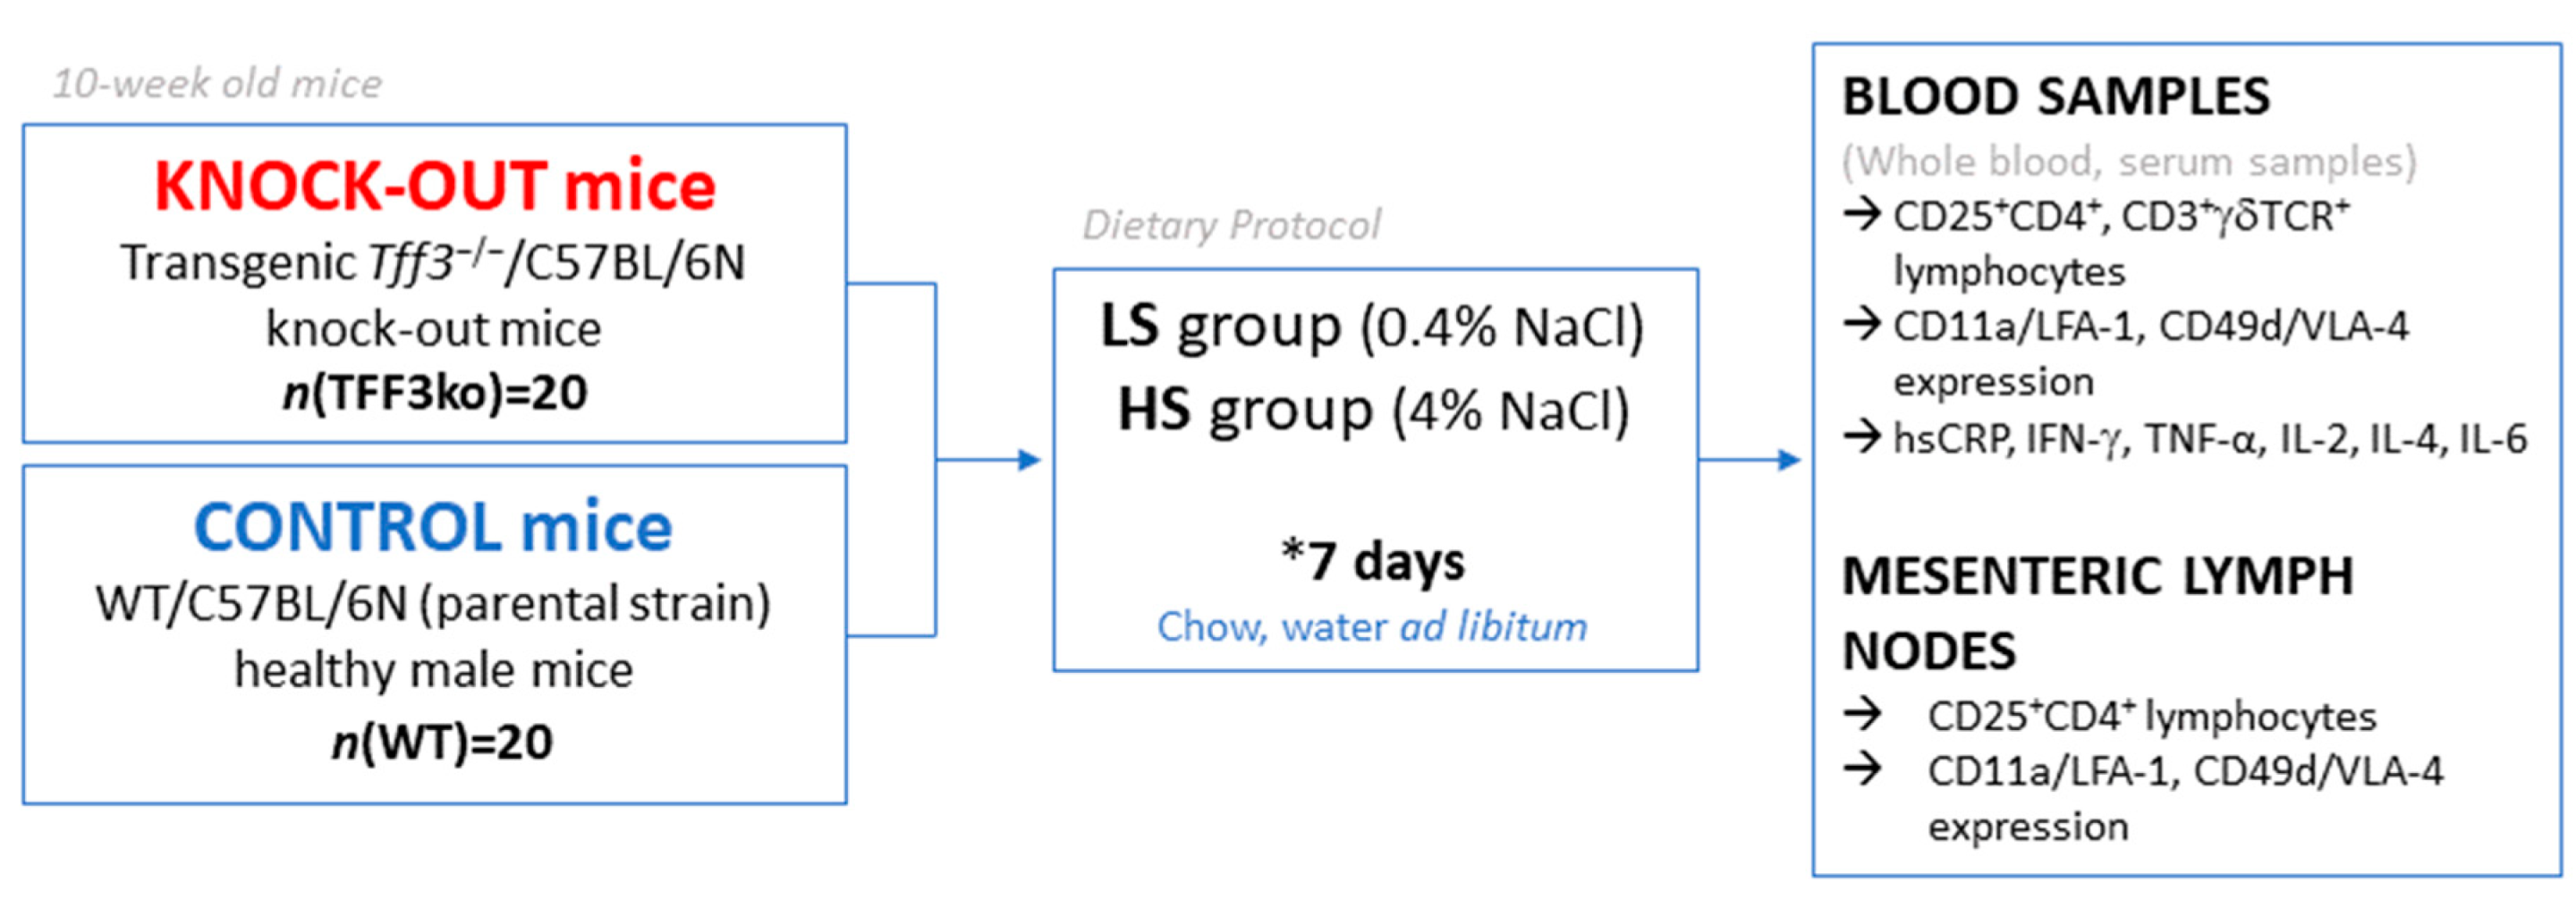
4.1. Dietary Protocols
4.2. Sampling and Isolation
4.3. Assay of Protein Concentration in Serum
4.4. Flow Cytometry
4.5. Statistical Analysis
5. Conclusions
Author Contributions
Funding
Institutional Review Board Statement
Informed Consent Statement
Data Availability Statement
Conflicts of Interest
References
- Nishimuta, M.; Kodama, N.; Yoshitake, Y.; Shimada, M.; Serizawa, N. Dietary Salt (Sodium Chloride) Requirement and Adverse Effects of Salt Restriction in Humans. J. Nutr. Sci. Vitaminol. 2018, 64, 83–89. [Google Scholar] [CrossRef] [PubMed]
- World Health Organization. World Health Organization Guideline: Sodium Intake for Adults and Children; World Health Organization: Geneva, Switzerland, 2012. [Google Scholar]
- World Health Organization. 2018 Healthy Diet, Factsheet No 394; World Health Organization: Geneva, Switzerland, 2018. [Google Scholar]
- Aguiar, S.L.F.; Miranda, M.C.G.; Guimarães, M.A.F.; Santiago, H.C.; Queiroz, C.P.; Cunha, P.d.S.; Cara, D.C.; Foureaux, G.; Ferreira, A.J.; Cardoso, V.N.; et al. High-Salt Diet Induces IL-17-Dependent Gut Inflammation and Exacerbates Colitis in Mice. Front. Immunol. 2018, 8, 1969. [Google Scholar] [CrossRef]
- Mihalj, M.; Matić, A.; Mihaljević, Z.; Barić, L.; Stupin, A.; Drenjančević, I. Short-Term High-NaCl Dietary Intake Changes Leukocyte Expression of VLA-4, LFA-1, and Mac-1 Integrins in Both Healthy Humans and Sprague-Dawley Rats: A Comparative Study. Mediat. Inflamm. 2019, 2019, e6715275. [Google Scholar] [CrossRef] [PubMed]
- Heras-Garvin, A.; Refolo, V.; Reindl, M.; Wenning, G.K.; Stefanova, N. High-salt diet does not boost neuroinflammation and neurodegeneration in a model of α-synucleinopathy. J. Neuroinflammation 2020, 17, 35. [Google Scholar] [CrossRef] [PubMed]
- Balan, Y.; Packirisamy, R.M.; Mohanraj, P.S. High dietary salt intake activates inflammatory cascades via Th17 immune cells: Impact on health and diseases. Arch. Med. Sci. 2020, 18, 459. [Google Scholar] [CrossRef] [PubMed]
- Cappuccio, F.P. Cardiovascular and other effects of salt consumption. Kidney Int. Suppl. 2013, 3, 312–315. [Google Scholar] [CrossRef] [PubMed]
- Drenjančević-Perić, I.; Jelaković, B.; Lombard, J.H.; Kunert, M.P.; Kibel, A.; Gros, M. High-Salt Diet and Hypertension: Focus on the Renin-Angiotensin System. Kidney Blood Press. Res. 2011, 34, 1–11. [Google Scholar] [CrossRef] [PubMed]
- Teixeira, D.E.; Peruchetti, D.B.; Souza, M.C.; das Graças Henriques, M.G.; Pinheiro, A.A.S.; Caruso-Neves, C. A high salt diet induces tubular damage associated with a pro-inflammatory and pro-fibrotic response in a hypertension-independent manner. Biochim. Biophys. Acta Mol. Basis Dis. 2020, 1866, 165907. [Google Scholar] [CrossRef] [PubMed]
- Zhu, H.; Pollock, N.K.; Kotak, I.; Gutin, B.; Wang, X.; Bhagatwala, J.; Parikh, S.; Harshfield, G.A.; Dong, Y. Dietary Sodium, Adiposity, and Inflammation in Healthy Adolescents. Pediatrics 2014, 133, e635–e642. [Google Scholar] [CrossRef]
- Afsar, B.; Kuwabara, M.; Ortiz, A.; Yerlikaya, A.; Siriopol, D.; Covic, A.; Rodriguez-Iturbe, B.; Johnson, R.J.; Kanbay, M. Salt Intake and Immunity. Hypertension 2018, 72, 19–23. [Google Scholar] [CrossRef]
- Singh, P.; Stephenson, R.; Castillo, A.; Majid, D.S.A. High-salt intake reduces renal tissue levels of inflammatory cytokines in mice. Physiol. Rep 2020, 8, e14621. [Google Scholar] [CrossRef] [PubMed]
- Matic, A.; Jukic, I.; Mihaljevic, Z.; Kolobaric, N.; Stupin, A.; Kozina, N.; Bujak, I.T.; Kibel, A.; Lombard, J.H.; Drenjancevic, I. Low-dose angiotensin II supplementation restores flow-induced dilation mechanisms in cerebral arteries of Sprague-Dawley rats on a high salt diet. J. Hypertens. 2022, 40, 441. [Google Scholar] [CrossRef]
- Barić, L.; Drenjančević, I.; Matić, A.; Stupin, M.; Kolar, L.; Mihaljević, Z.; Lenasi, H.; Šerić, V.; Stupin, A. Seven-Day Salt Loading Impairs Microvascular Endothelium-Dependent Vasodilation without Changes in Blood Pressure, Body Composition and Fluid Status in Healthy Young Humans. Kidney Blood Press. Res. 2019, 44, 835–847. [Google Scholar] [CrossRef] [PubMed]
- Cosic, A.; Jukic, I.; Stupin, A.; Mihalj, M.; Mihaljevic, Z.; Novak, S.; Vukovic, R.; Drenjancevic, I. Attenuated flow-induced dilatation of middle cerebral arteries is related to increased vascular oxidative stress in rats on a short-term high salt diet. J. Physiol. 2016, 594, 4917–4931. [Google Scholar] [CrossRef] [PubMed]
- Matic, A.; Jukic, I.; Stupin, A.; Baric, L.; Mihaljevic, Z.; Unfirer, S.; Tartaro Bujak, I.; Mihaljevic, B.; Lombard, J.H.; Drenjancevic, I. High salt intake shifts the mechanisms of flow-induced dilation in the middle cerebral arteries of Sprague-Dawley rats. Am. J. Physiol. Heart Circ. Physiol. 2018, 315, H718–H730. [Google Scholar] [CrossRef]
- Springer, T.A. Adhesion receptors of the immune system. Nature 1990, 346, 425–434. [Google Scholar] [CrossRef]
- Huo, Y.; Ley, K. Adhesion molecules and atherogenesis. Acta Physiol. Scand. 2001, 173, 35–43. [Google Scholar] [CrossRef] [PubMed]
- Blankenberg, S.; Barbaux, S.; Tiret, L. Adhesion molecules and atherosclerosis. Atherosclerosis 2003, 170, 191–203. [Google Scholar] [CrossRef]
- Galkina, E.; Ley, K. Vascular Adhesion Molecules in Atherosclerosis. Arterioscler. Thromb. Vasc. Biol. 2007, 27, 2292–2301. [Google Scholar] [CrossRef]
- O’Brien, K.D.; Allen, M.D.; McDonald, T.O.; Chait, A.; Harlan, J.M.; Fishbein, D.; McCarty, J.; Ferguson, M.; Hudkins, K.; Benjamin, C.D. Vascular cell adhesion molecule-1 is expressed in human coronary atherosclerotic plaques. Implications for the mode of progression of advanced coronary atherosclerosis. J. Clin. Investig. 1993, 92, 945–951. [Google Scholar] [CrossRef] [PubMed]
- Nakai, K.; Itoh, C.; Kawazoe, K.; Miura, Y.; Sotoyanagi, H.; Hotta, K.; Itoh, T.; Kamata, J.; Hiramori, K. Concentration of soluble vascular cell adhesion molecule-1 (VCAM-1) correlated with expression of VCAM-1 mRNA in the human atherosclerotic aorta. Coron. Artery Dis. 1995, 6, 497–502. [Google Scholar] [PubMed]
- Nakashima, Y.; Raines, E.W.; Plump, A.S.; Breslow, J.L.; Ross, R. Upregulation of VCAM-1 and ICAM-1 at atherosclerosis-prone sites on the endothelium in the ApoE-deficient mouse. Arterioscler. Thromb. Vasc. Biol. 1998, 18, 842–851. [Google Scholar] [CrossRef] [PubMed]
- Cybulsky, M.I.; Iiyama, K.; Li, H.; Zhu, S.; Chen, M.; Iiyama, M.; Davis, V.; Gutierrez-Ramos, J.C.; Connelly, P.W.; Milstone, D.S. A major role for VCAM-1, but not ICAM-1, in early atherosclerosis. J. Clin. Investig. 2001, 107, 1255–1262. [Google Scholar] [CrossRef]
- Finney, A.C.; Stokes, K.Y.; Pattillo, C.B.; Orr, A.W. Integrin Signaling in Atherosclerosis. Cell. Mol. Life Sci. 2017, 74, 2263–2282. [Google Scholar] [CrossRef]
- Anderson, M.E.; Siahaan, T.J. Targeting ICAM-1/LFA-1 interaction for controlling autoimmune diseases: Designing peptide and small molecule inhibitors. Peptides 2003, 24, 487–501. [Google Scholar] [CrossRef] [PubMed]
- Kerr, J.R. Cell adhesion molecules in the pathogenesis of and host defence against microbial infection. Mol. Pathol. 1999, 52, 220–230. [Google Scholar] [CrossRef] [PubMed][Green Version]
- Foster, C.A. VCAM-1/α4-integrin adhesion pathway: Therapeutic target for allergic inflammatory disorders. J. Allergy Clin. Immunol. 1996, 98, S270–S277. [Google Scholar] [CrossRef] [PubMed]
- Mondino, A.; Khoruts, A.; Jenkins, M.K. The anatomy of T-cell activation and tolerance. Proc. Natl. Acad. Sci. USA 1996, 93, 2245–2252. [Google Scholar] [CrossRef]
- Kozina, N.; Mihaljević, Z.; Lončar, M.B.; Mihalj, M.; Mišir, M.; Radmilović, M.D.; Justić, H.; Gajović, S.; Šešelja, K.; Bazina, I.; et al. Impact of High Salt Diet on Cerebral Vascular Function and Stroke in Tff3-/-/C57BL/6N Knockout and WT (C57BL/6N) Control Mice. Int. J. Mol. Sci. 2019, 20, 5188. [Google Scholar] [CrossRef] [PubMed]
- Bujak, M.; Bujak, I.T.; Sobočanec, S.; Mihalj, M.; Novak, S.; Ćosić, A.; Levak, M.T.; Kopačin, V.; Mihaljević, B.; Balog, T.; et al. Trefoil Factor 3 Deficiency Affects Liver Lipid Metabolism. Cell. Physiol. Biochem. 2018, 47, 827–841. [Google Scholar] [CrossRef]
- Aihara, E.; Engevik, K.A.; Montrose, M.H. Trefoil Factor Peptides and Gastrointestinal Function. Annu. Rev. Physiol. 2017, 79, 357–380. [Google Scholar] [CrossRef] [PubMed]
- Lin, N.; Xu, L.-F.; Sun, M. The protective effect of trefoil factor 3 on the intestinal tight junction barrier is mediated by toll-like receptor 2 via a PI3K/Akt dependent mechanism. Biochem. Biophys. Res. Commun. 2013, 440, 143–149. [Google Scholar] [CrossRef] [PubMed]
- Hoffmann, W. Trefoil Factor Family (TFF) Peptides and Their Links to Inflammation: A Re-evaluation and New Medical Perspectives. Int. J. Mol. Sci. 2021, 22, 4909. [Google Scholar] [CrossRef] [PubMed]
- Yang, Y.; Lin, Z.; Lin, Q.; Bei, W.; Guo, J. Pathological and therapeutic roles of bioactive peptide trefoil factor 3 in diverse diseases: Recent progress and perspective. Cell Death Dis. 2022, 13, 30. [Google Scholar] [CrossRef]
- Dimitrova-Yurukova, D.; Boyanov, N. Trefoil Factor 3—A Potential Inflammatory Marker in Ulcerative Colitis. Clin. Res. Immunol. 2019, 2, 1–3. [Google Scholar]
- Nakov, R.; Velikova, T.; Nakov, V.; Gerova, V.; Tankova, L. Trefoil Factor 3 is Highly Predictive of Complete Mucosal Healing Independently and in Combination with C-Reactive Protein in Patients with Ulcerative Colitis. J. Gastrointest. Liver Dis. 2019, 28, 169–174. [Google Scholar] [CrossRef]
- Nozaki, I.; Lunz, J.G.; Specht, S.; Park, J.-I.; Giraud, A.S.; Murase, N.; Demetris, A.J. Regulation and Function of Trefoil Factor Family 3 Expression in the Biliary Tree. Am. J. Pathol. 2004, 165, 1907–1920. [Google Scholar] [CrossRef]
- Grivennikov, S.; Karin, E.; Terzic, J.; Mucida, D.; Yu, G.-Y.; Vallabhapurapu, S.; Scheller, J.; Rose-John, S.; Cheroutre, H.; Eckmann, L.; et al. IL-6 and Stat3 Are Required for Survival of Intestinal Epithelial Cells and Development of Colitis-Associated Cancer. Cancer Cell 2009, 15, 103–113. [Google Scholar] [CrossRef] [PubMed]
- Šešelja, K.; Bazina, I.; Vrecl, M.; Welss, J.; Schicht, M.; Mihalj, M.; Kopačin, V.; Paulsen, F.; Pirman, T.; Baus Lončar, M. Tff3 Deficiency Protects against Hepatic Fat Accumulation after Prolonged High-Fat Diet. Life 2022, 12, 1288. [Google Scholar] [CrossRef]
- McHugh, R.S.; Whitters, M.J.; Piccirillo, C.A.; Young, D.A.; Shevach, E.M.; Collins, M.; Byrne, M.C. CD4+CD25+ Immunoregulatory T Cells: Gene Expression Analysis Reveals a Functional Role for the Glucocorticoid-Induced TNF Receptor. Immunity 2002, 16, 311–323. [Google Scholar] [CrossRef] [PubMed]
- Ng, W.F.; Duggan, P.J.; Ponchel, F.; Matarese, G.; Lombardi, G.; Edwards, A.D.; Isaacs, J.D.; Lechler, R.I. Human CD4+CD25+ cells: A naturally occurring population of regulatory T cells. Blood 2001, 98, 2736–2744. [Google Scholar] [CrossRef]
- Wo, J.; Zhang, F.; Li, Z.; Sun, C.; Zhang, W.; Sun, G. The Role of Gamma-Delta T Cells in Diseases of the Central Nervous System. Front. Immunol. 2020, 11, 580304. [Google Scholar] [CrossRef] [PubMed]
- Zhao, Y.; Niu, C.; Cui, J. Gamma-delta (γδ) T cells: Friend or foe in cancer development? J. Transl. Med. 2018, 16, 3. [Google Scholar] [CrossRef]
- Fu, T.; Znalesniak, E.B.; Kalinski, T.; Möhle, L.; Biswas, A.; Salm, F.; Dunay, I.R.; Hoffmann, W. TFF Peptides Play a Role in the Immune Response Following Oral Infection of Mice with Toxoplasma Gondii. Eur. J. Microbiol. Immunol. 2015, 5, 221–231. [Google Scholar] [CrossRef] [PubMed]
- Blanchard, C.; Durual, S.; Estienne, M.; Bouzakri, K.; Heim, M.H.; Blin, N.; Cuber, J.-C. IL-4 and IL-13 up-regulate intestinal trefoil factor expression: Requirement for STAT6 and de novo protein synthesis. J. Immunol. 2004, 172, 3775–3783. [Google Scholar] [CrossRef]
- Dossinger, V.; Kayademir, T.; Blin, N.; Gött, P. Down-regulation of TFF expression in gastrointestinal cell lines by cytokines and nuclear factors. Cell. Physiol. Biochem. 2002, 12, 197–206. [Google Scholar] [CrossRef]
- Loncar, M.B.; Al-azzeh, E.; Sommer, P.S.M.; Marinovic, M.; Schmehl, K.; Kruschewski, M.; Blin, N.; Stohwasser, R.; Gött, P.; Kayademir, T. Tumour necrosis factor α and nuclear factor κB inhibit transcription of human TFF3 encoding a gastrointestinal healing peptide. Gut 2003, 52, 1297–1303. [Google Scholar] [CrossRef] [PubMed]
- Shi, L.; Zhou, P.-H.; Xi, J.-L.; Yu, H.-G.; Zhang, B.-H. Recombinant Human Trefoil Factor 3 Ameliorates Bowel Injury: Its Anti-Inflammatory Effect on Experimental Necrotizing Enterocolitis. Int. J. Pept. 2014, 2014, 634135. [Google Scholar] [CrossRef]
- Thiam, A.R.; Farese, R.V.; Walther, T.C. The Biophysics and Cell Biology of Lipid Droplets. Nat. Rev. Mol. Cell Biol. 2013, 14, 775–786. [Google Scholar] [CrossRef]
- Deng, Z.; Wang, Y.; Zhou, L.; Shan, Y.; Tan, S.; Cai, W.; Liao, S.; Peng, L.; Lu, Z. High salt-induced activation and expression of inflammatory cytokines in cultured astrocytes. Cell Cycle 2017, 16, 785–794. [Google Scholar] [CrossRef]
- Jiang, E.; Chapp, A.D.; Fan, Y.; Larson, R.A.; Hahka, T.; Huber, M.J.; Yan, J.; Chen, Q.-H.; Shan, Z. Expression of Proinflammatory Cytokines Is Upregulated in the Hypothalamic Paraventricular Nucleus of Dahl Salt-Sensitive Hypertensive Rats. Front. Physiol. 2018, 9, 104. [Google Scholar] [CrossRef]
- Dalekos, G.N.; Elisaf, M.S.; Papagalanis, N.; Tzallas, C.; Siamopoulos, K.C. Elevated interleukin-1 beta in the circulation of patients with essential hypertension before any drug therapy: A pilot study. Eur. J. Clin. Investig. 1996, 26, 936–939. [Google Scholar] [CrossRef]
- Liu, Y.; Liu, T.; McCarron, R.M.; Spatz, M.; Feuerstein, G.; Hallenbeck, J.M.; Sirén, A.L. Evidence for activation of endothelium and monocytes in hypertensive rats. Am. J. Physiol. 1996, 270, H2125–H2131. [Google Scholar] [CrossRef]
- Kang, Y.-M.; Ma, Y.; Zheng, J.-P.; Elks, C.; Sriramula, S.; Yang, Z.-M.; Francis, J. Brain nuclear factor-kappa B activation contributes to neurohumoral excitation in angiotensin II-induced hypertension. Cardiovasc. Res. 2009, 82, 503–512. [Google Scholar] [CrossRef]
- Waki, H.; Gouraud, S.S.; Maeda, M.; Paton, J.F.R. Gene expression profiles of major cytokines in the nucleus tractus solitarii of the spontaneously hypertensive rat. Auton. Neurosci. 2008, 142, 40–44. [Google Scholar] [CrossRef] [PubMed]
- Monteleone, I.; Marafini, I.; Dinallo, V.; Di Fusco, D.; Troncone, E.; Zorzi, F.; Laudisi, F.; Monteleone, G. Sodium chloride-enriched Diet Enhanced Inflammatory Cytokine Production and Exacerbated Experimental Colitis in Mice. J. Crohn’s Colitis 2017, 11, 237–245. [Google Scholar] [CrossRef]
- Takahashi, H.; Nakagawa, S.; Wu, Y.; Kawabata, Y.; Numabe, A.; Yanagi, Y.; Tamaki, Y.; Uehara, Y.; Araie, M. A high-salt diet enhances leukocyte adhesion in association with kidney injury in young Dahl salt-sensitive rats. Hypertens. Res. 2017, 40, 912–920. [Google Scholar] [CrossRef] [PubMed]
- Waki, H.; Liu, B.; Miyake, M.; Katahira, K.; Murphy, D.; Kasparov, S.; Paton, J.F.R. Junctional Adhesion Molecule-1 Is Upregulated in Spontaneously Hypertensive Rats. Hypertension 2007, 49, 1321–1327. [Google Scholar] [CrossRef] [PubMed]
- Komatsu, S.; Panés, J.; Russell, J.M.; Anderson, D.C.; Muzykantov, V.R.; Miyasaka, M.; Granger, D.N. Effects of chronic arterial hypertension on constitutive and induced intercellular adhesion molecule-1 expression in vivo. Hypertension 1997, 29, 683–689. [Google Scholar] [CrossRef]
- Yilmaz, R.; Akoglu, H.; Altun, B.; Yildirim, T.; Arici, M.; Erdem, Y. Dietary salt intake is related to inflammation and albuminuria in primary hypertensive patients. Eur. J. Clin. Nutr. 2012, 66, 1214–1218. [Google Scholar] [CrossRef]
- Fekadu, J.; Modlich, U.; Bader, P.; Bakhtiar, S. Understanding the Role of LFA-1 in Leukocyte Adhesion Deficiency Type I (LAD I): Moving towards Inflammation? Int. J. Mol. Sci. 2022, 23, 3578. [Google Scholar] [CrossRef] [PubMed]
- Tokat, B.; Kurt, O.; Bugra, Z.; Ozturk, O.; Yilmaz-Aydogan, H. Investigation of the monocyte diapedesis-related LFA-1 and JAM-A gene variants in Turkish coronary heart disease patients. Meta Gene 2014, 2, 1–10. [Google Scholar] [CrossRef]
- Chigaev, A.; Sklar, L. Aspects of VLA-4 and LFA-1 regulation that may contribute to rolling and firm adhesion. Front. Immunol. 2012, 3, 242. [Google Scholar] [CrossRef]
- Evans, B.J.; McDowall, A.; Taylor, P.C.; Hogg, N.; Haskard, D.O.; Landis, R.C. Shedding of lymphocyte function–associated antigen-1 (LFA-1) in a human inflammatory response. Blood 2006, 107, 3593–3599. [Google Scholar] [CrossRef] [PubMed]
- Yusuf-Makagiansar, H.; Anderson, M.E.; Yakovleva, T.V.; Murray, J.S.; Siahaan, T.J. Inhibition of LFA-1/ICAM-1 and VLA-4/VCAM-1 as a therapeutic approach to inflammation and autoimmune diseases. Med. Res. Rev. 2002, 22, 146–167. [Google Scholar] [CrossRef]
- Tadzic, R.; Mihalj, M.; Vcev, A.; Ennen, J.; Tadzic, A.; Drenjancevic, I. The effects of arterial blood pressure reduction on endocan and soluble endothelial cell adhesion molecules (CAMs) and CAMs ligands expression in hypertensive patients on Ca-channel blocker therapy. Kidney Blood Press. Res. 2013, 37, 103–115. [Google Scholar] [CrossRef]
- Barreiro, O.; Sánchez-Madrid, F. Molecular Basis of Leukocyte-Endothelium Interactions During the Inflammatory Response. Rev. Esp. Cardiol. 2009, 62, 552–562. [Google Scholar] [CrossRef]
- Kolobarić, N.; Drenjančević, I.; Matić, A.; Šušnjara, P.; Mihaljević, Z.; Mihalj, M. Dietary Intake of n-3 PUFA-Enriched Hen Eggs Changes Inflammatory Markers’ Concentration and Treg/Th17 Cells Distribution in Blood of Young Healthy Adults—A Randomised Study. Nutrients 2021, 13, 1851. [Google Scholar] [CrossRef]
- Knezović, A.; Kolobarić, N.; Drenjančević, I.; Mihaljević, Z.; Šušnjara, P.; Jukić, I.; Stupin, M.; Kibel, A.; Marczi, S.; Mihalj, M.; et al. Role of Oxidative Stress in Vascular Low-Grade Inflammation Initiation Due to Acute Salt Loading in Young Healthy Individuals. Antioxidants 2022, 11, 444. [Google Scholar] [CrossRef] [PubMed]
- Mai, J.; Wang, H.; Yang#, X.-F. T Helper 17 Cells Interplay with CD4+CD25highFoxp3+ Tregs in Regulation of Inflammations and Autoimmune Diseases. Front. Biosci. 2010, 15, 986–1006. [Google Scholar] [CrossRef]
- Qin, J.; Zhou, J.; Fan, C.; Zhao, N.; Liu, Y.; Wang, S.; Cui, X.; Huang, M.; Guan, H.; Li, Y.; et al. Increased Circulating Th17 but Decreased CD4+Foxp3+ Treg and CD19+CD1dhiCD5+ Breg Subsets in New-Onset Graves’ Disease. Biomed. Res. Int. 2017, 2017, 8431838. [Google Scholar] [CrossRef] [PubMed]
- McCarthy, N.E.; Eberl, M. Human γδ T-Cell Control of Mucosal Immunity and Inflammation. Front. Immunol. 2018, 9, 985. [Google Scholar] [CrossRef] [PubMed]
- Xuekun, H.; Qintai, Y.; Yulian, C.; Gehua, Z. Correlation of gammadelta-T-cells, Th17 cells and IL-17 in peripheral blood of patients with allergic rhinitis. Asian Pac. J. Allergy Immunol. 2014, 32, 235–239. [Google Scholar]
- Malik, S.; Want, M.Y.; Awasthi, A. The Emerging Roles of Gamma–Delta T Cells in Tissue Inflammation in Experimental Autoimmune Encephalomyelitis. Front. Immunol. 2016, 7, 14. [Google Scholar] [CrossRef] [PubMed]
- Wenstedt, E.F.E.; Remmerswaal, E.B.M.; van der Bom-Baylon, N.D.; Schrooten, E.M.; Bemelman, F.J.; Vogt, L. The effect of high-salt diet on t-lymphocyte subpopulations in healthy males—A pilot study. J. Clin. Hypertens. 2020, 22, 2152–2155. [Google Scholar] [CrossRef] [PubMed]


| Expression | Rates (%) of Expressing Cells | Group (Genotype; Treatment) | Significance Level (p < 0.05) | |||||
|---|---|---|---|---|---|---|---|---|
| WT LS | WT HS | TFF3ko LS | TFF3ko HS | Genotype | Treatment | Genotype × Treatment | ||
| CD25 | CD4+CD25+ (MLN) | 7.94 ± 1.1 | 9.44 ± 0.9 | 13.7 ± 1.9 | 8.22 ± 3.4 | 0.05 * | 0.274 | 0.034 * |
| CD4+CD25+ | 5.71 ± 0.9 | 4.89 ± 1.7 | 5.11 ± 1.8 | 4.89 ± 2.45 | 0.794 | 0.577 | 0.362 | |
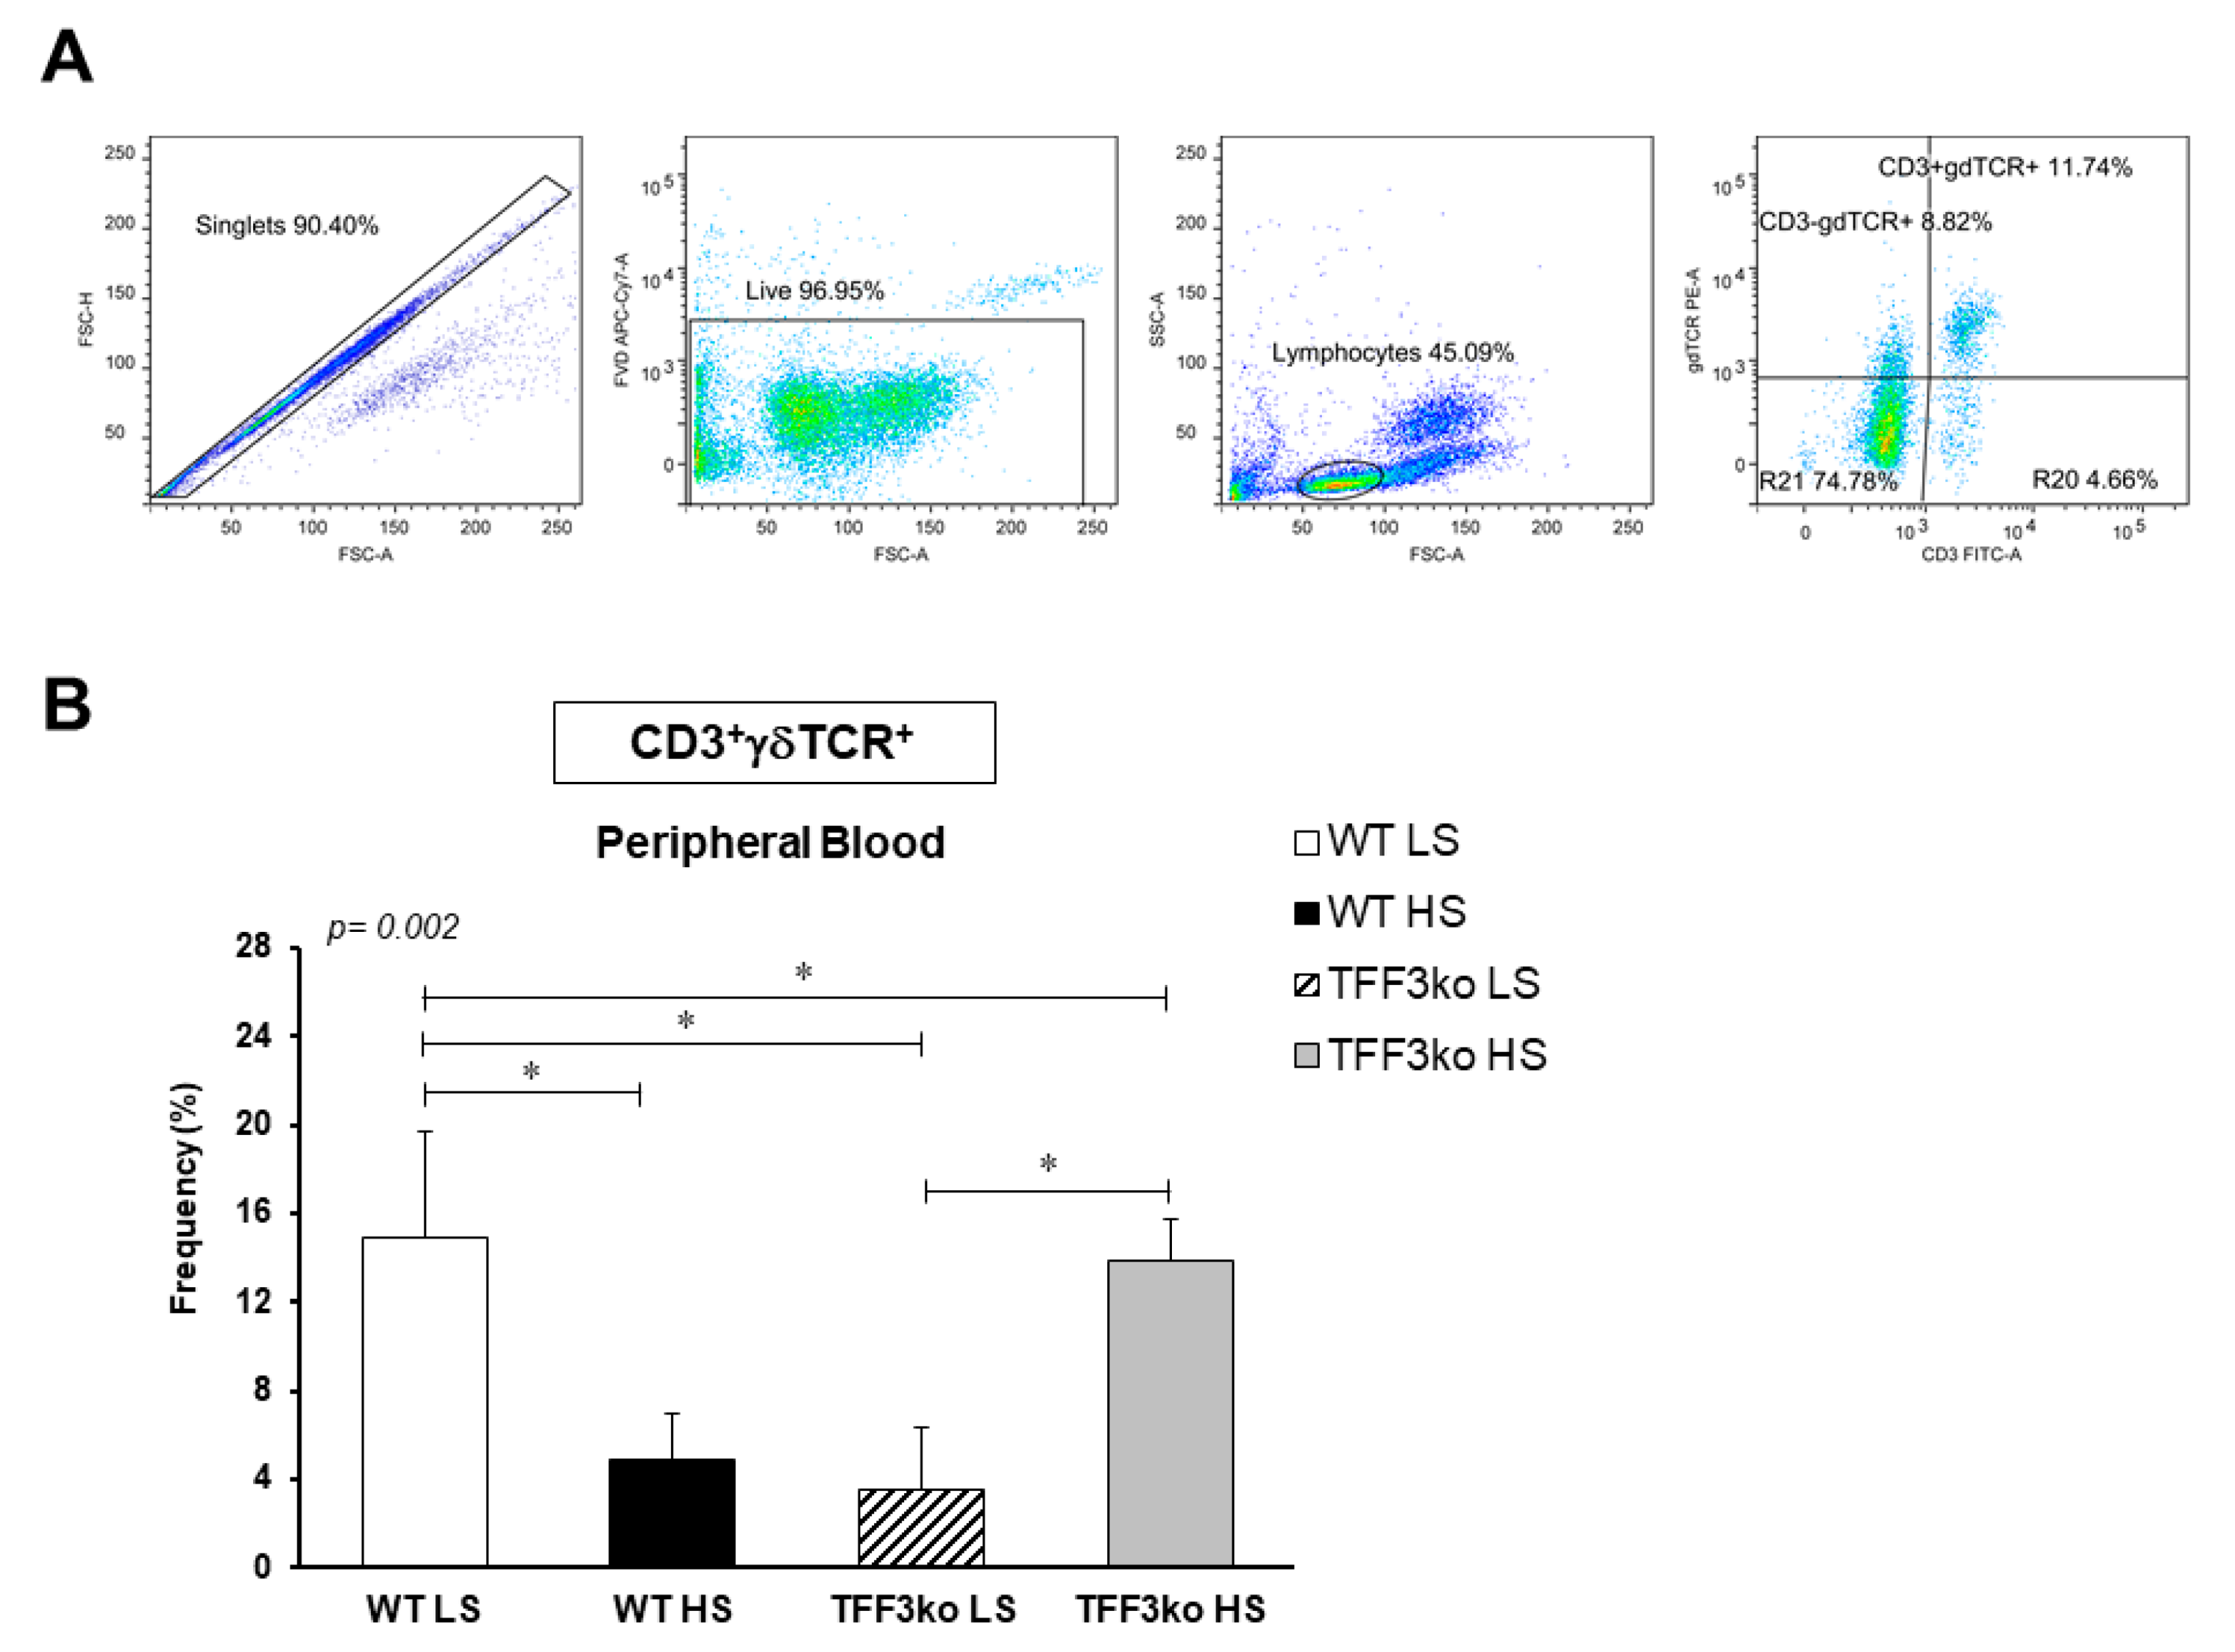
| γδ | CD3+γδTCR+ | 14.92 ± 4.8 | 4.9 ± 2 | 3.54 ± 2.8 | 13.89 ± 1.9 | 0.636 | 0.942 | 0.001 * |
| CD11a/LFA-1 | CD11a+ neutrophils | 1665.3 ± 415.4 | 2115.9 ± 257.3 | 1962.41 ± 252.9 | 2146.67 ± 260.6 | 0.229 | 0.152 | 0.297 |
| Ly6C+CD11a+ monocytes | 1614.58 ± 220.3 | 1689.23 ± 202.6 | 1618.23 ± 318.1 | 1970.6 ± 293.4 | 0.376 | 0.197 | 0.387 | |
| Ly6C−CD11ahigh monocytes | 5374.66 ± 91.2 | 5959.37 ± 258.5 | 6145.22 ± 246.4 | 5473.32 ± 685.5 | 0.529 | 0.846 | 0.019 * | |
| Ly6C−CD11aint monocytes | 1282.39 ± 29.9 | 1342.29 ± 66.4 | 1359.35 ± 37.7 | 1309.31 ± 138.3 | 0.648 | 0.918 | 0.270 | |
| CD11ahigh lymphocytes | 2682.85 ± 183.1 | 2815.28 ± 228.9 | 2714.47 ± 85.9 | 2814.10 ± 197.7 | 0.888 | 0.301 | 0.879 | |
| CD11aint lymphocytes | 581.20 ± 134.9 | 676.32 ± 210.1 | 578.63 ± 51.7 | 540.18 ± 81.7 | 0.396 | 0.723 | 0.413 | |
| CD11aint monocytes (MLN) | 1605.43 ± 18.7 | 1777.77± 148.4 | 1733.24 ± 31.3 | 1693.33 ± 94 | 0.909 | 0.379 | 0.033 * | |
| CD11ahigh monocytes (MLN) | 5269.45 ± 46.1 | 5389.06 ± 261.8 | 5502.09 ± 129.9 | 5407.61 ± 313.6 | 0.176 | 0.857 | 0.472 | |
| CD11a+ lymphocytes (MLN) | 1246.07 ± 43.4 | 1295.63 ± 93.1 | 1143.84 ± 122.9 | 1132.88 ± 116.4 | 0.05 * | 0.787 | 0.645 | |
| CD49d/VLA-4 | CD49d+ neutrophils | 2459.03 ± 320.2 | 1724.74 ± 193.4 | 2125.02 ± 539.5 | 1056.57 ± 125.5 | 0.032 * | 0.002 * | 0.412 |
| Ly6C−CD49+ monocytes | 3919.15 ± 942.8 | 3115.04 ± 483.9 | 2821.59 ±301.1 | 2135.75 ± 304.7 | 0.014 * | 0.05 * | 0.862 | |
| Ly6C+CD49+ monocytes | 3045.18 ± 122.2 | 2334.93 ± 397.7 | 2215.57 ±80.9 | 1390.12 ± 57.3 | <0.0001 * | 0.0003 * | 0.653 | |
| CD49+ lymphocytes | 4136.31 ± 675.2 | 1305.85 ± 418.3 | 1182.81 ± 381.8 | 783.42 ± 93.1 | 0.0001 * | 0.0002 * | 0.001 * | |
| CD49+ monocytes (MLN) | 2065.4 ± 227.3 | 2497.41 ± 278.6 | 2348.79 ± 878.9 | 2034.01 ± 841.2 | 0.803 | 0.878 | 0.273 | |
| CD49+ lymphocytes (MLN) | 1048.74 ± 161.6 | 1038.7 ± 104.3 | 1176.37 ± 266.9 | 1024.57 ± 279.9 | 0.609 | 0.468 | 0.524 | |
| Serum concentrations | C-reactive protein | 1079.75 ± 464.2 | 2305.84 ± 1052.4 | 1439.54 ± 390.9 | 1117.75 ± 342.3 | 0.074 | 0.05 * | 0.031 * |
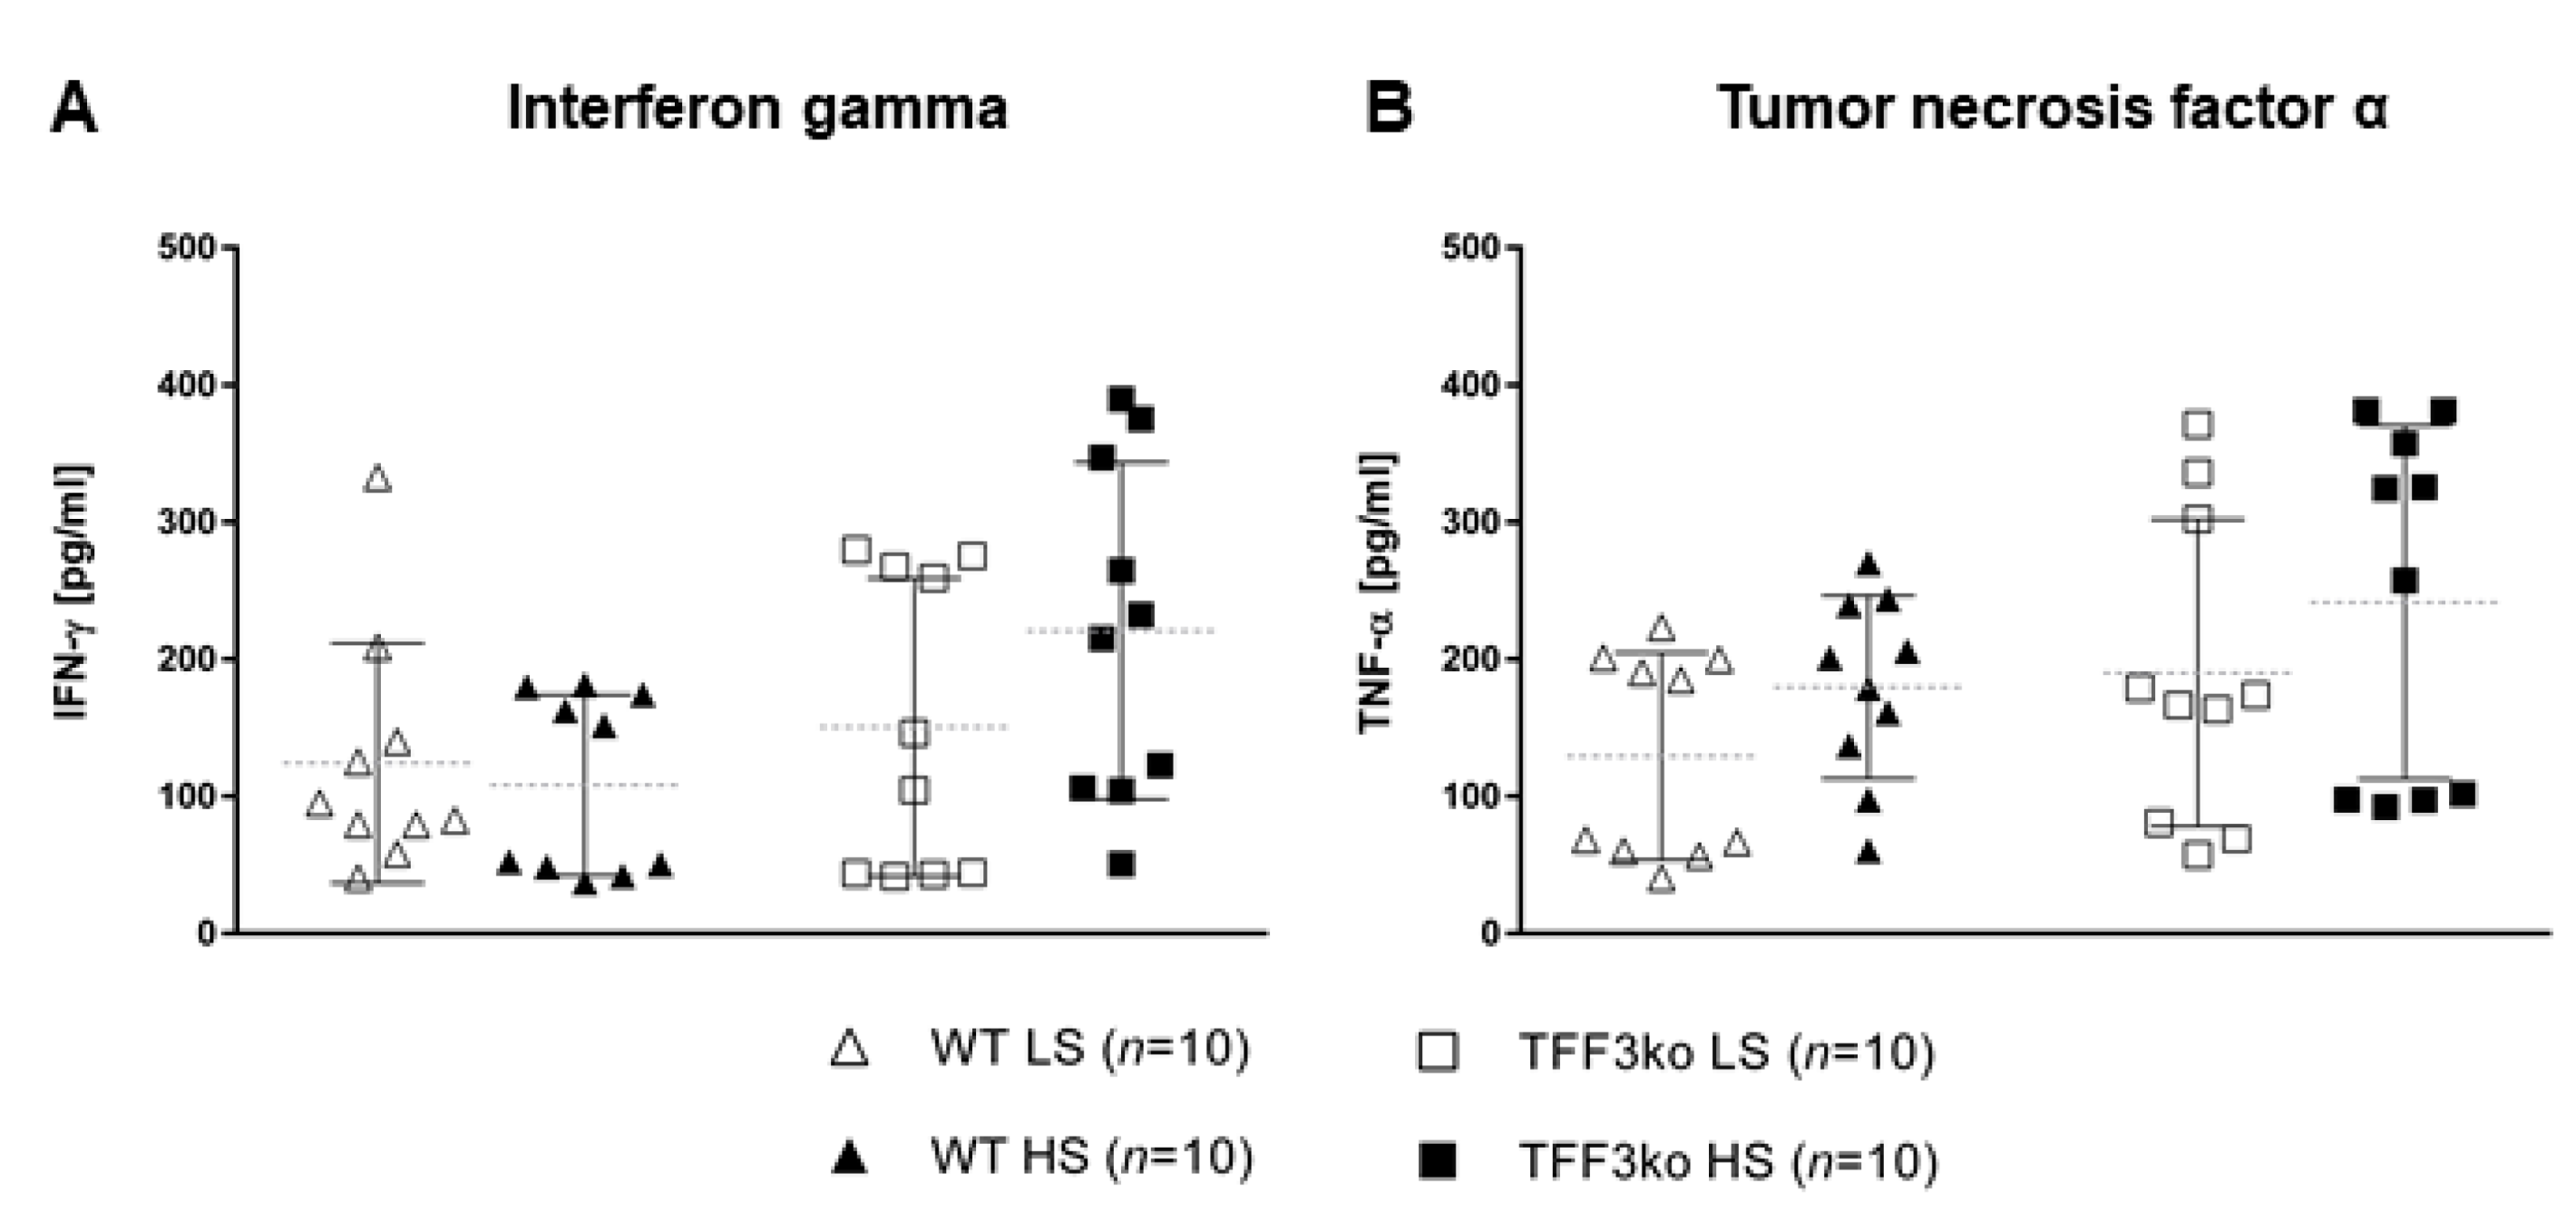
| Interferon gamma | 124.5 ± 87.5 | 108.2 ± 65.9 | 150.41 ± 108.5 | 220.70 ± 122.8 | 0.032 * | 0.389 | 0.175 | |
| Tumor necrosis factor alpha | 129.15 ± 75.5 | 179.59 ± 66.8 | 189.88 ± 111.8 | 241.53 ± 128.9 | 0.05 * | 0.112 | 0.985 | |
| Interleukin 2 | 112.55 ± 29.8 | 94.65 ± 36.4 | 157.29 ± 87.3 | 134.81 ± 53.3 | 0.022 * | 0.264 | 0.898 | |
| Interleukin 4 | 65.98 ± 46.1 | 94.17 ± 40.3 | 73.15 ± 51.4 | 63.95 ± 25.9 | 0.391 | 0.479 | 0.168 | |
| Interleukin 6 | 93.38 ±26.4 | 109.61 ± 22.3 | 150.03 ± 35.3 | 129.70 ± 28.3 | 0.0003 * | 0.616 | 0.088 | |
Disclaimer/Publisher’s Note: The statements, opinions and data contained in all publications are solely those of the individual author(s) and contributor(s) and not of MDPI and/or the editor(s). MDPI and/or the editor(s) disclaim responsibility for any injury to people or property resulting from any ideas, methods, instructions or products referred to in the content. |
© 2023 by the authors. Licensee MDPI, Basel, Switzerland. This article is an open access article distributed under the terms and conditions of the Creative Commons Attribution (CC BY) license (https://creativecommons.org/licenses/by/4.0/).
Share and Cite
Kolobarić, N.; Mihalj, M.; Kozina, N.; Matić, A.; Mihaljević, Z.; Jukić, I.; Drenjančević, I. Tff3−/− Knock-Out Mice with Altered Lipid Metabolism Exhibit a Lower Level of Inflammation following the Dietary Intake of Sodium Chloride for One Week. Int. J. Mol. Sci. 2023, 24, 7315. https://doi.org/10.3390/ijms24087315
Kolobarić N, Mihalj M, Kozina N, Matić A, Mihaljević Z, Jukić I, Drenjančević I. Tff3−/− Knock-Out Mice with Altered Lipid Metabolism Exhibit a Lower Level of Inflammation following the Dietary Intake of Sodium Chloride for One Week. International Journal of Molecular Sciences. 2023; 24(8):7315. https://doi.org/10.3390/ijms24087315
Chicago/Turabian StyleKolobarić, Nikolina, Martina Mihalj, Nataša Kozina, Anita Matić, Zrinka Mihaljević, Ivana Jukić, and Ines Drenjančević. 2023. "Tff3−/− Knock-Out Mice with Altered Lipid Metabolism Exhibit a Lower Level of Inflammation following the Dietary Intake of Sodium Chloride for One Week" International Journal of Molecular Sciences 24, no. 8: 7315. https://doi.org/10.3390/ijms24087315
APA StyleKolobarić, N., Mihalj, M., Kozina, N., Matić, A., Mihaljević, Z., Jukić, I., & Drenjančević, I. (2023). Tff3−/− Knock-Out Mice with Altered Lipid Metabolism Exhibit a Lower Level of Inflammation following the Dietary Intake of Sodium Chloride for One Week. International Journal of Molecular Sciences, 24(8), 7315. https://doi.org/10.3390/ijms24087315