Article

Secreted Amyloid Precursor Protein Alpha (sAPPα) Regulates the Cellular Proteome and Secretome of Mouse Primary Astrocytes

by
Katie Peppercorn
1,2,
Torsten Kleffmann
3,
Stephanie M. Hughes
1,2,4,† and
Warren P. Tate
1,2,*,†
1
Department of Biochemistry, School of Biomedical Sciences, Division of Health Sciences, University of Otago, Dunedin 9016, New Zealand
2
Brain Health Research Centre, University of Otago, Dunedin 9016, New Zealand
3
Research Infrastructure Centre, Division of Health Sciences, University of Otago, Dunedin 9016, New Zealand
4
Genetics Otago, University of Otago, Dunedin 9016, New Zealand
*
Author to whom correspondence should be addressed.
These authors contributed equally to this work.
Int. J. Mol. Sci. 2023, 24(8), 7165; https://doi.org/10.3390/ijms24087165
Submission received: 13 February 2023 / Revised: 23 March 2023 / Accepted: 6 April 2023 / Published: 12 April 2023

Abstract

:
Secreted amyloid precursor protein alpha (sAPPα), processed from a parent mammalian brain protein, amyloid precursor protein, can modulate learning and memory. Recently it has been shown to modulate the transcriptome and proteome of human neurons, including proteins with neurological functions. Here, we analysed whether the acute administration of sAPPα facilitated changes in the proteome and secretome of mouse primary astrocytes in culture. Astrocytes contribute to the neuronal processes of neurogenesis, synaptogenesis and synaptic plasticity. Cortical mouse astrocytes in culture were exposed to 1 nM sAPPα, and changes in both the whole-cell proteome (2 h) and the secretome (6 h) were identified with Sequential Window Acquisition of All Theoretical Fragment Ion Spectra–Mass Spectrometry (SWATH-MS). Differentially regulated proteins were identified in both the cellular proteome and secretome that are involved with neurologically related functions of the normal physiology of the brain and central nervous system. Groups of proteins have a relationship to APP and have roles in the modulation of cell morphology, vesicle dynamics and the myelin sheath. Some are related to pathways containing proteins whose genes have been previously implicated in Alzheimer’s disease (AD). The secretome is also enriched in proteins related to Insulin Growth Factor 2 (IGF2) signaling and the extracellular matrix (ECM). There is the promise that a more specific investigation of these proteins will help to understand the mechanisms of how sAPPα signaling affects memory formation.

1. Introduction

Astrocytes are a glial cell type essential to the proper functioning of the brain, contributing to neurogenesis, synaptogenesis [1], synaptic plasticity [2] and memory encoding [3]. Astrocytes can associate with many neurons and thereby thousands to millions of synapses [4,5,6], where they communicate with neurons bidirectionally [7]. Astrocytes can modulate neuronal function at the network level, where they are positioned to respond to neural network activity and impose a significant impact on that activity under both physiological and pathological conditions [8].
Astrocytes are morphologically plastic and able to transform shape quickly [9]. One of four morphologically distinct astrocytes, protoplasmic astrocytes [10], can enwrap fine processes called perisynaptic astrocytic processes (PAPs) around individual synapses, isolating them and preventing spillover of neurotransmitters to neighbouring synapses while providing essential biochemical support, enabling the modulation of synaptic transmission [11], cognition and information processing [2]. The PAP membrane contains glutamate transporters, which remove glutamate from the synaptic cleft to terminate transmission and the proteins required for releasing fast transmitters (e.g., glutamate, ATP, D-serine and GABA) [12].
Dysfunctional astrocytes have been linked to several neurological diseases, including Alzheimer’s disease (AD), Huntington’s disease, amyotrophic lateral sclerosis, epilepsy and stroke [13]. A reduction in astrocyte volume, surface area and morphological complexity has been observed in AD mouse models [14,15], and in human patients, this reduction correlates with increased dementia severity [16].
Astrocytes’ contribution to neuronal synaptogenesis [1] is achieved through the secretion of molecules, including proteins, into the extracellular milieu [17]. This comprises the cellular secretome, which is defined as the fraction of proteins, peptides and small molecules secreted from the cell. It includes growth factors, matricellular proteins, neurotransmitters, cytokines and chemokines and has been investigated in mice [18,19,20], rats [21] and humans [17]. Extracellular vesicles (EVs) derived from astrocytes are a key component of the secretome and contain molecules destined for specific target cells [22]. The contents of EVs are altered due to neurodegenerative disease [23].
Secreted Amyloid Precursor Protein Alpha (sAPPα) is a multifunctional protein with a predominant neural isoform, sAPPα695, also referred to as sAβPPα or APPsα. It is released into the extracellular space after the cleavage of the integral membrane parent protein Amyloid Precursor Protein (APP) by alpha secretase [24]. APP is a cell adhesion molecule [25] associated with synaptic plasticity [26], synapse formation and stability [27], and it is also essential for the normal development of the CNS [28]. sAPPα can restore the ability to form memories [29,30,31], and it prevents the development of memory defects in AD mouse models [32,33]. The electrophysiological model of learning, long-term potentiation (LTP), is modulated by sAPPα [26,30,31,32,34,35]. sAPPα promotes neurogenesis [36,37], neural cell proliferation [38] and can modulate dendritic spine density [39] and neurite outgrowth [40,41,42,43]. sAPPα also confers neuroprotection against hypoglycemia [44], amyloid beta (Aβ) toxicity [45] and glutamate toxicity [45].
Multiple receptors for sAPPα have been identified in neurons that are also expressed in astrocytes, including gamma-aminobutyric acid type B receptor subunit 1a (GABABR1a) [46,47], nicotinic a7-nACh receptors (a7-nAChRs) [39,48], sortilin [49,50], sorting-protein-related receptor A (SORLA) [51,52] and APP itself [53]. Nevertheless, no information concerning how sAPPα affects astrocytes is currently available.
A number of genes and proteins have been identified in rodent neurons that are regulated by sAPPα [54,55,56], and we recently determined how sAPPα affected the transcriptome and proteome of human glutamatergic neurons in culture [57]. Differentially regulated proteins include those encoded by AD risk genes, APP-processing-related proteins, proteins involved in synaptogenesis, neurotransmitter receptors, synaptic vesicle proteins and cytoskeletal proteins.
We hypothesised that sAPPα would regulate the neurological functions of the astrocyte via changes to its proteome. With the support that the astrocyte provides to the functions of the neuron, we further hypothesised that this regulation would include effects on the secretome of the astrocyte. Therefore, in the current study, we aimed to answer (i) whether sAPPα affects the molecular biology of the astrocyte, (ii) whether it changes the secretome as a consequence of changing the cellular proteome and (iii) whether any observed changes are related to neurological functions. We have shown that acute short-term exposure of mouse primary astrocytes to exogenous sAPPα695 resulted in significant changes in the proteins that are important for neurological function, both in the cellular proteome and, subsequently, in the secretome. Groups of proteins that show changes in both the proteome and secretome have a relationship to APP and have roles in cell morphology, vesicle dynamics and the myelin sheath. Some are in the Alzheimer’s disease KEGG pathway (mmu05010). This pathway includes the ‘risk genes’, for example, PSEN2, which predisposes to Alzheimer’s disease (AD) and that was identified in the dataset.

2. Results

2.1. Immunological Characterisation of the Cells

Immunocytochemistry confirmed that the primary cell cultures were highly enriched in astrocytes (Figure 1A–C) as the cells were positive for the astrocyte marker proteins of GFAP, s100b or both when tested together. Astrocytes with different morphological forms were present in the culture (Supplementary Figure S1), as might be expected in primary cells from mouse brains. Low-level microglial contamination was observed, with 8–10% of the nuclei from the four biological replicates staining positive for the microglial marker of CD68 (Figure 1D, white arrows). While this may have some influence on the proteome data, it was regarded as an acceptable level of contamination that would not undermine the validity of the analysis of astrocyte function. sAPPα can induce activation pathways in microglia [58]. In all images, the nuclei were stained with DAPI (blue).

2.2. Astrocyte Cellular Proteome Analysis after 2 h Exposure to Exogenous sAPPα

The proteome of the mouse primary astrocytes was analysed using Sequential Window Acquisition of all Theoretical Fragment Ion Spectra–Mass Spectrometry (SWATH-MS) following a 2 h incubation with sAPPα to identify proteins that were differentially regulated immediately in response to treatment.

2.2.1. The Spectral Library

The DDA (Data Dependent Acquisition) of the pre-fractionated pooled sample identified 6551 proteins and 154,232 peptides at a confidence interval of ≥99 and an FDR of q ≤ 0.01, which were integrated into the spectral library. After aligning the DIA data to the spectral library, 4256 proteins and 14,309 peptides were used for quantification based on an FDR for a peak matching of q ≤ 0.01 in at least one sample.

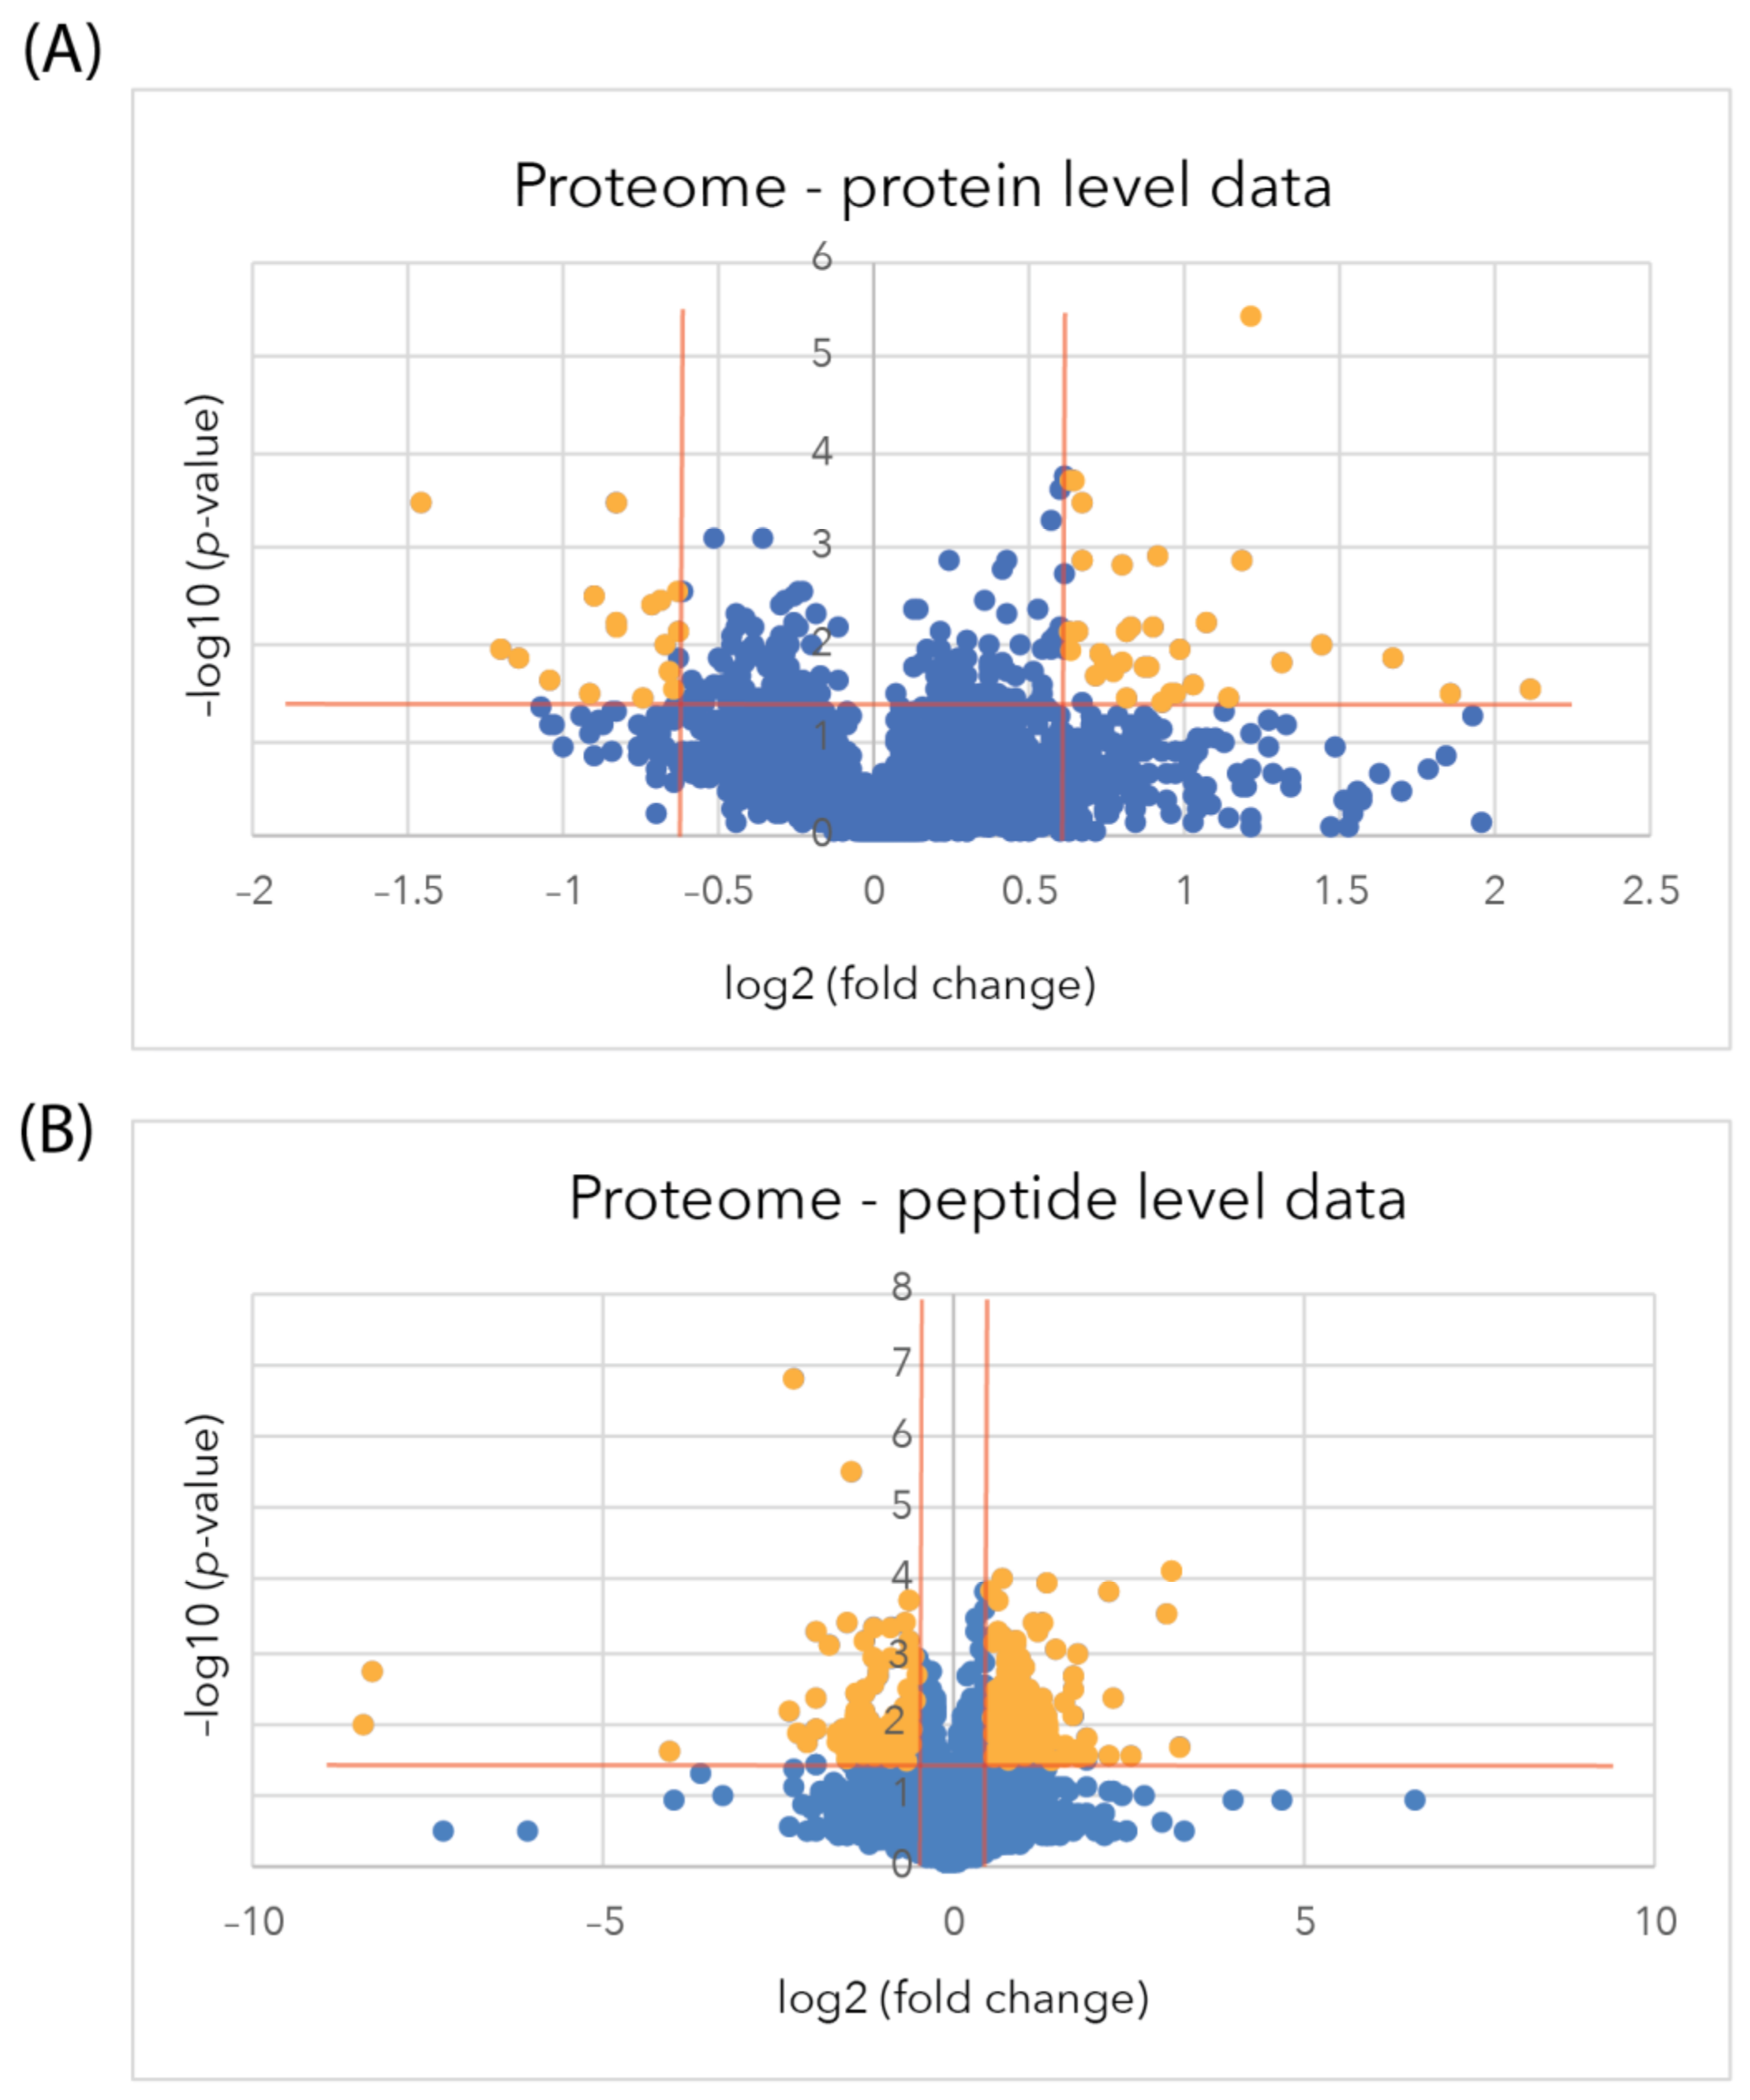
2.2.2. Changes in Astrocyte Cellular Proteome

At the protein level, using the average of all the peptide intensities of each protein, 64 proteins were identified using the spectral library as being differentially regulated, with 24 proteins down-regulated (log2(FC) ≤ −0.58, −log10(p-value) ≥ 1.3) and 40 up-regulated (log2(FC) ≥ 0.58, −log10(p-value) ≥ 1.3), as delineated by the orange lines in the volcano plots, with significantly differentially regulated (SDR) proteins shown as orange points (Figure 2A). All of the proteins that were significantly differentially regulated are listed in Supplementary Table S1.
At the peptide level, where individual peptide intensities were allowed for quantification, an expanded set of 341 peptides matched to 271 proteins showed a significant difference in relative abundance (log2(FC) ≤ −0.58 or ≥ 0.58, −log10(p-value) ≥ 1.3). It should be noted that this still required the data in each case to be closely concordant with the three biological replicate samples and from three technical replicates from each of these samples. From this analysis, now 115 proteins were down-regulated, and 156 were up-regulated (Figure 2B and Supplementary Table S2).
A STRING functional network analysis was performed on the differentially expressed proteins identified from more than one peptide (Figure 2A and Supplementary Table S1). APP (from which the protein sAPPα is derived) was added as an additional node. There were three main clusters in the network, with the functions of (i) chromatin organization (GO:0006325; strength 1.29; FDR 0.0092), (ii) RAB protein signal transduction (GO:0032482; strength 2.43; FDR 5.98 × 10⁻⁶) and (iii) membrane protein ectodomain proteolysis (GO:0006509; strength 2.72; FDR 0.0486). The latter cluster includes APP as the central node with a first-level interaction (edges) with three SDR proteins, PSEN2, KLC2 and ADAM9. PSEN2 and ADAM9 have protease activities and are involved in regulatory proteolytic processes.

2.2.3. Differentially Regulated Proteins of the Proteome Identified by an Individual Peptide

STRING network analysis and pathway enrichment analysis of the 270 proteins differentially regulated identified the networks and biological pathways in which these proteins were involved (Supplementary Table S3). Gene Ontology (GO) categories, Reactome and KEGG pathways enrichment analysis revealed that sAPPα-stimulated astrocytes up-regulated the expression of the proteins important for neurological function (Table 1). Of these proteins, 48 are related to the GO cellular component category ‘synapse; PHB2, NDRG2, MAP2K1, APP, PSEN2, KPNA2, YWHAH, PPP2CA, DBN1, AP3B1, NEFM, GSK3B, BIN1, FARP1, SEPT2, DARS, LAMC1, WASL, GPC4, XRN1, ARHGAP39, CDC42, RPL18A, ITGB5, RPL26, RPS7, SEPT11, ENAH, ERC1, RPL17, RPL29, RPLP2, NPTN, TUFM, ELAVL1, EPB4.1, FUS, SNX27, CLTA, RPS19, DMD, ITSN1, ADD1, HNRNPA2B1, GLS, SRI, SH3GLB1 and ERBB2IP (See Tables below for full names). A comparison of our differentially regulated proteins with the SynGO resources [59] revealed 47 proteins with synapse functions.
The added node APP was also part of the proteins associated with the GO-term ‘synapse’ and showed 15 first-level interactions (Figure 3), including the three proteins already identified in the protein-level analysis (ADAM9, KLC2, PSEN2, CAV1, SNX27, FUS, GSK3, DBN1, STUB1, ERC1, SOD1, SNX17, BIN1, GSK3B, NFIB). The evidence for the direct associations is shown in Table 2, with the scores indicating the strength of the likelihood of an interaction. Pathway analysis of this subset of regulated proteins showed an enrichment of protein nodes being assigned to GO terms, such as the regulation of proteolysis (GO:0030162; strength 1.11; FDR 0.00036) and the positive regulation of protein catabolic processes (GO:0045732; strength 1.55; FDR 7.33 × 10⁻⁵), therefore, adding further significance to the associated functions of SDR proteins identified in the protein-level analysis.
Network clustering of the peptide-level data applying the Markov Clustering Algorithm (MCL) [60] with an inflation parameter of 1.5 revealed four clusters of functionally related proteins (Figure 4): Cluster 1 with a group of neurologically related functions; Cluster 2, mitochondrial functions and energy production; Cluster 3, a collection of ribosome- and RNA-related proteins related to ribosomal RNA; and Cluster 4 proteins, associated with the microtubule cytoskeleton and the cell cycle.
Significantly, 66 of the 156 proteins that were up-regulated and 42 of the 115 proteins that were down-regulated were functionally associated with either APP, neurological functions or AD (Table 3).
In Table 3, we have listed all of the proteins that were differentially up- or down-regulated in the proteome that were identified under a specific GO term related to neurological function (synapse, neuron projection, myelin sheath and cytoskeleton) or to APP (sAPPα), and those within a pathway linked to AD. Most of the differentially regulated proteins scored in more than one category, and approximately 40% of all of the regulated proteins were identified in these categories.
Ribosomal proteins, for example, L26 and S7, which were found in our data set (Table 3), can have extra-ribosomal functions in signaling pathways [61]. L26 has been found to influence events, such as the activation of p53, and S7 influences PI3K/AKT and MAPK signaling. This may occur in the astrocyte itself. Therefore, while these proteins from within the neuron may influence a signaling pathway that is directly linked to synapse formation or neuronal projections in the neuron, as identified in the literature, they could have other neurologically important functions in the astrocyte. Although still poorly understood, there are translationally active microzones in neurons at the synapses and dendrites (neuronal projections). Specific ribosomal proteins in their ribosomal complexes may play a unique role in these.

2.3. Astrocyte Secretome Analysis after 6 h Exposure to Exogenous sAPPα

2.3.1. The Spectral Library

In the secretome samples derived from the media of sAPPα-treated astrocytes and the matched controls, a total of 933 proteins and 30,076 peptides were identified using DDA mass spectrometry analysis at a confidence interval of 99% and an FDR of q ≤ 0.01. The identified peptides and proteins were integrated into the spectral library and aligned to the DIA spectra for quantification. A total of 858 proteins and 4948 peptides were used for quantification after passing the FDR threshold for peak matching of q ≤ 0.01 in at least one sample. Twenty-five differentially regulated proteins were identified from 136 peptides (each from more than one peptide) that showed a significant difference (log2(FC) ≤ –0.58 or ≥ 0.58, −log10(p-value) ≥ 1.3) in relative abundance between sAPPα-treated astrocytes and the matched controls, as indicated by the orange points in the volcano plots (Figure 5A, Supplementary Table S4). An expanded dataset of 93 differentially regulated proteins derived from 133 peptides was quantified in the individual peptide analysis after filtering for p-value ≤ 0.05 and fold change (FC) ≥1.5 and ≤0.67 (Figure 5B). Supplementary Table S5 shows all the proteins in the peptide-level data that were up- and down-regulated, respectively.

2.3.2. Changes in the Astrocyte Secretome at the Protein Level

Functional network analysis of the 25 differentially regulated proteins (Supplementary Table S4) revealed a low degree of network connectivity between the proteins with a protein–protein interaction (PPI) enrichment p-value of 0.009 and one main cluster of seven protein nodes (APP, GSN, GM2663, DBN1 APLP2, CALM3 and HSP90B1), with APP having the highest betweenness centrality in the whole network. In the pathway enrichment analysis of all the significantly secreted proteins (Supplementary Table S5), eight proteins (APP, RPL10, CALM3, DBN1, ATP1A1, HNRNPH2, ADD1 and CDH13) were associated with the GO term ‘Synapse’ under ‘cellular compartment’ (GO:0045202; threshold, 0.67; FDR, 0.0360), six proteins (APP, HSP90B1, DBN1, GSN, PAWR and ADD1) were associated with the biological process term ‘Supramolecular fibre organization’ (GO:0097435; strength, 1.05; FDR, 0.0388) and five proteins (APP, CALM3, ADD1, CDH13 and AP2A1) were associated with the ‘Regulation of endocytosis’. Five proteins in this network had first-level interactions (edges) with APP (GSN, GM2663, DBN1 APLP2, and HSP90b1), of which most, except for GM2663 and APLP2, are involved in supramolecular fibre organization, a GO term encompasses the proteins involved in the process of assembly and disassembly of protein units into fibres, such as actin and tubulin.

2.3.3. Differentially Regulated Secretome Proteins Identified from Individual Peptides

The 93 proteins detected as being significantly differentially regulated are shown in Supplementary Table S5, with all of the proteins derived from the individual peptide-level data indicated as up- and down-regulated, respectively. Nineteen of these proteins (APP, BMP1, COL5A2, CST3, CTSD, DBN1, FN1, GALC, GDI2, GOT2, HSP90B1, HSPG2, P4HB, PDIA3, PEBP1, QSOX1, SERPINH1, SPARC and SPARCL1) have previously been reported from the secreted fraction of astrocytes [20,21,62].
STRING network analysis of the differentially regulated secreted proteins revealed a network of associated proteins with three main clusters (Figure 6) enriched in functional pathway terms of (i) the red cluster: supramolecular fibre organization (10 nodes; strength, 1.14; FDR, 2.23 × 10⁻⁵), synapse (11 nodes; strength, 0.68; FDR, 0.00088) and extracellular matrix organization (nine nodes; strength, 1.3; FDR, 9.92 × 10⁻⁷); (ii) the green cluster: carboxylic acid metabolic process (nine nodes; strength, 1.19; FDR, 1.65 × 10⁻⁵) and myelin sheath (four nodes; strength, 1.39; FDR, 0.0163); and (iii) the yellow cluster: ribosome biogenesis (six nodes; strength, 1.45; FDR, 0.00017) and proteasome complex (six nodes; strength, 2.13; FDR, 1.22 × 10⁻⁸). APP is a central node in the largest cluster (red cluster) with 13 first-order interactions (CFL1, DBN1, GNAO1, NRD1, CALU, PDIA3, HSP90b1, CST3, CTSD, NES, SPARCL1, FN1 and AGRN), mostly to proteins involved in supramolecular fibre organization (CFL1, DBN1, HSP90b1 and CST3) and synapse organization (SPARCL1, AGRN, CFL1 and DBN1), further enriching the functional association that was detected in the protein-level analysis. Further analysis using the SynGO resources [59] identified 28 proteins of the 93 differentially regulated proteins as being related to synaptic functions.
A combination of functional pathway enrichment analysis (STRING interactions and Gene Ontology enrichment analysis (Table 4 and Supplementary Table S6) and literature searching revealed 66 proteins of particular interest (~70% of those identified as differentially regulated) as they were associated with at least one of the neuronally related GO terms of neuronal synapse, dendrite, axon, myelin sheath, actin cytoskeleton, extracellular matrix organization, IGF regulation, Alzheimer’s disease KEGG pathway or have a link to APP (Table 5). Some proteins belonged to more than one GO category; for example, 12 proteins were associated with the Cellular Compartments ‘Neuron Projection’ and ‘Synapse’, and two more with these categories and ‘Myelin sheath’ (see Supplementary Figure S2).
In Table 5, we have listed all of the proteins that were differentially up- or down-regulated in the secretome that were identified under a specific GO term related to neurological function (synapse, neuron projection, myelin sheath, cytoskeleton, ECM organization or IGF regulation) or to APP (sAPPα) and the pathways linked to AD. Most differentially regulated proteins score in more than one category, and approximately 80% of those identified fell into these categories.

2.4. Comparison of the Proteome and Secretome Differentially Regulated Proteins

If a protein in the cellular proteome were decreased from exposure to extracellular sAPPα but elevated in the secretome, it suggests that the primary event is stimulated secretion without the enhancement of new synthesis. When both are elevated, it suggests de novo synthesis within the astrocyte, which is reflected in enhanced secretion, and when both are decreased, it suggests that enhanced turnover of the protein in the cell occurs without the de novo synthesis of that protein, resulting in lowered secretion.
Seven proteins were regulated in both the astrocyte cellular proteome and the secretome (Table 6). Three are regulated in the same direction, with one down-regulated (CKB) and two up-regulated (DBN1 and TPM4), and four are down-regulated in the proteome but up-regulated in the secretome (COL5a, ADD, PSMD3 and HNRMP2b1).

3. Discussion

3.1. sAPPα Modulates the Proteome and Secretome of the Astrocyte

We have identified a group of differentially regulated proteins relevant to neurological function; for example, actin-binding protein Drebrin, extracellular matrix protein SPARC, Myelin sheath protein SOD1, axon guidance protein DPYSL3, proteins associated with endocytosis, such as CALM3, and proteins involved in the regulation of Insulin-like Growth Factor transport and uptake (Reactome mmu381426), providing a focus for the further investigation of their relationship to sAPPα. A STRING functional association network analysis of both the proteome and secretome data sets was enriched with proteins that have links to APP (Figure 3 and Figure 6, respectively) and AD and that is associated with neurological functions (Table 2, Table 3 and Table 5). Intriguingly, several proteins with well-documented roles at the neuronal synapse are enriched in these data, suggesting that these proteins may have similar functions in the astrocyte or, alternatively, are transported to these regions in the neuron from the astrocyte. These findings are consistent with our hypothesis that astrocytes, as well as neurons, respond to sAPPα signaling.
Astrocytes participate in the encoding of memory stimulated after neuronal activity [3], and sAPPα signaling may play a part in this role. The regulation of translation in astrocytes by neuronal activity is also proposed to be a mechanism by which astrocytes modulate nervous system functioning [63,64]. Astrocytes modulate synaptic function by secreting neurotrophic factors, controlling synaptic formation [65] and regulating the concentration of neurotransmitters at the synapses [2]. They also express APP [66] and can generate their own sAPPα extracellularly. Astrocytes have mechanisms for endocytosis [67] and, like neurons, undergo rapid cellular morphology changes in response to chemical or electrical stimulation [68].
When there is an increased extracellular concentration of sAPPα (as simulated in our study), a group of proteins in the astrocyte was modulated that are directly involved with the regulation of the cytoskeleton (control of cell morphology and vesicle dynamics), the regulation of the ECM, the modulation of the myelin sheath (signaling to oligodendrocytes) and activities at the synapse between neurons.
It is known that sAPPα influences learning and memory by modulating the expression of the proteins involved with neurite outgrowth, synaptogenesis and neurotransmission [34,54,55,56,57,69]. Given the close proximity of astrocytes to neurons and their expression of several putative sAPPα receptors [39,48,49,50,51,52,53], sAPPα produced in vivo by neurons or generated extracellularly from the astrocyte itself could influence the molecular biology of astrocytes.

3.2. Astrocyte Differentially Regulated Proteins

Of the 271 differentially regulated proteins identified in the whole-cell proteome, 108 (~40%) had links to either APP (15), AD (17) or the GO terms ‘Synapse’ (48), ‘Neuron projection’ (37), ‘Myelin sheath’ (11) or ‘Cytoskeleton’ (57). It should be noted that for many of the regulated proteins identified in these studies, most publications to date relate to studies of their involvement in the neuron only, and so the mechanisms of action of the proteins in the astrocyte itself are yet to be experimentally confirmed. Where the proteins refer specifically to neuronal functions, such as the synapse, we infer that the proteins likely affect the astrocyte itself but may also regulate neuronal function either via the secretome or from a close association of the astrocyte with the neuron through downstream signaling or direct association.

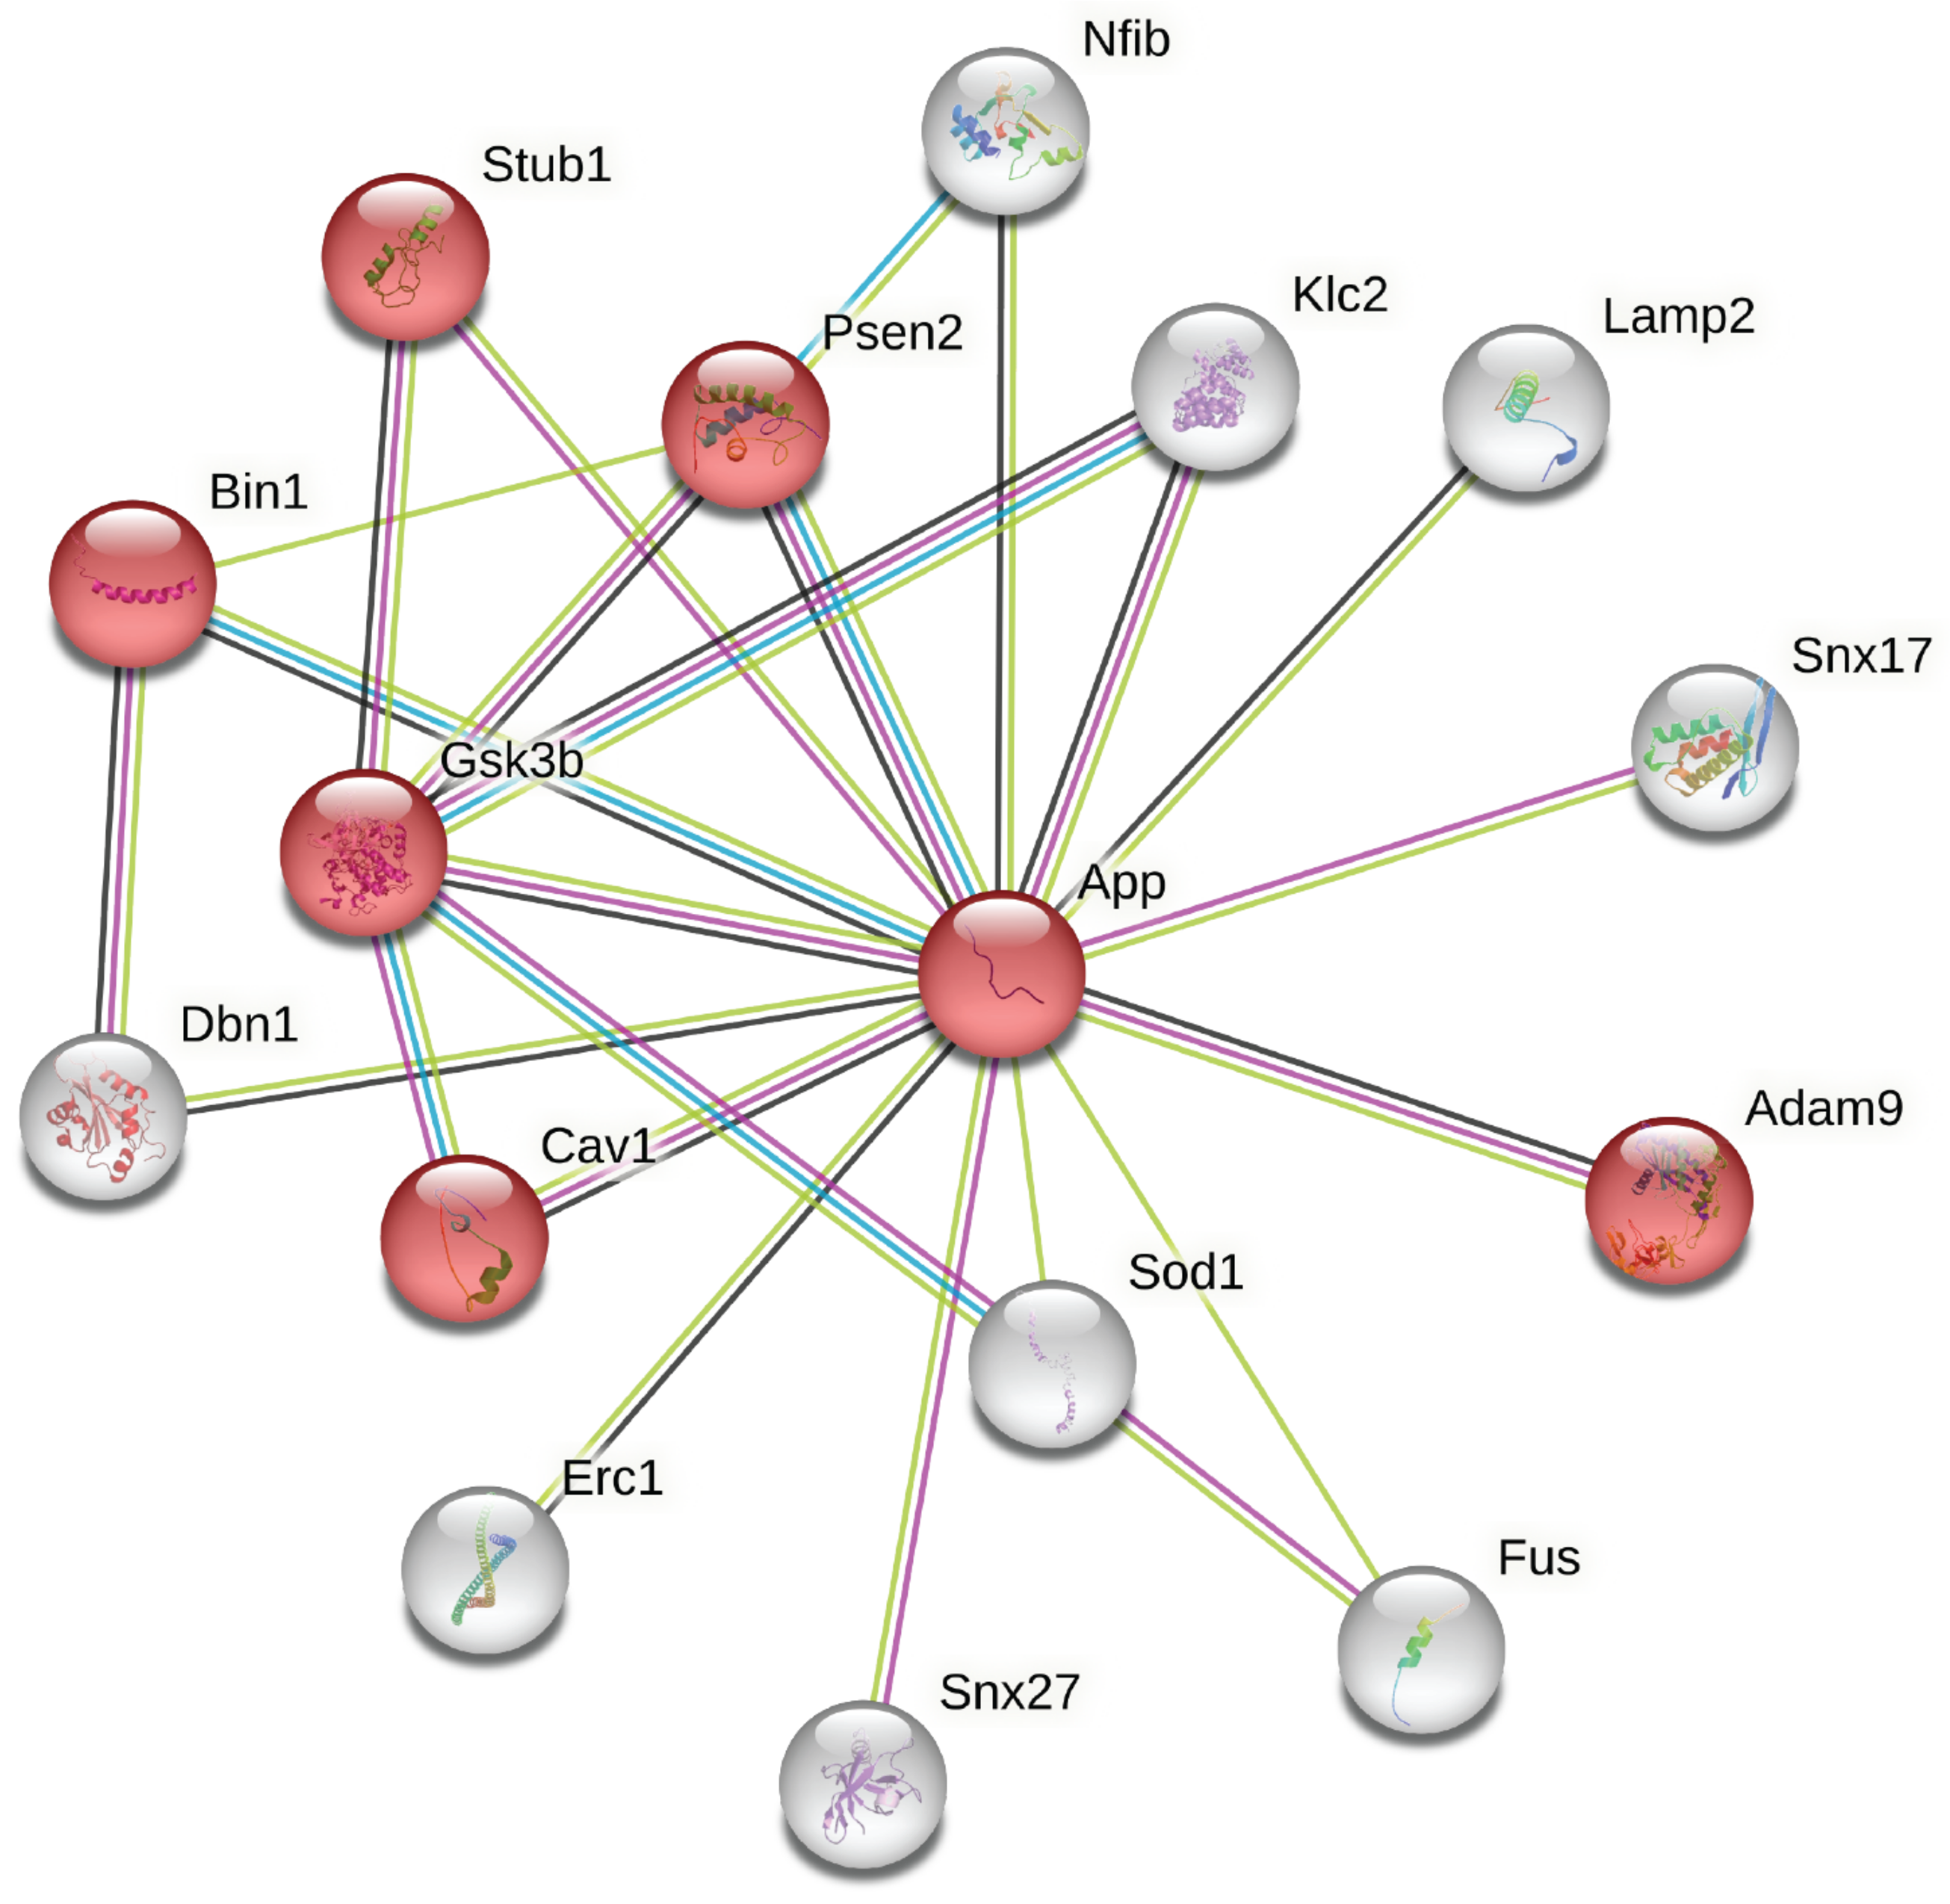
3.2.1. APP- and AD-Related Proteins

Both the proteome and secretome data sets contain numerous differentially regulated proteins with first-order network interactions with APP and associations with AD (Table 3 and Table 5). An example of an APP-related protein of interest was A Disintegrin and Metallo Protease 9 (ADAM9), which is down-regulated, and the net effect of this would be a reduction in the inhibition of ADAM 10, potentially increasing sAPPα production [70]. Proteins associated with the enriched KEGG pathway ‘Alzheimer’s disease’ were of interest given the role of APP in the pathology of the disease, namely the source of neurotoxic peptide Aβ. For example, presenilin (PSEN2) is a gamma secretase involved in the generation of Aβ. Some proteins in the ‘Alzheimer’s disease KEGG pathway’ are risk factors for AD, as identified from variants of the normal genes. PSEN2 is an example of a risk factor and is identified as being down-regulated in our data set. In our study, members of the pathway are both up- and down-regulated and may be beneficial, but the significance of this for brain health is not yet clear.
Other neurological diseases represented by proteins in these data include PD, ALS and HD (Table 1 and Table 4; Supplementary Tables S3 and S6). Alzheimer’s disease is associated with aberrant APP processing in neurons with an over-abundance of Aβ linked to disease pathology [71]. Astrocytes contribute to the pathology of AD, with astrocyte atrophy occurring in the early stage of the disease, leading to disruptions in synaptic connectivity, an imbalance of neurotransmitter homeostasis and neuronal cell death through increased excitotoxicity [72]. Thus, it is interesting that a group of proteins related to these processes is differentially regulated in astrocytes after sAPPα exposure.

3.2.2. Actin and Vesicle Dynamics

Does sAPPα signaling also induce morphology changes in astrocytes? sAPPα is known to cause changes to the actin cytoskeleton in neurons as it can stimulate neurite outgrowth [40,41,42,43], and here we show that 57 proteins associated with the cytoskeleton are differentially regulated in the proteome of astrocytes after sAPPα exposure, and there are 53 proteins specifically associated with plasma membrane cell projection (Table 1 and Supplementary Table S3). Although documented to date only in neurons, a group of ‘axon guidance’ proteins (DPYSL3, EPHA4, TUBB2A, COL5A2, SPTAN1, RPS27A AND AP2A1) from the reactome database are featured in the proteome data.
Does sAPPα signaling also modulate vesicle dynamics? Actin dynamics are also integral to the controlled endocytosis and exocytosis of vesicles containing molecules important for synaptic function, with the actin cytoskeleton and associated motors and adaptor proteins essential for the transport and fusion of vesicles at the plasma membrane. In the secretome, at the protein level of analysis, four proteins identified in our study were associated with the GO term ‘Regulation of endocytosis’ (CALM3, ADD1, CDH13 and AP2A1). At the peptide level of analysis, 21 and 46 proteins were associated with the GO term ‘vesicle’ in the secretome and proteome data sets, respectively, with five proteins (HSPD1, ANXA5, QSOX1, FN1 and HNRNPA2B1) in the secretome data specifically associated with the extracellular vesicle compartment (Table 4 and Supplementary Table S6). In neurons, vesicle fusion releases neurotransmitters to mediate synaptic transmission and sustain synaptic transmission. The fused vesicles must be recycled and retrieved via endocytosis [73]. In astrocytes, secreted vesicles contain molecules that signal to neurons, for example, to provide neuroprotection [74,75] or to stimulate apoptosis [76].

3.2.3. Myelin Sheath

Does sAPPα signaling influence myelination? Both the proteome and secretome data sets contained groups of proteins that are differentially regulated, which are involved with the myelin sheath, 11 proteins (CKB, WDR1, ATP6V1B2, MDH2, NEFM, SOD1, SEPT2, SLC25A4, CDC42, COX5B and TUFM) in the proteome, and 12 (CKB, CALM3, HSPD1, PDIA3, LDHB, GOT2, ATP1A1, PEBP1, GDI2, SPTAN1, RPS27A and GNAO1) in the secretome. The significance of this requires further investigation; however, astrocytes are known to signal to oligodendrocytes to modulate the myelination process [77,78].

3.2.4. ECM Organization

The secretome data included 34 proteins known to reside in the extracellular space but also eight proteins involved in the organization of the ECM (SPARC, BMP1, P4HB, FN1, COL5A2, CTSD, SERPINH1 and AGRN). During development, astrocytes secrete factors that promote neurite outgrowth [79]. The composition of the ECM is important for maintaining the proper functioning of neuronal synapses [80], and it is a drug target for neurological diseases [81].

3.2.5. sAPPα as a Signaling Molecule

sAPPα (and BDNF) share some common functionalities with Insulin-like Growth Factor 2 (IGF2), and memory retention and LTP can be enhanced and ‘forgetting’ prevented by the addition of endogenous Insulin-like Growth Factor 2 (IGF2) [82,83]. A study analysing astrocyte protein secretion and gene expression in three mouse models of genetic neurodegenerative diseases (Rett, Fragile X and Down syndrome) showed that astrocytes secrete the IGF2 inhibitory protein IGFBP2, causing learning and memory failure [84]. A group of IGF-related proteins (Reactome: mmu 381426) were identified in the secretome data (Table 5). Previous data from our laboratory have shown that sAPPα up-regulates the transcripts of IGF2 and IGFBP2 transiently after 30 min exposure in a human neuroblastoma SH-SY5Y cell culture model [85].

3.3. Functions of the Proteins Differentially Regulated in Cellular Proteome and Secretome

Of the proteins differentially regulated in both the proteome and secretome, three proteins (DBN, ADD1 and TPN4) are modulators of morphology or cytoskeletal proteins, while COL5a (collagen) is a constituent of the extracellular matrix and PSMD3 is part of the proteasome. Tropomycin (TPM4) influences the associations between actin and the other actin-binding proteins. Developmentally regulated brain protein, Drebrin (DBN), an actin-binding protein, is of particular interest in that it modulates long-term memory and synaptic plasticity in neurons by influencing synaptic morphology, specifically axonal growth [86,87,88]. The localisation of NMDA receptors (also expressed in hippocampal astrocytes) can be regulated by DBN [89]. In AD patients, DBN expression is reduced [90], and its overexpression in an AD mouse model rescues cognitive deficits and reduces amyloid plaque load [91]. ADD1 belongs to the adducin family of membrane–cytoskeleton-associated proteins, which, in neurons, are constituents of synaptic structures, such as dendritic spines and the growth cones of neurons, where they are involved in the assembly and disassembly of the actin cytoskeleton and responsible for synaptic plasticity and the modulation of synaptic strength [92].
Heterogeneous nuclear ribonucleoproteins (HNRNPs) transport RNAs between the nucleus and the cytoplasm [93]. In neurons, HNRNP-controlled localization-dependent translation of GLUA1 mRNA modulates synaptic AMPA receptor levels [94]. HNRNPA2B1 was down-regulated in the proteome but significantly increased in the secretome, and this protein regulates the selective sorting and secretion of miRNA into extracellular vesicles [95,96]. The differential effects of sAPPα on the proteome and secretome could indicate the stimulation of the secretion of vesicles.

3.4. Limitations of the Study

The astrocyte preparation was from the whole-mouse cortex, resulting in multiple astrocyte types; therefore, the data represented here may have given rise to an ‘averaged’ response. The isolated astrocytes in this artificial cell culture system are also lacking input from other glia and neurons during culture, which may influence the effects of sAPPα in vivo. It will be useful to undertake further validation of the selected proteins using a single astrocyte cell type alongside an immunocytochemistry analysis of slice cultures taken from the brain.
The number of regulated proteins with multiple peptide identifications above allowable detection limits was relatively small and may reflect the heterogeneous population of different types of astrocytes. Therefore, we also analysed individual peptide-level data at a relaxed significance threshold, which, in many cases, resulted in a single peptide quantification of an affected protein, albeit with good concordance within the biological and technical replicates. Individual peptide-level data confirmed the protein-level data but identified additional proteins in already-enriched networks and functional pathways.
Although SWATH MS, in theory, captures spectral data for every peptide, the abundance of each peptide and the set confidence limits, as well as the size of the spectral library, the mean data reported in the current study represent a significant sampling but not the complete set of the SDR proteins after exposure to sAPPα in primary mouse astrocytes.

4. Materials and Methods

4.1. Mouse Primary Astrocyte Cell Culture

Primary astrocytes were derived from the brain tissue of male P0–P2, C57BL/6 mice. The pups were housed at the Hercus-Taieri Resource Unit (HTRU), University of Otago. The experimental protocol was approved by the University of Otago Animal Ethics Committee and conducted in accordance with New Zealand Animal Welfare Legislation. The preparation of the primary astrocyte cultures followed a modified protocol based on [97] and refined by the Hughes Laboratory (University of Otago).
The pups were housed in the dark on warm water bottles until deeply anesthetised by intraperitoneal injection with 0.1 mL of Pentobarbital (Provet NZ Pty Ltd., Auckland, New Zealand) and placed in a Petri dish. Following a loss of consciousness, as determined by slowed/halted respiration, loss of heartbeat and reflexes, the animal was sacrificed by decapitation, and the cortex was isolated and covered with 1 mL of ice-cold Leibovitz (L)15 complete media (Leibovitz L15 (Hyclone, Logan, UT, USA), 1 × pen-strep (Gibco, Billings, MT, USA) and 6 g/L of Glucose (Sigma, Kawasaki, Japan)). After dicing with a sterile scalpel blade, the tissue was transferred to a 15 mL centrifuge tube (Corning, Somerville, MA, USA), and the tissue was allowed to settle. The supernatant was removed and replaced with 1 mL of digestion media (L15 complete media, papain (Worthington, Columbus, OH, USA, 1.2 U/mL) and DNase1 (Invitrogen, Waltham, MA, USA, 1 U/mL) before placing the tube in a MACS-mix rotor (Miltenyi Biotec, Gaithersburg, MD, USA) for 15 min at 37 °C.
The digested tissue was removed from the MACS-mix rotor and allowed to settle in the safety cabinet. The digestion media was aspirated, and 1 mL of trituration solution (L15 complete media, DNase1 (1 U/mL) and 2% (v/v) B27 (GIBCO, Life technologies, NZ, Carlsbad, CA, USA)) was added to the tube, followed by a 10 min incubation in the MACS-mix rotor at 37 °C. The supernatant was removed and replaced with fresh trituration solution, resuspended, and triturated through a series of fire-polished Pasteur pipettes of decreasing pore size until a cloudy solution with no cell clumps remained. The sample was passed through a 100 µm cell strainer (Falcon) and centrifuged (300× g, 5 min). The supernatant was discarded, and the cells were resuspended in Astrocyte Maintenance Media (AMM, DMEM, 10% (v/v) FBS, 1% (w/v) pen-strep (Gibco), 1% (w/v) L-glutamine (Gibco), 2.5 mM glucose, 0.23 mM sodium pyruvate (Gibco), 10 μM L-leucine methyl ester (L-LME, Sigma)) and plated into a poly-L-lysine (PLL, 10 μg/mL)-coated T25 flask. Each pup yielded enough cells for one T25 flask, which was eventually expanded to two 10 cm dishes for treatment and corresponding control for each animal. L-leucine methyl ester (L-LME, 10 μM) was added to inhibit microglial proliferation [98]. Fresh AMM was added to astrocyte cultures every 2–3 d, and the cultures were passaged with TrypLE™ Express enzyme (TrypLETM, GIBCO) and transferred into a T75 flask when reaching 95% confluence. After 14 d in vitro (DIV-14), the astrocytes were shaken for 6 h at 115 rpm at 37 °C to remove any remaining neurons and microglia. The cells were then subject to a final passage and plated into their appropriate vessel for experiments. The astrocytes were cultured for 3 weeks and characterised by immunocytochemistry (Figure 1 and Supplementary Figure S1).

4.2. Immunocytochemical Characterisation of Astrocytes

Primary cell cultures were analysed by immunocytochemistry using antibodies against GFAP and s100b to confirm the presence of astrocytes and CD68 to assess the level of microglia contamination. The cells (5 × 10⁴/cm2) were plated on Poly L lysine (Sigma)-coated coverslips and fixed with 300 µL 4% (v/v) paraformaldehyde (PFA, Sigma) for 15 min at room temperature. PFA was aspirated, and 300 µL of PBS was added to rinse the wells, followed by blocking for 1 h with 300 µL of PBS containing 3% (v/v) normal goat serum (Invitrogen). Primary antibody, rabbit anti-GFAP (1:1000, Dako Z0334, Santa Clara, CA, USA), mouse anti-s100b (1:500) (Novus Biologicals, NBP1-41373, Englewood, CO, USA) or rat anti-CD68 (1:500) (Serotec, SEMCA1957, Kidlington, UK) was diluted in 350 µL 3% (v/v) NGS in PBS containing 0.1% (v/v) Triton-X (BDH) and incubated at 4 °C overnight. After antibody removal, the cells were washed three times with a 10 min incubation of 350 µL PBS, 0.1% (v/v) Triton-X. Fluorescently labelled secondary antibody Rabbit448 (1:1000, Invitrogen A11032), Mouse594 (1:1000) (Invitrogen A11029) or Rat555 (1:1000) (Invitrogen A21434) was diluted in 300 µL 3% (v/v) NGS in PBS, 0.1% (v/v) Triton-X and incubated at room temperature for 1 h. Three PBS-Triton-X washes removed unbound antibodies, and PBS was added to each well. DAPI was used as a nuclear stain. The cells were imaged on a Fluorescent Eclipse Ti2 microscope (Nikon, Tokyo, Japan) attached to an Intensilight C-HGF1 light source (Nikon) and a DS-Qi2 camera (Nikon) linked to a computer with NIS-Elements D imaging software (Nikon). The percentage of microglia expressing CD68 was determined for each culture (four animals) by taking the average of three random images.

4.3. Preparation of the sAPPα Protein Used in the Study

An established protocol was used for the expression and purification of human sAPPα695 [44]. Briefly, sAPPα was expressed and secreted into serum-free DMEM media (GIBCO) from HEK cells that had been stably transformed with the gene fragment for sAPPα. The protein from 500 mL of the media was concentrated by precipitation with 60% (w/v) ammonium sulphate, followed by centrifugation at 10,000× g for 45 min and resuspended in 20 mM Tris–HCl, pH 7.0. Residual salt was removed by FPLC coupled to a HiTrap® desalting column (Cytiva, Marlborough, MA, USA), and a Heparin Sepharose column (HiTrap® heparin) was used for affinity purification. SDS-PAGE, Western blotting, and BCA assay analysis confirmed the purity and identity and determined the concentration of the purified sAPPα, respectively.

4.4. Study Protocol

Primary astrocytes were cultured from four individual P2 mouse pups (n = 4) in 10 cm2 cell culture dishes and incubated with either PBS or 1 nM sAPPα for 2 h (proteome study) or 6 h (secretome study). The cells were in serum-containing medium during the 2 h exposure to sAPPα for the proteome study. The 2 h time was chosen for the proteome study to assess the immediate effects of exposure to sAPPα, and 6 h for the secretome study to allow time for secretion. The time point rationale was based on previous studies using neural cells, tissue slices and whole animals that measure changes in gene expression after a stimulus (including sAPPα) [55,56,57,99]. The isolation of the proteins from the secreted fraction has been previously described [18,62] and was modified for this study. Prior to the addition of sAPPα, the cells were rinsed thoroughly (6 times) with pre-warmed PBS to remove any serum proteins. Serum-free cell culture media (7 mL) containing 1 nM sAPPα or the equivalent volume of 0.1 × PBS (vehicle) was added to the cells, which were returned to the incubator for 6 h. The cell culture media was harvested and centrifuged at 300× g for 5 min and 1000× g for 10 min followed by 20,000× g for 25 min. After each centrifugation, the supernatant was transferred to a fresh 2 mL microcentrifuge tube. Twelve successive centrifugation steps concentrated 6 mL of the media in 500 μL lots on a 10 kDa cut-off ultra-concentrating filter (Amicon, EMD Millipore), down to 60 μL (100-fold concentration) and all of the centrifugation was carried out in a temperature-controlled microcentrifuge (Microfuge 20R centrifuge, Beckman Coulter) at 20 °C. The samples were recovered by inverting the filter unit and centrifuging the retained liquid into a fresh Eppendorf tube at 2000× g for 2 min. Twenty μL of 50 mM triethylammonium bicarbonate (TEAB) and 1% (w/v) SDS in water was added to the filter and vortexed gently to rinse and elute any remaining protein. This 20 μL was pooled with the recovered retained liquid.
For the analysis of the cellular proteome, after 2 h of treatment with 1 nM sAPPα or PBS, the cells were harvested with TrypLE™ enzymatic digestion, rinsed with PBS, pelleted by centrifugation, snap frozen in an ethanol/dry ice bath and stored at −80 °C. To extract the protein fraction, the media or frozen cell pellets were thawed in 200 μL of solubilisation buffer (500 mM (TEAB), 1 mM of phenylmethylsulfonyl fluoride (PMSF), 1 mM of ethylenediaminetetraacetic acid (EDTA), 1 mM of ethylene-bis(oxyethylenenitrilo)tetraacetic acid (EGTA), 0.1% (w/v) sodium dodecyl sulphate (SDS) and 1% (w/v) sodium deoxycholate (SDC). To aid the lysis and digestion of the whole-cell proteome, the cell suspension was homogenised with twenty grinds of a pestle (sample grinding kit, GE Healthcare). The pestle was then rinsed with 200 μL of urea solution (8 M urea in aqueous 500 mM TEAB). The homogenate was vortexed for 10 s and sonicated for 1 min, and then supplemented with 100 U of benzonase. After incubation at 37 °C for 30 min, the cell lysate was centrifuged at 16,000× g for 30 min at 20 °C to remove insoluble material and cell debris. The supernatant was removed, carefully avoiding any top lipid layers and insoluble pellets. The recovered supernatant was further processed as the soluble protein fraction. The soluble protein fractions from the cell lysates and the media from the secretome fraction were each transferred to a 10 kDa molecular weight cut-off centrifugal filter unit (Amicon Ultracell—EMD Millipore, Burlington, MA, USA) and further processed following the Filter-Aided Sample Preparation (FASP) method [100]. In brief, detergents were depleted by washing the samples with 8 M of urea in aqueous 100 mM TEAB, followed by the reduction and alkylation of cysteine thiols with 5 mM tris (2-carboxyethyl) phosphine (TCEP) and 10 mM iodoacetamide (IAA) in aqueous 100 mM TEAB, respectively, and a final washing in aqueous 100 mM TEAB.
The protein content of each sample (secretome and proteome) was quantified with the Bradford protein quantitation assay (Biorad protein assay, Biorad, Hercules, CA, USA) and then supplemented with trypsin (Sequencing Grade Promega) in a trypsin-to-protein ratio of 1 to 20 (w/w) for overnight digestion at 37 °C. After 14 h, the digests were boosted with an additional amount of trypsin in a trypsin-to-protein ratio of 1 to 40 (w/w) and incubated for another 4 h at 37 °C. After digestion, the peptides were purified and concentrated by solid phase extraction (SPE) on Sep-Pac C18 cartridges (Waters, Milford, MA, USA) and dried using a centrifugal vacuum concentrator.

4.5. Protein Identification and Quantification by SWATH-MS

A comprehensive spectral library containing the peptide spectra of all of the identified proteins from all of the samples was generated through data-dependent acquisition (DDA) mass spectrometry of a pooled sample containing an equal amount of each sample. To achieve greater protein identification, the pooled sample was subjected to peptide pre-fractionation by Off-Gel isoelectric focusing (OG-IEF). Therefore, the peptides were first purified through solid phase extraction on Sep-Pak Plus Light C18 cartridges (Waters) and then fractionated into 12 fractions using OG-IEF along a linear pH gradient from 4 to 10 using a 3000 OFFGEL Fractionator (Agilent Technologies, Santa Clara, CA, USA) according to the manufacturer’s protocol. Each fraction was then analysed using DDA mass spectrometry on a 5600+ Triple Time-Of-Flight (TOF) mass spectrometer coupled to an Eksigent “ekspert nanoLC 415” uHPLC system (AB Sciex, Framingham, MA, USA), as previously described (Sweetman, 2020) [101]. For peptide/protein identification, the raw data files of all fractions were searched against the human reference sequence database (downloaded from https://www.ncbi.nlm.nih.gov/ on 29 March 2019), which contains 87,570 sequence entries, using the Protein Piolet software (version 4.5). Trypsin, carboxymethylcysteine and biological modifications were selected for a thorough search setup.
Protein quantification was achieved through data-independent acquisition (DIA) mass spectrometry using the SWATH-MS workflow according to the details described previously [101]. Each sample was analysed in four technical replicates using the same LC gradient as that used for the DDA analysis.

4.6. Data Analysis and Statistics

The spectral library was built using the SWATH application (version 2.0) embedded into PeakView software (version 2.2, AB Sciex), applying the criteria outlined in [101]. DIA spectral data were aligned to the library spectra at a false discovery threshold for peak picking of q = 0.01 in at least one sample. The peak area under the curve (AUC) was then exported to MarkerView software (version 1.2, AB Sciex) for further statistical analysis. The median value of the AUC of the four technical replicates was used to calculate the mean between the biological replicates of sAPPα-treated or control samples for each peptide and protein. The mean peptide/protein values were then compared between sAPPα-treated and control using a 2-tailed Student’s t-test. The proteins were identified as being SDR if they were up- or down-regulated by ≥1.5-fold (Log2 fold change ≥ 0.58 or ≤−0.58) with a p-value of ≤0.05 (−log10(p-value) ≤ 1.3).
Regulated proteins were analysed through functional association network analysis using the STRING database tool (https://string-db.org/) (accessed on 9 October 2022), which identifies the protein–protein associations previously documented in databases or mentioned together in the literature and highlights the groups of proteins that are statistically enriched for their associations with Gene Ontology (GO) terms, such as cellular localisation or biological function or specific molecular pathways or diseases [102,103]. For both the up- and down-regulated proteins APP, the protein that sAPPα is derived from, was added to the network search. To specifically search for synapse functions, regulated proteins were further analysed using the Synaptic Gene Ontology (SynGO) resources (https://www.syngoportal.org/) (accessed on 9 October 2022).
The comparison of sAPPα-treated and control samples was performed using protein-level data, i.e., the average AUCs of the peptides assigned to the same protein and at the level of individual peptide AUCs. In a small number of cases where two or more different proteins were identified from the same peptide sequence, the entries were omitted, as the identity of the protein could not be determined unequivocally. Where >1 isoform of the same protein was highlighted, one isoform was carried forward for further analysis, as the identity of the specific isoform could not be determined.
The individual peptide-level data has been used to find further potentially regulated proteins that are functionally associated with the targets identified on the protein level. However, where the proteins that have been identified as regulated on the individual peptide level are based on single-peptide quantification, those of interest would require further consideration.

5. Conclusions

In this study, we have tested the hypothesis that sAPPα regulates the neurologically relevant activities of astrocytes. Previously, our studies have shown that sAPPα is active in regulating neurological activity globally in live rodents [30], in hippocampal tissue slices [55] and in cultured neurons derived from stem cells [57]. Here, we have shown that sAPPα changes the astrocyte proteome, and thereby, the proteins in the secretome, and many of the identified proteins have neurologically related functions. The identification of proteins affected by acute exposure of astrocytes to sAPPα and changes in the array of proteins that are secreted by astrocytes indicates that sAPPα acts as a signaling molecule to the astrocyte. A consequence for neurons is inferred to be the mobilisation of the necessary tools and materials required for modifying or making new synaptic connections or potentiating existing synapses. It is consistent with the premise that bidirectional communication between astrocytes and neurons is necessary for controlled neurotransmission and that astrocytes participate in the encoding of memory, stimulated after neuronal activity [3,8]. The proteins identified in this study include a group of proteins involved with alterations to cell morphology and the modulation of vesicle dynamics and that is associated with transmission at the tetrapartite synapse. These proteins form candidates for more focused studies on their functional significance and for co-culture studies of astrocytes with neurons.
Previously, we have shown the potential use of sAPPα as a corrective therapy in compromised live animals through the infusion of the protein into rodent brains that restored memory of spatial learning [30], novel object recognition [31], and promoted long-term Potentiation—a model of mammalian memory (whether a full-length protein or a functionally active peptide RER derived from it) [104]. The long-term induction of neurologically important neuroprotective genes and pathways resulted from the expression of the sAPPα gene fragment in the brain, delivered and expressed in a lentivirus vector [56]. These studies implied that sAPPα activates a diverse range of neurologically important genes and proteins to achieve a final output function. The study of the human neuron in isolation [57] and this current study using astrocyte have identified many of the candidate genes and proteins at the molecular level that sAPPα is able to modulate. It further reinforces the promise of sAPPα and its derivatives for development as a potential therapeutic option for the treatment of Alzheimer’s disease.

Supplementary Materials

The following supporting information can be downloaded at: https://www.mdpi.com/article/10.3390/ijms24087165/s1.

Author Contributions

Conceptualization, K.P. and W.P.T.; Formal analysis, K.P., T.K. and W.P.T.; Funding acquisition, S.M.H. and W.P.T.; Investigation, K.P., T.K., S.M.H. and W.P.T.; Methodology, K.P., T.K. and S.M.H.; Project administration, W.P.T.; Supervision, S.M.H. and W.P.T.; Validation, T.K.; Writing—original draft, K.P. and W.P.T.; Writing—review and editing, T.K., S.M.H. and W.P.T. All authors have read and agreed to the published version of the manuscript.

Funding

The Health Research Council of New Zealand programme grant #16/597 supported K.P. and this study.

Institutional Review Board Statement

The study was conducted in accordance with the Declaration of Helsinki, approved by the University of Otago Animal Ethics Committee and conducted in accordance with the New Zealand Animal Welfare Legislation.

Informed Consent Statement

Not applicable.

Data Availability Statement

The mass spectrometry proteomics data have been deposited to the Proteome Xchange Consortium via the PRIDE partner repository with the data set identifier PXD037902.

Acknowledgments

We thank Tina Edgar for proofreading the manuscript prior to submission. K.P. dedicates this work to the memory of Geoff Layton for his interest in the science and her career development.

Conflicts of Interest

The authors declare no conflict of interest.

References

  1. Shan, L.; Zhang, T.; Fan, K.; Cai, W.; Liu, H. Astrocyte-Neuron Signaling in Synaptogenesis. Front. Cell Dev. Biol. 2021, 9, 680301. [Google Scholar] [CrossRef]
  2. Santello, M.; Toni, N.; Volterra, A. Astrocyte function from information processing to cognition and cognitive impairment. Nat. Neurosci. 2019, 22, 154–166. [Google Scholar] [CrossRef] [PubMed]
  3. Doron, A.; Rubin, A.; Benmelech-Chovav, A.; Benaim, N.; Carmi, T.; Refaeli, R.; Novick, N.; Kreisel, T.; Ziv, Y.; Goshen, I. Hippocampal astrocytes encode reward location. Nature 2022, 609, 772–778. [Google Scholar] [CrossRef]
  4. Bushong, E.A.; Martone, M.E.; Jones, Y.Z.; Ellisman, M.H. Protoplasmic astrocytes in CA1 stratum radiatum occupy separate anatomical domains. J. Neurosci. 2002, 22, 183–192. [Google Scholar] [CrossRef] [PubMed]
  5. Tang, Y.; Nyengaard, J.R.; De Groot, D.M. Total regional and global number of synapses in the human brain neocortex. Synapse 2001, 41, 258–273. [Google Scholar] [CrossRef]
  6. Oberheim, N.A.; Wang, X.; Goldman, S.; Nedergaard, M. Astrocytic complexity distinguishes the human brain. Trends Neurosci. 2006, 29, 547–553. [Google Scholar] [CrossRef] [PubMed]
  7. Araque, A.; Parpura, V.; Sanzgiri, R.P.; Haydon, P.G. Tripartite synapses: Glia, the unacknowledged partner. Trends Neurosci. 1999, 22, 208–215. [Google Scholar] [CrossRef] [PubMed]
  8. Singh, A.; Abraham, W.C. Abraham, Astrocytes and synaptic plasticity in health and disease. Exp. Brain Res. 2017, 235, 1645–1655. [Google Scholar] [CrossRef] [PubMed]
  9. Rodnight, R.B.; Gottfried, C. Morphological plasticity of rodent astroglia. J. Neurochem. 2013, 124, 263–275. [Google Scholar] [CrossRef]
  10. Oberheim, N.A.; Takano, T.; Han, X.; He, W.; Lin, J.H.C.; Wang, F.; Xu, Q.; Wyatt, J.D.; Pilcher, W.; Ojemann, J.; et al. Uniquely hominid features of adult human astrocytes. J. Neurosci. 2009, 29, 3276–3287. [Google Scholar] [CrossRef] [PubMed]
  11. Verkhratsky, A.; Nedergaard, M. Astroglial cradle in the life of the synapse. Philos. Trans. R. Soc. Lond. Ser. B Biol. Sci. 2014, 369, 20130595. [Google Scholar] [CrossRef] [PubMed]
  12. Araque, A.; Carmignoto, G.; Haydon, P.G.; Oliet, S.H.; Robitaille, R.; Volterra, A. Gliotransmitters travel in time and space. Neuron 2014, 81, 728–739. [Google Scholar] [CrossRef] [PubMed]
  13. Pekny, M.; Pekna, M.; Messing, A.; Steinhäuser, C.; Lee, J.-M.; Parpura, V.; Hol, E.M.; Sofroniew, M.V.; Verkhratsky, A. Astrocytes: A central element in neurological diseases. Acta Neuropathol. 2016, 131, 323–345. [Google Scholar] [CrossRef]
  14. Kulijewicz-Nawrot, M.; Verkhratsky, A.; Chvátal, A.; Syková, E.; Rodríguez, J.J. Astrocytic cytoskeletal atrophy in the medial prefrontal cortex of a triple transgenic mouse model of Alzheimer’s disease. J. Anat. 2012, 221, 252–262. [Google Scholar] [CrossRef] [PubMed]
  15. Olabarria, M.; Noristani, H.N.; Verkhratsky, A.; Rodríguez, J.J. Concomitant astroglial atrophy and astrogliosis in a triple transgenic animal model of Alzheimer’s disease. Glia 2010, 58, 831–838. [Google Scholar] [CrossRef]
  16. DeKosky, S.T.; Scheff, S.W.; Styren, S.D. Structural correlates of cognition in dementia: Quantification and assessment of synapse change. Neurodegeneration 1996, 5, 417–421. [Google Scholar] [CrossRef]
  17. Choi, S.S.; Lee, H.J.; Lim, I.; Satoh, J.-I.; Kim, S.U. Human astrocytes: Secretome profiles of cytokines and chemokines. PLoS ONE 2014, 9, e92325. [Google Scholar] [CrossRef] [PubMed]
  18. Lafon-Cazal, M.; Adjali, O.; Galéotti, N.; Poncet, J.; Jouin, P.; Homburger, V.; Bockaert, J.; Marin, P. Proteomic Analysis of Astrocytic Secretion in the Mouse: Comparison with the cerebrospinal fluid proteome. J. Biol. Chem. 2003, 278, 24438–24448. [Google Scholar] [CrossRef]
  19. Greco, T.; Seeholzer, S.H.; Mak, A.; Spruce, L.; Ischiropoulos, H. Quantitative mass spectrometry-based proteomics reveals the dynamic range of primary mouse astrocyte protein secretion. J. Proteome Res. 2010, 9, 2764–2774. [Google Scholar] [CrossRef] [PubMed]
  20. Keene, S.D.; Greco, T.; Parastatidis, I.; Lee, S.H.; Hughes, E.; Balice-Gordon, R.J.; Speicher, D.W.; Ischiropoulos, H. Mass spectrometric and computational analysis of cytokine-induced alterations in the astrocyte secretome. Proteomics 2009, 9, 768–782. [Google Scholar] [CrossRef]
  21. Moore, N.H.; Costa, L.G.; Shaffer, S.A.; Goodlett, D.R.; Guizzetti, M. Shotgun proteomics implicates extracellular matrix proteins and protease systems in neuronal development induced by astrocyte cholinergic stimulation. J. Neurochem. 2009, 108, 891–908. [Google Scholar] [CrossRef] [PubMed]
  22. Venturini, A.; Passalacqua, M.; Pelassa, S.; Pastorino, F.; Tedesco, M.; Cortese, K.; Gagliani, M.C.; Leo, G.; Maura, G.; Guidolin, D.; et al. Exosomes from Astrocyte Processes: Signaling to Neurons. Front. Pharmacol. 2019, 10, 1452. [Google Scholar] [CrossRef] [PubMed]
  23. Quiroz-Baez, R.; Hernández-Ortega, K.; Martínez-Martínez, E. Insights into the Proteomic Profiling of Extracellular Vesicles for the Identification of Early Biomarkers of Neurodegeneration. Front. Neurol. 2020, 11, 580030. [Google Scholar] [CrossRef] [PubMed]
  24. Zhang, H.; Ma, Q.; Zhang, Y.W.; Xu, H. Proteolytic processing of Alzheimer’s beta-amyloid precursor protein. J. Neurochem. 2012, 120 (Suppl. S1), 9–21. [Google Scholar] [CrossRef] [PubMed]
  25. Sosa, L.J.; Cáceres, A.; Dupraz, S.; Oksdath, M.; Quiroga, S.; Lorenzo, A. The physiological role of the amyloid precursor protein as an adhesion molecule in the developing nervous system. J. Neurochem. 2017, 143, 11–29. [Google Scholar] [CrossRef]
  26. Hick, M.; Herrmann, U.; Weyer, S.W.; Mallm, J.P.; Tschäpe, J.A.; Borgers, M.; Mercken, M.; Roth, F.C.; Draguhn, A.; Slomianka, L.; et al. Acute function of secreted amyloid precursor protein fragment APPsalpha in synaptic plasticity. Acta Neuropathol. 2015, 129, 21–37. [Google Scholar] [CrossRef]
  27. Montagna, E.; Dorostkar, M.M.; Herms, J. The Role of APP in Structural Spine Plasticity. Front. Mol. Neurosci. 2017, 10, 136. [Google Scholar] [CrossRef]
  28. Steubler, V.; Erdinger, S.; Back, M.K.; Ludewig, S.; Fässler, D.; Richter, M.; Han, K.; Slomianka, L.; Amrein, I.; von Engelhardt, J.; et al. Loss of all three APP family members during development impairs synaptic function and plasticity, disrupts learning, and causes an autism-like phenotype. EMBO J. 2021, 40, e107471. [Google Scholar] [CrossRef]
  29. Meziane, H.; Dodart, J.C.; Mathis, C.; Little, S.; Clemens, J.; Paul, S.M.; Ungerer, A. Memory-enhancing effects of secreted forms of the beta-amyloid precursor protein in normal and amnestic mice. Proc. Natl. Acad. Sci. USA 1998, 95, 12683–12688. [Google Scholar] [CrossRef]
  30. Taylor, C.J.; Ireland, D.R.; Ballagh, I.; Bourne, K.; Marechal, N.M.; Turner, P.R.; Bilkey, D.K.; Tate, W.P.; Abraham, W.C. Endogenous secreted amyloid precursor protein-alpha regulates hippocampal NMDA receptor function, long-term potentiation and spatial memory. Neurobiol. Dis. 2008, 31, 250–260. [Google Scholar] [CrossRef]
  31. Xiong, M.; Jones, O.D.; Peppercorn, K.; Ohline, S.M.; Tate, W.P.; Abraham, W.C. Secreted amyloid precursor protein-alpha can restore novel object location memory and hippocampal LTP in aged rats. Neurobiol. Learn Mem. 2017, 138, 291–299. [Google Scholar] [CrossRef] [PubMed]
  32. Tan, V.T.; Mockett, B.G.; Ohline, S.M.; Parfitt, K.D.; Wicky, H.E.; Peppercorn, K.; Schoderboeck, L.; Yahaya, M.F.B.; Tate, W.P.; Hughes, S.M.; et al. Lentivirus-mediated expression of human secreted amyloid precursor protein-alpha prevents development of memory and plasticity deficits in a mouse model of Alzheimer’s disease. Mol. Brain 2018, 11, 7. [Google Scholar] [CrossRef] [PubMed]
  33. Fol, R.; Braudeau, J.; Ludewig, S.; Abel, T.; Weyer, S.W.; Roederer, J.P.; Brod, F.; Audrain, M.; Bemelmans, A.P.; Buchholz, C.J.; et al. Viral gene transfer of APPsalpha rescues synaptic failure in an Alzheimer’s disease mouse model. Acta Neuropathol. 2016, 131, 247–266. [Google Scholar] [CrossRef] [PubMed]
  34. Mockett, B.G.; Guévremont, D.; Elder, M.K.; Parfitt, K.D.; Peppercorn, K.; Morrissey, J.; Singh, A.; Hintz, T.J.; Kochen, L.; Dieck, S.T.; et al. Glutamate Receptor Trafficking and Protein Synthesis Mediate the Facilitation of LTP by Secreted Amyloid Precursor Protein-Alpha. J. Neurosci. 2019, 39, 3188–3203. [Google Scholar] [CrossRef]
  35. Livingstone, R.W.; Elder, M.K.; Singh, A.; Westlake, C.M.; Tate, W.P.; Abraham, W.C.; Williams, J.M. Secreted Amyloid Precursor Protein-Alpha Enhances LTP Through the Synthesis and Trafficking of Ca(2+)-Permeable AMPA Receptors. Front. Mol. Neurosci. 2021, 14, 660208. [Google Scholar] [CrossRef]
  36. Baratchi, S.; Evans, J.; Tate, W.P.; Abraham, W.C.; Connor, B. Secreted amyloid precursor proteins promote proliferation and glial differentiation of adult hippocampal neural progenitor cells. Hippocampus 2012, 22, 1517–1527. [Google Scholar] [CrossRef] [PubMed]
  37. Caillé, I.; Allinquant, B.; Dupont, E.; Bouillot, C.; Langer, A.; Müller, U.; Prochiantz, A. Soluble form of amyloid precursor protein regulates proliferation of progenitors in the adult subventricular zone. Development 2004, 131, 2173–2181. [Google Scholar] [CrossRef]
  38. Demars, M.P.; Bartholomew, A.; Strakova, Z.; Lazarov, O. Soluble amyloid precursor protein: A novel proliferation factor of adult progenitor cells of ectodermal and mesodermal origin. Stem Cell Res. Ther. 2011, 2, 36. [Google Scholar] [CrossRef]
  39. Richter, M.C.; Ludewig, S.; Winschel, A.; Abel, T.; Bold, C.; Salzburger, L.R.; Klein, S.; Han, K.; Weyer, S.W.; Fritz, A.K.; et al. Distinct in vivo roles of secreted APP ectodomain variants APPsα and APPsβ in regulation of spine density, synaptic plasticity, and cognition. EMBO J. 2018, 37, e98335. [Google Scholar] [CrossRef] [PubMed]
  40. Small, D.H.; Nurcombe, V.; Reed, G.; Clarris, H.; Moir, R.; Beyreuther, K.; Masters, C.L. A heparin-binding domain in the amyloid protein precursor of Alzheimer’s disease is involved in the regulation of neurite outgrowth. J. Neurosci. 1994, 14, 2117–2127. [Google Scholar] [CrossRef]
  41. Young-Pearse, T.L.; Chen, A.C.; Chang, R.; Marquez, C.; Selkoe, D.J. Secreted APP regulates the function of full-length APP in neurite outgrowth through interaction with integrin beta1. Neural. Dev. 2008, 3, 15. [Google Scholar] [CrossRef]
  42. Dorard, E.; Chasseigneaux, S.; Gorisse-Hussonnois, L.; Broussard, C.; Pillot, T.; Allinquant, B. Soluble Amyloid Precursor Protein Alpha Interacts with alpha3-Na, K-ATPAse to Induce Axonal Outgrowth but Not Neuroprotection: Evidence for Distinct Mechanisms Underlying these Properties. Mol. Neurobiol. 2018, 55, 5594–5610. [Google Scholar] [CrossRef] [PubMed]
  43. Chasseigneaux, S.; Dinc, L.; Rose, C.; Chabret, C.; Coulpier, F.; Topilko, P.; Mauger, G.; Allinquant, B. Secreted amyloid precursor protein beta and secreted amyloid precursor protein alpha induce axon outgrowth in vitro through Egr1 signaling pathway. PLoS ONE 2011, 6, e16301. [Google Scholar] [CrossRef] [PubMed]
  44. Turner, P.R.; Bourne, K.; Garama, D.; Carne, A.; Abraham, W.C.; Tate, W.P. Production, purification and functional validation of human secreted amyloid precursor proteins for use as neuropharmacological reagents. J. Neurosci. Methods 2007, 164, 68–74. [Google Scholar] [CrossRef] [PubMed]
  45. Furukawa, K.; Sopher, B.L.; Rydel, R.E.; Begley, J.G.; Pham, D.G.; Martin, G.M.; Fox, M.; Mattson, M.P. Increased activity-regulating and neuroprotective efficacy of alpha-secretase-derived secreted amyloid precursor protein conferred by a C-terminal heparin-binding domain. J. Neurochem. 1996, 67, 1882–1896. [Google Scholar] [CrossRef] [PubMed]
  46. Rice, H.C.; De Malmazet, D.; Schreurs, A.; Frere, S.; Van Molle, I.; Volkov, A.N.; Creemers, E.; Vertkin, I.; Nys, J.; Ranaivoson, F.M.; et al. Secreted amyloid-β precursor protein functions as a GABA(B)R1a ligand to modulate synaptic transmission. Science 2019, 363, eaao4827. [Google Scholar] [CrossRef]
  47. Ishibashi, M.; Egawa, K.; Fukuda, A. Diverse Actions of Astrocytes in GABAergic Signaling. Int. J. Mol. Sci. 2019, 20, 2964. [Google Scholar] [CrossRef] [PubMed]
  48. Patel, H.; McIntire, J.; Ryan, S.; Dunah, A.; Loring, R. Anti-inflammatory effects of astroglial α7 nicotinic acetylcholine receptors are mediated by inhibition of the NF-κB pathway and activation of the Nrf2 pathway. J. Neuroinflamm. 2017, 14, 192. [Google Scholar] [CrossRef] [PubMed]
  49. Gustafsen, C.; Glerup, S.; Pallesen, L.T.; Olsen, D.; Andersen, O.M.; Nykjær, A.; Madsen, P.; Petersen, C.M. Sortilin and SorLA display distinct roles in processing and trafficking of amyloid precursor protein. J. Neurosci. 2013, 33, 64–71. [Google Scholar] [CrossRef]
  50. Larsen, J.V.; Petersen, C.M. SorLA in Interleukin-6 Signaling and Turnover. Mol. Cell. Biol. 2017, 37, e00641-16. [Google Scholar] [CrossRef]
  51. Hartl, D.; Klatt, S.; Roch, M.; Konthur, Z.; Klose, J.; Willnow, T.E.; Rohe, M. Soluble alpha-APP (sAPPalpha) regulates CDK5 expression and activity in neurons. PLoS ONE 2013, 8, e65920. [Google Scholar] [CrossRef] [PubMed]
  52. Toth, A.E.; Helms, H.C.; Harazin, A.; Johnsen, K.B.; Goldeman, C.; Burkhart, A.; Thomsen, M.S.; Kempen, P.J.; Klepe, A.; Lipka, D.V.; et al. Sortilin regulates blood-brain barrier integrity. FEBS J. 2021, 289, 1062–1079. [Google Scholar] [CrossRef] [PubMed]
  53. Milosch, N.; Tanriöver, G.; Kundu, A.; Rami, A.; Francois, J.C.; Baumkötter, F.; Weyer, S.W.; Samanta, A.; Jäschke, A.; Brod, F.; et al. Holo-APP and G-protein-mediated signaling are required for sAPPα-induced activation of the Akt survival pathway. Cell Death Dis. 2014, 5, e1391. [Google Scholar] [CrossRef] [PubMed]
  54. Stein, T.D.; Anders, N.J.; DeCarli, C.; Chan, S.L.; Mattson, M.P.; Johnson, J.A. Neutralization of transthyretin reverses the neuroprotective effects of secreted amyloid precursor protein (APP) in APPSW mice resulting in tau phosphorylation and loss of hippocampal neurons: Support for the amyloid hypothesis. J. Neurosci. 2004, 24, 7707–7717. [Google Scholar] [CrossRef] [PubMed]
  55. Ryan, M.M.; Morris, G.P.; Mockett, B.G.; Bourne, K.; Abraham, W.C.; Tate, W.P.; Williams, J.M. Time-dependent changes in gene expression induced by secreted amyloid precursor protein-alpha in the rat hippocampus. BMC Genom. 2013, 14, 376. [Google Scholar] [CrossRef]
  56. Ryan, M.; Tan, V.T.; Thompson, N.; Guévremont, D.; Mockett, B.G.; Tate, W.P.; Abraham, W.C.; Hughes, S.M.; Williams, J. Lentivirus-Mediated Expression of Human Secreted Amyloid Precursor Protein-Alpha Promotes Long-Term Induction of Neuroprotective Genes and Pathways in a Mouse Model of Alzheimer’s Disease. J. Alzheimers Dis. 2021, 79, 1075–1090. [Google Scholar] [CrossRef]
  57. Peppercorn, K.; Kleffmann, T.; Jones, O.; Hughes, S.; Tate, W. Secreted Amyloid Precursor Protein Alpha, a Neuroprotective Protein in the Brain Has Widespread Effects on the Transcriptome and Proteome of Human Inducible Pluripotent Stem Cell-Derived Glutamatergic Neurons Related to Memory Mechanisms. Front. Neurosci. 2022, 16, 858524. [Google Scholar] [CrossRef] [PubMed]
  58. Barger, S.W.; Harmon, A.D. Microglial activation by Alzheimer amyloid precursor protein and modulation by apolipoprotein E. Nature 1997, 388, 878–881. [Google Scholar] [CrossRef]
  59. Koopmans, F.; van Nierop, P.; Andres-Alonso, M.; Byrnes, A.; Cijsouw, T.; Coba, M.P.; Cornelisse, L.N.; Farrell, R.J.; Goldschmidt, H.L.; Howrigan, D.P.; et al. SynGO: An Evidence-Based, Expert-Curated Knowledge Base for the Synapse. Neuron 2019, 103, 217–234.e4. [Google Scholar] [CrossRef]
  60. Brohée, S.; van Helden, J. Evaluation of clustering algorithms for protein-protein interaction networks. BMC Bioinform. 2006, 7, 488. [Google Scholar] [CrossRef]
  61. Zhou, X.; Liao, W.-J.; Liao, J.-M.; Liao, P.; Lu, H. Ribosomal proteins: Functions beyond the ribosome. J. Mol. Cell Biol. 2015, 7, 92–104. [Google Scholar] [CrossRef]
  62. Dowell, J.A.; Johnson, J.A.; Li, L. Identification of Astrocyte Secreted Proteins with a Combination of Shotgun Proteomics and Bioinformatics. J. Proteome. Res. 2009, 8, 4135–4143. [Google Scholar] [CrossRef]
  63. Sapkota, D.; Sakers, K.; Liu, Y.; Lake, A.M.; Khazanchi, R.; Khankan, R.R.; Zhang, Y.; Dougherty, J.D.; Dougherty, J. Activity dependent translation in astrocytes. bioRxiv 2020. [Google Scholar] [CrossRef]
  64. Sapkota, D.; Kater, M.S.; Sakers, K.; Nygaard, K.R.; Liu, Y.; Koester, S.K.; Fass, S.B.; Lake, A.M.; Khazanchi, R.; Khankan, R.R.; et al. Activity-dependent translation dynamically alters the proteome of the perisynaptic astrocyte process. Cell Rep. 2022, 41, 111474. [Google Scholar] [CrossRef]
  65. Bernardinelli, Y.; Muller, D.; Nikonenko, I. Astrocyte-synapse structural plasticity. Neural Plast. 2014, 2014, 232105. [Google Scholar] [CrossRef] [PubMed]
  66. Haass, C.; Hung, A.; Selkoe, D. Processing of beta-amyloid precursor protein in microglia and astrocytes favors an internal localization over constitutive secretion. J. Neurosci. 1991, 11, 3783–3793. [Google Scholar] [CrossRef] [PubMed]
  67. Megias, L.; Guerri, C.; Fornas, E.; Azorin, I.; Bendala, E.; Sancho-Tello, M.; Durán, J.M.; Tomás, M.; Gomez-Lechon, M.J.; Renau-Piqueras, J. Endocytosis and transcytosis in growing astrocytes in primary culture. Possible implications in neural development. Int. J. Dev. Biol. 2000, 44, 209–221. [Google Scholar]
  68. Lushnikova, I.; Skibo, G.; Muller, D.; Nikonenko, I. Synaptic potentiation induces increased glial coverage of excitatory synapses in CA1 hippocampus. Hippocampus 2009, 19, 753–762. [Google Scholar] [CrossRef]
  69. Livingstone, R.W.; Elder, M.K.; Barrett, M.C.; Westlake, C.M.; Peppercorn, K.; Tate, W.P.; Abraham, W.C.; Williams, J.M. Secreted Amyloid Precursor Protein-Alpha Promotes Arc Protein Synthesis in Hippocampal Neurons. Front. Mol. Neurosci. 2019, 12, 198. [Google Scholar] [CrossRef]
  70. Moss, M.L.; Powell, G.; Miller, M.A.; Edwards, L.; Qi, B.; Sang, Q.-X.A.; De Strooper, B.; Tesseur, I.; Lichtenthaler, S.F.; Taverna, M.; et al. ADAM9 inhibition increases membrane activity of ADAM10 and controls α-secretase processing of amyloid precursor protein. J. Biol. Chem. 2011, 286, 40443–40451. [Google Scholar] [CrossRef]
  71. Hampel, H.; Hardy, J.; Blennow, K.; Chen, C.; Perry, G.; Kim, S.H.; Villemagne, V.L.; Aisen, P.; Vendruscolo, M.; Iwatsubo, T.; et al. The Amyloid-β Pathway in Alzheimer’s Disease. Mol. Psychiatry 2021, 26, 5481–5503. [Google Scholar] [CrossRef]
  72. Verkhratsky, A.; Olabarria, M.; Noristani, H.N.; Yeh, C.Y.; Rodriguez, J.J. Astrocytes in Alzheimer’s disease. Neurotherapeutics 2010, 7, 399–412. [Google Scholar] [CrossRef] [PubMed]
  73. Chanaday, N.L.; Cousin, M.A.; Milosevic, I.; Watanabe, S.; Morgan, J.R. The Synaptic Vesicle Cycle Revisited: New Insights into the Modes and Mechanisms. J. Neurosci. 2019, 39, 8209. [Google Scholar] [CrossRef]
  74. Wang, S.; Cesca, F.; Loers, G.; Schweizer, M.; Buck, F.; Benfenati, F.; Schachner, M.; Kleene, R. Synapsin I is an oligomannose-carrying glycoprotein, acts as an oligomannose-binding lectin, and promotes neurite outgrowth and neuronal survival when released via glia-derived exosomes. J. Neurosci. 2011, 31, 7275–7290. [Google Scholar] [CrossRef]
  75. Pascua-Maestro, R.; González, E.; Lillo, C.; Ganfornina, M.D.; Falcón-Pérez, J.M.; Sanchez, D. Extracellular Vesicles Secreted by Astroglial Cells Transport Apolipoprotein D to Neurons and Mediate Neuronal Survival Upon Oxidative Stress. Front. Cell. Neurosci. 2018, 12, 526. [Google Scholar] [CrossRef]
  76. Wang, G.; Dinkins, M.; He, Q.; Zhu, G.; Poirier, C.; Campbell, A.; Mayer-Proschel, M.; Bieberich, E. Astrocytes secrete exosomes enriched with proapoptotic ceramide and prostate apoptosis response 4 (PAR-4): Potential mechanism of apoptosis induction in Alzheimer disease (AD). J. Biol. Chem. 2012, 287, 21384–21395. [Google Scholar] [CrossRef]
  77. Traiffort, E.; Kassoussi, A.; Zahaf, A.; Laouarem, Y. Astrocytes and Microglia as Major Players of Myelin Production in Normal and Pathological Conditions. Front. Cell. Neurosci. 2020, 14, 79. [Google Scholar] [CrossRef]
  78. Ishibashi, T.; Dakin, K.A.; Stevens, B.; Lee, P.R.; Kozlov, S.V.; Stewart, C.L.; Fields, R.D. Astrocytes promote myelination in response to electrical impulses. Neuron 2006, 49, 823–832. [Google Scholar] [CrossRef]
  79. Wujek, J.R.; Akeson, R.A. Extracellular matrix derived from astrocytes stimulates neuritic outgrowth from PC12 cells in vitro. Dev. Brain Res. 1987, 34, 87–97. [Google Scholar] [CrossRef] [PubMed]
  80. Kurshan, P.T.; Phan, A.Q.; Wang, G.J.; Crane, M.M.; Lu, H.; Shen, K. Regulation of synaptic extracellular matrix composition is critical for proper synapse morphology. J. Neurosci. 2014, 34, 12678–12689. [Google Scholar] [CrossRef] [PubMed]
  81. Soleman, S.; Filippov, M.; Dityatev, A.; Fawcett, J. Targeting the neural extracellular matrix in neurological disorders. Neuroscience 2013, 253, 194–213. [Google Scholar] [CrossRef] [PubMed]
  82. Chen, D.Y.; Stern, S.A.; Garcia-Osta, A.; Saunier-Rebori, B.; Pollonini, G.; Bambah-Mukku, D.; Blitzer, R.D.; Alberini, C.M. A critical role for IGF-II in memory consolidation and enhancement. Nature 2011, 469, 491–497. [Google Scholar] [CrossRef] [PubMed]
  83. Beletskiy, A.; Chesnokova, E.; Bal, N. Insulin-Like Growth Factor 2 As a Possible Neuroprotective Agent and Memory Enhancer-Its Comparative Expression, Processing and Signaling in Mammalian CNS. Int. J. Mol. Sci. 2021, 22, 1849. [Google Scholar] [CrossRef] [PubMed]
  84. Caldwell, A.L.M.; Sancho, L.; Deng, J.; Bosworth, A.; Miglietta, A.; Diedrich, J.K.; Shokhirev, M.N.; Allen, N.J. Aberrant astrocyte protein secretion contributes to altered neuronal development in multiple models of neurodevelopmental disorders. Nat. Neurosci. 2022, 25, 1163–1178. [Google Scholar] [CrossRef]
  85. Morris, G. Secreted Amyloid Precursor Protein-α Mediates Neuroprotection and Gene Expression, in Biochemistry. Ph.D. Dissertation, University of Otago, Otago, New Zealand, 2011. [Google Scholar]
  86. Mizui, T.; Kojima, N.; Yamazaki, H.; Katayama, M.; Hanamura, K.; Shirao, T. Drebrin E is involved in the regulation of axonal growth through actin-myosin interactions. J. Neurochem. 2009, 109, 611–622. [Google Scholar] [CrossRef]
  87. Hayashi, K.; Ishikawa, R.; Ye, L.-H.; He, X.-L.; Takata, K.; Kohama, K.; Shirao, T. Modulatory role of drebrin on the cytoskeleton within dendritic spines in the rat cerebral cortex. J. Neurosci. 1996, 16, 7161–7170. [Google Scholar] [CrossRef] [PubMed]
  88. Ivanov, A.; Esclapez, M.; Pellegrino, C.; Shirao, T.; Ferhat, L. Drebrin A regulates dendritic spine plasticity and synaptic function in mature cultured hippocampal neurons. J. Cell Sci. 2009, 122 Pt 4, 524–534. [Google Scholar] [CrossRef]
  89. Takahashi, H.; Mizui, T.; Shirao, T. Down-regulation of drebrin A expression suppresses synaptic targeting of NMDA receptors in developing hippocampal neurones. J. Neurochem. 2006, 97 (Suppl. S1), 110–115. [Google Scholar] [CrossRef]
  90. Harigaya, Y.; Shoji, M.; Shirao, T.; Hirai, S. Disappearance of actin-binding protein, drebrin, from hippocampal synapses in Alzheimer’s disease. J. Neurosci. Res. 1996, 43, 87–92. [Google Scholar] [CrossRef]
  91. Liu, Y.; Xu, Y.F.; Zhang, L.; Huang, L.; Yu, P.; Zhu, H.; Deng, W.; Qin, C. Effective expression of Drebrin in hippocampus improves cognitive function and alleviates lesions of Alzheimer’s disease in APP (swe)/PS1 (ΔE9) mice. CNS Neurosci. Ther. 2017, 23, 590–604. [Google Scholar] [CrossRef]
  92. Stevens, R.J.; Littleton, J.T. Synaptic growth: Dancing with adducin. Curr. Biol. 2011, 21, R402–R405. [Google Scholar] [CrossRef] [PubMed]
  93. Kosturko, L.D.; Maggipinto, M.J.; Korza, G.; Lee, J.W.; Carson, J.H.; Barbarese, E. Heterogeneous nuclear ribonucleoprotein (hnRNP) E1 binds to hnRNP A2 and inhibits translation of A2 response element mRNAs. Mol. Biol. Cell 2006, 17, 3521–3533. [Google Scholar] [CrossRef] [PubMed]
  94. Jung, Y.; Seo, J.Y.; Ryu, H.G.; Kim, D.Y.; Lee, K.H.; Kim, K.T. BDNF-induced local translation of GluA1 is regulated by HNRNP A2/B1. Sci. Adv. 2020, 6, eabd2163. [Google Scholar] [CrossRef]
  95. Groot, M.; Lee, H. Sorting Mechanisms for MicroRNAs into Extracellular Vesicles and Their Associated Diseases. Cells 2020, 9, 1044. [Google Scholar] [CrossRef] [PubMed]
  96. Li, C.; Qin, F.; Wang, W.; Ni, Y.; Gao, M.; Guo, M.; Sun, G. hnRNPA2B1-Mediated Extracellular Vesicles Sorting of miR-122-5p Potentially Promotes Lung Cancer Progression. Int. J. Mol. Sci. 2021, 22, 12866. [Google Scholar] [CrossRef] [PubMed]
  97. Bosch, M.E.; Kielian, T. Astrocytes in juvenile neuronal ceroid lipofuscinosis (CLN3) display metabolic and calcium signaling abnormalities. J. Neurochem. 2019, 148, 612–624. [Google Scholar] [CrossRef] [PubMed]
  98. Jebelli, J.; Piers, T.; Pocock, J. Selective Depletion of Microglia from Cerebellar Granule Cell Cultures Using L-leucine Methyl Ester. J. Vis. Exp. 2015, e52983. [Google Scholar]
  99. Demmer, J.; Dragunow, M.; Lawlor, P.A.; Mason, S.E.; Leah, J.D.; Abraham, W.C.; Tate, W.P. Differential expression of immediate early genes after hippocampal long-term potentiation in awake rats. Brain Res. Mol. Brain Res. 1993, 17, 279–286. [Google Scholar] [CrossRef]
  100. Wiśniewski, J.R. Filter-Aided Sample Preparation: The Versatile and Efficient Method for Proteomic Analysis. Methods Enzymol. 2017, 585, 15–27. [Google Scholar]
  101. Sweetman, E.; Kleffmann, T.; Edgar, C.; de Lange, M.; Vallings, R.; Tate, W. A SWATH-MS analysis of Myalgic Encephalomyelitis/Chronic Fatigue Syndrome peripheral blood mononuclear cell proteomes reveals mitochondrial dysfunction. J. Transl. Med. 2020, 18, 365. [Google Scholar] [CrossRef]
  102. Franceschini, A.; Szklarczyk, D.; Frankild, S.; Kuhn, M.; Simonovic, M.; Roth, A.; Lin, J.; Minguez, P.; Bork, P.; Von Mering, C.; et al. STRING v9.1: Protein-protein interaction networks, with increased coverage and integration. Nucleic Acids Res. 2013, 41, D808-15. [Google Scholar] [CrossRef] [PubMed]
  103. Szklarczyk, D.; Gable, A.L.; Lyon, D.; Junge, A.; Wyder, S.; Huerta-Cepas, J.; Simonovic, M.; Doncheva, N.T.; Morris, J.H.; Bork, P.; et al. STRING v11: Protein-protein association networks with increased coverage, supporting functional discovery in genome-wide experimental datasets. Nucleic Acids Res. 2019, 47, D607–D613. [Google Scholar] [CrossRef] [PubMed]
  104. Morrissey, J.A.; Mockett, B.G.; Singh, A.; Kweon, D.; Ohline, S.M.; Tate, W.P.; Hughes, S.M.; Abraham, W.C. A C-terminal peptide from secreted amyloid precursor protein-alpha enhances long-term potentiation in rats and a transgenic mouse model of Alzheimer’s disease. Neuropharmacology 2019, 157, 107670. [Google Scholar] [CrossRef] [PubMed]
Figure 1. Primary cell cultures are enriched with astrocytes. Representative images from immunocytochemical analysis of DIV21 mouse primary astrocyte cultures using astrocytic markers (GFAP and s100b) and microglial marker (CD68). (A) anti-GFAP (red); (B) anti-s100b (green); (C) co-staining with anti-GFAP (red), anti-s100b (green); (D) anti-CD68 (yellow). Microglia are indicated by white arrows. In all images, the nuclei were stained with DAPI (blue). Scale bars: 50 mm.
Ijms 24 07165 g001
Figure 2. Astrocyte proteome volcano plots after sAPPα treatment. (A). Protein level data (B). Peptide-level data. Volcano plots show the −log10 p-value (y-axis) against Log2 fold change (x-axis) at 2 h to highlight any down-regulated (orange points, top left) and up-regulated proteins (orange points, top right), which meet the criteria for selection of a fold change minimum of 1.5 (log2 fold change ≤ −0.58 or ≥0.58) with a p-value of ≤0.05 (−log10 (p-value) ≤ 1.3). Blue points represent proteins where there has been no significant change to meet the criteria.
Ijms 24 07165 g002
Figure 3. First-order interaction partners of APP (proteome, peptide-level data). Differentially regulated proteins that are functionally associated with APP according to a STRING functional network analysis. The nodes highlighted in red are involved in the regulation of proteolysis and protein catabolic processes. The symbols are designated in Table 3.
Ijms 24 07165 g003
Figure 4. MCL Cluster Analysis of peptide-level proteome data. A selection of enriched GO terms is highlighted. STRING network of differentially expressed proteins was associated with enriched GO terms (coloured). Proteins (nodes) are coloured according to the different clusters they were assigned to after applying the Markov Clustering Algorithm (MCL) (Brohée and van Helden, 2006) [60].
Ijms 24 07165 g004
Figure 5. Volcano plots of the proteins identified in the astrocyte secretome from sAPPα-treated cells and matched untreated controls. (A). Protein level (B). Peptide-level volcano plots the −log10 p-value (y-axis) against log2 fold change (x-axis) at 6 h to highlight any down-regulated (left box-orange points) and up-regulated (right box-orange points) proteins, which meet the criteria for selection of a minimum of 1.5-fold change (log2 fold change ≤ −0.58 or ≥0.58) with a p-value of ≤0.05 (−log10 (p-value) ≤ 1.3). Blue points represent proteins where there has been no significant change to meet the criteria.
Ijms 24 07165 g005
Figure 6. STRING functional network analysis of differentially secreted proteins (peptide-level data) from primary astrocytes after exposure to 1 nM sAPPα for 6 h. The network shows three main clusters, which are enriched with the following functional pathway terms. Red cluster: supramolecular fibre organization (for example, actin), synapse and extracellular matrix organization. Green cluster: carboxylic acid metabolic process and myelin sheath. Yellow cluster: ribosome biogenesis and proteasome complex. APP forms the central node in the largest cluster (red cluster), with 13 first-order edges within the cluster.
Ijms 24 07165 g006
Table 1. Enriched GO terms. A selection of enriched categories linked to neurological function. GO component: Gene Ontology Cellular Component; GO Process: Gene Ontology Biological Process. Abbreviations: OGC, overall gene count; BGC, background gene count; FDR, false discovery rate. Refer to Supplementary Table S3 for related proteins.
CategoryGO Term IDGO Term DescriptionOGCBGCStrengthFDR
GO ComponentGO:0045202Synapse4814920.421.11 × 10−7
GO:0030054Cell junction5820500.371.50 × 10−7
GO:0030424Axon267910.430.00031
GO:0005856Cytoskeleton5720600.363.72 × 10−7
GO:0015630Microtubule cytoskeleton3211900.350.0011
GO:0098794Postsynapse287610.481.78 × 10−5
GO:0030135Coated vesicle122100.670.00074
GO:0031982Vesicle4620070.280.00097
GO:0098978Glutamatergic synapse195010.50.00078
GO:0099572Postsynaptic specialization174490.50.0018
GO:0043209Myelin sheath112120.630.0026
GO:0043005Neuron projection3715830.290.0033
GO:0120025Plasma-membrane-bounded cell projection5323870.260.00058
GO:0043197Dendritic spine102120.590.0083
GO:0098984Neuron-to-neuron synapse154460.440.0097
GO:0014069Postsynaptic density144140.450.0128
GO:0099571Postsynaptic cytoskeleton3171.160.0254
GO:0030425Dendrite197530.320.0348
GO ProcessGO:0007010Cytoskeleton organization3310640.410.00026
GO:0007015Actin filament organization142430.680.0006
GO:0030036Actin cytoskeleton organization194960.50.0025
GO:0030029Actin filament-based process205510.480.0031
GO:0097435Supramolecular fibre organization224690.593.82 × 10−5
GO:0008064Regulation of actin polymerization or depolymerization111810.70.0033
GO:0030705Cytoskeleton-dependent intracellular transport111860.690.004
GO:0110053Regulation of actin filament organization122660.570.0154
GO:0051493Regulation of cytoskeleton organization185410.440.0161
GO:0010970Transport along microtubule91550.680.0175
GO:1902683Regulation of receptor localization to synapse5251.220.0039
KEGGmmu05014Amyotrophic lateral sclerosis203640.667.34 × 10−6
mmu05012Parkinson disease162390.749.20 × 10−6
mmu05016Huntington disease172960.682.15 × 10−5
mmu05010Alzheimer disease183590.625.02 × 10−5
ReactomeMMU-195721Signaling by WNT132300.670.0013
Monarch MPOMP:0010768Mortality/aging12455490.272.04 × 10−10
Table 2. Differentially regulated proteins associated with APP. A STRING network analysis assigns scores relating to the strength of evidence that two proteins are functionally associated, derived from either co-expression data, an experimentally determined interaction, referred to within the same publication, or together in a database. The combined score (>0.4) is indicative of significance, and the interaction was confirmed by a literature search.
Node1Node2CoexpressionExperimentally
Determined Interaction
Database
Annotated
Automated
Textmining
Combined
Score
APPCAV10.0980.09100.3710.439
APPSNX2700.1300.40.455
APPFUS0000.4740.474
APPGSK30.061000.4680.479
APPDBN10.116000.5280.565
APPSTUB100.43900.3170.6
APPADAM90.0760.05300.610.629
APPERC10.062000.6790.686
APPSOD10000.720.72
APPSNX1700.06100.720.726
APPBIN10.09800.540.6810.856
APPGSK3B0.0560.42700.790.876
APPKLC10.1180.40200.9050.946
APPNFIB0.062000.9620.963
APPPSEN20.0480.6230.5020.9330.986
Table 3. A selection of neurologically significant astrocyte proteins regulated by sAPPα derived from the proteome peptide-level data. Functional pathway analysis using the STRING database highlighted proteins that were associated with (i) a first-level interaction with APP, (ii) GO terms with neurological function (synapse, neuron projection, myelin sheath and cytoskeleton) and (iii) the Alzheimer’s disease KEGG pathway. Abbreviation: FC, fold change. The Ijms 24 07165 i001 indicates the protein was classified to be in that category.
(A) Up-Regulated
SymbolProtein NameFCp-ValueAPP RelatedSynapseNeuron ProjectionMyelin SheathCytoskeletonAlzheimer’s Disease
DBN1Drebrin 19.512.30 × 10−2Ijms 24 07165 i001Ijms 24 07165 i001 Ijms 24 07165 i001
CYC1Cytochrome c-18.313.57 × 10−4 Ijms 24 07165 i001
ERC1ELKS/Rab6-interacting/CAST family member 13.823.41 × 10−2Ijms 24 07165 i001Ijms 24 07165 i001 Ijms 24 07165 i001
RPS7Ribosomal protein S73.473.29 × 10−2 Ijms 24 07165 i001 Ijms 24 07165 i001
RPL2660S ribosomal protein L262.862.93 × 10−2 Ijms 24 07165 i001Ijms 24 07165 i001
ADNPActivity-dependent neuroprotective protein2.673.89 × 10−2 Ijms 24 07165 i001
TBCATubulin cofactor A2.652.66 × 10−2 Ijms 24 07165 i001
MYL6Myosin light polypeptide 62.641.21 × 10−2 Ijms 24 07165 i001
XRN15′-3′ exoribonuclease 12.629.61 × 10−3 Ijms 24 07165 i001Ijms 24 07165 i001
PRC1Protein regulator of cytokinesis 12.545.44 × 10−3 Ijms 24 07165 i001
WASLWASP-like actin-nucleation-promoting factor 2.353.04 × 10−2 Ijms 24 07165 i001 Ijms 24 07165 i001
PRKAA1Protein kinase, AMP-activated, alpha 1 catalytic subunit2.342.13 × 10−2 Ijms 24 07165 i001
SOD1Superoxide dismutase 1, soluble2.336.13 × 10−4Ijms 24 07165 i001 Ijms 24 07165 i001Ijms 24 07165 i001
NDUFS8NADH:ubiquinone oxidoreductase core subunit S82.272.02 × 10−2 Ijms 24 07165 i001
BRK1BRICK1, SCAR/WAVE actin-nucleating complex subunit2.254.68 × 10−4 Ijms 24 07165 i001
TMOD3Tropomodulin 32.223.60 × 10−3 Ijms 24 07165 i001
TACC3Transforming, acidic coiled-coil containing protein 32.162.57 × 10−2 Ijms 24 07165 i001
RIF1Telomere-associated protein RIF12.096.85 × 10−3 Ijms 24 07165 i001
ErbinErbb2 interacting protein/LAP22.044.71 × 10−2 Ijms 24 07165 i001
HYPKHuntingtin interacting protein K2.031.45 × 10−2 Ijms 24 07165 i001
PSMD4Proteasome 26S subunit, non-ATPase, 42.025.66 × 10−3 Ijms 24 07165 i001
SEPTIN2Septin-21.991.53 × 10−2 Ijms 24 07165 i001Ijms 24 07165 i001Ijms 24 07165 i001Ijms 24 07165 i001
MPP1Membrane protein, palmitoylated 1.982.34 × 10−3 Ijms 24 07165 i001 Ijms 24 07165 i001
FNTAFarnesyltransferase, CAAX box, alpha1.983.18 × 10−3 Ijms 24 07165 i001
PLEKHA7Pleckstrin homology domain containing family A member 71.958.09 × 10−3 Ijms 24 07165 i001
SRISorcin1.944.84 × 10−2 Ijms 24 07165 i001Ijms 24 07165 i001
NEXNNexilin1.923.68 × 10−2 Ijms 24 07165 i001 Ijms 24 07165 i001
KLC1Kinesin light chain 11.892.35 × 10−2Ijms 24 07165 i001 Ijms 24 07165 i001 Ijms 24 07165 i001Ijms 24 07165 i001
EPB4.1Erythrocyte membrane protein band 4.11.894.72 × 10−2 Ijms 24 07165 i001 Ijms 24 07165 i001
RPS1940S ribosomal protein S191.873.56 × 10−3 Ijms 24 07165 i001
WDR1WD repeat domain 11.852.38 × 10−2 Ijms 24 07165 i001Ijms 24 07165 i001
SNX17Sorting nexin 171.781.62 × 10−3Ijms 24 07165 i001
COX6B1Cytochrome c oxidase, subunit 6B11.773.64 × 10−2 Ijms 24 07165 i001
MYO1EMyosin IE1.773.65 × 10−2 Ijms 24 07165 i001
SEPTIN11Septin 111.743.61 × 10−2 Ijms 24 07165 i001Ijms 24 07165 i001 Ijms 24 07165 i001
HNRNPCHeterogeneous nuclear ribonucleoprotein C 1.742.84 × 10−2 Ijms 24 07165 i001
MTPNMyotrophin1.741.76 × 10−2 Ijms 24 07165 i001
VSP4BVacuolar protein sorting 4B1.743.73 × 10−2 Ijms 24 07165 i001
DCTN2Dynactin 21.734.21 × 10−3 Ijms 24 07165 i001 Ijms 24 07165 i001
RPL17Ribosomal protein L171.732.74 × 10−4 Ijms 24 07165 i001
YWHAHTryptophan 5-monooxygenase activation protein1.711.25 × 10−2 Ijms 24 07165 i001
AP3B1Adaptor-related protein complex 3, beta 1 subunit1.712.06 × 10−2 Ijms 24 07165 i001Ijms 24 07165 i001
STK39STE20/SPS1-related proline-alanine-rich protein kinase1.704.09 × 10−2 Ijms 24 07165 i001
ARL6IP5ADP-ribosylation factor-like 6 interacting protein 51.684.25 × 10−2 Ijms 24 07165 i001
ITGB5Integrin beta 51.684.91 × 10−3 Ijms 24 07165 i001
PPP2CAProtein phosphatase 2 (formerly 2A), catalytic subunit1.671.06 × 10−2 Ijms 24 07165 i001Ijms 24 07165 i001 Ijms 24 07165 i001
ELAVL1ELAV (embryonic lethal, abnormal vision)-like 1 1.654.34 × 10−2 Ijms 24 07165 i001
NEFMNeurofilament medium polypeptide 1.652.08 × 10−2 Ijms 24 07165 i001Ijms 24 07165 i001Ijms 24 07165 i001Ijms 24 07165 i001
TBCELTubulin-specific chaperone cofactor E-like protein1.652.47 × 10−2 Ijms 24 07165 i001
TWF1Twinfilin actin-binding protein 11.632.01 × 10−2 Ijms 24 07165 i001
BIN1Bridging integrator 11.614.03 × 10−2Ijms 24 07165 i001Ijms 24 07165 i001Ijms 24 07165 i001 Ijms 24 07165 i001
TUFMTu translation elongation factor, mitochondrial1.602.22 × 10−2 Ijms 24 07165 i001 Ijms 24 07165 i001
MCM3Minichromosome maintenance complex component 31.591.39 × 10−2 Ijms 24 07165 i001
SH3GLB1SH3-domain GRB2-like B1 (endophilin)1.592.92 × 10−2 Ijms 24 07165 i001Ijms 24 07165 i001
TPM4Tropomyosin 4 1.592.61 × 10−2 Ijms 24 07165 i001
CDC42Cell division cycle 42 1.595.83 × 10−4 Ijms 24 07165 i001Ijms 24 07165 i001Ijms 24 07165 i001Ijms 24 07165 i001
CLTACathrin light chain A1.591.32 × 10−2 Ijms 24 07165 i001
NPM3Nucleoplasmin 31.592.29 × 10−4 Ijms 24 07165 i001
RPLP2Ribosomal protein, large P21.594.35 × 10−2 Ijms 24 07165 i001
RPL2960S ribosomal protein L291.581.81 × 10−2 Ijms 24 07165 i001Ijms 24 07165 i001
PSMD2proteasome 26S subunit, non-ATPase, 21.589.68 × 10−3 Ijms 24 07165 i001
DDAH2N(G),N(G)-dimethylarginine dimethylaminohydrolase 21.583.30 × 10−2 Ijms 24 07165 i001
NPTNNeuroplastin1.569.91 × 10−3 Ijms 24 07165 i001
KPNA2Karyopherin (importin) alpha 21.544.27 × 10−2 Ijms 24 07165 i001
MDH2Malate dehydrogenase 2, NAD (mitochondrial)1.528.93 × 10−3 Ijms 24 07165 i001
MAP2K1Mitogen-activated protein kinase kinase 11.524.53 × 10−2 Ijms 24 07165 i001Ijms 24 07165 i001 Ijms 24 07165 i001Ijms 24 07165 i001
(B) Down-regulated
SymbolProtein NameFCp-ValueAPP RelatedSynapseNeuron ProjectionMyelin SheathCytoskeletonAlzheimer’s Disease
RPS6KA1Ribosomal protein S6 kinase polypeptide 10.0031.16 × 10−2 Ijms 24 07165 i001
GPC4Glypican 40.0032.21 × 10−3 Ijms 24 07165 i001
SNX27Sorting nexin family member 270.207.92 × 10−3Ijms 24 07165 i001Ijms 24 07165 i001
PCNAProliferating cell nuclear antigen0.221.77 × 10−7 Ijms 24 07165 i001
NDUFB9NADH:ubiquinone oxidoreductase subunit B90.274.10 × 10−2 Ijms 24 07165 i001
NEK9NIMA (never in mitosis gene a)-related expressed kinase 90.275.78 × 10−4 Ijms 24 07165 i001
HNRNPA2B1Heterogeneous nuclear ribonucleoproteins A2/B10.308.82 × 10−4 Ijms 24 07165 i001Ijms 24 07165 i001
FARP1FERM, RhoGEF (Arhgef) and pleckstrin domain protein 1 0.331.65 × 10−2 Ijms 24 07165 i001Ijms 24 07165 i001 Ijms 24 07165 i001
GSK3Glycogen synthase kinase-30.373.43 × 10−6Ijms 24 07165 i001Ijms 24 07165 i001Ijms 24 07165 i001 Ijms 24 07165 i001Ijms 24 07165 i001
GSK3Lysosomal-associated membrane protein 20.382.43 × 10−2Ijms 24 07165 i001
NDUFV1NADH:ubiquinone oxidoreductase core subunit V10.382.03 × 10−2 Ijms 24 07165 i001
STOML2Stomatin (Epb7.2)-like 20.408.65 × 10−3 Ijms 24 07165 i001
GLSGlutaminase0.411.87 × 10−2 Ijms 24 07165 i001
STUB1STIP1 homology and U-Box containing protein 1 0.421.09 × 10−2Ijms 24 07165 i001
DARSAspartyl-tRNA synthetase0.423.17 × 10−2 Ijms 24 07165 i001
NDUFS2NADH:ubiquinone oxidoreductase core subunit S20.428.08 × 10−4 Ijms 24 07165 i001
COPG2Coatomer protein complex, subunit gamma 20.431.53 × 10−2 Ijms 24 07165 i001
ENAHProtein-enabled homolog0.431.59 × 10−2 Ijms 24 07165 i001 Ijms 24 07165 i001
PSEN2Presenilin 20.442.04 × 10−2Ijms 24 07165 i001Ijms 24 07165 i001 Ijms 24 07165 i001Ijms 24 07165 i001
ND4NADH dehydrogenase 40.461.49 × 10−3 Ijms 24 07165 i001
GLRX5Glutaredoxin 50.473.15 × 10−2 Ijms 24 07165 i001
LAMC1Laminin subunit gamma-1 precursor0.481.35 × 10−2 Ijms 24 07165 i001
NFIBNuclear factor I/B0.492.03 × 10−3Ijms 24 07165 i001 Ijms 24 07165 i001
ATP5DATP synthase, H+ transporting, mitochondrial F1 complex, delta subunit 0.493.26 × 10−2 Ijms 24 07165 i001
NDRG2Protein NDRG2, cytoplasmic protein Ndr10.521.64 × 10−2 Ijms 24 07165 i001Ijms 24 07165 i001
DMDDystrophin, muscular dystrophy 0.561.33 × 10−2 Ijms 24 07165 i001Ijms 24 07165 i001 Ijms 24 07165 i001
COX5BCytochrome c oxidase subunit 5B0.571.45 × 10−2 Ijms 24 07165 i001
FUSFused in sarcoma0.582.30 × 10−2Ijms 24 07165 i001Ijms 24 07165 i001Ijms 24 07165 i001
PSMD3Proteasome 26S subunit, non-ATPase, 30.598.54 × 10−3 Ijms 24 07165 i001
LIMA1LIM domain and actin-binding 1 0.613.95 × 10−2 Ijms 24 07165 i001
COX7A2Cytochrome c oxidase subunit 7A20.612.63 × 10−2 Ijms 24 07165 i001
ADAM9a disintegrin and metallopeptidase domain 9 0.623.11 × 10−2Ijms 24 07165 i001
ITSN1Intersectin 1 (SH3 domain protein 1A)0.622.74 × 10−2 Ijms 24 07165 i001Ijms 24 07165 i001 Ijms 24 07165 i001
RPL18ARibosomal protein L18A0.633.74 × 10−2 Ijms 24 07165 i001
CAV1Caveolin 1, caveolae protein0.641.70 × 10−2Ijms 24 07165 i001
CKBCreatine kinase0.651.48 × 10−3 Ijms 24 07165 i001Ijms 24 07165 i001
ARHGAP39rho GTPase-activating protein 390.653.28 × 10−2 Ijms 24 07165 i001 Ijms 24 07165 i001
PHB2Prohibitin 20.662.09 × 10−2 Ijms 24 07165 i001Ijms 24 07165 i001
ATP6V1B2ATPase, H+ transporting, lysosomal V1 subunit B20.667.47 × 10−3 Ijms 24 07165 i001
NEDD1Neural precursor cell-expressed, developmentally down-regulated gene 10.667.56 × 10−3 Ijms 24 07165 i001
ADD1Adducin 1 (alpha) 0.663.22 × 10−2 Ijms 24 07165 i001Ijms 24 07165 i001 Ijms 24 07165 i001
SLC25A4Solute carrier family 25 0.673.22 × 10−2 Ijms 24 07165 i001 Ijms 24 07165 i001
Table 4. Enriched GO terms (secreted proteins, peptide-level data). A selection of significantly enriched GO terms related to the proteins that were secreted from astrocytes after sAPPα exposure. GO component, Gene Ontology Cellular Component; GO Process, Gene Ontology Biological Process. Abbreviations: OGC, overall gene count; BGC, background gene count; FDR, false discovery rate. Refer to Supplementary Table S6 for related proteins and a full list of enriched GO terms.
CategoryGO Term IDGO Term DescriptionOGCBGCStrengthFDR
GO ProcessGO:0050807Regulation of synapse organization72750.790.0278
GO:0050808Synapse organization73030.750.0412
GO:0030036Actin cytoskeleton organization114960.730.0038
GO:0007010Cytoskeleton organization1410640.50.0241
GO:0034330Cell junction organization94810.660.0304
GO ComponentGO:0005576Extracellular region3422290.579.14 × 10−9
GO:0005615Extracellular space2414240.617.45 × 10−7
GO:0043209Myelin sheath122121.145.67 × 10−8
GO:0045202Synapse2414920.591.57 × 10−6
GO:0098794Postsynapse127610.580.0034
GO:0098978Glutamatergic synapse95010.640.0085
GO:0030424Axon137910.60.0015
GO:0043005Neuron projection1915830.460.0015
GO:0030426Growth cone72240.880.0024
GO:0150034Distal axon93990.740.0024
GO:0031982Vesicle2120070.40.0028
COMPARTMENTSGOCC:1903561Extracellular vesicle5931.110.0052
GO:0043197Dendritic spine62120.840.0089
GO:0044295Axonal growth cone3421.240.0194
GOCC:0120025Plasma-membrane-bounded cell projection1717740.370.0364
GO:0014069Postsynaptic density74140.610.0335
KEGGmmu00330Arginine and proline metabolism4531.260.0033
mmu05010Alzheimer disease83590.730.0043
mmu05014Amyotrophic lateral sclerosis93640.780.0015
mmu05016Huntington disease82960.820.0017
mmu05017Spinocerebellar ataxia61401.020.0017
mmu05012Parkinson disease92390.960.00014
ReactomeMMU-381426Regulation of IGF transport and uptake by Insulin-like Growth Factor Binding Proteins (IGFBPs)101221.36.95 × 10−8
MMU-422475Axon guidance72780.790.0021
MMU-1474228Degradation of the extracellular matrix614410.00047
MMU-1474244Extracellular matrix organization112950.961.30 × 10−6
MMU-5687128MAPK6/MAPK4 signaling7741.361.11 × 10−6
MMU-3858494Beta-catenin-independent WNT signaling101271.288.04 × 10−8
MMU-5676590NIK → noncanonical NF-kB signaling7571.475.37 × 10−7
Monarch MPOMP:0010768Mortality/aging4455490.280.009
Table 5. Regulated secreted proteins (peptide-level data). Summary of functional pathway analysis using the STRING database of differentially secreted regulated proteins, with a known interaction with APP or with the following Gene Ontology terms; neuron projection, synapse, myelin sheath, actin cytoskeleton, IGF regulation (Reactome: mmu 381426), extracellular matrix organization or Alzheimer’s Disease. A. Down-regulated, B. Up-regulated. Abbreviation: FC, fold change. The Ijms 24 07165 i001 indicates the protein was classified to be in that category.
(A) Down-Regulated
SymbolProtein NameFCp-ValueAPP RelatedSynapseNeuron ProjectionMyelin SheathAlzheimer’s DiseaseECM OrganisationIGF RegulationActin Cytoskeleton
CDH13Cadherin-130.0031.73 × 10−3 Ijms 24 07165 i001
GDI2Rab GDP dissociation inhibitor beta0.012.34 × 10−2 Ijms 24 07165 i001 Ijms 24 07165 i001
DPYSL3Dihydropyrimidinase-related protein 30.134.03 × 10−2 Ijms 24 07165 i001Ijms 24 07165 i001 Ijms 24 07165 i001
QSOX1Sulfhydryl oxidase 10.222.11 × 10−3 Ijms 24 07165 i001
CSCitrate synthase0.338.97 × 10−3 Ijms 24 07165 i001
SERPINC1Antithrombin-III0.386.83 × 10−4 Ijms 24 07165 i001
EPHA4Ephrin type-A receptor 40.392.36 × 10−2Ijms 24 07165 i001Ijms 24 07165 i001Ijms 24 07165 i001
CKBCreatine kinase B-type0.403.63 × 10−2 Ijms 24 07165 i001Ijms 24 07165 i001
PSMB3Proteasome subunit beta type-30.486.94 × 10−4 Ijms 24 07165 i001
RPL10ALarge-subunit ribosomal protein l10ae0.521.25 × 10−2 Ijms 24 07165 i001
ANXA5Annexin A50.543.18 × 10−2 Ijms 24 07165 i001Ijms 24 07165 i001
CKMCreatine kinase M-type0.551.91 × 10−2 Ijms 24 07165 i001
CALUCalumenin0.561.57 × 10−2Ijms 24 07165 i001 Ijms 24 07165 i001
ENPP5Ectonucleotide pyrophosphatase0.572.92 × 10−2
PGK1Phosphoglycerate kinase 10.592.11 × 10−2 Ijms 24 07165 i001
AGRNAgrin0.594.81 × 10−2Ijms 24 07165 i001Ijms 24 07165 i001Ijms 24 07165 i001 Ijms 24 07165 i001
RPS27AUbiquitin-40S ribosomal protein S27a0.613.85 × 10−2 Ijms 24 07165 i001
ASRGL1Isoaspartyl peptidase/L-asparaginase0.614.45 × 10−2 Ijms 24 07165 i001
PSMB5Proteasome subunit beta type-50.661.06 × 10−2 Ijms 24 07165 i001
HSPA4LHeat shock 70 kDa protein 4L0.674.72 × 10−3Ijms 24 07165 i001
GOT2Glutamatic-oxaloacetic transaminase 20.671.38 × 10−2 Ijms 24 07165 i001
(B) Up-regulated
SymbolProtein NameFCp-ValueAPP RelatedSynapseNeuron ProjectionMyelin SheathAlzheimer’s DiseaseECM OrganisationIGF RegulationActin Cytoskeleton
SPARCSPARC1.571.88 × 10−2Ijms 24 07165 i001Ijms 24 07165 i001 Ijms 24 07165 i001
PDIA3Protein disulfide-isomerase A31.582.92 × 10−2Ijms 24 07165 i001 Ijms 24 07165 i001
AKR1A1Aldehyde reductase1.624.35 × 10−2 Ijms 24 07165 i001
ITIH2Inter-alpha-trypsin inhibitor heavy chain1.651.62 × 10−2 Ijms 24 07165 i001
CST3Cystatin-C1.681.20 × 10−2Ijms 24 07165 i001 Ijms 24 07165 i001 Ijms 24 07165 i001
GNAO1Guanine nucleotide-binding protein G(o)1.683.98 × 10−2Ijms 24 07165 i001 Ijms 24 07165 i001Ijms 24 07165 i001
SPTAN1Spectrin alpha chain, non-erythrocytic 11.722.70 × 10−2Ijms 24 07165 i001 Ijms 24 07165 i001Ijms 24 07165 i001 Ijms 24 07165 i001
CALM3Calmodulin-1; Calmodulin 31.731.06 × 10−2 Ijms 24 07165 i001Ijms 24 07165 i001Ijms 24 07165 i001Ijms 24 07165 i001
PEBP1Phosphatidylethanolamine-binding protein 1.732.37 × 10−2 Ijms 24 07165 i001Ijms 24 07165 i001Ijms 24 07165 i001
DBN1Drebrin 1; Drebrin1.731.96 × 10−2Ijms 24 07165 i001Ijms 24 07165 i001Ijms 24 07165 i001 Ijms 24 07165 i001
PSMB7Proteasome subunit, beta 1.731.40 × 10−2 Ijms 24 07165 i001
TPM1Tropomyosin alpha-1 chain1.763.22 × 10−2 Ijms 24 07165 i001
S100A6Protein S100-A61.764.37 × 10−2 Ijms 24 07165 i001
PAWRPRKC apoptosis WT1 regulator protein1.771.38 × 10−2 Ijms 24 07165 i001 Ijms 24 07165 i001
ACTN1Actinin alpha 1/4 (Alpha-actinin-1)1.802.70 × 10−2 Ijms 24 07165 i001 Ijms 24 07165 i001
COL5A2Collagen alpha-2(V) chain1.854.53 × 10−2 Ijms 24 07165 i001
HSP90B1Heat shock protein 90, Endoplasmin1.854.18 × 10−2Ijms 24 07165 i001 Ijms 24 07165 i001Ijms 24 07165 i001
RPL1460S ribosomal protein L141.881.04 × 10−2 Ijms 24 07165 i001
PSMD3Proteasome 26s subunit, non-atpase, 31.894.72 × 10−2 Ijms 24 07165 i001
COTL1Coactosin-like 1 (dictyostelium)1.964.92 × 10−2 Ijms 24 07165 i001 Ijms 24 07165 i001
SCRN1Secernin-11.988.80 × 10−3 Ijms 24 07165 i001
TPM4Tropomyosin alpha-4 chain2.003.81 × 10−2 Ijms 24 07165 i001
ADD1Adducin 1 (alpha); Alpha-adducin2.149.37 × 10−3Ijms 24 07165 i001Ijms 24 07165 i001Ijms 24 07165 i001 Ijms 24 07165 i001
LDHBLactate dehydrogenase B2.171.28 × 10−2 Ijms 24 07165 i001
MARCKSMyristoylated ala-rich C-kinase substrate2.179.25 × 10−3 Ijms 24 07165 i001
PSMD6Proteasome 26s subunit, non-atpase, 62.192.24 × 10−2 Ijms 24 07165 i001
BMP1Bone morphogenetic protein 12.253.66 × 10−2 Ijms 24 07165 i001 Ijms 24 07165 i001
ATP1A1Na/K-transporting ATPase subunit alpha-12.342.78 × 10−2 Ijms 24 07165 i001 Ijms 24 07165 i001
NESNestin2.361.04 × 10−2Ijms 24 07165 i001
GALCGalactosylceramidase2.493.20 × 10−2 Ijms 24 07165 i001
SPARCL1SPARC-like 12.651.41 × 10−2Ijms 24 07165 i001Ijms 24 07165 i001 Ijms 24 07165 i001
FN1Fibronectin2.672.79 × 10−2Ijms 24 07165 i001 Ijms 24 07165 i001Ijms 24 07165 i001
HNRNPA2BHeterogeneous nuclear ribonucleoprotein2.677.84 × 10−3 Ijms 24 07165 i001Ijms 24 07165 i001
PSMB1Proteasome subunit, beta type 12.782.27 × 10−3 Ijms 24 07165 i001
RPSA40S ribosomal protein SA3.103.00 × 10−2 Ijms 24 07165 i001
HSPD160 kDa heat shock protein, mitochondrial3.399.18 × 10−3Ijms 24 07165 i001 Ijms 24 07165 i001
NRD1Nardilysin4.174.66 × 10−4Ijms 24 07165 i001
SERPINH1Serpin H14.311.17 × 10−2 Ijms 24 07165 i001 Ijms 24 07165 i001
TUBB2ATubulin beta-2A chain4.372.47 × 10−5 Ijms 24 07165 i001
CTSDCathepsin D19.329.23 × 10−4 Ijms 24 07165 i001
APPAmyloid-beta A4 protein23.223.41 × 10−6Ijms 24 07165 i001 Ijms 24 07165 i001 Ijms 24 07165 i001Ijms 24 07165 i001Ijms 24 07165 i001
RPL10Ribosomal protein L1023.906.53 × 10−3 Ijms 24 07165 i001
P4HBProtein disulfide-isomerase24.031.03 × 10−2 Ijms 24 07165 i001Ijms 24 07165 i001
ALDOCFructose-bisphosphate aldolase, class i34.843.39 × 10−2 Ijms 24 07165 i001Ijms 24 07165 i001
CFL1Cofilin-1>1001.10 × 10−2Ijms 24 07165 i001Ijms 24 07165 i001Ijms 24 07165 i001 Ijms 24 07165 i001
Table 6. Proteins are regulated in both the astrocyte cellular proteome and the secretome. Seven proteins are found both in the proteome and secretome as differentially regulated, with three * regulated in the same direction and four depleted in the cellular proteome but elevated in the secretome.
ProteinProteome
(Fold Change)
Secretome
(Fold Change)
* CKB0.680.40
* DBN19.511.73
* TPM4 1.592.0
COL5a0.371.85
ADD0.662.14
PSMD30.591.89
HNRMP2b10.302.67
Disclaimer/Publisher’s Note: The statements, opinions and data contained in all publications are solely those of the individual author(s) and contributor(s) and not of MDPI and/or the editor(s). MDPI and/or the editor(s) disclaim responsibility for any injury to people or property resulting from any ideas, methods, instructions or products referred to in the content.

