Article

Genome-Wide Identification and Analysis of Stress Response of Trehalose-6-Phosphate Synthase and Trehalose-6-Phosphate Phosphatase Genes in Quinoa

Key Laboratory of Saline-Alkali Vegetation Ecology Restoration, Ministry of Education, College of Life Sciences, Northeast Forestry University, Harbin 150040, China
*
Author to whom correspondence should be addressed.
These authors contributed equally to this work.
Int. J. Mol. Sci. 2023, 24(8), 6950; https://doi.org/10.3390/ijms24086950
Submission received: 5 March 2023 / Revised: 3 April 2023 / Accepted: 6 April 2023 / Published: 9 April 2023
(This article belongs to the Special Issue Molecular Regulatory Mechanisms of Salinity Tolerance in Plants)

Abstract

:
Saline-alkali stress seriously affects the yield and quality of crops, threatening food security and ecological security. Improving saline-alkali land and increasing effective cultivated land are conducive to sustainable agricultural development. Trehalose, a nonreducing disaccharide, is closely related to plant growth and development and stress response. Trehalose 6-phosphate synthase (TPS) and trehalose-6-phosphate phosphatase (TPP) are key enzymes catalyzing trehalose biosynthesis. To elucidate the effects of long-term saline-alkali stress on trehalose synthesis and metabolism, we conducted an integrated transcriptome and metabolome analysis. As a result, 13 TPS and 11 TPP genes were identified in quinoa (Chenopodium quinoa Willd.) and were named CqTPS1-13 and CqTPP1-11 according to the order of their Gene IDs. Through phylogenetic analysis, the CqTPS family is divided into two classes, and the CqTPP family is divided into three classes. Analyses of physicochemical properties, gene structures, conservative domains and motifs in the proteins, and cis-regulatory elements, as well as evolutionary relationships, indicate that the TPS and TPP family characteristics are highly conserved in quinoa. Transcriptome and metabolome analyses of the sucrose and starch metabolism pathway in leaves undergoing saline-alkali stress indicate that CqTPP and Class II CqTPS genes are involved in the stress response. Moreover, the accumulation of some metabolites and the expression of many regulatory genes in the trehalose biosynthesis pathway changed significantly, suggesting the metabolic process is important for the saline-alkali stress response in quinoa.

1. Introduction

The increasing soil saline-alkalization affects ecological environments and seriously reduces crop yields. On the contrary, the growing population in the world would require greater food production. This will lead to a contradiction between the supply and demand of food in the near future. The improvement of saline-alkali land can increase the area of the effectively cultivated land, which is very important for the sustainable development of agriculture. The total area of saline-alkali land in China is about 9.91 × 10⁴ km2 [1]. The saline-alkali land in northeast China, also known as soda saline-alkali land, contains a high concentration of carbonate, including Na2CO3 and NaHCO3, etc. [2,3].
Salt stress leads to ion toxicity and osmotic stress, disrupting metabolism and ion homeostasis, resulting in impaired photosynthesis, disordered metabolic process, and retarded root development, and thus inhibits plant growth and development which leads to a decline in crop yields [4,5,6,7]. In addition to ion toxicity and osmotic stress, alkali stress aggravates the damage to cell structure and activities. Saline-alkali stress causes serious interference with metabolic processes (e.g., carbohydrate degradation and nitrogen metabolism retardation) and significant changes in the contents of inorganic and organic ions, carbohydrates (amino acids and sugars, e.g., proline, sucrose, trehalose, and fructose), ROS, and MDA, etc. [8,9,10].
The carbohydrates are mainly synthesized by starch and sucrose metabolism and related pathways, e.g., glycolysis/gluconeogenesis, and amino sugar and nucleotide sugar metabolism [11]. The starch and sucrose metabolic pathway plays important roles in plant growth and development, yield quality, and stress response. The products and intermediate products not only provide carbon sources for plant growth and development but also participate in many biological processes, acting as signal molecules [12]. Various enzymes, e.g., sucrose phosphate synthase (SPS), sucrose synthase (SUS), and invertase (INV), participate in sucrose biosynthesis, distribution, and accumulation in plants [13]. The content of sucrose is an important factor for controlling the transport tempo of nutrients, directly affecting the growth, yield, and quality of crops [14]. In plants, starch is the most abundant carbohydrate reserve as the source of carbon and energy. Glucose is the precursor of starch biosynthesis in the chloroplasts and amyloplasts [15,16]. Starch metabolism is a complex and tightly regulated process involving several classes of enzymes, including ADP glucose phosphorylase (AGPase), starch synthase (SS), starch branching enzyme (SBE), starch debranching enzyme (DBE), phosphorylase (PHO), and disproportionation enzyme (DPE).
Trehalose (α-d-glucopyranosyl (1-1)-α-d-glucopyranoside), a nonreducing disaccharide, is produced in the starch and sucrose metabolism process [17]. Trehalose affects carbon allocation in plants and plays an important role in plant growth and development and stress response. Trehalose is synthesized from UDP-glucose (UDPG) and glucose 6-phosphate (Glc6P), which are catalyzed by trehalose-6-phosphate synthase (TPS) to form trehalose-6-phosphate (T6P), and then trehalose-6-phosphate phosphatase (TPP) dephosphorylates T6P to produce trehalose [17]. In addition to acting as a precursor of trehalose, T6P is also an important signal molecule for plant growth and development via dynamically regulating sucrose metabolism [18,19]. T6P inhibits the activity of sucrose nonfermenting-1-related protein kinase 1 (SnRK1) in plants [20]. The interaction between T6P and SnRK1 facilitates the maintenance of sugar homeostasis in plants [21].
In addition to catalyzing trehalose biosynthesis, TPSs and TPPs can improve plant stress tolerance. Salt stress induces TPS expression in wheat and improves OsTPP1 expression in rice [22,23]. Overexpression of OsTPS1 in rice increases the aglucon and proline content and promotes the upregulation of some stress-response genes, thereby enhancing tolerance to cold, drought, and salinity in rice [23,24]. Ectopic overexpression of the yeast TPS1 gene in potato also enhances drought tolerance [25]. The Arabidopsis TPS1 gene plays a key role in embryo development and flowering, and AtTPS1 depletion mutants are embryonically lethal [26]. Although the TPS/TPP pathway has been well-characterized in many species, little is known about the TPPs and TPSs in quinoa.
Quinoa (Chenopodium quinoa Willd.) is an annual dicotyledonous herbaceous crop of the Amaranthaceae family. Quinoa grains have high protein contents and excellent amino acid composition, including all essential amino acids required for the human body. Quinoa grains contain abundant natural antioxidant substances, vitamins, dietary fiber, and minerals [27]. Moreover, quinoa is cholesterol- and gluten-free and is an ideal food for certain patients or sensitive people. Based on these characteristics, the research on quinoa has received extensive attention. Moreover, the publication and upgrading of the quinoa genome sequence greatly promoted the research on quinoa [28].
In this study, we identified 13 TPS genes and 11 TPP genes in quinoa by genome sequence search and conserved domain search. The CqTPS and CqTPP genes were classified according to conservative domain and motif analysis. Furthermore, transcriptome and metabolome analyses were performed and clarified the important roles of CqTPS and CqTPP genes as well as starch and sucrose metabolism in the saline-alkali stress response in quinoa. Our study provides basic information for understanding the characteristics of the CqTPS and CqTPP gene families in quinoa and their functions in response to saline-alkali stress.

2. Results

2.1. Genome-Wide Identification of TPS and TPP Gene Family in Quinoa

In order to identify TPS and TPP family members in quinoa, the amino acid sequences of AtTPS1 (Accession No.: XM_002889154.1) and AtTPP1 (Accession No.: NM_001344938.1) were used as references to perform local BLAST based on the genome database of quinoa (Chenopodium quinoa Willd.). The family members were further confirmed according to the conservative domains. As a result, thirteen TPS proteins and eleven TPP proteins were identified in quinoa (Table 1 and Table 2) and were named CqTPS1-CqTPS13 and CqTPP1-CqTPP11 according to the Gene IDs. The CqTPS protein length is between 501 (CqTPS6) and 1173 (CqTPS12) amino acid residue numbers (aa), but most of the CqTPSs contained between 830 and 1173. This might be associated with differences in the protein domain. And the molecular weight of CqTPSs is between 56.16 kDa (CqTPS12) and 130.87 kDa (CqTPS12). The isoelectric point (pI) of all CqTPS proteins is less than 7; namely, they belong to acidic proteins. The CqTPP protein length is between 324 (CqTPP9) and 387 (CqTPP6) aa, and the molecular weight is between 37.08 kDa (CqTPP9) and 43.28 kDa (CqTPP6). Most CqTPPs belong to basic amino acids with an IP higher than 7, apart from TPP9 and TPP11, the two acidic proteins with pI5.97 and 6.80, respectively.

2.2. Phylogenetic Analysis of TPS and TPP Family Genes in Quinoa

To assess the TPS or TPP evolutionary relationship of Chenopodium quinoa Willd, Arabidopsis thaliana (L.), and Gossypium hirsutum Linn. [29,30,31,32], the phylogenetic trees of the TPS and TPP gene families were constructed, respectively. According to the phylogenetic tree, the TPS family members were divided into two classes (Figure 1A). Class I includes four AtTPSs, six GrTPSs, and six CqTPSs, and Class II includes seven AtTPSs, nine GrTPSs, and seven CqTPSs. The TPP family is divided into three classes (Figure 1B). Class I includes seven AtTPPs, six GrTPPs, and four CqTPPs, Class II includes three AtTPPs, four GrTPPs, and four CqTPPs, and Class III only includes three CqTPPs and two GrTPPs without an AtTPP homologue.

2.3. Analysis of Primary Structures of Genes and Proteins of CqTPSs and CqTPPs

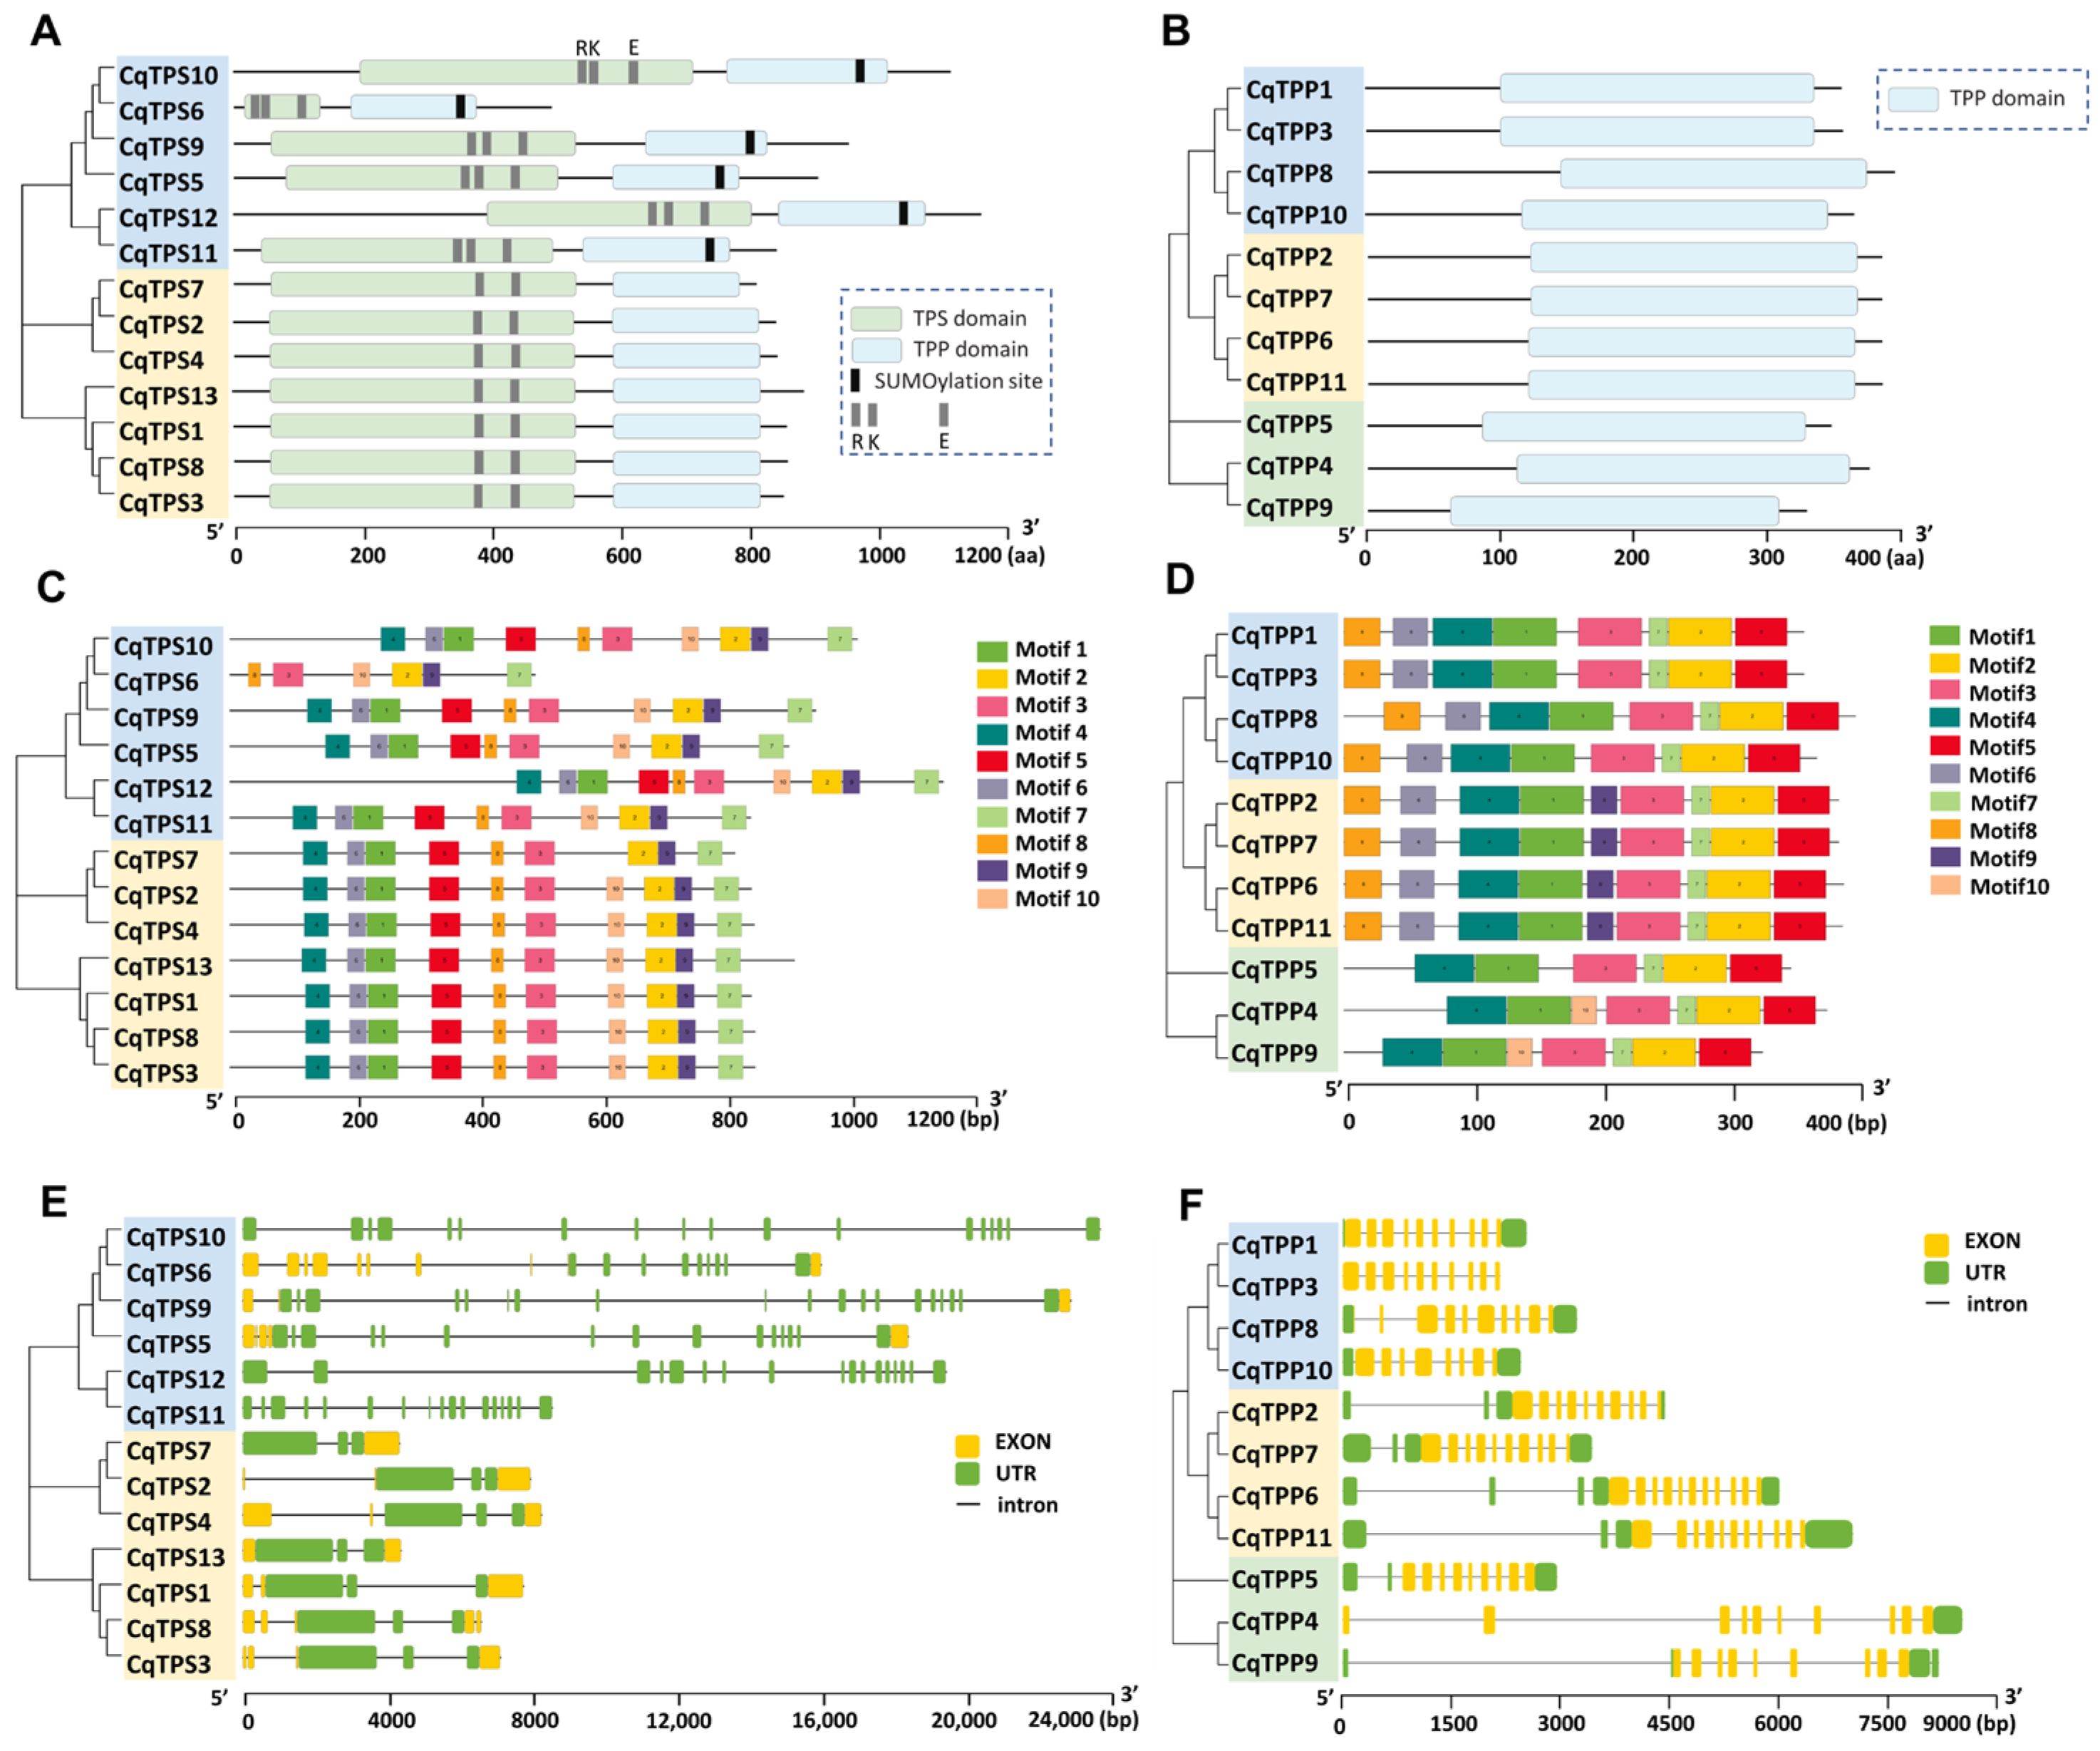
The conservative structure analysis indicates that the TPS domain (Pfam: PF00982) is unique to the CqTPS family proteins, and the TPP domain (Pfam: PF02358) is shared by CqTPS and CqTPP proteins (Figure 2A,B). Class I CqTPS enzymes contain a catalytic triad of residues, Arg (R)/Lys (K)/Glu (E), that is required for T6P synthesis. Moreover, Class I CqTPSs have a SUMOylation site at the C-terminal. Class II CqTPSs have an incomplete triad lacking ‘R’ residue in TPS domain, and no sumoylation site at the C-terminal (Figure 2A, Supplemental Figure S1). Then, we used MEME online tools (https://meme-suite.org/meme/doc/meme.html, accessed on 16 December 2022.) to analyze the motif distribution in CqTPS and CqTPP proteins. Ten conservative motifs were identified in CqTPS proteins, with a length of 21–50 aa (Figure 2C), and their sequence information is shown in Supplemental Figure S2A and Supplemental Table S1. Most CqTPS proteins contain all ten motifs, except for CqTPS7 lacking motif 10, TPS6 lacking motifs 1, 4, 6, and 5, and resulting in shorter proteins. According to the annotation, motifs 4, 6, 1, 5, 8, and 3 constitute the TPS domain, and motifs 10, 2, 9, and 7 constitute the TPP domain. The gene structure analysis based on GFF3 annotation indicates that the number of introns has a significant difference between the two classes. Class II CqTPS genes have only two introns. However, Class I CqTPS genes have a large number of introns, e.g., TPS6 has eight introns, and TPS5, 9, 10, 11, and 12 genes have ≥14 introns (Figure 2E).
The motif distribution analysis identified ten conservative motifs in CqTPP proteins (Figure 2D). The length of these conservative motifs ranged from 15 to 50 aa, and their sequence information is shown in Supplemental Figure S2B and Supplemental Table S2. The motif comparison indicates that Class I and Class II CqTPP proteins share some common motifs. All CqTPPs contain motifs 4, 1, 3, 7, 2, and 5. Class I and Class II CqTPPs also have motifs 8 and 6 at the N terminal, while Class II CqTPPs have a motif 9 in the middle of the proteins. In Class III, CqTPP5 has no additional motif, but CqTPP4 and 9 have a motif 10 inserted after motif 1 (Figure 2F). There is no significant difference in the gene structure of CqTPPs. The above results indicate that CqTPS and CqTPP genes have undergone functional differentiation during evolution.

2.4. Analysis of Cis-Acting Elements in the Promoters of CqTPS and CqTPP Genes

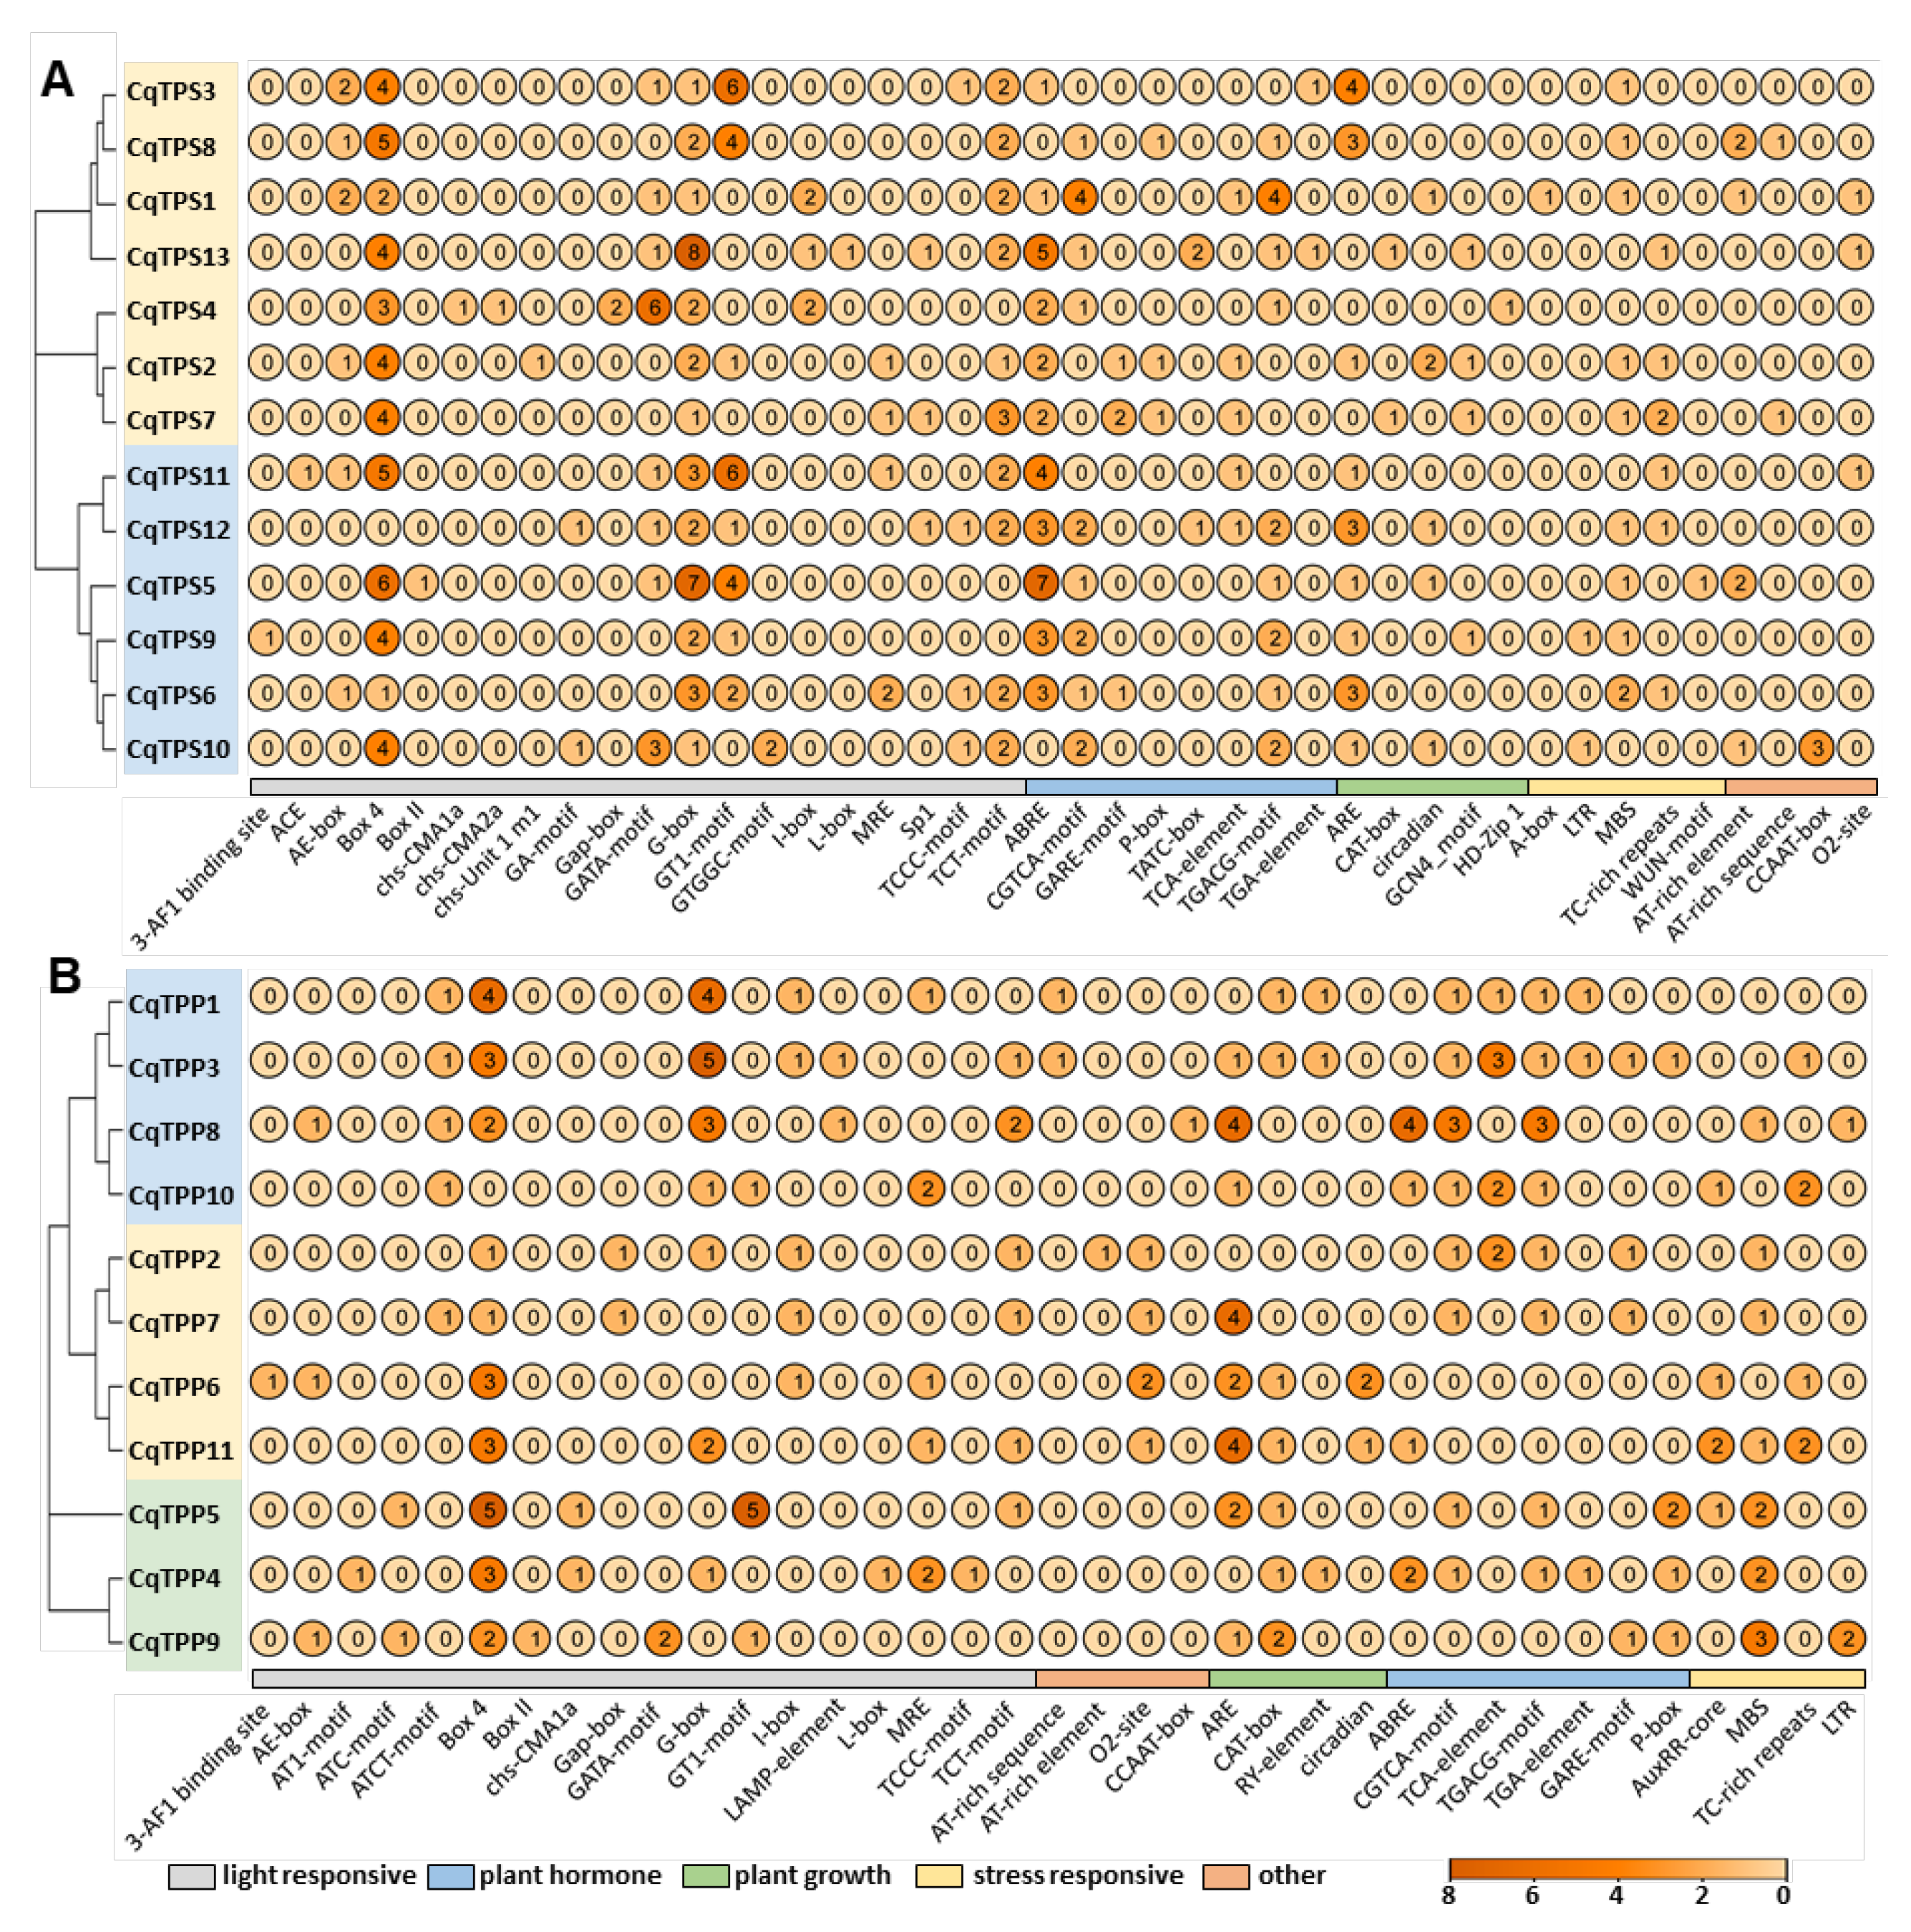
The sequences 2000 bp upstream of the start codon were selected as the promoters for cis-regulatory elements analysis. A total of 50 elements were identified in the promoters of CqTPSs and CqTPPs (Figure 3A,B). The cis-acting elements are classified into five categories, including Light Response, Plant Hormone, Plant Growth, Stress Response and Other. The composition of cis-acting elements in the CqTPS and CqTPP families is similar. The Light Response group contains the most elements, accounting for more than 60% of all elements. Among the Light Response elements, the number of Box 4 and G-box are the largest, followed by the GT1-motif element. It has been demonstrated that G-box in salt mustard participates in the salt stress response [33], and GT1-motif participates in nitrogen regulation in soybean [34]. In the Plant Hormone group, the number of ABREs, CGTCA-motifs, and TGACG-motifs are the largest. ABRE is demonstrated to be involved in the abscisic acid response, and the TGACG-motif participates in the methyl jasmonate response, indicating that the trehalose synthesis in quinoa is modulated by abscisic acid and jasmonate, which are stress responsive in plants [35]. Among Plant Growth elements, the number of AREs and Circadians are the largest. ARE is required for anaerobic induction, and Circadian element regulates circadian rhythm. Among the Stress Response elements, MBSs and TC-rich repeats are the most abundant. MBS is the MYB binding site involved in drought induction, and TC-rich repeats are involved in the defense and stress responses [36]. These results indicate that CqTPS and CqTPP genes are widely involved in various physiological and biochemical activities in plants, and responses to light, phytohormones, and abiotic stress.

2.5. Transcriptome and Metabolome Analyses of Trehalose Biosynthesis in Quinoa Leaves under Saline-Alkali Stress

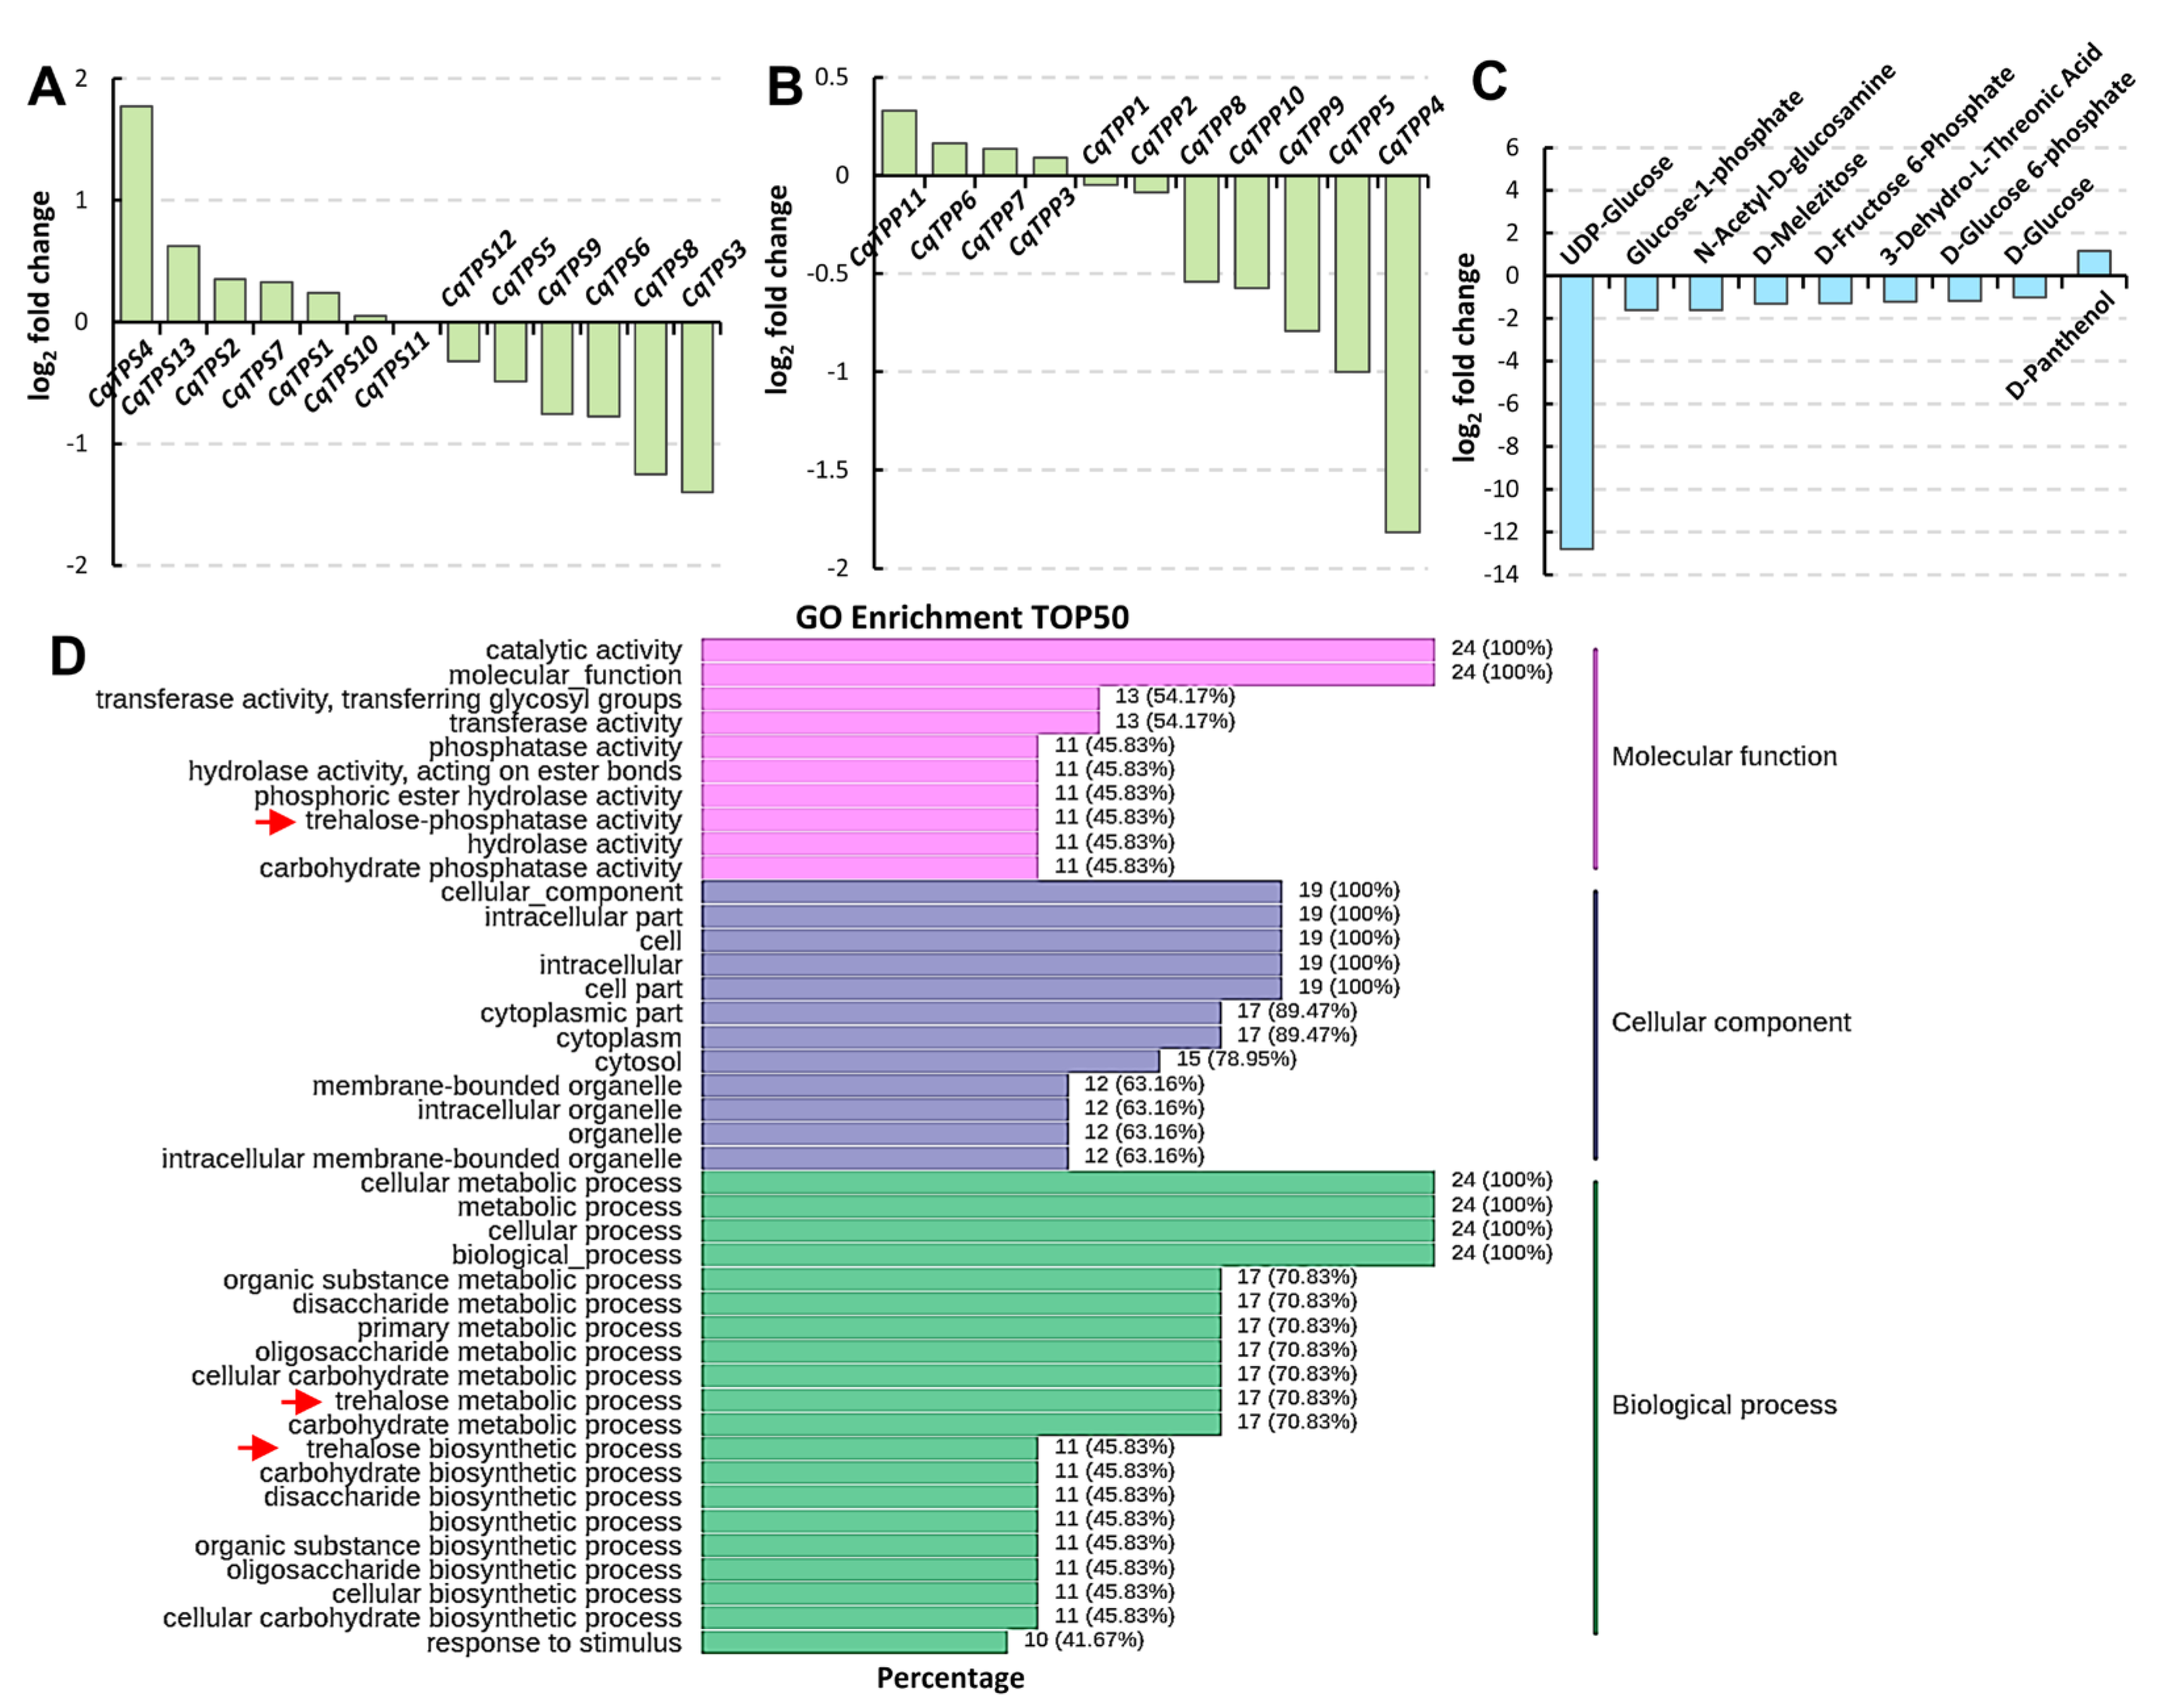
To investigate the saline-alkali stress response of CqTPSs and CqTPPs and related metabolites such as trehalose, glucose, and sucrose, etc., we performed integrated transcriptome and metabolome analysis using quinoa leaves undergoing carbonate treatment. Two weeks after the treatment, the quinoa plant height reduced significantly compared with that of untreated plants (Supplemental Figure S3A,B) and the total chlorophyll content declined significantly (Supplemental Figure S3C), indicating the saline-alkali condition seriously affected quinoa growth and development. Transcriptome analyses of CqTPS and CqTPP genes indicate that CqTPS4 was significantly upregulated [log2 fold change (FC) = 1.77], while CqTPS3 (log2FC = −1.40), CqTPS8 (log2FC = −1.25), and CqTPP4 (log2FC = −1.82) were significantly downregulated, and expression of the other genes changed but not significantly (Figure 4A,B). GO enrichment analysis indicates that the trehalose-related processes such as trehalose-phosphatase activity, the trehalose metabolic process, and the trehalose biosynthesis process were well enriched (Figure 4D, arrows). On the other hand, the contents of some metabolites in the starch and sucrose metabolism pathway were altered significantly. For example, UDP-Glucose (log2FC = −12.80), Glucose-1-phosphate (log2FC = −1.61), N-Acetyl-D-glucosamine (log2FC = −1.61), D-Melezitose (log2FC = −1.31), D-Fructose 6-Phosphate (log2FC = −12.80), 3-Dehydro-L-Threonic Acid (log2FC = −1.21), and D-Glucose 6-phosphate (log2FC = −1.28) decreased significantly, but D-Glucose (log2FC = −1.01) decreased slightly, while D-Panthenol (log2FC = 1.15) increased significantly (Figure 4C). These results indicate that the energy metabolism was severely inhibited under saline-alkali stress, and the CqTPSs and CqTPPs as well as trehalose metabolism are important for the saline-alkali stress response in quinoa.
Since the TPS- and TPP-regulated trehalose biosynthesis processes are in the starch and sucrose metabolism pathway, GO analysis of this pathway was conducted (Figure 5A, Supplemental Tables S3 and S4). Among the metabolites, UDP-Glucose (UDPG) content changed the most (log2FC = −12.80), and D-Glucose-1P, D-Glucose-6P, and D-Glucose, etc., also reduced. UDPG is mainly synthesized from Glucose-1P catalyzed by UGP2, or from sucrose catalyzed by sucrose synthases (SUSs) [37], the expression of one SUS increased and two declined. TPSs catalyze the synthesis of T6P from UDPG and D-Glucose-6P, and then TPPs dephosphorylate T6P to generate trehalose [38]. The expression of one CqTPS was upregulated and two CqTPSs and one CqTPP were downregulated. Trehalose and glucose/maltose can be converted into each other, and maltose can be converted into glucose catalyzed by maltodextrin glucosidase (malZ) [39], while the expression of malZ increased. In order to verify the transcriptome data, we performed an RT-qPCR analysis to check the expression of the related DEGs, and the results were basically consistent with the transcriptome data (Figure 5B). These results prove that CqTPSs and CqTPPs and the starch and sucrose metabolism pathway play important roles in the carbonate-induced saline-alkali stress response in quinoa.

2.6. Analysis of CqTPS Genes’ Response to Saline-Alkali Stress

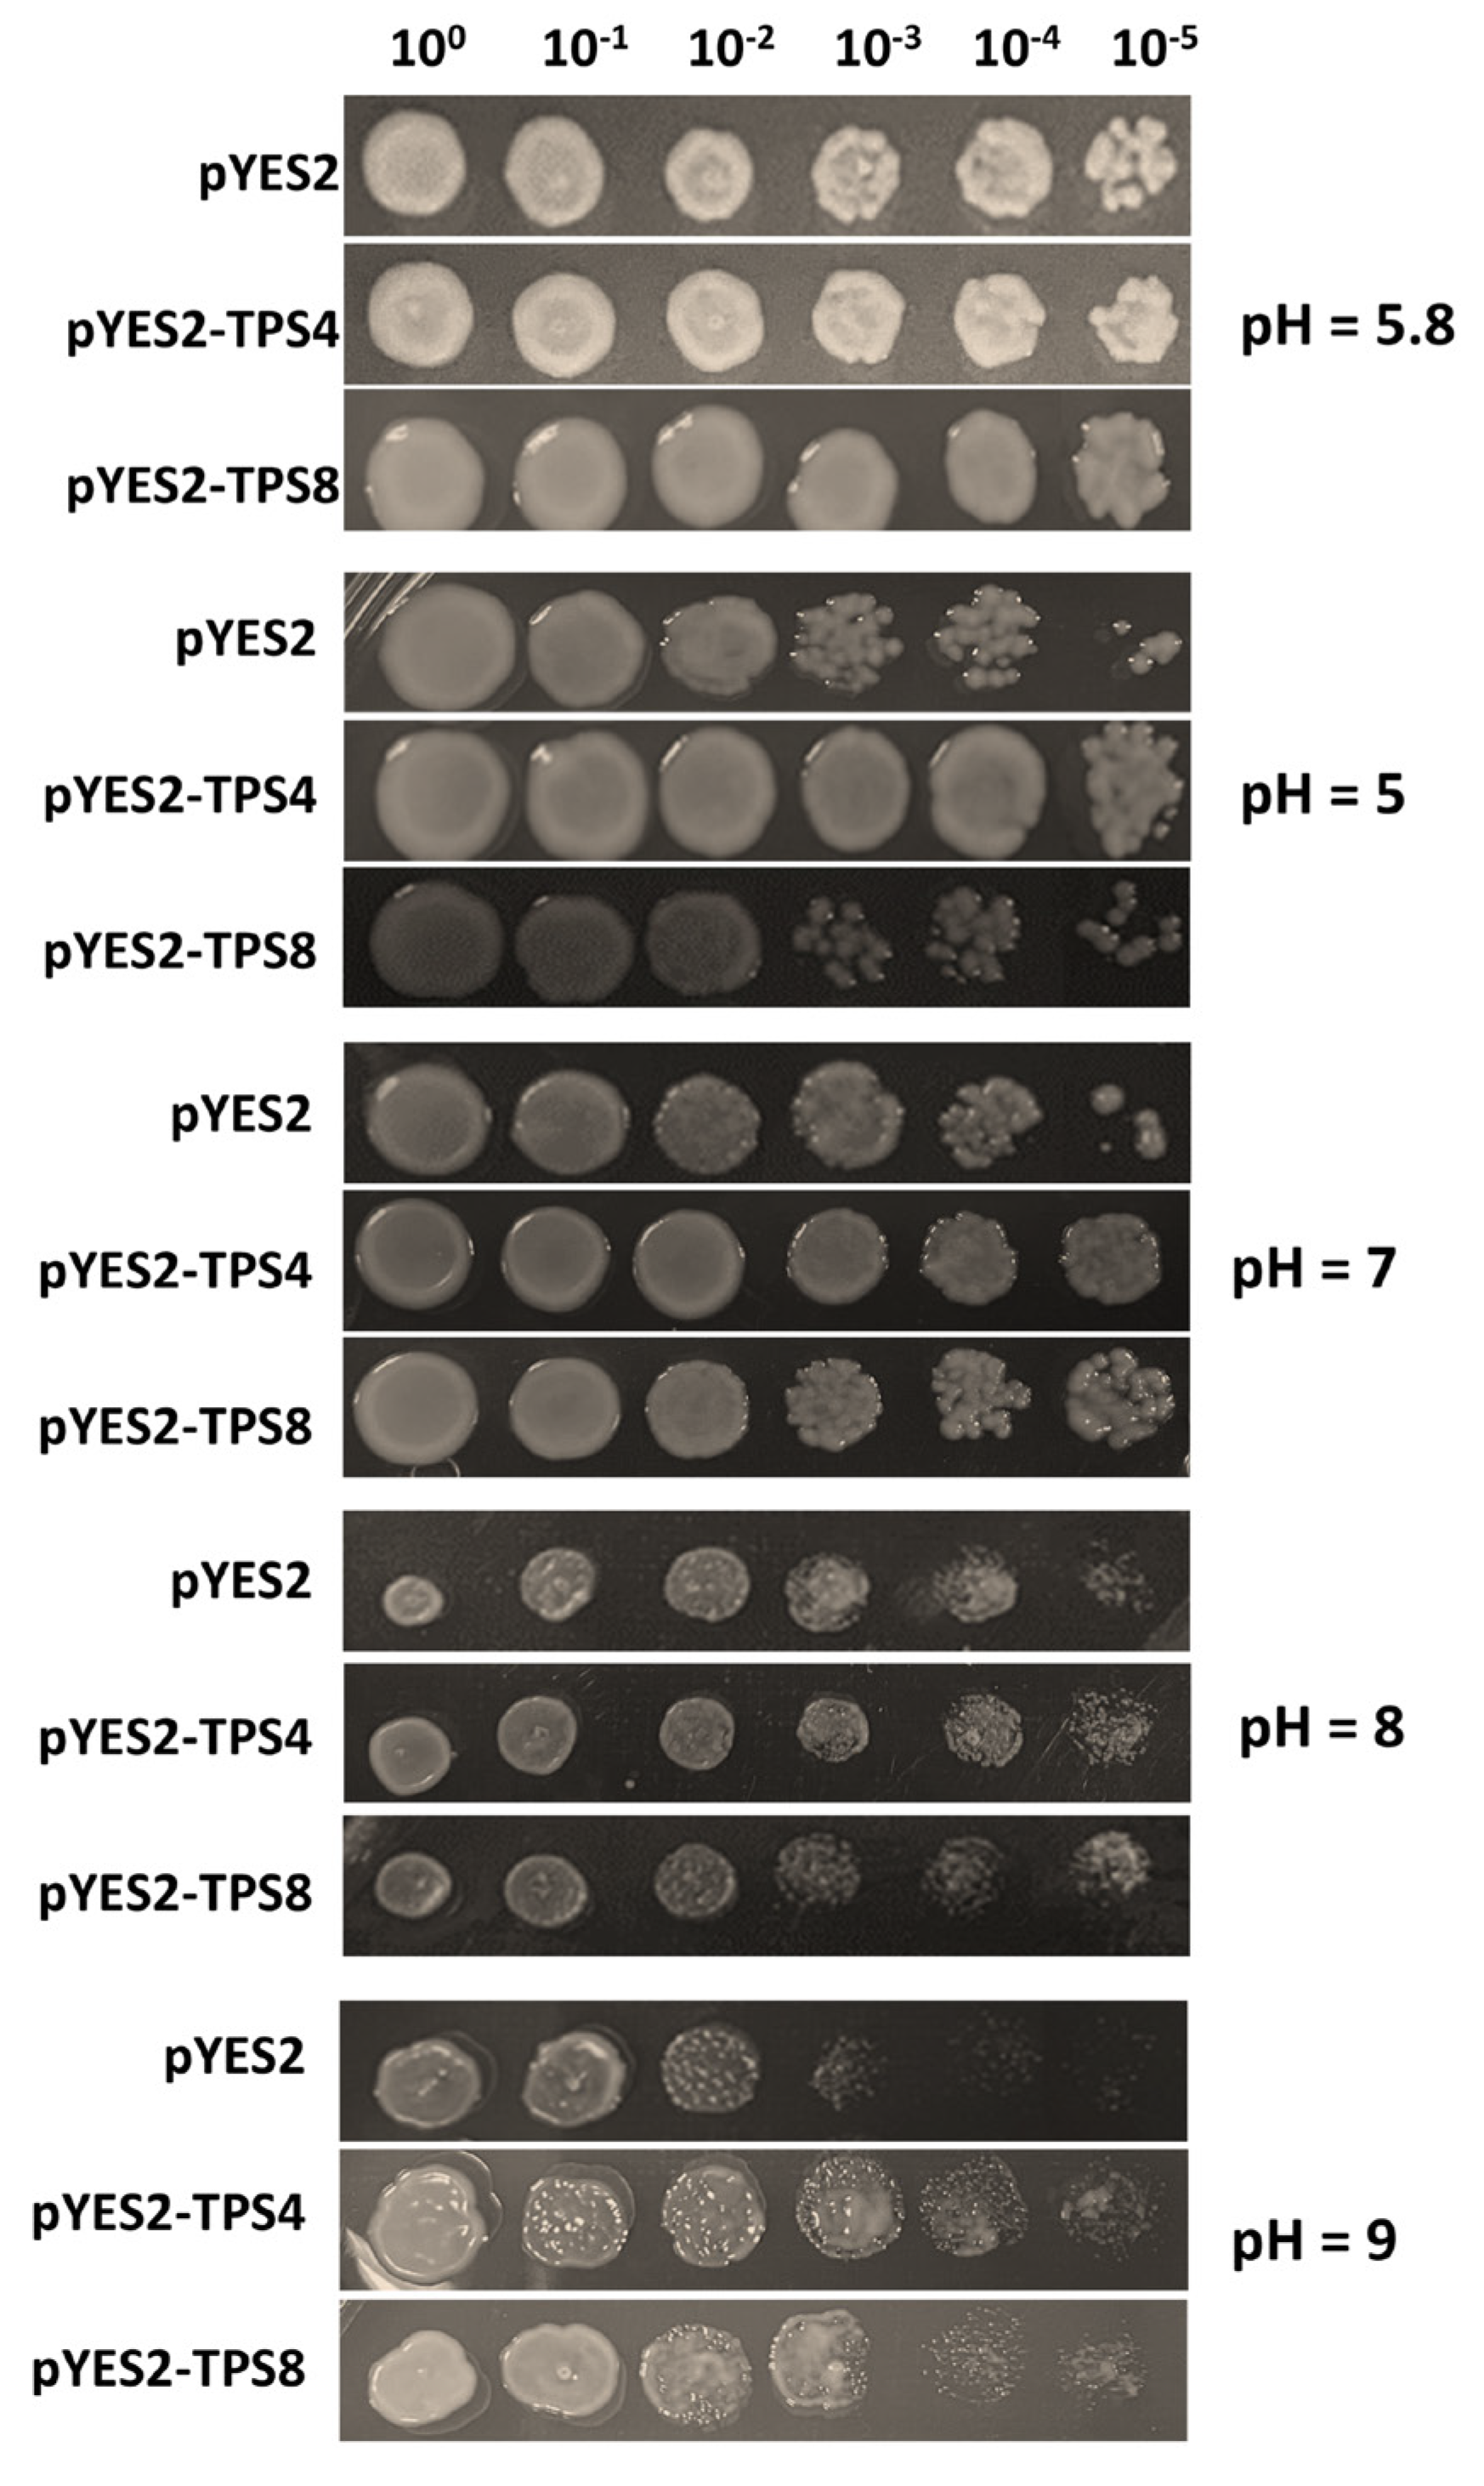
To characterize the regulatory roles of CqTPS genes in response to saline-alkali stress, we determined the growth of yeast (Saccharomyces cerevisiae) harboring CqTPS4/8 genes exposed to saline-alkali stress. The results indicate that CqTPS4- and CqTPS8-expressing yeast cells exhibited an increased survival ratio compared to the control (with empty vector) on an SC-Ura medium containing 25 mM NaHCO3 with pH = 5, 7, 8, and 9 (Figure 6), suggesting that CqTPS4 and CqTPS8 are involved in the saline-alkali stress response.

3. Discussion

TPSs and TPPs are key enzymes for trehalose biosynthesis and are important for plant development and stress response. To date, TPS and TPP family genes have been identified in all major plant taxa and microbes such as bacteria, fungi, and yeast, etc. [40,41,42]. In this study, we identified 13 TPS genes and 11 TPP genes in the quinoa genome (Chenopodium quinoa Willd.). Compared with cotton and Arabidopsis, CqTPSs were divided into two classes, and CqTPPs were divided into three classes, according to their protein conservative domains. The Class III TPP group does not include Arabidopsis proteins, and the members lack N-terminal motifs 6 and 8, which exist in Class I and Class II TPPs (Figure 2D). This may be due to the gene variation resulting from exon/intron gain/loss, exonization/pseudoexonization, and/or insertion/deletion, which lead to functional differentiation during evolution [43,44].
The AtTPS1 protein has a catalytic triad of residues, Arg (R)/Lys (K)/Glu (E), which is critical to TPS activity, and contains a putative SUMOylation site in the TPP domain [45]. Lack of the catalytic triad results in loss of TPS activity. Class I AtTPS proteins with the catalytic triad residues in the TPS domain are demonstrated to have catalytic activity, except for AtTPS3, a possible pseudogene [46]. These structure characteristics are also conserved in quinoa. Among the 13 CqTPSs, Class I CqTPSs have the catalytic triad of residues in the TPS domain and a SUMOylation site at the C-terminal (Figure 2A) [45,46]. According to the conservative domains and motifs, it is speculated that Class I CqTPSs may have TPS activity, and, of course, this needs to be verified by experiments. The Class II CqTPSs have an incomplete triad lacking the ‘R’ residue in the TPS domain, and no sumoylation site is found at the C-terminal, suggesting they may not have TPS activity. These structural features are consistent with the Arabidopsis Class II members, which have been elucidated to have no TPS catalytic activity [47,48]. The TPP domain in AtTPS1 is likely crucial for plant development, although it lacks some of the residues in the active site of the TPP enzyme [42]. Interestingly, despite the high conservation of TPP activity sites, none of the class II AtTPSs have TPP activity [49,50,51]. Meanwhile, the TPP domain in Class I and Class II CqTPSs is highly similar to that of AtTPSs, implying that they are likely to have similar functions (Supplemental Figure S1). Although the Class II TPS proteins may have no TPS and TPP enzyme activities, they are proposed to regulate Class I TPS enzyme activity based on the association of rice class I and II proteins [52], and act as signaling proteins based on their conservative ligand-binding sites [42]. There is much evidence implicating that Class II TPS proteins are involved in stress response. For instance, TPS5 is involved in ABA signaling [53], TPS5 in thermotolerance [54], TPS5 in basal pathogen defense [43], and TPS11 in cold tolerance [44] and aphid resistance [55]. In quinoa leaves, the expression levels of Class II genes, CqTPS3, CqTPS4, and CqTPS8, were altered significantly under saline-alkali conditions, suggesting that Class II genes in quinoa also respond to stress. On the other hand, all CqTPS proteins do not have a nuclear localization signal (NLS), suggesting they cannot enter the nucleus autonomously.
In addition to TPP catalytic activity, some AtTPP genes are associated with an abiotic stress response. For example, AtTPPD is responsible for salt and oxidative stress resistance [56], and AtTPPF and AtTPPI are involved in drought response [56,57]. Moreover, the rice OsTPP1 and OsTPP2 are involved in the cold stress response [58,59], and OsTPP7 regulates anaerobiosis resistance during germination [60]. In quinoa leaves, expression of CqTPP4 decreased significantly under saline-alkali stress (Figure 6B), suggesting it is involved in the stress response. The transcription levels of other CqTPP genes also changed under the same conditions but not significantly. Further study is needed to clarify the association of CqTPP genes with different stresses.
When plants are under stress, the related transcription factors (TFs) are activated to bind specific cis-acting elements to regulate the expression of downstream stress-response genes. In this study, many cis-acting elements related to stress (A-box, MBS, LTR, TC-rich repeats, and WUN-motif), phytohormones (ABRE, GCTGA-motif, etc.), and light (G-box, box4, etc.) were identified in promoters of CqTPS and CqTPP family genes. In quinoa leaves under saline-alkali stress, the expression levels of CqTPS4, 3, 9, and CqTPP4 were altered significantly (Figure 4A,B). Among them, CqTPS4, the only upregulated gene, contains six GATA-motifs, three Box4s, two Gap-boxes, and two G-boxes in its promoter (Figure 3A), suggesting these elements may be closely related to the response to saline-alkali stress. The other three CqTPS and CqTPP genes were significantly downregulated under saline-alkali stress. This is also observed in previous studies, that show that some TPS or TPP genes are up- and some other genes are downregulated. This may be due to the complexity of regulatory mechanisms of trehalose biosynthesis as well as the functional division of these genes, e.g., some Class I TPS genes are responsible for plant growth and development, and some Class II TPS genes are related to the stress response. Another possible reason is the plant development stage and stress treatment duration. Two-week treatment is a long-term stress, the quinoa plants may have adapted to the condition and have adjusted the metabolic system and regulatory machineries. For example, the stabilized expression levels of CqTPS genes lead to a proper level of T6P, which subsequently stabilizes the abundance of sucrose and trehalose as well as related physiological activities.
Sucrose is the final product of the photosynthesis of green plants and functions as an important carbon source for cell activities. Carbohydrates from sucrose account for 90% of plant biomass. At the same time, sucrose and starch metabolism, which produces signal molecules such as glucose, fructose, and T6P, is one of the key pathways to regulate plant growth and development and abiotic stress response [61,62,63]. Trehalose and T6P are important intermediates in sucrose and starch metabolism, and trehalose biosynthesis is essential for plant growth and development [64]. In most flowering plants, the trehalose content is extremely low and is barely detectable [65,66]. Under stress conditions, trehalose functions as an osmoprotectant to protect the cellular structure and cell membrane from stress-induced damage [38] and improve plant tolerance to various abiotic stresses, especially salinity and drought stresses [36]. T6P links plant growth and development with the status of sucrose metabolism [67]. In Arabidopsis seedlings, the T6P content is highly correlated with the level of sucrose, and dynamically responds to the fluctuation of sucrose and gives feedback. Therefore, T6P is considered a key signaling metabolite, acting as a plant ‘insulin’ to regulate sucrose utilization. [68].
Surprisingly, despite being under saline-alkali treatment and despite the alteration of expression of CqTPS and CqTPP genes and significant decrease of contents of UDPG and D-Glucose-6P, the contents of sucrose, trehalose, and T6P in quinoa leaves did not change significantly, whereas the contents of UDPG and D-Glucose-6P, the substrates for T6P generation, decreased significantly (Figure 4C and Figure 5A). Similar phenomena were also observed in maize ra3 mutants, the TPP loss-of-function alleles, and there were no significant differences in T6P or trehalose levels compared to wild-type [66]. Moreover, there were no significant differences in T6P levels between wild-type, ra3, and ra3 tpp4 mutants [69]. Since T6P plays a central role in controlling growth and development, a modicum change in T6P level may cause serious effects on plants. Significant changes have also occurred in the transcription levels of many genes in starch and sucrose metabolic pathways, such as amylase genes, SUS (sucrose synthase), glgA (glycogen synthase), and glgC (ADPglucose pyrophosphorylase) genes, etc. (Figure 5), which consequently led to changes in metabolites. GO Enrichment analysis indicates that the trehalose-related processes such as trehalose-phosphatase activity, the trehalose metabolic process, and the trehalose biosynthesis process were well enriched in DEGs (Figure 4D, arrows). On the other hand, the contents of some metabolites in starch and sucrose metabolism pathway altered significantly. Therefore, there may be tight regulatory machineries to rescue the change of T6P, such as the complementation from other functional TPS and/or TPP genes, or other unknown pathway(s). In the case of this study, the two-week treatment belongs to a long-term stress, and the saline-alkali stress was moderate, thus the quinoa plants may have adapted to the stress and have adjusted the T6P level, and subsequently stabilized the contents of trehalose and sucrose. Quinoa is a species with strong resistance to stress; whether the adjustment of T6P is due to this characteristic of quinoa or the nature of many plants is unknown. In source leaves, much of the UDP-Glc is consumed by sucrose synthesis [70]; whereas in growing tissues, it is the direct substrate for the synthesis of cellulose and hemicelluloses, and a precursor for other nucleotide sugars that are needed for the synthesis of noncellulosic cell wall polysaccharides [71,72]. Therefore, the remarkable decrease of UDPG in leaves of developing quinoa plants may be due to consumption in sucrose synthesis and cell wall deposition, as well as in other metabolic pathways, such as amino sugar and nucleotide sugar metabolism (Figure 5A).
Moreover, the expression of many regulatory genes in the sucrose and starch metabolism pathway changed, including sucrose synthases (SUSs) and amylases, etc. (Figure 5A). SUSs catalyze the reversible conversion of sucrose and fructose and produce UDPG [73]. The abundance of SUSs affects the thickness of the secondary cell wall, sharevegetative growth, and mechanical strength [74]. On the other hand, the expression of SUSs is affected by salt stress [75]. The amylases include alpha-amylase (AMY) and beta-amylase (β-amylase). AMY is a crucial enzyme that functions throughout the whole life cycle of angiosperm [76]. Alteration of the expression of these genes suggests that the sucrose and starch metabolism pathway is crucial for the saline-alkali stress response.

4. Materials and Methods

4.1. Genome-Wide Identification of TPS and TPP Family Members in Quinoa (Chenopodium quinoa Willd.)

From Ensemble Plants (http://plants.ensembl.org/index.html, accessed on 5 December 2022.), we downloaded the genome file and GFF3 file of quinoa (http://plants.ensembl.org/index.html, accessed on 5 December 2022.) [77], from TAIR (https://www.Arabidopsis.org/, accessed on 5 December 2022.), we downloaded Arabidopsis TPS and TPP protein sequences.

4.2. Bioinformatics Analysis of Quinoa TPS and TPP Family Genes

4.2.1. Phylogenetic Analysis

The phylogenetic trees of TPS and TPP families, containing quinoa, Arabidopsis, and cotton proteins, were constructed based on multiple sequence alignments using MAGA 11 software [78] and the maximum likelihood model (bootstrap is 1000). iTOL (http://itol.embl.de/, accessed on 12 December 2022.) website was used to optimize the evolutionary tree.

4.2.2. The Physicochemical Properties, Conserved Motif Analysis

The protein length, isoelectric point (pI), and molecular weight (MW) were predicted using ExPASy website (https://www.expasy.org/, accessed on 8 December 2022.) [79].
The conserved motifs were retrieved by searching MEME website (https://meme-suite.org/meme/doc/meme.html, accessed on 16 December 2022.) [80]. The maximum retrieval value was set to 10, and the other parameters were default. InterProScan software (interproscan-5.55-88.0-64-bit) was used to annotate the motifs.

4.2.3. Gene Structure and Cis-Acting Element Analysis

The gene structure of the CqTPS and CqTPP family genes was analyzed using TBtools combined with the GFF3 gene annotation data, and to plot the exon–intron diagram.
The 2kb sequences upstream of the start codons of CqTPS and CqTPP genes were screened using TBtools and used as promoter sequences for analysis. plantCARE [81] (https://bioinformatics.psb.ugent.be/webtools/plantcare/html/, accessed on 20 December 2022.) was used to investigate the cis-acting elements in promoters to predict the roles of genes in stress responses.

4.3. Plant Materials, Growth Conditions, and Stress Treatments

Quinoa (Jiaqi #3) plants grew under a 16 h light/8 h dark cycle at 22 °C. Two-week-old quinoa seedlings were treated with a solution containing 100 mM Na2CO3:NaHCO3 = 1:9 once every 5 days, three times in total. The control group was treated with water. The leaves were harvested randomly five days after the third treatment, then sent for RNA sequencing and an ultraperformance liquid chromatography–electrospray ionization–tandem mass spectrometry (UPLC–ESI–MS/MS) analysis.

4.4. RT-qPCR Validation

The total RNA used for RT-qPCR (reverse transcription quantitative PCR) was consistent with that for RNA sequencing. RT-qPCR was performed following the manufacturer’s instructions for Ultra SYBR Mixture (Low ROX) on the ABI7300 real-time PCR system (Applied Biosystems, Waltham, MA, USA). UBQ9 (AUR62020068) was used as the reference gene for normalizing mRNA transcription [82]. The relative expression level was calculated by the 2−△△CT method [83]. All RT-qPCR analyses were set with 3 technical repeats. The primers are listed in Supplemental Table S5.

4.5. Stress Tolerance Assays of CqTPS4 and CqTPS8 in Yeast

The cds of CqTPS4 and CqTPS8 were amplified from the quinoa cDNA library using specific primers (listed in Supplemental Table S4). The PCR products were inserted into the pYES2 vector, and the recombined pYES2-TPS4 and pYES2-TPS8 plasmids were transformed into yeast (Saccharomyces cerevisiae) strain INVSC1, respectively. The pYES2 empty vector was used as a control.
The transformed yeast was cultured overnight in SC-Ura liquid medium containing 2% glucose at 30 °C. After adjustment of OD600 to 0.4, the culture was diluted according to the indicated gradient on an SC-Ura medium containing 25 mM NaHCO3 with pH 5, 6, 7, 8, and 9, respectively, at 30 °C for 24 h.

5. Conclusions

In this study, we identified 13 CqTPS genes and 11 CqTPP genes in the quinoa genome and analyzed their physicochemical properties, gene structures, conservative domains and motifs in the proteins, and cis-regulatory elements, as well as evolutionary relationships. The results indicate that the TPS and TPP family characteristics are highly conserved in quinoa. Transcriptome and metabolome analyses of the sucrose and starch metabolism pathway in leaves indicate that CqTPP4 and Class II CqTPS4, 3, 9 genes, and trehalose biosynthesis are important for the saline-alkali stress response in quinoa. This study may help to explain the biological activities of CqTPS and CqTPP proteins in developmental processes and stress responses in quinoa. However, our knowledge of their precise biological role is still lacking. Thus, in order to provide important insights to help others for developing crop cultivars resistant to unfavorable stress conditions, an extensive functional validation study of CqTPSs andCqTPPs is necessary.

Supplementary Materials

The supporting information can be downloaded at: https://www.mdpi.com/article/10.3390/ijms24086950/s1.

Author Contributions

L.L. conceived and supervised the project. L.L., X.W., and M.W. designed the experiments. L.L., G.Q., M.W., X.W., and Y.Z. analyzed the data. X.W., M.W., P.Z., Y.L., J.Z., and Y.H. performed the experiments. L.L., X.W., and M.W. drafted the manuscript. All authors contributed to the manuscript revision, and read and approved the submitted version. All authors have read and agreed to the published version of the manuscript.

Funding

This work was supported by the National Natural Science Foundation of China (32170279).

Institutional Review Board Statement

Not applicable.

Informed Consent Statement

Not applicable.

Data Availability Statement

All data are presented in this article.

Acknowledgments

We are grateful to Jiaqi Agricultural Technology Co., Ltd. for providing Jiaqi #3 quinoa seeds.

Conflicts of Interest

The authors declare no conflict of interest. The funders have no role in the design of the study and collection, analysis, and interpretation of data and in writing the manuscript.

References

  1. Wang, L.; Seki, K.; Miyazaki, T.; Ishihama, Y. The causes of soil alkalinization in the Songnen Plain of Northeast China. Paddy Water Environ. 2009, 7, 259–270. [Google Scholar] [CrossRef]
  2. Kaiwen, G.; Zisong, X.; Yuze, H.; Qi, S.; Yue, W.; Yanhui, C.; Jiechen, W.; Wei, L.; Huihui, Z. Effects of salt concentration, pH, and their interaction on plant growth, nutrient uptake, and photochemistry of alfalfa (Medicago sativa) leaves. Plant Signal. Behav. 2020, 15, 1832373. [Google Scholar] [CrossRef] [PubMed]
  3. Zhang, H.; Liu, X.L.; Zhang, R.X.; Yuan, H.Y.; Wang, M.M.; Yang, H.Y.; Ma, H.Y.; Liu, D.; Jiang, C.J.; Liang, Z.W. Root Damage under Alkaline Stress Is Associated with Reactive Oxygen Species Accumulation in Rice (Oryza sativa L.). Front. Plant Sci. 2017, 8, 1580. [Google Scholar] [CrossRef]
  4. Fan, C. Genetic mechanisms of salt stress responses in halophytes. Plant Signal. Behav. 2020, 15, 1704528. [Google Scholar] [CrossRef]
  5. Zhao, C.; Zhang, H.; Song, C.; Zhu, J.K.; Shabala, S. Mechanisms of Plant Responses and Adaptation to Soil Salinity. Innovation (Camb.) 2020, 1, 100017. [Google Scholar] [CrossRef] [PubMed]
  6. Nam, M.H.; Huh, S.M.; Kim, K.M.; Park, W.J.; Seo, J.B.; Cho, K.; Kim, D.Y.; Kim, B.G.; Yoon, I.S. Comparative proteomic analysis of early salt stress-responsive proteins in roots of SnRK2 transgenic rice. Proteome Sci. 2012, 10, 25. [Google Scholar] [CrossRef] [Green Version]
  7. Mo, W.; Tang, W.; Du, Y.; Jing, Y.; Bu, Q.; Lin, R. PHYTOCHROME-INTERACTING FACTOR-LIKE14 and SLENDER RICE1 Interaction Controls Seedling Growth under Salt Stress. Plant Physiol. 2020, 184, 506–517. [Google Scholar] [CrossRef]
  8. Ashraf, M.; Foolad, M.R. Roles of glycine betaine and proline in improving plant abiotic stress resistance. Environ. Exp. Bot. 2007, 59, 206–216. [Google Scholar] [CrossRef]
  9. Kim, T.H. Plant stress surveillance monitored by ABA and disease signaling interactions. Mol. Cells. 2012, 33, 1–7. [Google Scholar] [CrossRef]
  10. Wang, X.-s.; Ren, H.-l.; Wei, Z.-w.; Wang, Y.-w.; Ren, W.-b. Effects of neutral salt and alkali on ion distributions in the roots, shoots, and leaves of two alfalfa cultivars with differing degrees of salt tolerance. J. Integr. Agric. 2017, 16, 1800–1807. [Google Scholar] [CrossRef] [Green Version]
  11. Preiss, J. Regulation of the Biosynthesis and Degradation of Starch. Annu. Rev. Plant Biol. 1982, 33, 431–454. [Google Scholar] [CrossRef]
  12. Aluko, O.O.; Li, C.; Wang, Q.; Liu, H. Sucrose Utilization for Improved Crop Yields: A Review Article. Int. J. Mol. Sci. 2021, 22, 4704. [Google Scholar] [CrossRef] [PubMed]
  13. Mirajkar, S.J.; Suprasanna, P.; Vaidya, E.R. Spatial distribution and dynamics of sucrose metabolising enzymes in radiation induced mutants of sugarcane. Plant Physiol. Biochem. 2016, 100, 85–93. [Google Scholar] [CrossRef]
  14. Slewinski, T.L.; Braun, D.M. Current perspectives on the regulation of whole-plant carbohydrate partitioning. Plant Sci. 2010, 178, 341–349. [Google Scholar] [CrossRef]
  15. Tester, R.F.; Karkalas, J.; Qi, X. Starch—Composition, fine structure and architecture. J. Cereal Sci. 2004, 39, 151–165. [Google Scholar] [CrossRef]
  16. Carolina, A.; Almeida, M. Physicochemical properties, modifications and applications of starches from different botanical sources. Food Sci. Technol. 2015, 35, 215–236. [Google Scholar] [CrossRef] [Green Version]
  17. O’Hara, L.E.; Paul, M.J.; Wingler, A. How Do Sugars Regulate Plant Growth and Development? New Insight into the Role of Trehalose-6-Phosphate. Mol. Plant. 2013, 6, 261–274. [Google Scholar] [CrossRef] [Green Version]
  18. Satoh-Nagasawa, N.; Nagasawa, N.; Malcomber, S.; Sakai, H.; Jackson, D. A trehalose metabolic enzyme controls inflorescence architecture in maize. Nature 2006, 441, 227–230. [Google Scholar] [CrossRef]
  19. Wingler, A.; Delatte, T.L.; O’Hara, L.E.; Primavesi, L.F.; Jhurreea, D.; Paul, M.J.; Schluepmann, H. Trehalose 6-phosphate is required for the onset of leaf senescence associated with high carbon availability. Plant Physiol. 2012, 158, 1241–1251. [Google Scholar] [CrossRef] [Green Version]
  20. Martínez-Barajas, E.; Delatte, T.; Schluepmann, H.; de Jong, G.J.; Somsen, G.W.; Nunes, C.; Primavesi, L.F.; Coello, P.; Mitchell, R.A.; Paul, M.J. Wheat grain development is characterized by remarkable trehalose 6-phosphate accumulation pregrain filling: Tissue distribution and relationship to SNF1-related protein kinase1 activity. Plant Physiol. 2011, 156, 373–381. [Google Scholar] [CrossRef] [Green Version]
  21. Nägele, T.; Weckwerth, W. Mathematical modeling reveals that metabolic feedback regulation of SnRK1 and hexokinase is sufficient to control sugar homeostasis from energy depletion to full recovery. Front. Plant Sci. 2014, 5, 365. [Google Scholar] [CrossRef] [PubMed] [Green Version]
  22. Ullah, N.; Yüce, M.; Neslihan Öztürk Gökçe, Z.; Budak, H. Comparative metabolite profiling of drought stress in roots and leaves of seven Triticeae species. BMC Genom. 2017, 18, 969. [Google Scholar] [CrossRef] [PubMed]
  23. Ge, L.F.; Chao, D.Y.; Shi, M.; Zhu, M.Z.; Gao, J.P.; Lin, H.X. Overexpression of the trehalose-6-phosphate phosphatase gene OsTPP1 confers stress tolerance in rice and results in the activation of stress responsive genes. Planta 2008, 228, 191–201. [Google Scholar] [CrossRef]
  24. Kim, S.-J.; Jeong, D.-H.; An, G.; Kim, S.-R. Characterization of a drought-responsive gene, OsTPS1, identified by the T-DNA Gene-Trap system in rice. J. Plant Biol. 2005, 48, 371–379. [Google Scholar] [CrossRef]
  25. Kondrák, M.; Marincs, F.; Antal, F.; Juhász, Z.; Bánfalvi, Z. Effects of yeast trehalose-6-phosphate synthase 1 on gene expression and carbohydrate contents of potato leaves under drought stress conditions. BMC Plant Biol. 2012, 12, 74. [Google Scholar] [CrossRef] [Green Version]
  26. Gómez, L.D.; Gilday, A.; Feil, R.; Lunn, J.E.; Graham, I.A. AtTPS1-mediated trehalose 6-phosphate synthesis is essential for embryogenic and vegetative growth and responsiveness to ABA in germinating seeds and stomatal guard cells. Plant J. 2010, 64, 1–13. [Google Scholar] [CrossRef]
  27. Pathan, S.; Siddiqui, R.A. Nutritional Composition and Bioactive Components in Quinoa (Chenopodium quinoa Willd.) Greens: A Review. Nutrients 2022, 14, 558. [Google Scholar] [CrossRef]
  28. Zou, C.; Chen, A.; Xiao, L.; Muller, H.M.; Ache, P.; Haberer, G.; Zhang, M.; Jia, W.; Deng, P.; Huang, R.; et al. A high-quality genome assembly of quinoa provides insights into the molecular basis of salt bladder-based salinity tolerance and the exceptional nutritional value. Cell Res. 2017, 27, 1327–1340. [Google Scholar] [CrossRef] [Green Version]
  29. Blázquez, M.A.; Santos, E.; Flores, C.L.; Martínez-Zapater, J.M.; Salinas, J.; Gancedo, C. Isolation and molecular characterization of the Arabidopsis TPS1 gene, encoding trehalose-6-phosphate synthase. Plant J. 1998, 13, 685–689. [Google Scholar] [CrossRef]
  30. Vogel, G.; Aeschbacher, R.A.; Müller, J.; Boller, T.; Wiemken, A. Trehalose-6-phosphate phosphatases from Arabidopsis thaliana: Identification by functional complementation of the yeast tps2 mutant. Plant L. 1998, 13, 673–683. [Google Scholar] [CrossRef]
  31. Wang, W.; Cui, H.; Xiao, X.; Wu, B.; Sun, J.; Zhang, Y.; Yang, Q.; Zhao, Y.; Liu, G.; Qin, T. Genome-Wide Identification of Cotton (Gossypium spp.) Trehalose-6-Phosphate Phosphatase (TPP) Gene Family Members and the Role of GhTPP22 in the Response to Drought Stress. Plants 2022, 11, 1079. [Google Scholar] [CrossRef]
  32. Mu, M.; Lu, X.K.; Wang, J.J.; Wang, D.L.; Yin, Z.J.; Wang, S.; Fan, W.L.; Ye, W.W. Genome-wide Identification and analysis of the stress-resistance function of the TPS (Trehalose-6-Phosphate Synthase) gene family in cotton. BMC Genet. 2016, 17, 54. [Google Scholar] [CrossRef] [Green Version]
  33. Ou, W.; Mao, X.; Huang, C.; Tie, W.; Yan, Y.; Ding, Z.; Wu, C.; Xia, Z.; Wang, W.; Zhou, S.; et al. Genome-Wide Identification and Expression Analysis of the KUP Family under Abiotic Stress in Cassava (Manihot esculenta Crantz). Front. Physiol. 2018, 9, 17. [Google Scholar] [CrossRef] [PubMed] [Green Version]
  34. Wang, W.; Li, J.; Nadeem, M.; Wang, J.; Huang, R.; Liu, Q.; Fan, W.; Zheng, H.; Yan, L.; Wang, X. The central role of GmGLP20.4 in root architecture modifications of soybean under low-nitrogen stress. Theor. Appl. Genet. 2022, 135, 4083–4093. [Google Scholar] [CrossRef]
  35. Zhu, J.K. Abiotic Stress Signaling and Responses in Plants. Cell 2016, 167, 313–324. [Google Scholar] [CrossRef] [Green Version]
  36. Zhang, B.; Song, Y.; Zhang, X.; Wang, Q.; Li, X.; He, C.; Luo, H. Identification and expression assay of calcium-dependent protein kinase family genes in Hevea brasiliensis and determination of HbCDPK5 functions in disease resistance. Tree Physiol. 2022, 42, 1070–1083. [Google Scholar] [CrossRef] [PubMed]
  37. Wang, W.; Viljamaa, S.; Hodek, O.; Moritz, T.; Niittylä, T. Sucrose synthase activity is not required for cellulose biosynthesis in Arabidopsis. Plant J. 2022, 110, 1493–1497. [Google Scholar] [CrossRef]
  38. Sarkar, A.K.; Sadhukhan, S. Imperative role of trehalose metabolism and trehalose-6-phosphate signaling on salt stress responses in plants. Physiol. Plant. 2022, 174, e13647. [Google Scholar] [CrossRef]
  39. Iordachescu, M.; Imai, R. Trehalose biosynthesis in response to abiotic stresses. J. Integr. Plant Biol. 2008, 50, 1223–1229. [Google Scholar] [CrossRef]
  40. Avonce, N.; Wuyts, J.; Verschooten, K.; Vandesteene, L.; Van Dijck, P. The Cytophaga hutchinsonii ChTPSP: First characterized bifunctional TPS-TPP protein as putative ancestor of all eukaryotic trehalose biosynthesis proteins. Mol. Biol. Evol. 2010, 27, 359–369. [Google Scholar] [CrossRef] [Green Version]
  41. Avonce, N.; Mendoza-Vargas, A.; Morett, E.; Iturriaga, G. Insights on the evolution of trehalose biosynthesis. BMC Evol. Biol. 2006, 6, 109. [Google Scholar] [CrossRef] [PubMed] [Green Version]
  42. Lunn, J.E. Gene families and evolution of trehalose metabolism in plants. Funct. Plant Biol. 2007, 34, 550–563. [Google Scholar] [CrossRef] [PubMed]
  43. Wang, X.; Du, Y.; Yu, D. Trehalose phosphate synthase 5-dependent trehalose metabolism modulates basal defense responses in Arabidopsis thaliana. J. Integr. Plant Biol. 2019, 61, 509–527. [Google Scholar] [CrossRef] [PubMed]
  44. Liu, X.; Fu, L.; Qin, P.; Sun, Y.; Liu, J.; Wang, X. Overexpression of the wheat trehalose 6-phosphate synthase 11 gene enhances cold tolerance in Arabidopsis thaliana. Gene 2019, 710, 210–217. [Google Scholar] [CrossRef] [PubMed]
  45. Fichtner, F.; Olas, J.J.; Feil, R.; Watanabe, M.; Krause, U.; Hoefgen, R.; Stitt, M.; Lunn, J.E. Functional Features of TREHALOSE-6-PHOSPHATE SYNTHASE1, an Essential Enzyme in Arabidopsis. Plant Cell 2020, 32, 1949–1972. [Google Scholar] [CrossRef] [Green Version]
  46. Delorge, I.; Figueroa, C.M.; Feil, R.; Lunn, J.E.; Van Dijck, P. Trehalose-6-phosphate synthase 1 is not the only active TPS in Arabidopsis thaliana. Biochem. J. 2015, 466, 283–290. [Google Scholar] [CrossRef]
  47. Henry, C.; Bledsoe, S.W.; Siekman, A.; Kollman, A.; Waters, B.M.; Feil, R.; Stitt, M.; Lagrimini, L.M. The trehalose pathway in maize: Conservation and gene regulation in response to the diurnal cycle and extended darkness. J. Exp. Bot. 2014, 65, 5959–5973. [Google Scholar] [CrossRef] [Green Version]
  48. Yang, H.L.; Liu, Y.J.; Wang, C.L.; Zeng, Q.Y. Molecular evolution of trehalose-6-phosphate synthase (TPS) gene family in Populus, Arabidopsis and rice. PLoS ONE 2012, 7, e42438. [Google Scholar] [CrossRef]
  49. Harthill, J.E.; Meek, S.E.; Morrice, N.; Peggie, M.W.; Borch, J.; Wong, B.H.; Mackintosh, C. Phosphorylation and 14-3-3 binding of Arabidopsis trehalose-phosphate synthase 5 in response to 2-deoxyglucose. Plant J. 2006, 47, 211–223. [Google Scholar] [CrossRef]
  50. Ramon, M.; De Smet, I.; Vandesteene, L.; Naudts, M.; Leyman, B.; Van Dijck, P.; Rolland, F.; Beeckman, T.; Thevelein, J.M. Extensive expression regulation and lack of heterologous enzymatic activity of the Class II trehalose metabolism proteins from Arabidopsis thaliana. Plant Cell Environ. 2009, 32, 1015–1032. [Google Scholar] [CrossRef] [PubMed]
  51. Vogel, G.; Fiehn, O.; Jean-Richard-dit-Bressel, L.; Boller, T.; Wiemken, A.; Aeschbacher, R.A.; Wingler, A. Trehalose metabolism in Arabidopsis: Occurrence of trehalose and molecular cloning and characterization of trehalose-6-phosphate synthase homologues. J. Exp. Bot. 2001, 52, 1817–1826. [Google Scholar] [CrossRef] [PubMed] [Green Version]
  52. Zang, B.; Li, H.; Li, W.; Deng, X.W.; Wang, X. Analysis of trehalose-6-phosphate synthase (TPS) gene family suggests the formation of TPS complexes in rice. Plant Mol. Biol. 2011, 76, 507–522. [Google Scholar] [CrossRef]
  53. Tian, L.; Xie, Z.; Lu, C.; Hao, X.; Wu, S.; Huang, Y.; Li, D.; Chen, L. The trehalose-6-phosphate synthase TPS5 negatively regulates ABA signaling in Arabidopsis thaliana. Plant Cell Rep. 2019, 38, 869–882. [Google Scholar] [CrossRef] [PubMed]
  54. Suzuki, N.; Bajad, S.; Shuman, J.; Shulaev, V.; Mittler, R. The transcriptional co-activator MBF1c is a key regulator of thermotolerance in Arabidopsis thaliana. J. Biol. Chem. 2008, 283, 9269–9275. [Google Scholar] [CrossRef] [PubMed] [Green Version]
  55. Singh, V.; Louis, J.; Ayre, B.G.; Reese, J.C.; Pegadaraju, V.; Shah, J. TREHALOSE PHOSPHATE SYNTHASE11-dependent trehalose metabolism promotes Arabidopsis thaliana defense against the phloem-feeding insect Myzus persicae. Plant J. 2011, 67, 94–104. [Google Scholar] [CrossRef]
  56. Krasensky, J.; Broyart, C.; Rabanal, F.A.; Jonak, C. The redox-sensitive chloroplast trehalose-6-phosphate phosphatase AtTPPD regulates salt stress tolerance. Antioxid. Redox Signal. 2014, 21, 1289–1304. [Google Scholar] [CrossRef] [Green Version]
  57. Lin, Q.; Yang, J.; Wang, Q.; Zhu, H.; Chen, Z.; Dao, Y.; Wang, K. Overexpression of the trehalose-6-phosphate phosphatase family gene AtTPPF improves the drought tolerance of Arabidopsis thaliana. BMC Plant Biol. 2019, 19, 381. [Google Scholar] [CrossRef] [PubMed] [Green Version]
  58. Habibur Rahman Pramanik, M.; Imai, R. Functional identification of a trehalose 6-phosphate phosphatase gene that is involved in transient induction of trehalose biosynthesis during chilling stress in rice. Plant Mol. Biol. 2005, 58, 751–762. [Google Scholar] [CrossRef]
  59. Shima, S.; Matsui, H.; Tahara, S.; Imai, R. Biochemical characterization of rice trehalose-6-phosphate phosphatases supports distinctive functions of these plant enzymes. FEBS J. 2007, 274, 1192–1201. [Google Scholar] [CrossRef]
  60. Kretzschmar, T.; Pelayo, M.A.; Trijatmiko, K.R.; Gabunada, L.F.; Alam, R.; Jimenez, R.; Mendioro, M.S.; Slamet-Loedin, I.H.; Sreenivasulu, N.; Bailey-Serres, J.; et al. A trehalose-6-phosphate phosphatase enhances anaerobic germination tolerance in rice. Nat. Plants 2015, 1, 15124. [Google Scholar] [CrossRef]
  61. Wang, S.; Pei, J.; Li, J.; Tang, G.; Zhao, J.; Peng, X.; Nie, S.; Ding, Y.; Wang, C. Sucrose and starch metabolism during Fargesia yunnanensis shoot growth. Physiol. Plant 2020, 168, 188–204. [Google Scholar] [CrossRef]
  62. Ruan, Y.L. Sucrose metabolism: Gateway to diverse carbon use and sugar signaling. Annu. Rev. Plant Biol. 2014, 65, 33–67. [Google Scholar] [CrossRef]
  63. Yoon, J.; Cho, L.H.; Tun, W.; Jeon, J.S.; An, G. Sucrose signaling in higher plants. Plant Sci. 2021, 302, 110703. [Google Scholar] [CrossRef] [PubMed]
  64. Fichtner, F.; Lunn, J.E. The Role of Trehalose 6-Phosphate (Tre6P) in Plant Metabolism and Development. Annu. Rev. Plant Biol. 2021, 72, 737–760. [Google Scholar] [CrossRef]
  65. Lunn, J.E.; Delorge, I.; Figueroa, C.M.; Van Dijck, P.; Stitt, M. Trehalose metabolism in plants. Plant J. 2014, 79, 544–567. [Google Scholar] [CrossRef]
  66. Carillo, P.; Feil, R.; Gibon, Y.; Satoh-Nagasawa, N.; Jackson, D.; Bläsing, O.E.; Stitt, M.; Lunn, J.E. A fluorometric assay for trehalose in the picomole range. Plant Methods 2013, 9, 21. [Google Scholar] [CrossRef] [PubMed]
  67. Paul, M. Trehalose 6-phosphate. Curr. Opin. Plant Biol. 2007, 10, 303–309. [Google Scholar] [CrossRef]
  68. Gabriel, C.; Fernhout, J.J.; Fichtner, F.; Feil, R.; Lunn, J.E.; Kossmann, J.; Lloyd, J.R.; van der Vyver, C. Genetic manipulation of trehalose-6-phosphate synthase results in changes in the soluble sugar profile in transgenic sugarcane stems. Plant Direct 2021, 5, e358. [Google Scholar] [CrossRef]
  69. Claeys, H.; Vi, S.L.; Xu, X.; Satoh-Nagasawa, N.; Eveland, A.L.; Goldshmidt, A.; Feil, R.; Beggs, G.A.; Sakai, H.; Brennan, R.G.; et al. Control of meristem determinacy by trehalose 6-phosphate phosphatases is uncoupled from enzymatic activity. Nat. Plants 2019, 5, 352–357. [Google Scholar] [CrossRef] [PubMed]
  70. Szecowka, M.; Heise, R.; Tohge, T.; Nunes-Nesi, A.; Vosloh, D.; Huege, J.; Feil, R.; Lunn, J.; Nikoloski, Z.; Stitt, M.; et al. Metabolic fluxes in an illuminated Arabidopsis rosette. Plant Cell 2013, 25, 694–714. [Google Scholar] [CrossRef] [Green Version]
  71. Chen, X.; Alonso, A.P.; Shachar-Hill, Y. Dynamic metabolic flux analysis of plant cell wall synthesis. Metab. Eng. 2013, 18, 78–85. [Google Scholar] [CrossRef] [PubMed]
  72. Ishihara, H.; Moraes, T.A.; Pyl, E.T.; Schulze, W.X.; Obata, T.; Scheffel, A.; Fernie, A.R.; Sulpice, R.; Stitt, M. Growth rate correlates negatively with protein turnover in Arabidopsis accessions. Plant J. 2017, 91, 416–429. [Google Scholar] [CrossRef] [PubMed] [Green Version]
  73. Schmölzer, K.; Gutmann, A.; Diricks, M.; Desmet, T.; Nidetzky, B. Sucrose synthase: A unique glycosyltransferase for biocatalytic glycosylation process development. Biotechnol. Adv. 2016, 34, 88–111. [Google Scholar] [CrossRef]
  74. Li, M.; Wang, S.; Liu, Y.; Zhang, Y.; Ren, M.; Liu, L.; Lu, T.; Wei, H.; Wei, Z. Overexpression of PsnSuSy1, 2 genes enhances secondary cell wall thickening, vegetative growth, and mechanical strength in transgenic tobacco. Plant Mol. Biol. 2019, 100, 215–230. [Google Scholar] [CrossRef]
  75. Peng, J.; Zhang, L.; Liu, J.; Luo, J.; Zhao, X.; Dong, H.; Ma, Y.; Sui, N.; Zhou, Z.; Meng, Y. Effects of Soil Salinity on Sucrose Metabolism in Cotton Fiber. PLoS ONE 2016, 11, e0156398. [Google Scholar] [CrossRef] [PubMed] [Green Version]
  76. Damaris, R.N.; Lin, Z.; Yang, P.; He, D. The Rice Alpha-Amylase, Conserved Regulator of Seed Maturation and Germination. Int. J. Mol. Sci. 2019, 20, 450. [Google Scholar] [CrossRef] [Green Version]
  77. Jarvis, D.E.; Ho, Y.S.; Lightfoot, D.J.; Schmöckel, S.M.; Li, B.; Borm, T.J.; Ohyanagi, H.; Mineta, K.; Michell, C.T.; Saber, N.; et al. The genome of Chenopodium quinoa. Nature 2017, 542, 307–312. [Google Scholar] [CrossRef] [Green Version]
  78. Tamura, K.; Stecher, G.; Kumar, S. MEGA11: Molecular Evolutionary Genetics Analysis Version 11. Mol. Biol. Evol. 2021, 38, 3022–3027. [Google Scholar] [CrossRef]
  79. Duvaud, S.; Gabella, C.; Lisacek, F.; Stockinger, H.; Ioannidis, V.; Durinx, C. Expasy, the Swiss Bioinformatics Resource Portal, as designed by its users. Nucleic Acids Res. 2021, 49, W216–W227. [Google Scholar] [CrossRef]
  80. Bailey, T.L.; Elkan, C. Fitting a mixture model by expectation maximization to discover motifs in biopolymers. Proc. Int. Conf. Intell. Syst. Mol. Biol. 1994, 2, 28–36. [Google Scholar]
  81. Lescot, M.; Dehais, P.; Thijs, G.; Marchal, K.; Moreau, Y.; Van de Peer, Y.; Rouze, P.; Rombauts, S. PlantCARE, a database of plant cis-acting regulatory elements and a portal to tools for in silico analysis of promoter sequences. Nucleic Acids Res. 2002, 30, 325–327. [Google Scholar] [CrossRef] [PubMed]
  82. Xiaolin, Z.; Baoqiang, W.; Xian, W.; Xiaohong, W. Identification of the CIPK-CBL family gene and functional characterization of CqCIPK14 gene under drought stress in quinoa. BMC Genom. 2022, 23, 447. [Google Scholar] [CrossRef] [PubMed]
  83. Livak, K.J.; Schmittgen, T.D. Aanalysis of relative gene expression data using real-time quantitative PCR and the 2(-Delta Delta C(T)) Method. Methods 2001, 25, 402–408. [Google Scholar] [CrossRef] [PubMed]
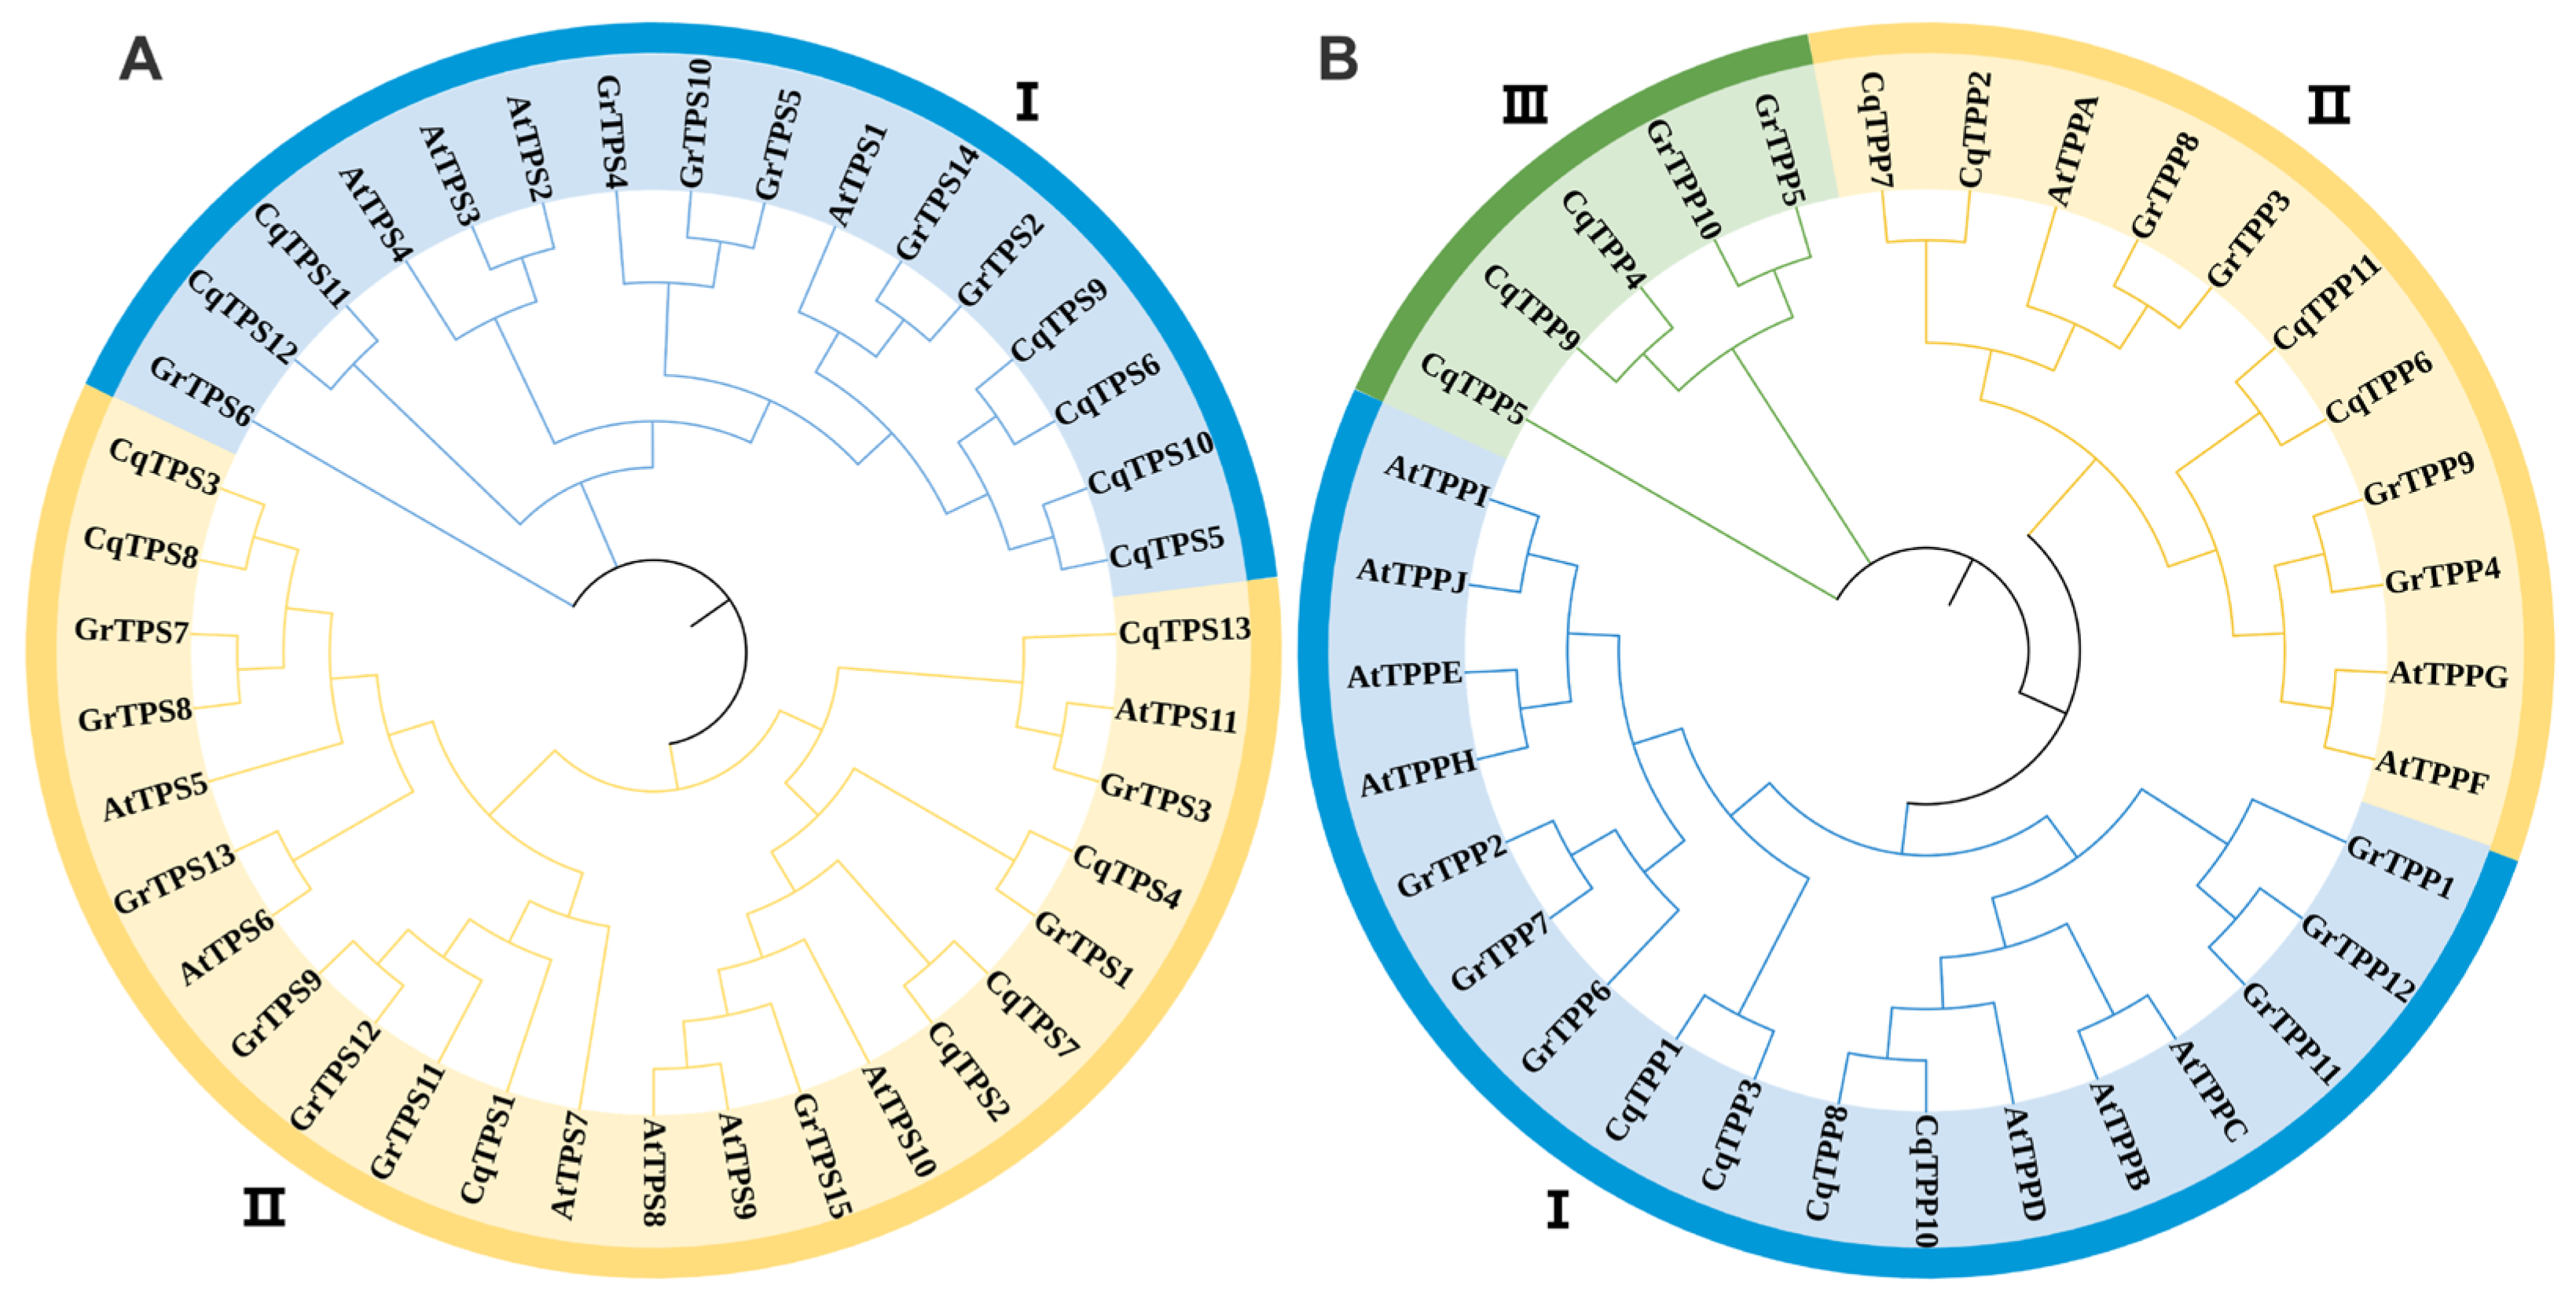
Figure 1. Phylogenetic analysis of TPS and TPP gene familes of Chenopodium quinoa Willd, Arabidopsis thaliana (L.), and Gossypium hirsutum Linn. (A) A phylogenetic tree containing 13 CqTPSs, 11 AtTPSs, and 15 GrTPSs, which are divided into two Classes distinguished in different colors. (B) A phylogenetic tree containing 11 CqTPPs, 10 AtTPPs, and 12 GrTPPs, which are divided into three Classes distinguished in different colors. I, II and III represent Class I, Class II and Class III respectively.
Ijms 24 06950 g001
Figure 2. Analysis of gene and protein primary structures of CqTPSs and CqTPPs. (A,B) Conservative domain analysis of CqTPS (A) and CqTPP (B) proteins. Class I CqTPS proteins contain a catalytic triad residue, Arg (R)/Lys (K)/Glu (E) (dark gray bars), and a SUMOylation site at the C-terminal (black bars). (C,D) Motif distribution analysis of CqTPS (C) and CqTPP (D) proteins. (E,F) Gene structure analysis of CqTPSs (E) and CqTPPs (F).
Ijms 24 06950 g002
Figure 3. Analysis of cis-acting elements in promoters of CqTPS (A) and CqTPP (B) genes. The categorized groups are indicated by color bars. The number of each element is indicated in the circles and is also shown by different colors presented in a color scale in the lower panel.
Ijms 24 06950 g003
Figure 4. Transcriptome analysis of CqTPSs and CqTPPs and related processes and metabolism analysis of related metabolites in quinoa leaves undergoing saline-alkali stress. (A,B) Transcriptome analysis of expression levels of CqTPS and CqTPP family genes in quinoa leaves. Two-week-old quinoa seedlings were treated with a carbonate solution containing 100 mM Na2CO3:NaHCO3 = 1:9 for two weeks. (C) Metabolism analysis of the differently accumulated metabolites (DAMs) in the starch and sucrose metabolism pathway. (D) Go enrichment analysis of total differently expressed genes (DEGs). Arrows, trehalose-related processes.
Ijms 24 06950 g004
Figure 5. GO Analysis of starch and sucrose metabolism (main routes related to trehalose metabolism) in quinoa leaves. (A) Overview of the starch and sucrose metabolism pathway in quinoa leaves in response to saline-alkali stress. Rectangles with orange frames, metabolites; circles, DEGs; blue solid lines with arrows, directions of the processes; rectangles with green frames, other metabolism pathways; gray dotted lines, connection of the starch and sucrose metabolism pathway with other metabolism pathways. The colors of rectangles and circles indicate significances, which are presented in color scales. The genes highlighted in red were detected by RT-qPCR. (B) RT-qPCR analysis of the DEGs. UBQ9 (AUR62020068) was used as endogenoue control. Three independent experiments per sample, three replicates per experiment. *, p < 0.05; **, p < 0.01; ***, p < 0.001; Student’s t-test. Abbreviations: AMY, α-amylase; GBE1, glycogen branching enzyme; glgA, glycogen synthase; glgC, ADPglucose pyrophosphorylase; ISA, isoamylase; malZ, maltodextrin glucosidase; SUS, sucrose synthase; T6P, trehalose 6-phosphate; TPP, trehalose 6-phosphate phosphatase; TPS, trehalose-6-phosphate synthase; UDP-glucose, uridine diphosphate glucose.
Ijms 24 06950 g005
Figure 6. The growth activity of CqTPS4- and CqTPS8-expressing yeast under saline-alkali stress. Yeast strain INVSC1 was transformed with the pYES2-CqTPS4, pYES2-CqTPS8, or pYES2 empty vector (control), respectively, and grew for 24 hrs on SC-Ura medium containing 25 mM NaHCO3 with pH value as indicated. pH 5.8 was the control pH value.
Ijms 24 06950 g006
Table 1. Basic information of CqTPS genes in quinoa genome.
Gene NameLocus_IDPosition (bp)Deduced PolypeptideTrehalose Ppase
Scaffold LocationStartEndLength (aa)MW (Da)pIStart (aa)End (aa)
CqTPS1AUR62002092Scaffold_44802,006,7542,013,92485796.63 6.24595829
CqTPS2AUR62005352Scaffold_1214997,2401,004,59185796.71 6.44593825
CqTPS3AUR62007314Scaffold_19713,942,4333,949,01686397.47 6.70597832
CqTPS4AUR62008239Scaffold_34222,052,1492,059,82686297.33 6.65595829
CqTPS5AUR62013953Scaffold_3035858,836875,850919103.22 6.48616818
CqTPS6AUR62013957Scaffold_30351,012,0801,026,86150156.16 6.51190392
CqTPS7AUR62014005Scaffold_30352,206,3772,210,38283093.91 6.54634798
CqTPS8AUR62018691Scaffold_1817914,067920,16386397.41 6.75597832
CqTPS9AUR62019657Scaffold_21277,449,0037,470,166963108.42 6.63651854
CqTPS10AUR62019658Scaffold_21277,636,9797,658,8931032116.20 6.20729931
CqTPS11AUR62027638Scaffold_11255,349,3145,357,21985696.48 6.11567764
CqTPS12AUR62035839Scaffold_17591,363,1651,381,1381173130.87 6.408841087
CqTPS13AUR62040284Scaffold_138570,03174,078928103.71 5.34593828
Table 2. Basic information of CqTPP genes in quinoa genome.
Gene NameLocus_IDPosition (bp)Deduced PolypeptideTrehalose Ppase
Scaffold LocationStartEndLength (aa)MW (Da)pIStart (aa)End (aa)
CqTPP1AUR62002023Scaffold_44801,360,0511,362,65235640.67 10.05100333
CqTPP2AUR62002194Scaffold_44803,394,6463,399,20538342.74 7.18121366
CqTPP3AUR62003778Scaffold_23704,555,5404,557,76435640.63 9.98100333
CqTPP4AUR62004476Scaffold_42503,542,1283,550,90237442.91 7.73111355
CqTPP5AUR62006139Scaffold_10012,668,3222,671,35534639.33 7.4186328
CqTPP6AUR62007476Scaffold_19715,646,7325,652,91638743.28 7.20120363
CqTPP7AUR62015517Scaffold_27517,485,9977,489,52438342.84 7.21121366
CqTPP8AUR62018916Scaffold_3876327,982331,29636944.94 9.97144374
CqTPP9AUR62023475Scaffold_1606414,991423,43132437.08 5.9761306
CqTPP10AUR62027730Scaffold_3784988,017990,53736640.98 9.83114343
CqTPP11AUR62039934Scaffold_3651310,550317,77138643.03 6.80120363
Disclaimer/Publisher’s Note: The statements, opinions and data contained in all publications are solely those of the individual author(s) and contributor(s) and not of MDPI and/or the editor(s). MDPI and/or the editor(s) disclaim responsibility for any injury to people or property resulting from any ideas, methods, instructions or products referred to in the content.