Article

The Effect of CaV1.2 Inhibitor Nifedipine on Chondrogenic Differentiation of Human Bone Marrow or Menstrual Blood-Derived Mesenchymal Stem Cells and Chondrocytes

1
Department of Regenerative Medicine, State Research Institute Centre for Innovative Medicine, 08406 Vilnius, Lithuania
2
Research Unit of Health Sciences and Technology, Faculty of Medicine, University of Oulu, 90014 Oulu, Finland
3
World Health Organization Collaborating Center for Public Health Aspects of Musculoskeletal Health and Aging, Université de Liège, B-4000 Liège, Belgium
4
Department of Joint Surgery, First Affiliated Hospital of Sun Yat-sen University, Guangzhou 510080, China
*
Author to whom correspondence should be addressed.
Int. J. Mol. Sci. 2023, 24(7), 6730; https://doi.org/10.3390/ijms24076730
Submission received: 13 January 2023 / Revised: 27 February 2023 / Accepted: 29 March 2023 / Published: 4 April 2023

Abstract

:
Cartilage is an avascular tissue and sensitive to mechanical trauma and/or age-related degenerative processes leading to the development of osteoarthritis (OA). Therefore, it is important to investigate the mesenchymal cell-based chondrogenic regenerating mechanisms and possible their regulation. The aim of this study was to investigate the role of intracellular calcium (iCa2+) and its regulation through voltage-operated calcium channels (VOCC) on chondrogenic differentiation of mesenchymal stem/stromal cells derived from human bone marrow (BMMSCs) and menstrual blood (MenSCs) in comparison to OA chondrocytes. The level of iCa2+ was highest in chondrocytes, whereas iCa2+ store capacity was biggest in MenSCs and they proliferated better as compared to other cells. The level of CaV1.2 channels was also highest in OA chondrocytes than in other cells. CaV1.2 antagonist nifedipine slightly suppressed iCa2+, Cav1.2 and the proliferation of all cells and affected iCa2+ stores, particularly in BMMSCs. The expression of the CaV1.2 gene during 21 days of chondrogenic differentiation was highest in MenSCs, showing the weakest chondrogenic differentiation, which was stimulated by the nifedipine. The best chondrogenic differentiation potential showed BMMSCs (SOX9 and COL2A1 expression); however, purposeful iCa2+ and VOCC regulation by blockers can stimulate a chondrogenic response at least in MenSCs.

1. Introduction

Human articular cartilage is a highly specialized, avascular tissue, which has a low ability to repair lesions, which lead to diseases such as osteoarthritis (OA) [1,2,3]. OA is known to be the most common form of arthritis and a leading cause of human disability worldwide, largely due to pain, as a primary symptom of the joint impairment [1,4]. Up to date, the most common treatment includes OA-related pain suppressing non-steroidal anti-inflammatory drugs (NSAIDs) and other types of painkillers [5,6,7]. However, very often the therapeutic result of the conventional treatments is disappointing. Therefore, OA cartilage repair by applying stem cells has been considered as a promising field of articular regenerative medicine [8,9,10,11].
The pluripotent stem cells and the mesenchymal stem/stromal cells have been so far mostly investigated in OA tissue regeneration studies both in vitro and in vivo [12,13,14]. As the human embryonic stem cells (ESCs) have limited applicability due to ethical issues, mouse and other experimental animal ESCs can generate an unlimited source of chondrocytes and other tissues specific cells under the appropriate conditions in vitro [15]. Another type of pluripotent stem cells, induced pluripotent stem cells (iPSCs), have also been intensively investigated in the cartilage tissue regeneration field; however, the challenges of directing their differentiation as well as risks related to the elusive origin and tumorigenesis should not be ignored [16]. Due to the ability to differentiate into chondrocytes and immunomodulatory properties, adult tissue-derived MSCs have been suggested to be one of the most attractive tools for the OA regenerative studies both in vitro and in-vivo [17,18,19]. Rapid proliferation, minor immunological rejection expands the therapeutic application of MSCs in the regulation of OA pathogenesis. Among various types of human tissues-derived MSCs, the adipose [20], human synovial membrane [21], autologous and allogeneic bone marrow [22,23] and chondrocytes [24,25], umbilical cord [26] in patients and animal models have been investigated for OA regeneration purposes. Recently, menstrual blood-derived MSCs have also been shown to have chondrogenic differentiation properties [27]. Therefore, in this study the chondrogenic potential of human BMMSCs, menstrual blood-derived MSCs (MenSCs) and OA cartilage-derived chondrocytes have been studied in vitro, considering the possible further application for the therapeutic OA regenerative purposes in vivo.
The level of intracellular calcium ions (iCa2+) controls a number of signaling pathways important for the cell functioning, proliferation and differentiation including chondrogenesis. An increasing body of evidence shows that calcium ions (Ca2+) participate in the regulation of differentiation potential of chondrogenic progenitor cells [28,29,30]. However, the effect of different iCa2+ levels, as well as mechanisms of iCa2+ regulation in the chondrogenic differentiation of mesenchymal and other types of stem cells are still unclear [31]. The importance of intracellular ion homeostasis in the functioning of chondrocyte [32], as well as other types of cells, has been extensively demonstrated [33]. Plasma membrane-situated proteins such as L-type voltage-operated calcium channels are crucial for the regulation of the iCa2+ level and further cell functioning [34]. VOCC are predominantly found in excitable cells, such as neurons, cardiomyocytes, glial or other types of the cells that can be extracellularly stimulated [13,35]. However, VOCC channels can also be expressed in a wide range of non-excitable cells, including chondrocytes [36]. The mechanism of VOCC action goes through the cell membrane depolarization and Ca2+ flow into the cells mainly through the VOCC subunits CaV1.2, which regulates the iCa2+ level and thus coordinates cell differentiation leading to the proper tissue development and functioning [37].
Chondrogenesis is regulated by the interplay between numerous intra- and extracellular factors [29]. Various cardiovascular (CV) drugs are well-known VOCC inhibitors used to prevent high blood pressure and to treat hypertension and at the same time might affect chondrogenesis [38]. Recent publications showed that anti-hypertensive VOCC inhibitors can affect the iCa2+ level and subsequent expression of the chondrogenic differentiation-related markers in human BMMSCs and animal cartilage-derived chondrocytes [29,34]. However, the effect of an anti-hypertensive cardiovascular therapeutic agent such as nifedipine on iCa2+ regulation through the VOCC channels and its effect on chondrogenic differentiation of various types of MSCs has not been investigated so far. The alteration of Ca2+ entry into the cytoplasm by prescribed cardiovascular anti-hypertensive Ca2+ ion channel blockers might stimulate or suppress the chondrogenic differentiation potential of MSCs in vitro showing a possible regulation mechanisms of OA pathogenesis in vivo.
Therefore, the aim of this study was to investigate the role of iCa2+ and its regulation through the inhibition of VOCC channels with CaV1.2 antagonist nifedipine on chondrogenic differentiation potential of human MenSCs, BMMSCs and OA chondrocytes. The chondrogenic potential of OA cartilage-derived chondrocytes will reveal the possibility to stimulate the regenerating potential of OA cartilage by externally used chemical drugs.

2. Results

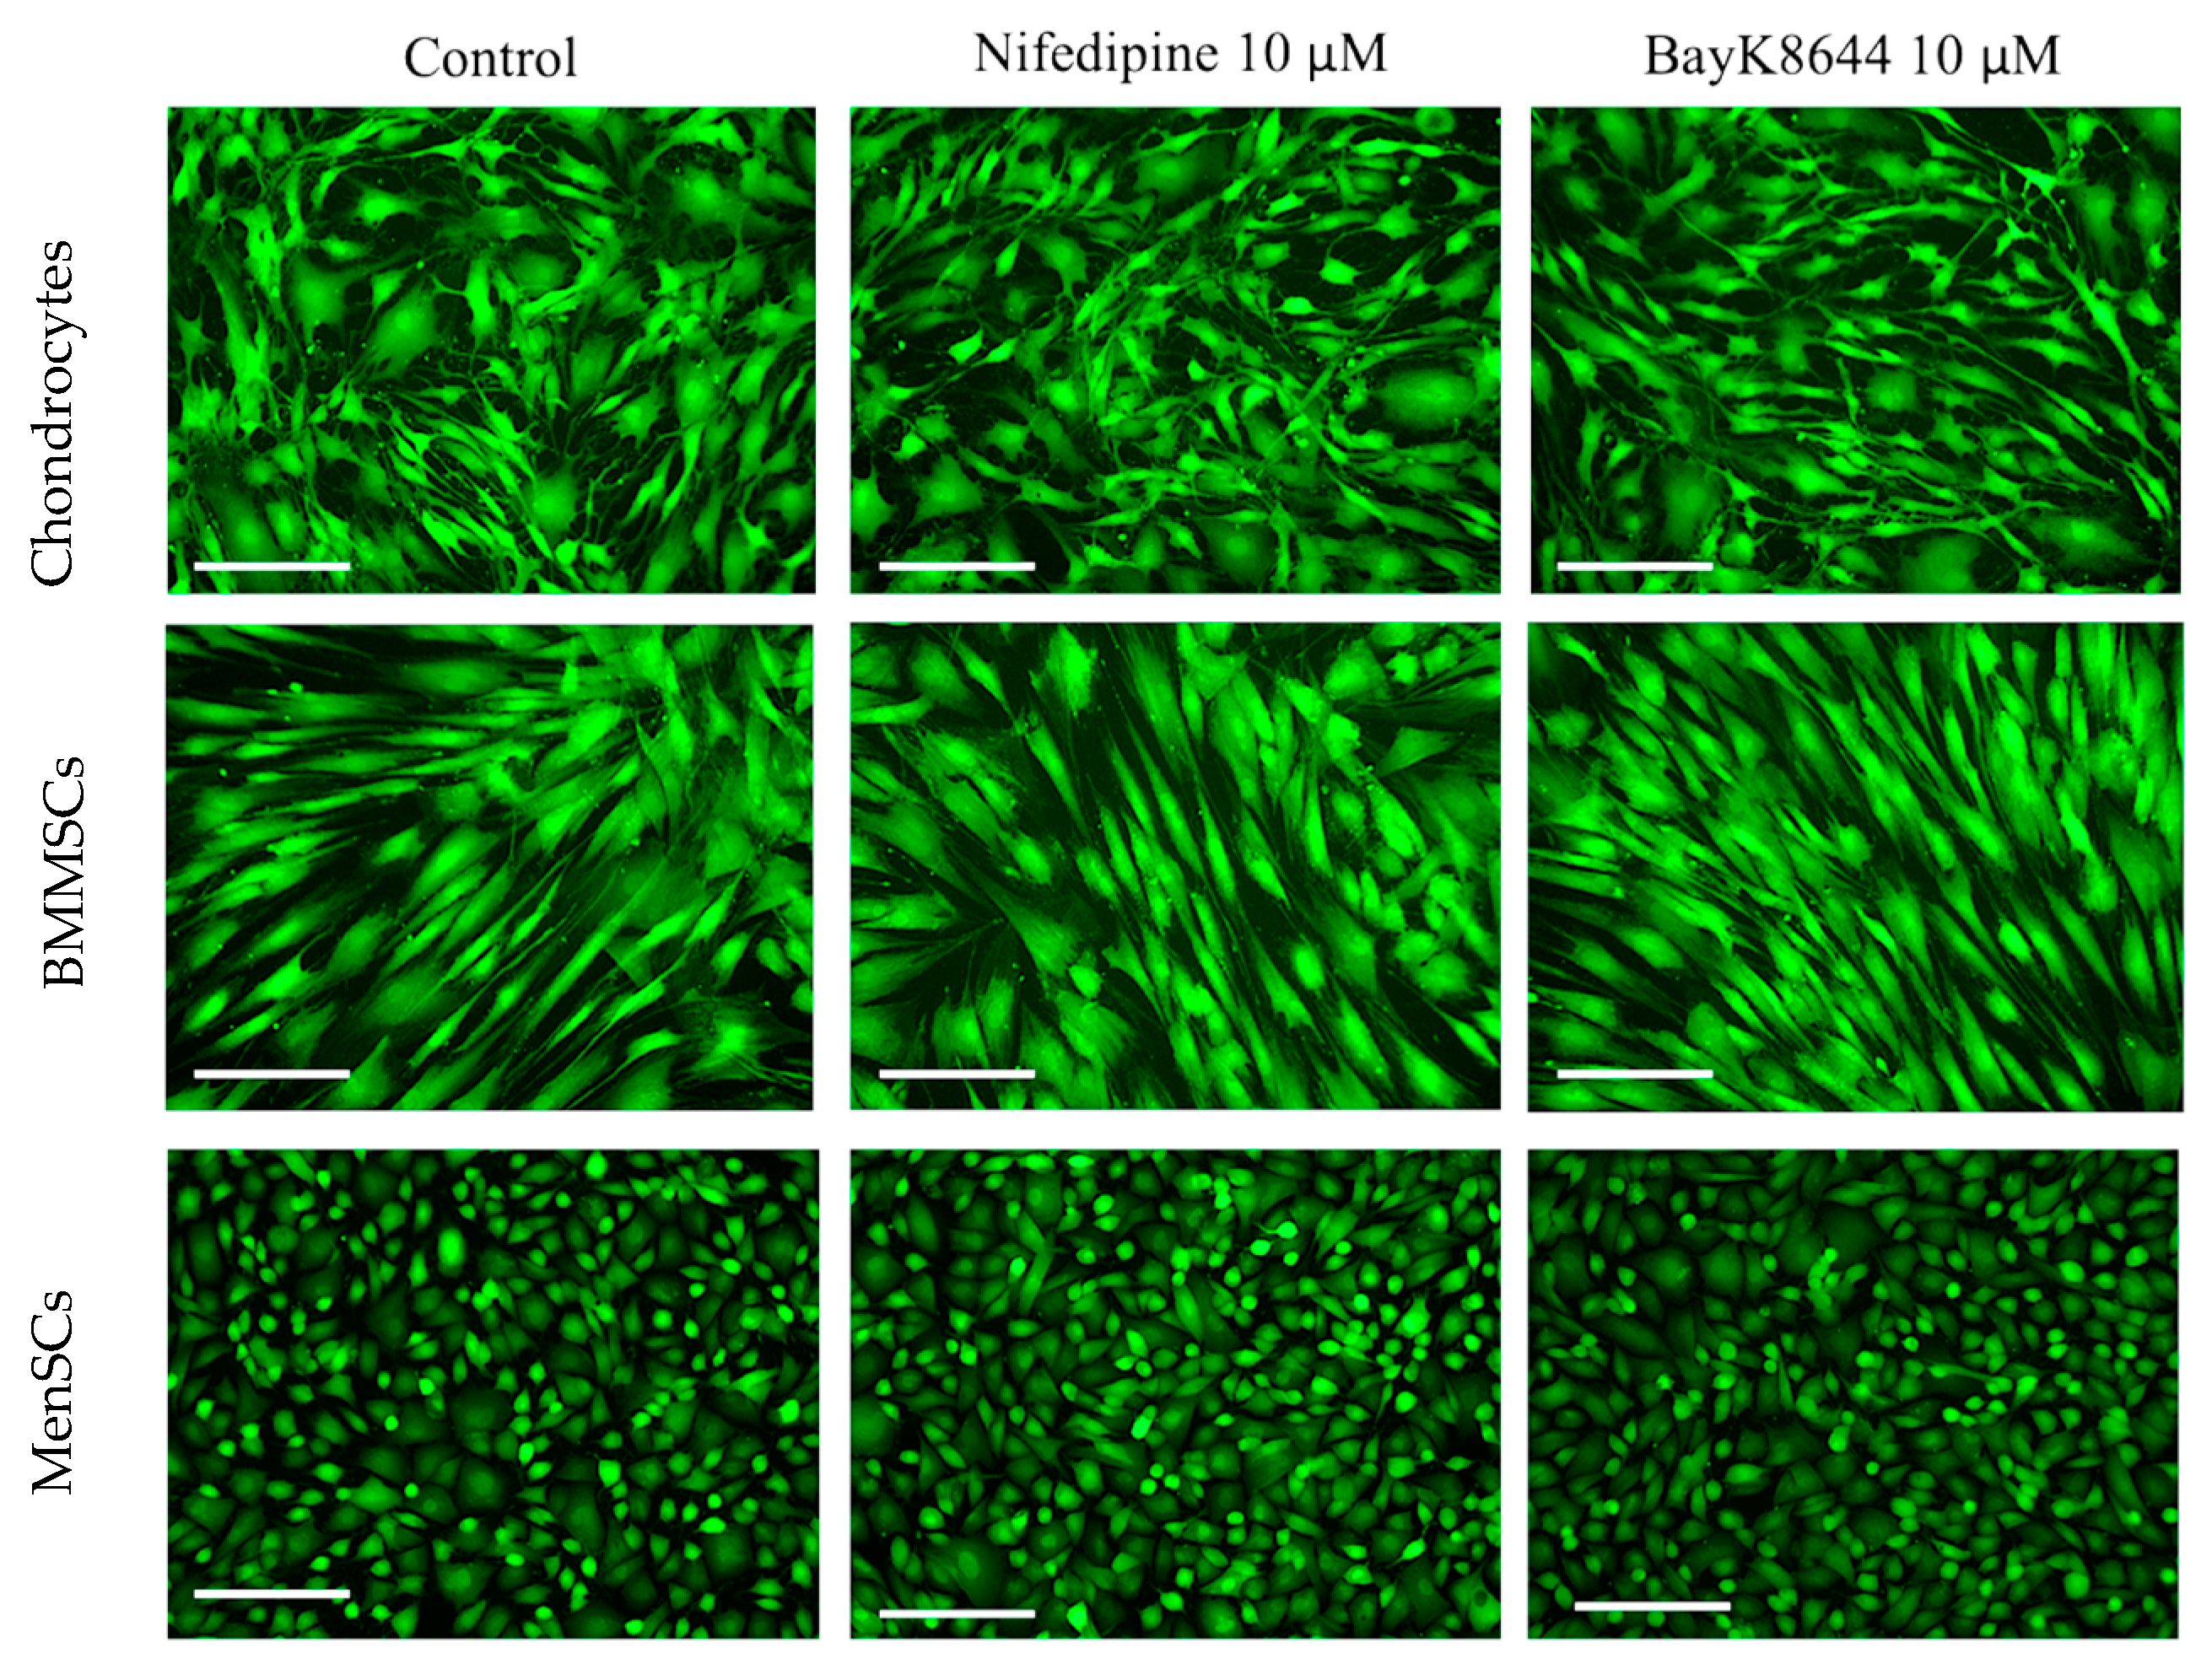
2.1. The Effects of Nifedipine and BayK8644 on iCa2+ Levels in MenSCs, BMMSCs and Chondrocytes

The effects of nifedipine, a VOCC channel CaV1.2 subunit antagonist, was analyzed by flow cytometry (Figure 1) and visualized microscopically (Figure 2). In addition, the effect of the VOCC channel CaV1.2 subunit agonist BayK8644 on iCa2+ was also analyzed. The highest iCa2+ level was observed in chondrocytes, and the lowest in BMMSCs. The affecting cells with 10 μM of nifedipine or 10 μM of BayK8644 for the 3 days did not significantly change the iCa2+ levels (Figure 1).
The identification of iCa2+ by fluorescent dye Cal520 and microscope showed almost similar levels of iCa2+ in all types of the tested cells (Figure 2). It is probably understandable since microscopical identification is a less sensitive qualitative measurement than flow cytometer.
However, the iCa2+ staining with fluorescent Cal520 dye and time laps measurement revealed a different intensity of iCa2+ oscillations in different cells (Figure 2, Supplementary Videos S1–S3). The most intensive iCa2+ oscillations were observed in MenSCs as compared to the other cell types (Supplementary Video S1). The frequency of iCa2+ oscillations in BMMSCs (Supplementary Video S2) and chondrocytes (Supplementary Video S3) were considerably lower as compared to the MenSCs, suggesting the slower intracellular mechanisms regulating iCa2+ release/accumulation in the cytoplasm in those types of cells. In addition, the light microscopy micrographs also showed that BMMSC were the largest in size while MenSCs were the smallest that could also have an impact in iCa2+ regulation, oscillations and cell activity/proliferation.

2.2. The Release of iCa2+ from Intracellular Stores in MenSCs, BMMSCs and Chondrocytes

For the investigation of ionomycin-induced iCa2+ release from ER and other intracellular stores, the flow cytometer Calibur was used, which allows for the measurement of the instant fluorescence responses from the fluorescent dye Cal520 labeled cells. The obtained data (Figure 3A) confirmed the results presented in Figure 1 showing the highest basal level of iCa2+ in chondrocytes as compared to the other cell types.
Although the differences in iCa2+ basal levels were relatively small between the MenSCs, BMMSCs and chondrocytes, the ionomycin upregulated the iCa2+ level significantly stronger in MenSCs compared to the other cell types, suggesting a bigger or more active iCa2+ accumulation in those cells’ calcium stores (Figure 3A,B).

2.3. The Effect of Nifedipine on Basal Levels and Release of iCa2+ from Intracellular Stores of MenSCs, BMMSCs and Chondrocytes

Since the application of ionomycin resulted in a significantly higher level of iCa2+ in MenSCs, as compared to the other types of cells (Figure 3), we further investigated whether the iCa2+ store levels in all three cell types can be changed by their preincubation with nifedipine and BayK8644 for the 24 h. Data show the ionomycin-induced release of calcium from the intracellular stores remained to be the highest in MenSCs, as compared to the other types of cells, while it was not considerably altered by the incubation with nifedipine or BayK8644 (Figure 4A).
Surprisingly, the incubation of BMMSCs with nifedipine for the 24 h resulted in a significantly upregulated level of ionomycin-induced iCa2+ release from the intracellular stores (Figure 4B). The iCa2+ increase in BMMSCs by adding BayK8644 and ionomycin was also observed. The effect of nifedipine in chondrocytes was similar to the other cells, i.e., nifedipine significantly increased the basal iCa2+ level as well as induced slight iCa2+ release by ionomycin (Figure 4C).
These data suggest that MenSCs accumulate a high level of iCa2+ in the intracellular stores that were not significantly affected by the VOCC regulators. The accumulation of iCa2+ in the intracellular stores of BMMSCs and chondrocytes was considerably lower than in MenSCs. However, the inhibition or stimulation of VOCC with nifedipine or BayK8644, respectively, upregulated the iCa2+, particularly in the BMMSCs. Those observations imply that VOCC blocker nifedipine might affect not only CaV1.2 channels present in the plasma membrane but also channels inside the cells. There is also a possibility that nifedipine induces an external Ca2+ compensatory inflow through the other channels and/or receptors.

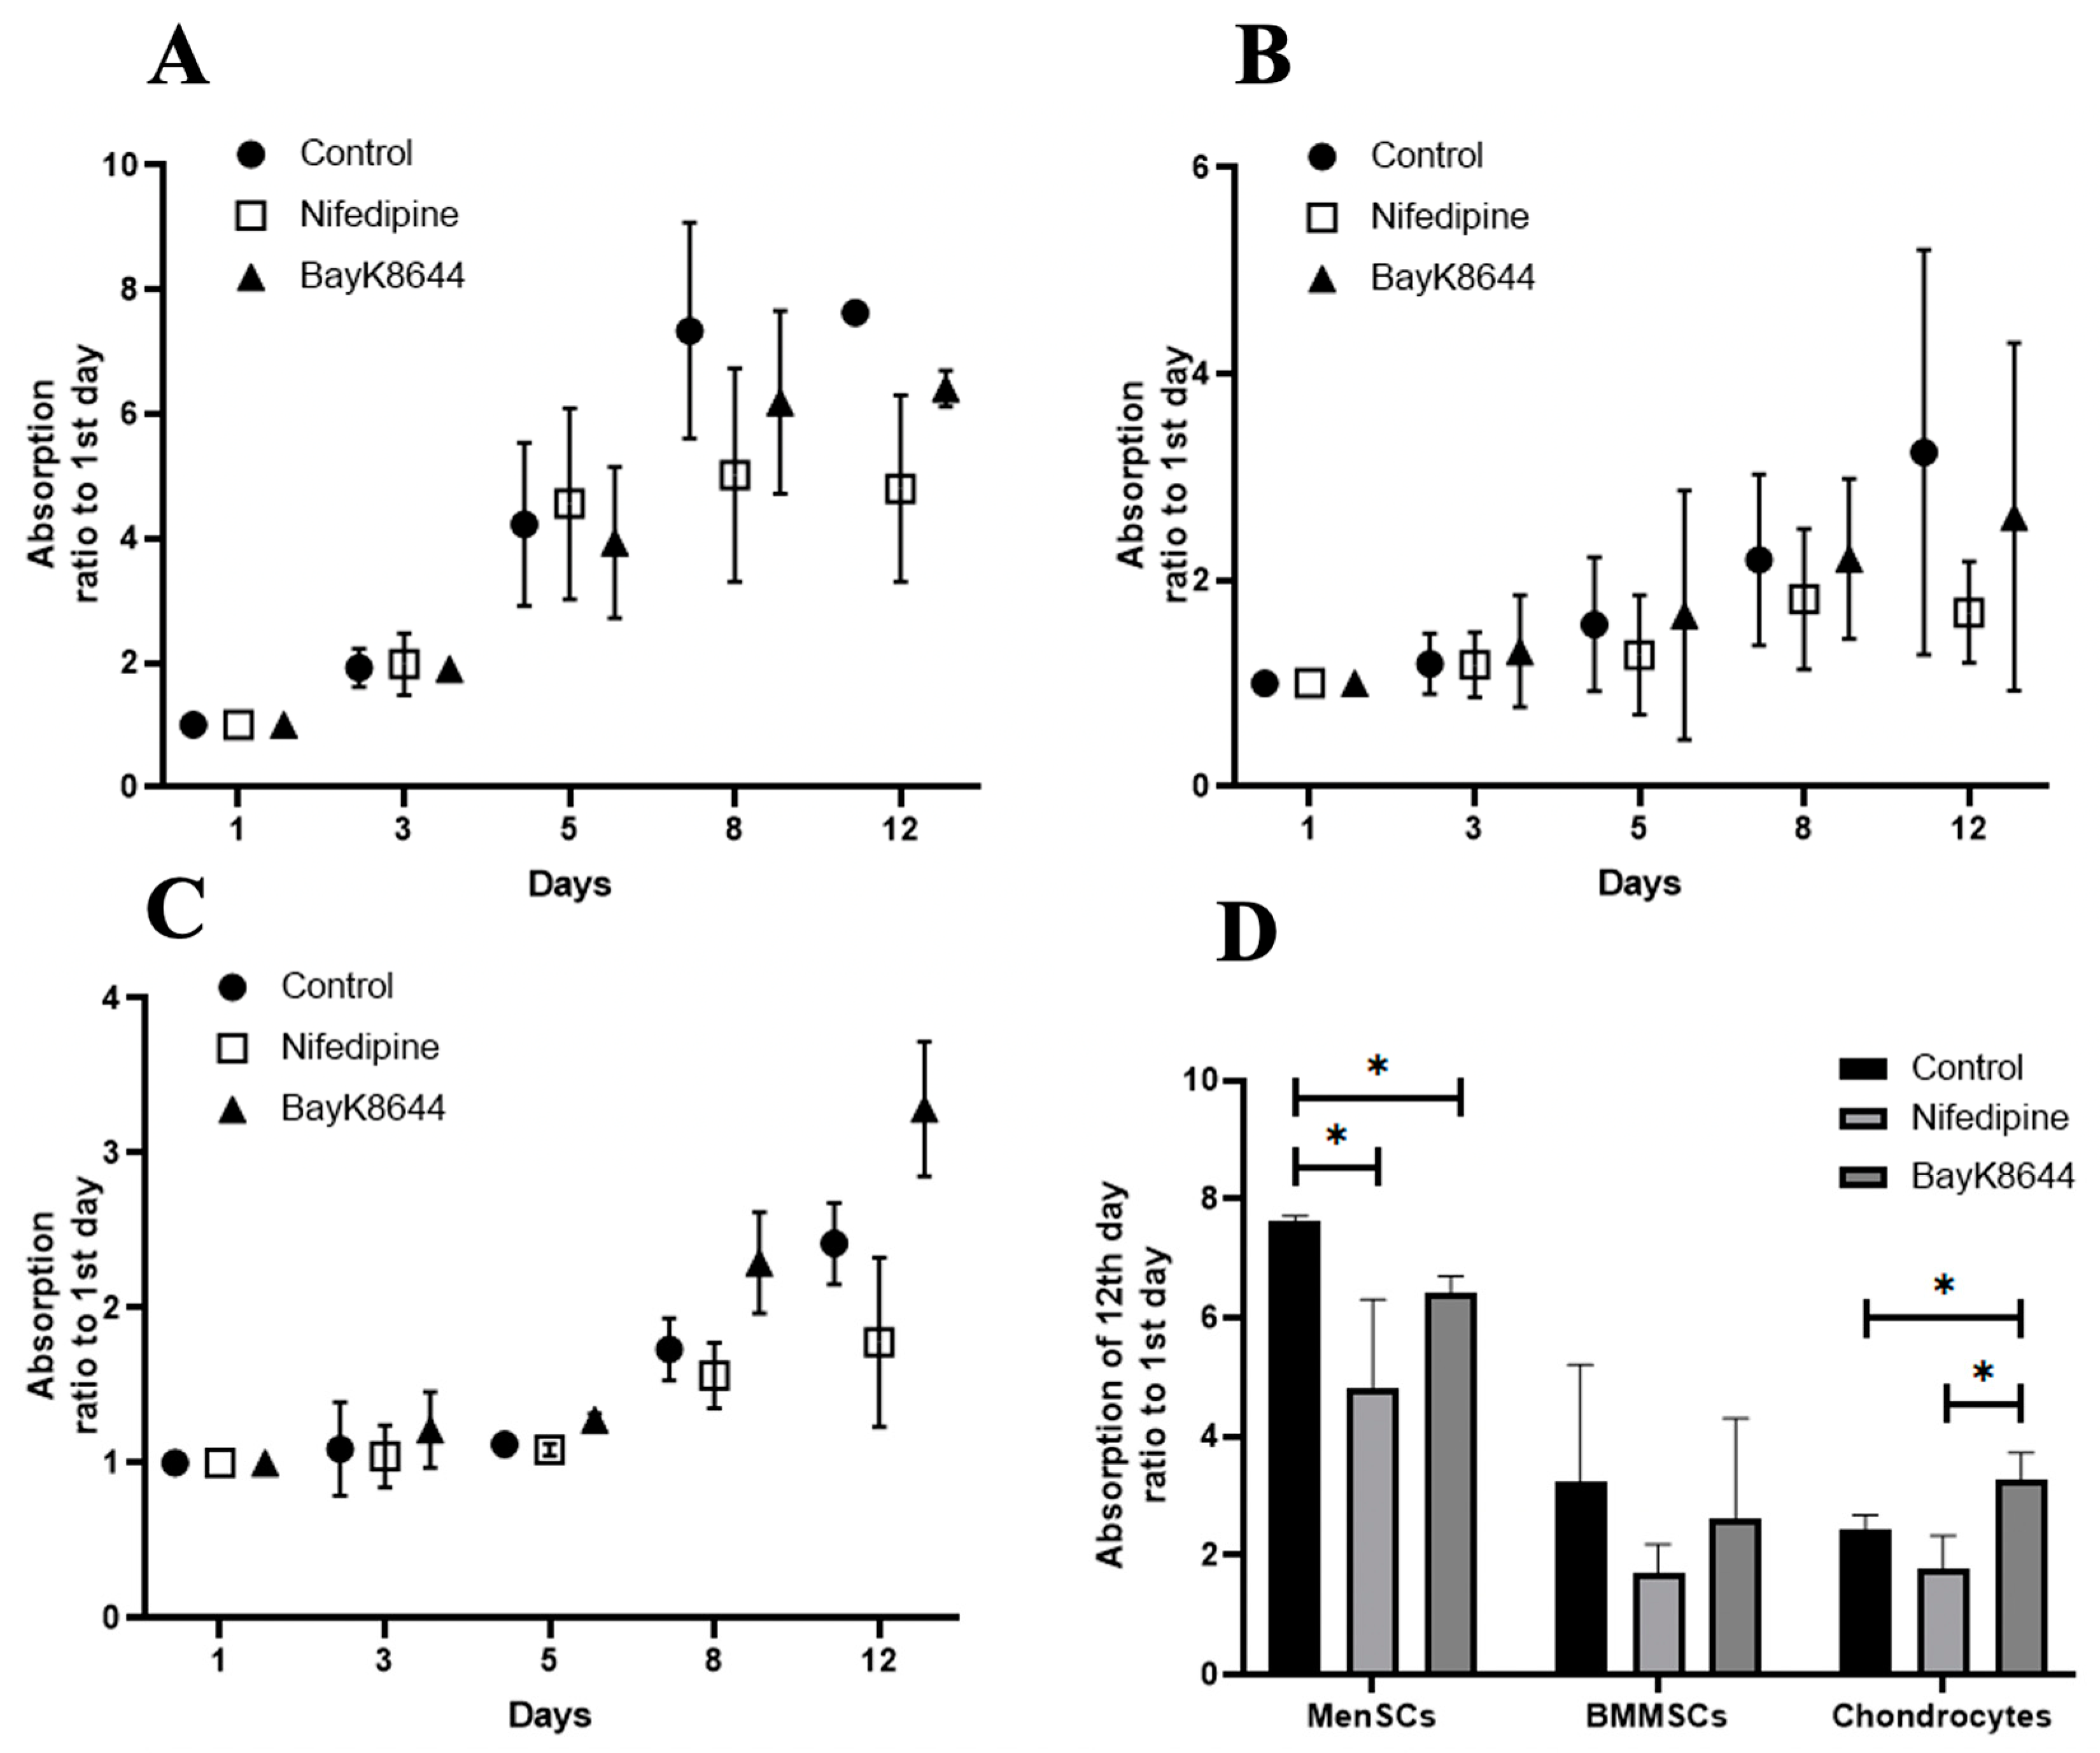
2.4. The Effect of Nifedipine on Proliferation of MenSCs, BMMSCs and Chondrocytes

Cell proliferation is an active process that requires a high level of iCa2+ [39], energetic and metabolic resources. Since VOCC antagonist nifedipine contributed to the iCa2+ accumulation during the 24 h of incubation, we have measured the effect of nifedipine on cell proliferation during 12 days of incubation (Figure 5). Data in Figure 5 show that MenSCs cells more intensively proliferated compared to the other types of cells that could be related to the bigger iCa2+ storages.
The VOCC antagonist nifedipine significantly suppressed the proliferation rate of all tested cells (Figure 5A–C). The strongest proliferation inhibiting effect of nifedipine was observed on the most intensively proliferating MenSCs, as compared to the other cells (Figure 5D). Surprisingly, BayK8644 also suppressed the proliferation of MenSCs and BMMSCs, but not in chondrocytes (Figure 5D). Data suggest that iCa2+ regulating channels are most active in MenSCs, compared to the other cells. There is also a possibility that certain levels of iCa2+ are necessary for the cell proliferation, which is differently regulated in different cells.

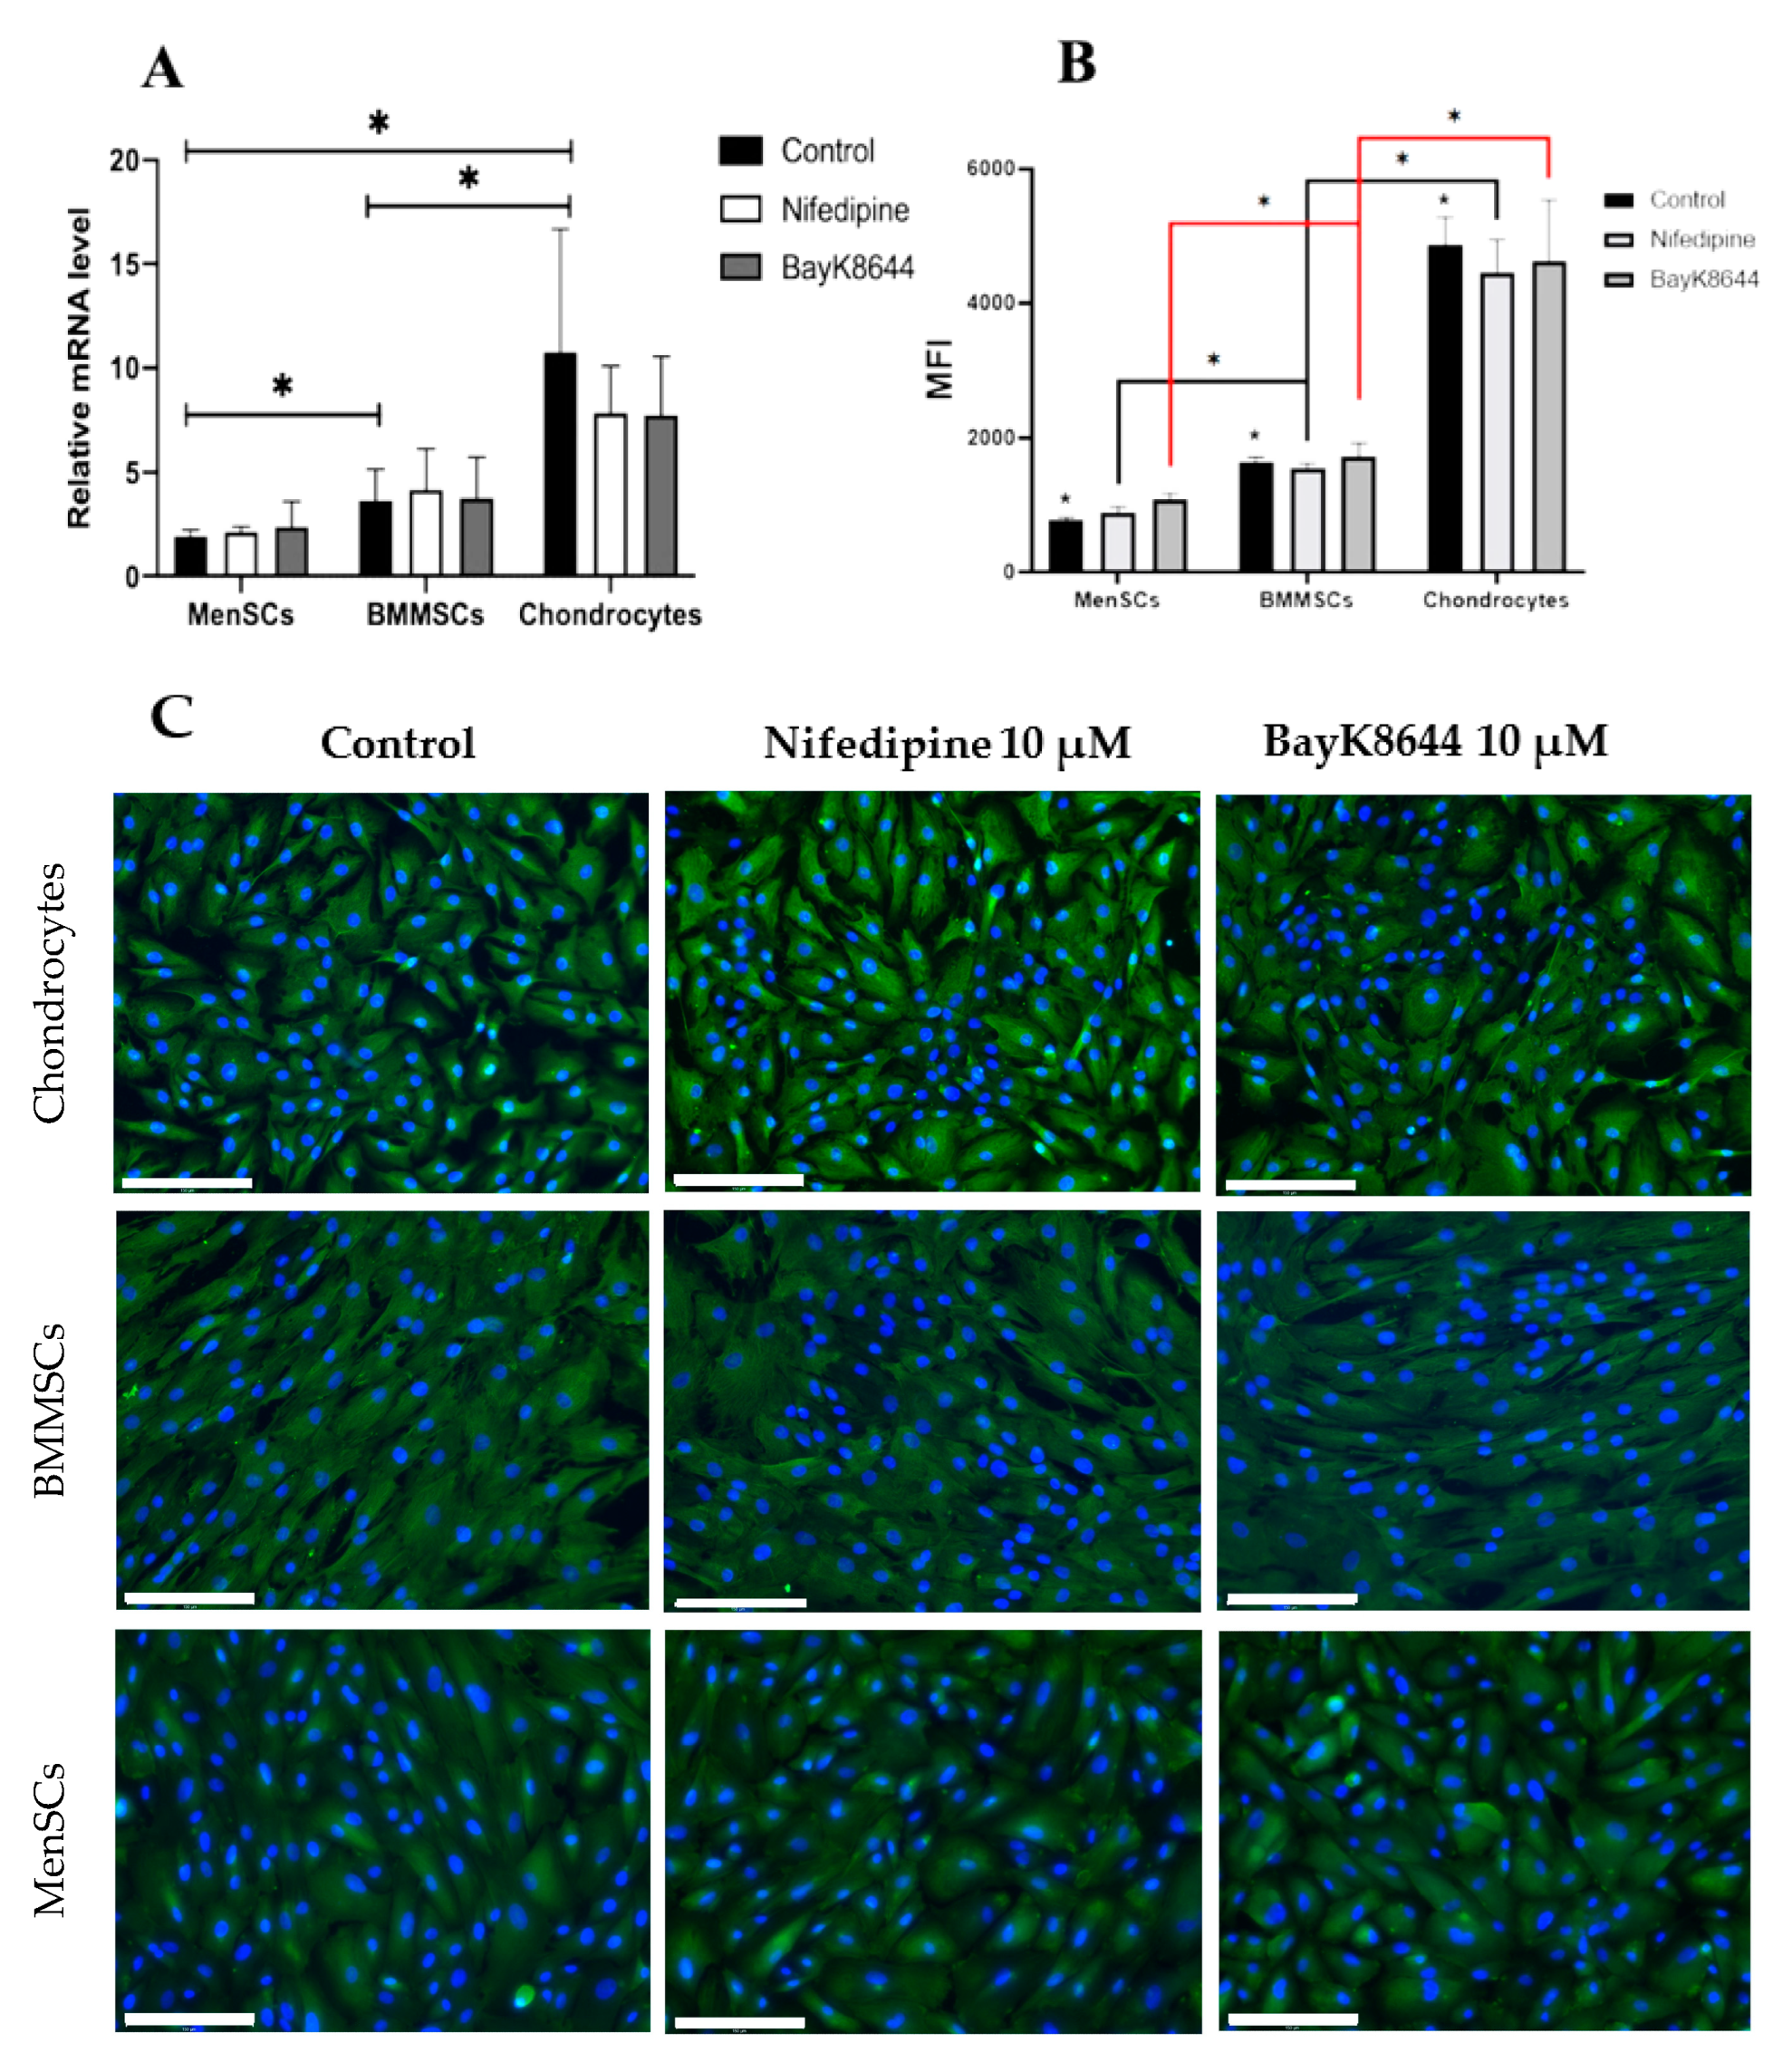
2.5. The Effect of Nifedipine on CaV1.2 Level in MenSCs, BMMSCs and Chondrocytes

Since the VOCC antagonist nifedipine affected the iCa2+ accumulation in storages and cell proliferation, the effect of nifedipine on the total level of CaV1.2, a main subunit of the VOCC channel, was also investigated at gene (CACNA1C) (Figure 6A) and protein (Figure 6B,C) levels using flow cytometer (BD FACSAria) (Figure 6B) and fluorescent microscope EVOS (Figure 6C).
Surprisingly, the expression of CACNA1C in MenSCs was the lowest, while in chondrocytes was the highest (Figure 6A). The highest CACNA1C expression in chondrocytes could be related to their highest level of iCa2+ compared to the other cells. No significant change in CACNA1C gene expression was observed after the cell’s treatment with nifedipine and BayK8644 for the 3 days.
The gene expression data were supported by the flow cytometry measurement, which was expressed as mean fluorescence intensity (MFI) (Figure 6B). Similar to the CACNA1C gene expression, the level of CaV1.2 was significantly lower in the MenSCs, as compared to the BMMSCs and OA chondrocytes (Figure 6B). Additionally, the cell incubation with nifedipine or BayK8644 for the 3 days did not significantly change the level of CaV1.2 in all measured cells.
Finally, the level of CaV1.2 in the cells was confirmed by fluorescent micrographs and was highest in chondrocytes, as compared to the BMMSCs and MenSCs (Figure 6C). No significant effect of nifedipine or BayK8644 on CaV1.2 was observed within the 3 days of incubation.

2.6. Different Effects of Nifedipine and BayK8644 on Expression of Chondrogenic Differentiation Markers in MenSCs, BMMSCs and Chondrocytes

Finally, the effect of nifedipine on chondrogenic differentiation of tested cells was observed. The expression of chondrogenic differentiation identifying genes SOX9, COL2A1 and CACNA1C in all types of the cells following chondrogenic differentiation for the 21 days are shown in Figure 7.
The basal expression of SOX9, a transcription factor regulating chondrogenic differentiation, was the lowest in MenSCs, as compared to the other cells (Figure 7A), while the stimulatory effect of TGF-β3 on SOX9 expression was stronger in BMMSCs and chondrocytes (red line). The VOCC antagonist nifedipine had some stimulating effect on SOX9 expression in MenSCs with and without TGF-β3, but not in other cell types (Figure 7A). The VOCC agonist BayK8644 suppressed TGF-β3 -induced upregulation of SOX9 expression in all tested cells.
The basal expression level of COL2A1, the most important biomarker of chondrogenic differentiation, was low in all undifferentiated cells. Similarly to the SOX9 expression, it was stimulated by TGF-β3 in BMMSCs and chondrocytes but not in MenSCs (red line). The nifedipine also stimulated COL2A1 expression in MenSCs but not in other types of the cells (Figure 7B).
The expression of VOCC subunit CaV1.2 (CACNA1C) was also analyzed in all cell types during their chondrogenic differentiation for the 21 days (Figure 7C). The basal expression level of CaV1.2 (CACNA1C) at the control level, opposite to the SOX9 and CACNA1C expressions, was the highest in MenSCs and the lowest in OA chondrocytes (Figure 7C). However, neither nifedipine nor BayK8644 had any significant effect on CACNA1C expression with or without TGF-β3. The cell stimulation with TGF-β3 also resulted in tendencies of increase in CACNA1C gene expression in all cell types.
Taken together, the tendencies of SOX9 and COL2A1 expressions after the TGF-β3 stimulus were similar in all types of cells, i.e., the strongest in BMMSCs and weakest in MenSCs, whereas CaV1.2 antagonist nifedipine had a stimulating effect only on MenSCs. The expression of CaV1.2, opposite to the SOX9 and COL2A1 expressions, was highest in MenSCs than in the rest cells. The agonist BayK8644 did not have a chondrogenic differentiation stimulating effect in all cells. Data show that BMMSCs have a highest chondrogenic differentiation potential compared to other tested cells, while the nifedipine stimulated this potential only in MenSCs. The best chondrogenic differentiation potential of BMMSCs might be related to their lower level of iCa2+ and/or different regulation of Cav1.2 channel compared to the other cells. Data also suggest that in Ca2+ entrance to the cell’s trough, the CaV1.2 is essential for the cell proliferation but not for the chondrogenic differentiation.

3. Discussion

The various types of the multipotent and pluripotent stem cells, tissue engineering technologies, including scaffolds or hydrogels, have been investigated for the cartilage tissue regenerating purposes [40,41]. The multipotent MSCs derived from the adipose [20], human synovial membrane [21], autologous and allogeneic bone marrow [22,23] and chondrocytes [24,25], umbilical cord [26] and other tissues in patients and animal models have been investigated for the OA regeneration purposes. However, it is difficult to compare the efficiency of all cell-based cartilage regeneration model systems investigated both in vitro and in vivo due to the high variation of applied experimental conditions. Beside the direct MSCs participation in cell differentiation processes, they can secret paracrine factors and extracellular vesicles also participating in the chondrogenic differentiation [42]. The paracrine effects of the MSCs even raised a question to change their name to the signalling cells, which did not correspond with all the MSCs functions [14].
In this study, we have chosen to investigate the chondrogenic differentiation potential of adult tissue-derived mesenchymal stem/stromal cells (MSCs) such as MenSCs and BMMSCs in comparison to the OA cartilage-derived chondrocytes and to investigate the impact of VOOC channel regulators on it. Previously published studies showed the chondrogenic potential of BMMSCs being high enough to be used for the cartilage regeneration purpose in vitro [43,44]. Our recently published findings also confirmed the higher chondrogenic potential of BMMSCs than other MSCs and their suitability for the investigation of chondrogenic differentiation mechanisms in model systems in vitro [41,45]. Human BMMSCs recruitment to the IL-8- and MIP-3α-containing scaffolds enhanced tissue regeneration of an osteochondral defect site in beagle knee articular cartilage [46]. Moreover, the pre-clinical study of intra-articular injections of BM-MSCs for the treatment of knee osteoarthritis showed positive results [47].
Another type of MSCs used in this study, such as menstrual blood-derived cells, was chosen as an easily accessible source of MSCs. They were firstly isolated and observed by [48]. From that time, the menstrual blood has attracted huge scientific interest, leading to a permanently increasing number of different research studies and possible applications of MenSCs in both experimental and clinical practices. In addition, the MenSCs, due to their origin, could have a higher level of stemness and better differentiation potential [49]. It has been shown that MenSCs, similar to other types of MSCs, possess MSCs-typical qualities such as high proliferative potential, self-renewal property and a multipotent differentiation into osteogenic, adipogenic and chondrogenic directions [48]. Both, MenSCs and BMMSCs can differentiate not only into a mesenchymal origin direction (osteocytes, chondrocytes, adipocytes, muscle cells) but also into the other tissue-specific cells [50,51]. Finally, the articular regeneration potential of OA cartilage-derived chondrocytes has also been investigated, applying the most popular anti-hypertensive pharmacological medications regulating the intracellular calcium level through the VOOC channels.
Calcium is a ubiquitous intracellular signaling molecule controlling various cellular processes such as cell growth and differentiation, secretion of paracrine factors, gene expression, activation of various signaling pathways regulating proper cell and tissue functioning [52]. Calcium signaling has been studied in various cells in order to understand the molecular mechanisms of many physiological and pathophysiological processes such as cancer, diabetes, neuro, muscle and other disorders [53,54,55,56]. The functional effects of iCa2+ have been mostly investigated on excitable cells such as neurons and cardiomyocytes [57,58,59,60], while in non-excitable cells such as various types of mesenchymal stem/stromal cells or chondrocytes, the iCa2+ signaling modulates cell viability, proliferation and differentiation potentials [61]. Recently, the role of iCa2+ and its targeted regulation has been intensively studied in chondrogenesis and OA pathogenesis [32,34]. Since the big part of the antihypertensive drugs are calcium channel blockers, they could also affect chondrocytes and the development of OA, especially in elderly patients, suffering from the hypertension and thus regularly taking antihypertensive medications [38].
At the cellular level, the iCa2+ can regulate not only the cell proliferation and differentiation but also apoptosis, autophagy, cancer, migration and other intracellular processes [62,63]. It was shown that an extracellular Ca2+ concentration is much higher compared to the iCa2+, which should be strictly controlled by the network of calcium pumps, transporters, channels and calcium sequestering depo proteins acting differently in different cells [63]. The cell proliferation was shown to be an active cell cycle-related process requiring a certain level of iCa2+ and the activation of calcium channels particularly L-type [64]. On the other hand, the iCa2+ overload was shown to induce cell apoptosis through the opening of the permeability transition pore and release of apoptogenic factors [65]. The iCa2+ level can be also artificially changed by the ionophores such as ionomycin, which helps to release the Ca2+ from the intracellular stores to the cell cytoplasm [66,67]. The usage of ionophores to investigate iCa2+ changes with or without L-type channel modulators, could be a good model to investigate calcium-related mechanisms regulating MSCs functioning in vitro.
The results of this study demonstrate that OA chondrocytes cultured under the regular conditions have a slightly higher level of iCa2+, as compared to the MenSCs and BMMSCs, while the largest iCa2+ store, as well as more intensive iCa2+ oscillations were observed in MenSCs. The larger iCa2+ stores can also be related to the better MenSCs proliferation and a total differentiation potential [68]. The VOOC antagonist nifedipine or agonist BayK8644 did not affect either the total iCa2+ levels nor the intensity of calcium oscillations in all cell types. However, nifedipine affected an intracellular calcium stores in all cells, particularly in BMMSCs that were disrupted by ionomycin. In addition, the nifedipine suppressed all cells proliferation, with the most pronounced effect on MenSCs. The strongest effect of nifedipine on MenSCs proliferation could be explained by the most intensive growth and/or largest iCa2+ store better controlling cytoplasmic calcium level as compared to the other cells. Other authors also have shown that nifedipine can initiate the release of iCa2+ from ryanodine receptor-mediated endoplasmic reticulum (ER) stores in the neuromuscular junction of neonatal rats [69]. This mechanism might also be explained by the compensatory mechanism of various Ca2+ channels in the cells. A similar increase in iCa2+ after nifedipine exposure was shown in porcine aortic endothelial cells that do not express L-type VOCCs [70]. Findings suggest that nifedipine might have different mechanisms of action in different cell types and might indirectly stimulate iCa2+ levels or release from ER or other stores.
Beside the investigation of nifedipine’s effect on iCa2+ levels, stores and proliferation, the regulation of the VOOC sub-channel CaV1.2 and its participation in chondrogenic differentiation is no less important and interesting. The advantage of calcium, as a signaling molecule, over other ions is mainly based on its chemical properties and abundant amount, which requires a strong intracellular control by Ca2+-binding proteins, pores and various channels such as L-type, Na/Ca ATPases and others [32,71]. The main L-type channel subunit CaV1.2 plays an important role in activating chondrogenesis in limb development in mouse and chicken embryos and regulating the expression of its downstream genes [72]. It was shown that the inhibition, or even deletion of CaV1.2, downregulated the expression of chondrogenic differentiation-related genes such as SOX9, COL2A1 and aggrecan [72,73]. It has been also demonstrated that the level of CaV1.2 was significantly elevated in the rat dental pulp MSCs during chondrogenic differentiation and its C-terminal domain was essential for this process [74].
In our study, the expression of CaV1.2 at protein and gene levels was higher in chondrocytes compared to the other cells and was not changed after the incubation with nifedipine or BayK8644 for 3 days in all three cell types. We assume the cells restore sufficient/excessive iCa2+ level by regulating other calcium channels, rather than changing VOCC CaV1.2 expression. The expression of CaV1.2 in OA chondrocytes correlates with their higher level of iCa2+ compared to the other cells.
However, under the chondrogenic differentiation, the expression of the CaV1.2 gene was higher in the MenSCs than in BMMSCs and OA chondrocytes and inversely correlated with the chondrogenic markers such as transcription factor SOX9 and structural protein COL2A1 in all cells. Moreover, the different effect of nifedipine on the chondrogenic gene expression in three cell types was observed, i.e., the nifedipine considerably stimulated SOX9 and COL2A1 expression in MenSCs with and without TGF-β3, while in BMMSCs and OA chondrocytes it did not. This might be associated with the higher activity, not a level, of CaV1.2 and iCa2+ stores in MenSCs than other cells, which was not sufficiently suppressed during the chondrogenesis, thus negatively affecting cell capacity to produce cartilage-related proteins. Data further support the hypothesis that in different cells, the iCa2+ is differently regulated, affecting chondrogenic differentiation. Data also suggest that chondrogenic differentiation does not require a high iCa2+ level or CaV1.2 activity. The targeted regulation of the iCa2+-related mechanism in various cell types could regulate their chondrogenic differentiation potential.

4. Materials and Methods

4.1. The Cell Isolation and Culture

MenSCs, BMMSCs and chondrocytes were isolated and cultured as previously described [34,68]. Briefly, menstrual blood samples were collected from the 25–30 years old female donors (n = 5) using sterile silicone cups (iCare, China) during the second day of menstruation and MenSCs were isolated using gradient centrifugation. Bone marrow and human articular cartilage samples were collected after surgical procedures in Santaros hospital (Vilnius, Lithuania). BMMSCs were extracted from the 28–32 years old female bone marrow (n = 5) using a sterile scalpel, centrifuged and filtered into a sterile tube, while chondrocytes were isolated from the 40–82 years old female cartilage (n = 5) using enzymatic digestion by pronase (Roche diagnostics, Basel, Switzerland), followed by type II collagenase (Biochrom AG, Berlin, Germany). All cell types were seeded into cell culture flasks.
All procedures with the donor tissues were performed in accordance with the Bioethical Permission (No. 158200-14-741) and its supplemented version (Permission No. 158200-741-PP2-34) approved by the Vilnius Regional Biomedical Research Ethics Committee.
MenSCs, BMMSCs and chondrocytes were cultivated under the same conditions: in DMEM (1 g/L glucose), supplemented with 10% fetal bovine serum (FBS) (Merck, Rahway, NJ, USA) and 1% penicillin 10,000 units/mL—streptomycin 10,000 μg/mL (PS) (Sigma Aldrich, St. Louis, MO, USA) (named as complete growth medium), 37 °C incubator with 5% CO2. For the cell expansion prior to the experiments, 1 ng/mL of fibroblast growth factor-2 (FGF2) (Thermo Fischer Scientific, Waltham, MA, USA) was added to the MenSCs and BMMSCs medium to maintain their stem cells potential and to avoid spontaneous differentiation. Medium for all three types of the cells was changed twice a week.
MenSCs and BMMSCs were characterized according to typical MSC surface marker expression (CD44, CD73, CD90, CD105, CD14, CD34, CD36, CD45) and ability to differentiate into adipogenic and osteogenic lineages in our previous publication [68].

4.2. Measurement of Intracellular Calcium (iCa2+) by Fluorescent Microscope and Flow Cytometry

For the iCa2+ with the fluorescent microscope, the cells were seeded into 24-well plates at a density of 10,000 cells/well. After the cells reached confluence, they were treated with 1 μL/mL of DMSO (Control) (Sigma Aldrich, St. Louis, MO, USA), 10 μM of nifedipine (Sigma Aldrich, St. Louis, MO, USA) and 10 μM of BayK8644 (Sigma Aldrich, St. Louis, MO, USA) in complete growth medium for 3 days. Nifedipine and BayK8644 were dissolved in DMSO. Then the cells were stained with calcium specific fluorescent dye Cal-520 (1 μM) (Santa Cruz, Biotechnologies, Dallas, TX, USA) in Hanks’ buffered saline solution (HBSS) with probenecid (1 mM) (Sigma Aldrich, St. Louis, MO, USA) and Pluronic® F-127 (0.02%) (Sigma Aldrich, St. Louis, MO, USA) and incubated at +37 °C with 5% CO2 for 90 min. After this, the cells were washed twice with PBS and HBSS with 1 mM probenecid (Sigma Aldrich, St. Louis, MO, USA) was added, and cells were analyzed with a fluorescent microscope (EVOS M7000). The intracellular calcium oscillations were recorded, and the record speed was increased by 8-fold (8 frames/s) for the better observation of calcium level changes in individual cells (Supplementary Videos S1–S3).
For the iCa2+ analysis with flow cytometry, the cells were seeded into 6-well plates at a density of 50,000 cells/well. After the cells reached confluence, they were treated with 10 μM of nifedipine (Sigma Aldrich, St. Louis, MO, USA) and 10 μM of BayK8644 (Sigma Aldrich, St. Louis, MO, USA) in complete growth medium for 3 days. Then the cells were detached with trypsin and 50,000 of the cells of each group (incubated with nifedipine and BayK8644, and not incubated (control)) were transferred into flow cytometry tubes, centrifuged at 600× g for 5 min and stained with calcium specific fluorescent dye Cal-520 (1 μM) (Santa Cruz, Biotechnologies, Dallas, TX, USA) in DMEM medium with 10% of FBS at +37 °C with 5% CO2 for 30 min. After incubation, cells were washed with PBS and centrifuged at 600× g for 5 min. The supernatant was discarded, and cells were resuspended in 300 μL of PBS with 1% of BSA. Each sample was run in triplicates; fluorescence was measured using flow cytometer (FACSAria III, Becton Dickinson), 488 nm laser paired with a 530/30 nm bandpass filter.
In order to measure the store-related iCa2+ changes, the cells were treated with nifedipine and BayK8644 for 24 h, divided into flow cytometer tubes, stained with the Cal520 dye, as previously described, and the basic iCa2+ level was measured with a Calibur cytometer. This flow cytometer allows for the measurement of instant iCa2+ changes. After 90 s of measurement, the 1 μM of ionomycin, iCa2+ releasing ionophore, was added (Santa Cruz Biotechnology, Dallas, TX, USA) and the iCa2+ change was recorded for ~200 s. The data were analyzed using FlowJo software, version 10 (FlowJo Corp., Ashland, OR, USA). The median fluorescence intensity (MFI) of all samples was calculated by subtracting the MFI of non-stained cells from the MFI of Cal-520 stained cells. Before the addition of ionomycin, measured MFI of the cells was held as basal iCa2+ and after 90 s of adding ionomycin—as a high level of iCa2+.

4.3. Detection of CaV1.2 by Immunocytochemistry

For the CaV1.2 measurements by immunocytochemistry, the cells were seeded on glass cover slips and grown in Petri dishes with complete medium, at a density of 10,000 cells/cover slip. After several days of cultivation, cells were transferred to a new Petri dish, washed 3 times with PBS (Biochrom, Holliston, MA, USA) and fixed with 4% paraformaldehyde (PFA) (Sigma Aldrich, St. Louis, MO, USA) at RT for 20 min. After fixation, the glass slips with the cells were washed twice with PBS and permeabilized with 0.1% Triton X-100 at RT for 20 min. Cells were washed twice with PBS and blocked with 1% bovine serum albumin (BSA) in PBS at +37 °C for 30 min. Antibody against the CaV1.2 subunit (ab84814, Abcam, Cambridge, UK) was prepared in 1% BSA/PBS (1:100) and incubated in 37 °C incubator with 5% CO2 for 1 h. Secondary anti-mouse Ig-G1-Alexa488 fluorescent antibody (a21200, Thermo Fischer Scientific, Waltham, MA, USA) was added (1:500) and incubated at 37 °C for 30 min. After that, the cells were washed three times with 1% BSA/PBS solution, stained with 1 µM DAPI (4′,6-diamidino-2-phenylindole) dye for 30–60 s (Vector laboratories, Burlingame, CA, USA), washed with water, put on the objective glass and analyzed with fluorescent microscope (EVOS M7000).

4.4. Analysis of CaV1.2 by Flow Cytometer

For the CaV1.2 analysis by flow cytometer, the cells were stained with monoclonal antibody against CaV1.2 (ab84814, Abcam, Cambridge, UK): the cells were enzymatically detached and 50,000 of the cells per one sample were fixed with 4% paraformaldehyde (PFA) for 20 min at RT. After this, cells were washed with PBS and centrifuged at 500× g for 5 min. Later on, the cells were permeabilized with 0.1% Triton X-100 at RT for 20 min. and washed once with 1% BSA in PBS, centrifuged and the supernatant was discarded, the cells were blocked with 1% of BSA in PBS solution at RT for 30 min. After this, primary antibody (1:1000) was added and incubated at RT for 1 h. Cells were washed twice with 1% BSA in PBS solution and incubated with fluorescent secondary anti-mouse IgG-PE antibody (P852, Thermo Fisher Scientific, Waltham, MA, USA) and incubated at RT for 30 min. After incubation, the cells were washed twice with and measured in 200 μL of PBS solution containing 1% of BSA. At least 10,000 events were collected by the flow cytometer FACSAriaIII and analyzed using FlowJo analysis software, version 10.

4.5. Proliferation Assay

The cells were seeded into 12-well plates at a density of 20,000 cells/well in a complete medium. The next day, cells were divided into 3 treatment groups: control (with dimethyl sulfoxide (DMSO), which is a solvent for nifedipine and BayK8644, and the same amount as nifedipine and BayK8644 was added), nifedipine (10 μM) and BayK8644 (10 μM). Cell proliferation was determined at days 1, 3, 5, 8 and 12 with a cell counting kit—8 (CCK-8) (Dojindo, Munich, 152 Germany) according to the manufacturer’s instructions. The commercial CCK-8 kit allows for the measurement of cell proliferation by utilizing highly water-soluble tetrazolium salt. This salt is being reduced by living cell dehydrogenases and produces soluble orange formazan dye. This way, the amount of the formazan dye generated by dehydrogenases in cells is directly proportional to the number of living cells. The medium was collected in a 96 well plate and absorbance at 450 nm was quantified with a SpectraMax i3 spectrophotometer (Molecular Devices, San Jose, CA, USA).

4.6. Chondrogenic Differentiation

The cells were detached, counted and transferred into conical 15 mL tubes (250,000 cells/tube). After that, the cells were washed with DMEM medium without FBS, centrifuged at 600× g for 5 min and supernatant was changed to the chondrogenic medium (high glucose (4.5 g/L) DMEM medium) and incubated for 24 h. During this period, the cells formed 3D cell pellets. The next day, chondrogenic medium (high glucose (4.5 g/L) DMEM medium, 1% PS (Merck, Rahway, NJ, USA), 1% insulin-transferrin-selenium (ITS) (Gibco Life Technologies, Grand Island, NY, USA), 0.35 mM L-proline (Carl Roth, Karlsruhe, Germany), 10−7 M dexamethasone, 0.17 mM ascorbic acid phosphate (Sigma Aldrich, St. Louis, MO, USA) with or without 10 ng/mL of TGF-β3 (Thermo Fisher Scientific, Waltham, MA, USA) was added. The chondrogenic differentiation of each sample was evaluated comparing samples with and without growth factor TGF-β3. The chondrogenic medium was changed three times a week.
The effect of nifedipine and BayK8644 on chondrogenesis of MenSCs, BMMSCs and chondrocytes was investigated as follows: 1 μL/mL of DMSO (Control), 10 μM of nifedipine and 10 μM of BayK8644 were added to the cells in complete chondrogenic media and incubated for 21 days, changing chondrogenic medium as usual. After chondrogenic differentiation, the cell pellets were analyzed by RT-qPCR.

4.7. Gene Expression Analysis

Cell pellets were washed twice with PBS and homogenized with a syringe in RLT lysis buffer with 10% mercaptoethanol (from Qiagen RNeasy Mini Kit kit, Venlo, Netherlands) according to the manufacturer’s recommendations. The RNA was subsequently purified with RNeasy Mini Spin columns (Qiagen kit, Venlo, Netherlands). RNA concentration and purity was measured with the spectrophotometer (Spectramax i3).
RNA samples were treated with dsDNase and cDNA synthesis was performed with the Maxima®First Strand cDNA Synthesis Kit (Thermofisher Scientific, Waltham, MA, USA) according to the manufacturer protocol. RT-qPCR was performed using Maxima Probe qPCR Master Mix (2X) with the Agilent Aria MX instrument. The TaqMan gene expression assays were used for gene expression analysis. The RT-qPCR reaction volume contained 25 μL of reaction buffer with 1 μL of 20X TaqMan gene expression assay mix. All reactions were run in triplicates. Cycle conditions were as follows: initial denaturation step at 95 °C for 10 min, followed by 40 cycles of denaturation at 95 °C for 15 s and finally annealing and extension at 60 °C for 60 s. Each RNA sample was controlled for genomic DNA contamination by the reactions without reverse transcriptase, and the reagent contamination was checked by the reactions without template (NTC). For the normalization of gene expression, the geometric mean of two reference genes—RPS9 and B2M was used.
RT-qPCR reaction mixes were prepared with Maxima Probe qPCR Master Mix (Thermo Fischer Scientific, Waltham, MA, USA) and TaqMan Gene expression Assays (RPS9—Hs02339424_g1, B2M—Hs00984230_m1, ACTB—Hs01060665_g1, SOX9—Hs00165814_m1, COL2A1—Hs01060345_m1, CACNA1C—Hs00167681_m1 (Thermo Fischer Scientific, Waltham, MA, USA).

4.8. Statistical Analysis

The statistical difference between groups was evaluated using two-way analysis of variance (ANOVA), and Student’s t-test was used to calculate statistical significance. Data were considered to be statistically significant at p ≤ 0.05. GraphPad Prism 8.4.0 software was used to perform statistical analysis. Not less than three patients’ cells and three repeats were measured.

5. Conclusions

Taken together, the adult human tissues-derived MSCs of different origins may not be equally applied for the cartilage regeneration purposes, as they possess different chondrogenic differentiation potential. Data show the BM-MSCs having a higher chondrogenic differentiation potential than MenSCs or OA chondrocytes. Molecular pathways regulating the iCa2+ signaling through the VOCC subunit CaV1.2 can affect the proliferation and differentiation of MSCs and OA chondrocytes, including chondrogenic response. Therefore, the stem cell therapies and antihypertensive drugs, such as CaV1.2 inhibitor nifedipine, should be prescribed with cautiousness to the patients with hypertension and/or joint diseases.

Supplementary Materials

The supporting information can be downloaded at: https://www.mdpi.com/article/10.3390/ijms24076730/s1.

Author Contributions

Writing—original draft preparation and study design—I.U., D.B. and E.B. (Eiva Bernotiene); cell isolation, iCa2+ measurement with flow cytometry (Calibur), chondrogenesis—I.U. and R.V.; CaV1.2 protein expression, flow cytometry, immunocytochemistry, iCa2+ measurement with flow cytometry (FACSAriaIII)—D.B. and R.M.; gene expression study—E.B. (Edvardas Bagdonas); conceptualization of the manuscript—all authors; critical revision—E.B. (Eiva Bernotiene) and A.M. All authors have read and agreed to the published version of the manuscript.

Funding

This work was funded by European Structural and Social Funds (ES Struktūrinės Paramos) through the Research Council of Lithuania (Lietuvos Mokslo Taryba) according to the activity Attracting Foreign Researchers for Research Implementation (2018–2022), Grant No 01.2.2-LMT-K-718-02-0022.

Institutional Review Board Statement

All procedures with the donor tissues were performed in accordance with the Bioethical Permission (No. 158200-14-741) and its supplemented version (Permission No. 158200-741-PP2-34) approved by the Vilnius Regional Biomedical Research Ethics Committee.

Informed Consent Statement

Informed consent was obtained from all patients involved in the study.

Data Availability Statement

The data supporting these findings can be found at the State Research Institute Centre for Innovative Medicine, Department of Regenerative Medicine.

Acknowledgments

The authors acknowledge financial support from the European Structural and Social Funds (ES Struktūrinės Paramos) through the Research Council of Lithuania (Lietuvos Mokslo Taryba) according to the activity ‘Improvement of researchers’ qualification by implementing world-class R&D projects’ of Measure No. 09.3.3-LMT-K-712 (grant application code: 09.3.3-LMT-K-712-01-0157, agreement No. DOTSUT-215). Additionally, the authors thank dr. Irute Girkontaite for helping with the evaluation of iCa2+ with the BD FACS Calibur flow cytometer. Also, the first author (I.U.) would like to thank WORLD ASSOCIATION OF SCIENTISTS for granting scholarship for the project, titled “Paracrine Effects of Human Menstrual Blood-Derived Mesenchymal Stem Cells for Cartilage Tissue Regeneration” in 2022, as one of the 15 Planetary Emergencies: Medicine and Biotechnology.

Conflicts of Interest

The authors do not declare any conflicts of interest.

Abbreviations

BMMSCsbone marrow mesenchymal stem cells
BSAbovine serum albumin
Ca2+calcium ions
COL2A1collagen type II gene
DAPI4′,6-diamidino-2-phenylindole
ERendoplasmic reticulum
FBSfetal bovine serum
FGF2fibroblast growth factor-2
iCa2+intracellular Ca2+;
MenSCsmenstrual blood-derived mesenchymal stem cells
MFImedian fluorescence intensity
MSCsmesenchymal stem cells
NSAIDsnon-steroidal anti-inflammatory drugs
OAosteoarthritis
PFAparaformaldehyde
TGF-β3transforming growth factor β3
VOCCvoltage-operated calcium channels

References

  1. Mobasheri, A.; Batt, M. An update on the pathophysiology of osteoarthritis. Ann. Phys. Rehabil. Med. 2016, 59, 333–339. [Google Scholar] [CrossRef]
  2. Mobasheri, A.; van Spil, W.E.; Budd, E.; Uzieliene, I.; Bernotiene, E.; Bay-Jensen, A.C.; Larkin, J.; Levesque, M.C.; Gualillo, O.; Henrotin, Y. Molecular taxonomy of osteoarthritis for patient stratification, disease management and drug development: Biochemical markers associated with emerging clinical phenotypes and molecular endotypes. Curr. Opin. Rheumatol. 2019, 31, 80–89. [Google Scholar] [CrossRef]
  3. Neogi, T. The epidemiology and impact of pain in osteoarthritis. Osteoarthr. Cartil. 2013, 21, 1145–1153. [Google Scholar] [CrossRef] [PubMed] [Green Version]
  4. Mobasheri, A.; Rayman, M.P.; Gualillo, O.; Sellam, J.; van der Kraan, P.; Fearon, U. The role of metabolism in the pathogenesis of osteoarthritis. Nat. Rev. Rheumatol. 2017, 13, 302–311. [Google Scholar] [CrossRef] [PubMed]
  5. Davies, P.S.; Graham, S.M.; MacFarlane, R.J.; Leonidou, A.; Mantalaris, A.; Tsiridis, E. Disease-modifying osteoarthritis drugs: In vitro and in vivo data on the development of DMOADs under investigation. Expert Opin. Investig. Drugs 2013, 22, 423–441. [Google Scholar] [CrossRef]
  6. Karsdal, M.A.; Michaelis, M.; Ladel, C.; Siebuhr, A.S.; Bihlet, A.R.; Andersen, J.R.; Guehring, H.; Christiansen, C.; Bay-Jensen, A.C.; Kraus, V.B. Disease-modifying treatments for osteoarthritis (DMOADs) of the knee and hip: Lessons learned from failures and opportunities for the future. Osteoarthr. Cartil. 2016, 24, 2013–2021. [Google Scholar] [CrossRef]
  7. Ghouri, A.; Conaghan, P.G. Update on novel pharmacological therapies for osteoarthritis. Ther. Adv. Musculoskelet Dis. 2019, 11, 1759720x19864492. [Google Scholar] [CrossRef] [Green Version]
  8. Mancuso, P.; Raman, S.; Glynn, A.; Barry, F.; Murphy, J.M. Mesenchymal Stem Cell Therapy for Osteoarthritis: The Critical Role of the Cell Secretome. Front. Bioeng. Biotechnol. 2019, 7, 9. [Google Scholar] [CrossRef] [Green Version]
  9. Iijima, H.; Isho, T.; Kuroki, H.; Takahashi, M.; Aoyama, T. Effectiveness of mesenchymal stem cells for treating patients with knee osteoarthritis: A meta-analysis toward the establishment of effective regenerative rehabilitation. NPJ Regen. Med. 2018, 3, 15. [Google Scholar] [CrossRef] [PubMed] [Green Version]
  10. Diekman, B.O.; Guilak, F. Stem cell-based therapies for osteoarthritis: Challenges and opportunities. Curr. Opin. Rheumatol. 2013, 25, 119–126. [Google Scholar] [CrossRef]
  11. Harrell, C.R.; Markovic, B.S.; Fellabaum, C.; Arsenijevic, A.; Volarevic, V. Mesenchymal stem cell-based therapy of osteoarthritis: Current knowledge and future perspectives. Biomed. Pharmacother. 2019, 109, 2318–2326. [Google Scholar] [CrossRef] [PubMed]
  12. Murphy, C.; Mobasheri, A.; Táncos, Z.; Kobolák, J.; Dinnyés, A. The Potency of Induced Pluripotent Stem Cells in Cartilage Regeneration and Osteoarthritis Treatment. Adv. Exp. Med. Biol. 2018, 1079, 55–68. [Google Scholar] [CrossRef] [PubMed]
  13. Cheli, V.T.; Santiago González, D.A.; Namgyal Lama, T.; Spreuer, V.; Handley, V.; Murphy, G.G.; Paez, P.M. Conditional Deletion of the L-Type Calcium Channel Cav1.2 in Oligodendrocyte Progenitor Cells Affects Postnatal Myelination in Mice. J. Neurosci. 2016, 36, 10853–10869. [Google Scholar] [CrossRef] [Green Version]
  14. Caplan, A.I. Mesenchymal Stem Cells: Time to Change the Name! Stem Cells Transl. Med. 2017, 6, 1445–1451. [Google Scholar] [CrossRef] [Green Version]
  15. Craft, A.M.; Ahmed, N.; Rockel, J.S.; Baht, G.S.; Alman, B.A.; Kandel, R.A.; Grigoriadis, A.E.; Keller, G.M. Specification of chondrocytes and cartilage tissues from embryonic stem cells. Development 2013, 140, 2597–2610. [Google Scholar] [CrossRef] [PubMed] [Green Version]
  16. Ou, L.; Wang, X.; Zou, F. Is iPS cell the panacea? IUBMB Life 2010, 62, 170–175. [Google Scholar] [CrossRef]
  17. Wang, M.; Yuan, Z.; Ma, N.; Hao, C.; Guo, W.; Zou, G.; Zhang, Y.; Chen, M.; Gao, S.; Peng, J.; et al. Advances and Prospects in Stem Cells for Cartilage Regeneration. Stem Cells Int. 2017, 2017, 4130607. [Google Scholar] [CrossRef] [Green Version]
  18. Ansboro, S.; Greiser, U.; Barry, F.; Murphy, M. Strategies for improved targeting of therapeutic cells: Implications for tissue repair. Eur. Cell Mater. 2012, 23, 310–318. [Google Scholar] [CrossRef]
  19. Somoza, R.A.; Welter, J.F.; Correa, D.; Caplan, A.I. Chondrogenic differentiation of mesenchymal stem cells: Challenges and unfulfilled expectations. Tissue Eng. Part B Rev. 2014, 20, 596–608. [Google Scholar] [CrossRef] [Green Version]
  20. Murata, D.; Fujimoto, R.; Nakayama, K. Osteochondral Regeneration Using Adipose Tissue-Derived Mesenchymal Stem Cells. Int. J. Mol. Sci. 2020, 21, 3589. [Google Scholar] [CrossRef]
  21. Fernandez-Pernas, P.; Rodríguez-Lesende, I.; de la Fuente, A.; Mateos, J.; Fuentes, I.; De Toro, J.; Blanco, F.J.; Arufe, M.C. CD105+-mesenchymal stem cells migrate into osteoarthritis joint: An animal model. PLoS ONE 2017, 12, e0188072. [Google Scholar] [CrossRef] [PubMed] [Green Version]
  22. Nejadnik, H.; Hui, J.H.; Feng Choong, E.P.; Tai, B.C.; Lee, E.H. Autologous bone marrow-derived mesenchymal stem cells versus autologous chondrocyte implantation: An observational cohort study. Am. J. Sports Med. 2010, 38, 1110–1116. [Google Scholar] [CrossRef]
  23. Spakova, T.; Plsikova, J.; Harvanova, D.; Lacko, M.; Stolfa, S.; Rosocha, J. Influence of Kartogenin on Chondrogenic Differentiation of Human Bone Marrow-Derived MSCs in 2D Culture and in Co-Cultivation with OA Osteochondral Explant. Molecules 2018, 23, 181. [Google Scholar] [CrossRef] [PubMed] [Green Version]
  24. Brittberg, M.; Lindahl, A.; Nilsson, A.; Ohlsson, C.; Isaksson, O.; Peterson, L. Treatment of deep cartilage defects in the knee with autologous chondrocyte transplantation. N. Engl. J. Med. 1994, 331, 889–895. [Google Scholar] [CrossRef]
  25. Mrugala, D.; Bony, C.; Neves, N.; Caillot, L.; Fabre, S.; Moukoko, D.; Jorgensen, C.; Noël, D. Phenotypic and functional characterisation of ovine mesenchymal stem cells: Application to a cartilage defect model. Ann. Rheum. Dis. 2008, 67, 288–295. [Google Scholar] [CrossRef] [PubMed]
  26. Matas, J.; Orrego, M.; Amenabar, D.; Infante, C.; Tapia-Limonchi, R.; Cadiz, M.I.; Alcayaga-Miranda, F.; González, P.L.; Muse, E.; Khoury, M.; et al. Umbilical Cord-Derived Mesenchymal Stromal Cells (MSCs) for Knee Osteoarthritis: Repeated MSC Dosing Is Superior to a Single MSC Dose and to Hyaluronic Acid in a Controlled Randomized Phase I/II Trial. Stem Cells Transl. Med. 2019, 8, 215–224. [Google Scholar] [CrossRef] [Green Version]
  27. Rossignoli, F.; Caselli, A.; Grisendi, G.; Piccinno, S.; Burns, J.S.; Murgia, A.; Veronesi, E.; Loschi, P.; Masini, C.; Conte, P.; et al. Isolation, Characterization, and Transduction of Endometrial Decidual Tissue Multipotent Mesenchymal Stromal/Stem Cells from Menstrual Blood. BioMed Res. Int. 2013, 2013, 901821. [Google Scholar] [CrossRef] [Green Version]
  28. Fodor, J.; Matta, C.; Juhász, T.; Oláh, T.; Gönczi, M.; Szíjgyártó, Z.; Gergely, P.; Csernoch, L.; Zákány, R. Ionotropic purinergic receptor P2X4 is involved in the regulation of chondrogenesis in chicken micromass cell cultures. Cell Calcium 2009, 45, 421–430. [Google Scholar] [CrossRef] [Green Version]
  29. Matta, C.; Zakany, R. Calcium signalling in chondrogenesis: Implications for cartilage repair. Front. Biosci.-Sch. 2013, 5, 305–324. [Google Scholar] [CrossRef] [PubMed] [Green Version]
  30. Matta, C.; Mobasheri, A. Regulation of chondrogenesis by protein kinase C: Emerging new roles in calcium signalling. Cell. Signal. 2014, 26, 979–1000. [Google Scholar] [CrossRef] [Green Version]
  31. Uzieliene, I.; Bernotas, P.; Mobasheri, A.; Bernotiene, E. The Role of Physical Stimuli on Calcium Channels in Chondrogenic Differentiation of Mesenchymal Stem Cells. Int. J. Mol. Sci. 2018, 19, 2998. [Google Scholar] [CrossRef] [Green Version]
  32. Mobasheri, A.; Matta, C.; Uzielienè, I.; Budd, E.; Martín-Vasallo, P.; Bernotiene, E. The chondrocyte channelome: A narrative review. Jt. Bone Spine 2019, 86, 29–35. [Google Scholar] [CrossRef] [PubMed]
  33. Morris, C.E. Cytotoxic Swelling of Sick Excitable Cells-Impaired Ion Homeostasis and Membrane Tension Homeostasis in Muscle and Neuron. Curr. Top. Membr. 2018, 81, 457–496. [Google Scholar] [CrossRef]
  34. Uzieliene, I.; Bernotiene, E.; Rakauskiene, G.; Denkovskij, J.; Bagdonas, E.; Mackiewicz, Z.; Porvaneckas, N.; Kvederas, G.; Mobasheri, A. The Antihypertensive Drug Nifedipine Modulates the Metabolism of Chondrocytes and Human Bone Marrow-Derived Mesenchymal Stem Cells. Front. Endocrinol. 2019, 10, 756. [Google Scholar] [CrossRef]
  35. Jadhav, A.; Liang, W.; Papageorgiou, P.C.; Shoker, A.; Kanthan, S.C.; Balsevich, J.; Levy, A.S.; Heximer, S.; Backx, P.H.; Gopalakrishnan, V. Catharanthine dilates small mesenteric arteries and decreases heart rate and cardiac contractility by inhibition of voltage-operated calcium channels on vascular smooth muscle cells and cardiomyocytes. J. Pharmacol. Exp. Ther. 2013, 345, 383–392. [Google Scholar] [CrossRef] [PubMed] [Green Version]
  36. Kawano, S.; Shoji, S.; Ichinose, S.; Yamagata, K.; Tagami, M.; Hiraoka, M. Characterization of Ca(2+) signaling pathways in human mesenchymal stem cells. Cell Calcium 2002, 32, 165–174. [Google Scholar] [CrossRef]
  37. Shao, Y.; Alicknavitch, M.; Farach-Carson, M.C. Expression of voltage sensitive calcium channel (VSCC) L-type Cav1.2 (alpha1C) and T-type Cav3.2 (alpha1H) subunits during mouse bone development. Dev. Dyn. 2005, 234, 54–62. [Google Scholar] [CrossRef] [PubMed]
  38. Vaiciuleviciute, R.; Bironaite, D.; Uzieliene, I.; Mobasheri, A.; Bernotiene, E. Cardiovascular Drugs and Osteoarthritis: Effects of Targeting Ion Channels. Cells 2021, 10, 2572. [Google Scholar] [CrossRef] [PubMed]
  39. Munaron, L.; Antoniotti, S.; Lovisolo, D. Intracellular calcium signals and control of cell proliferation: How many mechanisms? J. Cell Mol. Med. 2004, 8, 161–168. [Google Scholar] [CrossRef]
  40. Xiang, S.; Lin, Z.; Makarcyzk, M.J.; Riewruja, K.; Zhang, Y.; Zhang, X.; Li, Z.; Clark, K.L.; Li, E.; Liu, S.; et al. Differences in the intrinsic chondrogenic potential of human mesenchymal stromal cells and iPSC-derived multipotent cells. Clin. Transl. Med. 2022, 12, e1112. [Google Scholar] [CrossRef]
  41. Uzieliene, I.; Bironaite, D.; Pachaleva, J.; Bagdonas, E.; Sobolev, A.; Tsai, W.-B.; Kvedaras, G.; Bernotiene, E. Chondroitin Sulfate-Tyramine-Based Hydrogels for Cartilage Tissue Repair. Int. J. Mol. Sci. 2023, 24, 3451. [Google Scholar] [CrossRef]
  42. Vonk, L.A.; van Dooremalen, S.F.J.; Liv, N.; Klumperman, J.; Coffer, P.J.; Saris, D.B.F.; Lorenowicz, M.J. Mesenchymal Stromal/stem Cell-derived Extracellular Vesicles Promote Human Cartilage Regeneration In Vitro. Theranostics 2018, 8, 906–920. [Google Scholar] [CrossRef]
  43. Solchaga, L.A.; Penick, K.J.; Welter, J.F. Chondrogenic differentiation of bone marrow-derived mesenchymal stem cells: Tips and tricks. Methods Mol. Biol. 2011, 698, 253–278. [Google Scholar] [CrossRef] [Green Version]
  44. Narcisi, R.; Koevoet, W.; van Osch, G. Expansion and Chondrogenic Differentiation of Human Bone Marrow-Derived Mesenchymal Stromal Cells. Methods Mol. Biol. 2021, 2221, 15–28. [Google Scholar] [CrossRef]
  45. Uzieliene, I.; Bironaite, D.; Bagdonas, E.; Pachaleva, J.; Sobolev, A.; Tsai, W.-B.; Kvederas, G.; Bernotiene, E. The Effects of Mechanical Load on Chondrogenic Responses of Bone Marrow Mesenchymal Stem Cells and Chondrocytes Encapsulated in Chondroitin Sulfate-Based Hydrogel. Int. J. Mol. Sci. 2023, 24, 2915. [Google Scholar] [CrossRef] [PubMed]
  46. Park, M.S.; Kim, Y.H.; Jung, Y.; Kim, S.H.; Park, J.C.; Yoon, D.S.; Kim, S.-H.; Lee, J.W. In Situ Recruitment of Human Bone Marrow-Derived Mesenchymal Stem Cells Using Chemokines for Articular Cartilage Regeneration. Cell Transplant. 2015, 24, 1067–1083. [Google Scholar] [CrossRef]
  47. Doyle, E.C.; Wragg, N.M.; Wilson, S.L. Intraarticular injection of bone marrow-derived mesenchymal stem cells enhances regeneration in knee osteoarthritis. Knee Surg. Sport. Traumatol. Arthrosc. 2020, 28, 3827–3842. [Google Scholar] [CrossRef] [Green Version]
  48. Meng, X.; Ichim, T.E.; Zhong, J.; Rogers, A.; Yin, Z.; Jackson, J.; Wang, H.; Ge, W.; Bogin, V.; Chan, K.W.; et al. Endometrial regenerative cells: A novel stem cell population. J. Transl. Med. 2007, 5, 57. [Google Scholar] [CrossRef] [PubMed] [Green Version]
  49. Cordeiro, M.R.; Carvalhos, C.A.; Figueiredo-Dias, M. The Emerging Role of Menstrual-Blood-Derived Stem Cells in Endometriosis. Biomedicines 2023, 11, 39. [Google Scholar] [CrossRef]
  50. Pittenger, M.F.; Mackay, A.M.; Beck, S.C.; Jaiswal, R.K.; Douglas, R.; Mosca, J.D.; Moorman, M.A.; Simonetti, D.W.; Craig, S.; Marshak, D.R. Multilineage potential of adult human mesenchymal stem cells. Science 1999, 284, 143–147. [Google Scholar] [CrossRef] [PubMed] [Green Version]
  51. Stock, P.; Brückner, S.; Winkler, S.; Dollinger, M.M.; Christ, B. Human bone marrow mesenchymal stem cell-derived hepatocytes improve the mouse liver after acute acetaminophen intoxication by preventing progress of injury. Int. J. Mol. Sci. 2014, 15, 7004–7028. [Google Scholar] [CrossRef] [Green Version]
  52. Islam, M.S. Calcium Signaling: From Basic to Bedside. Adv. Exp. Med. Biol. 2020, 1131, 1–6. [Google Scholar] [CrossRef]
  53. Cui, C.; Merritt, R.; Fu, L.; Pan, Z. Targeting calcium signaling in cancer therapy. Acta Pharm. Sin. B 2017, 7, 3–17. [Google Scholar] [CrossRef]
  54. Klec, C.; Ziomek, G.; Pichler, M.; Malli, R.; Graier, W.F. Calcium Signaling in ß-cell Physiology and Pathology: A Revisit. Int. J. Mol. Sci. 2019, 20, 6110. [Google Scholar] [CrossRef] [Green Version]
  55. Glaser, T.; Arnaud Sampaio, V.F.; Lameu, C.; Ulrich, H. Calcium signalling: A common target in neurological disorders and neurogenesis. Semin. Cell Dev. Biol. 2019, 95, 25–33. [Google Scholar] [CrossRef] [PubMed]
  56. Agrawal, A.; Suryakumar, G.; Rathor, R. Role of defective Ca(2+) signaling in skeletal muscle weakness: Pharmacological implications. J. Cell Commun. Signal. 2018, 12, 645–659. [Google Scholar] [CrossRef] [PubMed]
  57. Guo, Q.; Sopher, B.L.; Furukawa, K.; Pham, D.G.; Robinson, N.; Martin, G.M.; Mattson, M.P. Alzheimer’s presenilin mutation sensitizes neural cells to apoptosis induced by trophic factor withdrawal and amyloid beta-peptide: Involvement of calcium and oxyradicals. J. Neurosci. 1997, 17, 4212–4222. [Google Scholar] [CrossRef] [PubMed] [Green Version]
  58. Carey, M.B.; Matsumoto, S.G. Spontaneous calcium transients are required for neuronal differentiation of murine neural crest. Dev. Biol. 1999, 215, 298–313. [Google Scholar] [CrossRef] [PubMed] [Green Version]
  59. Kuo, I.Y.; Ehrlich, B.E. Signaling in muscle contraction. Cold Spring Harb. Perspect. Biol. 2015, 7, a006023. [Google Scholar] [CrossRef]
  60. Winslow, R.L.; Walker, M.A.; Greenstein, J.L. Modeling calcium regulation of contraction, energetics, signaling, and transcription in the cardiac myocyte. Wiley Interdiscip. Rev. Syst. Biol. Med. 2016, 8, 37–67. [Google Scholar] [CrossRef]
  61. Buonanno, A.; Fields, R.D. Gene regulation by patterned electrical activity during neural and skeletal muscle development. Curr. Opin. Neurobiol. 1999, 9, 110–120. [Google Scholar] [CrossRef]
  62. Pchelintseva, E.; Djamgoz, M.B.A. Mesenchymal stem cell differentiation: Control by calcium-activated potassium channels. J. Cell. Physiol. 2018, 233, 3755–3768. [Google Scholar] [CrossRef] [PubMed]
  63. Patergnani, S.; Danese, A.; Bouhamida, E.; Aguiari, G.; Previati, M.; Pinton, P.; Giorgi, C. Various Aspects of Calcium Signaling in the Regulation of Apoptosis, Autophagy, Cell Proliferation, and Cancer. Int. J. Mol. Sci. 2020, 21, 8323. [Google Scholar] [CrossRef] [PubMed]
  64. Patel, R.; Holt, M.; Philipova, R.; Moss, S.; Schulman, H.; Hidaka, H.; Whitaker, M. Calcium/calmodulin-dependent phosphorylation and activation of human Cdc25-C at the G2/M phase transition in HeLa cells. J. Biol. Chem. 1999, 274, 7958–7968. [Google Scholar] [CrossRef] [PubMed] [Green Version]
  65. Bonora, M.; Patergnani, S.; Ramaccini, D.; Morciano, G.; Pedriali, G.; Kahsay, A.E.; Bouhamida, E.; Giorgi, C.; Wieckowski, M.R.; Pinton, P. Physiopathology of the Permeability Transition Pore: Molecular Mechanisms in Human Pathology. Biomolecules 2020, 10, 998. [Google Scholar] [CrossRef] [PubMed]
  66. Morgan, A.J.; Jacob, R. Ionomycin enhances Ca2+ influx by stimulating store-regulated cation entry and not by a direct action at the plasma membrane. Biochem. J. 1994, 300 Pt 3, 665–672. [Google Scholar] [CrossRef] [Green Version]
  67. Yoshida, S.; Plant, S. Mechanism of release of Ca2+ from intracellular stores in response to ionomycin in oocytes of the frog Xenopus laevis. J. Physiol. 1992, 458, 307–318. [Google Scholar] [CrossRef]
  68. Uzieliene, I.; Bagdonas, E.; Hoshi, K.; Sakamoto, T.; Hikita, A.; Tachtamisevaite, Z.; Rakauskiene, G.; Kvederas, G.; Mobasheri, A.; Bernotiene, E. Different phenotypes and chondrogenic responses of human menstrual blood and bone marrow mesenchymal stem cells to activin A and TGF-β3. Stem Cell Res. Ther. 2021, 12, 251. [Google Scholar] [CrossRef]
  69. Piriz, J.; Rosato Siri, M.D.; Pagani, R.; Uchitel, O.D. Nifedipine-mediated mobilization of intracellular calcium stores increases spontaneous neurotransmitter release at neonatal rat motor nerve terminals. J. Pharmacol. Exp. Ther. 2003, 306, 658–663. [Google Scholar] [CrossRef] [Green Version]
  70. Berkels, R.; Mueller, A.; Roesen, R.; Klaus, W. Nifedipine and Bay K 8644 Induce an increase of. J. Cardiovasc. Pharmacol. Ther. 1999, 4, 175–181. [Google Scholar] [CrossRef]
  71. Carafoli, E.; Krebs, J. Why Calcium? How Calcium Became the Best Communicator. J. Biol. Chem. 2016, 291, 20849–20857. [Google Scholar] [CrossRef] [Green Version]
  72. Atsuta, Y.; Tomizawa, R.R.; Levin, M.; Tabin, C.J. L-type voltage-gated Ca(2+) channel Ca(V)1.2 regulates chondrogenesis during limb development. Proc. Natl. Acad. Sci. USA 2019, 116, 21592–21601. [Google Scholar] [CrossRef] [PubMed] [Green Version]
  73. Dieterle, M.P.; Husari, A.; Rolauffs, B.; Steinberg, T.; Tomakidi, P. Integrins, cadherins and channels in cartilage mechanotransduction: Perspectives for future regeneration strategies. Expert Rev. Mol. Med. 2021, 23, e14. [Google Scholar] [CrossRef] [PubMed]
  74. Ju, Y.; Ge, J.; Ren, X.; Zhu, X.; Xue, Z.; Feng, Y.; Zhao, S. Cav1.2 of L-type Calcium Channel Is a Key Factor for the Differentiation of Dental Pulp Stem Cells. J. Endod. 2015, 41, 1048–1055. [Google Scholar] [CrossRef] [PubMed]
Figure 1. The effects of nifedipine and BayK8644 on iCa2+ level in MenSCs (A), BMMSCs (B) and chondrocytes (C) cultivated in a monolayer. Cells were affected with nifedipine (10 μM) or BayK8644 (10 μM) for the 3 days, stained with Cal-520, and mean fluorescence intensity (MFI) was measured by flow cytometer (BD FACSAria). Control–cells without nifedipine or BayK8644. Data are shown as mean ± SD, n = 3 different donor samples-derived cells of each type.
Ijms 24 06730 g001
Figure 2. The iCa2+ levels in MenSCs, BMMSCs and chondrocytes cultivated in a monolayer, affected with nifedipine (10 μM) or BayK8644 (10 μM) for the 3 days and stained with Cal-520 dye. Control–cells without nifedipine or BayK8644. Cells were visualized with EVOs fluorescent microscope; the representative micrographs are shown. Scale bar 200 μm.
Ijms 24 06730 g002
Figure 3. The ionomycin-induced iCa2+ release in MenSCs, BMMSCs and chondrocytes. Cells were stained with Cal-520 and analyzed with flow cytometer (Calibur). (A) The iCa2+ fluorescence is shown as mean fluorescence intensity (MFI) ± standard deviation (SD) before and 90 s after adding the ionomycin (1 μM). * Data are shown as mean ± standard deviation (SD) and are considered significant at p ≤ 0.05 (n = 5). (B) The representative cell population measurement before and after adding the ionomycin (1 μM at 90 s). The two-way ANOVA was used to compare cells.
Ijms 24 06730 g003
Figure 4. The effect of nifedipine and BayK8644 on the iCa2+ levels in MenSCs (A), BMMSCs (B) and chondrocytes (C). Cells were treated with nifedipine (10 μM) or BayK8644 (10 μM) for the 24 h and stained with Cal-520 dye. The accumulation of iCa2+ is shown as median fluorescence intensity (MFI) ± standard deviation (SD) before and 90 s after adding ionomycin (1 μM), measured by flow cytometer Calibur. * Data are shown as mean ± standard deviation (SD) and are significant at p ≤ 0.05 (n = 3) measuring three different donor cells of each type, two-way ANOVA was used.
Ijms 24 06730 g004
Figure 5. The effect of nifedipine and BayK8644 on MenSCs, BMMSCs and chondrocytes proliferation. Proliferation of MenSCs (A), BMMSCs (B) and chondrocytes (C) after the treatment with nifedipine (10 μM) and BayK8644 (10 μM) for 1, 3, 5, 8, and 12 days. Proliferation was measured using CCK-8 assay. Proliferation rate is shown as a ratio of CCK-8 absorbance (450 nm) to the 1st day of cell adherence. (D) The effect of nifedipine on the 12th day of cell proliferation. * Data are shown as mean ± standard deviation (SD) and are significant at p ≤ 0.05 (n = 3) measuring three different donor samples-derived cells of each type using a two-way ANOVA.
Ijms 24 06730 g005
Figure 6. The effects of nifedipine and BayK8644 on CaV1.2 expressions in MenSCs, BMMSCs and chondrocytes. (A) The CACNA1C gene expression. Relative transcript level was evaluated comparing to the housekeeping B2M, RPS9 and ACTB genes and are significant at p ≤ 0.05. (B) CaV1.2 protein level measured by flow cytometer as mean fluorescence intensity (MFI); data are shown as mean of MFI ± standard deviation (SD). (C) Fluorescent micrographs of CaV1.2 in MenSCs, BMMSCs and chondrocytes after the stimulation with nifedipine (10 μM) and BayK8644 (10 μM) for the 3 days. Control–cells without any treatment. Cells were visualized with EVOs fluorescent microscope; the representative micrographs are shown; scale bar = 150 µM. * Data are shown as mean ± standard deviation (SD) and are significant at p ≤ 0.05 (n = 3) measuring three different donor sample-derived cells of each type using a two-way ANOVA.
Ijms 24 06730 g006
Figure 7. The effect of nifedipine and BayK8644 on chondrogenic differentiation-related genes in MenSCs, BMMSCs and chondrocytes. The expression of SOX9 (A), COL2A1 (B) and CACNA1C (C) after the stimulation of chondrogenic differentiation for the 21 days with TGF-β3 (10 ng/mL), nifedipine (10 μM) or BayK8644 (10 μM). Control cells were cultured under the same chondrogenic differentiation conditions, but without TGF-β3, nifedipine or BayK8644. Relative transcript level evaluated according to the housekeeping genes B2M and RPS9. Red lines represent the gene expression after the TGF-β3 stimulation. Data are shown as mean ± standard deviation (SD) and were significant at * p ≤ 0.05.
Ijms 24 06730 g007
Disclaimer/Publisher’s Note: The statements, opinions and data contained in all publications are solely those of the individual author(s) and contributor(s) and not of MDPI and/or the editor(s). MDPI and/or the editor(s) disclaim responsibility for any injury to people or property resulting from any ideas, methods, instructions or products referred to in the content.

