Abstract
Fibroblast growth factor (FGF) family genes are a class of polypeptide factors with similar structures that play an important role in regulating cell proliferation and differentiation, nutritional metabolism, and neural activity. In previous studies, the FGF gene has been widely studied and analyzed in many species. However, the systematic study of the FGF gene in cattle has not been reported. In this study, 22 FGF genes distributed on 15 chromosomes were identified in the Bos taurus genome and clustered into seven subfamilies according to phylogenetic analysis and conservative domains. Collinear analysis showed that the bovine FGF gene family was homologous to Bos grunniens, Bos indicus, Hybrid-Bos taurus, Bubalus bubalis, and Hybrid-Bos indicus, and tandem replication and fragment replication were the key driving forces for the expansion of the gene family. Tissue expression profiling showed that bovine FGF genes were commonly expressed in different tissues, with FGF1, FGF5, FGF10, FGF12, FGF16, FGF17, and FGF20 being highly expressed in adipose tissue. In addition, real-time fluorescence quantitative PCR (qRT-PCR) detection showed that some FGF genes were differentially expressed before and after adipocyte differentiation, indicating their diverse role in the formation of lipid droplets. This study made a comprehensive exploration of the bovine FGF family and laid a foundation for further study on the potential function in the regulation of bovine adipogenic differentiation.
1. Introduction
Beef is rich in protein, and its amino acid composition is close to the needs of the human body, so it is deeply loved by consumers. With the improvement in living standards, consumers pay more attention to the taste and flavor of beef products, and these factors are affected by the content and distribution of intramuscular fat (IMF) []. At the cellular level, adipocyte proliferation (increased number of adipocytes) and differentiation (adipocyte hypertrophy, increased triglyceride accumulation) are the main ways to increase fat content. It is of great significance to increase the intramuscular fat content and improve beef quality by studying and revealing the molecular regulation mechanism of proliferation and differentiation of bovine adipocytes.
Adipogenesis is a biological process closely coordinated by a series of transcriptional cascades and a large number of transcriptional regulatory factors []. At present, the most widely studied regulatory factors of adipogenesis are the CCAAT/enhancer-binding protein (C/EBP) and peroxisome proliferator-activated receptor (PPAR) families, which play an important role in the cascade of adipogenesis [,]. In addition, varieties of regulatory factors and signaling pathways are involved in the directional differentiation of pluripotent stem cells into precursor adipocytes, including WNT proteins [], bone morphogenetic protein (BMP), and members of the fibroblast growth factor (FGF) proteins [,]. Here, the main purpose of this study is to explore the regulatory role of the FGF gene family in the process of adipocyte differentiation.
The FGF family consists of 22 members that not only closely relate to embryonic development, tissue regeneration, angiogenesis, metabolic activity, and neurological function but also play an important role in cell proliferation, differentiation, migration, apoptosis, and chemotaxis [,]. Mitochondrial brown fat uncoupling protein-1 (UCP1) plays a key role in regulating the energy balance of brown adipose tissue (BAT). It has been found that FGF6 and FGF9 can regulate energy metabolism by inducing the expression of UCP1 in adipocytes and preadipocytes []. FGF2 not only acts on muscle growth but also promotes fat and angiogenesis [,]. FGF10 can not only stimulate the proliferation of preadipocytes through the Ras/MAPK pathway but also promote the expression of retinoblastoma protein (pRb), and the complex of pRb and C/EBPα can induce adipogenesis []. In rodent models with obesity and type 2 diabetes, FGF21 has the effect of reducing blood sugar and lipidemia and can increase energy consumption leading to weight loss [].
Although the functional studies of some FGF family members have been reported in many species, their expression patterns and regulatory mechanisms during adipogenic differentiation of bovine adipocytes have not been systematically studied and elucidated. Therefore, in this study, the characteristics and function of the FGF gene family members are analyzed. Furthermore, we detect the expression profile of FGF family members during the adipogenic differentiation in cattle. Our results lay a foundation for further exploring the molecular mechanism of the FGF genes on bovine adipogenesis.
2. Results
2.1. Identification of Members of the Bovine FGF Family
In this study, 49 verified FGF protein sequences of humans (Homo sapiens, 22), mice (Mus musculus, 22), and cattle (Bos taurus, 5) were used to identify members of the FGF family. Through the HMM analysis and BLASTP alignment of these 49 protein sequences, 22 non-redundant FGF protein sequences were identified in cattle, including FGF1–FGF14 and FGF16–FGF23 (Table 1). Meanwhile, the corresponding FGF family proteins (Additional file S1) were identified in Bos indicus (19), Hybrid-Bos taurus (21), Hybrid-Bos indicus (20), Bos grunniens (20), Bubalus bubalis (22), Bos mutus (16), and Bison bison bison (18). All FGF protein sequences can be seen in Additional file S2.

Table 1.
Description of Bos taurus FGF family genes.
Isoelectric point (PI), molecular weight (Mw), and the number and sequence of amino acids (AA) are shown in Additional file S3. The results showed that the amino acid sequences of 22 bovine FGF proteins ranged from 155 (FGF1) to 270 (FGF5), while the molecular weight (Mw) ranged from 17249.83 to 29640.87 Da, which was consistent with the corresponding protein length. FGF1 and FGF21 showed acidity with PIs of 6.51 and 6.08, respectively. FGF9 was neutral (7.06), and all other protein members were basic, with PIs between 7.7 and 11.48. All the 22 FGF proteins of bovine contained FGF/FGF superfamily conserved domain (Additional file S4).
2.2. Structural Characteristics of Members of the Bovine FGF Family
In this study, the phylogenetic relationships of bovine FGF family members were analyzed to predict their conserved motifs and gene structure (Figure 1). The results showed that the FGF family members of cattle were mainly clustered into eight subfamilies according to the different evolutionary branches. The FGF1 subfamily consisted of FGF1 and FGF2, the FGF4 subfamily consisted of FGF4-6, the FGF7 subfamily consisted of FGF7, FGF10, and FGF22, the FGF8 subfamily consisted of FGF8, FGF17, and FGF18, the FGF9 subfamily consisted of FGF9, FGF16, and FGF20, the FGF19 subfamily consisted of FGF19, FGF21 and FGF23, FGF11-14 was from a subfamily, and FGF3 was divided into a separate subfamily. All FGF family proteins contained motif 1 and motif 2, which consisted of 21 and 20 amino acids, respectively (Additional file S5). The FGF8 subfamily had the same six motifs, FGF1-4 and FGF6 had the same four motifs, FGF11-14 had the same six motifs, and FGF9, FGF16, and FGF20 had the same five motifs. The coding sequence (CDS), untranslated region (UTR), and intron of FGF family members were different. The number of CDS varied from 2 to 13, and the position and length of 3′ UTR and 5′ UTR were also different, but the members of the FGF family in the same evolutionary branch showed similar conservative patterns and gene structures.
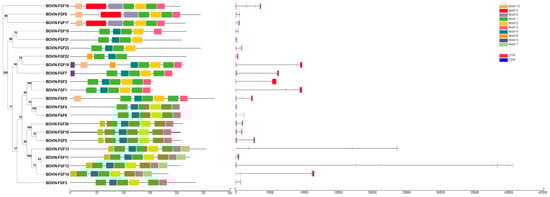
Figure 1.
Phylogenetic analysis (left), motif analysis (middle), and gene structure analysis (right) of bovine FGF protein.
2.3. Phylogenetic Analysis of Bovine FGF Protein
On the basis of exploring the evolutionary relationship of the bovine FGF gene, we constructed a phylogenetic tree based on a total of 202 FGF members, including human, mouse, and eight bovine subfamily species (Figure 2). Phylogenetic analysis showed that FGF family proteins were mainly clustered into eight groups, and the number of genes in each group was different. Group IV was the largest with 37 genes, followed by Group III with 30, both Groups I and IV with 28, both Groups II and VII with 26, and Group VIII with 19 and Group VI with 8.
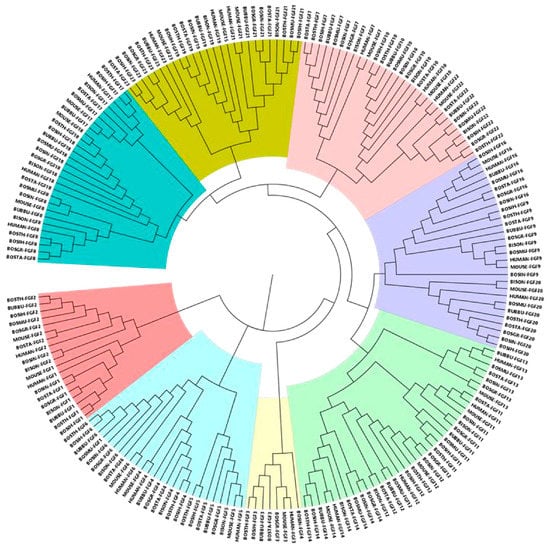
Figure 2.
Phylogenetic neighbor-joining (NJ) tree of FGF family members of different species. FGF proteins were divided into eight clusters, which were distinguished by different colors.
2.4. Chromosome Distribution and Collinearity Analysis of FGF Gene
We analyzed the location of FGF family members on the chromosomes of six bovine subfamily species, and the 22 FGF genes in cattle were unevenly distributed on 15 chromosomes (Figure 3). Compared to Bos taurus, Bos indicus (FGF3, FGF5, and FGF17), Hybrid-Bos taurus (FGF13 and FGF16), Hybrid-Bos indicus (FGF13), and Bos grunniens (FGF17 and FGF19) are missing several FGF genes. Meanwhile, the order of FGF1 and FGF22 of Bos taurus (Chr7) on chromosomes was opposite to that of Hybrid-Bos taurus (Chr7), Hybrid-Bos indicus (Chr7), and Bubalus bubalis (Chr9). In addition, the sequence and position of three tandem genes (FGF19, FGF4, and FGF3) located on Bos taurus chromosome 29 changed on Hybrid-Bos taurus, Hybrid-Bos indicus, and Bos grunniens chromosomes. In addition, we found two pairs of tandem repeat genes on the chromosomes of Bos taurus. FGF3, FGF4, and FGF19 were located on chromosome 29, only 35 and 63 kb apart, respectively. On chromosome 5, FGF6 and FGF23 were also located within 50 kb of each other. Meanwhile, eight pairs of fragmented repeat genes were also found (Figure 4). These gene replication events may be one of the drivers of FGF gene evolution.
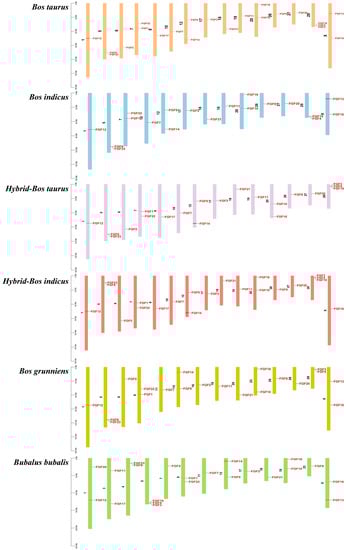
Figure 3.
The chromosomal distribution of FGFs gene.
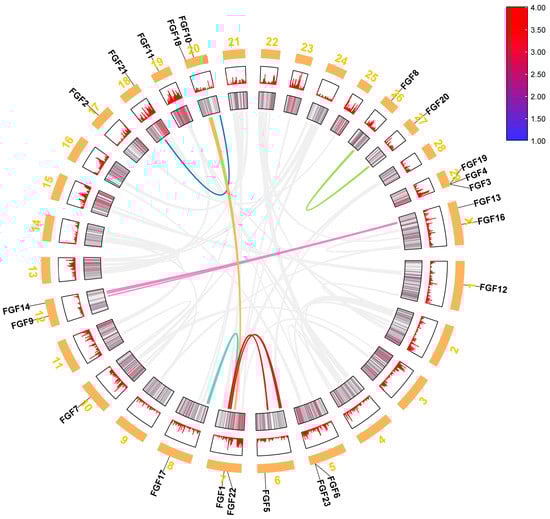
Figure 4.
Repetitive gene analysis of FGF gene in Bos taurus genome.
2.5. Collinear Analysis of FGF Gene in Several Bovine Subfamily Species
To further explore the phylogenetic mechanisms of the FGF gene, we studied homology in six bovine subfamily species. The results of the collinear analysis showed that there were multiple collinear gene pairs between Bos taurus and Bos indicus (31691), Hybrid-Bos taurus (34495), Hybrid-Bos indicus (33570), Bos grunnines (32378), and Bubalus bubalis (33327) (Figure 5). There was a one-to-one correspondence between Bos taurus chromosomes (2N = 60) and Hybrid-Bos indicus, Bos grunnines, Hybrid-Bos taurus, and Bos indicus, and there was also great homology between Bos taurus chromosomes and Bubalus bubalis chromosomes (2N = 50), indicating that these collinear gene pairs are relatively conservative in the evolution of bovine species (Table 2).
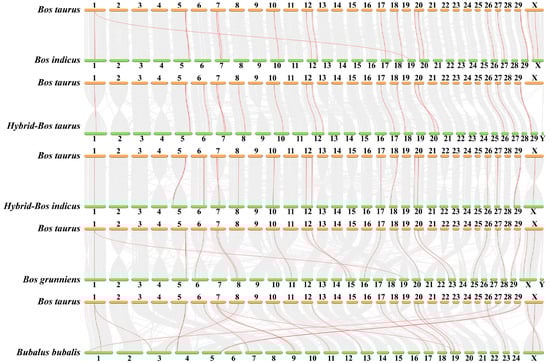
Figure 5.
Collinear analysis of FGF gene.
Table 2.
Homology analysis of FGF gene between Bos taurus and other bovine subfamily species.
2.6. Expression Analysis of FGF Gene in Different Tissues
The expression patterns of genes can provide an important reference for studying their function, so we explored the expression patterns of FGF gene family members in eight tissue types (heart, liver, spleen, lung, kidney, muscle, adipose, rumen) of cattle. (Figure 6, Table S4). The results showed that the expression of FGF1, FGF5, FGF10, FGF12, FGF16, FGF17, and FGF20 was the highest in adipose tissue, while the expression of FGF4, FGF7, FGF8, FGF11, FGF14, FGF18, FGF19, FGF21, FGF22, and FGF23 in adipose tissue was lower than that in lung tissue but higher than that in other tissues. In addition, all the members of the FGF gene family were generally expressed in various tissues, indicating that they may play a wide range of roles in life activities.
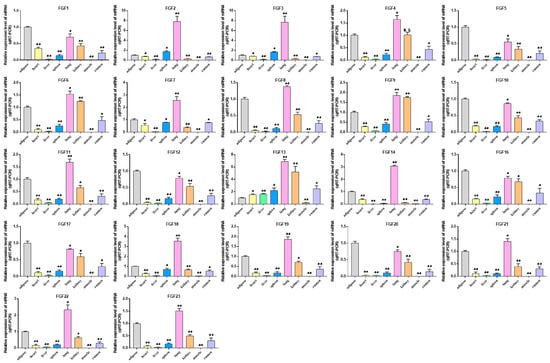
Figure 6.
Analysis of the expression of FGF family members in different tissues of cattle. Compared with the control, “*” means a significant difference (p < 0.05), “**” means an extremely significant difference (p < 0.01), and “N.S.” indicates a non-significant difference.
2.7. Expression Analysis of FGF Gene during Differentiation of Bovine Adipocytes
This study explored the expression pattern of the FGF gene family using bovine subcutaneous adipocytes. The results of Oil Red O staining showed that the number of lipid droplets formed by adipocytes on the 10th day was significantly higher than that of uninduced adipocytes. The results of qRT-PCR detection showed that the expression levels of adipogenic marker genes FABP4 and PPARγ increased significantly after cell induction, indicating that the induced differentiation model of bovine adipocytes was successfully established (Figure 7, Table S2). Then, the expression pattern of the FGF gene was detected by cell model, and it was found that except for FGF4, FGF13, FGF16, FGF21, and FGF22, the FGF family genes had relatively high expression levels in bovine adipocytes. In addition, with the increase in induction days, the expression levels of FGF1, FGF2, FGF3, FGF10, FGF11, and FGF18 increased significantly. The expression levels of FGF5, FGF10, and FGF20 were highest on the second day of differentiation and then decreased rapidly. The expression of FGF14 was the highest on the 4th day of differentiation and then decreased to the lowest on the 10th day of differentiation. The expression levels of FGF12 did not change significantly on the 2nd to 8th day of differentiation but decreased significantly on the 10th day of differentiation. The expression level of other FGF family members decreased significantly with the increase in adipocyte differentiation time (Figure 8, Table S2).
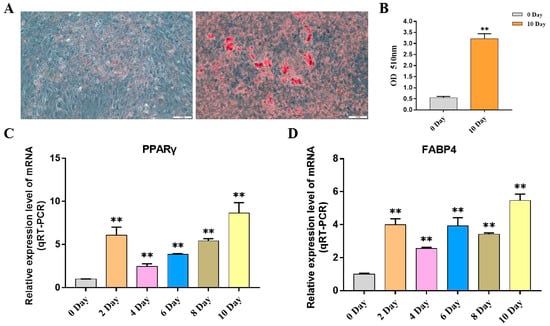
Figure 7.
Induction of primary adipocyte differentiation. (A) Oil red O assay for lipid droplet distribution in adipocytes on day 0 and day 10 of differentiation. (B) The absorbance of adipocyte extract at 510 nm was measured at 0 and 10 days after induction. (C,D) The expression of PPARγ and FABP4 genes was detected. Compared with the control, “**” means an extremely significant difference (p < 0.01).
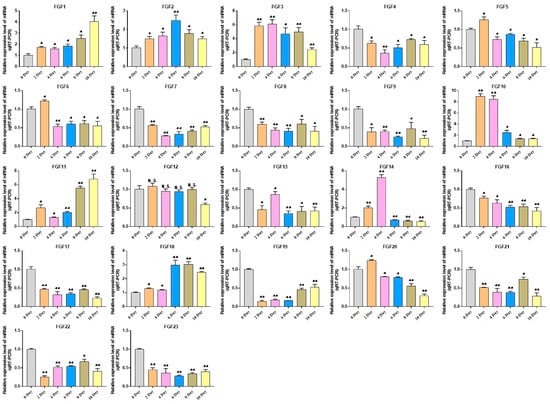
Figure 8.
Detection of FGFs gene expression during adipocyte differentiation. Compared with the control, “*” means a significant difference (p < 0.05), “**” means an extremely significant difference (p < 0.01), and “N.S.” indicates a non-significant difference.
3. Discussion
Beef is one of the most important meat products in daily life, and the content of IMF directly affects its taste and flavor, so it is of great significance to explore the molecular mechanism affecting IMF deposition. In recent years, with the completion of whole genome sequencing of animals and plants, a large number of studies on gene families have been reported. Fibroblast growth factor (FGF) transduces signals through fibroblast growth factor receptor (FGFR) tyrosine kinase, which mainly regulates the development and morphogenesis of many tissues by paracrine or autocrine actions [,,]. Considering the potential role of FGF family members and the fact that only a small number of FGF family members have been reported in other species [,], we believe that it is very important to identify and analyze the FGF gene family in cattle.
3.1. Identification and Phylogenetic Analysis of Bovine FGF Family Proteins
In this study, we used the 49 identified human, mouse, and bovine FGF protein sequences as references to retrieve FGF genes in the Bos taurus (22), Bos indicus (19), Hybrid-Bos taurus (20), Hybrid-Bos indicus (21), Bos grunniens (20), Bubalus bubalis (22), Bos mutus (16), and Bison bison bison (18) genomes based on sequence similarity and conserved structural domains. The difference in the number of FGF gene family members may be related to the genome size and ploidy level []. Previous studies have found that Caenorhabditis elegans has only two FGF genes, whereas 22, 22, 27, and 35 FGF genes were identified in the genomes of human, mouse, zebrafish, and common carp, respectively, indicating that the massive expansion of FGF gene family members occurred during the evolution of primitive metazoans into vertebrates and aquatic organisms [,,,,]. In addition, a new FGF gene, FGF24, has been identified in zebrafish, but direct homologs of FGF24 have not been identified in humans, mice, or bovids, and it is speculated that it may have been lost during the evolution of these animals [,]. The phylogenetic study showed that the FGF genes identified in humans, mice, and eight species of the Bovine subfamily were clustered into eight main branches (Figure 2), and the FGF members with close evolutionary distance would gather together. For example, Bos taurus FGF1, FGF13, and FGF23 clustered first with Bos indicus and then with FGF genes from other species. Studies have shown that the FGF family has experienced at least two major extensions: The first expansion increased the number of FGFs from one or more primitive FGF genes to eight primitive FGF genes, forming the prototype of eight subfamilies. The second amplification occurred in the process of allelic evolution, which was mainly caused by genome replication []. In this study, a phylogenetic tree was constructed using 22 bovine fibroblast growth factor protein sequences, and it was found that they could be clustered into eight subfamilies (FGF1, FGF3, FGF4, FGF7, FGF8, FGF9, FGF11, and FGF19 subfamilies), while the 22 FGF genes in the human and mouse genomes were clustered into seven subfamilies, with FGF3 identified as a member of the FGF7 subfamily [,]. In all the current studies, FGF3 genes in vertebrates are always divided into the FGF4 subfamily or FGF7 subfamily, but in fact, the clustering classification of FGF3 is still controversial [,,]. Oulion proposed a new evolutionary scenario for FGF genes based on the results obtained by studying gene content, phylogenetic distribution, and the conservation of commonalities between amphioxus and vertebrates, namely that FGF3 forms a new subfamily, which is consistent with the results of the present study []. This evolutionary scheme is demonstrated for the first time in this study based on the results of analyzing the phylogenetic relationships of bovine FGF family members, and it contributes to reconciling different evolutionary hypotheses proposed in previous studies.
3.2. Analysis of Physicochemical Properties and Structural Characteristics of the Bovine FGF Protein
Molecular weight and isoelectric point play an important role in determining molecular and biochemical functions []. We studied the size and isoelectric point of bovine FGF protein and found that, except for FGF1, FGF9, and FGF21, the isoelectric point of most FGF proteins was more than seven, indicating that there was a high proportion of basic amino acids. In order to gain insight into the structural diversity of bovine FGF proteins, the intron-exon organization was analyzed (Figure 1). Some similar FGF gene pairs showed different intron/exon arrangements, which indicates that the bovine FGF gene may have a more complex gene structure evolution. We identified 10 conserved motifs in bovine FGF proteins, of which motif 1 and motif 2 were present in almost all FGF proteins (Additional file S5). There were some differences in the arrangement of conserved motifs among members of the FGF family, but the members of the same subfamily were composed of similar motifs, which indicates that their structures and biological functions are similar. These results confirmed the characteristics of the bovine FGF protein family and laid a foundation for further study of the function of the FGF gene.
3.3. Chromosome Distribution, Replication, and Collinearity Analysis of Bovine FGF Protein
The chromosome map of the bovine FGF gene showed that 22 FGF genes were unevenly distributed on 15 chromosomes (Figure 3). The number of genes on each chromosome varied from one to three, including two genes on chromosomes 5, 7, 12, 20, and X, three genes on chromosome 29, and only one gene on most other chromosomes. Gene replication (tandem replication and fragment replication) and transposable events are the main driving forces leading to the complexity of eukaryotic genomes and the expansion of family members []. In the study of the human FGF gene family, it was found that FGF3, FGF4, and FGF19 were located on chromosome 11, and the distances were 40 and 10 kb, respectively. FGF6 and FGF23 were within 55 kb on chromosome 12. In the mouse study, it was found that FGF3, FGF4, and FGF19 were located in the 80 kb range of chromosome 7, and FGF6 and FGF23 were closely linked on chromosome 6 []. Like humans and mice, we identified FGF3, FGF4, and FGF19 on bovine chromosomes within the range of 35 to 63 kb on chromosome 29, while FGF6 and FGF23 were also located within 50 kb on chromosome 5 (Figure 3). These gene positions suggest that the FGF gene family arose through the duplication and translocation of genes and chromosomes during evolution, which would have contributed to the diversification of gene functions []. To investigate the evolutionary relationships of the FGF genes, we performed genomic collinearity analysis on cattle and five other bovine subfamily species and found multiple collinearity gene pairs, indicating that the FGF genes are highly conserved.
3.4. FGF Gene Affects Adipocyte Differentiation
In order to understand the expression of FGF family members, the expression profiles of the FGF gene in eight tissue types of cattle were analyzed. The results showed that FGF family members were expressed in all these tissues, with FGF1, FGF5, FGF10, FGF12, FGF16, FGF17, and FGF20 being highly expressed in adipose tissue. Studies have shown that FGF1 can promote the differentiation of human preadipocytes into mature adipocytes by regulating the dependent network of BMP protein and activin membrane binding inhibitor (BAMBI)/PPARγ []. FGF2 can activate PI3K/AKT signal pathway and promote the proliferation and adipogenic differentiation of adipose stem cells []. FGF10 can promote adipogenic differentiation of goat intramuscular preadipocytes []. This is consistent with our qRT-PCR results, the expression levels of FGF1, FGF2, and FGF10 are significantly increased in induced adipocytes, and other FGF family members have different expression levels. Fibroblast growth factor receptors (FGFRs) are tyrosine kinase receptors (TRKs) that include four genes, FGFR1, FGFR2, FGFR3, and FGFR4 []. Four FGFR genes in vertebrates produce seven FGFR proteins with different ligand binding specificity (FGFRs 1b, 1c, 2b, 2c, 3b, 3c, and 4) according to the difference of immunoglobulin-like domain III, and the biological function of typical FGFs is mediated by the interaction with FGFRs [,,]. Therefore, we performed an expression analysis of FGFRs, which showed that FGFR2 and FGFR4 were most highly expressed in adipose tissue and FGFR1 and FGFR3 were less expressed in adipose tissue than in lung and kidney tissue but higher than in other tissues (Figure 9A, Table S3). Previous studies on the binding specificity of FGFs-FGFRs found that members of the FGF7 subfamily were able to strongly activate FGFR2b, members of the FGF8 and FGF9 subfamilies showed high relative activity toward FGFR3c, members of the FGF19 subfamily showed consistent activity toward FGFR1c, 2c, 3c and FGFR4, and members of the FGF4 subfamily specifically activated the c receptor splice form [,]. Our analysis of the expression of FGFRs during adipocyte lipogenic differentiation also showed that the expression trends of FGFRs were similar to the expression trends of their specifically bound FGF subfamily members, and the findings strongly suggest that FGF–FGFR signaling plays an important role in adipose tissue development and adipocyte lipogenic differentiation (Figure 6, Figure 8 and Figure 9, Table S1).
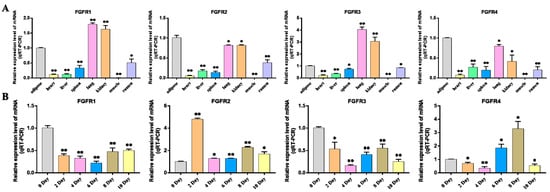
Figure 9.
Expression assay of FGFRs genes. (A) Detection of FGFRs gene expression profile in different tissues of cattle. (B) Detection of FGFRs gene expression profile during bovine adipocyte differentiation. Compared with the control, “*” means a significant difference (p < 0.05), “**” means an extremely significant difference (p < 0.01).
The interaction between proteins can reveal their regulatory relationship, which helps us to understand the potential function of these proteins. We used Cytoscape’s Agilent plug-in to mine the literature about FGF family members and their interaction genes to build a complete interaction network (Figure 10) []. For example, the FGF signal can regulate the metabolism of endothelial cells through MYC-dependent HK2 expression, which in turn affects the development of blood vessels and lymphatic vessels []. Knockout of the FGF21 gene in liver tissue can activate glucose-6-phosphatase and phosphoenolpyruvate carboxykinase through STAT3/SOCS3 pathway, thus increasing gluconeogenesis and glycogen decomposition, resulting in the aggravation of liver insulin resistance []. In addition, studies correlating single nucleotide polymorphisms (SNPs) in the 3′ untranslated region (UTR) of the FGF21 gene with metabolic syndrome, obesity, and diabetes showed that genetic variants in the 3′ UTR region of the FGF21 gene were associated with obesity and not with metabolic syndrome and diabetes []. The opening of Piezo1 ion channels in mature adipocytes leads to the release of FGF1, which activates FGFR1 and induces precursor adipocyte differentiation []. In general, these results showed that the FGF gene family plays a role in regulating vascular development, metabolism, and adipose differentiation by interacting with other genes.
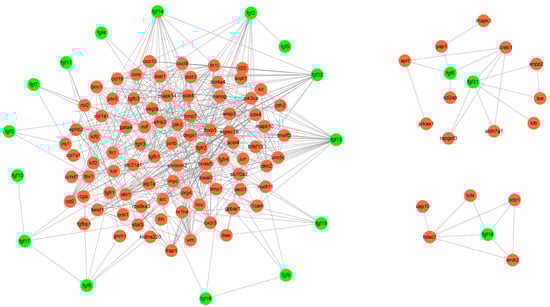
Figure 10.
Interactive network mining of FGF genes.
4. Materials and Methods
4.1. Identification and Phylogenetic Analysis of FGF Gene
We downloaded the genome files and annotation information of related species from the Ensembl database (https://asia.ensembl.org/info/about/species.html, accessed on 11 May 2022) and NCBI database (https://www.ncbi.nlm.nih.gov/genome/?term=BOS, accessed on 13 May 2022), respectively. The hidden Markov model (HMM) of the FGF gene (PF0048) was downloaded from the Pfam database (http://pfam-legacy.xfam.org/, accessed on 25 May 2022), and the HMMER 3.0 software (version 3.0) was used to build a multiple comparison model based on structural domain similarity to retrieve possible FGF proteins according to default parameters []. Meanwhile, according to the same template protein sequence, the possible FGF protein was obtained by Protein Basic Local Alignment Search Tool (BLASTP) analysis []. Then, the final protein sequences of FGF were obtained by manual examination of the two analysis results, and these protein sequences were submitted to NCBI CD-Search (https://www.ncbi.nlm.nih.gov/Structure/bwrpsb/bwrpsb.cgi, accessed on 5 June 2022) to determine the conserved protein domain []. Basic information, such as PI and Mw of genes, is predicted by ExPASy website (https://web.expasy.org/compute_pi/, accessed on 16 June 2022) []. The amino acid sequence alignment of the FGF gene was completed by ClustalW software (version 2.1). The results were analyzed by MEGA software (version 7.0.26), and the phylogenetic tree was constructed by using default parameters and setting 1000 repeats [,]. The evolutionary tree was adjusted and embellished using Figtree software (version 1.4) [].
4.2. Conservative Motif and Gene Structure Analysis
Motif analysis of the amino acid sequence of FGF through the MEME database (https://meme-suite.org/meme/tools/meme, accessed on 2 July 2022) was conducted. In the parameter setting, the maximum number of motifs was 10, the optimal width was 6–50 amino acids, and the motifs with e values less than 1 × 10⁻¹⁰ were retained to identify the conservative motifs in these sequences []. The structure of the FGF gene was analyzed using TBtools software (version 1.108), and the structure of the gene was located through CDS and genome sequencing [].
4.3. Chromosome Distribution, Gene Replication, and Collinearity Analysis
Using the genome annotation information obtained, the FGF genes of several bovine subfamily species were mapped to the corresponding chromosomes. MCScanX tool was used to analyze the replication events of the bovine FGF gene, and the collinearity analysis of homologous genes between cattle and five other bovine subfamily species was conducted []. All the above results were visualized using TBTools [].
4.4. Culture and Induced Differentiation of Bovine Primary Adipocytes
The subcutaneous adipocytes of cattle were provided by the Key Laboratory of Ruminant Molecular Cell Breeding of Ningxia University. Adipocytes stored in liquid nitrogen were resuscitated and inoculated in culture dishes to grow to about 80%, the differentiation medium was changed to induce differentiation of the cells, and after 2 days of induction, the maintenance medium was changed to continue the culture. The adipocytes that were not induced and induced for 10 days were stained with Oil Red O and photographed and preserved under a microscope. The specific content is carried out with reference to the method [,].
4.5. RNA Extraction and qRT-PCR
Tissue samples of the heart, liver, spleen, lung, kidney, muscle, adipose, and rumen of cattle were provided by the Key Laboratory of Ruminant Molecular Cell Breeding of Ningxia University. The total RNA of cultured cells was extracted with TRIZOL reagent (American Invitgen), and the purity, concentration, and integrity of RNA were detected by ultraviolet spectrophotometer and 1.0% agarose gel electrophoresis. The first strand cDNA was prepared using a cDNA synthesis kit (Takara, China), and the gene expression level was detected by real-time fluorescence quantitative PCR reaction (qRT-PCR). Primer information is included in Additional file S6.
4.6. Statistical Analysis
In the qRT-PCR experiment, the mRNA of GAPDH was used as the endogenous control at the basic level, and the relative gene expression level was measured using the 2−ΔΔCt method [,]. Visualization of statistical results was performed using GraphPad Prism software (version 7.0).
5. Conclusions
Through genome-wide analysis, we identified a total of 158 FGF genes in the Bovidae. The molecular characteristics, gene structure, chromosome location, conserved motif, and evolutionary relationship of FGF genes were analyzed comprehensively. There was a good collinearity of the FGF gene between bovine and other species of bovine subfamily. Expression analysis and functional prediction indicated that FGF genes exhibited tissue-specific expression patterns and that they played an important role in regulating adipocyte differentiation. This study enriched the understanding of the FGF family and laid a foundation for further study of the molecular mechanism of FGF genes in the adipogenic differentiation and development of adipose tissue of cattle.
Supplementary Materials
The following supporting information can be downloaded at: https://www.mdpi.com/article/10.3390/ijms24065663/s1.
Author Contributions
H.S. and J.Z. made the same contribution to the work. H.S. and Y.M. conceived and designed the experiments; H.S., J.Z., and C.P. performed the experiments; H.S., J.Z., F.L., M.Y., and Y.L. analyzed the data and constructed the figures; H.S. and J.Z. wrote the draft; B.C. and L.Z. reviewed and edited the manuscript; Y.M. provided financial support. All authors have read and agreed to the published version of the manuscript.
Funding
This study was supported by grants from the National Natural Science Foundation of China (U22A20506, 32072720), the Key Research and Talent Introduction Project of Ningxia Hui Autonomous Region (2021BEF01002, 2021NXZD1) and the cultivation project for talents in science and technology innovation of Ningxia Hui Autonomous Region (2020GKLRLX02). The funding bodies played no role in the design of the study, collection, analysis, and interpretation of data and writing the manuscript.
Institutional Review Board Statement
Not applicable.
Informed Consent Statement
Not applicable.
Data Availability Statement
All data are reported in this manuscript.
Acknowledgments
We thank Run-jun Yang and Lu-pei Zhang for review and suggestions for the manuscript.
Conflicts of Interest
The authors declare no conflict of interest.
References
- Kazala, E.C.; Lozeman, F.J.; Mir, P.S.; Laroche, A.; Bailey, D.R.C.; Weselake, R.J. Relationship of fatty acid composition to intramuscular fat content in beef from crossbred Wagyu cattle. J. Anim. Sci. 1999, 77, 1717–1725. [Google Scholar] [CrossRef] [PubMed]
- Rosen, E.D.; MacDougald, O.A. Adipocyte differentiation from the inside out. Nat. Rev. Mol. Cell Biol. 2006, 7, 885–896. [Google Scholar] [CrossRef] [PubMed]
- Lowe, C.E.; O’Rahilly, S.; Rochford, J.J. Adipogenesis at a glance. J. Cell Sci. 2011, 124, 2681–2686. [Google Scholar] [CrossRef]
- Lefterova, M.I.; Lazar, M.A. New developments in adipogenesis. Trends Endocrinol. Metab. 2009, 20, 107–114. [Google Scholar] [CrossRef] [PubMed]
- Christodoulides, C.; Lagathu, C.; Sethi, J.K.; Vidal-Puig, A. Adipogenesis and WNT signalling. Trends Endocrinol. Metab. 2009, 20, 16–24. [Google Scholar] [CrossRef]
- Huang, H.; Song, T.-J.; Li, X.; Hu, L.; He, Q.; Liu, M.; Lane, M.D.; Tang, Q.-Q. BMP signaling pathway is required for commitment of C3H10T1/2 pluripotent stem cells to the adipocyte lineage. Proc. Natl. Acad. Sci. USA 2009, 106, 12670–12675. [Google Scholar] [CrossRef]
- Widberg, C.H.; Newell, F.S.; Bachmann, A.W.; Ramnoruth, S.N.; Spelta, M.C.; Whitehead, J.P.; Hutley, L.J.; Prins, J.B. Fibroblast growth factor receptor 1 is a key regulator of early adipogenic events in human preadipocytes. Am. J. Physiol. Metab. 2009, 296, E121–E131. [Google Scholar] [CrossRef]
- Ohta, H.; Itoh, N. Roles of FGFs as Adipokines in Adipose Tissue Development, Remodeling, and Metabolism. Front. Endocrinol. 2014, 5, 18. [Google Scholar] [CrossRef]
- Eswarakumar, V.; Lax, I.; Schlessinger, J. Cellular signaling by fibroblast growth factor receptors. Cytokine Growth Factor Rev. 2005, 16, 139–149. [Google Scholar] [CrossRef]
- Shamsi, F.; Xue, R.; Huang, T.L.; Lundh, M.; Liu, Y.; Leiria, L.O.; Lynes, M.D.; Kempf, E.; Wang, C.-H.; Sugimoto, S.; et al. FGF6 and FGF9 regulate UCP1 expression independent of brown adipogenesis. Nat. Commun. 2020, 11, 1421. [Google Scholar] [CrossRef]
- Mathes, S.; Fahrner, A.; Ghoshdastider, U.; Rüdiger, H.A.; Leunig, M.; Wolfrum, C.; Krützfeldt, J. FGF-2–dependent signaling activated in aged human skeletal muscle promotes intramuscular adipogenesis. Proc. Natl. Acad. Sci. USA 2021, 118, e2021013118. [Google Scholar] [CrossRef] [PubMed]
- Kakudo, N.; Morimoto, N.; Ogawa, T.; Taketani, S.; Kusumoto, K. FGF-2 combined with bilayer artificial dermis composed of collagen matrix prompts generation of fat pad in subcutis of mice. Med. Mol. Morphol. 2019, 52, 73–81. [Google Scholar] [CrossRef] [PubMed]
- Ohta, H.; Konishi, M.; Itoh, N. FGF10 and FGF21 as regulators in adipocyte development and metabolism. Endocr. Metab. Immune Disord. Drug Targets 2011, 11, 302–309. [Google Scholar] [CrossRef]
- Giralt, M.; Gavaldà-Navarro, A.; Villarroya, F. Fibroblast growth factor-21, energy balance and obesity. Mol. Cell. Endocrinol. 2015, 418, 66–73. [Google Scholar] [CrossRef]
- Thisse, B.; Thisse, C. Functions and regulations of fibroblast growth factor signaling during embryonic development. Dev. Biol. 2005, 287, 390–402. [Google Scholar] [CrossRef] [PubMed]
- Böttcher, R.T.; Niehrs, C. Fibroblast Growth Factor Signaling during Early Vertebrate Development. Endocr. Rev. 2005, 26, 63–77. [Google Scholar] [CrossRef] [PubMed]
- Itoh, N.; Ornitz, D.M. Evolution of the Fgf and Fgfr gene families. Trends Genet. 2004, 20, 563–569. [Google Scholar] [CrossRef]
- Itoh, N.; Konishi, M.; Simmons, A.E.; Karimi, I.; Talwar, M.; Simmons, T.W.; Su, F.; Juarez, M.A.; Cooke, C.L.; LaPointe, L.; et al. The Zebrafish fgf Family. Zebrafish 2007, 4, 179–186. [Google Scholar] [CrossRef]
- Zhao, Y.; Zhang, J.; Sun, Z.; Tang, Y.; Wu, Y. Genome-Wide Identification and Analysis of the Polycomb Group Family in Medicago truncatula. Int. J. Mol. Sci. 2021, 22, 7537. [Google Scholar] [CrossRef]
- Jiang, L.; Zhang, S.; Dong, C.; Chen, B.; Feng, J.; Peng, W.; Mahboob, S.; Al-Ghanim, K.A.; Xu, P. Genome-wide identification, phylogeny, and expression of fibroblast growth genes in common carp. Gene 2016, 578, 225–231. [Google Scholar] [CrossRef]
- Itoh, N.; Ornitz, D. Functional evolutionary history of the mouseFgf gene family. Dev. Dyn. 2008, 237, 18–27. [Google Scholar] [CrossRef] [PubMed]
- Draper, B.W.; Stock, D.W.; Kimmel, C.B. Zebrafish fgf24 functions with fgf8 to promote posterior mesodermal development. Development 2003, 130, 4639–4654. [Google Scholar] [CrossRef]
- Popovici, C.; Roubin, R.; Coulier, F.; Birnbaum, D. An evolutionary history of the FGF superfamily. Bioessays 2005, 27, 849–857. [Google Scholar] [CrossRef]
- Coulier, F.; Pontarotti, P.; Roubin, R.; Hartung, H.; Goldfarb, M.; Birnbaum, D. Of Worms and Men: An Evolutionary Perspective on the Fibroblast Growth Factor (FGF) and FGF Receptor Families. J. Mol. Evol. 1997, 44, 43–56. [Google Scholar] [CrossRef]
- Oulion, S.; Bertrand, S.; Escriva, H. Evolution of the FGF Gene Family. Int. J. Evol. Biol. 2012, 2012, 298147. [Google Scholar] [CrossRef] [PubMed]
- Mohanta, T.K.; Khan, A.; Hashem, A.; Abd_Allah, E.F.; Al-Harrasi, A. The molecular mass and isoelectric point of plant proteomes. BMC Genom. 2019, 20, 631. [Google Scholar] [CrossRef]
- Hughes, A.L. The evolution of functionally novel proteins after gene duplication. Proc. R. Soc. B Boil. Sci. 1994, 256, 119–124. [Google Scholar] [CrossRef]
- Ornitz, D.M.; Itoh, N. Fibroblast growth factors. Genome Biol. 2001, 2, 1–7. [Google Scholar] [CrossRef] [PubMed]
- He, J.; Chen, D.L.; Samocha-Bonet, D.; Gillinder, K.; Barclay, J.; Magor, G.W.; Perkins, A.; Greenfield, J.; Yang, G.; Whitehead, J.P. Fibroblast growth factor-1 (FGF-1) promotes adipogenesis by downregulation of carboxypeptidase A4 (CPA4)—A negative regulator of adipogenesis implicated in the modulation of local and systemic insulin sensitivity. Growth Factors 2016, 34, 210–216. [Google Scholar] [CrossRef]
- Lu, G.-M.; Rong, Y.-X.; Liang, Z.-J.; Hunag, D.-L.; Wu, F.-X.; Ma, Y.-F.; Luo, Z.-Z.; Liu, X.-H.; Mo, S.; Li, H.-M. FGF2-induced PI3K/Akt signaling evokes greater proliferation and adipogenic differentiation of human adipose stem cells from breast than from abdomen or thigh. Aging 2020, 12, 14830–14848. [Google Scholar] [CrossRef]
- Xu, Q.; Lin, S.; Wang, Y.; Zhu, J.; Lin, Y. Fibroblast growth factor 10 (FGF10) promotes the adipogenesis of intramuscular preadipocytes in goat. Mol. Biol. Rep. 2018, 45, 1881–1888. [Google Scholar] [CrossRef] [PubMed]
- Price, C.A. Mechanisms of fibroblast growth factor signaling in the ovarian follicle. J. Endocrinol. 2016, 228, R31–R43. [Google Scholar] [CrossRef]
- Zhang, K.; Ealy, A. Disruption of fibroblast growth factor receptor signaling in bovine cumulus-oocyte complexes during in vitro maturation reduces subsequent embryonic development. Domest. Anim. Endocrinol. 2012, 42, 230–238. [Google Scholar] [CrossRef] [PubMed]
- Ornitz, D.M.; Xu, J.; Colvin, J.S.; McEwen, D.G.; MacArthur, C.A.; Coulier, F.; Gao, G.; Goldfarb, M. Receptor Specificity of the Fibroblast Growth Factor Family. J. Biol. Chem. 1996, 271, 15292–15297. [Google Scholar] [CrossRef]
- Zhang, X.; Ibrahimi, O.A.; Olsen, S.; Umemori, H.; Mohammadi, M.; Ornitz, D.M. Receptor Specificity of the Fibroblast Growth Factor Family: The Complete Mammalian FGF Family. J. Biol. Chem. 2006, 281, 15694–15700. [Google Scholar] [CrossRef]
- Shannon, P.; Markiel, A.; Ozier, O.; Baliga, N.S.; Wang, J.T.; Ramage, D.; Amin, N.; Schwikowski, B.; Ideker, T. Cytoscape: A software environment for integrated models of Biomolecular Interaction Networks. Genome Res. 2003, 13, 2498–2504. [Google Scholar] [CrossRef] [PubMed]
- Yu, P.; Wilhelm, K.; Dubrac, A.; Tung, J.K.; Alves, T.C.; Fang, J.S.; Xie, Y.; Zhu, J.; Chen, Z.; De Smet, F.; et al. FGF-dependent metabolic control of vascular development. Nature 2017, 545, 224–228. [Google Scholar] [CrossRef]
- Wang, C.; Dai, J.; Yang, M.; Deng, G.; Xu, S.; Jia, Y.; Boden, G.; Ma, Z.A.; Yang, G.; Li, L. Silencing of FGF-21 expression promotes hepatic gluconeogenesis and glycogenolysis by regulation of the STAT3-SOCS3 signal. FEBS J. 2014, 281, 2136–2147. [Google Scholar] [CrossRef]
- Zhang, M.; Zeng, L.; Wang, Y.-J.; An, Z.-M.; Ying, B.-W. Associations of Fibroblast Growth Factor 21 Gene 3′ Untranslated Region Single-Nucleotide Polymorphisms with Metabolic Syndrome, Obesity, and Diabetes in a Han Chinese Population. DNA Cell Biol. 2012, 31, 547–552. [Google Scholar] [CrossRef]
- Wang, S.; Cao, S.; Arhatte, M.; Li, D.; Shi, Y.; Kurz, S.; Hu, J.; Wang, L.; Shao, J.; Atzberger, A.; et al. Adipocyte Piezo1 mediates obesogenic adipogenesis through the FGF1/FGFR1 signaling pathway in mice. Nat. Commun. 2020, 11, 2303. [Google Scholar] [CrossRef]
- Johnson, L.S.; Eddy, S.R.; Portugaly, E. Hidden Markov model speed heuristic and iterative HMM search procedure. BMC Bioinform. 2010, 11, 431. [Google Scholar] [CrossRef] [PubMed]
- Altschul, S.F.; Gish, W.; Miller, W.; Myers, E.W.; Lipman, D.J. Basic local alignment search tool. J. Mol. Biol. 1990, 215, 403–410. [Google Scholar] [CrossRef] [PubMed]
- Lu, S.; Wang, J.; Chitsaz, F.; Derbyshire, M.K.; Geer, R.C.; Gonzales, N.R.; Gwadz, M.; Hurwitz, D.I.; Marchler, G.H.; Song, J.S.; et al. CDD/SPARCLE: The conserved domain database in 2020. Nucleic Acids Res. 2020, 48, D265–D268. [Google Scholar] [CrossRef] [PubMed]
- Artimo, P.; Jonnalagedda, M.; Arnold, K.; Baratin, D.; Csardi, G.; de Castro, E.; Duvaud, S.; Flegel, V.; Fortier, A.; Gasteiger, E.; et al. ExPASy: SIB bioinformatics resource portal. Nucleic Acids Res. 2012, 40, W597–W603. [Google Scholar] [CrossRef] [PubMed]
- Kumar, S.; Stecher, G.; Tamura, K. MEGA7: Molecular Evolutionary Genetics Analysis Version 7.0 for Bigger Datasets. Mol. Biol. Evol. 2016, 33, 1870–1874. [Google Scholar] [CrossRef] [PubMed]
- Wei, K.-F.; Chen, J.; Chen, Y.-F.; Wu, L.-J.; Xie, D.-X. Molecular Phylogenetic and Expression Analysis of the Complete WRKY Transcription Factor Family in Maize. DNA Res. 2012, 19, 153–164. [Google Scholar] [CrossRef]
- Pan, C.; Lei, Z.; Wang, S.; Wang, X.; Wei, D.; Cai, X.; Luoreng, Z.; Wang, L.; Ma, Y. Genome-wide identification of cyclin-dependent kinase (CDK) genes affecting adipocyte differentiation in cattle. BMC Genom. 2021, 22, 532. [Google Scholar] [CrossRef]
- Bailey, T.L.; Johnson, J.; Grant, C.E.; Noble, W.S. The MEME Suite. Nucleic Acids Res. 2015, 43, W39–W49. [Google Scholar] [CrossRef]
- Chen, C.J.; Chen, H.; Zhang, Y.; Thomas, H.R.; Frank, M.H.; He, Y.H.; Xia, R. TBtools: An Integrative Toolkit Developed for Interactive Analyses of Big Biological Data. Mol. Plant 2020, 13, 1194–1202. [Google Scholar] [CrossRef]
- Wang, Y.; Tang, H.; DeBarry, J.D.; Tan, X.; Li, J.; Wang, X.; Lee, T.-H.; Jin, H.; Marler, B.; Guo, H.; et al. MCScanX: A toolkit for detection and evolutionary analysis of gene synteny and collinearity. Nucleic Acids Res. 2012, 40, e49. [Google Scholar] [CrossRef]
- Huang, J.; Zheng, Q.; Wang, S.; Wei, X.; Li, F.; Ma, Y. High-Throughput RNA Sequencing Reveals NDUFC2-AS lncRNA Promotes Adipogenic Differentiation in Chinese Buffalo (Bubalus bubalis L.). Genes 2019, 10, 689. [Google Scholar] [CrossRef] [PubMed]
- Wang, Y.; Goulart, R.A.; Pantanowitz, L. Oil red O staining in cytopathology. Diagn. Cytopathol. 2011, 39, 272–273. [Google Scholar] [CrossRef] [PubMed]
- Adnan, M.; Morton, G.; Hadi, S. Analysis of rpoS and bolA gene expression under various stress-induced environments in planktonic and biofilm phase using 2−ΔΔCT method. Mol. Cell. Biochem. 2011, 357, 275–282. [Google Scholar] [CrossRef] [PubMed]
- Arocho, A.; Chen, B.; Ladanyi, M.; Pan, Q. Validation of the 2-−ΔΔCt Calculation as an Alternate Method of Data Analysis for Quantitative PCR of BCR-ABL P210 Transcripts. Diagn. Mol. Pathol. 2006, 15, 56–61. [Google Scholar] [CrossRef]
Disclaimer/Publisher’s Note: The statements, opinions and data contained in all publications are solely those of the individual author(s) and contributor(s) and not of MDPI and/or the editor(s). MDPI and/or the editor(s) disclaim responsibility for any injury to people or property resulting from any ideas, methods, instructions or products referred to in the content. |
© 2023 by the authors. Licensee MDPI, Basel, Switzerland. This article is an open access article distributed under the terms and conditions of the Creative Commons Attribution (CC BY) license (https://creativecommons.org/licenses/by/4.0/).