Article

Short-Term Decreasing and Increasing Dietary BCAA Have Similar, but Not Identical Effects on Lipid and Glucose Metabolism in Lean Mice

College of Animal Science and Technology, Northeast Agricultural University, Harbin 150030, China
*
Author to whom correspondence should be addressed.
Int. J. Mol. Sci. 2023, 24(6), 5401; https://doi.org/10.3390/ijms24065401
Submission received: 9 December 2022 / Revised: 31 December 2022 / Accepted: 5 February 2023 / Published: 11 March 2023
(This article belongs to the Section Molecular Endocrinology and Metabolism)

Abstract

:
Branched-chain amino acids (BCAA) showed multiple functions in glycolipid metabolism and protein synthesis. However, the impacts on the metabolic health of low or high dietary BCAA remain controversial due to the various experimental conditions. Gradient levels of BCAA were supplemented in lean mice for four weeks: 0BCAA (without BCAA), 1/2BCAA (half BCAA), 1BCAA (regular BCAA), and 2BCAA (double BCAA). The results showed that the diet without BCAA caused energy metabolic disorders, immune defects, weight loss, hyperinsulinemia, and hyperleptinemia. 1/2BCAA and 2BCAA diets reduced body fat percentage, but 1/2 BCAA also decreased muscle mass. 1/2BCAA and 2BCAA groups improved lipid and glucose metabolism by affecting metabolic genes. Meanwhile, significant differences between low and high dietary BCAA were observed. The results of this study provide evidence and reference for the controversy about dietary BCAA levels, which indicates that the main difference between low and high BCAA dietary levels may present in the longer term.

1. Introduction

Obesity is a growing threat to human health worldwide, leading to severe metabolic complications, including diabetes mellitus, insulin and leptin resistance, and other metabolic disorders. A primary cause of obesity is improper food consumption, specifically of diets with high fat (HFD) [1]. Therefore, dietary intervention is an effective means to prohibit obesity.
Amino acids (AAs), as critical nutritive substances in diets, can not only play a vital role in nutrition, but also exhibit various functions in immuno-stimulation, metabolism, or physiology. The proposal and application of the concept of functional amino acids have been proven effective in mitigating diseases impairing animal health [2]. For instance, dietary threonine supplementation notably reduces fat mass, improves insulin resistance, and facilitates lipid metabolic health in obese mice [3]. The increased dietary intake of aromatic amino acids (phenylalanine, tryptophan, and tyrosine) improved lipid metabolism and insulin tolerance by stimulating bile acid synthesis [4]. Moreover, leucine (Leu), isoleucine (Ile), and valine (Val), which are called branched-chain amino acids (BCAAs), are always research hot spots because of their association with type 2 diabetes, insulin resistance, and obesity [5,6]. Substantial evidence indicates that dietary BCAA supplementation can improve muscle development, insulin sensitivity, and lipid accumulation in high-fat, diet-induced, obese (DIO) mice [7,8,9].
However, the notion that BCAA supplementation could be positive for lipid metabolism or insulin function remains controversial [10]. Reduced consumption of BCAAs effectively antagonized obesity and insulin resistance [11]. A recent report showed that the adverse metabolic effects in lean mice were induced by Ile and Val, not Leu [12]. Yet, our previous study demonstrated that elevated dietary Leu, rather than Ile and Val, worsen the lipid metabolism in lean mice [13]. These results are affected by various experimental conditions, such as the mouse model, diet composition, or the duration of the test. Thus, more evidence is needed to verify the effects of dietary BCAA regulation under different conditions.
In this study, we explore the effect of four different dietary BCAA levels (without, low, regular, and high BCAA levels included) by purified diet on lipid and glucose metabolism in normal lean mice under the same conditions. The total BCAA deprivation experiment was designed to indirectly investigate the role of BCAAs in body development, which was also a preliminary study for the following individual BCAA-removed trials.

2. Results

2.1. Different Dietary BCAA Levels Influenced the Ratio of Muscle and WAT in Lean Mice

Lean mice were provided diets with four different BCAA levels for four weeks (Figure 1A). There were no significant differences in body weight among the 1/2BCAA, 1BCAA, and 2BCAA groups. Completely removing dietary BCAA significantly reduced body weight during the experimental period (Figure 1B). However, no marked difference in the average daily feed intake among the four groups was observed (Figure 1C). At the end of the fourth week, liver histopathological observation and relative liver weight showed no significant difference among experiment groups with different dietary BCAA levels (Figure 1D,E). The diet without BCAA significantly decreased the relative organ weight of the spleen, gastrocnemius muscle, and WAT, and increased the relative kidney weight. We also observed a lower relative weight of WAT in the 1/2BCAA group compared with the 1BCAA and 2BCAA groups, a lower relative weight of gastrocnemius muscle and a higher relative weight of BAT in 1/2BCAA and 2BCAA groups compared with 1BCAA group (Figure 1E). Half or doubled dietary BCAA levels showed the same trend in WAT and BAT.

2.2. Complete Deprivation of Dietary BCAA Impaired Glucose Homeostasis

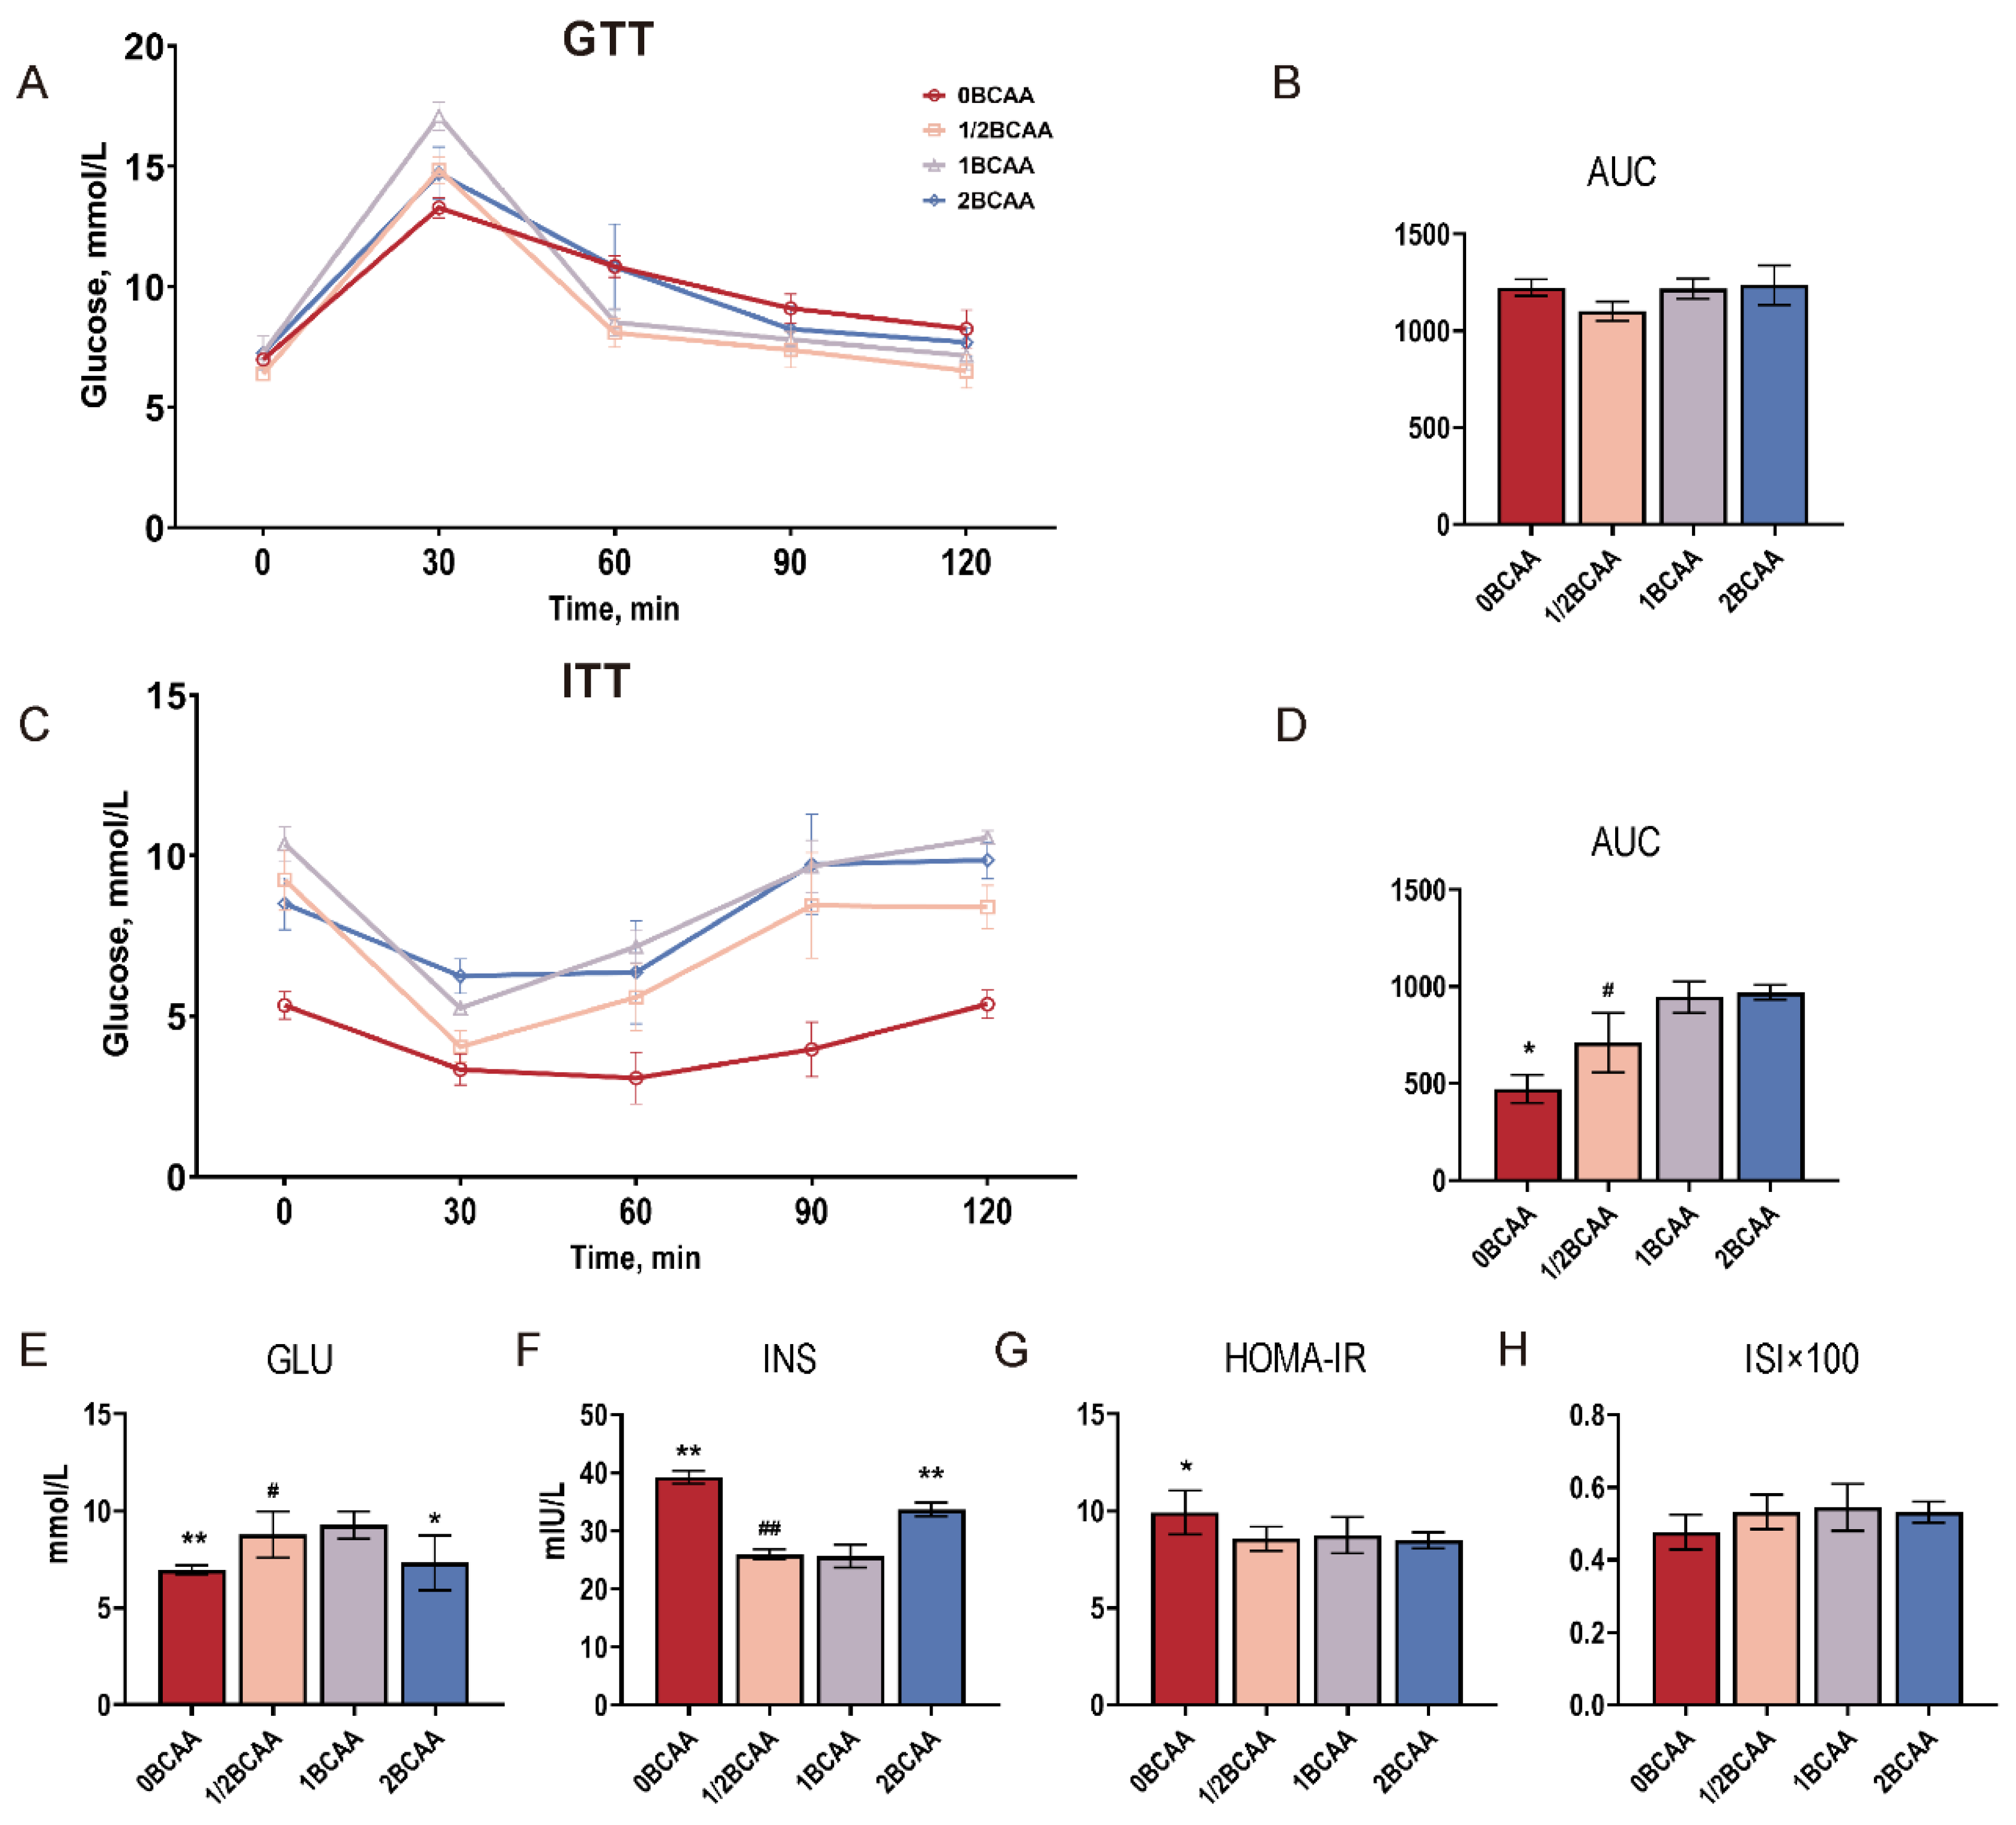
Different levels of BCAA had no significant effect on glucose homeostasis in lean mice (Figure 2A,B). However, non-BCAA and low-BCAA diets decreased the area under the curve (AUC) of ITT (Figure 2C,D). BCAA removal reduced the GLU level and increased the serum insulin level, thus inducing a poor performance in HOMA-IR (Figure 2E–G). The 2BCAA group had a lower GLU level and higher insulin level in the serum compared with the 1/2BCAA and 1BCAA groups, which did not affect the HOMA-IR and ISI (Figure 2E–H).

2.3. Different Dietary BCAA Levels Altered the Serum Indexes in Lean Mice

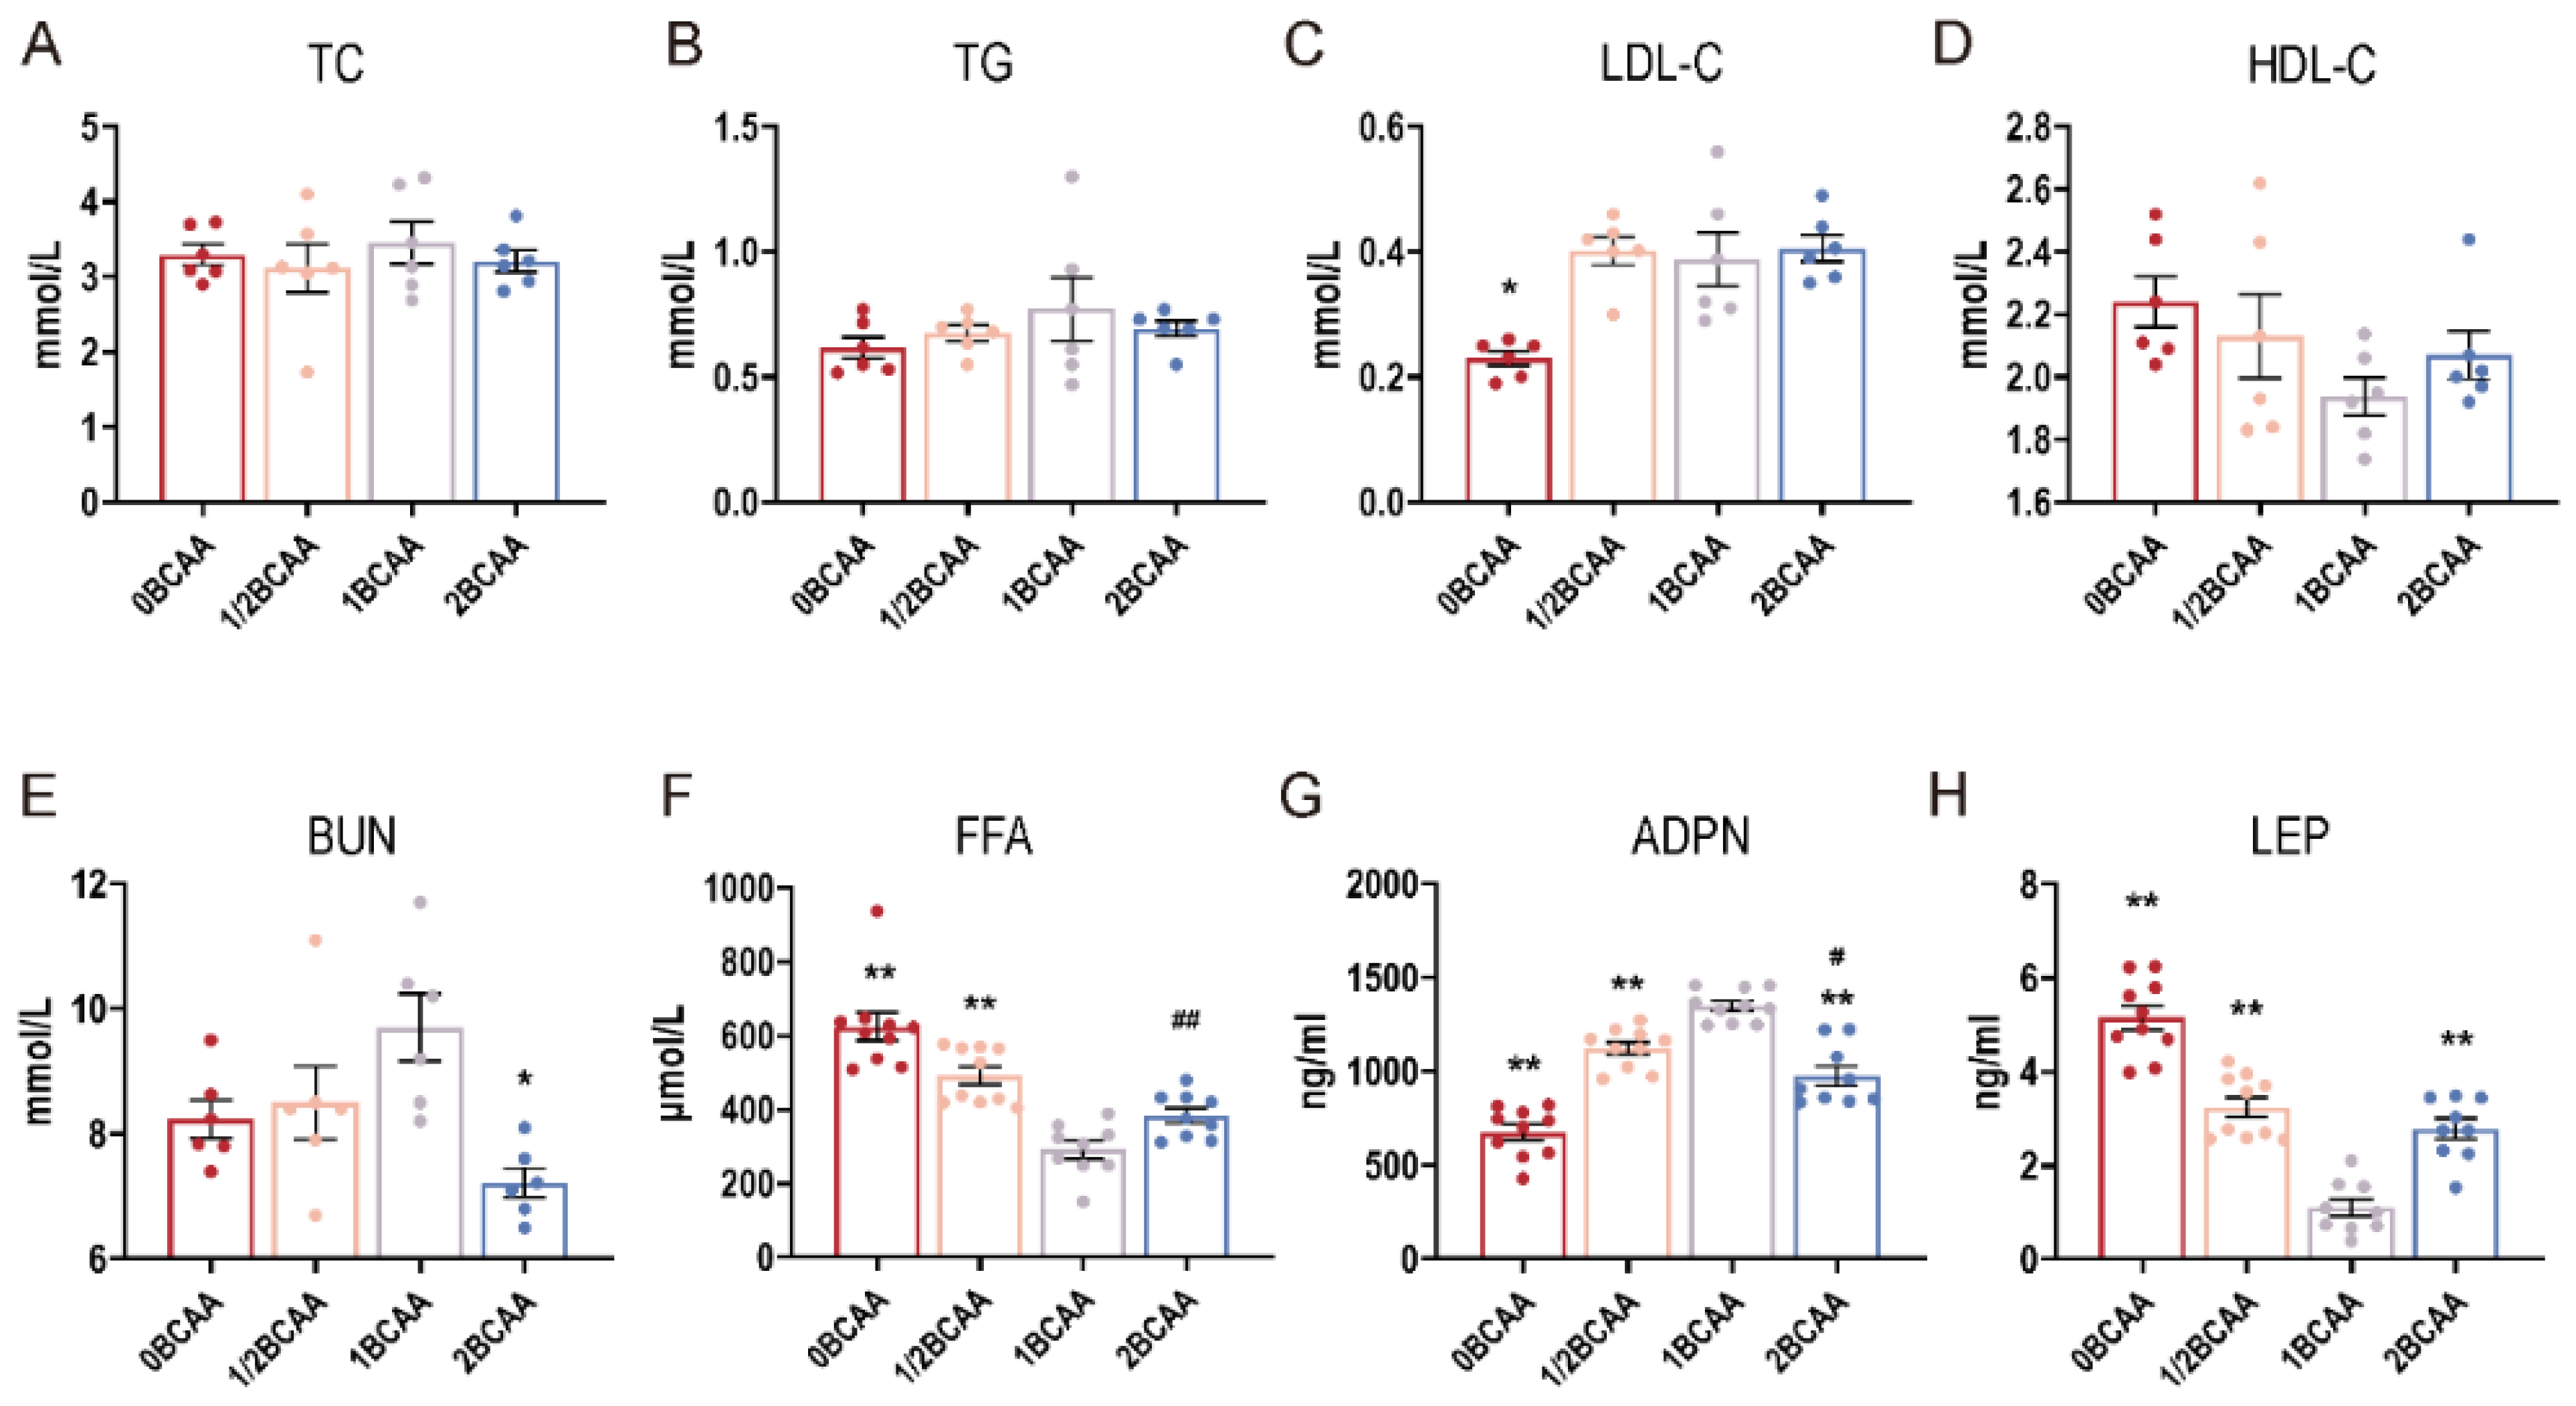
Different dietary BCAA levels had no significant influence on serum TC, TG, and HDL-C in lean mice (Figure 3). Mice fed with a diet without BCAA had a lower LDL-C and ADPN, and higher FFA and LEP in the serum compared with the control group. Half the dietary BCAA level elevated FFA, ADPN, and LEP serum levels. Compared with the 1BCAA group, a 2BCAA diet decreased BUN and ADPN levels and increased LEP level. Besides, the FFA and ADPN levels in the 1/2BCAA group were superior to those in the 2BCAA group.

2.4. Different Dietary BCAA Levels Have Different Effects on Metabolic Genes

To further determine the variations in transcriptome among groups with different dietary BCAA levels, transcriptome analyses were performed. The volcano plot showed differentially expressed genes in the liver of mice (Figure S1A). As shown in the violin plot, there was no distinct difference in the abundance of differentially expressed genes (DEGs) in different treatments (Figure S1B). The heatmap and hierarchical clusters analysis (Figure S1C) highlighted significant differences in the expression levels of the top 50 DEGs among the four groups. The counts of DEGs in 0BCAA vs. 1BCAA (455 up-regulated genes and 1127 down-regulated genes), 1/2BCAA vs. 1BCAA (175 up-regulated genes and 188 down-regulated genes), 2BCAA vs. 1BCAA (327 up-regulated genes and 107 down-regulated genes), and 1/2BCAA vs. 2BCAA (63 up-regulated genes and 203 down-regulated genes) were demonstrated (Figure S1D).
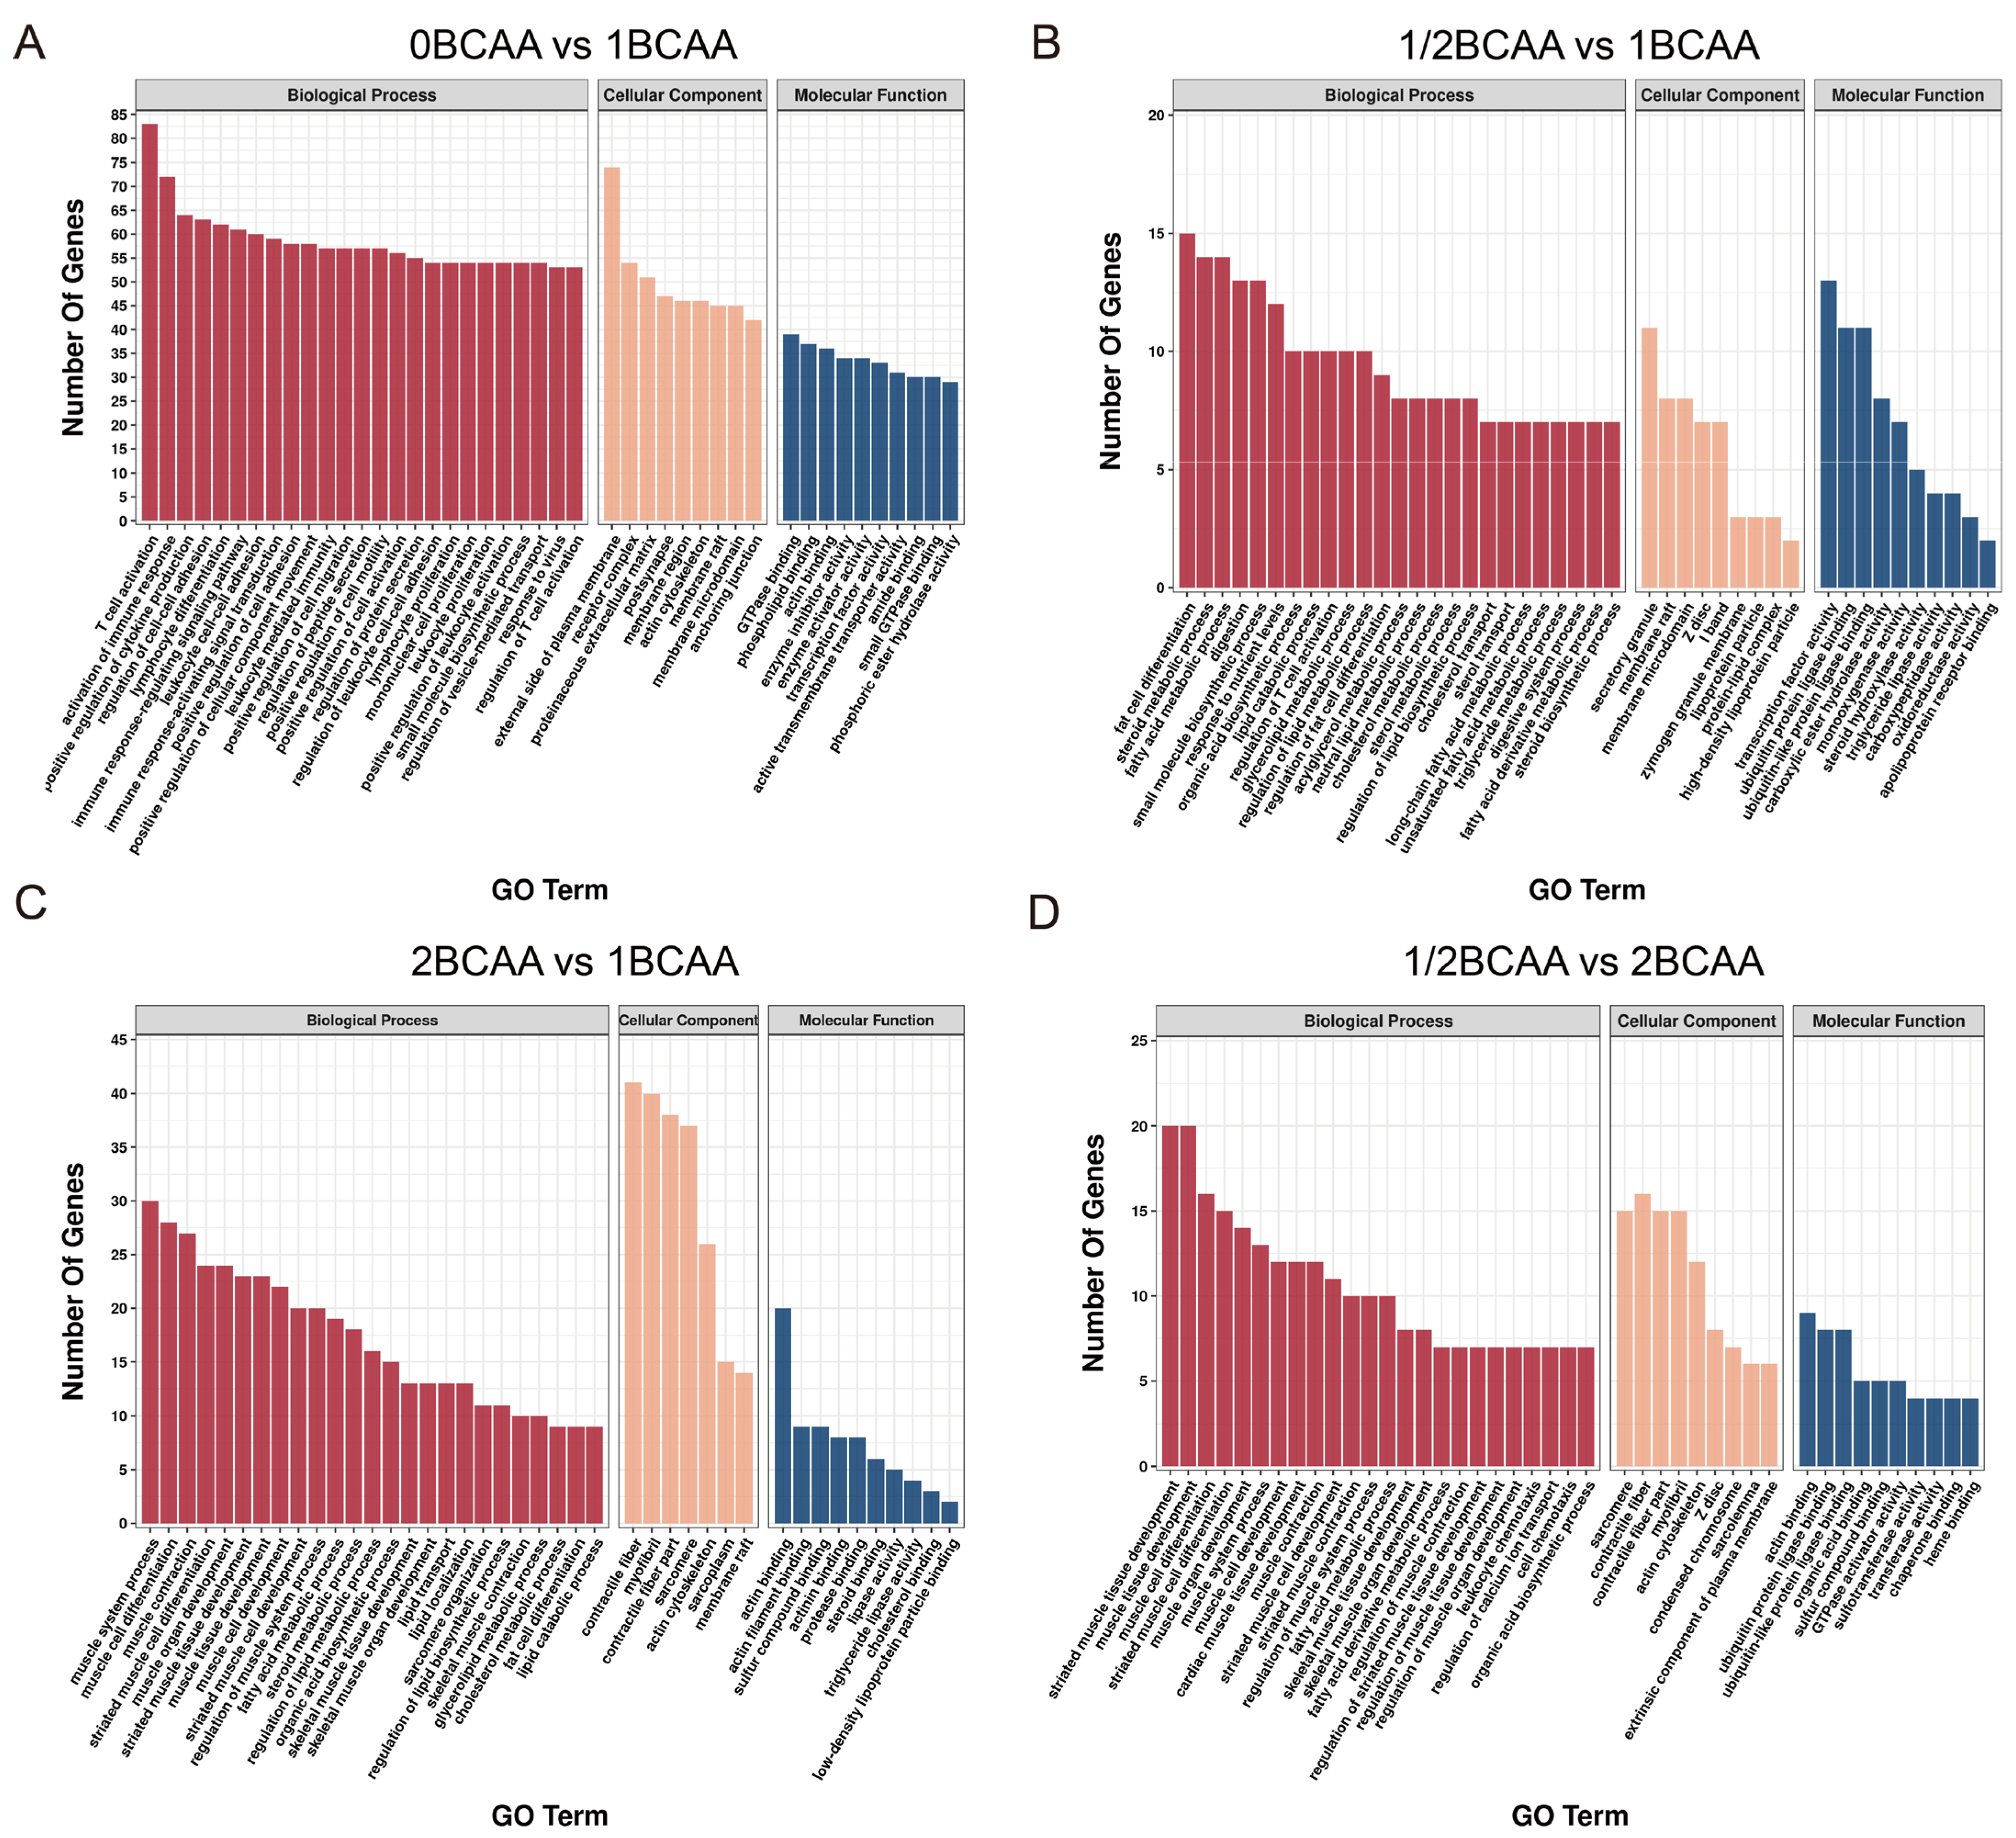
GO functional enrichment analysis was performed to investigate the potential functions of the DEGs (Figure 4). Enriched GO terms targeted by DEGs between 0BCAA and 1BCAA were mainly related to an immune function and inflammation. Insulin secretion and response to insulin were also significantly enriched. Besides, terms related to lipid metabolism, carbohydrate metabolism, and muscle development were markedly enriched among 1/2BCAA, 1BCAA, and 2BCAA groups: “fat cell differentiation”, “fatty acid metabolic process”, “lipid catabolic process”, “cholesterol transport”, “skeletal system development”, “muscle tissue development”, “glycogen (starch) synthase activity”, and so on.
KEGG enrichment analysis revealed that dietary BCAA levels could influence the pathways involved in lipid, carbohydrate, protein, and insulin metabolism (Figure 5), including “fatty acid metabolism”, “fat digestion and absorption”, “cholesterol metabolism”, “bile secretion”, “starch and sucrose metabolism”, “carbohydrate digestion and absorption”, “protein digestion and absorption”, “PPAR signaling pathway”, “pancreatic secretion”, “insulin signaling pathway”, and “insulin resistance”.
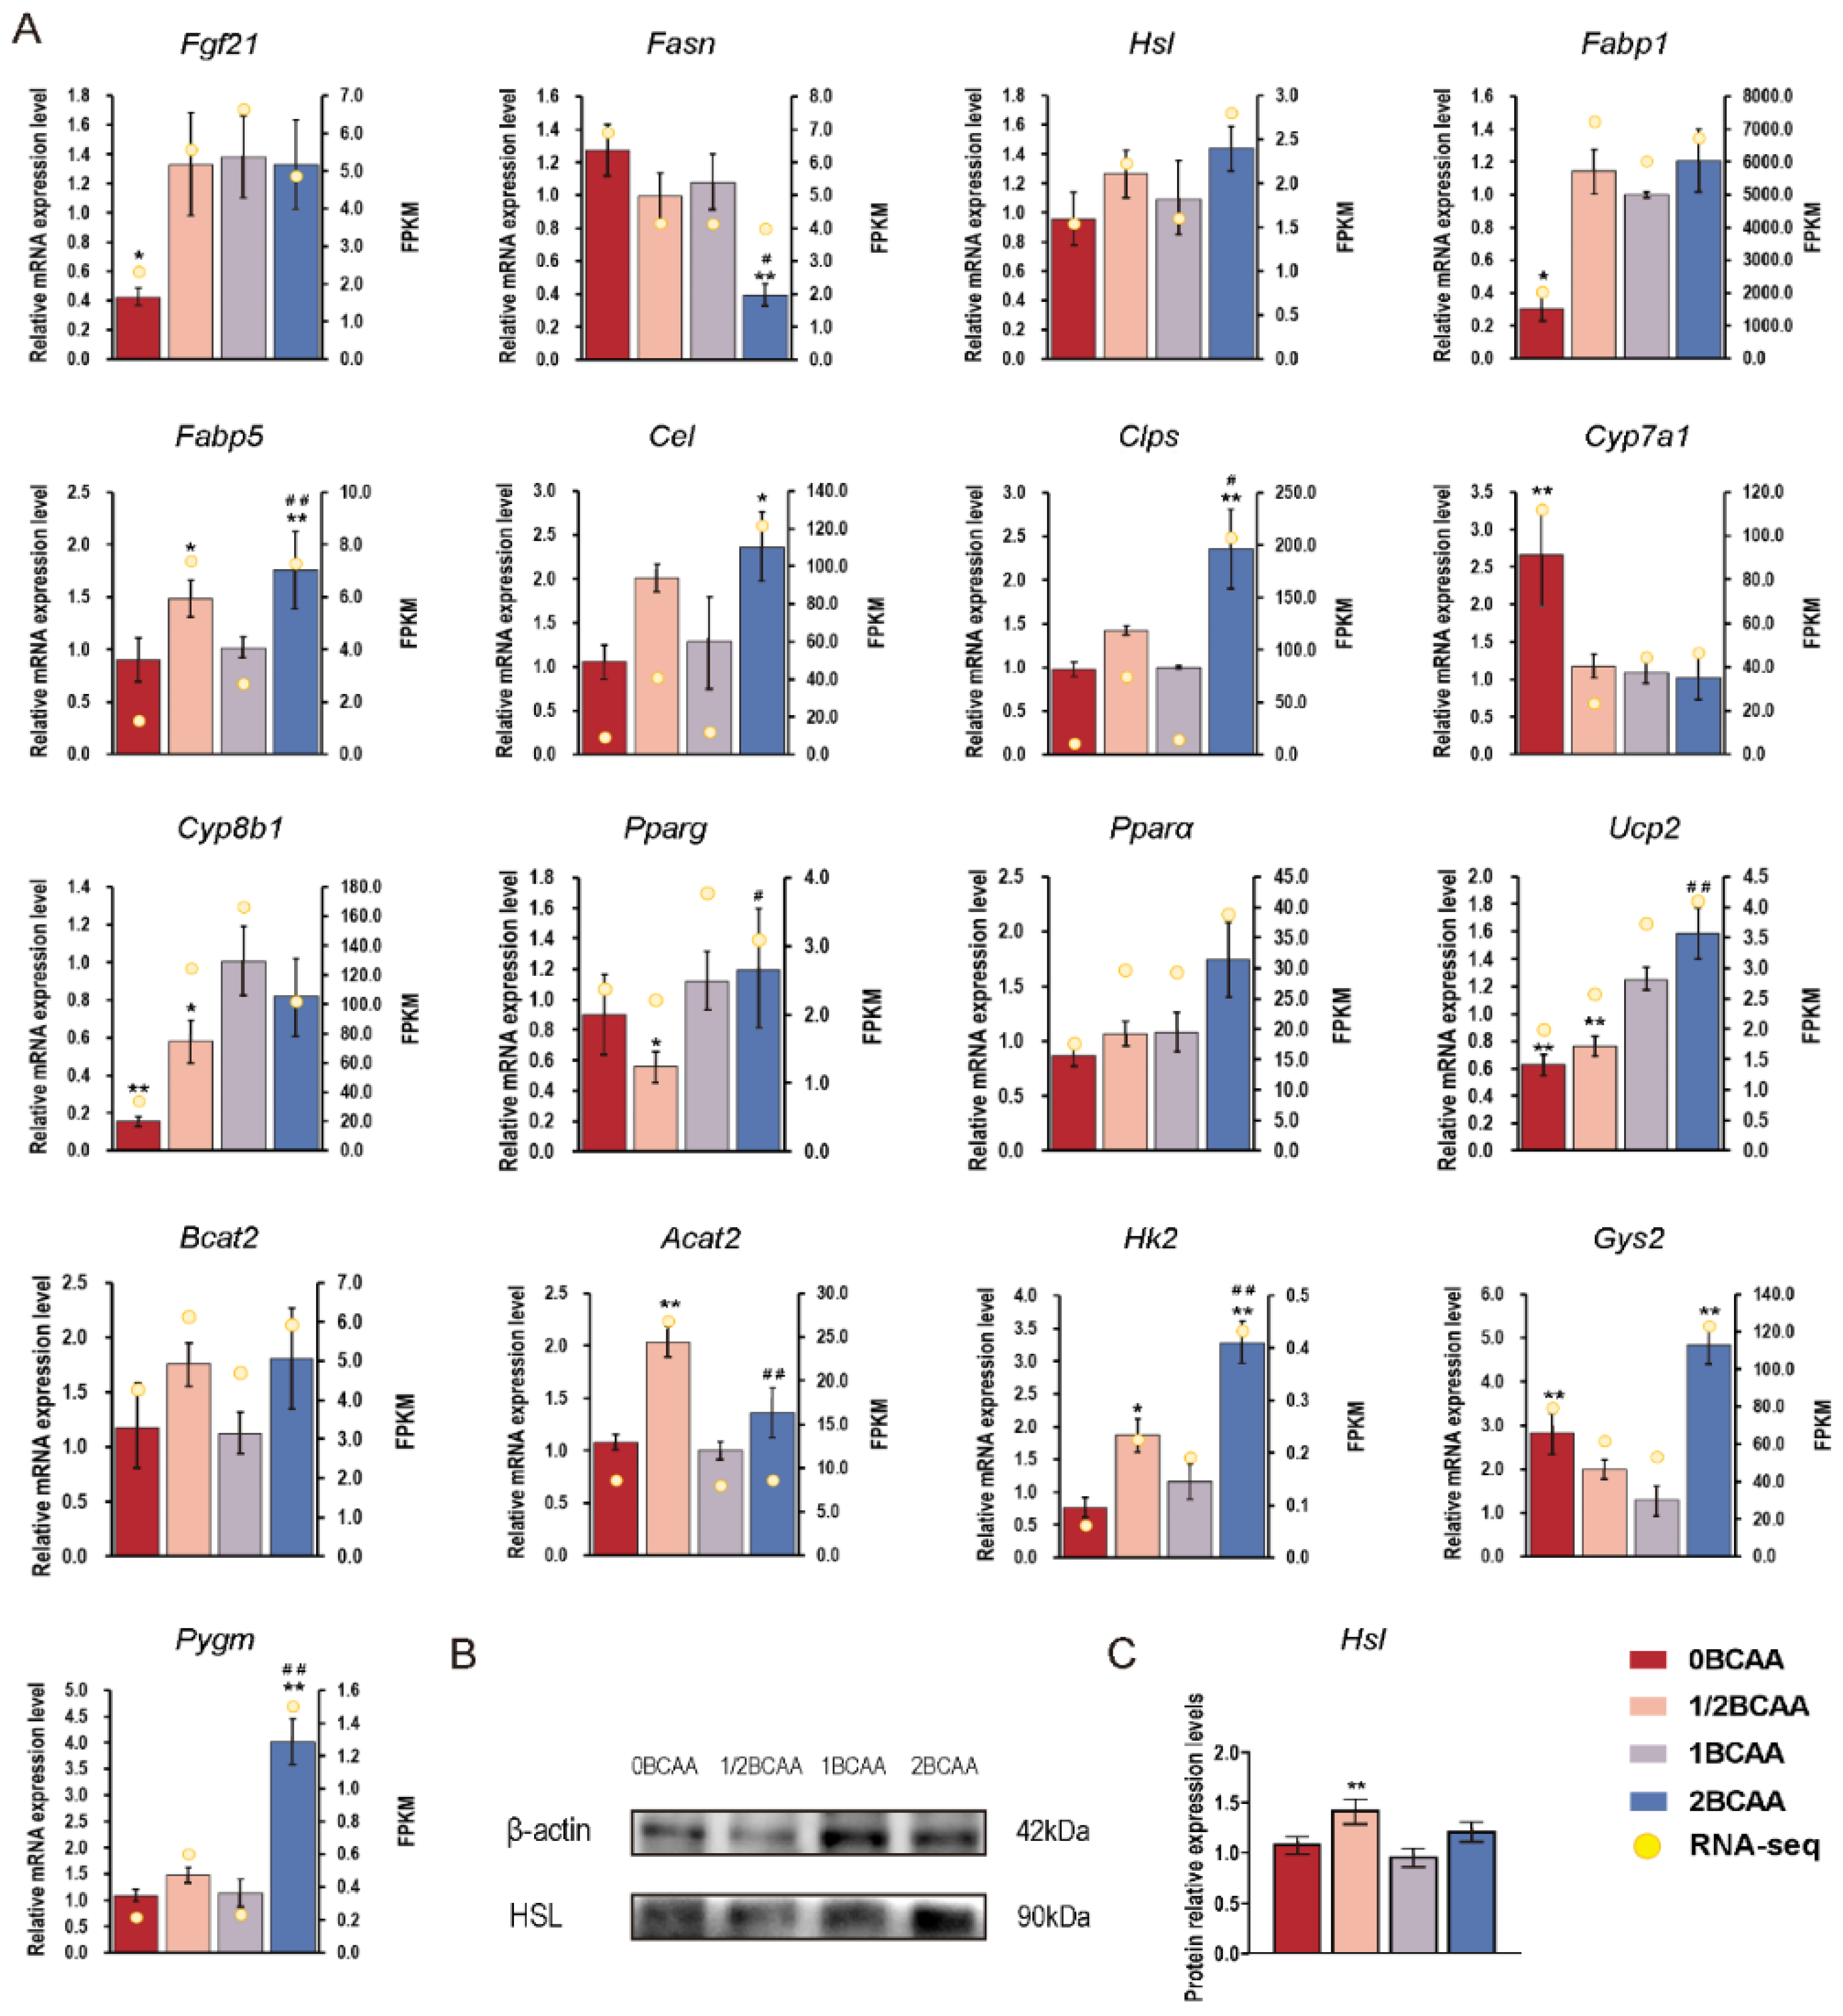
Seventeen genes related to lipid and glucose metabolism affected by different BCAA levels were selected for validation through real-time PCR (Table 1). The results of real-time PCR validation are shown in Figure 6A, consistent with the transcriptomic analyses, which proved that the results from transcriptomic analyses can be trusted. The secondary verification was performed by western blot, and the relative protein expression of HSL agreed with the data in the study (Figure 6B,C).

3. Discussion

Our previous studies demonstrated that BCAAs had different impacts on lipid metabolism in mice under different conditions (lean or obese) [9,13], which was also proved by other researchers [12]. However, the results from these trials always had more or less differences. The never-ceased controversies highlight the importance of test conditions. In this study, the effects of 1/2BCAA and 2BCAA levels on lipid and glucose metabolism in lean mice are considered favorable, but achieved through different mechanisms. Meanwhile, the deprivation of total BCAA caused severe immune and metabolic defects. Furthermore, almost no significant linear regression relationship between dietary levels and each physiological change was observed.
Mice without BCAA intake kept losing weight during the whole group, showing the importance of BCAAs in body development. Meanwhile, the feed intake in the 0BCAA group was as much as the other groups, suggesting their collapsed energy metabolism. The nutritional and metabolic block forced the undernourished mice to break down fats and muscle to meet the energy requirement, which caused the relative decrease in muscle weight, WAT weight, and serum glucose levels, and increased serum FFA. The decreased relative spleen weight after BCAA deprivation may be the main sign of health problems. Transcriptome analysis also indicated that the diet without BCAA triggered marked suppression of the immune system. The present results are not surprising because the deficiency of essential amino acids results in impaired metabolism and immune function [14]. However, researchers paid little attention to the impact of BCAAs on immune resistance. When dealing with diabetes or obesity through dietary BCAA intervention, the immune affections of BCAAs should be considered together.
Lipid accumulation is an obvious sign of obesity development, which is also the direct reflection of BCAAs affecting lipid metabolism. Previous studies demonstrated that BCAA supplementation maintained muscle mass and inhibited obesity development in mice [7,15,16,17]. However, it has been reported that reducing BCAA consumption decreased WAT and muscle mass [11,12]. No changes in body weight and body composition were observed when intervening with leucine [18]. We observed that 1/2BCAA and 2BCAA dietary levels both reduced relative WAT weight and increased relative BAT weight in lean mice. In addition, the reduced muscle percentage in the 1/2BCAA group confirmed that BCAA promotes muscle development and suppresses muscle loss [19]. Leptin has an anti-obesity effect that decreases adiposity but maintains muscle mass [20,21]. Serum leptin levels elevated by 1/2BCAA and 2BCAA diets were perhaps a reason for the WAT loss. In addition, BAT is a thermogenic organ that enhances fat consumption and regulates BCAA catabolism [22]. Meanwhile, branched-chain aminotransferase (Bcat2), the rate-limiting BCAA catabolic enzyme, was up-regulated in both 1/2BCAA and 2BCAA groups. The reason could be that both lowering and heightening dietary levels activated BCAA catabolism in healthy mice. Moreover, few genes related to the browning of WAT in lean mice were affected by different dietary BCAA levels.
Insulin resistance is closely related to the incidence of type 2 diabetes. Supplementation of dietary BCAAs could moderately weaken the insulin sensitivity and metabolic efficiency of the mice but cannot induce insulin resistance [23,24]. We found that halving and doubling dietary BCAA levels did not influence glucose homeostasis in healthy lean mice, but high BCAA level showed the facilitation effect of BCAAs on insulin secretion [25]. Complete deprivation of BCAAs leads to hyperinsulinemia, hyperleptinemia, and higher HOMA-IR, which may not mean insulin resistance or leptin resistance, but because of the abnormal health and metabolism status in mice from the 0BCAA group. Still, hyperinsulinemia and hyperleptinemia were undoubtedly involved in the physical degeneration in the 0BCAA group.
Different BCAA levels changed genes associated with lipid and glucose metabolism differently. Fibroblast growth factor 21 (Fgf21) promotes lipid metabolism, hepatic gluconeogenesis and insulin sensitivity without affecting hepatic glycogen breakdown [26,27,28]. Additionally, Fgf21 needs to take effect with enough adipose tissue as an indispensable mediator [29], which explains the low Fgf21 level in the 0BCAA group. However, Fgf21 in the 1/2BCAA and 2BCAA groups was not significantly affected, assuming Fgf21 may not be the most critical signaling pathway in the liver when facing BCAA treatment. Fatty acid synthase (Fasn) is a complex multifunctional enzyme that plays an essential role in the synthesis of fatty acids, which was only suppressed in the 2BCAA group, but not the 1/2BCAA group. The unique up-regulation of peroxisome proliferator-activated receptor alpha (Pparα), and uncoupling protein 2 (Ucp2) that regulates lipid metabolism, proved the positive effects of high BCAA levels. Nevertheless, the increased expression level of the Pparα–Fabp1 axis was always found in DIO mice, and the suppression of the Pparα–Fabp1 axis was considered as a treatment for nonalcoholic steatohepatitis [30], suggesting the potential threat of a high-BCAA diet. Carboxyl ester lipase (Cel) and colipase (Clps) control the hydrolysis and absorption of lipids, which were down-regulated in DIO mice [31] and up-regulated by increasing dietary BCAA levels in lean mice. Additionally, high dietary BCAA levels stimulated glycogen metabolism by enhancing glycogenesis (glycogen synthase 2, Gys2 [32]) and glycogenolysis (hexokinase 2, Hk2 [33]; muscle glycogen phosphorylase, Pygm [34]). Intriguingly, though the improvement of half-dietary BCAAs on genes involved in lipid and glucose metabolism is not as significant as that in the 2BCAA group, the 1/2BCAA group significantly ameliorated insulin sensitivity. The loss of cytochrome P450 family 8 subfamily B member 1 (Cyp8b1) was proved to improve glucose homeostasis [35], and the up-regulation of Acat2 could reduce toxic polar lipids and improve insulin sensitivity [36], which may explain the better glucose homeostasis in many studies when reducing dietary BCAA levels. Taken together, the difference in gene expression between the 1/2BCAA and 2BCAA groups may be the key to clarifying the mechanism when using dietary BCAA intervention. These differences may be enlarged after four weeks and perhaps reverse their advantages in metabolism, which warrants further studies.
In summary, complete deprivation of BCAAs resulted in metabolic disorders and finally caused the development of weight loss, hyperinsulinemia, and hyperleptinemia in lean mice within four weeks. Increasing and decreasing dietary BCAA levels reduced the body fat rate, but only maintained muscle mass in mice through the high BCAA diet. Further, doubled and half dietary BCAA levels improved metabolic status via regulating lipid and glucose metabolism-related genes. The differences between the 1/2BCAA and 2BCAA groups may provide references for the controversy about BCAA intervention. At least in the present study, low and high BCAA levels in the diet achieved favorable effects on metabolic health in lean mice before the fourth week. Further research is needed to determine the impact of single BCAA removal or long-term BCAA regulation.

4. Materials and Methods

4.1. Animals and Diets

The study was approved by Northeast Agricultural University Animal Science Research Ethics Committee (NEAU-[2011]-9) (Approval Code: NEAUEC20200202; Approval Date: 3 April 2020). All mice were purchased from HFK Biotechnology Co., Ltd. (Beijing, China) and housed in a temperature-controlled (22 ± 2 °C) and humidity-controlled (55 ± 5%) environment, on a 12 h light/dark cycle with free access to food and water. Before the beginning of the experiment, a total of 60 eight-week-old male C57BL/6J mice were acclimated to a control diet (amino acid-customized diet) for 7 days and then randomly divided into following diets for 4 weeks: 0BCAA (without BCAA), 1/2BCAA (half the normal BCAA level), 1BCAA (normal BCAA level, control group), and 2BCAA (twice the normal BCAA level). Mice selected for each group have a similar average initial body weight. Body weight and food intake were recorded weekly. To formulate isonitrogenous and isoenergetic diets, and minimize the interference of other amino acids, dietary nitrogen was balanced by proportionally supplementing amino acid mixtures, except for BCAAs (Table 2).

4.2. Glucose Tolerance Test (GTT) and Insulin Tolerance Test (ITT)

In the third week, the glucose tolerance test (GTT) and insulin tolerance test (ITT) were performed following an intraperitoneal glucose (2 g/kg) and insulin injections (0.75 units/kg) after 12 h or 6 h starvation of the mice, respectively. Blood samples were collected from the tail vein at 0, 15, 30, 60 and 120 min after the injection, and glucose levels were measured with a glucose meter (Roche Diagnostics, Shanghai, China). The fasting serum glucose levels were determined by a colorimetric assay (Nanjing Jiancheng Bioengineering Institute, Nanjing, China), and insulin levels were assessed using a commercial ELISA kit (Nanjing Jiancheng Bioengineering Institute, Nanjing, China), according to the manufacturer’s instructions. The status of insulin resistance was applied by a homeostasis model assessment of insulin resistance (HOMA-IR) and the improved insulin sensitivity index (ISI). The HOMA-IR index was calculated using the following formula: HOMA-IR = [fasting glucose levels (mmol/L)] × [fasting serum insulin (mU/L)]/22.5. The ISI × 100 index was calculated using the following formula: ISI × 100 = 1/[fasting glucose levels (mmol/L)] × [fasting serum insulin (mU/L)] × 100.

4.3. Sample Collection

At the end of the experiment, the mice were deprived of food overnight. Blood samples were obtained from the orbital vein in mice anesthetized with ether. Blood was centrifuged at 3000× g for 15 min at 4 °C, to collect serum that was stored at −80 °C until use. The mice were sacrificed by neck breaking. The liver, spleen, kidney, white adipose tissue (WAT), brown adipose tissue (BAT), and gastrocnemius muscle were quickly removed, weighed and immediately frozen in liquid nitrogen and stored at −80 °C until analysis.

4.4. Histological Analysis

Histological analysis of the liver in mice was carried out with the H&E staining method [9]. The liver fragments fixed in 4% paraformaldehyde buffer were dehydrated and embedded in paraffin to produce random 6 μm thick cuts and stained with hematoxylin and eosin for visualization through an Olympus microscope (Tokyo, Japan).

4.5. Serum Parameter Determination

Serum levels of triglycerides (TG), total cholesterol (TC), high-density lipoprotein cholesterol (HDL-C), low-density lipoprotein cholesterol (LDL-C), glucose, free fatty acids (FFA), and blood urea nitrogen (BUN) were determined by enzymatic methods, using commercial diagnostics kits (Nanjing Jiancheng Bioengineering Institute, Nanjing, China). The adiponectin (ADPN) and leptin (LEP) levels were assessed using a commercial ELISA kit (Nanjing Jiancheng Bioengineering Institute, Nanjing, China).

4.6. Transcriptomic Analysis and Data Processing

The total RNA samples isolated from experimental groups were subjected to gene expression analysis. The Qubit®RNA Assay Kit in Qubit®2.0 Flurometer (Life Technologies, Carlsbad, CA, USA) was used to measure the RNA concentration, the RNA Nano 6000Assay Kit of the Bioanalyzer 2100 system (Agilent Technologies, Santa Clara, CA, USA) was used to assess RNA integrity. The sequencing libraries were generated using NEBNext®UltraTMRNA Library Prep Kit for Illumina® (NEB, Ipswich, MA, USA), following the manufacturer’s recommendations, and index codes were added to attribute the sequences to each sample. Then, mRNA was purified, and its purity was re-assessed using poly-oligo-attached magnetic beads. A stringent significance threshold (p-value < 0.05) was used to limit the false-positive findings, and the fold change ≥1 was chosen to screen a manageable number of genes. The Gene Ontology (GO) Database was used to detect the significant function of differentially expressed genes (DEG) from the level of biological process (BP), cellular component (CC) and molecular function (MF). The canonical pathways of DEGs were analyzed using the Kyoto Encyclopedia of Genes and Genomes (KEGG) database.

4.7. Quantitative Real-Time PCR Analysis

The total RNA of liver tissue samples was extracted using the Trizol reagent (TaKaRa, Dalian, China). Before cDNA synthesis, the purity and concentration of RNA were evaluated by absorbance at 260/280 nm. The cDNA was obtained by reverse transcription using PrimeScriptTM RT kit (Takara, Dalian, China). Quantitative real-time PCR was performed using an SYBR Premix Ex TaqTM Kit (Takara, Dalian, China) on an ABI 7500 Fast Real-Time PCR System (Applied Biosystems, Bedford, MA, USA). Calculations were performed using a comparative method (2−ΔΔCt), and β-actin was used as the internal control. The sequences of primers for the PCR are shown in Table 3.

4.8. Western Blot Analysis

The tissues were homogenized at 4 °C in RIPA lysis buffer with a 1% protease inhibitor cocktail, as described previously [9]. The tissue homogenates were centrifuged (12,000× g, 15 min, 4 °C), and a Pierce BCA Protein Assay Kit (Thermo Scientific, Waltham, MA, USA) was used to determine the total protein concentration of lysate. Equal amounts of proteins were diluted with the loading buffer and heated in boiling water for 5 min. The protein sample was separated on a 12% SDS−polyacrylamide gel electrophoresis and transferred to PVDF membranes overnight. After blocking with 3% BSA in Tris−Tween buffered saline for 2 h at room temperature, the membranes were incubated with the following antibodies overnight at 4 °C: fatty acid synthase (FAS) (1:1000, Absin) and fibroblast growth factor 21 (FGF21) (1:1000, Absin). The membranes were washed with TBST three times and incubated for 3 h with the peroxidase-conjugated secondary antibody (1:2000, Cell Signaling). The band was visualized by ECL detection systems (Thermo Scientific, Waltham, MA, USA). The images were detected on a Fujifilm LAS-3000 (Tokyo, Japan). The Image J software 1.80 (National Institutes of Health, Bethesda, MD, USA) was used to quantify the protein densitometry.

4.9. Statistical Analysis

Data were analyzed with the one-way analysis of variance (ANOVA), using the general linear model procedure in SPSS 26.0 (IBM SPSS Statistics, Chicago, IL, USA, 2019), Image J 1.80 (National Institutes of Health, Bethesda, MD, USA, 2021), and GraphPad Prism 8.3.0 (GraphPad Software, La Jolla, CA, USA, 2012). For multiple comparisons, a Tukey’s multiple comparison test, LSD multiple-comparison test, and Duncan’s multiple comparison test were used. The results are presented as the mean and standard error of the mean for the effect of protein restriction. Differences were considered significantly different at p < 0.05, with a trend toward significance at p < 0.10.

Supplementary Materials

The following supporting information can be downloaded at: https://www.mdpi.com/article/10.3390/ijms24065401/s1.

Author Contributions

Y.S.: Methodology; Formal analysis; Investigation; Data curation; Writing—original draft; Writing—review & editing. B.S.: Investigation; Formal analysis; Writing—review & editing. Z.W.: Investigation. Y.L.: Writing—review & editing. Q.M.: Conceptualization; Supervision; Writing—review & editing. All authors have read and agreed to the published version of the manuscript.

Funding

This work was supported by the grant from the National Natural Science Foundation of China (31772611) and the Natural Science Foundation of Heilongjiang Province (YQ2019C007).

Institutional Review Board Statement

The study was approved by Northeast Agricultural University Animal Science Research Ethics Committee (NEAU-[2011]-9) (Approval Code: NEAUEC20200202; Approval Date: 3 April 2020).

Informed Consent Statement

Not applicable.

Data Availability Statement

Not applicable.

Acknowledgments

The authors of the article would like to thank Linlin Hu, from the Northeast Agricultural University in China, for support and assistance in the management and breeding of the mouse.

Conflicts of Interest

The authors declare no conflict of interest.

References

  1. Miyamoto, J.; Igarashi, M.; Watanabe, K.; Karaki, S.-I.; Mukouyama, H.; Kishino, S.; Li, X.; Ichimura, A.; Irie, J.; Sugimoto, Y.; et al. Gut microbiota confers host resistance to obesity by metabolizing dietary polyunsaturated fatty acids. Nat. Commun. 2019, 10, 4007. [Google Scholar] [CrossRef] [PubMed] [Green Version]
  2. Wu, G. Functional amino acids in nutrition and health. Amino Acids 2013, 45, 407–411. [Google Scholar] [CrossRef] [PubMed] [Green Version]
  3. Ma, Q.; Zhou, X.; Sun, Y.; Hu, L.; Zhu, J.; Shao, C.; Meng, Q.; Shan, A. Threonine, but Not Lysine and Methionine, Reduces Fat Accumulation by Regulating Lipid Metabolism in Obese Mice. J. Agric. Food Chem. 2020, 68, 4876–4883. [Google Scholar] [CrossRef]
  4. Ma, Q.; Chen, J.; Zhou, X.; Hu, L.; Sun, Y.; Wang, Z.; Yue, Z.; Shan, A. Dietary supplementation with aromatic amino acids decreased triglycerides and alleviated hepatic steatosis by stimulating bile acid synthesis in mice. Food Funct. 2020, 12, 267–277. [Google Scholar] [CrossRef]
  5. McCormack, S.E.; Shaham, O.; McCarthy, M.A.; Deik, A.A.; Wang, T.J.; Gerszten, R.E.; Clish, C.B.; Mootha, V.K.; Grinspoon, S.K.; Fleischman, A. Circulating branched-chain amino acid concentrations are associated with obesity and future insulin resistance in children and adolescents. Pediatr. Obes. 2012, 8, 52–61. [Google Scholar] [CrossRef] [PubMed] [Green Version]
  6. Rousseau, M.; Guénard, F.; Garneau, V.; Allam-Ndoul, B.; Lemieux, S.; Pérusse, L.; Vohl, M.-C. Associations Between Dietary Protein Sources, Plasma BCAA and Short-Chain Acylcarnitine Levels in Adults. Nutrients 2019, 11, 173. [Google Scholar] [CrossRef] [PubMed] [Green Version]
  7. Zhang, Y.; Guo, K.; LeBlanc, R.E.; Loh, D.; Schwartz, G.J.; Yu, Y.-H. Increasing Dietary Leucine Intake Reduces Diet-Induced Obesity and Improves Glucose and Cholesterol Metabolism in Mice via Multimechanisms. Diabetes 2007, 56, 1647–1654. [Google Scholar] [CrossRef] [Green Version]
  8. Eller, L.K.; Saha, D.C.; Shearer, J.; Reimer, R.A. Dietary leucine improves whole-body insulin sensitivity independent of body fat in diet-induced obese Sprague–Dawley rats. J. Nutr. Biochem. 2013, 24, 1285–1294. [Google Scholar] [CrossRef]
  9. Ma, Q.; Zhou, X.; Hu, L.; Chen, J.; Zhu, J.; Shan, A. Leucine and isoleucine have similar effects on reducing lipid accumulation, improving insulin sensitivity and increasing the browning of WAT in high-fat diet-induced obese mice. Food Funct. 2020, 11, 2279–2290. [Google Scholar] [CrossRef]
  10. Newgard, C.B.; An, J.; Bain, J.R.; Muehlbauer, M.J.; Stevens, R.D.; Lien, L.F.; Haqq, A.; Shah, S.; Arlotto, M.; Slentz, C.; et al. A Branchedchain Amino Acid-Related Metabolic Signature that Differentiates Obese and Lean Humans and Contributes to Insulin Resistance. Cell Metab. 2009, 9, 565–566. [Google Scholar] [CrossRef] [Green Version]
  11. Fontana, L.; Cummings, N.E.; Apelo, S.I.A.; Neuman, J.C.; Kasza, I.; Schmidt, B.A.; Cava, E.; Spelta, F.; Tosti, V.; Syed, F.A.; et al. Decreased Consumption of Branched-Chain Amino Acids Improves Metabolic Health. Cell Rep. 2016, 16, 520–530. [Google Scholar] [CrossRef] [PubMed] [Green Version]
  12. Yu, D.; Richardson, N.E.; Green, C.L.; Spicer, A.B.; Murphy, M.E.; Flores, V.; Jang, C.; Kasza, I.; Nikodemova, M.; Wakai, M.H.; et al. The Adverse Metabolic Effects of Branched-Chain Amino Acids Are Mediated by Isoleucine and Valine. Cell Metab. 2021, 33, 905–922.e6. [Google Scholar] [CrossRef] [PubMed]
  13. Zhou, X.; Chen, J.; Sun, B.; Wang, Z.; Zhu, J.; Yue, Z.; Zhang, Y.; Shan, A.; Ma, Q.; Wang, J. Leucine, but not isoleucine or valine, affects serum lipid profiles and browning of WAT in mice. Food Funct. 2021, 12, 6712–6724. [Google Scholar] [CrossRef] [PubMed]
  14. Hou, Q.; Zhao, F.; Liu, W.; Lv, R.; Khine, W.W.T.; Han, J.; Sun, Z.; Lee, Y.-K.; Zhang, H. Probiotic-directed modulation of gut microbiota is basal microbiome dependent. Gut Microbes 2020, 12, 1736974. [Google Scholar] [CrossRef] [Green Version]
  15. Nishimura, J.; Masaki, T.; Arakawa, M.; Seike, M.; Yoshimatsu, H. Isoleucine Prevents the Accumulation of Tissue Triglycerides and Upregulates the Expression of Pparalpha and Uncoupling Protein in Diet-Induced Obese Mice. J. Nutr. 2010, 140, 496–500. [Google Scholar] [CrossRef] [Green Version]
  16. Kamei, Y.; Hatazawa, Y.; Uchitomi, R.; Yoshimura, R.; Miura, S. Regulation of Skeletal Muscle Function by Amino Acids. Nutrients 2020, 12, 261. [Google Scholar] [CrossRef] [Green Version]
  17. O’Rielly, R.; Li, H.; Lim, S.M.; Yazbeck, R.; Kritas, S.; Ullrich, S.S.; Feinle-Bisset, C.; Heilbronn, L.; Page, A.J. The Effect of Isoleucine Supplementation on Body Weight Gain and Blood Glucose Response in Lean and Obese Mice. Nutrients 2020, 12, 2446. [Google Scholar] [CrossRef]
  18. Binder, E.; Bermúdez-Silva, F.J.; André, C.; Elie, M.; Romero-Zerbo, S.Y.; Leste-Lasserre, T.; Belluomo, L.; Duchampt, A.; Clark, S.; Aubert, A.; et al. Leucine Supplementation Protects from Insulin Resistance by Regulating Adiposity Levels. PLoS ONE 2013, 8, e74705. [Google Scholar] [CrossRef] [Green Version]
  19. Magne, H.; Savary-Auzeloux, I.; Rémond, D.; Dardevet, D. Nutritional strategies to counteract muscle atrophy caused by disuse and to improve recovery. Nutr. Res. Rev. 2013, 26, 149–165. [Google Scholar] [CrossRef] [Green Version]
  20. Buettner, C.; Muse, E.D.; Cheng, A.; Chen, L.; Scherer, T.; Pocai, A.; Su, K.; Cheng, B.; Li, X.; Harvey-White, J.; et al. Leptin Controls Adipose Tissue Lipogenesis Via Central, Stat3-Independent Mechanisms. Nat. Med. 2008, 14, 667–675. [Google Scholar] [CrossRef] [PubMed]
  21. Yoshida, R.; Noguchi, K.; Shigemura, N.; Jyotaki, M.; Takahashi, I.; Margolskee, R.F.; Ninomiya, Y. Leptin Suppresses Mouse Taste Cell Responses to Sweet Compounds. Diabetes 2015, 64, 3751–3762. [Google Scholar] [CrossRef] [Green Version]
  22. Yoneshiro, T.; Wang, Q.; Tajima, K.; Matsushita, M.; Maki, H.; Igarashi, K.; Dai, Z.; White, P.J.; McGarrah, R.W.; Ilkayeva, O.R.; et al. BCAA catabolism in brown fat controls energy homeostasis through SLC25A44. Nature 2019, 572, 614–619. [Google Scholar] [CrossRef] [PubMed]
  23. Maida, A.; Chan, J.S.; Sjøberg, K.A.; Zota, A.; Schmoll, D.; Kiens, B.; Herzig, S.; Rose, A.J. Repletion of branched chain amino acids reverses mTORC1 signaling but not improved metabolism during dietary protein dilution. Mol. Metab. 2017, 6, 873–881. [Google Scholar] [CrossRef] [PubMed]
  24. Lee, J.; Vijayakumar, A.; White, P.J.; Xu, Y.; Ilkayeva, O.; Lynch, C.J.; Newgard, C.B.; Kahn, B.B. BCAA Supplementation in Mice with Diet-induced Obesity Alters the Metabolome without Impairing Glucose Homeostasis. Endocrinology 2021, 162, bqab062. [Google Scholar] [CrossRef] [PubMed]
  25. Wang, T.J.; Larson, M.G.; Vasan, R.S.; Cheng, S.; Rhee, E.P.; McCabe, E.; Lewis, G.D.; Fox, C.S.; Jacques, P.F.; Fernandez, C.; et al. Metabolite Profiles and the Risk of Developing Diabetes. Nat. Med. 2011, 17, 448–453. [Google Scholar]
  26. Kharitonenkov, A.; Shiyanova, T.L.; Koester, A.; Ford, A.M.; Micanovic, R.; Galbreath, E.; Sandusky, G.; Hammond, L.; Moyers, J.; Owens, R.; et al. Fgf-21 as a Novel Metabolic Regulator. J. Clin. Investig. 2005, 115, 1627–1635. [Google Scholar] [CrossRef] [Green Version]
  27. Li, H.; Wu, G.; Fang, Q.; Zhang, M.; Hui, X.; Sheng, B.; Wu, L.; Bao, Y.; Li, P.; Xu, A.; et al. Fibroblast growth factor 21 increases insulin sensitivity through specific expansion of subcutaneous fat. Nat. Commun. 2018, 9, 272. [Google Scholar] [CrossRef] [Green Version]
  28. Barb, D.; Bril, F.; Kalavalapalli, S.; Cusi, K. Plasma Fibroblast Growth Factor 21 Is Associated with Severity of Nonalcoholic Steatohepatitis in Patients with Obesity and Type 2 Diabetes. J. Clin. Endocrinol. Metab. 2019, 104, 3327–3336. [Google Scholar] [CrossRef]
  29. Veniant, M.M.; Hale, C.; Helmering, J.; Chen, M.M.; Stanislaus, S.; Busby, J.; Vonderfecht, S.; Xu, J.; Lloyd, D.J. FGF21 Promotes Metabolic Homeostasis via White Adipose and Leptin in Mice. PLoS ONE 2012, 7, e40164. [Google Scholar] [CrossRef]
  30. Yan, T.; Luo, Y.; Yan, N.; Hamada, K.; Zhao, N.; Xia, Y.; Wang, P.; Zhao, C.; Qi, D.; Yang, S. Intestinal Peroxisome Proliferator-Activated Receptor A—Fatty Acid-Binding Protein 1 Axis Modulates Nonalcoholic Steatohepatitis. Hepatology 2022, 77, 239–255. [Google Scholar] [CrossRef]
  31. Ali, F.; Ismail, A.; Esa, N.M.; Pei, C.P.; Kersten, S. Hepatic genome-wide expression of lipid metabolism in diet-induced obesity rats treated with cocoa polyphenols. J. Funct. Foods 2015, 17, 969–978. [Google Scholar] [CrossRef]
  32. Flannery, C.A.; Choe, G.H.; Cooke, K.M.; Fleming, A.G.; Radford, C.C.; Kodaman, P.H.; Jurczak, M.J.; Kibbey, R.G.; Taylor, H.S. Insulin Regulates Glycogen Synthesis in Human Endometrial Glands through Increased GYS2. J. Clin. Endocrinol. Metab. 2018, 103, 2843–2850. [Google Scholar] [CrossRef] [PubMed]
  33. Bramer, S.A.; Macedo, A.; Klein, C. Hexokinase 2 drives glycogen accumulation in equine endometrium at day 12 of diestrus and pregnancy. Reprod. Biol. Endocrinol. 2017, 15, 4. [Google Scholar] [CrossRef] [PubMed] [Green Version]
  34. Migocka-Patrzałek, M.; Lewicka, A.; Elias, M.; Daczewska, M. The effect of muscle glycogen phosphorylase (Pygm) knockdown on zebrafish morphology. Int. J. Biochem. Cell Biol. 2019, 118, 105658. [Google Scholar] [CrossRef] [PubMed]
  35. Kaur, A.; Patankar, J.V.; de Haan, W.; Ruddle, P.; Wijesekara, N.; Groen, A.K.; Verchere, C.B.; Singaraja, R.R.; Hayden, M.R. Loss of Cyp8b1 Improves Glucose Homeostasis by Increasing GLP-1. Diabetes 2014, 64, 1168–1179. [Google Scholar] [CrossRef] [Green Version]
  36. Wang, Y.-J.; Bian, Y.; Luo, J.; Lu, M.; Xiong, Y.; Guo, S.-Y.; Yin, H.-Y.; Lin, X.; Li, Q.; Chang, C.C.Y.; et al. Cholesterol and fatty acids regulate cysteine ubiquitylation of ACAT2 through competitive oxidation. Nature 2017, 19, 808–819. [Google Scholar] [CrossRef] [Green Version]
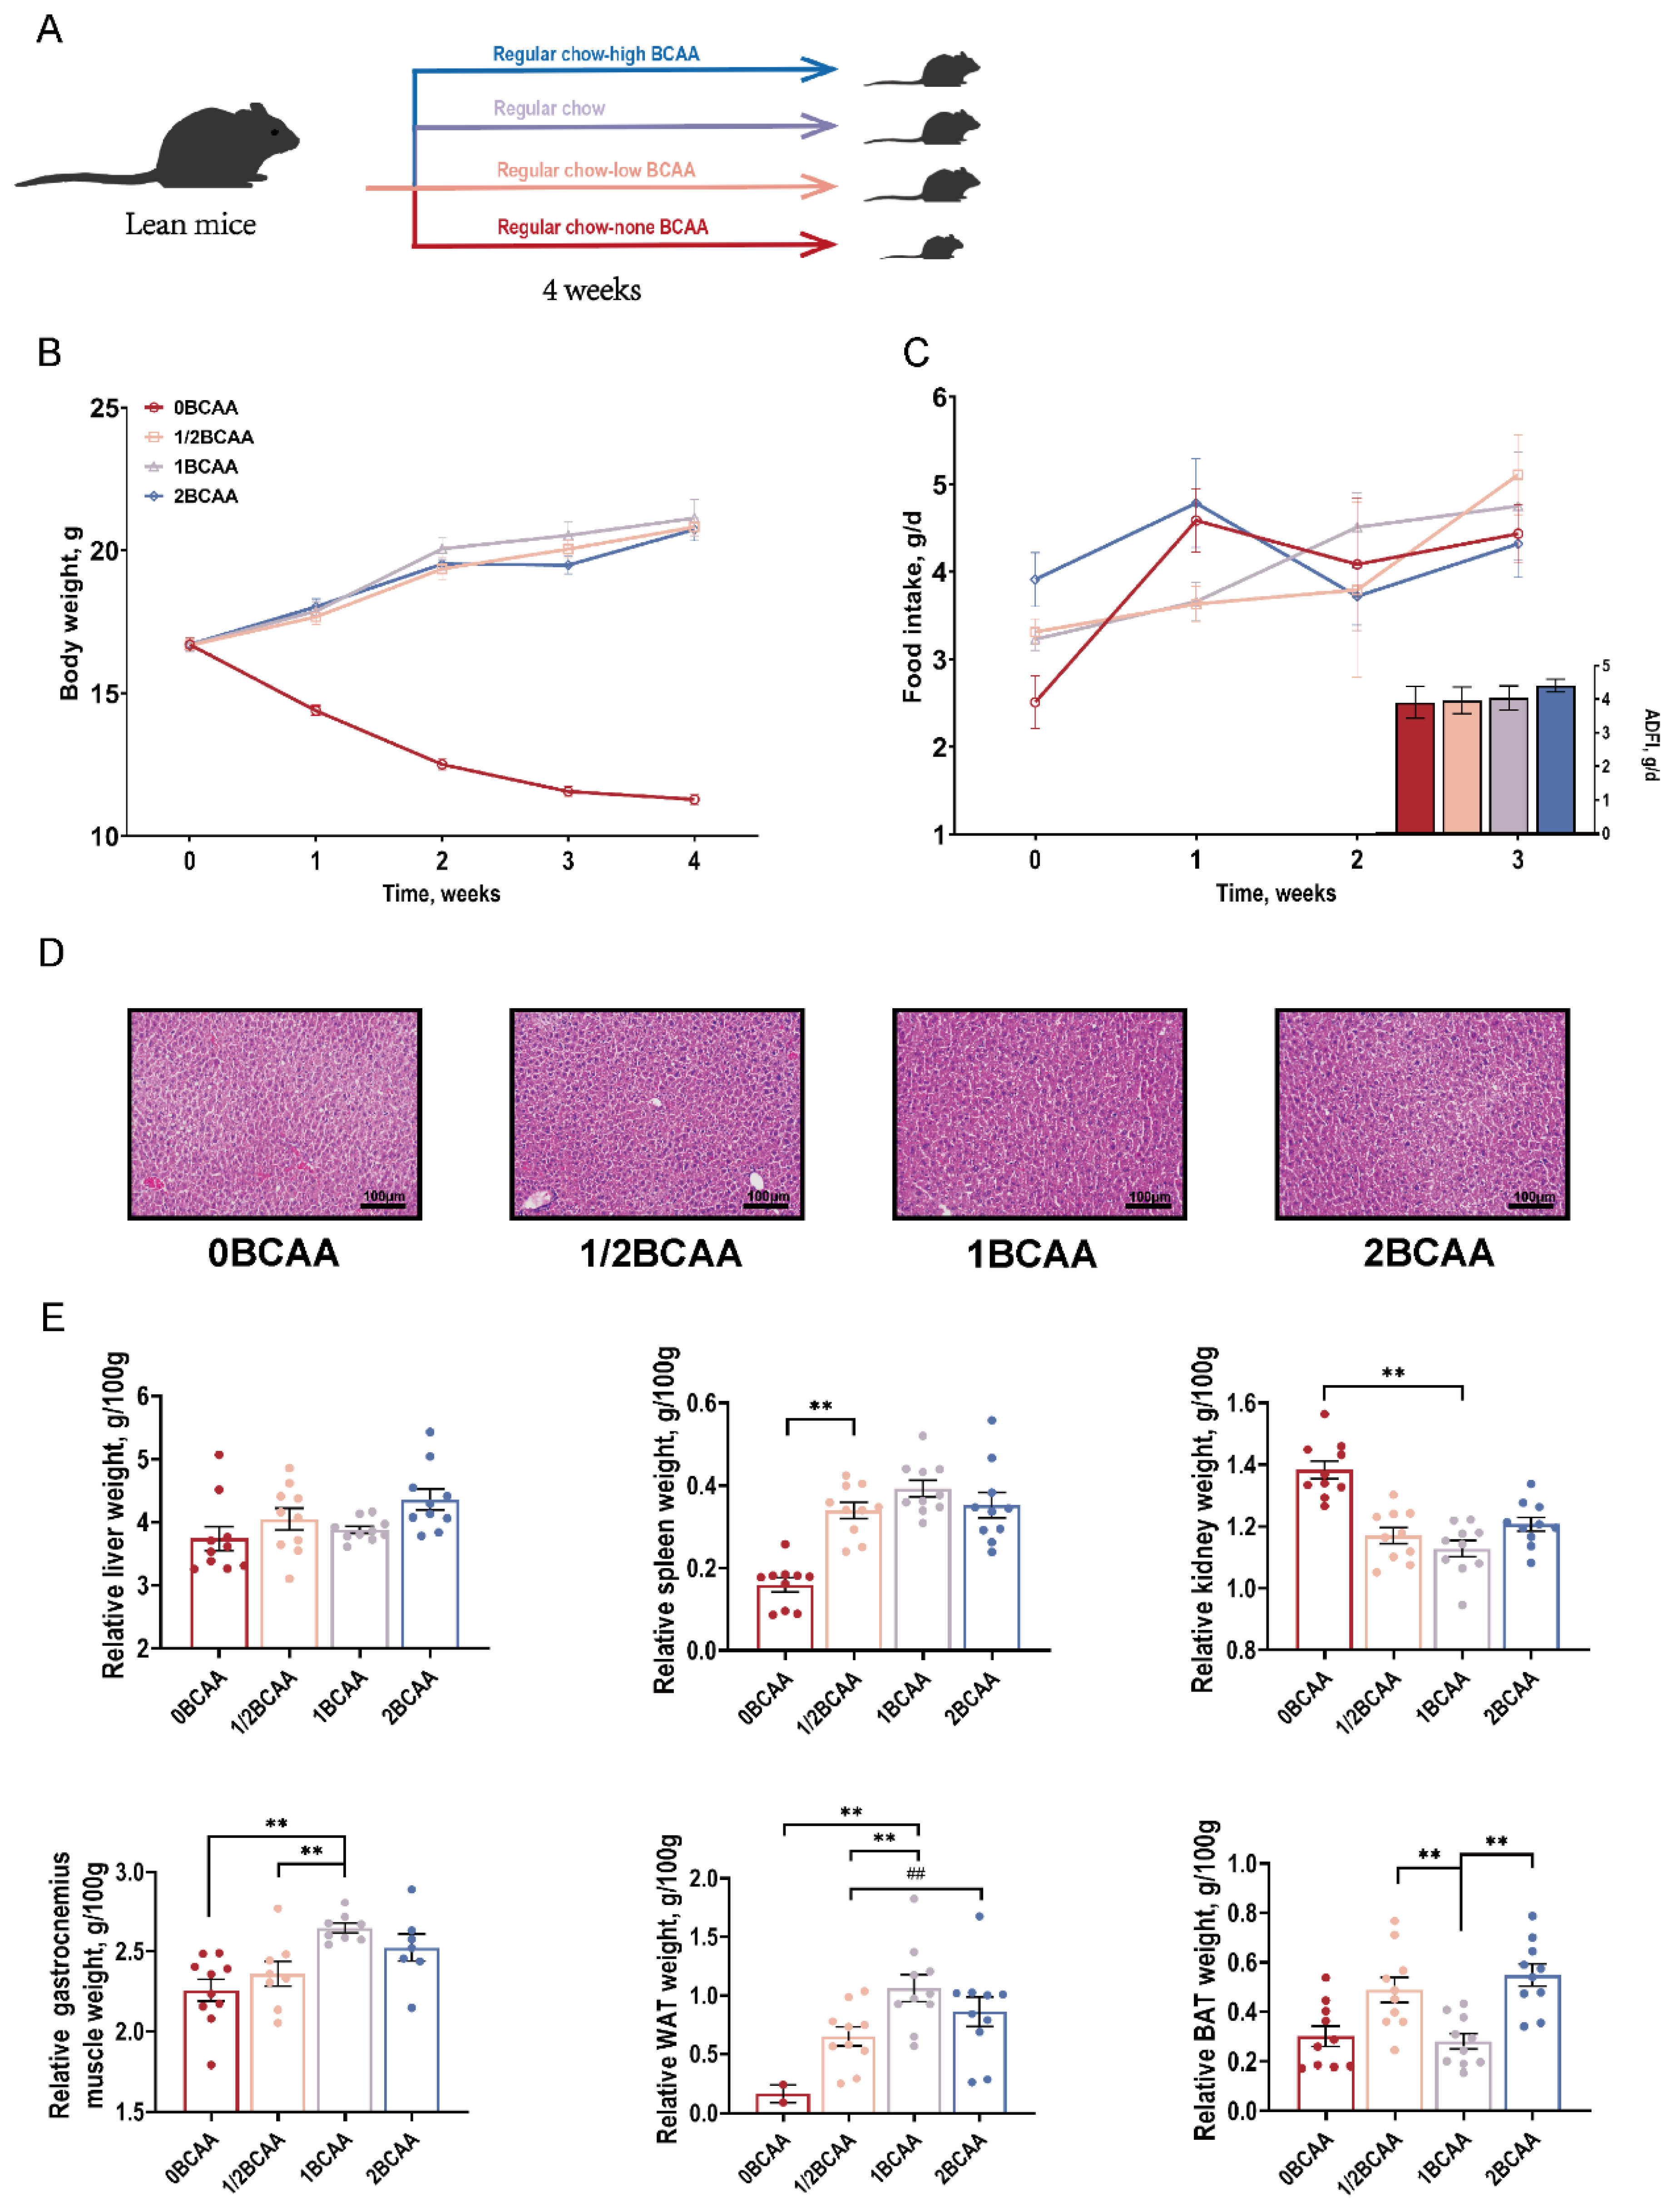
Figure 1. Effects of different dietary BCAA levels on the growth performance and organ development of lean mice. (A): Experimental design; (B): Body weight curve; (C): Feed intake for 4 weeks; (D): Representative H&E staining images of the liver; (E): Relative organ weight. Values are presented as the means ± SEM (n = 15 of growth performance and ADFI, n = 8 of relative organ weights). ADFI: Average daily feed intake; WAT: White adipose tissue; BAT: Brown adipose tissue. ** p < 0.01 versus 1BCAA group. ## p < 0.01 in 2BCAA group versus 1/2BCAA group.
Ijms 24 05401 g001
Figure 2. Effects of different dietary BCAA levels on glucose homeostasis in lean mice. (A): GTT curve; (B): GTT AUC; (C): ITT curve; (D): ITT AUC; (E): Serum GLU level; (F): Serum INS level; (G): HOMA-IR; (H): ISI index. Values are presented as the means ± SEM (n = 8). GTT: Glucose tolerance test; ITT: Insulin tolerance test; AUC: Areas under the curves; GLU: Glucose; INS: Insulin; HOMA-IR: Homeostasis model assessment of insulin resistance; ISI: Improved insulin sensitivity index. Values are presented as the means ± SEM (n = 8). * p < 0.05, ** p < 0.01 versus 1BCAA group. # p < 0.05, ## p < 0.01 in 2BCAA group versus 1/2BCAA group.
Ijms 24 05401 g002
Figure 3. Effects of different dietary BCAA levels on serum biochemical indices in lean mice. (A): Total cholesterol; (B): Total triglycerides; (C): Low-density lipoprotein cholesterol; (D): High-density lipoprotein cholesterol; (E): Urea nitrogen; (F): Free fatty acid; (G): Adiponectin; (H): Leptin. Values are presented as the means ± SEM. (AE): n = 6; (FH): n = 10. TC: Total cholesterol; TG: Total triglycerides; LDL-C: Low-density lipoprotein cholesterol; HDL-C: High-density lipoprotein cholesterol; BUN: Urea nitrogen; FFA: Free fatty acid; ADPN: Adiponectin; LEP: Leptin. * p < 0.05, ** p < 0.01 versus 1BCAA group. # p < 0.05, ## p < 0.01 in 2BCAA group versus 1/2BCAA group.
Ijms 24 05401 g003
Figure 4. GO enrichment analysis of differentially expressed genes in four groups. (A): 0BCAA vs. 1BCAA; (B): 1/2BCAA vs. 1BCAA; (C): 2BCAA vs. 1BCAA; (D): 1/2BCAA vs. 2BCAA. GO: Gene ontology; BP: Biological processes; CC: Cellular components; MF: Molecular functions.
Ijms 24 05401 g004
Figure 5. KEGG enrichment analysis of differentially expressed genes in four groups. (A): 0BCAA vs. 1BCAA; (B): 1/2BCAA vs. 1BCAA; (C): 2BCAA vs. 1BCAA; (D): 1/2BCAA vs. 2BCAA; KEGG: Kyoto encyclopedia of genes pathway.
Ijms 24 05401 g005
Figure 6. Effects of different dietary BCAA levels on genes related to lipid and glucose metabolism in lean mice. (A): RT-PCR validation of transcriptomic analysis; (B): Western blot analysis of HSL; (C): Relative protein expression level. Values are presented as the means ± SEM (n = 8). Fgf21: Fibroblast growth factor 21; Fasn: Fatty acid synthase; Hsl: Hormone sensitive lipase; Fabp1: Fatty acid-binding protein 1; Fabp5: Fatty acid-binding protein 5; Cel: Carboxyl ester lipase; Clps: Colipase; Cyp7a1: Cytochrome P450 family 7 subfamily A member 1; Cyp8b1: Cytochrome P450 family 8 subfamily B member 1; Pparg: Peroxisome proliferator-activated receptor gamma; Pparα: Peroxisome proliferator-activated receptor alpha; Ucp2: Uncoupling protein 2; Bcat2: Branched-chain aminotransferase 2; Acat2: Acetyl-Coenzyme A acetyltransferase 2; Hk2: Hexokinase 2; Gys2: Glycogen synthase 2; Pygm: Muscle glycogen phosphorylase; FPKM: Fragments Per Kilobase of exon model per Million mapped fragments. * p < 0.05, ** p < 0.01 versus 1BCAA group. # p < 0.05, ## p < 0.01 in 2BCAA group versus 1/2BCAA group.
Ijms 24 05401 g006
Table 1. Selected significant differentially expressed genes from transcriptomic analysis.
IDlog2FoldChangep-ValueDirectionGene Name
0 BCAA vs. 1 BCAA
ENSMUSG00000030827−1.44930.002DownFgf21
ENSMUSG00000054422−1.51470.026DownFabp1
ENSMUSG00000027533−0.98170.011DownFabp5
ENSMUSG000000282401.43590.019UpCyp7a1
ENSMUSG00000050445−2.2162<0.001DownCyp8b1
ENSMUSG00000000440−0.57400.030DownPparg
ENSMUSG00000022383−0.65850.070DownPparα
ENSMUSG00000033685−0.81870.008DownUcp2
ENSMUSG00000000628−1.53500.014DownHk2
0.5 BCAA vs. 1 BCAA
ENSMUSG000000275331.58880.003UpFabp5
ENSMUSG000000031230.59690.006UpHsl
ENSMUSG00000028240−0.8180<0.001DownCyp7a1
ENSMUSG00000000440−0.63480.011DownPparg
ENSMUSG00000033685−0.40570.052DownUcp2
ENSMUSG0000002422511.45220.003UpClps
ENSMUSG0000002681812.37840.002UpCel
ENSMUSG000000326481.48130.031UpPygm
ENSMUSG000000238321.87630.005UpAcat2
ENSMUSG000000308260.50640.008UpBcat2
2 BCAA vs. 1 BCAA
ENSMUSG000000275331.46970.026UpFabp5
ENSMUSG000000031230.8616<0.001UpHsl
ENSMUSG0000002422526.1467<0.001UpClps
ENSMUSG00000050445−0.66520.031DownCyp8b1
ENSMUSG000000223830.47120.062UpPparα
ENSMUSG0000002681827.1306<0.001UpCel
ENSMUSG000000326482.6947<0.001UpPygm
ENSMUSG000000302441.30390.010UpGys2
ENSMUSG000000006281.21380.030UpHk2
ENSMUSG000000308260.38790.063UpBcat2
0.5 BCAA vs. 2 BCAA
ENSMUSG00000030244−0.97220.087DownGys2
ENSMUSG000000238321.72240.010UpAcat2
ENSMUSG00000033685−0.60000.020DownUcp2
ENSMUSG00000028240−0.94930.052DownCyp7a1
F: Forward primer; R: Reverse primer; Fgf21: Fibroblast growth factor 21; Fasn: Fatty acid synthase; Hsl: Hormone sensitive lipase; Fabp1: Fatty acid-binding protein 1; Fabp5: Fatty acid-binding protein 5; Cel: Carboxyl ester lipase; Clps: Colipase; Cyp7a1: Cytochrome P450 family 7 subfamily A member 1; Cyp8b1: Cytochrome P450 family 8 subfamily B member 1; Pparg: Peroxisome proliferator-activated receptor gamma; Pparα: Peroxisome proliferator-activated receptor alpha; Ucp2: Uncoupling protein 2; Bcat2: Branched-chain aminotransferase 2; Acat2: Acetyl-Coenzyme A acetyltransferase 2; Hk2: Hexokinase 2; Gys2: Glycogen synthase 2; Pygm: Muscle glycogen phosphorylase.
Table 2. The composition of diets. 1BCAA (fully purified amino acid-specified diet), 0BCAA (without BCAA), 1/2BCAA (with half the BCAA level in 1BCAA), and 2BCAA (with twice the BCAA level in 1BCAA) for 4 weeks.
Amino Acid Defined Diets0BCAA1/2BCAA1BCAA2BCAA
Ingredient composition, g/kg as fed
L-Alanine5.75.14.63.5
L-Arginine HCl9.58.67.75.9
L-Aspartic acid15.013.612.29.4
L-Cystine4.64.13.72.8
L-Glutamic acid44.740.536.327.9
Glycine3.93.63.22.5
L-Histidine HCl, monohydrate5.75.14.63.5
L-Lysine HCl16.014.513.010.0
L-Methionine5.75.14.63.5
L-Proline25.222.920.515.8
L-Serine11.910.89.77.5
L-Threonine8.27.56.75.2
L-Tryptophan2.62.32.11.6
L-Tyrosine11.510.49.37.1
L-Phenylalanine10.89.88.86.8
L-Isoleucine-4.38.617.2
L-Leucine-7.715.430.8
L-Valine-5.010.020.0
Sucrose304.5304.5304.5304.5
Corn Starch302302302302
Maltodextrin75757575
Vitamin Mix10101010
Mineral Mix, AIN-9335353535
Choline Bitartrate2.52.52.52.5
Corn oil40404040
Cellulose50505050
% kcal from
Protein18.818.818.818.8
Carbohydrates71.871.871.871.8
Fat9.49.49.49.4
kcal/g3.83.83.83.8
Table 3. Primer sequence for RT-qPCR.
GenesGenBank IDForward SequenceReverse Sequence
β-ActinXM_021187106.2CAGGCATTGCTGACAGGATGTGCTGATCCACATCTGCTGG
Fgf21NM_020013.4GTGTCAAAGCCTCTAGGTTTCTTGGTACACATTGTAACCGTCCTC
FasnNM_001146708.1TGCTTGCTGGCTCACAGTTAATCAGTTTCACGAACCCGCC
HslXM_029479277.1TGGTGACACTCGCAGAAGACGATGGCAGGTGTGAACTGGA
Fabp1NM_017399.5GTACCAATTGCAGAGCCAGGCATGGTCTCCAGTTCGCACT
Fabp5NM_001272097.1TGAAAGAGCTAGGAGTAGGACTGCTCTCGGTTTTGACCGTGATG
CelNM_009885.2AGGACAACACCTATGGGCAAGCTCCTCCCCGTCATACAGGTA
ClpsNM_001317065.1GAACAGTATGCAGTGTAAGAGCAGCAGATGCCATAGTTGGTGTTG
Cyp7a1NM_007824.3AAACTCCCTGTCATACCACAAAGTTTCCATCACTTGGGTCTATGC
Cyp8b1NM_010012.3TGTACAGTGCTAGGAGCCCTGCTCAGGAAGCCAGCCTTAA
PpargNM_133249.3TCCTGTAAAAGCCCGGAGTATGCTCTGGTAGGGGCAGTGA
PparαNM_001113418.1CCATCTGTCCTCTCTCCCCATTGCAGCTCCGATCACACTT
Ucp2NM_011671.5ATGGTTGGTTTCAAGGCCACACGGTATCCAGAGGGAAAGTGAT
Bcat2NM_001243052.2CAGCCACACTAGGACAGGTCTCAGCCTTGTTATTCCACTCCAC
Acat2NM_009338.3CCCGTGGTCATCGTCTCAGGGACAGGGCACCATTGAAGG
Hk2NM_013820.3TGATCGCCTGCTTATTCACGGAACCGCCTAGAAATCTCCAGA
Gys2NM_145572.2GAGTGGGGAGAGAATTACTTCCTGGGCTCACATTGTTCTACTTGA
PygmNM_011224.2CTTAGCCGGAGTGGAAAATGTGTAATCTCTCGGAGTAGCCACA
F: Forward primer; R: Reverse primer; Fgf21: Fibroblast growth factor 21; Fasn: Fatty acid synthase; Hsl: Hormone sensitive lipase; Fabp1: Fatty acid-binding protein 1; Fabp5: Fatty acid-binding protein 5; Cel: Carboxyl ester lipase; Clps: Colipase; Cyp7a1: Cytochrome P450 family 7 subfamily A member 1; Cyp8b1: Cytochrome P450 family 8 subfamily B member 1; Pparg: Peroxisome proliferator-activated receptor gamma; Pparα: Peroxisome proliferator-activated receptor alpha; Ucp2: Uncoupling protein 2; Bcat2: Branched-chain aminotransferase 2; Acat2: Acetyl-Coenzyme A acetyltransferase 2; Hk2: Hexokinase 2; Gys2: Glycogen synthase 2; Pygm: Muscle glycogen phosphorylase.
Disclaimer/Publisher’s Note: The statements, opinions and data contained in all publications are solely those of the individual author(s) and contributor(s) and not of MDPI and/or the editor(s). MDPI and/or the editor(s) disclaim responsibility for any injury to people or property resulting from any ideas, methods, instructions or products referred to in the content.