
Characterization of Different Types of Epiretinal Proliferations by Synchrotron Radiation-Based Fourier Transform Infrared Micro-Spectroscopy


Abstract
1. Introduction
2. Results
2.1. Lipid Region
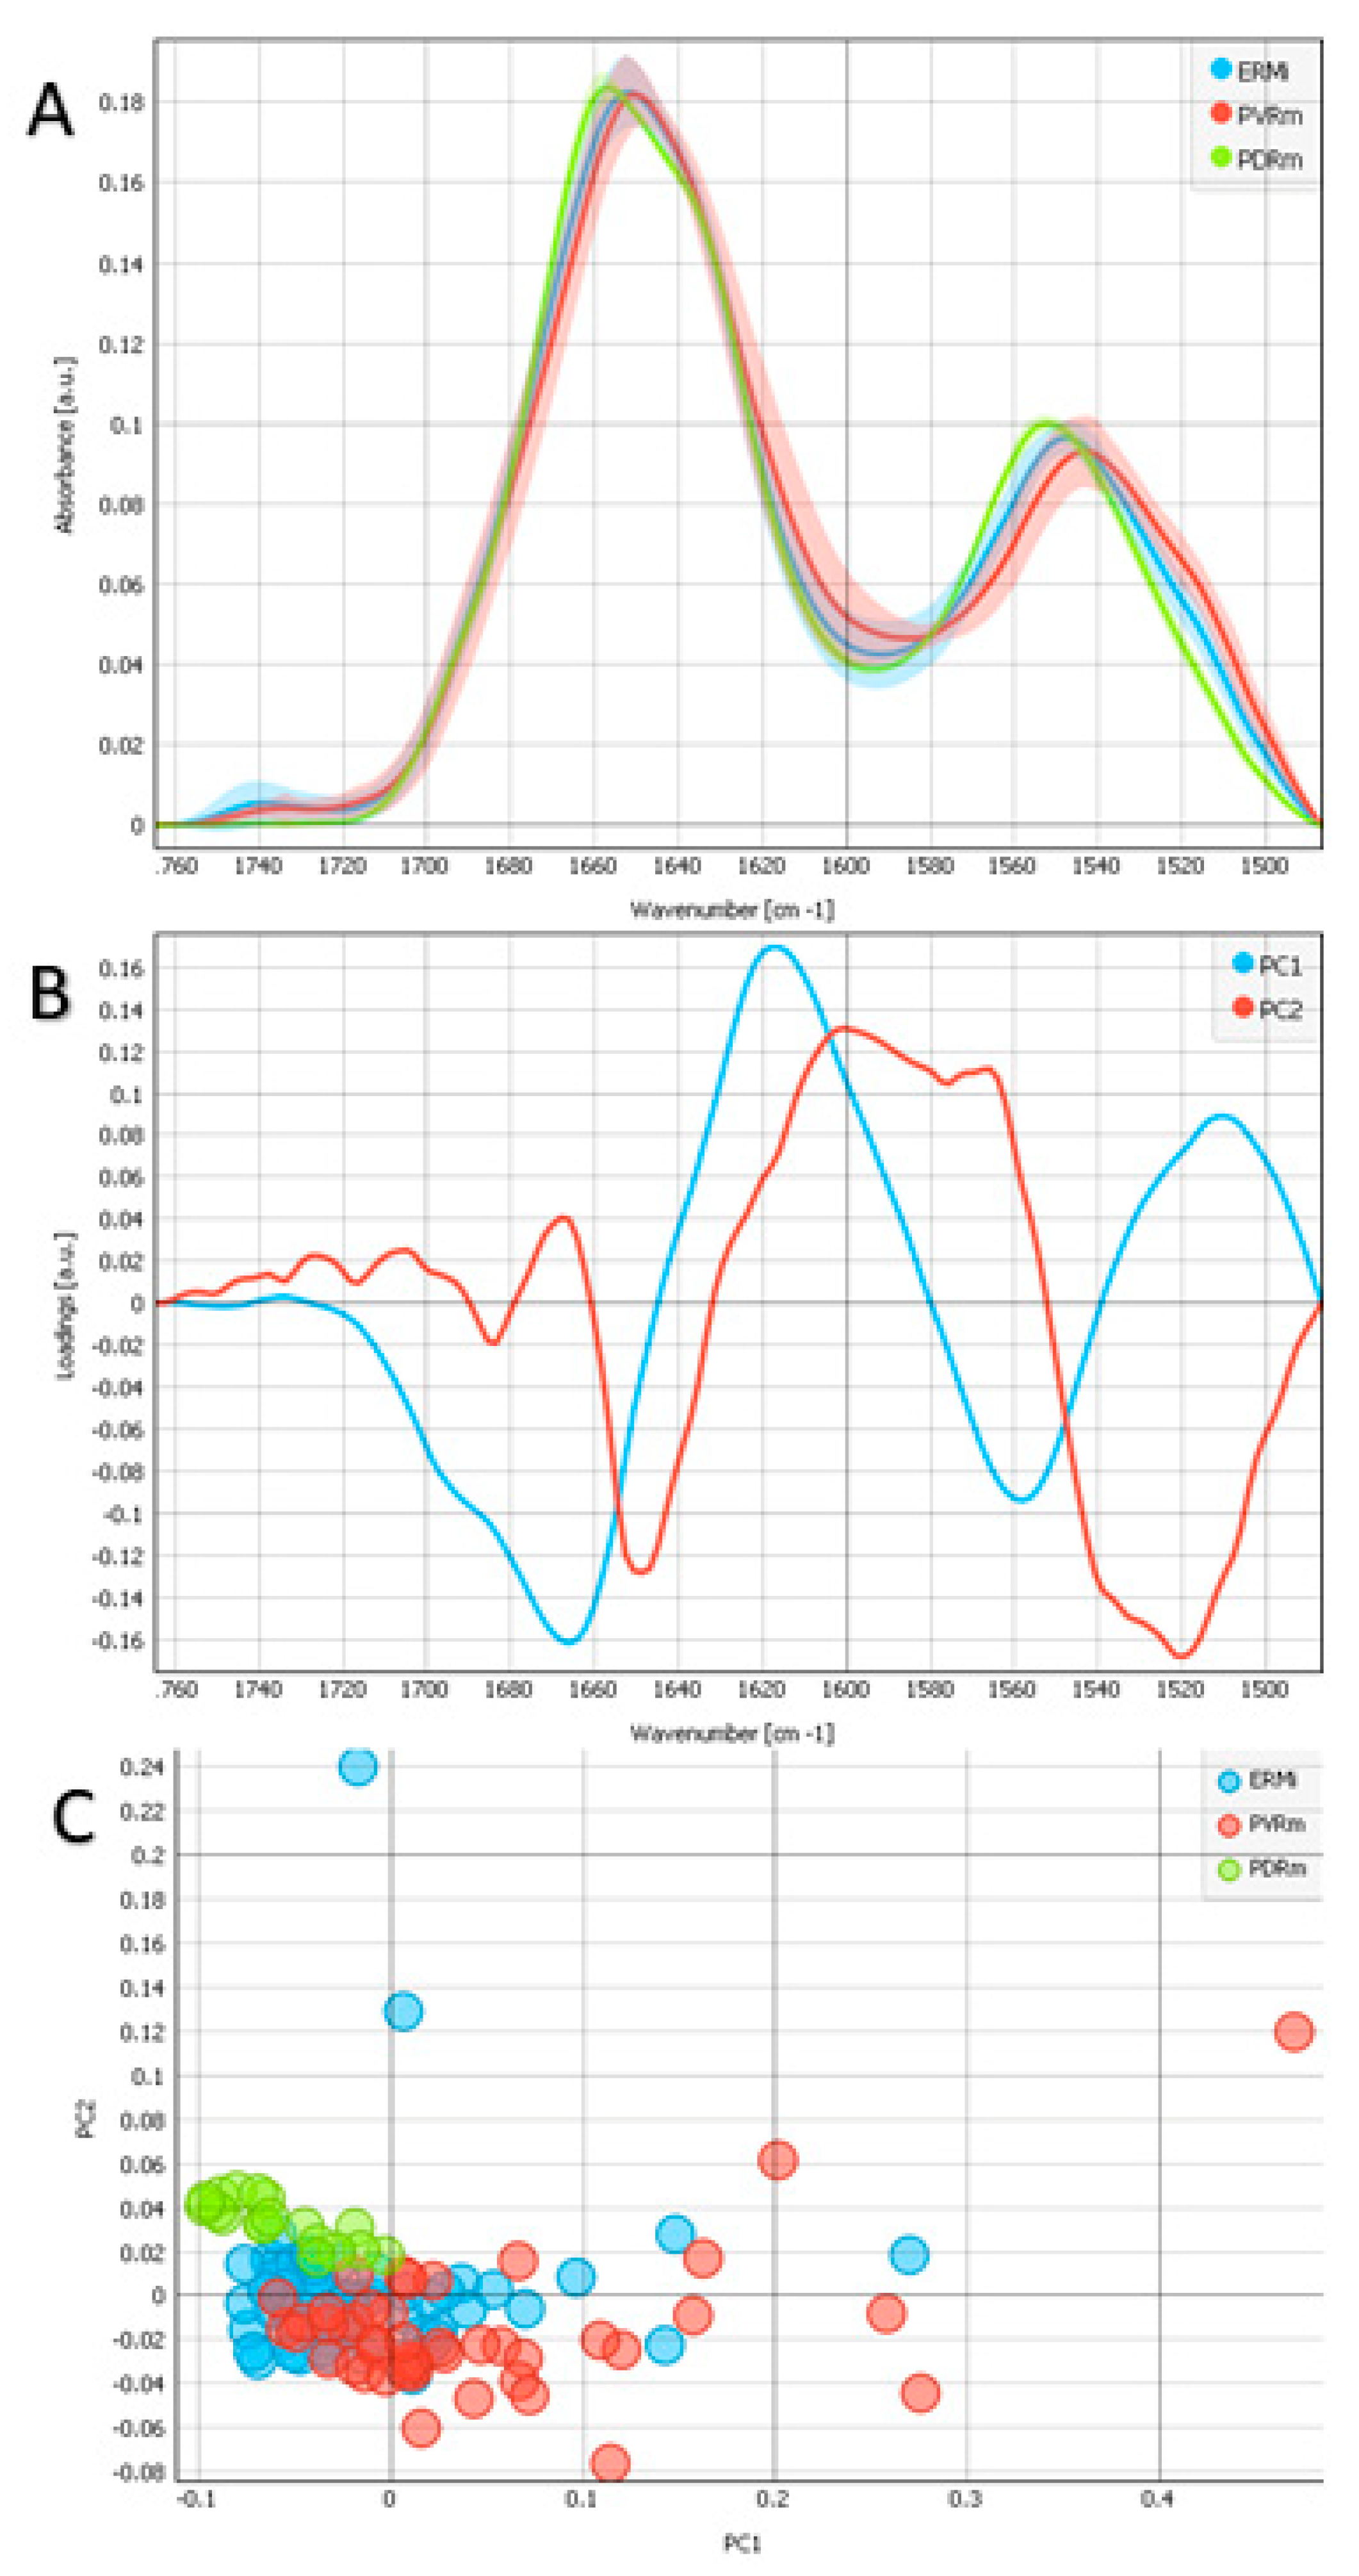
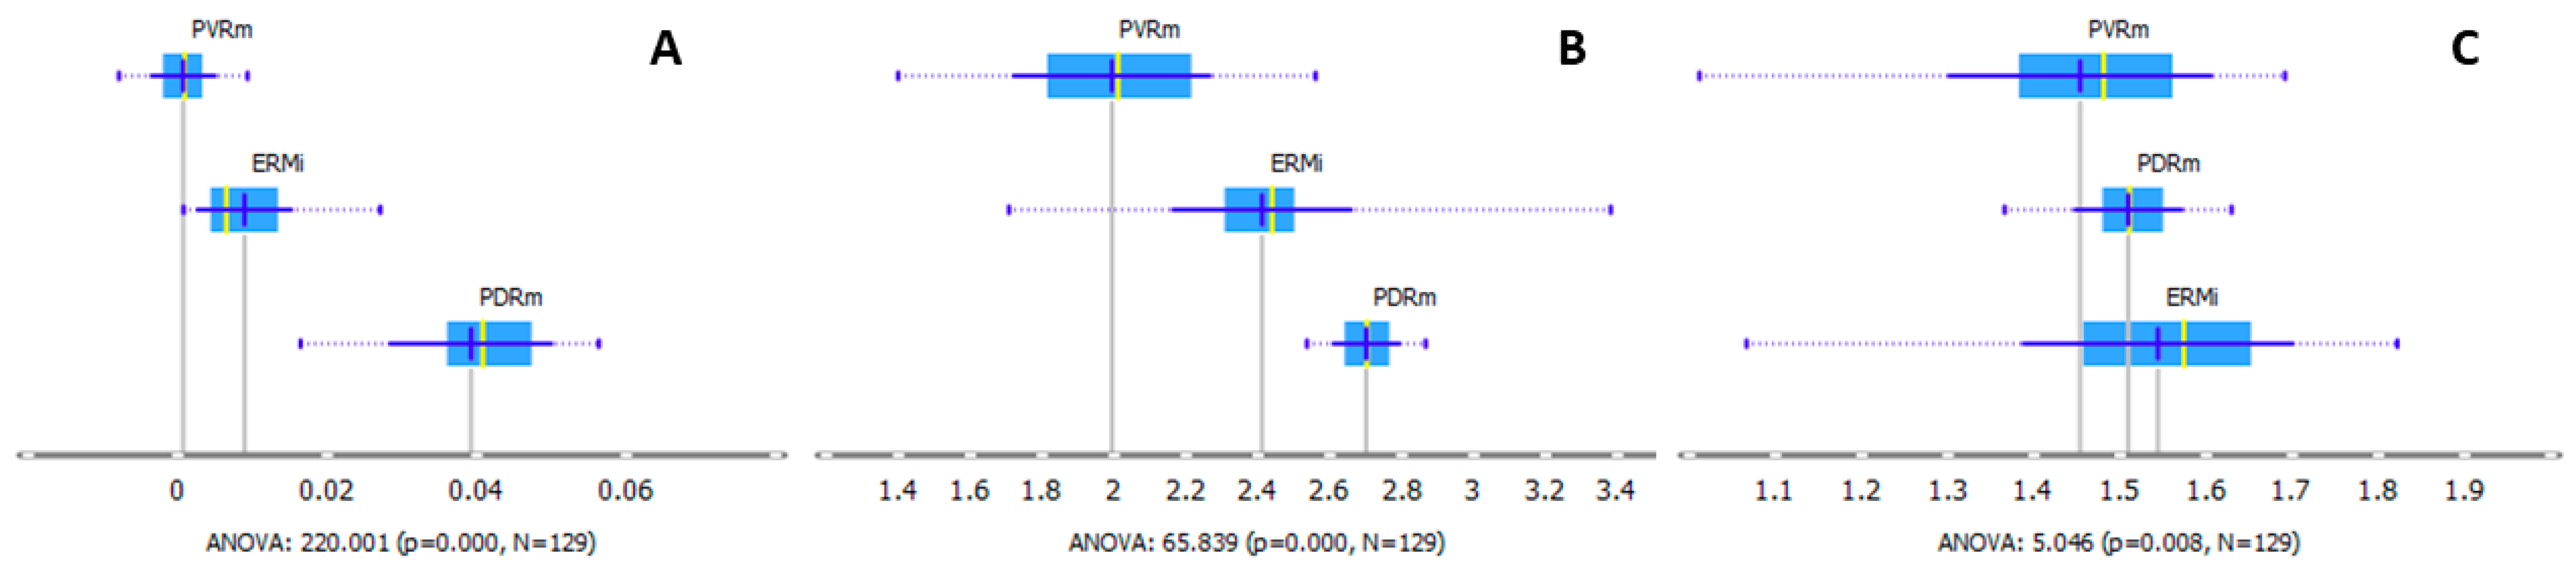
2.2. Protein Region
2.3. Protein Region Band Deconvolution
2.4. Nucleic Acids and Carbohydrates Regions
2.5. Additional Protein Analysis
3. Discussion
4. Materials & Methods
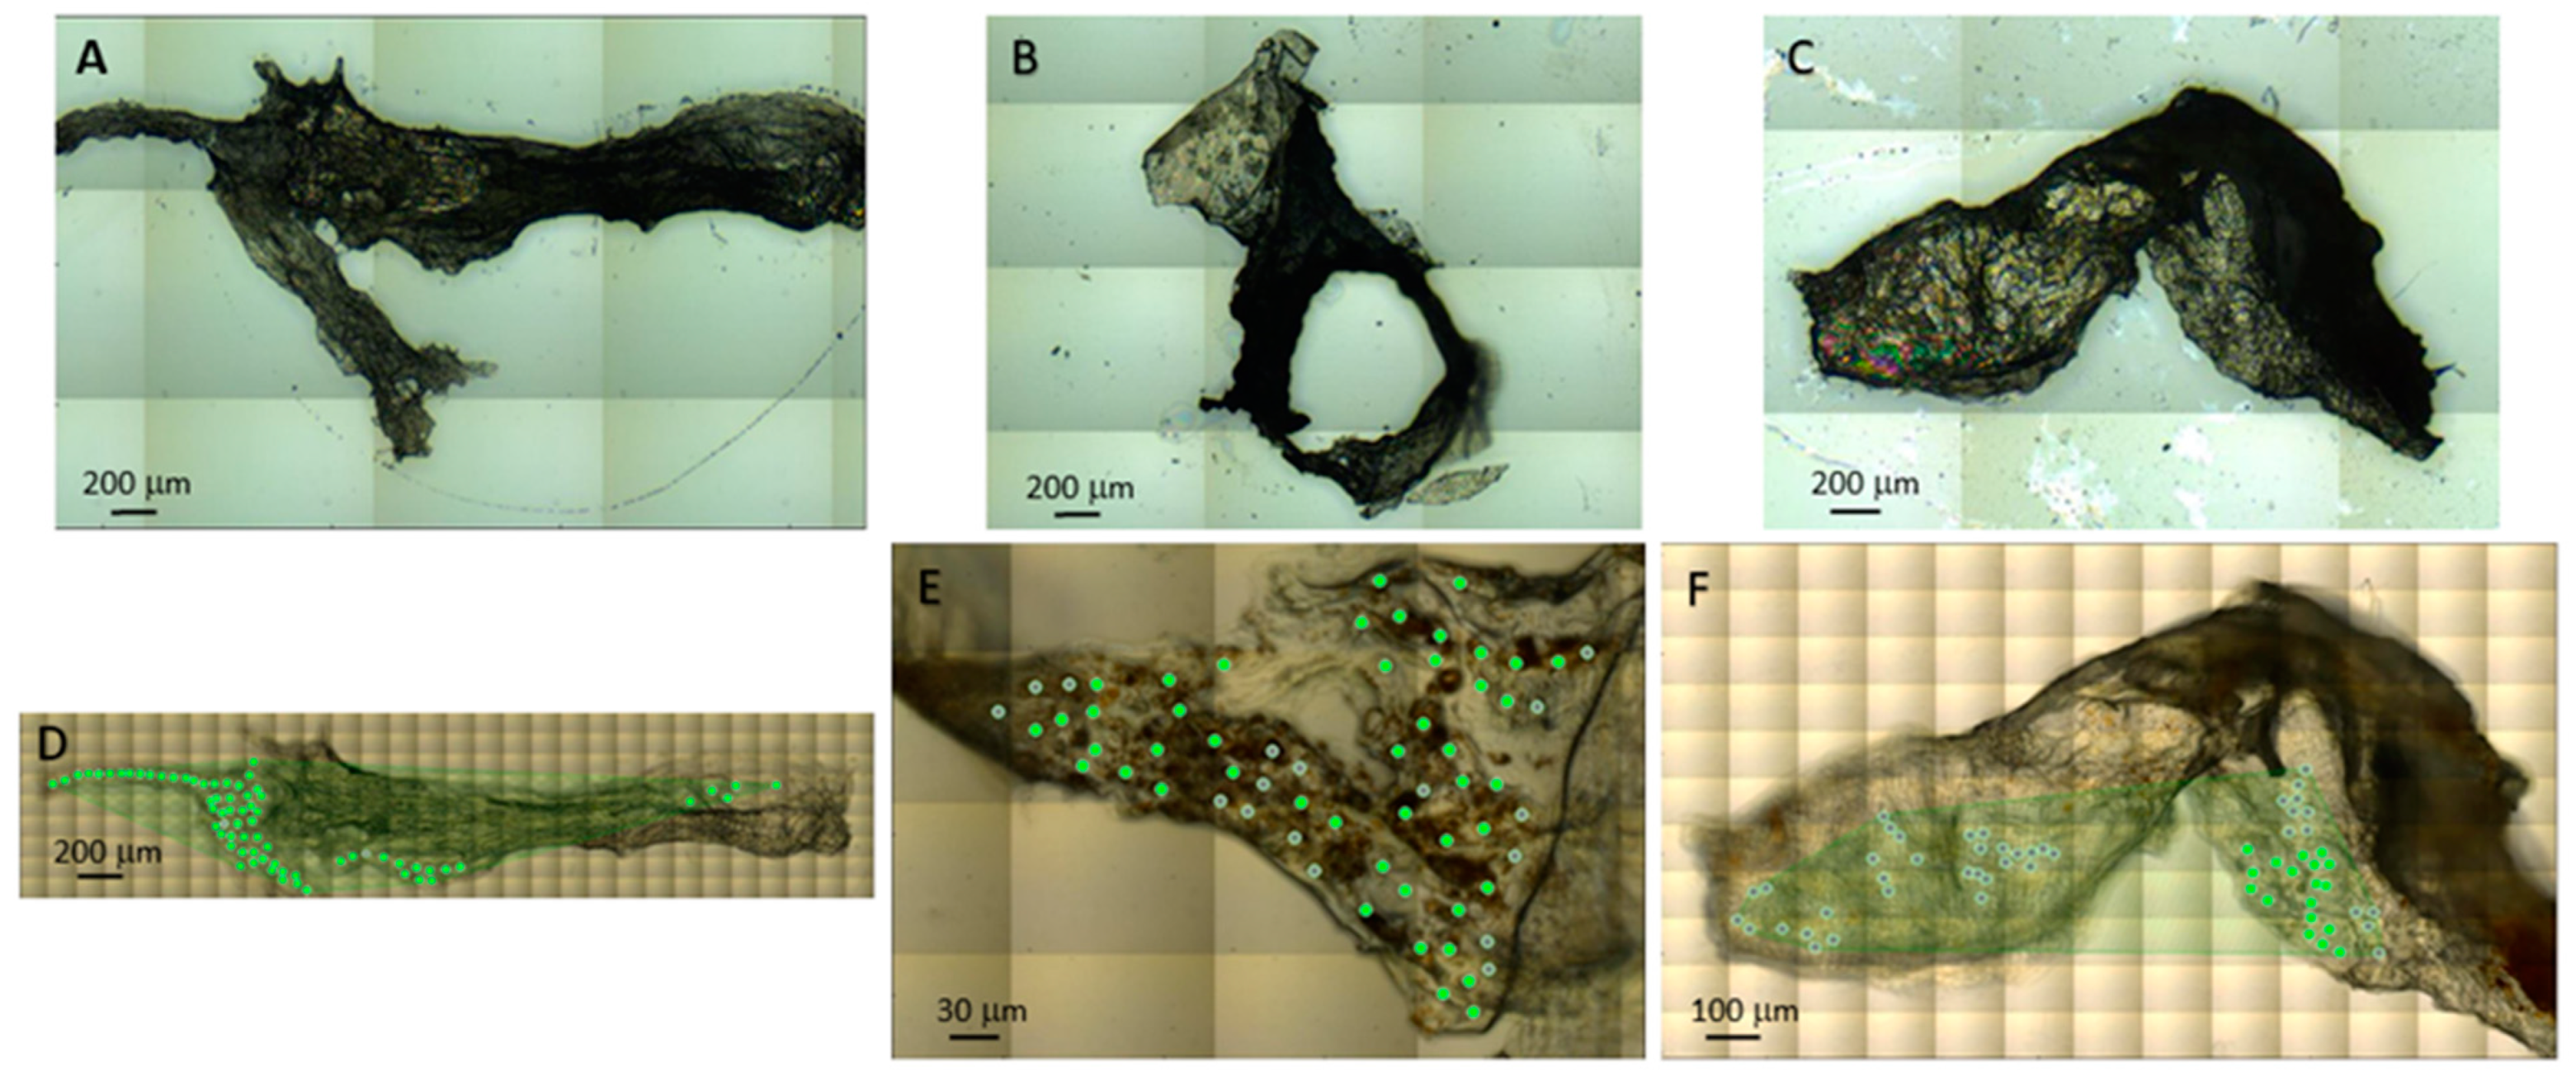
4.1. Sample Preparation
4.2. Synchrotron Radiation-Based FTIR Micro-Spectroscopy
5. Conclusions
Supplementary Materials
Author Contributions
Funding
Institutional Review Board Statement
Informed Consent Statement
Data Availability Statement
Acknowledgments
Conflicts of Interest
References
- George, B.; Chen, S.; Chaudhary, V.; Gonder, J.; Chakrabarti, S. Extracellular matrix proteins in epiretinal membranes and in diabetic retinopathy. Curr. Eye Res. 2009, 34, 134–144. [Google Scholar] [CrossRef] [PubMed]
- Tsotridou, E.; Loukovitis, E.; Zapsalis, K.; Pentara, I.; Asteriadis, S.; Tranos, P.; Zachariadis, Z.; Anogeianakis, G. A Review of Last Decade Developments on Epiretinal Membrane Pathogenesis. Med. Hypothesis Discov. Innov. Ophthalmol. 2020, 9, 91–110. [Google Scholar] [PubMed]
- Fung, A.; Galvin, J.; Tran, T. Epiretinal membrane: A review. Clin. Exp. Ophthalmol. 2021, 49, 289–308. [Google Scholar] [CrossRef] [PubMed]
- Smiddy, W.E.; Maguire, A.M.; Green, W.R.; Michels, R.G.; de la Cruz, Z.; Enger, C.; Jaeger, M.; Rice, T.A. Idiopathic epiretinal membranes: Ultrastructural characteristics and clinicopathologic correlation. Retina 1989, 25 (Suppl. 5), 811–820. [Google Scholar] [CrossRef] [PubMed]
- Andjelić, S.; Lumi, X.; Yan, X.; Graw, J.; Moe, M.C.; Facskó, A.; Hawlina, M.; Petrovski, G. Characterization of ex vivo cultured neuronal- and glial- like cells from human idiopathic epiretinal membranes. BMC Ophthalmol. 2014, 23, 165. [Google Scholar] [CrossRef]
- Bu, S.C.; Kuijer, R.; van der Worp, R.J.; Huiskamp, E.A.; Renardel de Lavalette, V.W.; Li, X.R.; Hooymans, J.M.; Los, L.I. Glial cells and collagens in epiretinal membranes associated with idiopathic macularholes. Retina 2014, 34, 897–906. [Google Scholar] [CrossRef]
- Schumann, R.G.; Eibl, K.H.; Zhao, F.; Scheerbaum, M.; Scheler, R.; Schaumberger, M.M.; Wehnes, H.; Walch, A.K.; Haritoglou, C.; Kampik, A.; et al. Immunocytochemical and ultrastructural evidence of glial cells and hyalocytes in internal limiting membrane specimens of idiopathic macular holes. Investig. Ophthalmol. Vis. Sci. 2011, 52, 7822–7834. [Google Scholar] [CrossRef]
- Bringmann, A.; Pannicke, T.; Grosche, J.; Francke, M.; Wiedemann, P.; Skatchkov, S.N.; Osborne, N.N.; Reichenbach, A. Muller cells in the healthy and diseased retina. Prog. Retin. Eye Res. 2006, 25, 397–424. [Google Scholar] [CrossRef]
- Ioachim, E.; Stefaniotou, M.; Gorezis, S.; Tsanou, E.; Psilas, K.; Agnantis, N.J. Immunohistochemical study of extracellular matrix components in epiretinal membranes of vitreoproliferative retinopathy and proliferative diabetic retinopathy. Eur. J. Ophthalmol. 2005, 15, 384–391. [Google Scholar] [CrossRef]
- Campochiaro, P. The Pathogenesis of Proliferative Vitreoretinopathy; Elsevier Mosby: Philadelphia, PA, USA, 2006. [Google Scholar]
- Veréb, Z.; Lumi, X.; Andjelic, S.; Globocnik-Petrovic, M.; Urbancic, M.; Hawlina, M.; Facskó, A.; Petrovski, G. Functional and molecular characterization of ex vivo cultured epiretinal membrane cells from human proliferative diabetic retinopathy. Biomed. Res. Int. 2013, 2013, 492376. [Google Scholar] [CrossRef]
- Tamaki, K.; Usui-Ouchi, A.; Murakami, A.; Ebihara, N. Fibrocytes and Fibrovascular Membrane Formation in Proliferative Diabetic Retinopathy. Investig. Ophthalmol. Vis. Sci. 2016, 57, 4999–5005. [Google Scholar] [CrossRef]
- Leisser, C.; Paschalis, E.; Rokidi, S.; Behanova, M.; Ruiss, M.; Burgmüller, W.; Findl, O. Fourier-Transform Infrared Spectroscopy of Epiretinal Membranes and Internal Limiting Membranes after Pars Plana Vitrectomy with Membrane Peeling. Ophthalmic Res. 2021, 64, 793–797. [Google Scholar] [CrossRef]
- Surewicz, W.K.; Mantsch, H.H. New insight into protein secondary structure from resolution-enhanced infrared spectra. Biochim. Biophys. Acta Protein Struct. Mol. 1988, 952, 115–130. [Google Scholar] [CrossRef]
- Mantsch, H.H.; McElhaney, R.N. Phospholipid phase transitions in model and biological membranes as studied by infrared spectroscopy. Chem. Phys. Lipids 1991, 57, 213–226. [Google Scholar] [CrossRef] [PubMed]
- Taillandier, E.; Liquier, J. Infrared spectroscopy of DNA. Methods Enzymol. 1992, 211, 307–335. [Google Scholar] [CrossRef] [PubMed]
- Baranska, M. (Ed.) Optical Spectroscopy and Computational Methods in Biology and Medicine; Springer Science & Business Media: Dordrecht, The Netherlands, 2013; Volume 14. [Google Scholar]
- Miller, L.M.; Dumas, P. Chemical imaging of biological tissue with synchrotron infrared light. Biochim. Biophys. Acta Biomembr. 2006, 1758, 846–857. [Google Scholar] [CrossRef] [PubMed]
- Kreuzer, M.; Dučić, T.; Hawlina, M.; Andjelic, S. Synchrotron based FTIR microspectroscopy of protein aggregation and lipids peroxidation changes in human cataractous lens epithelial cells. Sci. Rep. 2020, 10, 15489. [Google Scholar] [CrossRef]
- Bhatia, N.K.; Srivastava, A.; Katyal, N.; Jain, N.; Khan, M.A.; Kundu, B.; Deep, S. Curcumin binds to the pre-fibrillar aggregates of Cu/Zn superoxide dismutase (SOD1) and alters its amyloidogenic pathway resulting in reduced cytotoxicity. Biochim. Biophys. Acta Proteins Proteom. 2015, 1854, 426–436. [Google Scholar] [CrossRef]
- Sarroukh, R.; Goormaghtigh, E.; Ruysschaert, J.M.; Raussens, V. ATR-FTIR: A ‘rejuvenated’ tool to investigate amyloid proteins. Biochim. Biophys. Acta Biomembr. 2013, 1828, 2328–2338. [Google Scholar] [CrossRef]
- Olsztyńska-Janus, S.; Pietruszka, A.; Kiełbowicz, Z.; Czarnecki, M.A. ATR-IR study of skin components: Lipids, proteins and water. Part I: Temperature effect. Spectrochim. Acta Part A Mol. Biomol. Spectrosc. 2018, 188, 37–49. [Google Scholar] [CrossRef]
- Shahzad, M.I.; Giorcelli, M.; Shahzad, N.; Guastella, S.; Castellino, M.; Jagdale, P.; Tagliaferro, A. Study of carbon nanotubes based Polydimethylsiloxane composite films. J. Phys. Conf. Ser. 2013, 439, 012010. [Google Scholar] [CrossRef]
- Sanden, K.W.; Böcker, U.; Ofstad, R.; Pedersen, M.E.; Høst, V.; Afseth, N.K.; Rønning, S.B.; Pleshko, N. Characterization of Collagen Structure in Normal, Wooden Breast and Spaghetti Meat Chicken Fillets by FTIR Microspectroscopy and Histology. Foods 2021, 10, 548. [Google Scholar] [CrossRef]
- Cheheltani, R.; McGoverin, C.M.; Rao, J.; Vorp, D.A.; Kiani, M.F.; Pleshko, N. Fourier transform infrared spectroscopy to quantify collagen and elastin in an in vitro model of extracellular matrix degradation in aorta. Analyst 2014, 139, 3039–3047. [Google Scholar] [CrossRef] [PubMed]
- Liu, K.Z.; Man, A.; Shaw, R.A.; Liang, B.; Xu, Z.; Gong, Y. Molecular determination of liver fibrosis by synchrotron infrared microspectroscopy. Biochim. Biophys. Acta 2006, 1758, 960–967. [Google Scholar] [CrossRef] [PubMed][Green Version]
- Querido, W.; Kandel, S.; Pleshko, N. Applications of vibrational spectroscopy for analysis of connective tissues. Molecules 2021, 26, 922. [Google Scholar] [CrossRef] [PubMed]
- Suryadevara, V.; Nazeer, S.S.; Sreedhar, H.; Adelaja, O.; Kajdacsy-Balla, A.; Natarajan, V.; Walsh, M.J. Infrared spectral microscopy as a tool to monitor lung fibrosis development in a model system. Biomed. Opt. Express. 2020, 11, 3996–4007. [Google Scholar] [CrossRef] [PubMed]
- Mantsch, H.H.; Jackson, M. Molecular spectroscopy in biodiagnostics (from hippocrates to herschel and beyond). J. Mol. Struct. 1995, 347, 187–206. [Google Scholar] [CrossRef]
- Riaza, T.; Zeeshana, R.; Zarifa, F.; Ilyasa, K.; Muhammada, N.; Safia, S.Z.; Rahima, A.; Rizvib, S.A.A.; Rehman, I.U. FTIR analysis of natural and synthetic collagen. Appl. Spectrosc. Rev. 2018, 53, 703–746. [Google Scholar] [CrossRef]
- Lasch, P.; Boese, M.; Pacifico, A.; Diem, M. Ft–IR spectroscopic investigations of single cells on the subcellular level. Vib. Spectrosc. 2002, 28, 147–157. [Google Scholar] [CrossRef]
- Wood, B.R.; Chernenko, T.; Matthäus, C.; Diem, M.; Chong, C.; Bernhard, U.; Jene, C.; Brandli, A.A.; McNaughton, D.; Tobin, M.J.; et al. Shedding new light on the molecular architecture of oocytes using a combination of synchrotron Fourier transform-infrared and Raman spectroscopic imaging. Anal. Chem. 2008, 80, 9065–9072. [Google Scholar] [CrossRef]
- Ozek, N.S.; Tuna, S.; Erson-Bensan, A.E.; Severcan, F. Characterization of microRNA-125b expression in mCF7 breast cancer cells by AtR-FtIR spectroscopy. Analyst 2010, 135, 3094–3102. [Google Scholar] [CrossRef] [PubMed]
- Chen, Y.; Kearns, V.R.; Zhou, L.; Sandinha, T.; Lam, W.C.; Steel, D.H.; Chan, Y.K. Silicone oil in vitreoretinal surgery: Indications, complications, new developments and alternative long-term tamponade agents. Acta Ophthalmol. 2021, 99, 240–250. [Google Scholar] [CrossRef] [PubMed]
- Barca, F.; Caporossi, T.; Rizzo, S. Silicone oil: Different physical proprieties and clinical applications. Biomed. Res. Int. 2014, 2014, 502143. [Google Scholar] [CrossRef] [PubMed]
- Faulborn, J.; Bowald, S. Silikonöl in epiretinalen Membranen 3-4 Monate nach Implantation: Mikroskopische Befunde in 2 Fällen [Silicone oil in epiretinal membranes 3-4 months following implantation: Microscopic findings in 2 cases]. Klin Monbl. Augenheilkd. 1986, 188, 133–134. [Google Scholar] [CrossRef]
- Bornfeld, N.; E1-Hifnawi, E.; Laqua, H. Ultrastructural characteristics of preretinal membranes from human eyes filled with silicone oil. Am. J. Ophthalmol. 1987, 103, 770–775. [Google Scholar] [CrossRef]
- Kirchhof, B.; Tavakolian, U.; Paulmann, H.; Heimann, K. Histopathological findings in eyes after silicone oil injection. Graefes Arch. Clin. Exp. Ophthalmol. 1986, 224, 34–37. [Google Scholar] [CrossRef]
- Ni, C.; Wang, W.J.; Albert, D.M.; Schepens, C.L. Intravitreous silicone injection. Histopathologic findings in a human eye after 12 years. Arch. Ophthalmol. 1983, 101, 1399–1401. [Google Scholar] [CrossRef]
- Leaver, P.K.; Grey, R.H.; Garner, A. Silicone oil injection in the treatment of massive preretinal retraction: II. Late com plications in 93 eyes. Br. J. Ophthalmol. 1979, 63, 361–367. [Google Scholar] [CrossRef]
- Altera, A.; Tosi, G.M.; Regoli, M.; De Benedetto, E.; Bertelli, E. The extracellular matrix complexity of idiopathic epiretinal membranes and the bilaminar arrangement of the associated internal limiting membrane in the posterior retina. Graefes Arch. Clin. Exp. Ophthalmol. 2021, 259, 2559–2571. [Google Scholar] [CrossRef]
- Yang, Y.; Sulé-Suso, J.; Sockalingum, G.D.; Kegelaer, G.; Manfait, M.; El Haj, A.J. Study of tumor cell invasion by Fourier transform infrared microspectroscopy. Biopolymers 2005, 78, 311–317. [Google Scholar] [CrossRef]
- Wood, B.R.; Quinn, M.A.; Tait, B.; Ashdown, M.; Hislop, T.; Romeo, M.; McNaughton, D. FTIR microspectroscopic study of cell types and potential confounding variables in screening for cervical malignancies. Biospectroscopy 1998, 4, 75–91. [Google Scholar] [CrossRef]
- Dovbeshko, G.; Gridina, N.Y.; Kruglova, E.B.; Pashchuk, O.P. FTIR spectroscopy studies of nucleic acid damage. Talanta 1997, 53, 233–246. [Google Scholar] [CrossRef]
- Zohdi, V.; Whelan, D.R.; Wood, B.R.; Pearson, J.T.; Bambery, K.R.; Black, M.J. Importance of Tissue Preparation Methods in FTIR Micro-Spectroscopical Analysis of Biological Tissues: ‘Traps for New Users’. PLoS ONE 2015, 10, e0116491. [Google Scholar] [CrossRef] [PubMed]
- Yousef, I.; Ribó, L.; Crisol, A.; Šics, I.; Ellis, G.; Ducic, T.; Kreuzer, M.; Benseny-Cases, N.; Quispe, M.; Dumas, P.; et al. MIRAS: The Infrared Synchrotron Radiation Beamline at ALBA. Synchrotron Radiat News 2017, 30, 4–6. [Google Scholar] [CrossRef]
- Toplak, M.; Birarda, G.; Read, S.; Sandt, C.; Rosendahl, S.M.; Vaccari, L.; Demšar, J.; Borondics, F. Infrared Orange: Connecting Hyperspectral Data with Machine Learning. Synchrotron Radiat News 2017, 30, 40–45. [Google Scholar] [CrossRef]
- Lumi, X.; Dučić, T.; Kreuzer, M.; Hawlina, M.; Andjelic, S. UV Effect on Human Anterior Lens Capsule Macro-Molecular Composition Studied by Synchrotron-Based FTIR Micro-Spectroscopy. Int. J. Mol. Sci. 2021, 22, 5249. [Google Scholar] [CrossRef] [PubMed]


Disclaimer/Publisher’s Note: The statements, opinions and data contained in all publications are solely those of the individual author(s) and contributor(s) and not of MDPI and/or the editor(s). MDPI and/or the editor(s) disclaim responsibility for any injury to people or property resulting from any ideas, methods, instructions or products referred to in the content. |
© 2023 by the authors. Licensee MDPI, Basel, Switzerland. This article is an open access article distributed under the terms and conditions of the Creative Commons Attribution (CC BY) license (https://creativecommons.org/licenses/by/4.0/).
Share and Cite
Andjelic, S.; Kreuzer, M.; Hawlina, M.; Lumi, X. Characterization of Different Types of Epiretinal Proliferations by Synchrotron Radiation-Based Fourier Transform Infrared Micro-Spectroscopy. Int. J. Mol. Sci. 2023, 24, 4834. https://doi.org/10.3390/ijms24054834
Andjelic S, Kreuzer M, Hawlina M, Lumi X. Characterization of Different Types of Epiretinal Proliferations by Synchrotron Radiation-Based Fourier Transform Infrared Micro-Spectroscopy. International Journal of Molecular Sciences. 2023; 24(5):4834. https://doi.org/10.3390/ijms24054834
Chicago/Turabian StyleAndjelic, Sofija, Martin Kreuzer, Marko Hawlina, and Xhevat Lumi. 2023. "Characterization of Different Types of Epiretinal Proliferations by Synchrotron Radiation-Based Fourier Transform Infrared Micro-Spectroscopy" International Journal of Molecular Sciences 24, no. 5: 4834. https://doi.org/10.3390/ijms24054834
APA StyleAndjelic, S., Kreuzer, M., Hawlina, M., & Lumi, X. (2023). Characterization of Different Types of Epiretinal Proliferations by Synchrotron Radiation-Based Fourier Transform Infrared Micro-Spectroscopy. International Journal of Molecular Sciences, 24(5), 4834. https://doi.org/10.3390/ijms24054834