
MUC1 Expression Affects the Immunoflogosis in Renal Cell Carcinoma Microenvironment through Complement System Activation and Immune Infiltrate Modulation

 ,
,  , ,
, ,  ,
,  and
and 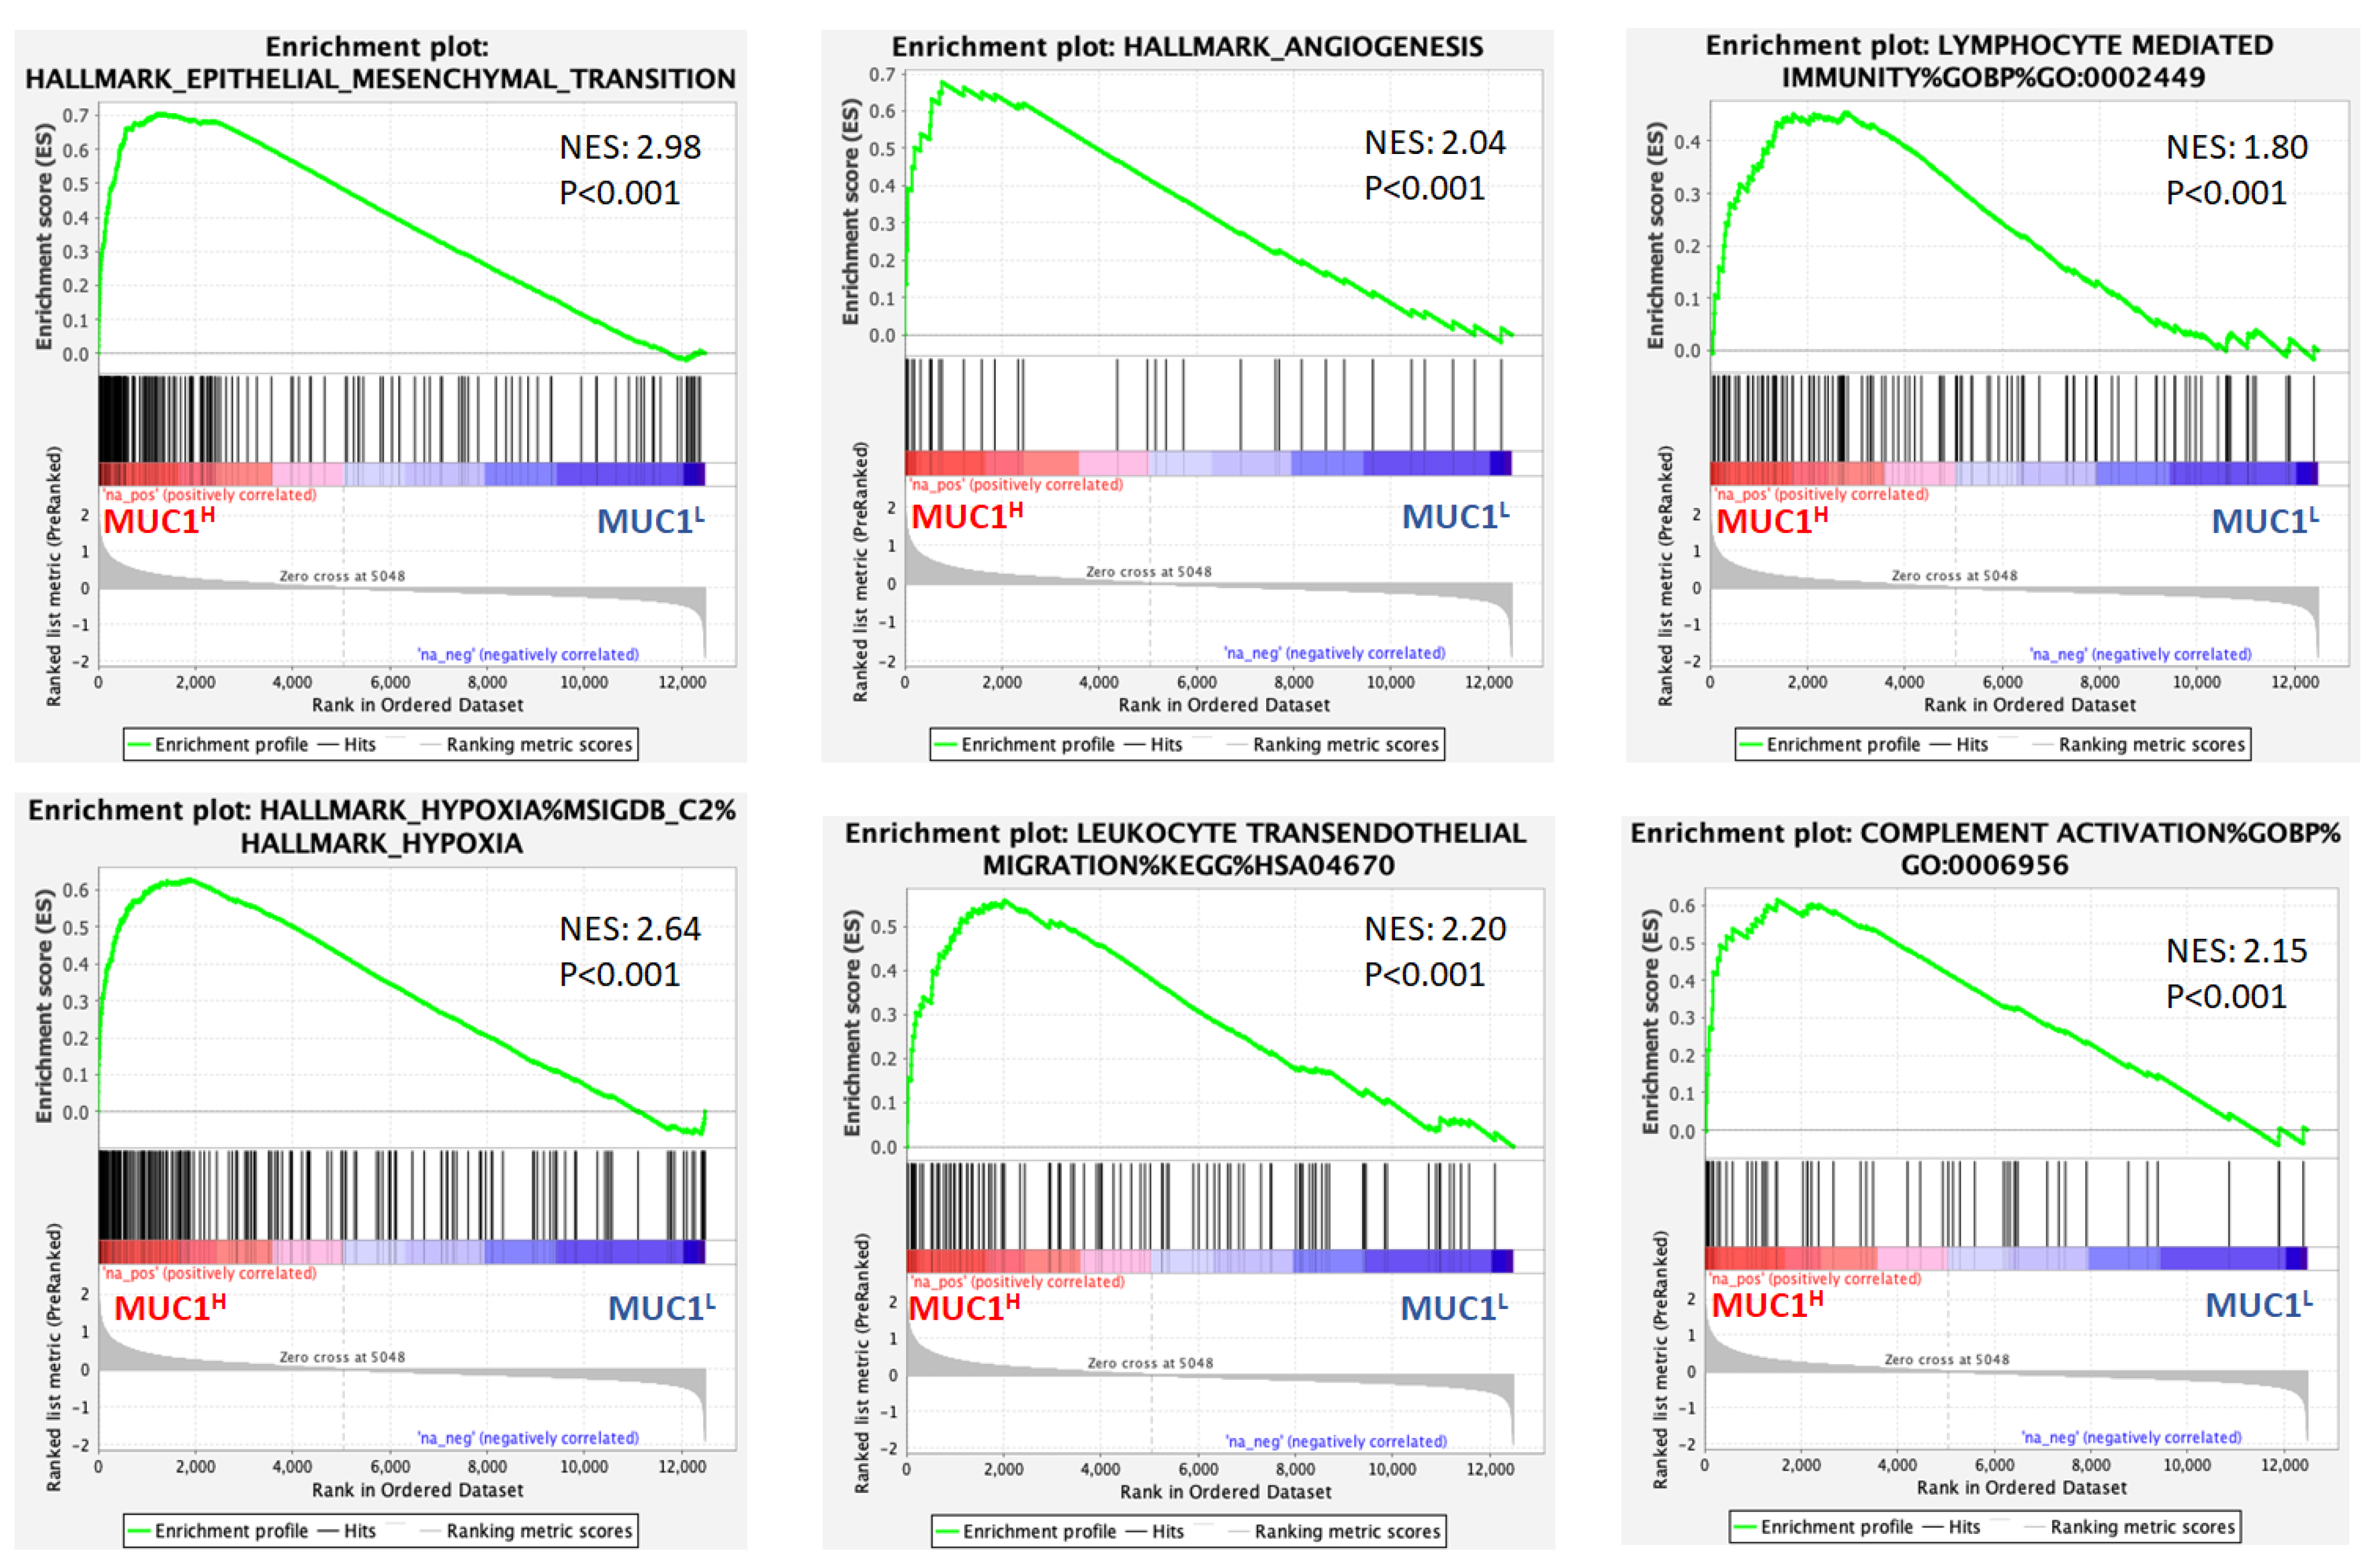
Abstract
1. Introduction
2. Results
2.1. Gene Set Enrichment Analysis (GSEA) Shows Differences in Gene Expression Patterns between MUC1H and MUC1L Tumors
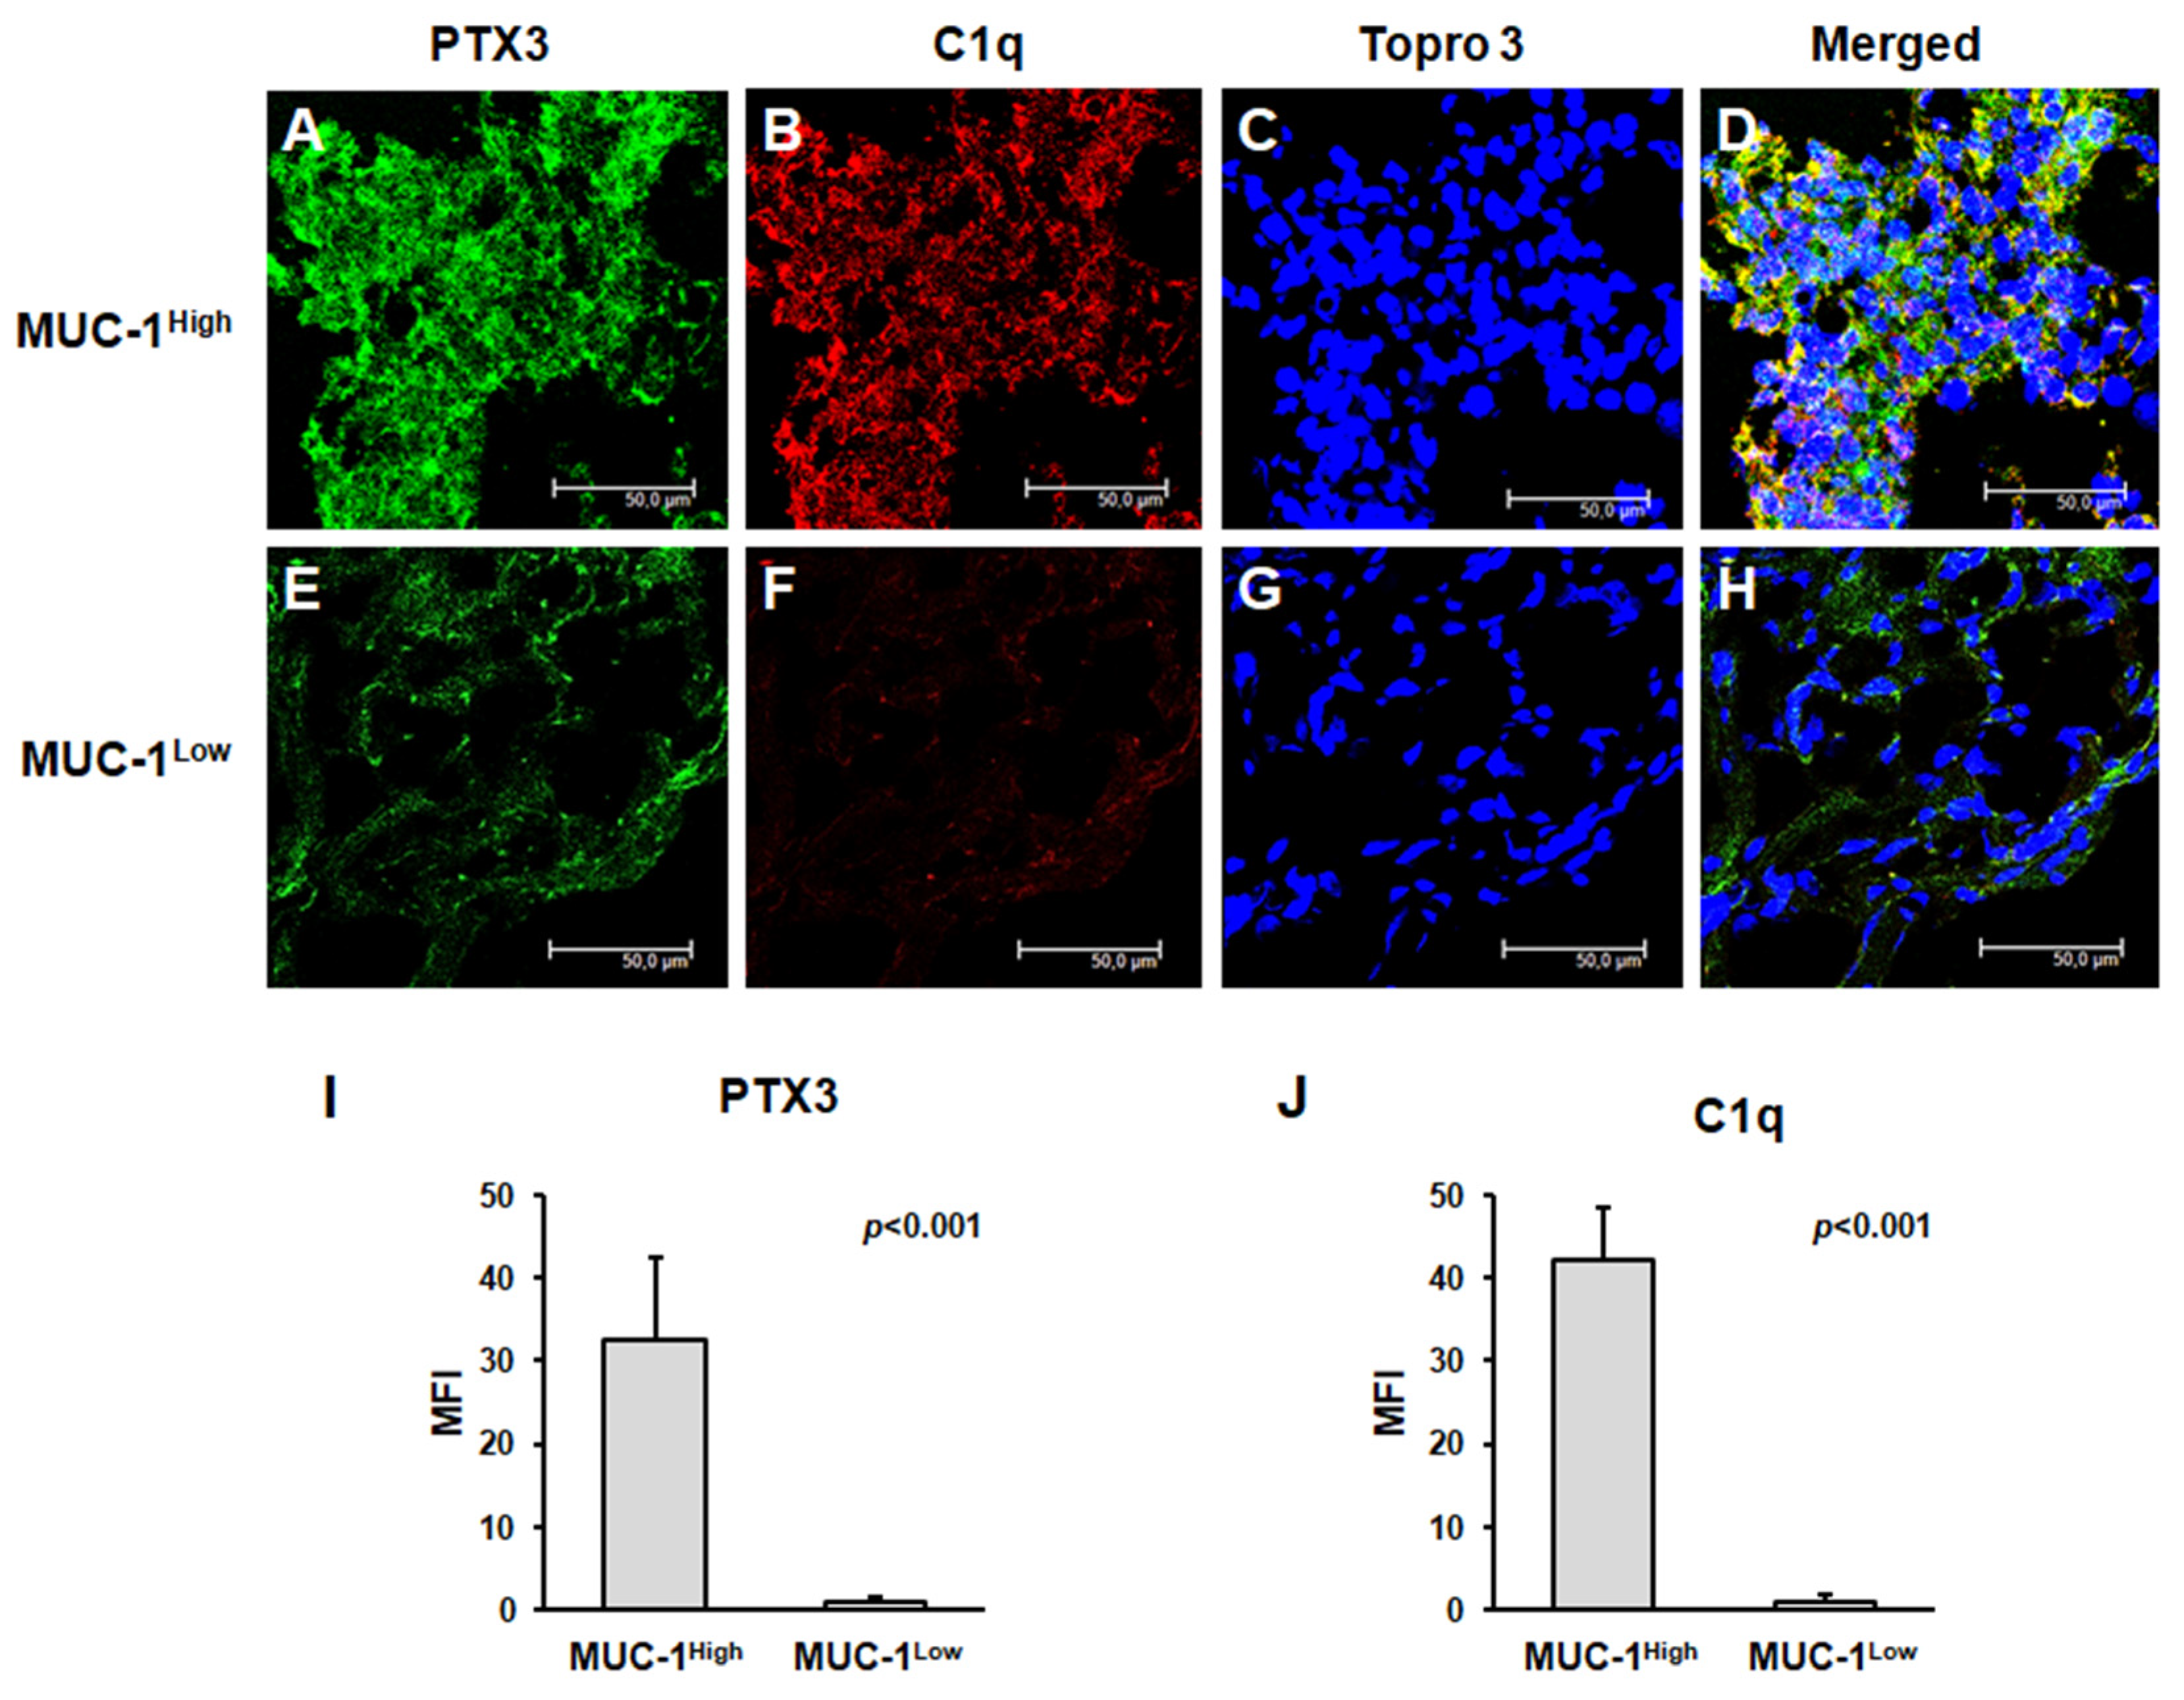
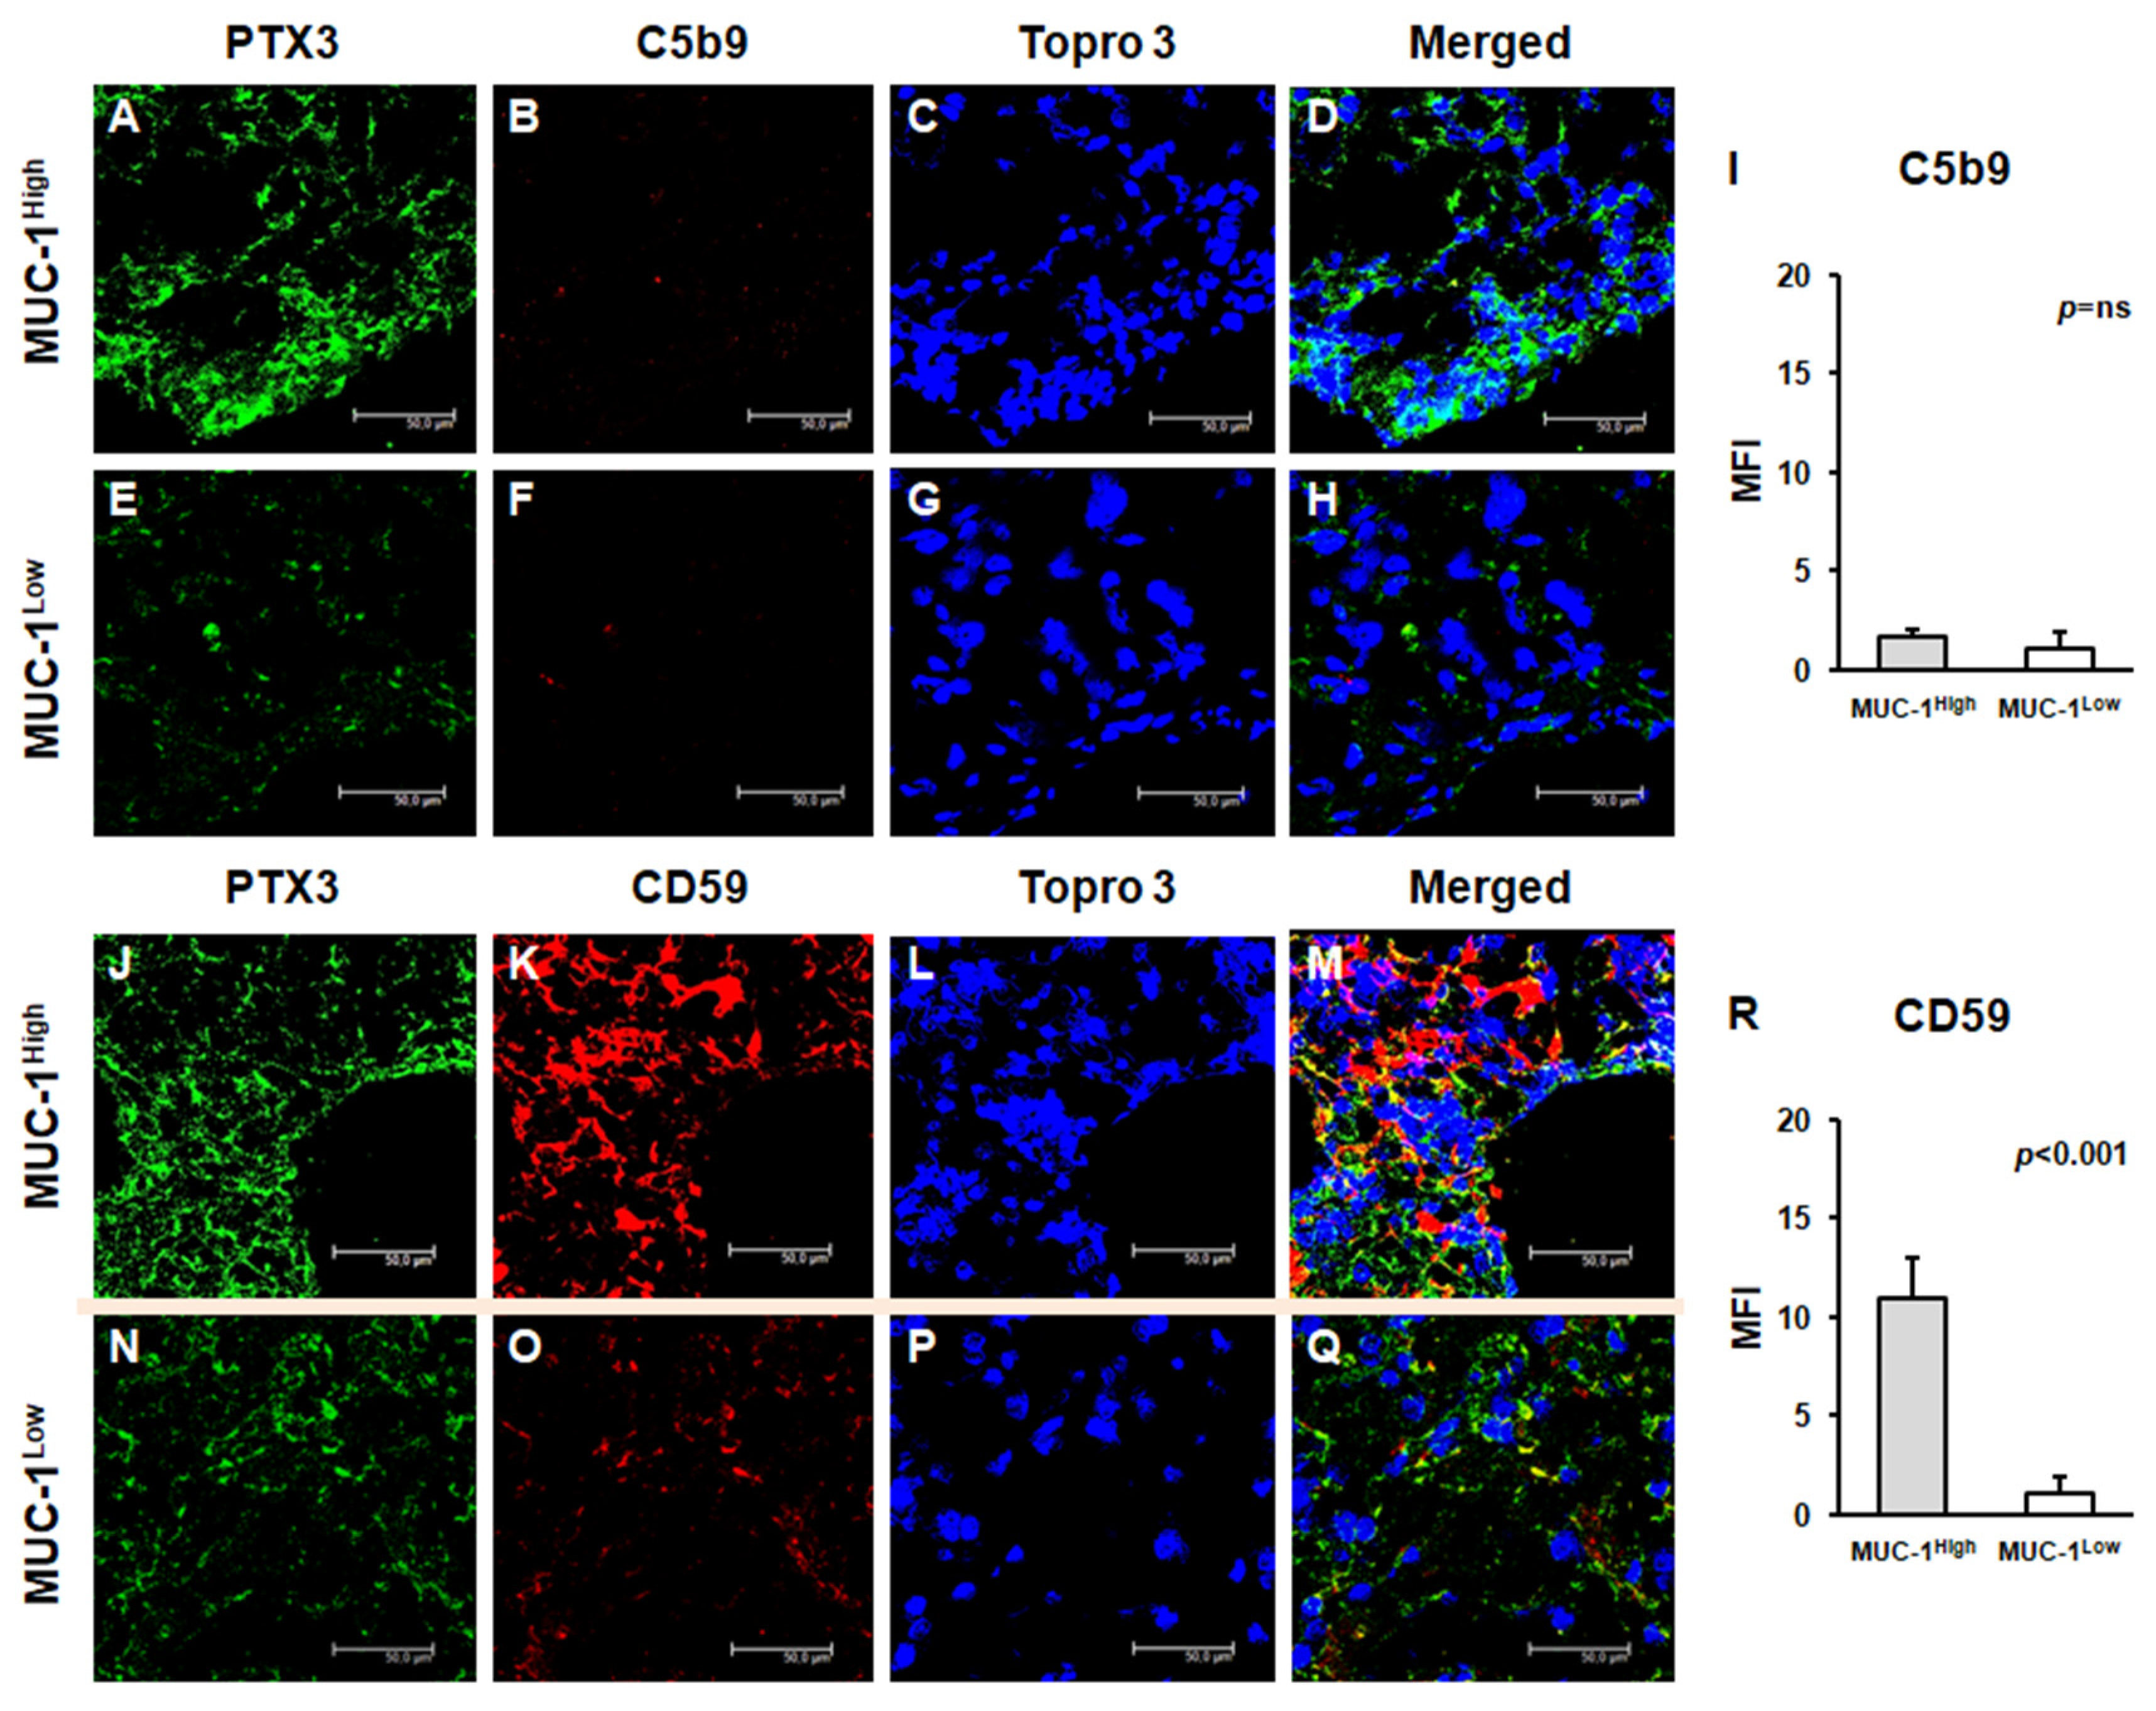
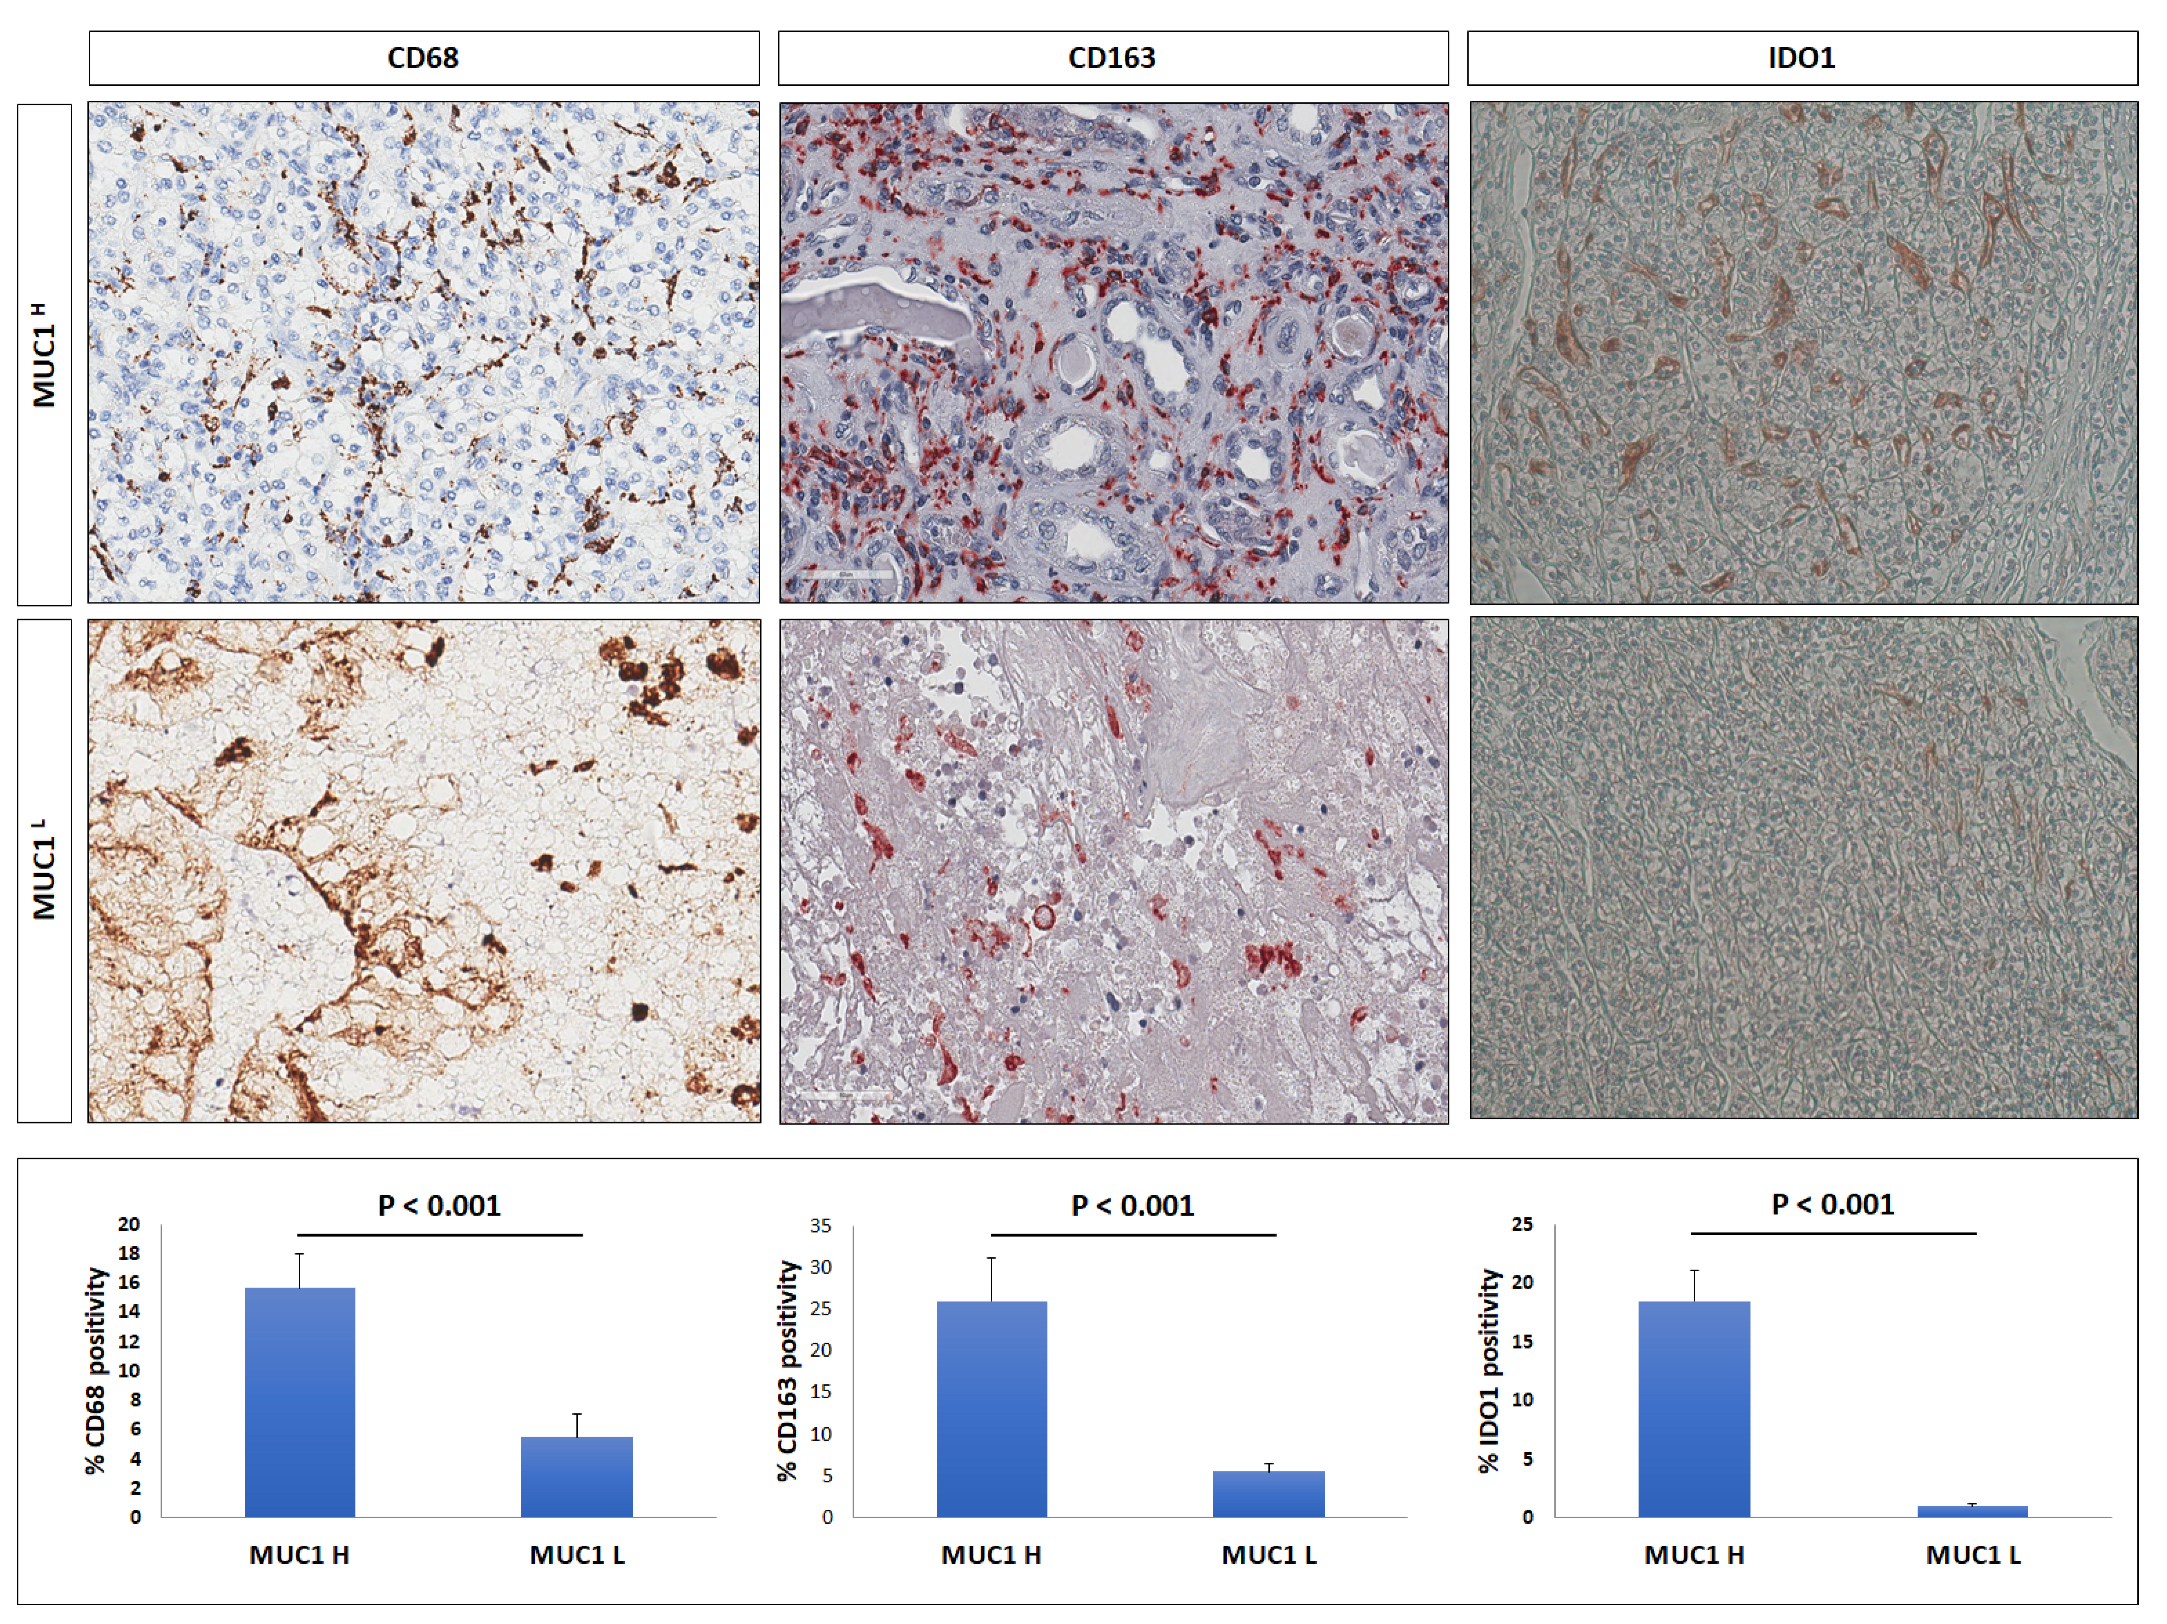
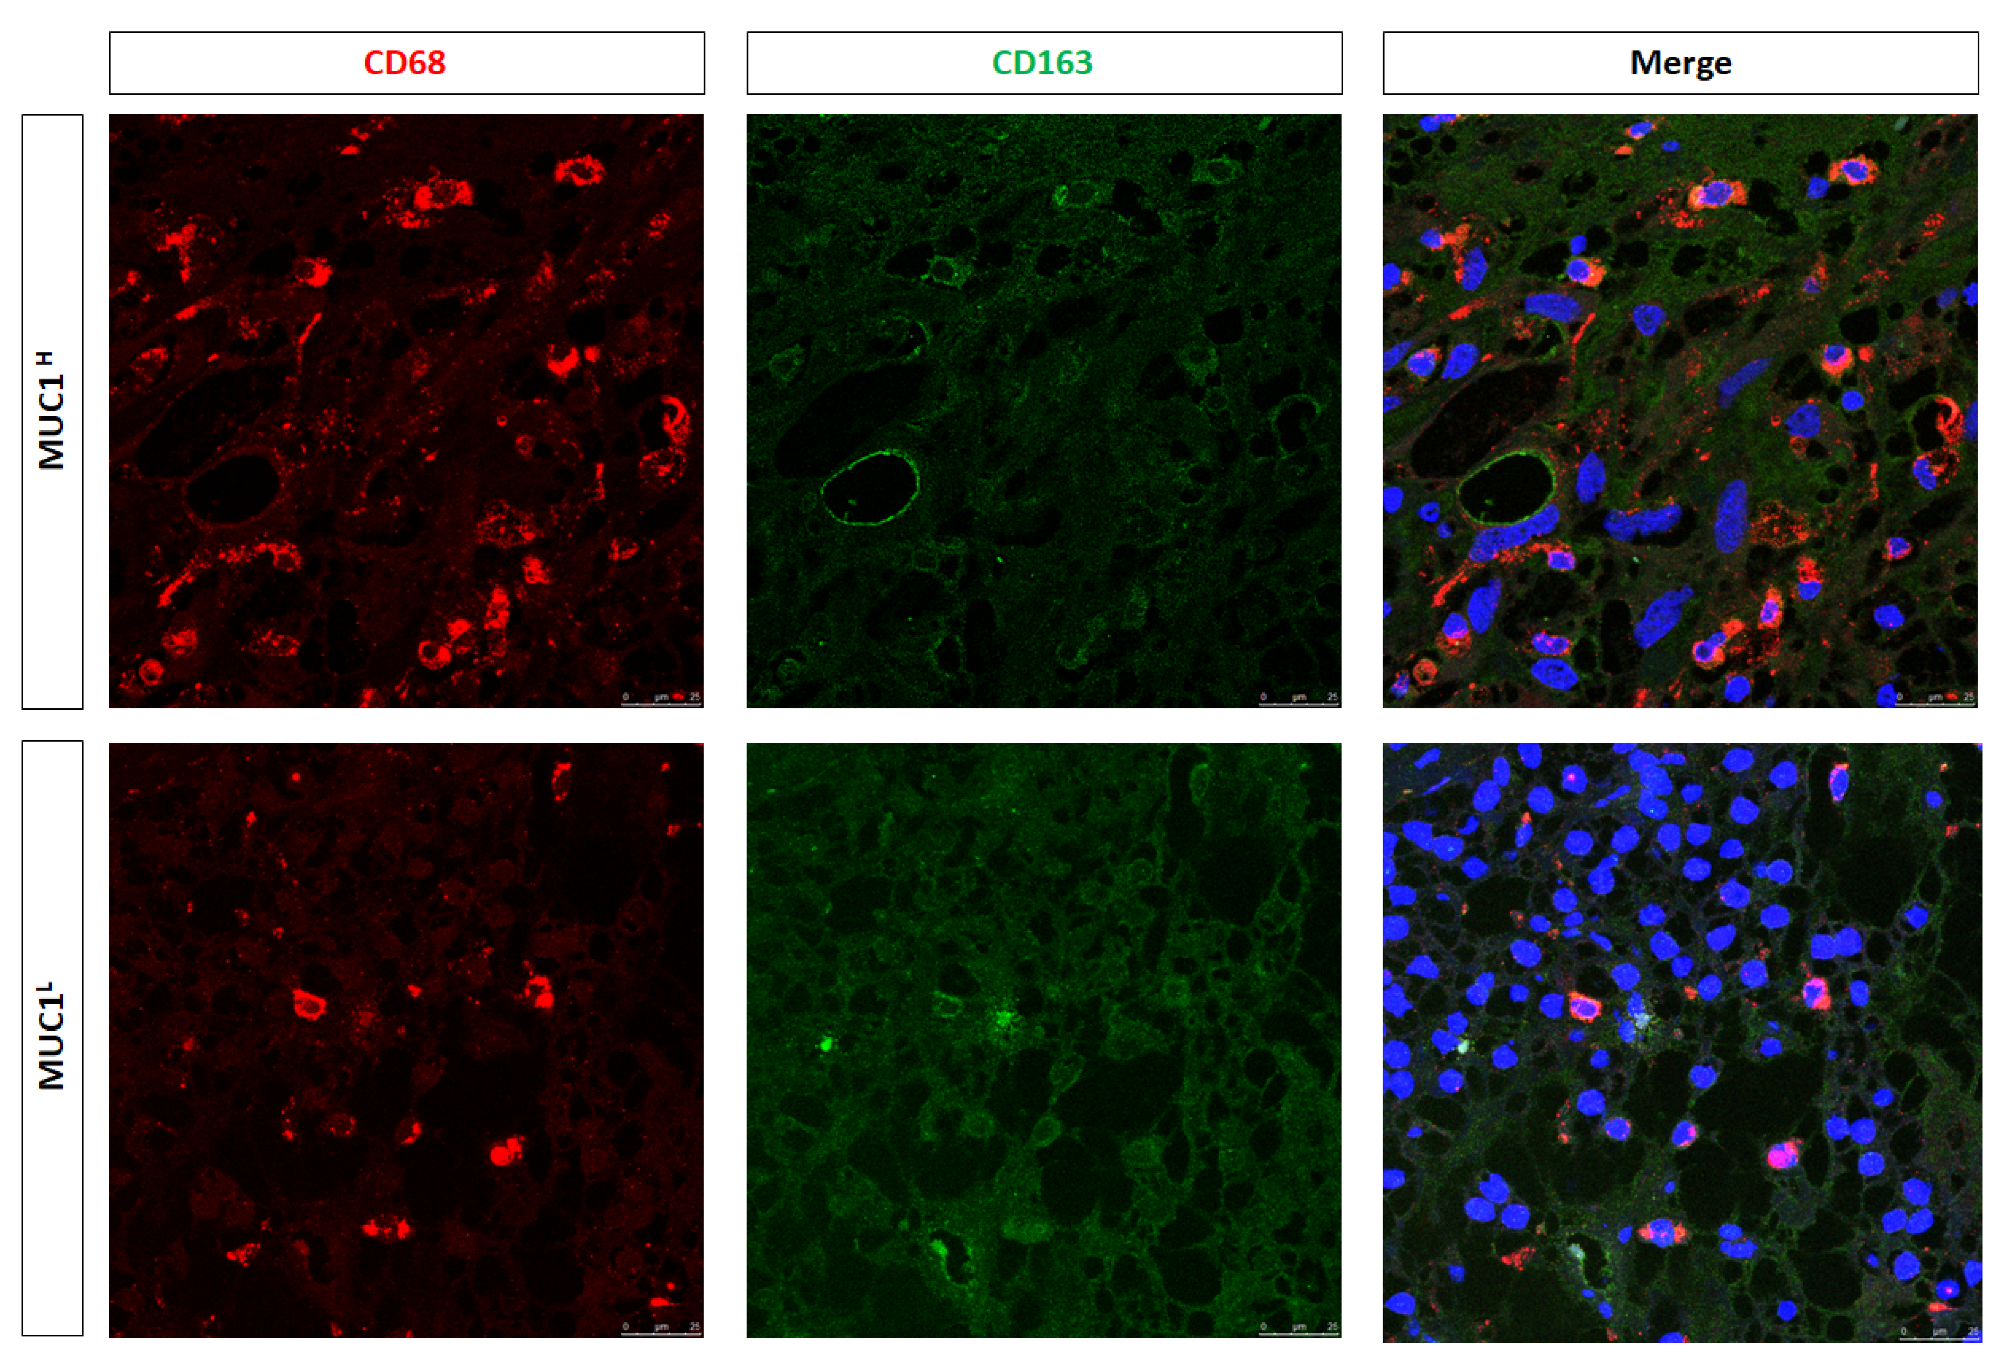
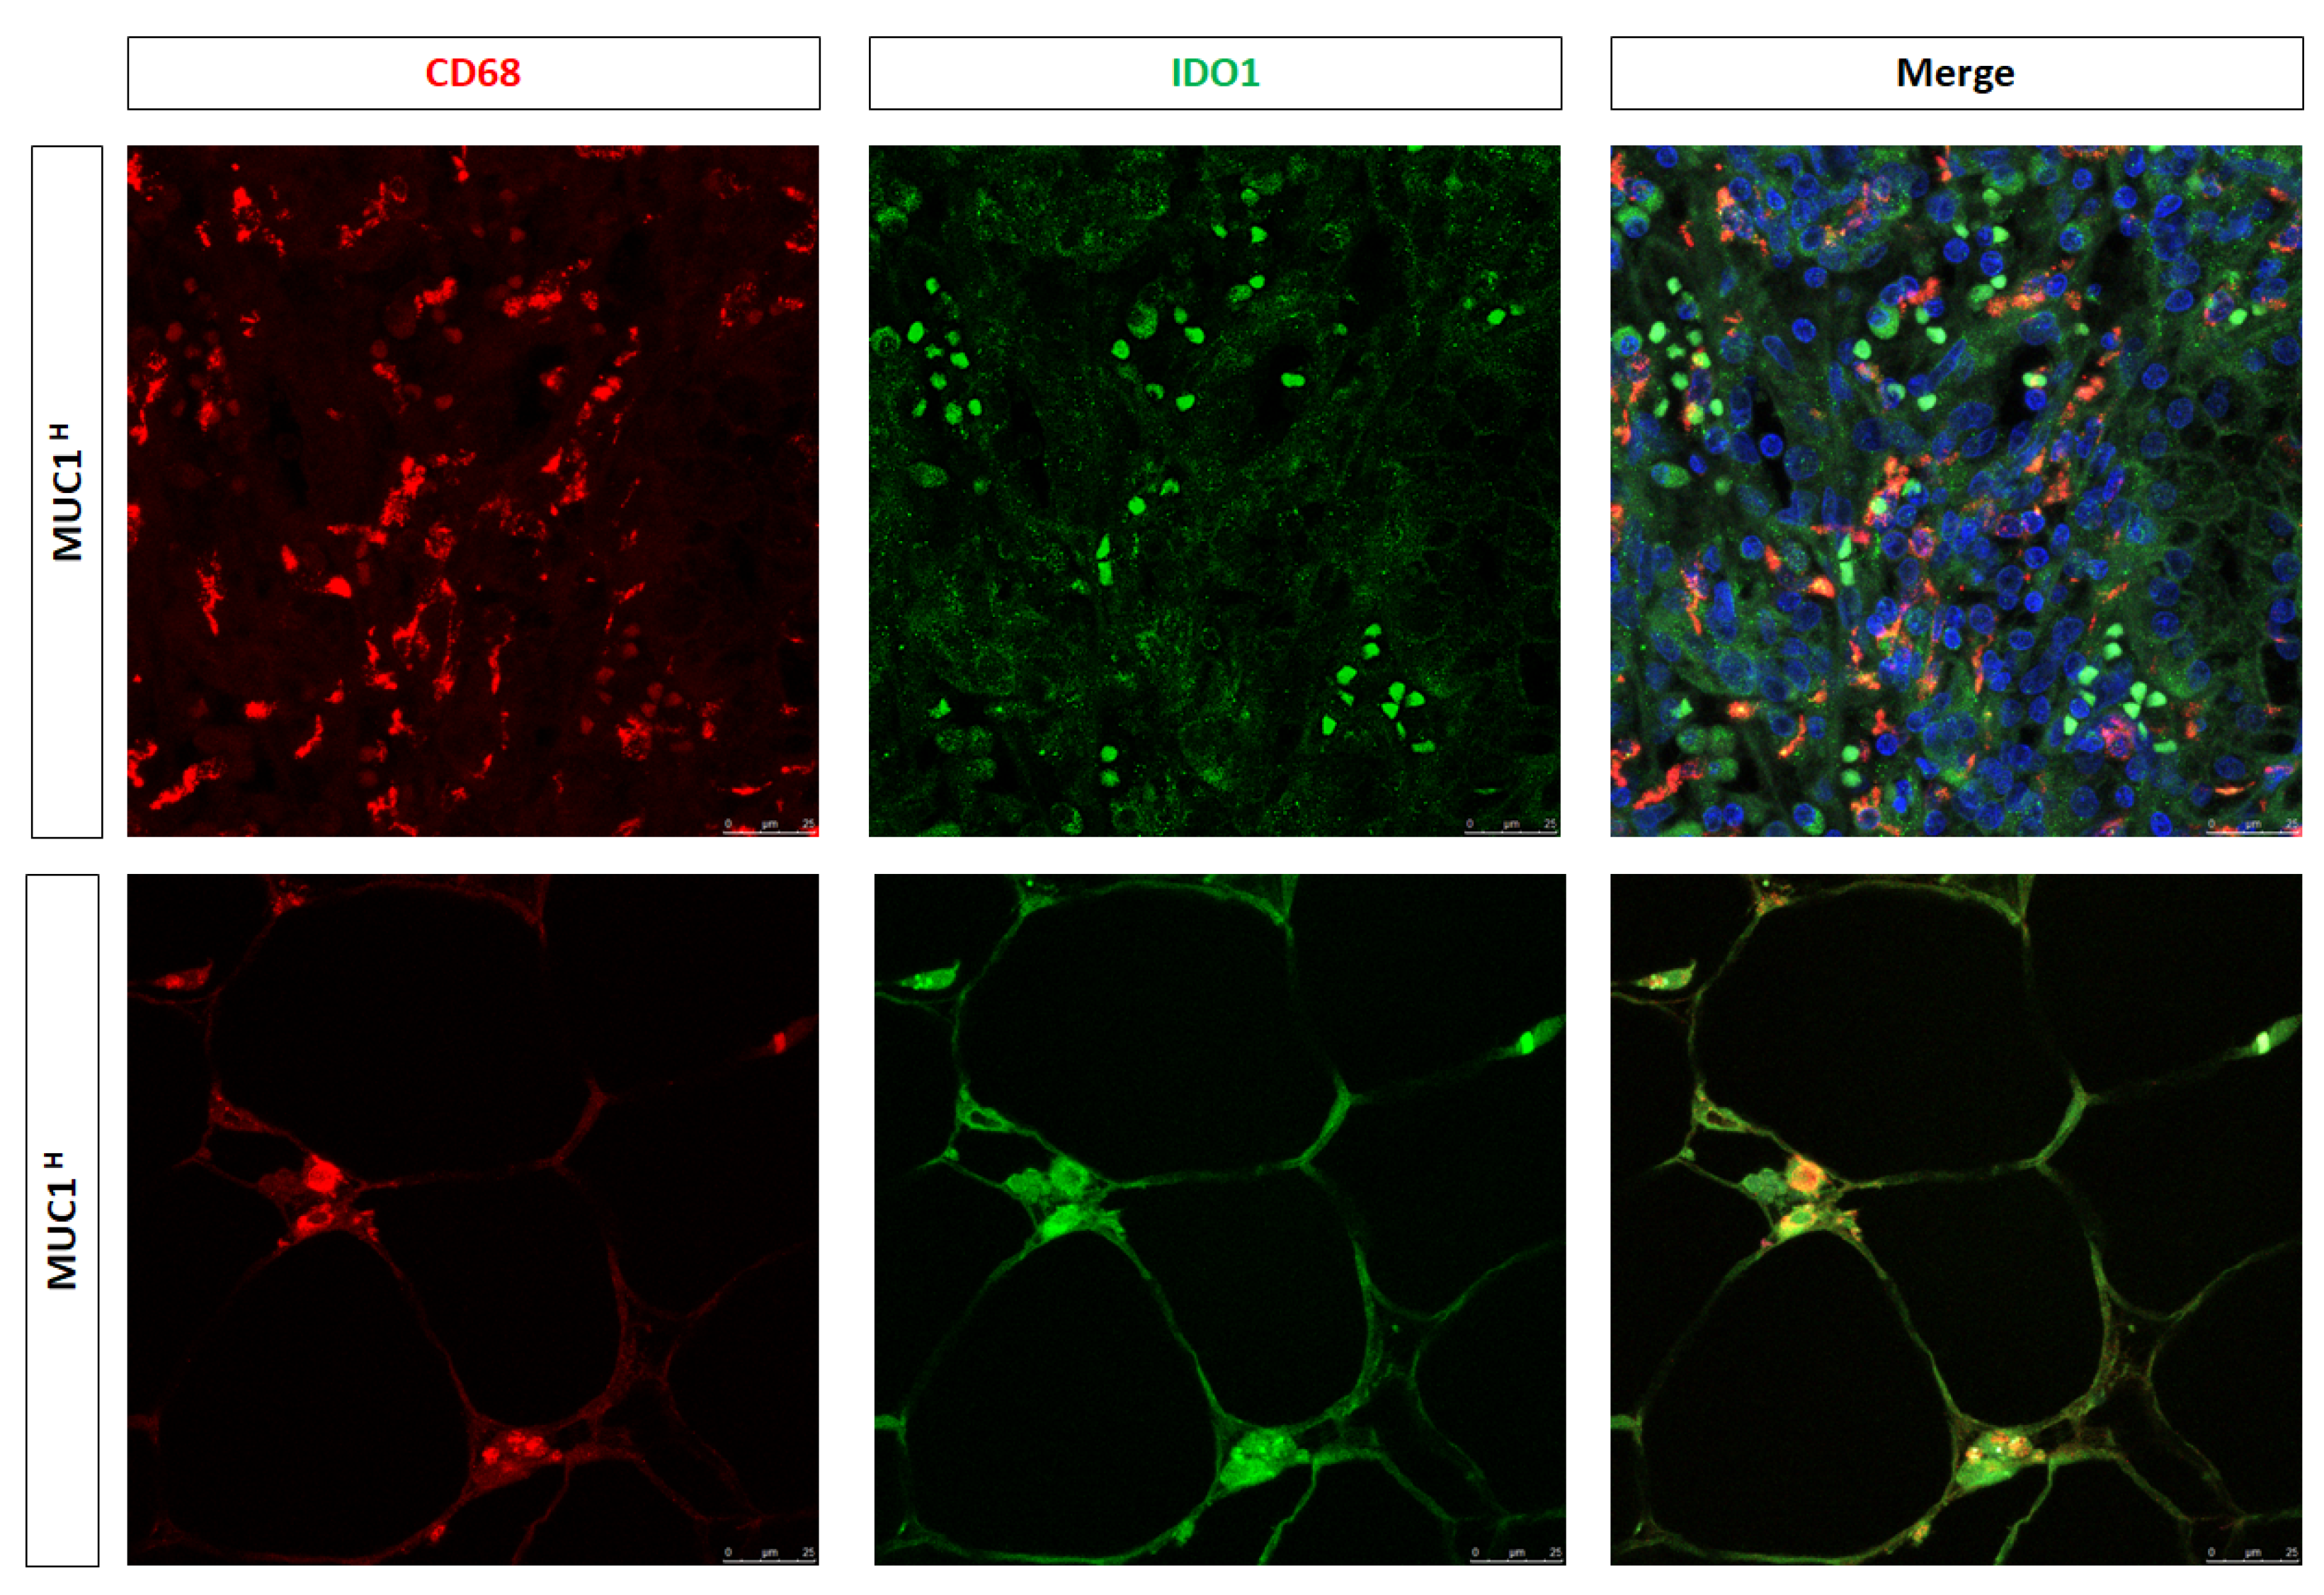
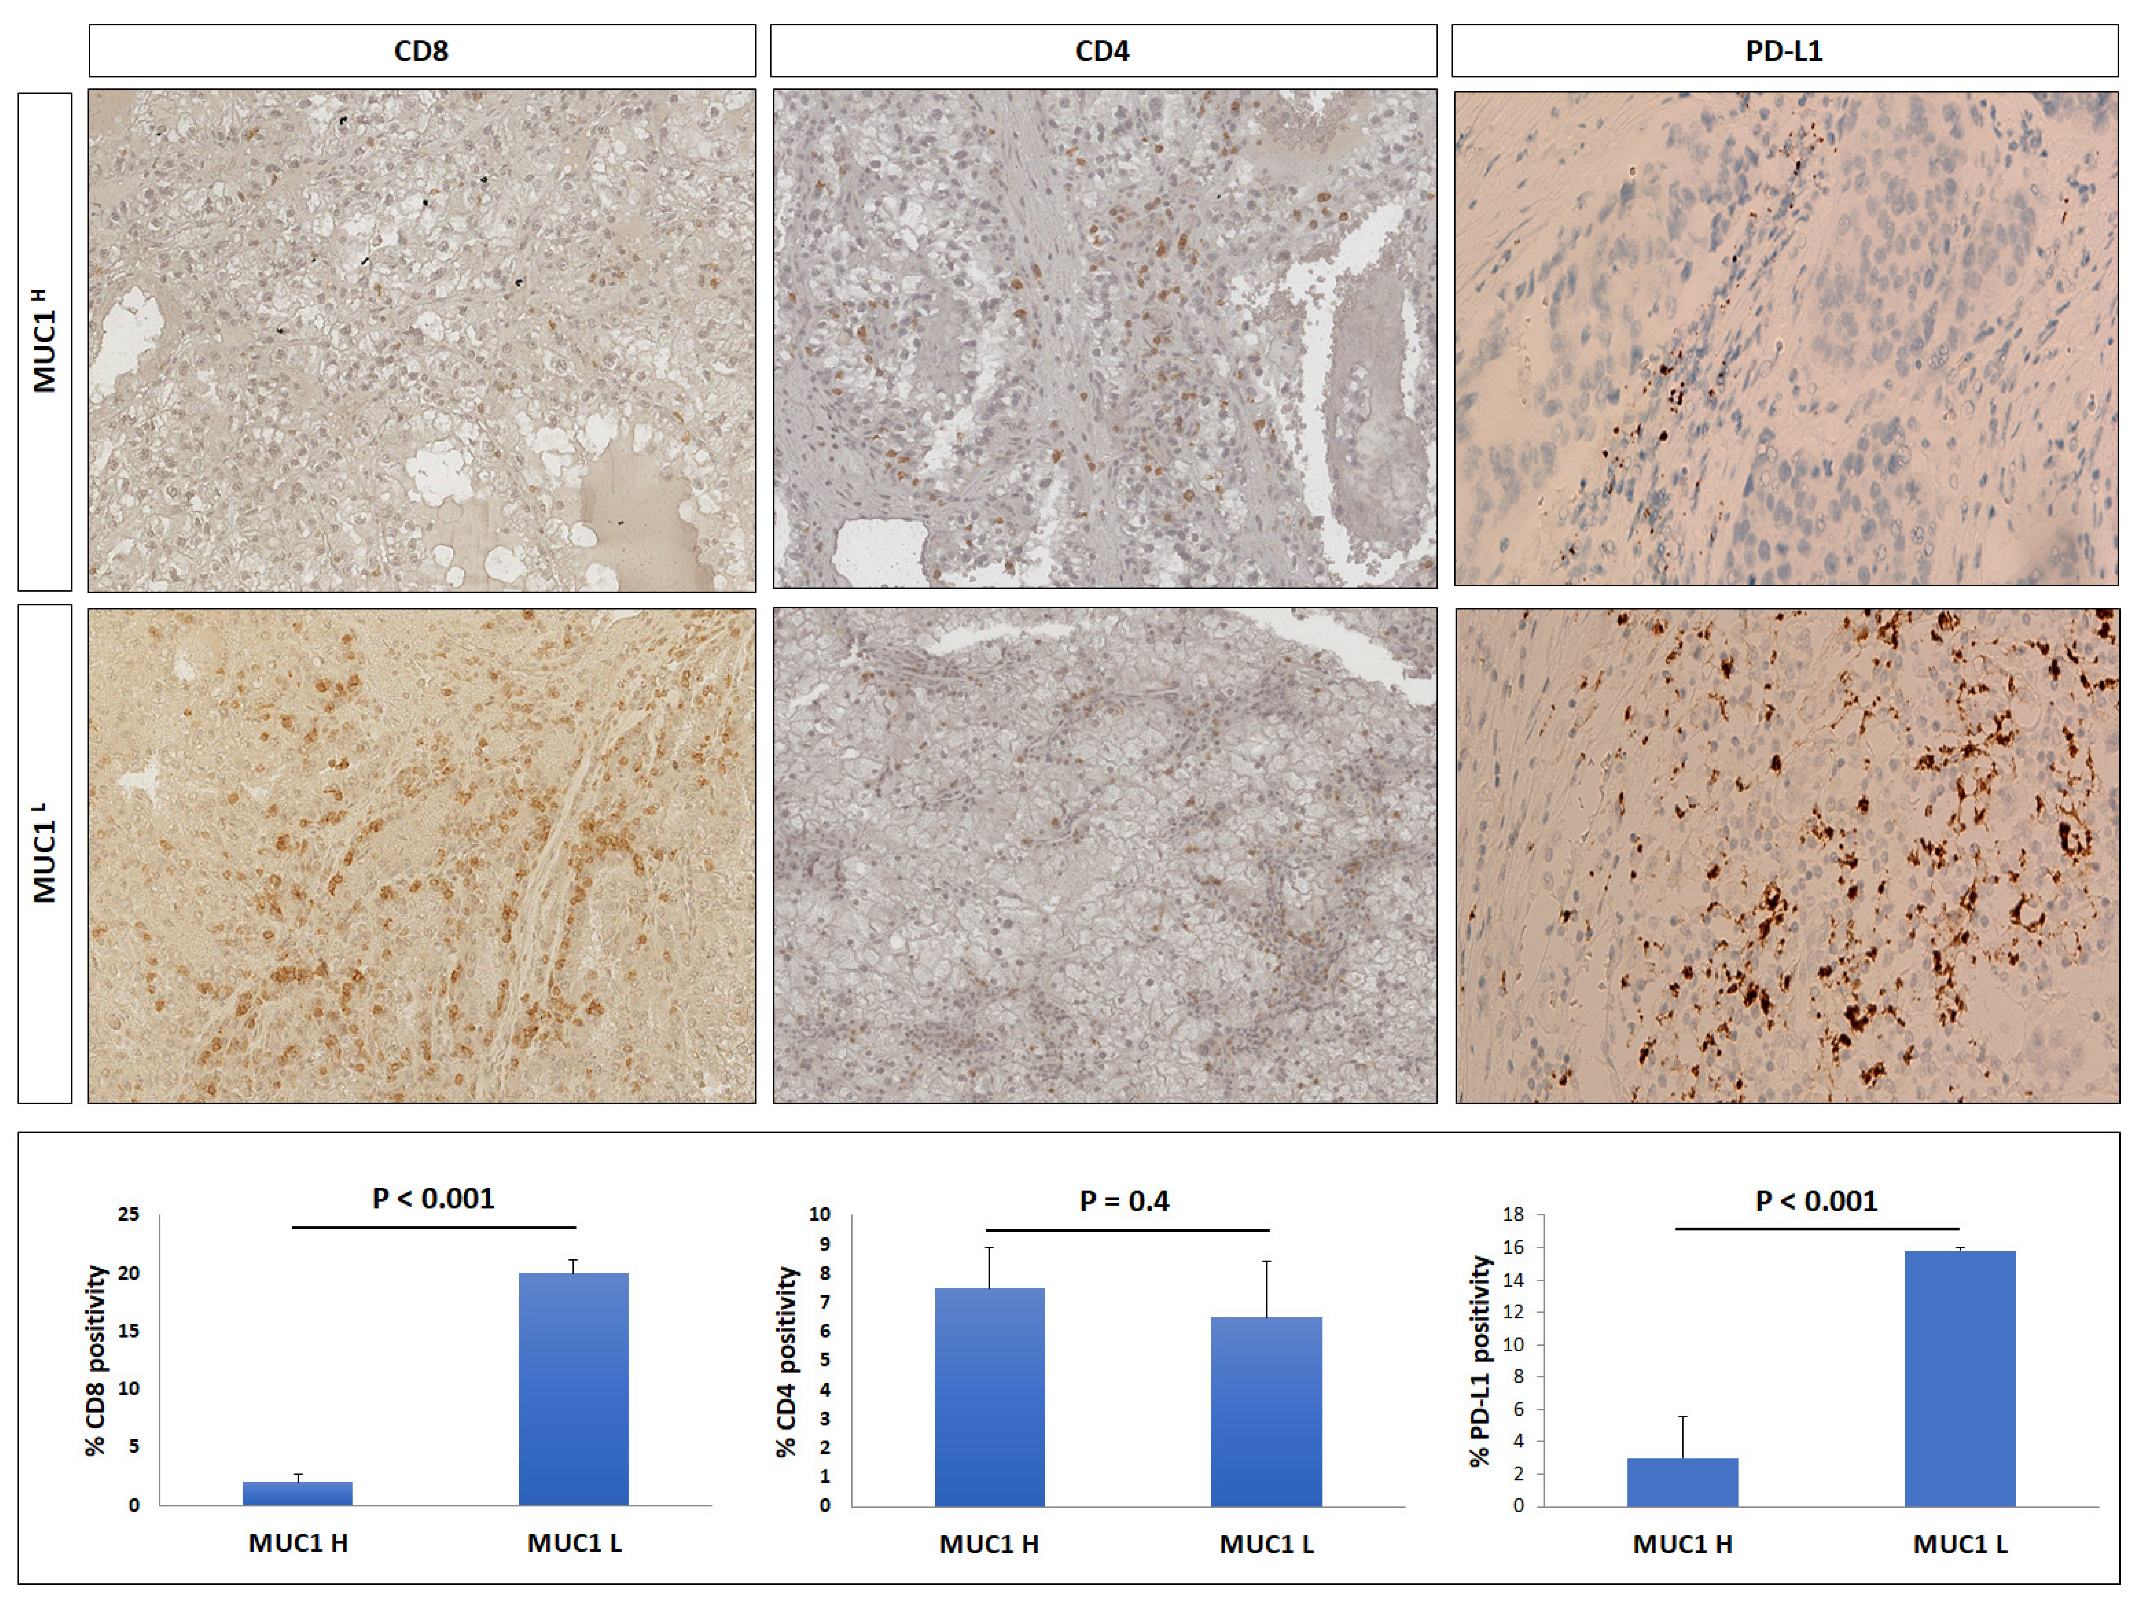
2.2. MUC1H Renal Tumors Display an Altered Modulation of Immunoflogosis in TME
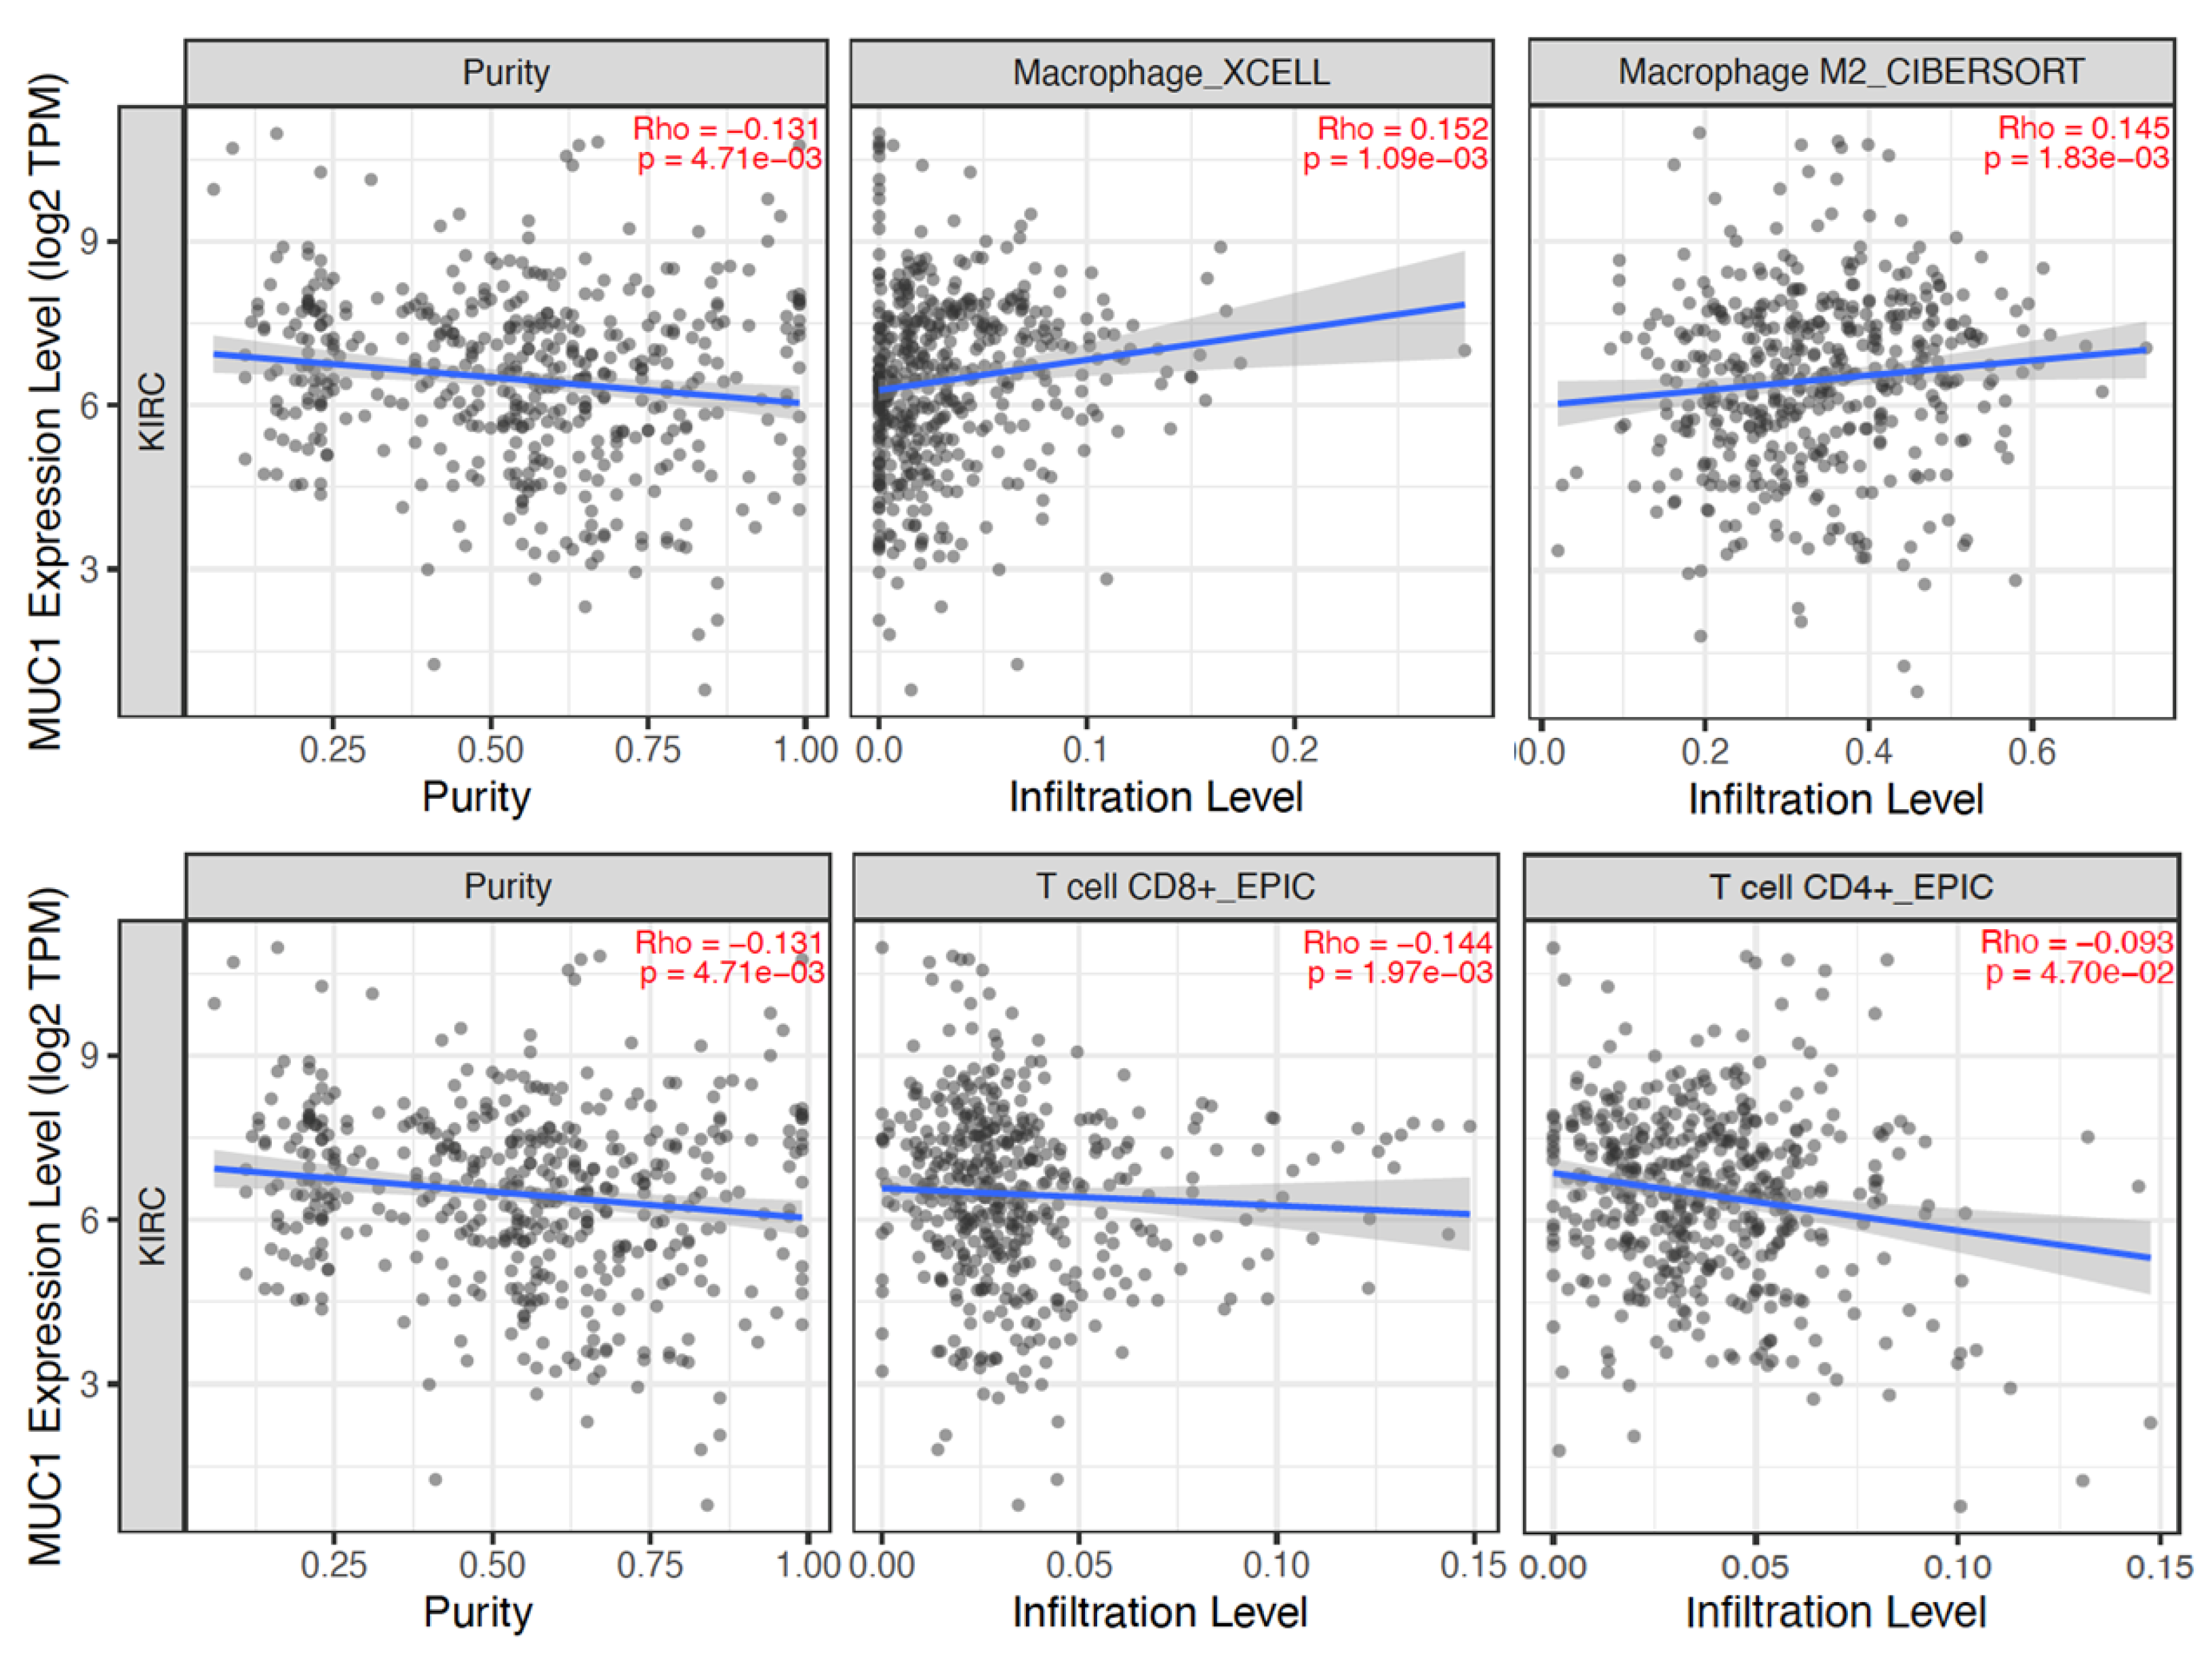
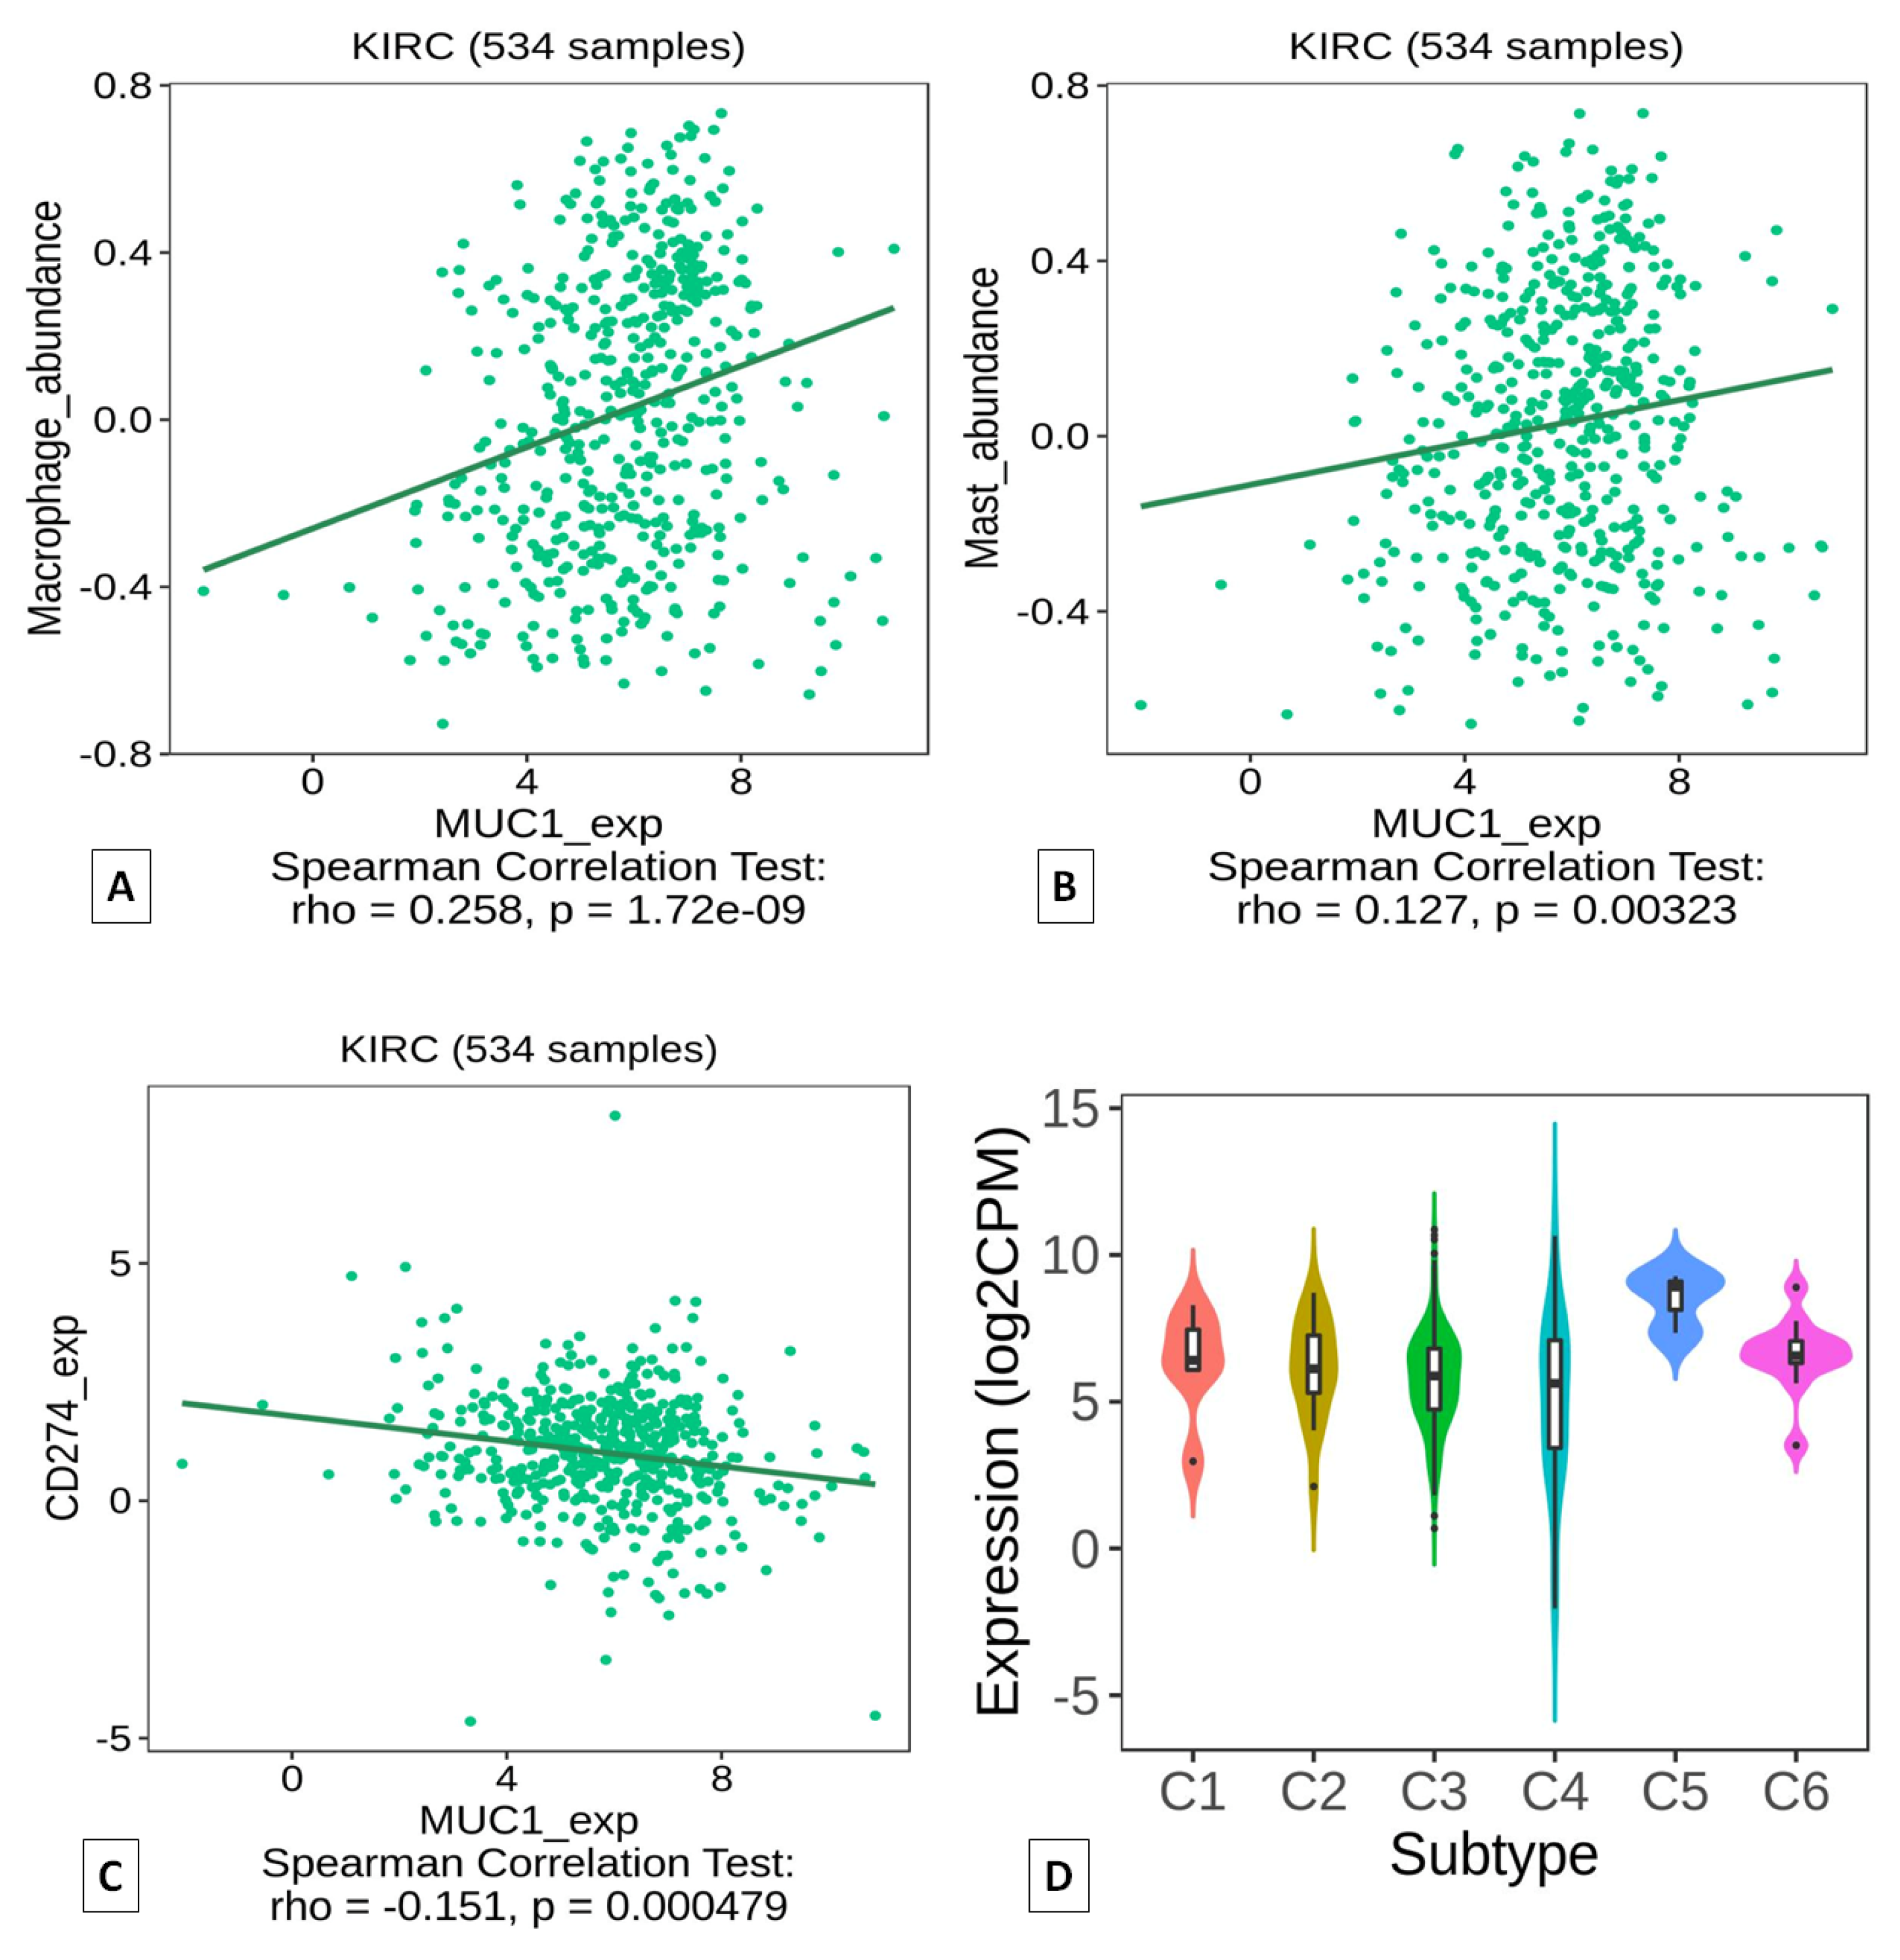
2.3. TIMER and TISIDB Analyses Show MUC1 Modulation of Tumor-Infiltrating Immune Cells
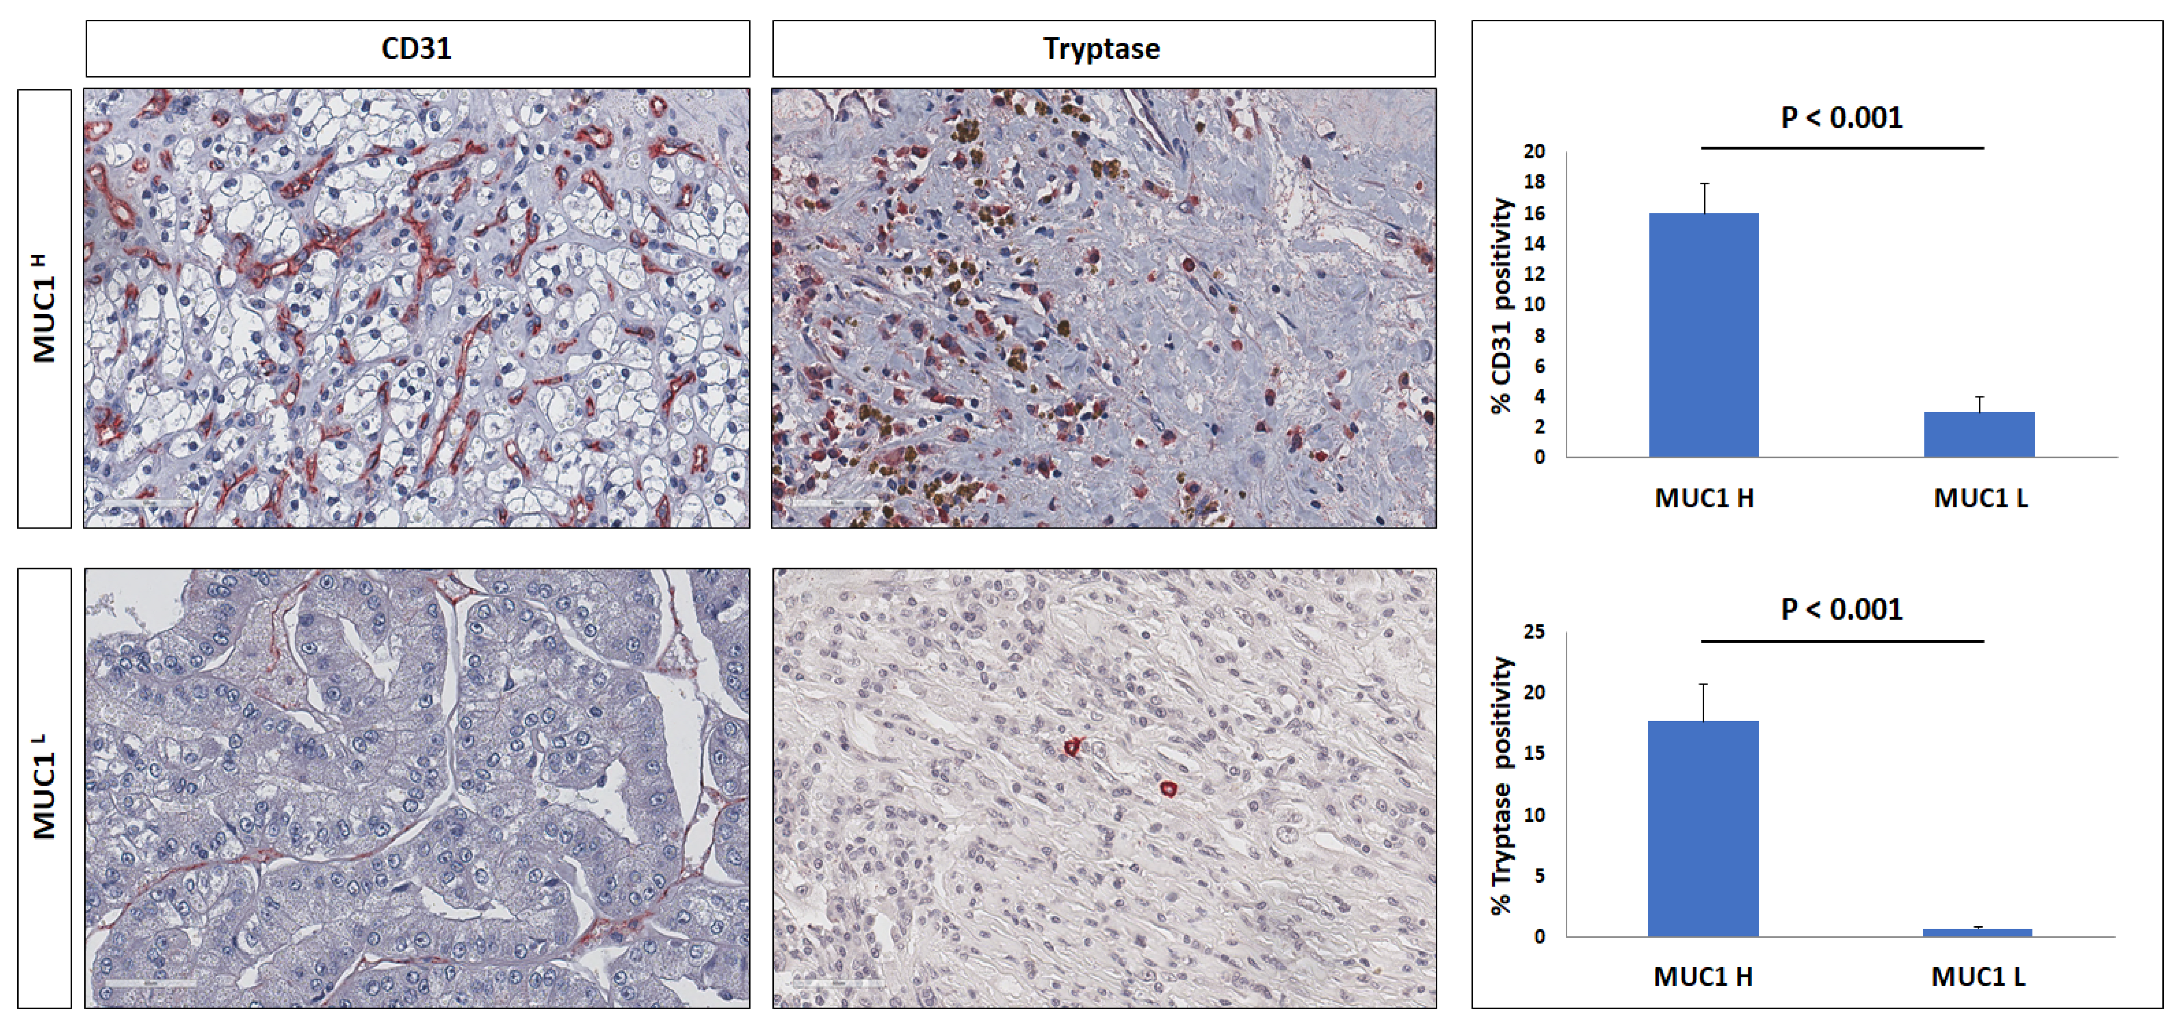
2.4. MUC1 Expression Is Associated with Increased Angiogenesis and Subtype-Specific Immune Cell Infiltration
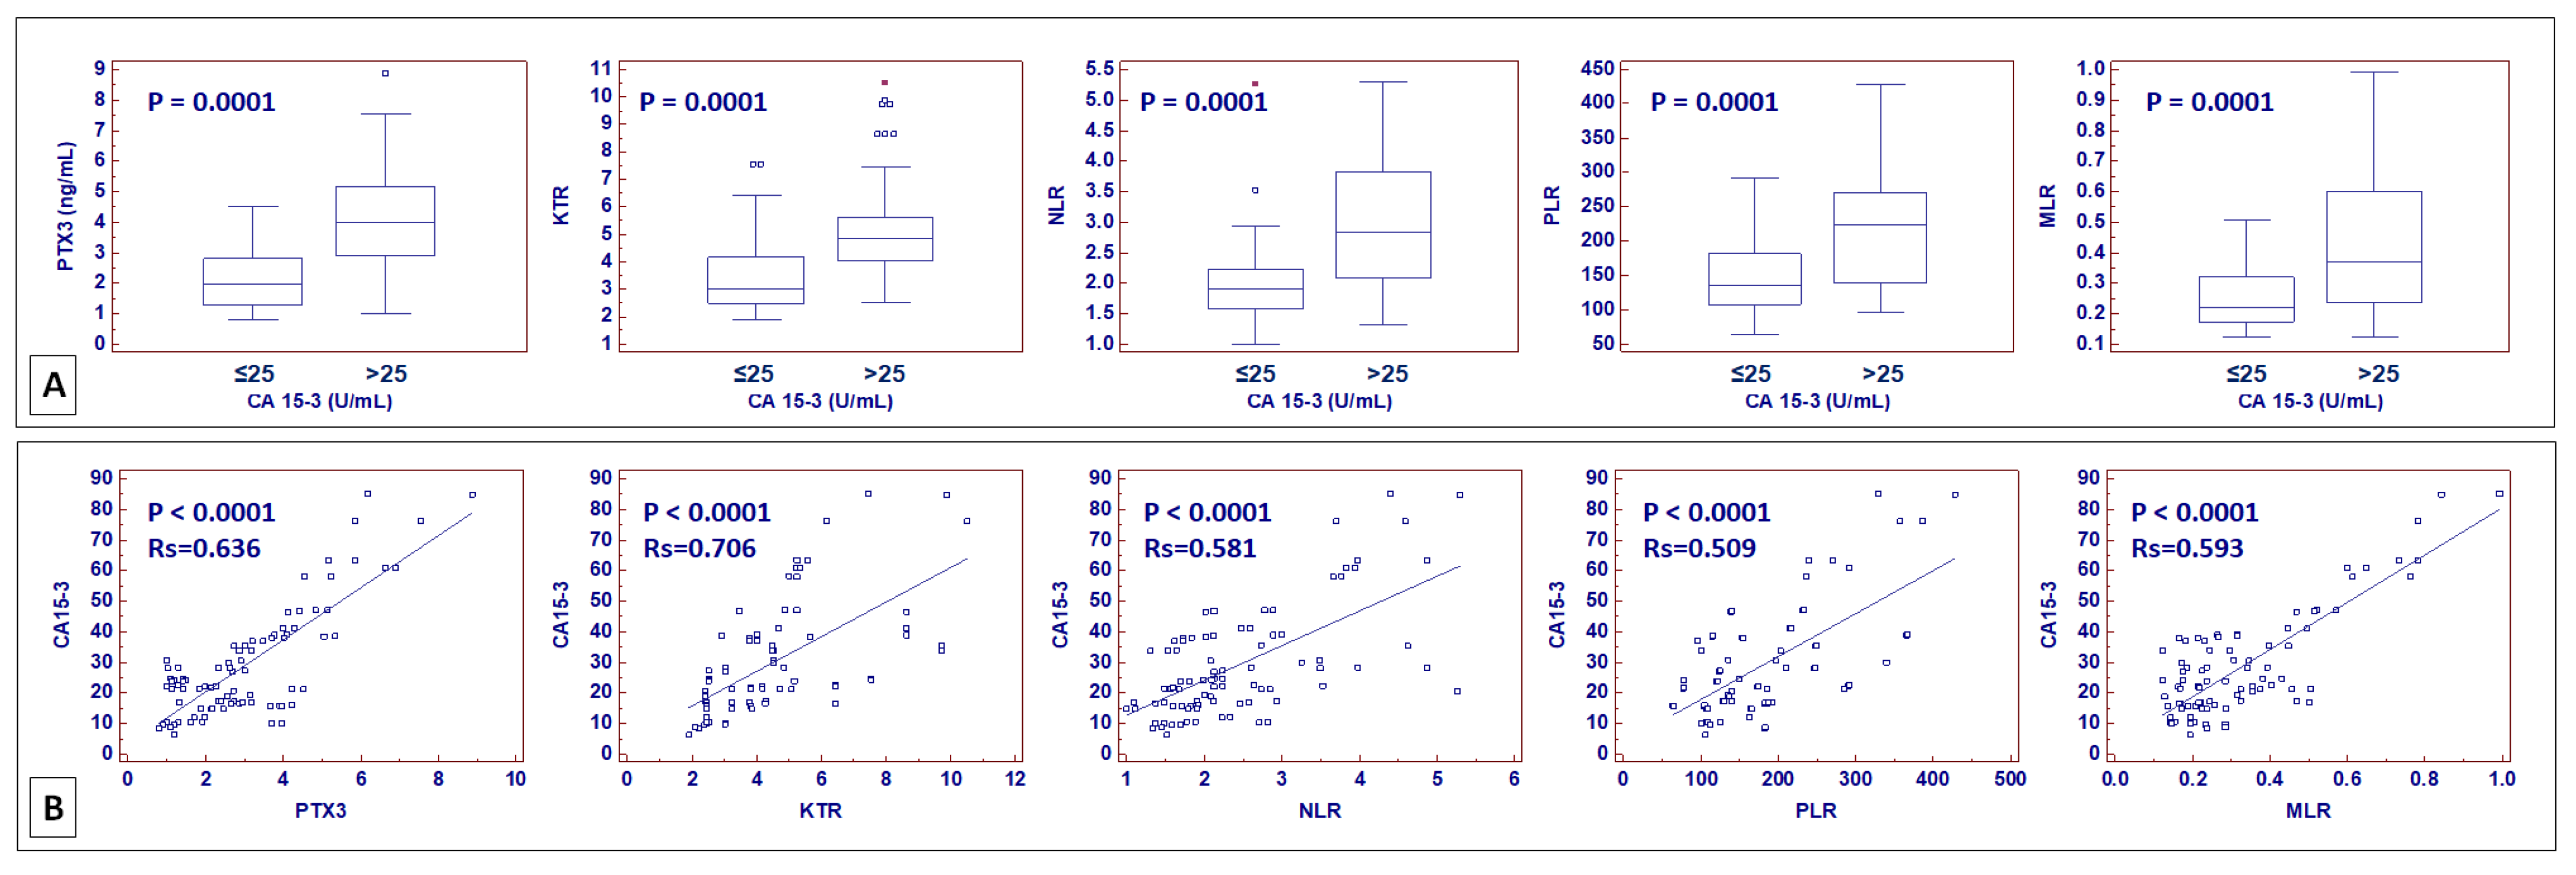
2.5. MUC1 Soluble Form (Serum CA15-3) Correlates with PTX3 Serum Levels, KYN-to-Tryptophan Ratio (KTR), and Other Systemic Inflammation Biomarkers
3. Discussion
4. Materials and Methods
4.1. Study Population, Tissue Collection, and Circulating Biomarkers Evaluation
4.2. Gene Set Enrichment Analysis (GSEA)
4.3. Immunohistochemistry
4.4. Indirect Immunofluorescence and Confocal Laser Scanning Microscopy
Supplementary Materials
Author Contributions
Funding
Institutional Review Board Statement
Informed Consent Statement
Data Availability Statement
Conflicts of Interest
References
- Siegel, R.L.; Miller, K.D.; Fuchs, H.E.; Jemal, A. Cancer statistics, 2022. CA Cancer J. Clin. 2022, 72, 7–33. [Google Scholar] [CrossRef]
- Vavallo, A.; Simone, S.; Lucarelli, G.; Rutigliano, M.; Galleggiante, V.; Grandaliano, G.; Gesualdo, L.; Campagna, M.; Cariello, M.; Ranieri, E.; et al. Pre-existing type 2 diabetes mellitus is an independent risk factor for mortality and progression in patients with renal cell carcinoma. Medicine 2014, 93, e183. [Google Scholar] [CrossRef]
- Gluba-Brzózka, A.; Rysz, J.; Ławiński, J.; Franczyk, B. Renal Cell Cancer and Obesity. Int. J. Mol. Sci. 2022, 23, 3404. [Google Scholar] [CrossRef]
- Saly, D.L.; Eswarappa, M.S.; Street, S.E.; Deshpande, P. Renal Cell Cancer and Chronic Kidney Disease. Adv. Chronic Kidney Dis. 2021, 28, 460–468.e1. [Google Scholar] [CrossRef]
- Lucarelli, G.; Galleggiante, V.; Rutigliano, M.; Sanguedolce, F.; Cagiano, S.; Bufo, P.; Lastilla, G.; Maiorano, E.; Ribatti, D.; Giglio, A.; et al. Metabolomic profile of glycolysis and the pentose phosphate pathway identifies the central role of glucose-6-phosphate dehydrogenase in clear cell-renal cell carcinoma. Oncotarget 2015, 6, 13371–13386. [Google Scholar] [CrossRef]
- Lucarelli, G.; Rutigliano, M.; Sallustio, F.; Ribatti, D.; Giglio, A.; Lepore Signorile, M.; Grossi, V.; Sanese, P.; Napoli, A.; Maiorano, E.; et al. Integrated multi-omics characterization reveals a distinctive metabolic signature and the role of NDUFA4L2 in promoting angiogenesis, chemoresistance, and mitochondrial dysfunction in clear cell renal cell carcinoma. Aging 2018, 10, 3957–3985. [Google Scholar] [CrossRef]
- Ragone, R.; Sallustio, F.; Piccinonna, S.; Rutigliano, M.; Vanessa, G.; Palazzo, S.; Lucarelli, G.; Ditonno, P.; Battaglia, M.; Fanizzi, F.P.; et al. Renal Cell Carcinoma: A Study through NMR-Based Metabolomics Combined with Transcriptomics. Diseases 2016, 4, 7. [Google Scholar] [CrossRef]
- Lucarelli, G.; Loizzo, D.; Franzin, R.; Battaglia, S.; Ferro, M.; Cantiello, F.; Castellano, G.; Bettocchi, C.; Ditonno, P.; Battaglia, M. Metabolomic insights into pathophysiological mechanisms and biomarker discovery in clear cell renal cell carcinoma. Expert Rev. Mol. Diagn. 2019, 19, 397–407. [Google Scholar] [CrossRef]
- di Meo, N.A.; Lasorsa, F.; Rutigliano, M.; Loizzo, D.; Ferro, M.; Stella, A.; Bizzoca, C.; Vincenti, L.; Pandolfo, S.D.; Autorino, R.; et al. Renal Cell Carcinoma as a Metabolic Disease: An Update on Main Pathways, Potential Biomarkers, and Therapeutic Targets. Int. J. Mol. Sci. 2022, 23, 14360. [Google Scholar] [CrossRef]
- Lucarelli, G.; Ferro, M.; Loizzo, D.; Bianchi, C.; Terracciano, D.; Cantiello, F.; Bell, L.N.; Battaglia, S.; Porta, C.; Gernone, A.; et al. Integration of Lipidomics and Transcriptomics Reveals Reprogramming of the Lipid Metabolism and Composition in Clear Cell Renal Cell Carcinoma. Metabolites 2020, 10, 509. [Google Scholar] [CrossRef]
- Bianchi, C.; Meregalli, C.; Bombelli, S.; Di Stefano, V.; Salerno, F.; Torsello, B.; De Marco, S.; Bovo, G.; Cifola, I.; Mangano, E.; et al. The glucose and lipid metabolism reprogramming is grade-dependent in clear cell renal cell carcinoma primary cultures and is targetable to modulate cell viability and proliferation. Oncotarget 2017, 8, 113502–113515. [Google Scholar] [CrossRef]
- Lucarelli, G.; Rutigliano, M.; Loizzo, D.; di Meo, N.A.; Lasorsa, F.; Mastropasqua, M.; Maiorano, E.; Bizzoca, C.; Vincenti, L.; Battaglia, M.; et al. MUC1 Tissue Expression and Its Soluble Form CA15-3 Identify a Clear Cell Renal Cell Carcinoma with Distinct Metabolic Profile and Poor Clinical Outcome. Int. J. Mol. Sci. 2022, 23, 13968. [Google Scholar] [CrossRef]
- Chen, W.; Zhang, Z.; Zhang, S.; Zhu, P.; Ko, J.K.; Yung, K.K. MUC1: Structure, Function, and Clinic Application in Epithelial Cancers. Int. J. Mol. Sci. 2021, 22, 6567. [Google Scholar] [CrossRef]
- Gigante, M.; Pontrelli, P.; Herr, W.; Gigante, M.; D’Avenia, M.; Zaza, G.; Cavalcanti, E.; Accetturo, M.; Lucarelli, G.; Carrieri, G.; et al. miR-29b and miR-198 overexpression in CD8+ T cells of renal cell carcinoma patients down-modulates JAK3 and MCL-1 leading to immune dysfunction. J. Transl. Med. 2016, 14, 84. [Google Scholar] [CrossRef]
- Monti, M.; Lunardini, S.; Magli, I.A.; Campi, R.; Primiceri, G.; Berardinelli, F.; Amparore, D.; Terracciano, D.; Lucarelli, G.; Schips, L.; et al. Micro-RNAs Predict Response to Systemic Treatments in Metastatic Renal Cell Carcinoma Patients: Results from a Systematic Review of the Literature. Biomedicines 2022, 10, 1287. [Google Scholar] [CrossRef]
- Di Lorenzo, G.; De Placido, S.; Pagliuca, M.; Ferro, M.; Lucarelli, G.; Rossetti, S.; Bosso, D.; Puglia, L.; Pignataro, P.; Ascione, I.; et al. The evolving role of monoclonal antibodies in the treatment of patients with advanced renal cell carcinoma: A systematic review. Expert Opin. Biol. Ther. 2016, 16, 1387–1401. [Google Scholar] [CrossRef]
- Guillaume, Z.; Auvray, M.; Vano, Y.; Oudard, S.; Helley, D.; Mauge, L. Renal Carcinoma and Angiogenesis: Therapeutic Target and Biomarkers of Response in Current Therapies. Cancers 2022, 14, 6167. [Google Scholar] [CrossRef]
- Divella, C.; Stasi, A.; Franzin, R.; Rossini, M.; Pontrelli, P.; Sallustio, F.; Netti, G.S.; Ranieri, E.; Lacitignola, L.; Staffieri, F.; et al. Pentraxin-3-mediated complement activation in a swine model of renal ischemia/reperfusion injury. Aging 2021, 13, 10920–10933. [Google Scholar] [CrossRef]
- Netti, G.S.; Lucarelli, G.; Spadaccino, F.; Castellano, G.; Gigante, M.; Divella, C.; Rocchetti, M.T.; Rascio, F.; Mancini, V.; Stallone, G.; et al. PTX3 modulates the immunoflogosis in tumor microenvironment and is a prognostic factor for patients with clear cell renal cell carcinoma. Aging 2020, 12, 7585–7602. [Google Scholar] [CrossRef]
- Subramanian, A.; Tamayo, P.; Mootha, V.K.; Mukherjee, S.; Ebert, B.L.; Gillette, M.A.; Paulovich, A.; Pomeroy, S.L.; Golub, T.R.; Lander, E.S.; et al. Gene set enrichment analysis: A knowledge-based approach for interpreting genome-wide expression profiles. Proc. Natl. Acad. Sci. USA 2005, 102, 15545–15550. [Google Scholar] [CrossRef]
- Li, T.; Fu, J.; Zeng, Z.; Cohen, D.; Li, J.; Chen, Q.; Li, B.; Liu, X.S. TIMER2.0 for analysis of tumor-infiltrating immune cells. Nucleic Acids Res. 2020, 48, W509–W514. [Google Scholar] [CrossRef]
- Ru, B.; Wong, C.N.; Tong, Y.; Zhong, J.Y.; Zhong, S.S.W.; Wu, W.C.; Chu, K.C.; Wong, C.Y.; Lau, C.Y.; Chen, I.; et al. TISIDB: An integrated repository portal for tumor-immune system interactions. Bioinformatics 2019, 35, 4200–4202. [Google Scholar] [CrossRef]
- Tamma, R.; Rutigliano, M.; Lucarelli, G.; Annese, T.; Ruggieri, S.; Cascardi, E.; Napoli, A.; Battaglia, M.; Ribatti, D. Microvascular density, macrophages, and mast cells in human clear cell renal carcinoma with and without bevacizumab treatment. Urol. Oncol. Semin. Orig. Investig. 2019, 37, 355.e11–355.e19. [Google Scholar] [CrossRef]
- Sobiepanek, A.; Kuryk, Ł.; Garofalo, M.; Kumar, S.; Baran, J.; Musolf, P.; Siebenhaar, F.; Fluhr, J.W.; Kobiela, T.; Plasenzotti, R.; et al. The Multifaceted Roles of Mast Cells in Immune Homeostasis, Infections and Cancers. Int. J. Mol. Sci. 2022, 23, 2249. [Google Scholar] [CrossRef]
- Lucarelli, G.; Rutigliano, M.; Ferro, M.; Giglio, A.; Intini, A.; Triggiano, F.; Palazzo, S.; Gigante, M.; Castellano, G.; Ranieri, E.; et al. Activation of the kynurenine pathway predicts poor outcome in patients with clear cell renal cell carcinoma. Urol. Oncol. Semin. Orig. Investig. 2017, 35, 461.e15–461.e27. [Google Scholar] [CrossRef]
- Lucarelli, G.; Ditonno, P.; Bettocchi, C.; Vavallo, A.; Rutigliano, M.; Galleggiante, V.; Larocca, A.M.; Castellano, G.; Gesualdo, L.; Grandaliano, G.; et al. Diagnostic and prognostic role of preoperative circulating CA 15-3, CA 125, and beta-2 microglobulin in renal cell carcinoma. Dis. Markers 2014, 2014, 689795. [Google Scholar] [CrossRef]
- Ferro, M.; Di Mauro, M.; Cimino, S.; Morgia, G.; Lucarelli, G.; Abu Farhan, A.R.; Vartolomei, M.D.; Porreca, A.; Cantiello, F.; Damiano, R.; et al. Systemic combining inflammatory score (SCIS): A new score for prediction of oncologic outcomes in patients with high-risk non-muscle-invasive urothelial bladder cancer. Transl. Androl. Urol. 2021, 10, 626–635. [Google Scholar] [CrossRef]
- Cantiello, F.; Russo, G.I.; Vartolomei, M.D.; Farhan, A.R.A.; Terracciano, D.; Musi, G.; Lucarelli, G.; Di Stasi, S.M.; Hurle, R.; Serretta, V.; et al. Systemic Inflammatory Markers and Oncologic Outcomes in Patients with High-risk Non-muscle-invasive Urothelial Bladder Cancer. Eur. Urol. Oncol. 2018, 1, 403–410. [Google Scholar] [CrossRef]
- Ferro, M.; Babă, D.F.; de Cobelli, O.; Musi, G.; Lucarelli, G.; Terracciano, D.; Porreca, A.; Busetto, G.M.; Del Giudice, F.; Soria, F.; et al. Neutrophil percentage-to-albumin ratio predicts mortality in bladder cancer patients treated with neoadjuvant chemotherapy followed by radical cystectomy. Future Sci. OA 2021, 7, FSO709. [Google Scholar] [CrossRef]
- Ferro, M.; Musi, G.; Matei, D.V.; Mistretta, A.F.; Luzzago, S.; Cozzi, G.; Bianchi, R.; Di Trapani, E.; Cioffi, A.; Lucarelli, G.; et al. Assessment of PSIM (Prostatic Systemic Inflammatory Markers) Score in Predicting Pathologic Features at Robotic Radical Prostatectomy in Patients with Low-Risk Prostate Cancer Who Met the Inclusion Criteria for Active Surveillance. Diagnostics 2021, 11, 355. [Google Scholar] [CrossRef]
- Vartolomei, M.D.; Ferro, M.; Cantiello, F.; Lucarelli, G.; Di Stasi, S.; Hurle, R.; Guazzoni, G.; Busetto, G.M.; De Berardinis, E.; Damiano, R.; et al. Validation of Neutrophil-to-lymphocyte Ratio in a Multi-institutional Cohort of Patients With T1G3 Non-muscle-invasive Bladder Cancer. Clin. Genitourin. Cancer 2018, 16, 445–452. [Google Scholar] [CrossRef]
- Zapała, Ł.; Kunc, M.; Sharma, S.; Biernat, W.; Radziszewski, P. Low Lymphocyte-to-Monocyte Ratio Is the Potential Indicator of Worse Overall Survival in Patients with Renal Cell Carcinoma and Venous Tumor Thrombus. Diagnostics 2021, 11, 2159. [Google Scholar] [CrossRef]
- Hakimi, A.A.; Reznik, E.; Lee, C.H.; Creighton, C.J.; Brannon, A.R.; Luna, A.; Aksoy, B.A.; Liu, E.M.; Shen, R.; Lee, W.; et al. An Integrated Metabolic Atlas of Clear Cell Renal Cell Carcinoma. Cancer Cell 2016, 29, 104–116. [Google Scholar] [CrossRef]
- Li, Y.; Lih, T.M.; Dhanasekaran, S.M.; Mannan, R.; Chen, L.; Cieslik, M.; Wu, Y.; Lu, R.J.; Clark, D.J.; Kołodziejczak, I.; et al. Histopathologic and proteogenomic heterogeneity reveals features of clear cell renal cell carcinoma aggressiveness. Cancer Cell 2023, 41, 139–163.e17. [Google Scholar] [CrossRef]
- Zhong, W.; Li, Y.; Yuan, Y.; Zhong, H.; Huang, C.; Huang, J.; Lin, Y.; Huang, J. Characterization of Molecular Heterogeneity Associated With Tumor Microenvironment in Clear Cell Renal Cell Carcinoma to Aid Immunotherapy. Front. Cell Dev. Biol. 2021, 9, 736540. [Google Scholar] [CrossRef]
- Beksac, A.T.; Paulucci, D.J.; Blum, K.A.; Yadav, S.S.; Sfakianos, J.P.; Badani, K.K. Heterogeneity in renal cell carcinoma. Urol. Oncol. Semin. Orig. Investig. 2017, 35, 507–515. [Google Scholar] [CrossRef]
- Ajona, D.; Ortiz-Espinosa, S.; Pio, R. Complement anaphylatoxins C3a and C5a: Emerging roles in cancer progression and treatment. Semin. Cell Dev. Biol. 2019, 85, 153–163. [Google Scholar] [CrossRef]
- Ribatti, D. A double-edged sword in tumor angiogenesis and progression. Dual roles of mast cells, macrophages, and neutrophils. Pathol. Res. Pract. 2022, 240, 154167. [Google Scholar] [CrossRef]
- Mennitto, A.; Huber, V.; Ratta, R.; Sepe, P.; de Braud, F.; Procopio, G.; Guadalupi, V.; Claps, M.; Stellato, M.; Daveri, E.; et al. Angiogenesis and Immunity in Renal Carcinoma: Can We Turn an Unhappy Relationship into a Happy Marriage? J. Clin. Med. 2020, 9, 930. [Google Scholar] [CrossRef]
- Tuna, B.; Yorukoglu, K.; Unlu, M.; Mungan, M.U.; Kirkali, Z. Association of mast cells with microvessel density in renal cell carcinomas. Eur. Urol. 2006, 50, 530–534. [Google Scholar] [CrossRef]
- Ribatti, D.; Annese, T.; Tamma, R. Controversial role of mast cells in breast cancer tumor progression and angiogenesis. Clin. Breast Cancer 2021, 21, 486–491. [Google Scholar] [CrossRef]
- Ribatti, D.; Crivellato, E. Mast cells, angiogenesis, and tumour growth. Biochim. Biophys. Acta 2012, 1822, 2–8. [Google Scholar] [CrossRef] [PubMed]
- Klapper, J.A.; Downey, S.G.; Smith, F.O.; Yang, J.C.; Hughes, M.S.; Kammula, U.S.; Sherry, R.M.; Royal, R.E.; Steinberg, S.M.; Rosenberg, S. High-dose interleukin-2 for the treatment of metastatic renal cell carcinoma: A retrospective analysis of response and survival in patients treated in the surgery branch at the National Cancer Institute between 1986 and 2006. Cancer 2008, 113, 293–301. [Google Scholar] [CrossRef] [PubMed]
- Battaglia, M.; Lucarelli, G. The role of renal surgery in the era of targeted therapy: The urologist’s perspective. Urologia 2015, 82, 137–138. [Google Scholar] [CrossRef] [PubMed]
- Deleuze, A.; Saout, J.; Dugay, F.; Peyronnet, B.; Mathieu, R.; Verhoest, G.; Bensalah, K.; Crouzet, L.; Laguerre, B.; Belaud-Rotureau, M.A.; et al. Immunotherapy in Renal Cell Carcinoma: The Future Is Now. Int. J. Mol. Sci. 2020, 21, 2532. [Google Scholar] [CrossRef] [PubMed]
- Giraldo, N.A.; Becht, E.; Vano, Y.; Petitprez, F.; Lacroix, L.; Validire, P.; Sanchez-Salas, R.; Ingels, A.; Oudard, S.; Moatti, A.; et al. Tumor-Infiltrating and Peripheral Blood T-cell Immunophenotypes Predict Early Relapse in Localized Clear Cell Renal Cell Carcinoma. Clin. Cancer Res. 2017, 23, 4416–4428. [Google Scholar] [CrossRef] [PubMed]
- Thorsson, V.; Gibbs, D.L.; Brown, S.D.; Wolf, D.; Bortone, D.S.; Ou Yang, T.H.; Porta-Pardo, E.; Gao, G.F.; Plaisier, C.L.; Eddy, J.A.; et al. The Immune Landscape of Cancer. Immunity 2018, 48, 812–830.e14. [Google Scholar] [CrossRef]


Disclaimer/Publisher’s Note: The statements, opinions and data contained in all publications are solely those of the individual author(s) and contributor(s) and not of MDPI and/or the editor(s). MDPI and/or the editor(s) disclaim responsibility for any injury to people or property resulting from any ideas, methods, instructions or products referred to in the content. |
© 2023 by the authors. Licensee MDPI, Basel, Switzerland. This article is an open access article distributed under the terms and conditions of the Creative Commons Attribution (CC BY) license (https://creativecommons.org/licenses/by/4.0/).
Share and Cite
Lucarelli, G.; Netti, G.S.; Rutigliano, M.; Lasorsa, F.; Loizzo, D.; Milella, M.; Schirinzi, A.; Fontana, A.; Di Serio, F.; Tamma, R.; et al. MUC1 Expression Affects the Immunoflogosis in Renal Cell Carcinoma Microenvironment through Complement System Activation and Immune Infiltrate Modulation. Int. J. Mol. Sci. 2023, 24, 4814. https://doi.org/10.3390/ijms24054814
Lucarelli G, Netti GS, Rutigliano M, Lasorsa F, Loizzo D, Milella M, Schirinzi A, Fontana A, Di Serio F, Tamma R, et al. MUC1 Expression Affects the Immunoflogosis in Renal Cell Carcinoma Microenvironment through Complement System Activation and Immune Infiltrate Modulation. International Journal of Molecular Sciences. 2023; 24(5):4814. https://doi.org/10.3390/ijms24054814
Chicago/Turabian StyleLucarelli, Giuseppe, Giuseppe Stefano Netti, Monica Rutigliano, Francesco Lasorsa, Davide Loizzo, Martina Milella, Annalisa Schirinzi, Antonietta Fontana, Francesca Di Serio, Roberto Tamma, and et al. 2023. "MUC1 Expression Affects the Immunoflogosis in Renal Cell Carcinoma Microenvironment through Complement System Activation and Immune Infiltrate Modulation" International Journal of Molecular Sciences 24, no. 5: 4814. https://doi.org/10.3390/ijms24054814
APA StyleLucarelli, G., Netti, G. S., Rutigliano, M., Lasorsa, F., Loizzo, D., Milella, M., Schirinzi, A., Fontana, A., Di Serio, F., Tamma, R., Ribatti, D., Battaglia, M., Ranieri, E., & Ditonno, P. (2023). MUC1 Expression Affects the Immunoflogosis in Renal Cell Carcinoma Microenvironment through Complement System Activation and Immune Infiltrate Modulation. International Journal of Molecular Sciences, 24(5), 4814. https://doi.org/10.3390/ijms24054814