
Osteogenic and Adipogenic Differentiation Potential of Oral Cancer Stem Cells May Offer New Treatment Modalities

 ,
,  , , , and
Abstract
1. Introduction
2. Results
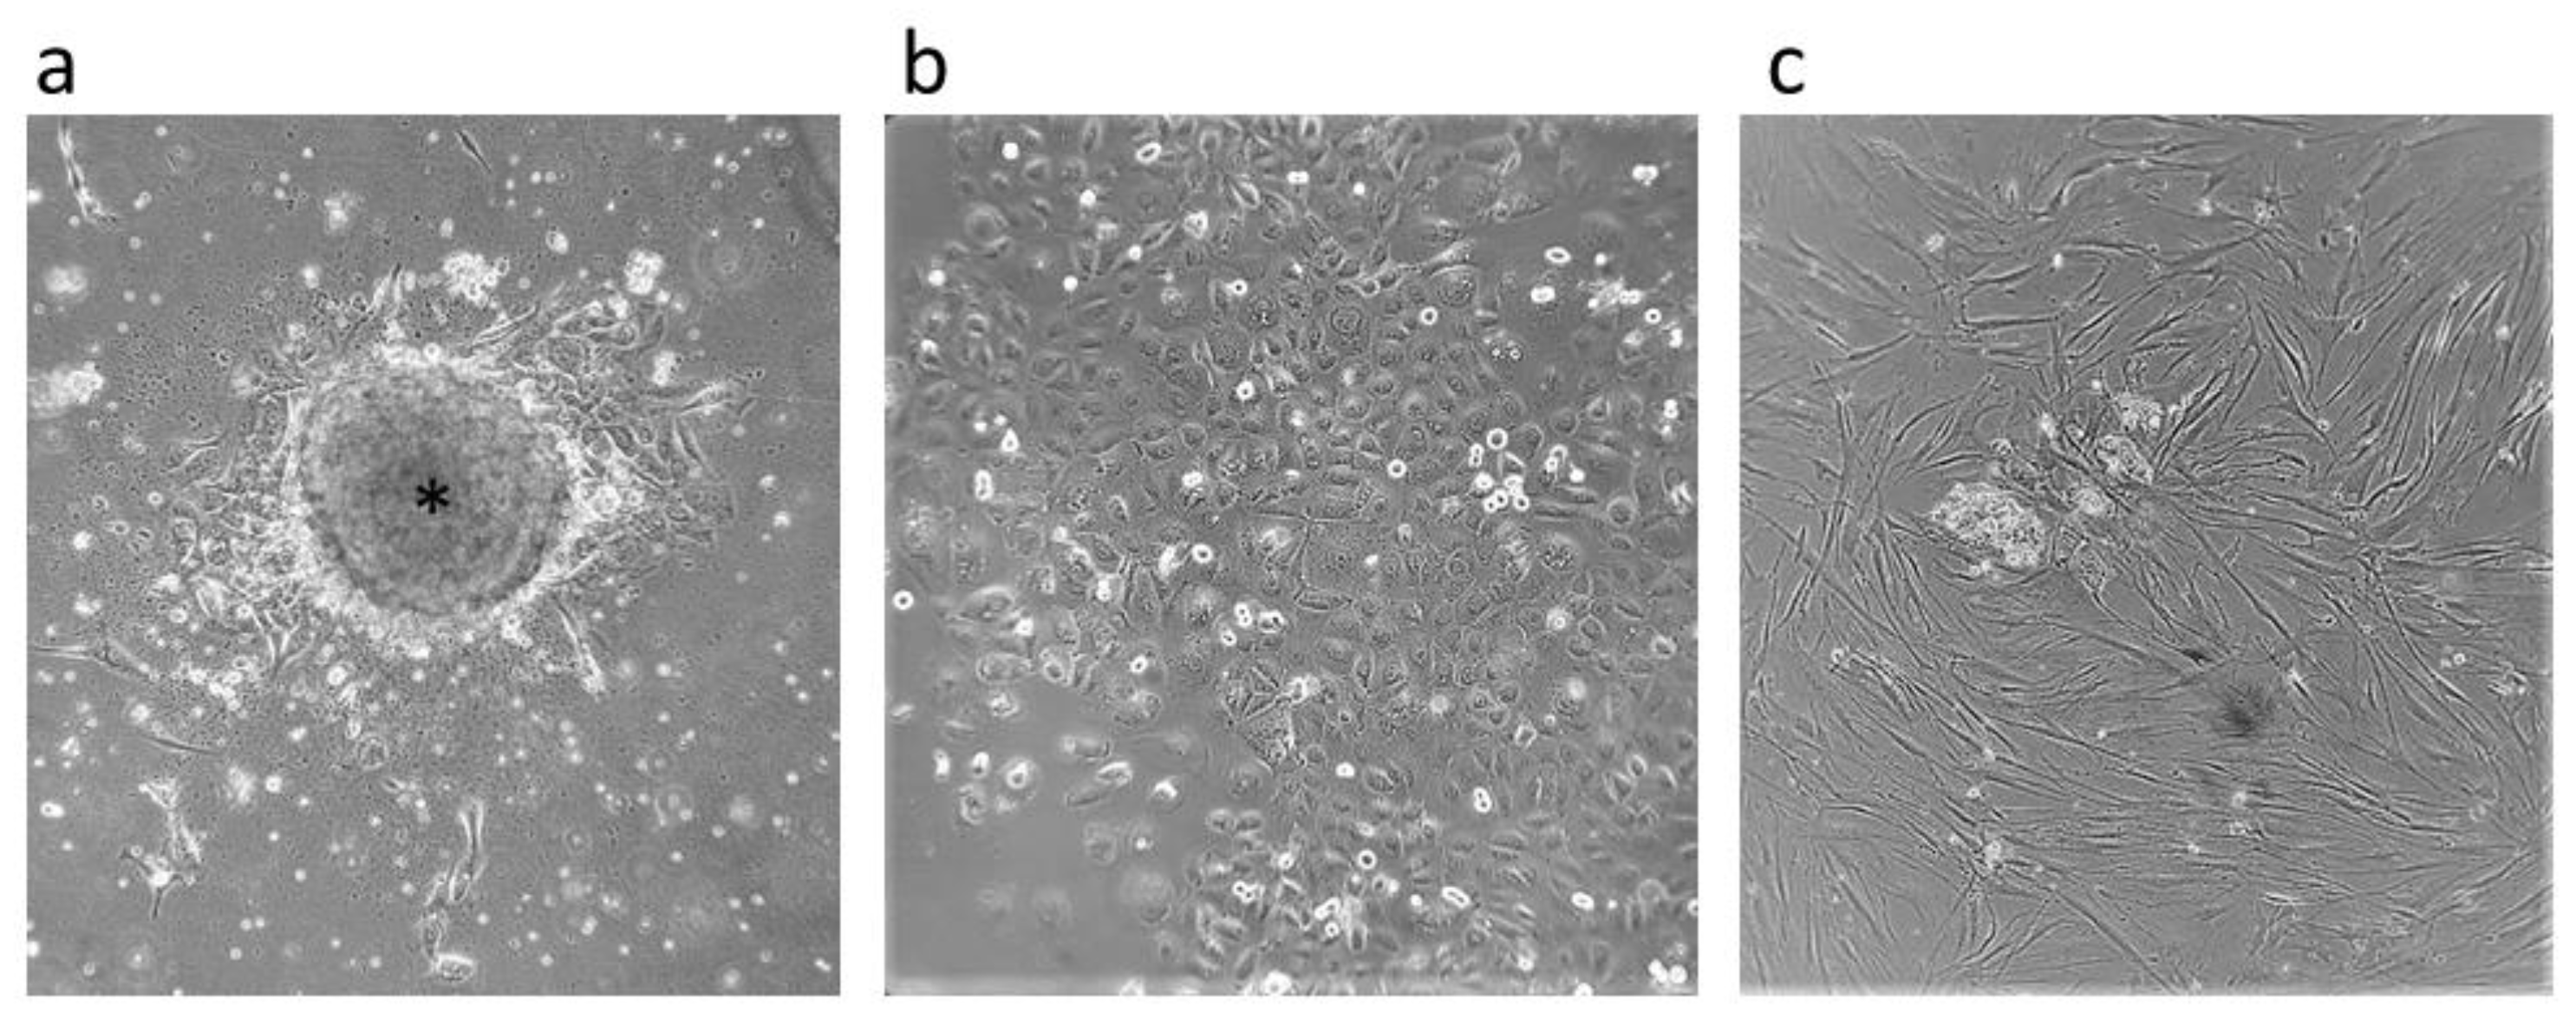
2.1. CSCs’ Isolation and Characterization
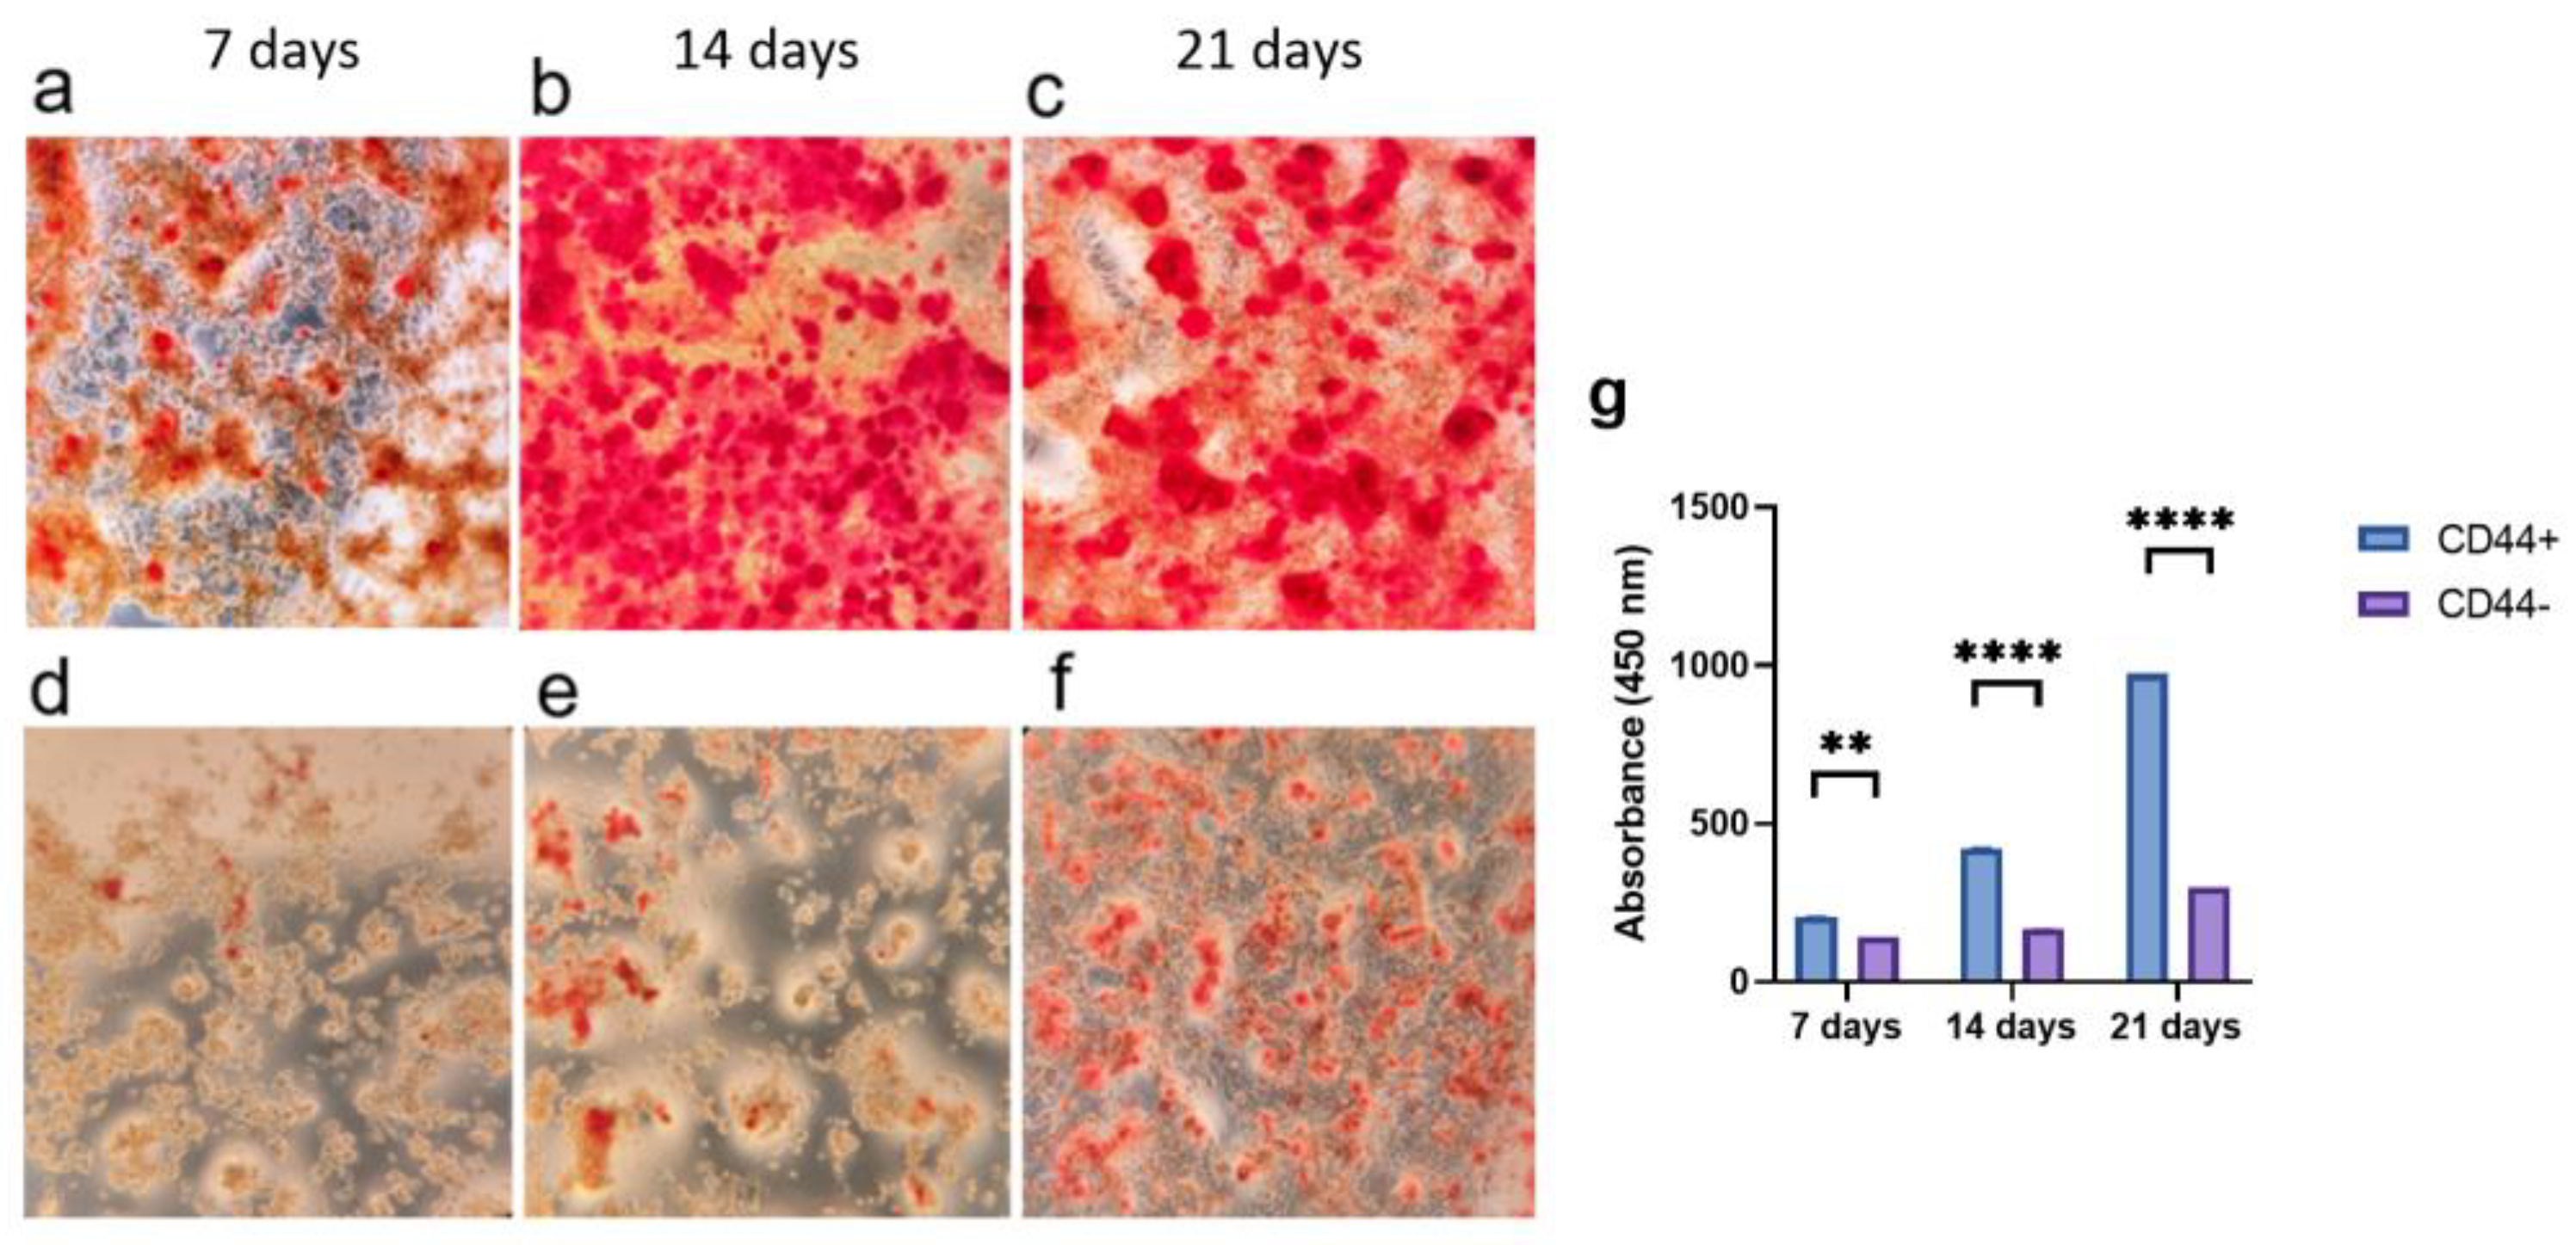
2.2. Osteogenic Differentiation
2.3. Adipogenic Differentiation of CD44+/CD44− Cells
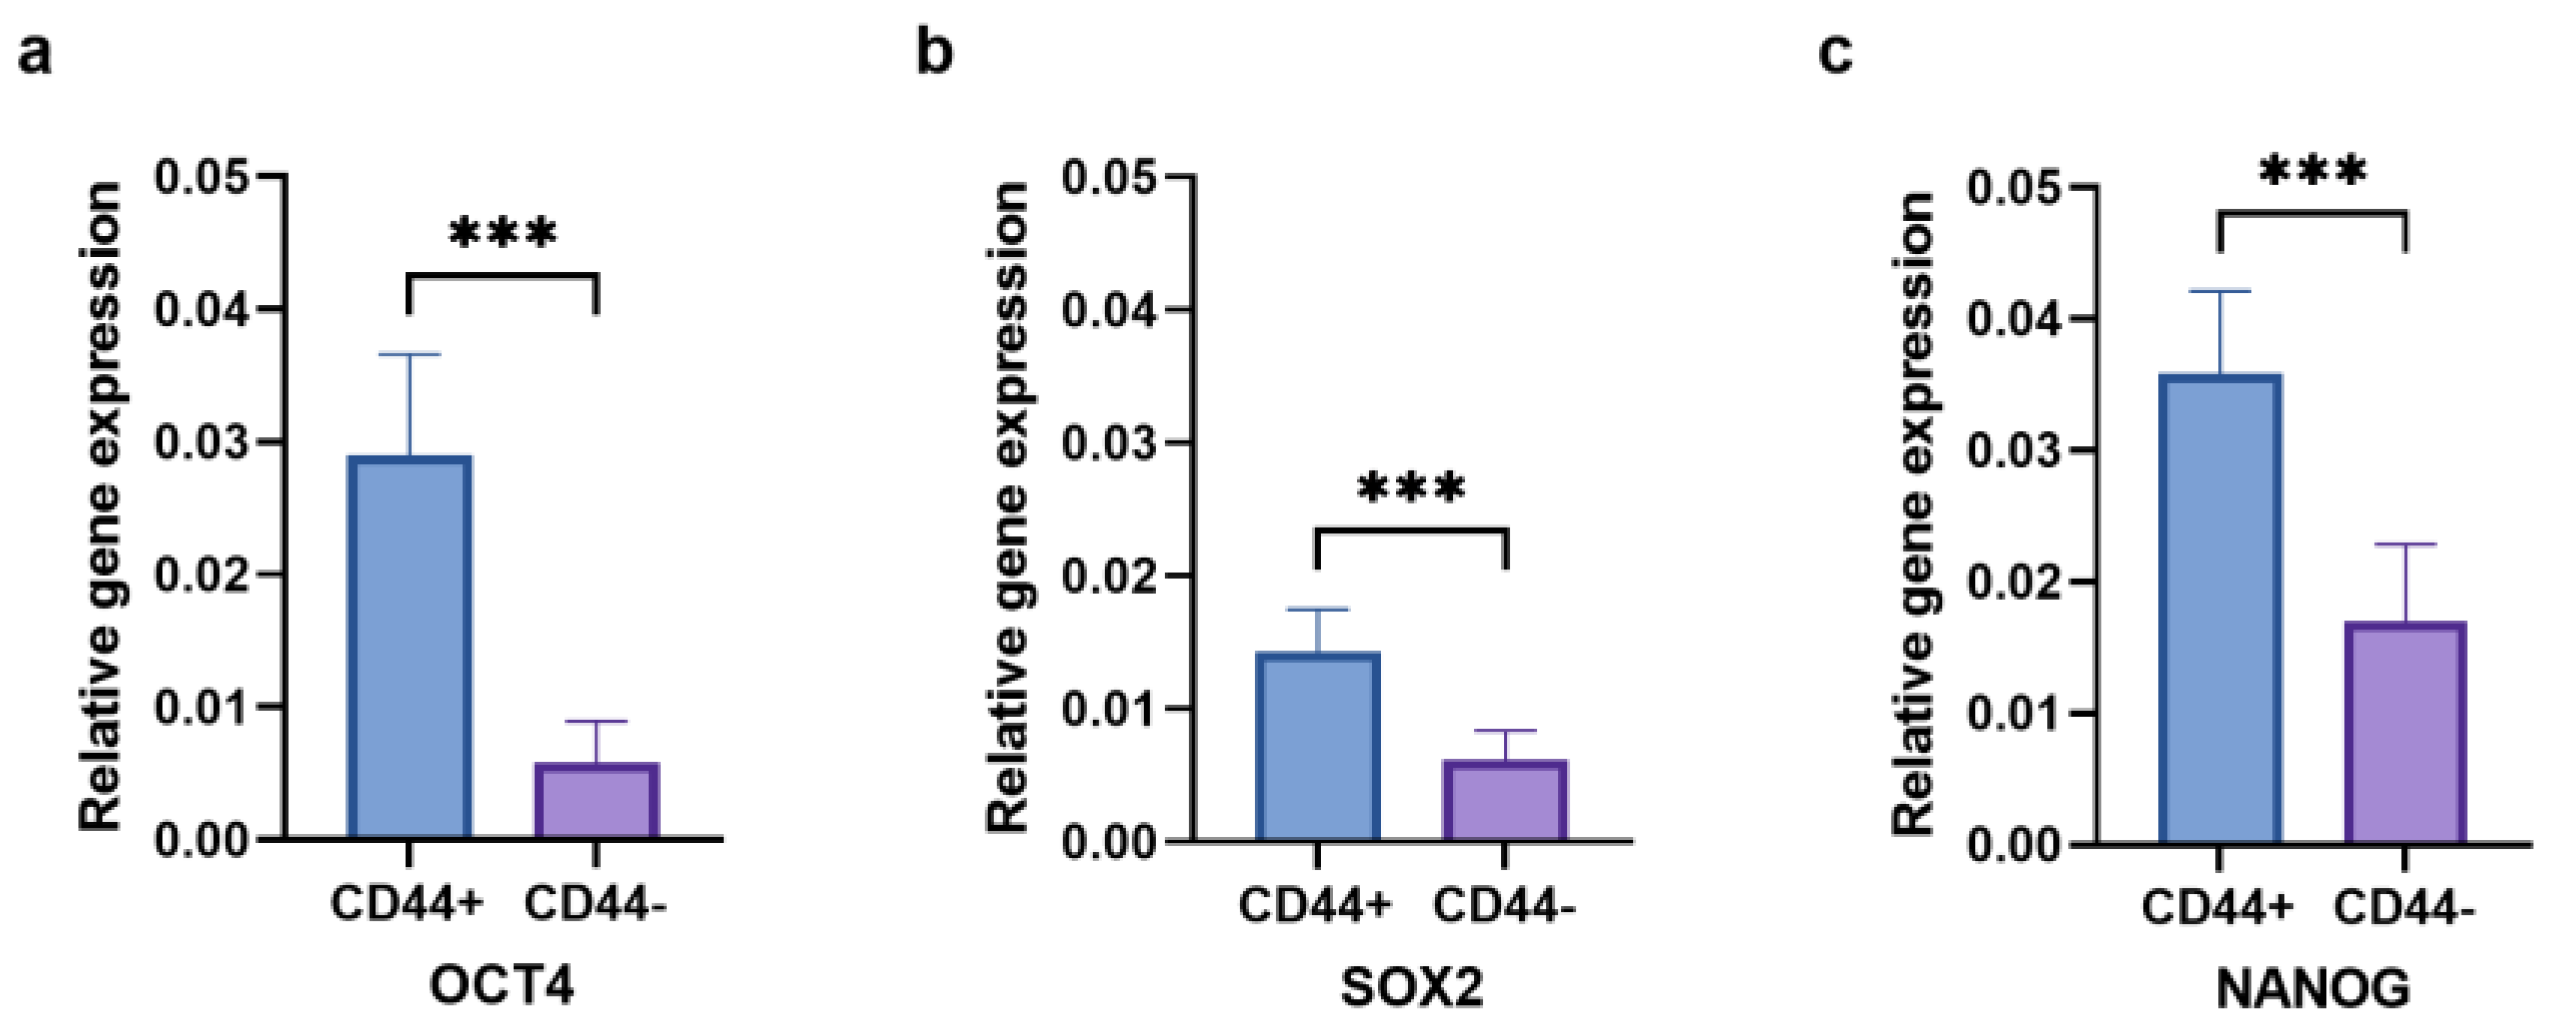
2.4. Stemness Markers of CD44+ and CD44− Cell Subpopulations
2.5. Stemness Markers and Differentiation
2.6. Apoptosis after Differentiation
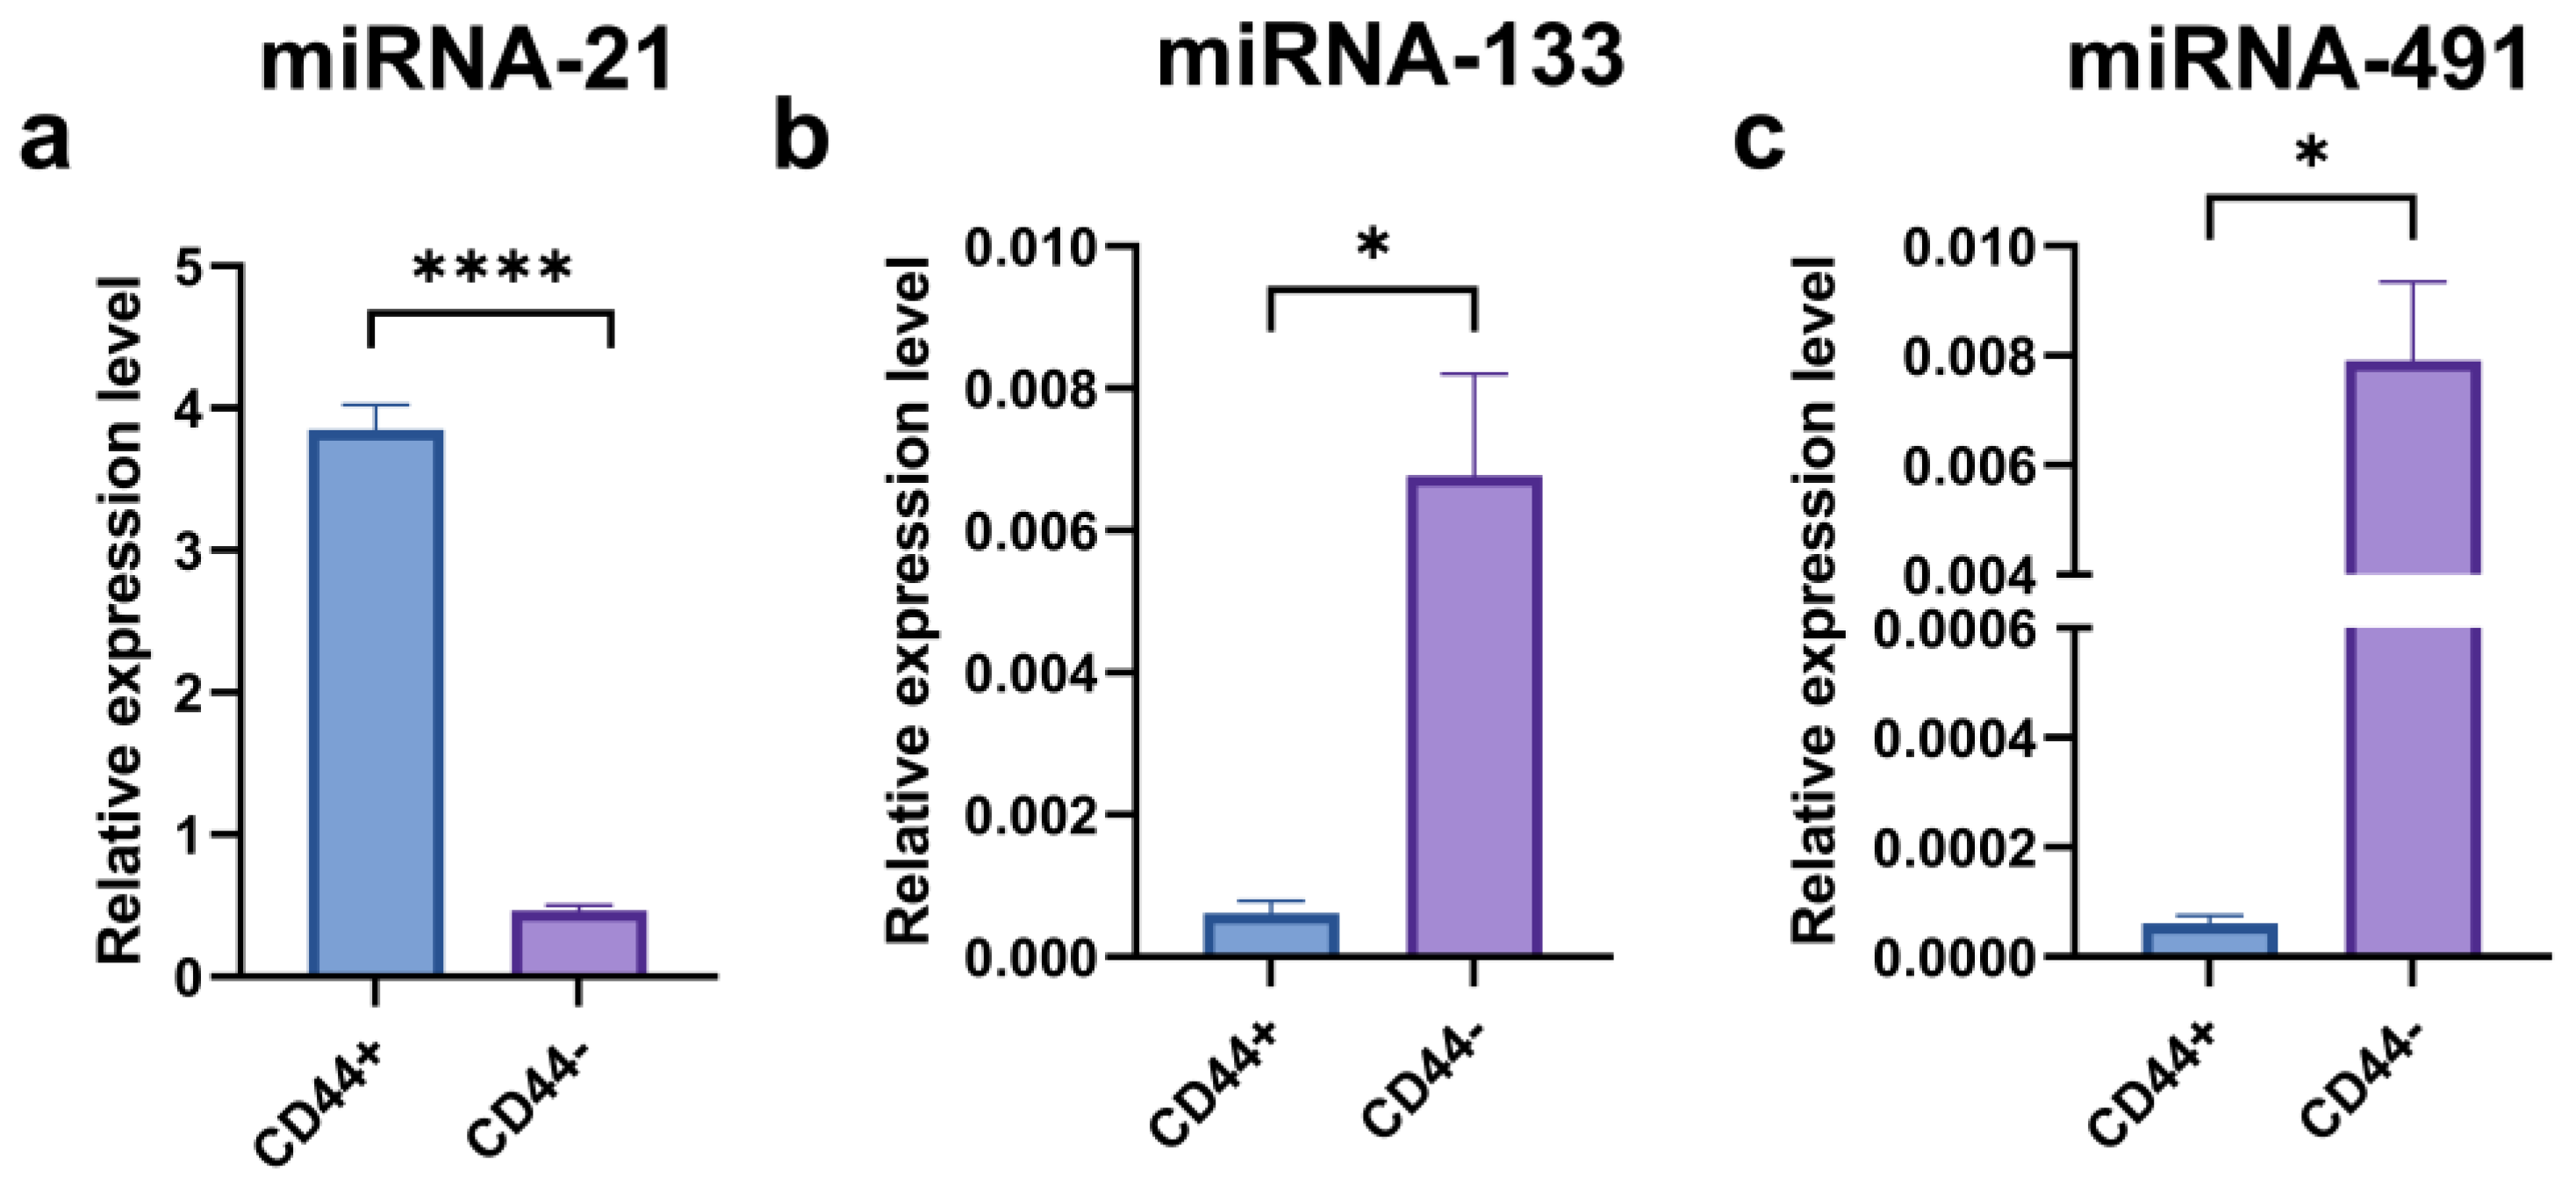
2.7. Expression of miRNA-21, miRNA-133, and miRNA-491
3. Discussion
4. Materials and Methods
4.1. Cell Cultures
4.2. Magnetic-Activated Cell Sorting
4.3. Spheroid Formation Assay
4.4. Colony-Forming Assay
4.5. Differentiation Capacity of CD44+ and CD44− Cells
4.6. Apoptosis Assay
4.7. RNA Isolation and Reverse Transcription
4.8. Gene Expression Analysis of Differentiation and Stemness Markers
4.9. TaqMan microRNA Assay
4.10. Statistical Analysis
Author Contributions
Funding
Institutional Review Board Statement
Informed Consent Statement
Data Availability Statement
Acknowledgments
Conflicts of Interest
References
- Jou, A.; Hess, J. Epidemiology and Molecular Biology of Head and Neck Cancer. Oncol. Res. Treat. 2017, 40, 328–332. [Google Scholar] [CrossRef] [PubMed]
- Johnson, D.E.; Burtness, B.; Leemans, C.R.; Lui, V.W.Y.; Bauman, J.E.; Grandis, J.R. Head and Neck Squamous Cell Carcinoma. Nat. Rev. Dis. Prim. 2020, 6, 92. [Google Scholar] [CrossRef] [PubMed]
- Bray, F.; Ferlay, J.; Soerjomataram, I.; Siegel, R.L.; Torre, L.A.; Jemal, A. Global Cancer Statistics 2018: GLOBOCAN Estimates of Incidence and Mortality Worldwide for 36 Cancers in 185 Countries. CA Cancer J. Clin. 2018, 68, 394–424. [Google Scholar] [CrossRef] [PubMed]
- Ferlay, J.; Colombet, M.; Soerjomataram, I.; Mathers, C.; Parkin, D.M.; Piñeros, M.; Znaor, A.; Bray, F. Estimating the Global Cancer Incidence and Mortality in 2018: GLOBOCAN Sources and Methods. Int. J. Cancer 2019, 144, 1941–1953. [Google Scholar] [CrossRef]
- Milosevic, M.; Lazarevic, M.; Toljic, B.; Petrovic, M.; Vukadinovic, M.; Jezdic, Z.; Anicic, B.; Jelovac, D.; Jovanovic, S.; Milasin, J. Basal Cell Carcinoma Stem Cells Exhibit Osteogenic and Chondrogenic Differentiation Potential. Biocell 2021, 45, 1543–1550. [Google Scholar] [CrossRef]
- Zhau, H.E.; He, H.; Wang, C.Y.; Zayzafoon, M.; Morrissey, C.; Vessella, R.L.; Marshall, F.F.; Chung, L.W.K.; Wang, R. Human Prostate Cancer Harbors the Stem Cell Properties of Bone Marrow Mesenchymal Stem Cells. Clin. Cancer Res. 2011, 17, 2159–2169. [Google Scholar] [CrossRef]
- Naik, P.P.; Das, D.N.; Panda, P.K.; Mukhopadhyay, S.; Sinha, N.; Praharaj, P.P.; Agarwal, R.; Bhutia, S.K. Implications of Cancer Stem Cells in Developing Therapeutic Resistance in Oral Cancer. Oral Oncol. 2016, 62, 122–135. [Google Scholar] [CrossRef]
- Yan, Y.; Zuo, X.; Wei, D. Concise Review: Emerging Role of CD44 in Cancer Stem Cells: A Promising Biomarker and Therapeutic Target. Stem Cells Transl. Med. 2015, 4, 1033–1043. [Google Scholar] [CrossRef]
- Lazarević, M.; Milošević, M.; Trišić, D.; Toljić, B.; Simonović, J.; Nikolić, N.; Miković, N.; Jelovac, D.; Petrović, M.; Vukadinović, M.; et al. Putative Cancer Stem Cells Are Present in Surgical Margins of Oral Squamous Cell Carcinoma. J. BUON 2018, 23, 1686–1692. [Google Scholar]
- Zhang, B.; Pan, X.; Cobb, G.P.; Anderson, T.A. MicroRNAs as Oncogenes and Tumor Suppressors. Dev. Biol. 2007, 302, 1–12. [Google Scholar] [CrossRef]
- Smith, B.; Agarwal, P.; Bhowmick, N.A. MicroRNA Applications for Prostate, Ovarian and Breast Cancer in the Era of Precision Medicine. Endocr. Relat. Cancer 2017, 24, R157–R172. [Google Scholar] [CrossRef] [PubMed]
- Fan, T.; Wang, W.; Zhang, B.; Xu, Y.; Chen, L.; Pan, S.; Hu, H.; Geng, Q. Regulatory Mechanisms of MicroRNAs in Lung Cancer Stem Cells. SpringerPlus 2016, 5, 1762. [Google Scholar] [CrossRef] [PubMed]
- Hwang, H.-W.; Mendell, J.T. MicroRNAs in Cell Proliferation, Cell Death, and Tumorigenesis. Br. J. Cancer 2006, 94, 776–780. [Google Scholar] [CrossRef] [PubMed]
- DeSano, J.T.; Xu, L. MicroRNA Regulation of Cancer Stem Cells and Therapeutic Implications. AAPS J. 2009, 11, 682–692. [Google Scholar] [CrossRef] [PubMed]
- Li, J.; Huang, H.; Sun, L.; Yang, M.; Pan, C.; Chen, W.; Wu, D.; Lin, Z.; Zeng, C.; Yao, Y.; et al. MiR-21 Indicates Poor Prognosis in Tongue Squamous Cell Carcinomas as an Apoptosis Inhibitor. Clin. Cancer Res. 2009, 15, 3998–4008. [Google Scholar] [CrossRef]
- Bourguignon, L.Y.W.; Shiina, M.; Li, J.-J. Hyaluronan–CD44 Interaction Promotes Oncogenic Signaling, MicroRNA Functions, Chemoresistance, and Radiation Resistance in Cancer Stem Cells Leading to Tumor Progression. Adv. Cancer Res. 2014, 123, 255–275. [Google Scholar] [CrossRef] [PubMed]
- Bourguignon, L.Y.W.; Earle, C.; Wong, G.; Spevak, C.C.; Krueger, K. Stem Cell Marker (Nanog) and Stat-3 Signaling Promote MicroRNA-21 Expression and Chemoresistance in Hyaluronan/CD44-Activated Head and Neck Squamous Cell Carcinoma Cells. Oncogene 2012, 31, 149–160. [Google Scholar] [CrossRef] [PubMed]
- Kim, W.-T.; Ryu, C.J. Cancer Stem Cell Surface Markers on Normal Stem Cells. BMB Rep. 2017, 50, 285–298. [Google Scholar] [CrossRef]
- Patil, S.; Al-Brakati, A.; Abidi, N.; Almasri, M.; Almeslet, A.; Patil, V.; Raj, T.; Bhandi, S. CD44-positive cancer stem cells from oral squamous cell carcinoma exhibit reduced proliferation and stemness gene expression upon adipogenic induction. Med. Oncol. 2022, 39, 23. [Google Scholar] [CrossRef] [PubMed]
- Arima, Y.; Nobusue, H.; Saya, H. Targeting of Cancer Stem Cells by Differentiation Therapy. Cancer Sci. 2020, 111, 2689–2695. [Google Scholar] [CrossRef]
- Zhang, X.; Cruz, F.D.; Terry, M.; Remotti, F.; Matushansky, I. Terminal Differentiation and Loss of Tumorigenicity of Human Cancers via Pluripotency-Based Reprogramming. Oncogene 2013, 32, 2249–2260. [Google Scholar] [CrossRef] [PubMed]
- McKenna, S.L.; Cotter, T.G. Functional Aspects of Apoptosis in Hematopoiesis and Consequences of Failure. Adv. Cancer Res. 1997, 71, 121–164. [Google Scholar] [CrossRef]
- Khan, A.Q.; Ahmed, E.I.; Elareer, N.R.; Junejo, K.; Steinhoff, M.; Uddin, S. Role of MiRNA-Regulated Cancer Stem Cells in the Pathogenesis of Human Malignancies. Cells 2019, 8, 840. [Google Scholar] [CrossRef] [PubMed]
- Tu, H.-F.; Lin, S.-C.; Chang, K.-W. MicroRNA Aberrances in Head and Neck Cancer: Pathogenetic and Clinical Significance. Curr. Opin. Otolaryngol. Head Neck Surg. 2013, 21, 104–111. [Google Scholar] [CrossRef] [PubMed]
- Barlak, N.; Capik, O.; Sanli, F.; Karatas, O.F. The Roles of MicroRNAs in the Stemness of Oral Cancer Cells. Oral Oncol. 2020, 109, 104950. [Google Scholar] [CrossRef] [PubMed]
- Mamoori, A.; Gopalan, V.; Smith, R.A.; Lam, A.K.-Y. Modulatory Roles of MicroRNAs in the Regulation of Different Signalling Pathways in Large Bowel Cancer Stem Cells. Biol. Cell 2016, 108, 51–64. [Google Scholar] [CrossRef]
- Mortoglou, M.; Miralles, F.; Arisan, E.D.; Dart, A.; Jurcevic, S.; Lange, S.; Uysal-Onganer, P. MicroRNA-21 Regulates Stemness in Pancreatic Ductal Adenocarcinoma Cells. Int. J. Mol. Sci. 2022, 23, 1275. [Google Scholar] [CrossRef]
- Haghpanah, V.; Fallah, P.; Tavakoli, R.; Naderi, M.; Samimi, H.; Soleimani, M.; Larijani, B. Antisense-MiR-21 Enhances Differentiation/Apoptosis and Reduces Cancer Stemness State on Anaplastic Thyroid Cancer. Tumour Biol. 2016, 37, 1299–1308. [Google Scholar] [CrossRef]
- Huang, W.C.; Chan, S.H.; Jang, T.H.; Chang, J.W.; Ko, Y.C.; Yen, T.C.; Chiang, S.L.; Chiang, W.F.; Shieh, T.Y.; Liao, C.T.; et al. miRNA-491-5p and GIT1 serve as modulators and biomarkers for oral squamous cell carcinoma invasion and metastasis. Cancer Res. 2014, 74, 751–764. [Google Scholar] [CrossRef]
- He, B.; Lin, X.; Tian, F.; Yu, W.; Qiao, B. MiR-133a-3p Inhibits Oral Squamous Cell Carcinoma (OSCC) proliferation and invasion by suppressing COL1A1. J. Cell. Biochem. 2018, 119, 338–346. [Google Scholar] [CrossRef] [PubMed]
- Shen, C.; Xiang, M.; Nie, C.; Hu, H.; Ma, Y.; Wu, H. CD44 as a Molecular Marker to Screen Cancer Stem Cells in Hypopharyngeal Cancer. Acta Otolaryngol. 2013, 133, 1219–1226. [Google Scholar] [CrossRef] [PubMed]
- Allegri, L.; Baldan, F.; Mio, C.; Puppin, C.; Russo, D.; Kryštof, V.; Damante, G. Effects of BP-14, a Novel Cyclin-Dependent Kinase Inhibitor, on Anaplastic Thyroid Cancer Cells. Oncol. Rep. 2016, 35, 2413–2418. [Google Scholar] [CrossRef] [PubMed]
- Ma, R.; Tang, S.; Tan, H.; Lin, W.; Wang, Y.; Wei, J.; Zhao, L.; Tang, T. Preparation, Characterization, and in Vitro Osteoblast Functions of a Nano-Hydroxyapatite/Polyetheretherketone Biocomposite as Orthopedic Implant Material. Int. J. Nanomed. 2014, 9, 3949–3961. [Google Scholar] [CrossRef]
- Simonovic, J.; Toljic, B.; Lazarevic, M.; Markovic, M.M.; Peric, M.; Vujin, J.; Panajotovic, R.; Milasin, J. The Effect of Liquid-Phase Exfoliated Graphene Film on Neurodifferentiation of Stem Cells from Apical Papilla. Nanomaterials 2022, 12, 3116. [Google Scholar] [CrossRef]
- Livak, K.J.; Schmittgen, T.D. Analysis of Relative Gene Expression Data Using Real-Time Quantitative PCR and the 2(-Delta Delta C(T)) Method. Methods 2001, 25, 402–408. [Google Scholar] [CrossRef] [PubMed]


| OCT4 | Rv | 5′ TGC TCC AGC TTC TCC TTC TC 3′ |
| Fw | 5′ GTG GAG AGC AAC TCC GAT G 3′ | |
| SOX9 | Rv | 5′ CTC TTT TGC ACC CCT CCC ATT 3′ |
| Fw | 5′ GAC TTC ACA TGT CCC AGC ACT A 3′ | |
| NANOG | Rv | 5′ TTT TTG CGA CAG TCT TCT CTG C 3′ |
| Fw | 5′ ATT CAG GAC AGC CCT GAT TCT TC 3′ | |
| RUNX2 | Rv | 5′ GTC TCG GTG GCT GGT AGT GA 3′ |
| Fw | 5′ ACA AAC AAC CAC AGA ACC ACA AGT 3′ | |
| ALP | Rv | 5′ ATG GCA GTG AAG GGC TTC TT 3′ |
| Fw | 5′ CCA CGT CTT CAC ATT TGG TG 3′ | |
| BMP4 | Rv | 5′ GGG TGA GTG GAT GG AAC 3′ |
| Fw | 5′ CTC GAT GAG TAT GAT AAG GTG GTA 3′ | |
| FAP | Rv | 5′ TTA TGC TCT CTC ATA AAC TCT CGT GGA ATG GAC 3′ |
| Fw | 5′ ATG TGT GAT GCT TT GTA GGT ACC TG 3′ | |
| LIPIN | Rv | 5′ TGG ACT CTT TCA TCT TGT GTG GA 3′ |
| Fw | 5′ CCC GAC CTT CAA CAC CTA AAA GT 3′ | |
| PPARG | Rv | 5′ TGG ATC TGT TCT TGT GAA TG 3′ |
| Fw | 5′ CGT GGA TCT CTC GGT AAT 3′ | |
| GAPDH | Rv | 5′ CCC TGT TGC TGT AGC CAA ATT CGT 3′ |
| Fw | 5′ TCA TGA CCA CAG TCC ATG CCA TCA 3′ |
Disclaimer/Publisher’s Note: The statements, opinions and data contained in all publications are solely those of the individual author(s) and contributor(s) and not of MDPI and/or the editor(s). MDPI and/or the editor(s) disclaim responsibility for any injury to people or property resulting from any ideas, methods, instructions or products referred to in the content. |
© 2023 by the authors. Licensee MDPI, Basel, Switzerland. This article is an open access article distributed under the terms and conditions of the Creative Commons Attribution (CC BY) license (https://creativecommons.org/licenses/by/4.0/).
Share and Cite
Jaksic Karisik, M.; Lazarevic, M.; Mitic, D.; Nikolic, N.; Milosevic Markovic, M.; Jelovac, D.; Milasin, J. Osteogenic and Adipogenic Differentiation Potential of Oral Cancer Stem Cells May Offer New Treatment Modalities. Int. J. Mol. Sci. 2023, 24, 4704. https://doi.org/10.3390/ijms24054704
Jaksic Karisik M, Lazarevic M, Mitic D, Nikolic N, Milosevic Markovic M, Jelovac D, Milasin J. Osteogenic and Adipogenic Differentiation Potential of Oral Cancer Stem Cells May Offer New Treatment Modalities. International Journal of Molecular Sciences. 2023; 24(5):4704. https://doi.org/10.3390/ijms24054704
Chicago/Turabian StyleJaksic Karisik, Milica, Milos Lazarevic, Dijana Mitic, Nadja Nikolic, Maja Milosevic Markovic, Drago Jelovac, and Jelena Milasin. 2023. "Osteogenic and Adipogenic Differentiation Potential of Oral Cancer Stem Cells May Offer New Treatment Modalities" International Journal of Molecular Sciences 24, no. 5: 4704. https://doi.org/10.3390/ijms24054704
APA StyleJaksic Karisik, M., Lazarevic, M., Mitic, D., Nikolic, N., Milosevic Markovic, M., Jelovac, D., & Milasin, J. (2023). Osteogenic and Adipogenic Differentiation Potential of Oral Cancer Stem Cells May Offer New Treatment Modalities. International Journal of Molecular Sciences, 24(5), 4704. https://doi.org/10.3390/ijms24054704