


mtR_find: A Parallel Processing Tool to Identify and Annotate RNAs Derived from the Mitochondrial Genome


Abstract
1. Introduction
2. Results
2.1. Performance
2.2. Read Statistics
2.3. Length Distribution and Annotation of mt-ncRNAs
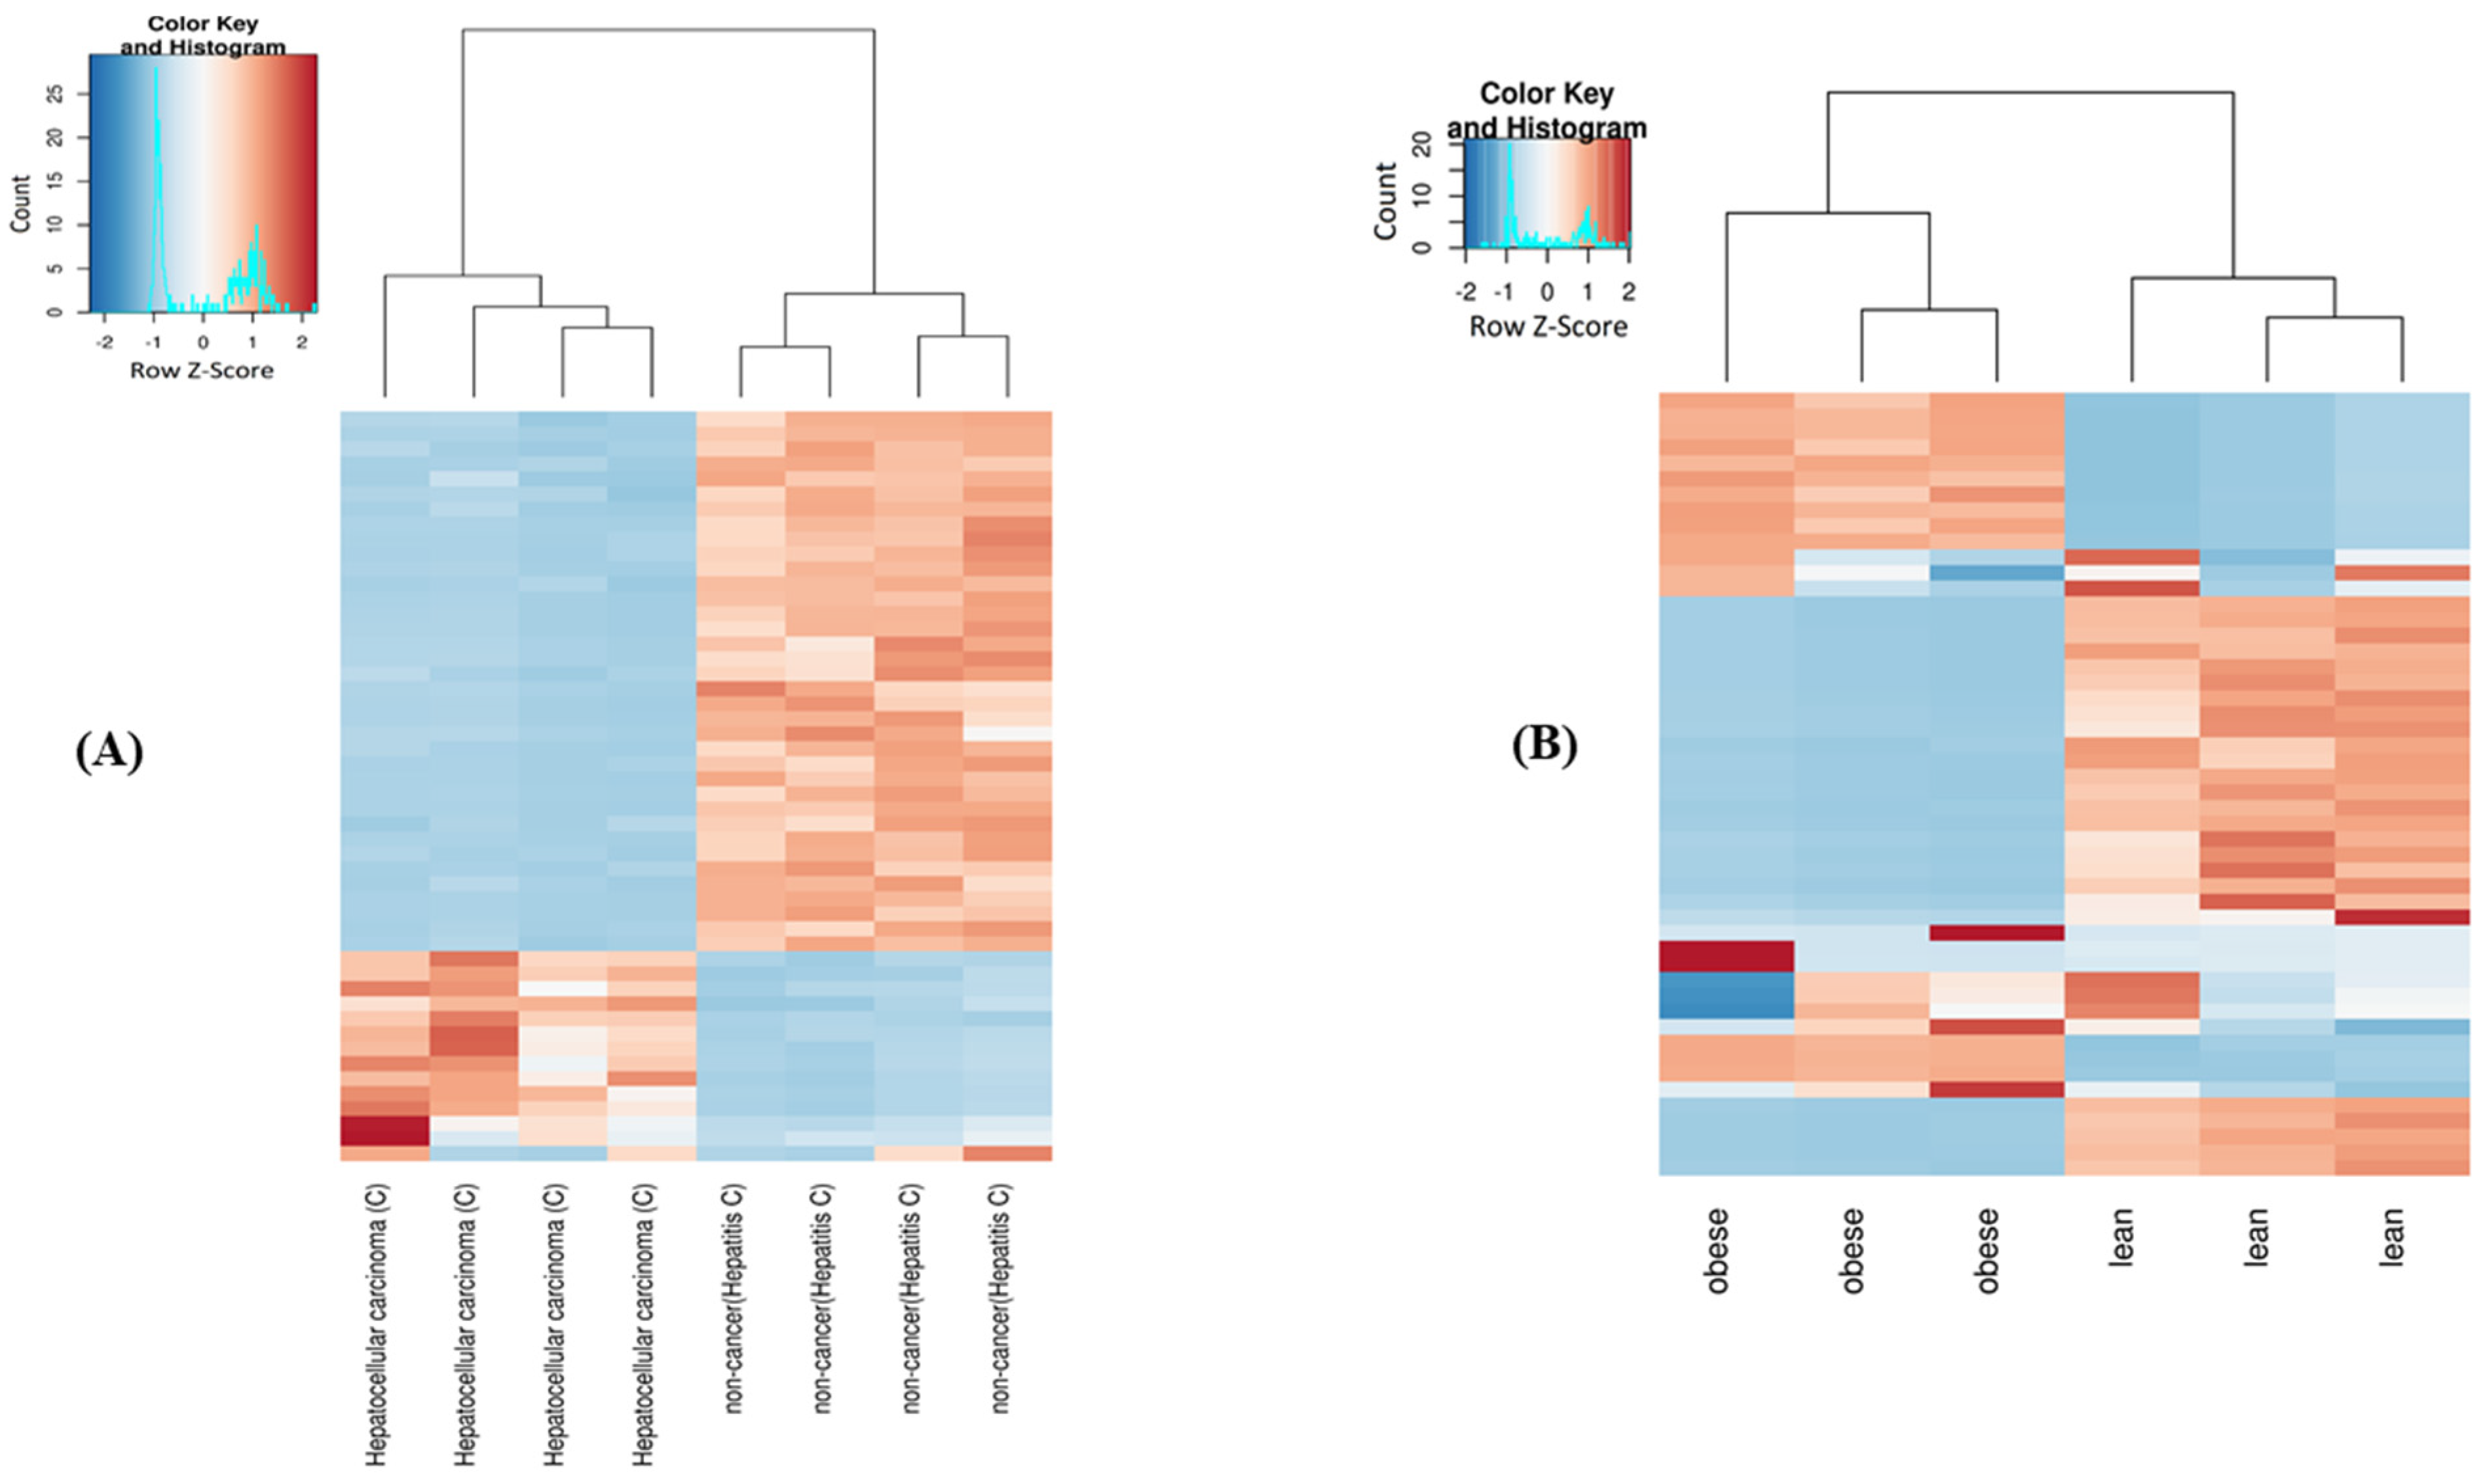
2.4. Differential Expression of mt-ncRNAs
2.5. Novel Mitochondrial tRFs and Non-Coding RNAs Detected by mtR_find
2.6. Performance of the Tool with Simulated Data Set
3. Discussion
4. Materials and Methods
4.1. Implementation
4.2. Data Resources, Extraction of Mitochondrial Genome, and Annotation File
4.3. ncRNA Count Generation
4.4. Mapping
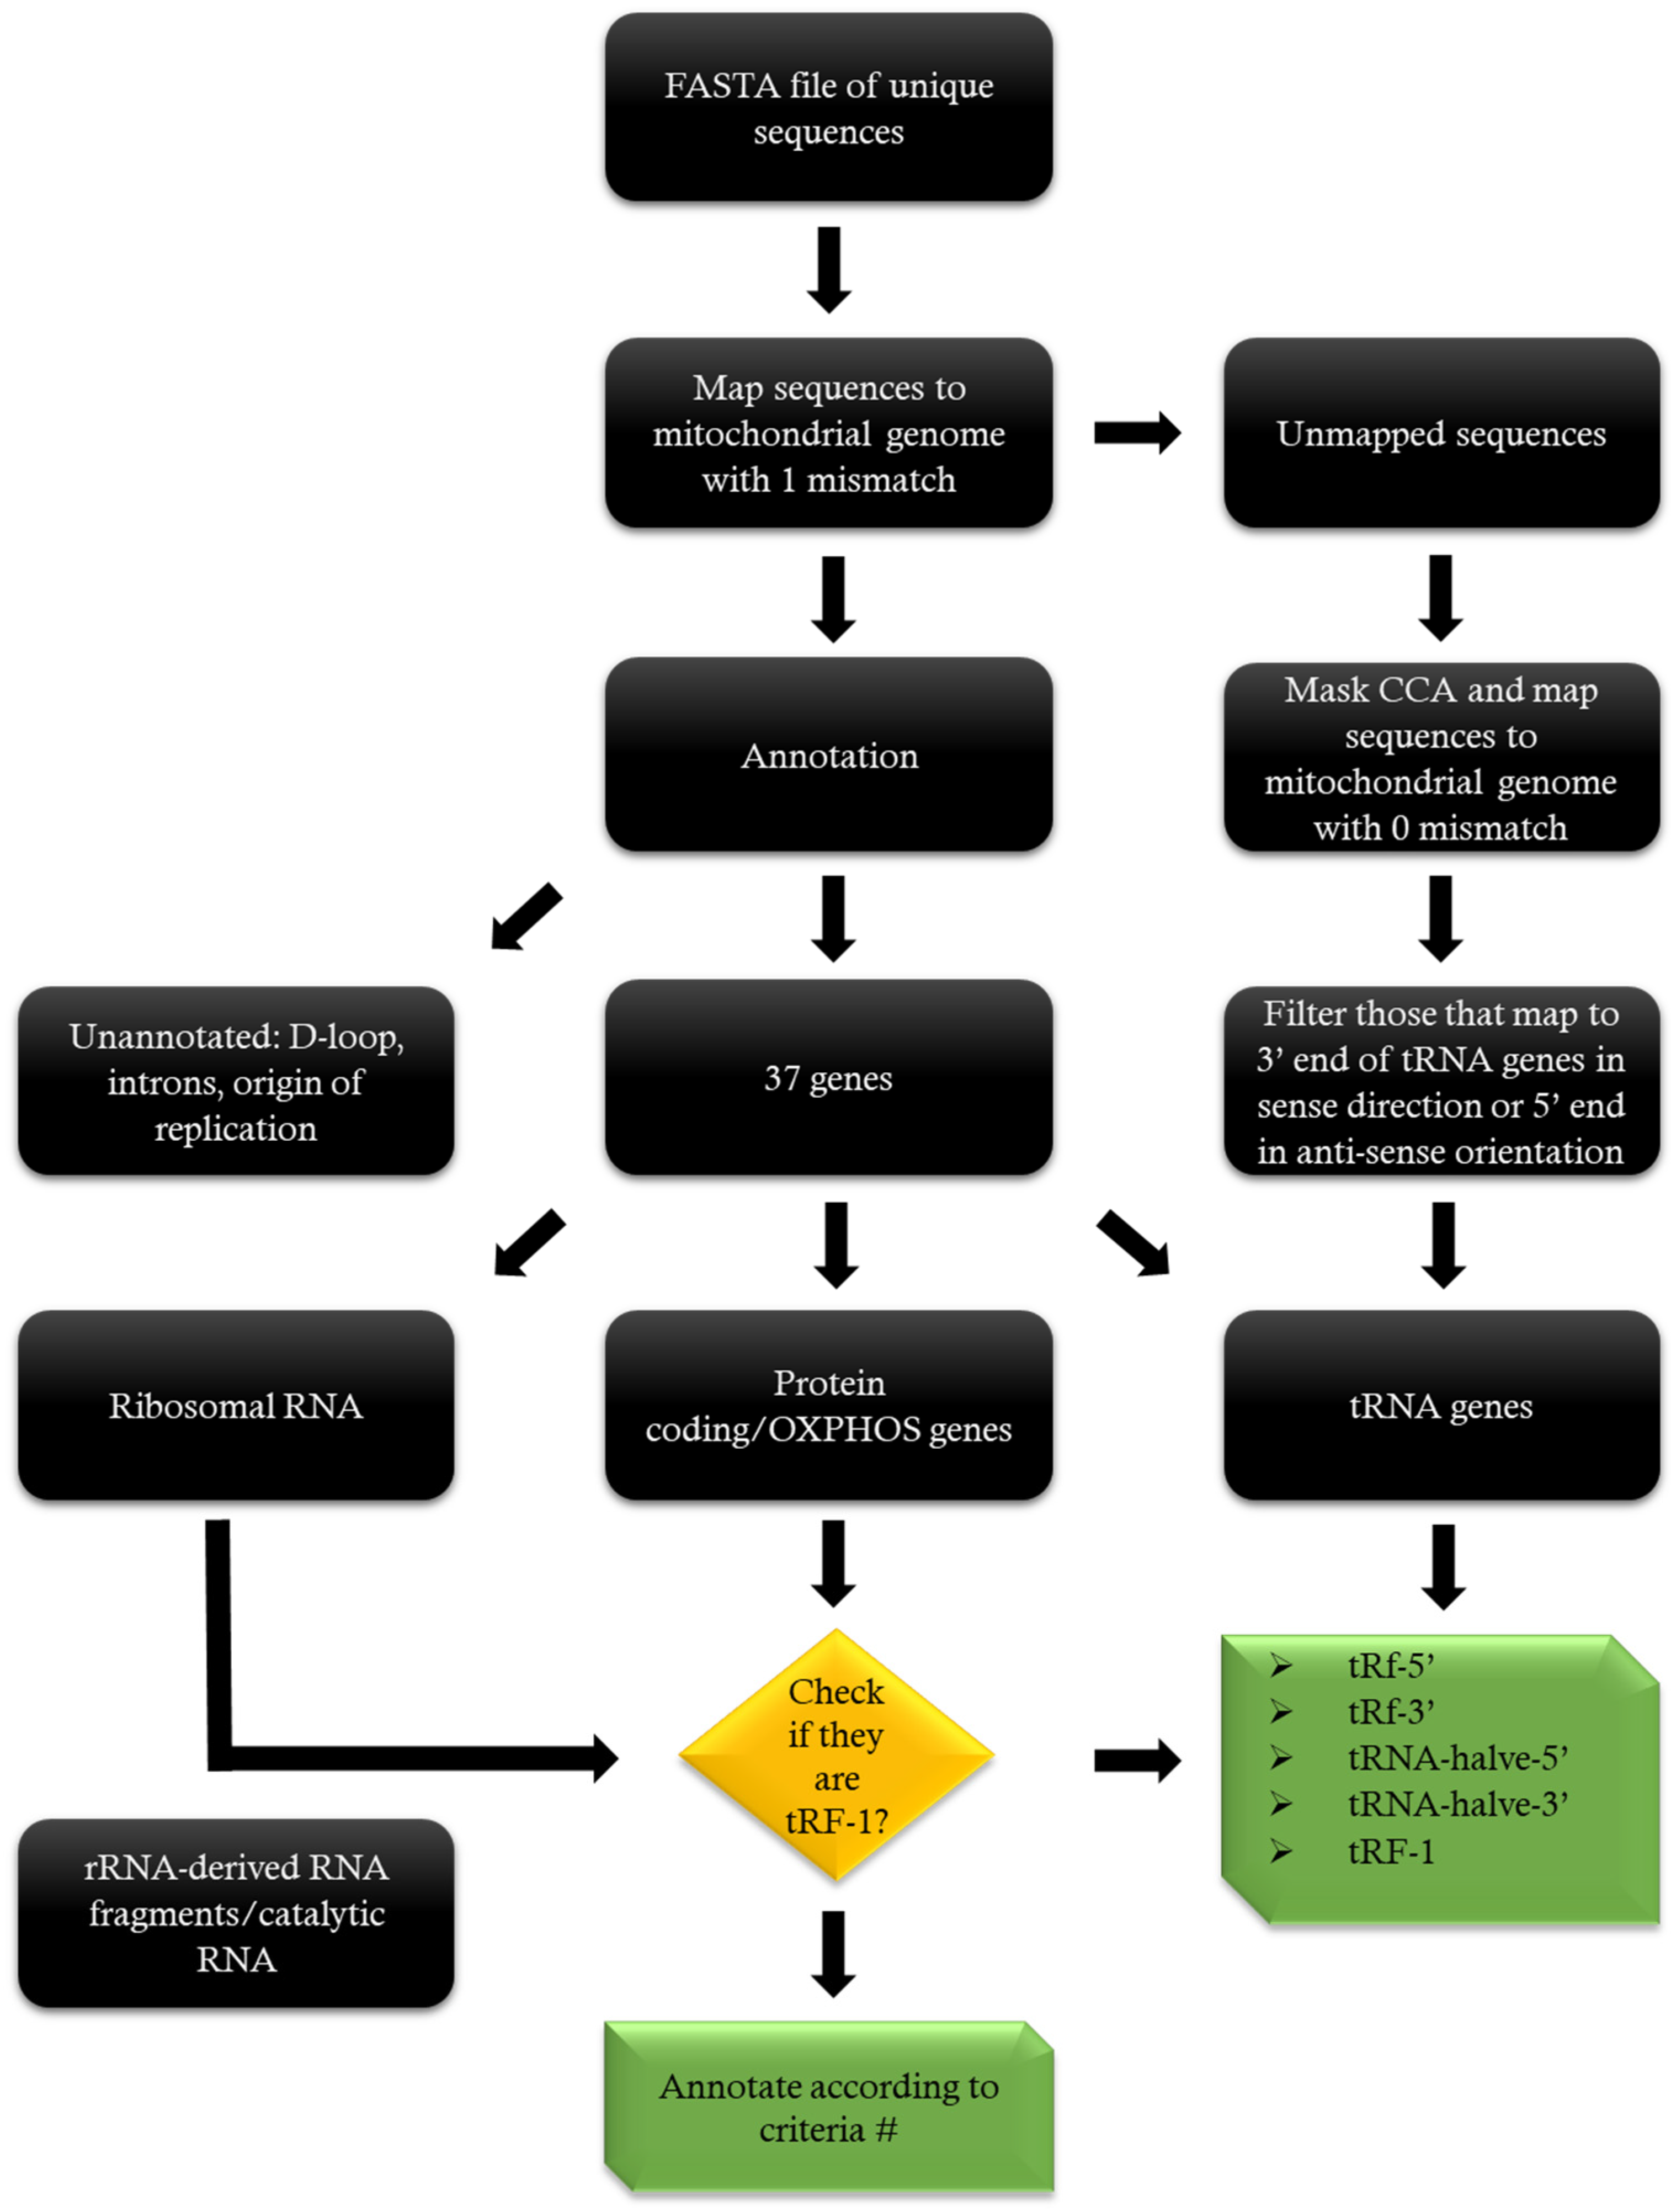
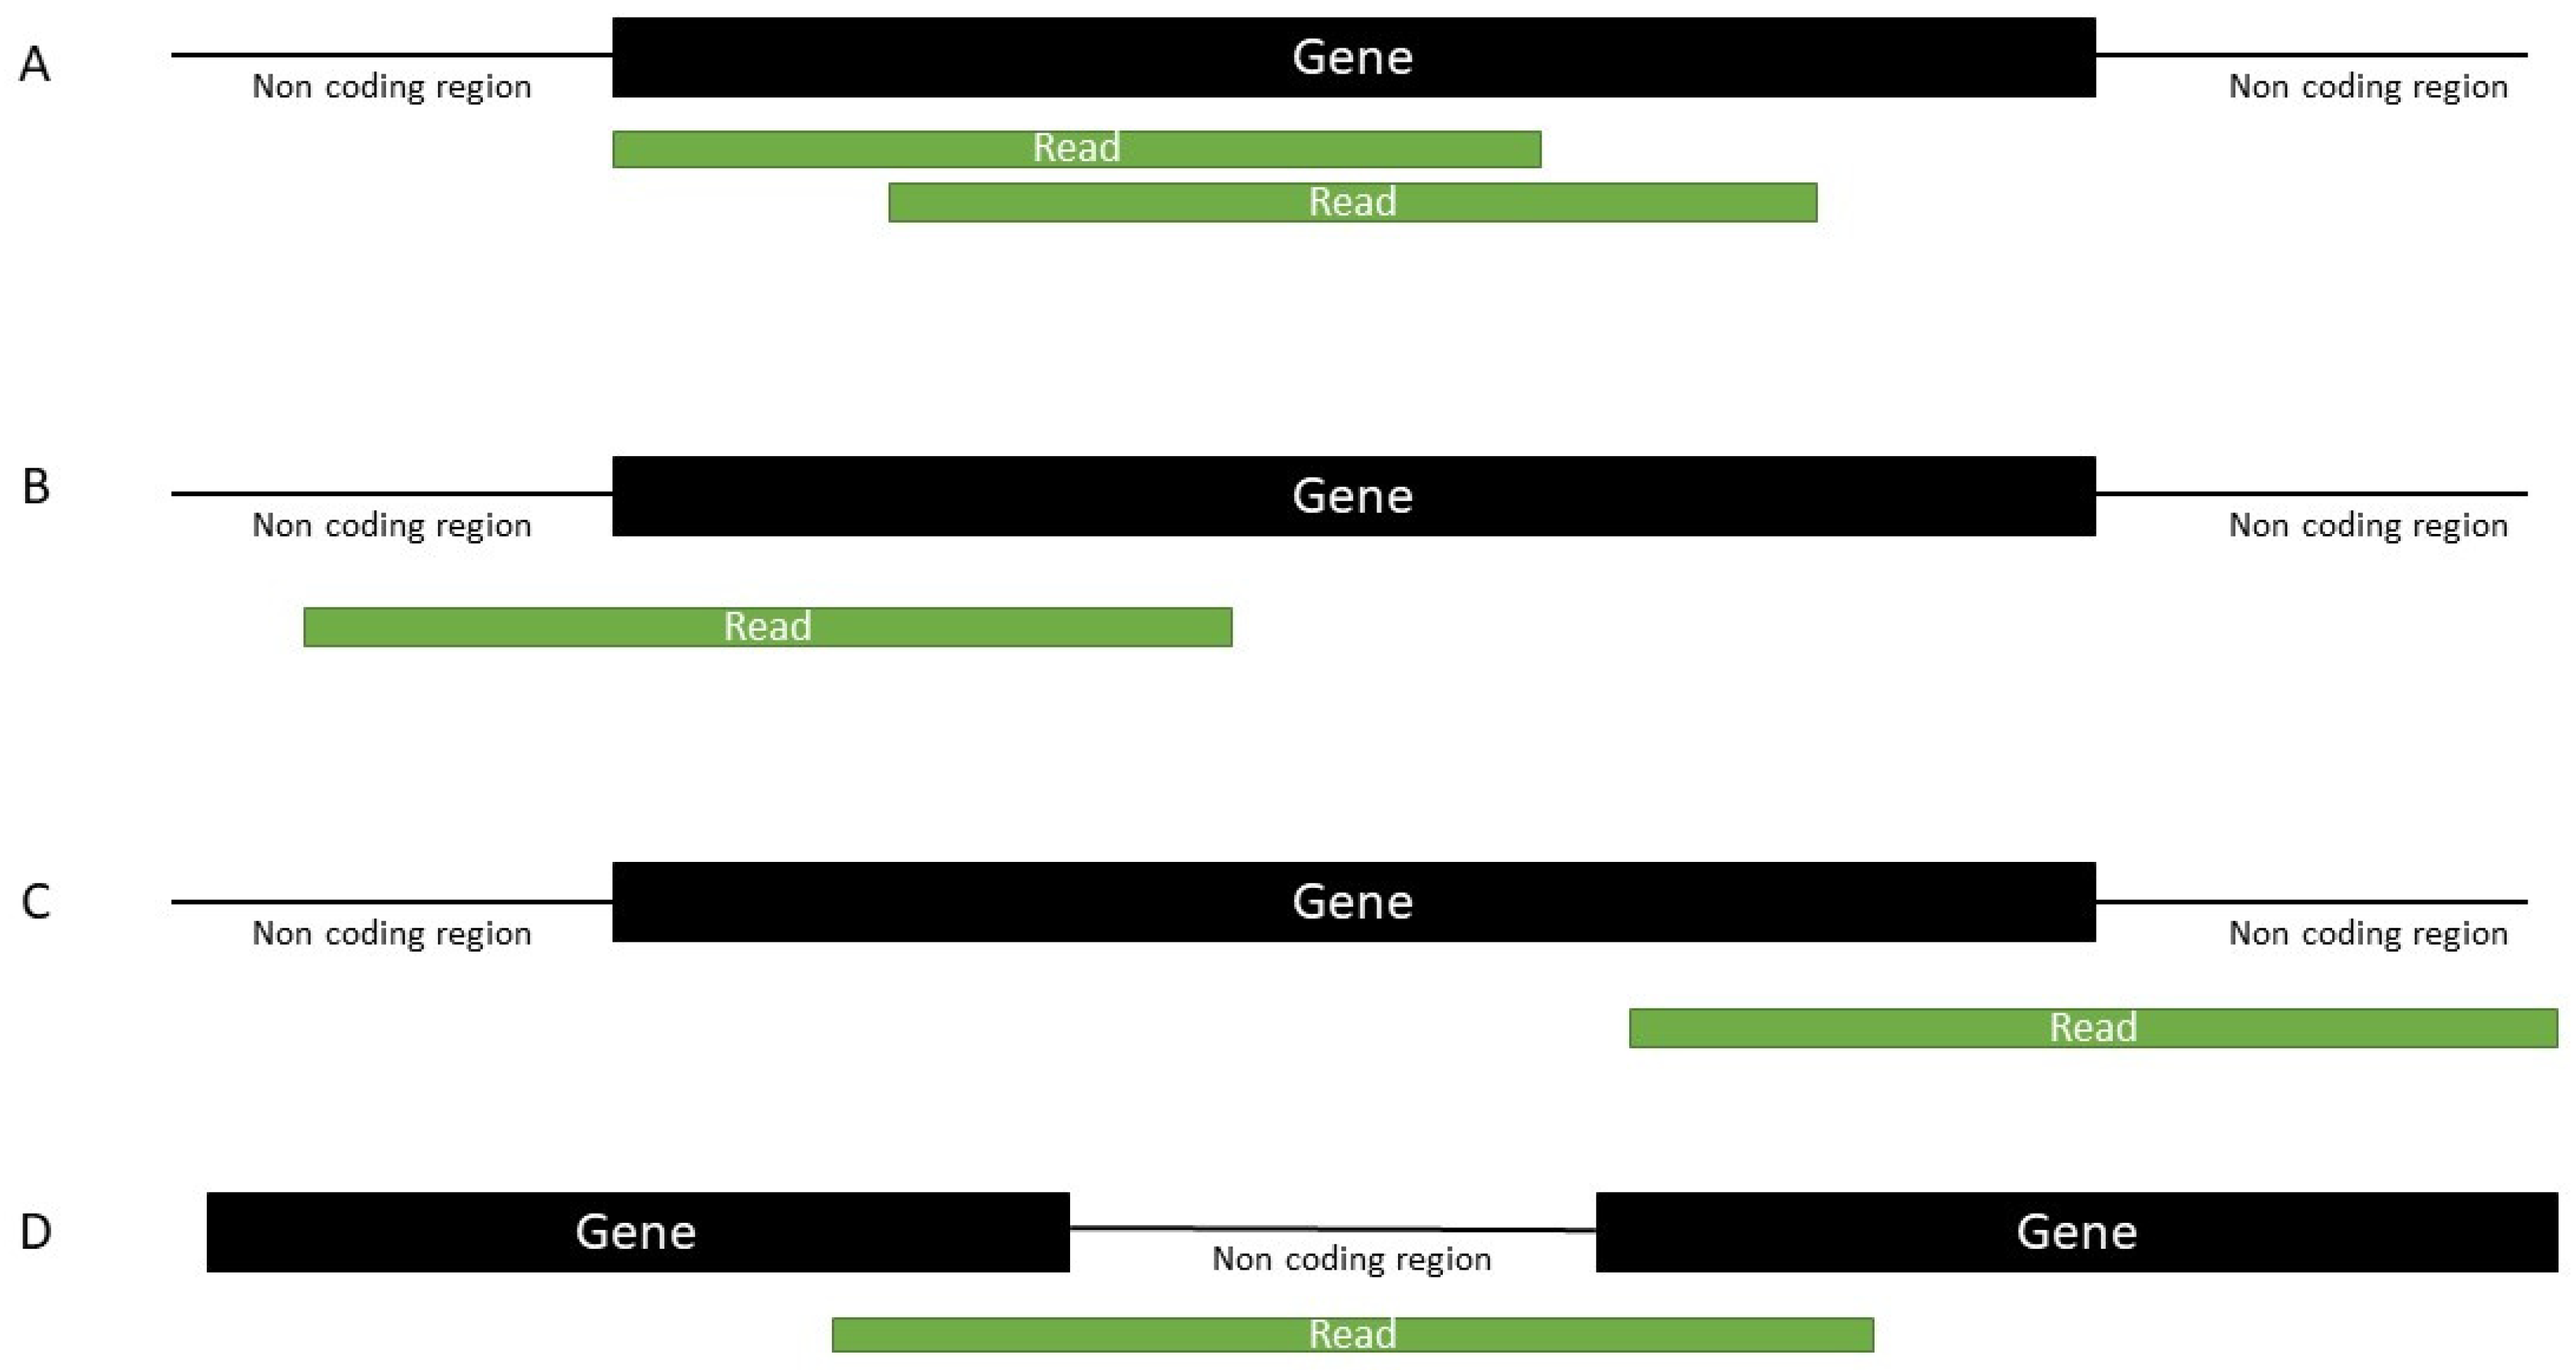
4.5. Annotation
4.6. Nomenclature
4.7. Training-Experimental Dataset
4.8. Training-Simulated Dataset
4.9. Identification of Novel tRFs
5. Conclusions
Supplementary Materials
Author Contributions
Funding
Institutional Review Board Statement
Informed Consent Statement
Data Availability Statement
Acknowledgments
Conflicts of Interest
References
- Formosa, L.E.; Ryan, M.T. Mitochondrial OXPHOS complex assembly lines. Nat. Cell Biol. 2018, 20, 511–513. [Google Scholar] [CrossRef]
- Bock, F.J.; Tait, S.W.G. Mitochondria as multifaceted regulators of cell death. Nat. Rev. Mol. Cell Biol. 2019, 21, 85–100. [Google Scholar] [CrossRef]
- Gissi, C.; Iannelli, F.; Pesole, G. Evolution of the mitochondrial genome of Metazoa as exemplified by comparison of congeneric species. Heredity 2008, 101, 301. [Google Scholar] [CrossRef]
- Ro, S.; Ma, H.Y.; Park, C.; Ortogero, N.; Song, R.; Hennig, G.W.; Zheng, H.; Lin, Y.M.; Moro, L.; Hsieh, J.T.; et al. The mitochondrial genome encodes abundant small noncoding RNAs. Cell Res 2013, 23, 759–774. [Google Scholar] [CrossRef]
- Mercer, T.R.; Neph, S.; Dinger, M.E.; Crawford, J.; Smith, M.A.; Shearwood, A.M.; Haugen, E.; Bracken, C.P.; Rackham, O.; Stamatoyannopoulos, J.A.; et al. The human mitochondrial transcriptome. Cell 2011, 146, 645–658. [Google Scholar] [CrossRef]
- Huang, J.; Wu, S.; Wang, P.; Wang, G. Non-coding RNA regulated cross-talk between mitochondria and other cellular compartments. Front. Cell Dev. Biol. 2021, 9, 688523. [Google Scholar] [CrossRef]
- Gao, S.; Tian, X.; Chang, H.; Sun, Y.; Wu, Z.; Cheng, Z.; Dong, P.; Zhao, Q.; Ruan, J.; Bu, W. Two novel lncRNAs discovered in human mitochondrial DNA using PacBio full-length transcriptome data. Mitochondrion 2018, 38, 41–47. [Google Scholar] [CrossRef]
- Hedberg, A.; Knutsen, E.; Løvhaugen, A.S.; Jørgensen, T.E.; Perander, M.; Johansen, S.D. Cancer-specific SNPs originate from low-level heteroplasmic variants in human mitochondrial genomes of a matched cell line pair. Mitochondrial DNA Part A DNA Mapp. Seq. Anal. 2019, 30, 82–91. [Google Scholar] [CrossRef]
- Jørgensen, T.E.; Bakke, I.; Ursvik, A.; Andreassen, M.; Moum, T.; Johansen, S.D. An evolutionary preserved intergenic spacer in gadiform mitogenomes generates a long noncoding RNA. BMC Evol. Biol. 2014, 14, 182. [Google Scholar] [CrossRef]
- Bernt, M.; Donath, A.; Jühling, F.; Externbrink, F.; Florentz, C.; Fritzsch, G.; Pütz, J.; Middendorf, M.; Stadler, P.F. MITOS: Improved de novo metazoan mitochondrial genome annotation. Mol. Phylogenet. Evol. 2013, 69, 313–319. [Google Scholar] [CrossRef]
- Wyman, S.K.; Jansen, R.K.; Boore, J.L. Automatic annotation of organellar genomes with DOGMA. Bioinformatics 2004, 20, 3252–3255. [Google Scholar] [CrossRef]
- Ma, H.; Weber, G.M.; Wei, H.; Yao, J. Identification of mitochondrial genome-encoded small RNAs related to egg deterioration caused by postovulatory aging in rainbow trout. Mar. Biotechnol. 2016, 18, 584–597. [Google Scholar] [CrossRef]
- Selitsky, S.R.; Sethupathy, P. tDRmapper: Challenges and solutions to mapping, naming, and quantifying tRNA-derived RNAs from human small RNA-sequencing data. BMC Bioinform. 2015, 16, 354. [Google Scholar] [CrossRef]
- Shi, J.; Ko, E.A.; Sanders, K.M.; Chen, Q.; Zhou, T. SPORTS1.0: A tool for annotating and profiling non-coding RNAs optimized for rRNA- and tRNA-derived small RNAs. Genom. Proteom. Bioinform. 2018, 16, 144–151. [Google Scholar] [CrossRef]
- Loher, P.; Telonis, A.G.; Rigoutsos, I. MINTmap: Fast and exhaustive profiling of nuclear and mitochondrial tRNA fragments from short RNA-seq data. Sci. Rep. 2017, 7, 41184. [Google Scholar] [CrossRef]
- Wu, X.; Kim, T.-K.; Baxter, D.; Scherler, K.; Gordon, A.; Fong, O.; Etheridge, A.; Galas, D.J.; Wang, K. sRNAnalyzer-a flexible and customizable small RNA sequencing data analysis pipeline. Nucleic Acids Res. 2017, 45, 12140–12151. [Google Scholar] [CrossRef]
- Problem Using Multiprocessing with Really Big Objects? Available online: https://github.com/python/cpython/issues/61760 (accessed on 21 October 2022).
- Selitsky, S.R.; Baran-Gale, J.; Honda, M.; Yamane, D.; Masaki, T.; Fannin, E.E.; Guerra, B.; Shirasaki, T.; Shimakami, T.; Kaneko, S.; et al. Small tRNA-derived RNAs are increased and more abundant than microRNAs in chronic hepatitis B and C. Sci. Rep. 2015, 5, 7675. [Google Scholar] [CrossRef]
- Pliatsika, V.; Loher, P.; Magee, R.; Telonis, A.G.; Londin, E.; Shigematsu, M.; Kirino, Y.; Rigoutsos, I. MINTbase v2.0: A comprehensive database for tRNA-derived fragments that includes nuclear and mitochondrial fragments from all The Cancer Genome Atlas projects. Nucleic Acids Res. 2018, 46, D152–D159. [Google Scholar] [CrossRef] [PubMed]
- Rigoutsos, I.; Londin, E.; Kirino, Y. Short RNA regulators: The past, the present, the future, and implications for precision medicine and health disparities. Curr. Opin. Biotechnol. 2019, 58, 202–210. [Google Scholar] [CrossRef]
- Donkin, I.; Versteyhe, S.; Ingerslev, L.R.; Qian, K.; Mechta, M.; Nordkap, L.; Mortensen, B.; Appel, E.V.; Jorgensen, N.; Kristiansen, V.B.; et al. Obesity and bariatric surgery drive epigenetic variation of spermatozoa in humans. Cell Metab. 2016, 23, 369–378. [Google Scholar] [CrossRef]
- Kwon, C.; Tak, H.; Rho, M.; Chang, H.R.; Kim, Y.H.; Kim, K.T.; Balch, C.; Lee, E.K.; Nam, S. Detection of PIWI and piRNAs in the mitochondria of mammalian cancer cells. Biochem. Biophys. Res. Commun. 2014, 446, 218–223. [Google Scholar] [CrossRef] [PubMed]
- Rackham, O.; Shearwood, A.-M.J.; Mercer, T.R.; Davies, S.M.K.; Mattick, J.S.; Filipovska, A. Long noncoding RNAs are generated from the mitochondrial genome and regulated by nuclear-encoded proteins. RNA 2011, 17, 2085–2093. [Google Scholar] [CrossRef] [PubMed]
- Zhao, Y.; Liu, S.; Zhou, L.; Li, X.; Meng, Y.; Li, Y.; Li, L.; Jiao, B.; Bai, L.; Yu, Y.; et al. Aberrant shuttling of long noncoding RNAs during the mitochondria-nuclear crosstalk in hepatocellular carcinoma cells. Am. J. Cancer Res. 2019, 9, 999–1008. [Google Scholar]
- Saikia, M.; Jobava, R.; Parisien, M.; Putnam, A.; Krokowski, D.; Gao, X.-H.; Guan, B.-J.; Yuan, Y.; Jankowsky, E.; Feng, Z.; et al. Angiogenin-cleaved tRNA halves interact with cytochrome C, protecting cells from apoptosis during osmotic stress. Mol. Cell. Biol. 2014, 34, 2450. [Google Scholar] [CrossRef]
- Emara, M.M.; Ivanov, P.; Hickman, T.; Dawra, N.; Tisdale, S.; Kedersha, N.; Hu, G.-F.; Anderson, P. Angiogenin-induced tRNA-derived stress-induced RNAs promote stress-induced stress granule assembly. J. Biol. Chem. 2010, 285, 10959–10968. [Google Scholar] [CrossRef] [PubMed]
- Ivanov, P.; Emara, M.M.; Villen, J.; Gygi, S.P.; Anderson, P. Angiogenin-induced tRNA fragments inhibit translation initiation. Mol. Cell 2011, 43, 613–623. [Google Scholar] [CrossRef]
- Vidaurre, S.; Fitzpatrick, C.; Burzio, V.A.; Briones, M.; Villota, C.; Villegas, J.; Echenique, J.; Oliveira-Cruz, L.; Araya, M.; Borgna, V.; et al. Down-regulation of the antisense mitochondrial non-coding RNAs (ncRNAs) is a unique vulnerability of cancer cells and a potential target for cancer therapy. J. Biol. Chem. 2014, 289, 27182–27198. [Google Scholar] [CrossRef]
- Burzio, V.A.; Villota, C.; Villegas, J.; Landerer, E.; Boccardo, E.; Villa, L.L.; Martínez, R.; Lopez, C.; Gaete, F.; Toro, V.; et al. Expression of a family of noncoding mitochondrial RNAs distinguishes normal from cancer cells. Proc. Natl. Acad. Sci. USA 2009, 106, 9430–9434. [Google Scholar] [CrossRef]
- Rackham, O.; Busch, J.D.; Matic, S.; Siira, S.J.; Kuznetsova, I.; Atanassov, I.; Ermer, J.A.; Shearwood, A.-M.J.; Richman, T.R.; Stewart, J.B.; et al. Hierarchical RNA processing is required for mitochondrial ribosome assembly. Cell Rep. 2016, 16, 1874–1890. [Google Scholar] [CrossRef] [PubMed]
- Siira, S.J.; Rossetti, G.; Richman, T.R.; Perks, K.; Ermer, J.A.; Kuznetsova, I.; Hughes, L.; Shearwood, A.-M.J.; Viola, H.M.; Hool, L.C.; et al. Concerted regulation of mitochondrial and nuclear non-coding RNAs by a dual-targeted RNase Z. EMBO Rep. 2018, 19, e46198. [Google Scholar] [CrossRef]
- Kim, S.J.; Xiao, J.; Wan, J.; Cohen, P.; Yen, K. Mitochondrially derived peptides as novel regulators of metabolism. J. Physiol. 2017, 595, 6613–6621. [Google Scholar] [CrossRef] [PubMed]
- Smalheiser, N.R.; Lugli, G.; Thimmapuram, J.; Cook, E.H.; Larson, J. Mitochondrial small RNAs that are up-regulated in hippocampus during olfactory discrimination training in mice. Mitochondrion 2011, 11, 994–995. [Google Scholar] [CrossRef]
- Telonis, A.G.; Loher, P.; Magee, R.; Pliatsika, V.; Londin, E.; Kirino, Y.; Rigoutsos, I. tRNA fragments show intertwining with mRNAs of specific repeat content and have links to disparities. Cancer Res. 2019, 72, 3034–3049. [Google Scholar] [CrossRef]
- Magee, R.G.; Telonis, A.G.; Loher, P.; Londin, E.; Rigoutsos, I. Profiles of miRNA isoforms and tRNA fragments in prostate cancer. Sci. Rep. 2018, 8, 5314. [Google Scholar] [CrossRef]
- Pozzi, A.; Dowling, D.K. The genomic origins of small mitochondrial RNAs: Are they transcribed by the mitochondrial DNA or by mitochondrial pseudogenes within the nucleus (NUMTs)? Genome Biol. Evol. 2019, 11, 1883–1896. [Google Scholar] [CrossRef]
- The Pandas Development Team. Pandas-Dev/Pandas: Pandas. 2020. Zenodo. Available online: https://zenodo.org/record/7549438#.Y_MuSXbMJPY (accessed on 26 August 2022).
- Hunter, J.D. Matplotlib: A 2D graphics environment. Comput. Sci. Eng. 2007, 9, 90–95. [Google Scholar] [CrossRef]
- Langmead, B. Aligning short sequencing reads with Bowtie. Curr. Protoc. Bioinform. 2010, 32, 11.7.1–11.7.14. [Google Scholar] [CrossRef]
- Li, H.; Handsaker, B.; Wysoker, A.; Fennell, T.; Ruan, J.; Homer, N.; Marth, G.; Abecasis, G.; Durbin, R. The sequence alignment/map format and SAMtools. Bioinformatics 2009, 25, 2078–2079. [Google Scholar] [CrossRef]
- Zerbino, D.R.; Achuthan, P.; Akanni, W.; Amode, M.R.; Barrell, D.; Bhai, J.; Billis, K.; Cummins, C.; Gall, A.; Girón, C.G.; et al. Ensembl 2018. Nucleic Acids Res. 2018, 46, D754–D761. [Google Scholar] [CrossRef]
- Karimi, K.; Fortriede, J.D.; Lotay, V.S.; Burns, K.A.; Wang, D.Z.; Fisher, M.E.; Pells, T.J.; James-Zorn, C.; Wang, Y.; Ponferrada, V.G.; et al. Xenbase: A genomic, epigenomic and transcriptomic model organism database. Nucleic Acids Res. 2018, 46, D861–D868. [Google Scholar] [CrossRef]
- Lee, Y.S.; Shibata, Y.; Malhotra, A.; Dutta, A. A novel class of small RNAs: tRNA-derived RNA fragments (tRFs). Genes Dev. 2009, 23, 2639–2649. [Google Scholar] [CrossRef]
- Mohideen, A.; Johansen, S.D.; Babiak, I. High-throughput identification of adapters in single-read sequencing data. Biomolecules 2020, 10, 878. [Google Scholar] [CrossRef] [PubMed]
- Division of Biology, Faculty of Science, University of Zagreb, Croatia. Characterization of Long Non-Coding RNAs Expressed during Oocyte-to-Embryo Transition in Mice. Available online: https://www.ebi.ac.uk/ena/browser/view/PRJEB14222?show=reads (accessed on 21 October 2022).
- Leinonen, R.; Sugawara, H.; Shumway, M.; International Nucleotide Sequence Database Collaboration. The sequence read archive. Nucleic Acids Res. 2011, 39, D19–D21. [Google Scholar] [CrossRef] [PubMed]
- Love, M.I.; Huber, W.; Anders, S. Moderated estimation of fold change and dispersion for RNA-seq data with DESeq2. Genome Biol. 2014, 15, 550. [Google Scholar] [CrossRef]
- Magoc, T.; Salzberg, S.L. FLASH: Fast length adjustment of short reads to improve genome assemblies. Bioinformatics 2011, 27, 2957–2963. [Google Scholar] [CrossRef]


| Comparison | Total DE | tRNA | rRNA | Non-Coding | Protein-Coding | Log2foldchange | |||||||||||
|---|---|---|---|---|---|---|---|---|---|---|---|---|---|---|---|---|---|
| Total | ↑ | ↓ | Total | ↑ | ↓ | Total | ↑ | ↓ | Total | ↑ | ↓ | Total | ↑ | ↓ | Min | Max | |
| HC cancer vs. uninfected | 423 | 224 | 199 | 348 | 216 | 132 | 53 | 6 | 47 | 11 | 2 | 9 | 11 | 0 | 11 | −25.88 | 7.05 |
| HB cancer vs. uninfected | 369 | 206 | 163 | 304 | 154 | 150 | 55 | 48 | 7 | 4 | 0 | 4 | 6 | 4 | 2 | −25.1 | 8.6 |
| HB cancer vs. non-cancer | 369 | 208 | 161 | 265 | 143 | 122 | 82 | 51 | 31 | 9 | 6 | 3 | 13 | 8 | 5 | −8.15 | 7.5 |
| HC cancer vs. non-cancer | 437 | 255 | 182 | 354 | 220 | 134 | 56 | 22 | 34 | 13 | 11 | 2 | 14 | 2 | 12 | −12.12 | 10.15 |
| Species | ncRNA | Gene | Sequence Subtype | Strand (H or L) | Orientation (Sense or Anti-Sense) | Sequence Start Position | Sequence Length | Substitutions | Specific-ID | |
|---|---|---|---|---|---|---|---|---|---|---|
| mtsRNA | hsa | mt-sRNA | Glu | tRH-3 | L | sense | 14,676 | 34 | NIL | hsa|mt-sRNA|Glu|tRH-3|L|14676|34 |
| dre | mt-sRNA | Glu | tRH-3 | L | anti-sense | 14,675 | 32 | NIL | dre|mt-sRNA|Glu|tRH-3|L|as14675|32 | |
| mmu | mt-sRNA | Arg | tRF-5 | H | 10,406 | 25 | 24C0 | mmu|mt-sRNA|Arg|tRF-5|H|10406|25 | ||
| mtlncRNA | rno | mt-lncRNA | ND1 | L | 3310 | 201 | rno|mt-lncRNA|ND1|L|3310|201 | |||
| hsa | mt-lncRNA | COI | H | 6015 | 150 | hsa|mt-lncRNA|COI|H|6015|150 | ||||
| xen | mt-lncRNA | ATP6 | L | 8550 | 85 | Xen|mt-lncRNA|ATP6|L|8550|85 |
Disclaimer/Publisher’s Note: The statements, opinions and data contained in all publications are solely those of the individual author(s) and contributor(s) and not of MDPI and/or the editor(s). MDPI and/or the editor(s) disclaim responsibility for any injury to people or property resulting from any ideas, methods, instructions or products referred to in the content. |
© 2023 by the authors. Licensee MDPI, Basel, Switzerland. This article is an open access article distributed under the terms and conditions of the Creative Commons Attribution (CC BY) license (https://creativecommons.org/licenses/by/4.0/).
Share and Cite
Mohideen, A.M.S.H.; Johansen, S.D.; Babiak, I. mtR_find: A Parallel Processing Tool to Identify and Annotate RNAs Derived from the Mitochondrial Genome. Int. J. Mol. Sci. 2023, 24, 4373. https://doi.org/10.3390/ijms24054373
Mohideen AMSH, Johansen SD, Babiak I. mtR_find: A Parallel Processing Tool to Identify and Annotate RNAs Derived from the Mitochondrial Genome. International Journal of Molecular Sciences. 2023; 24(5):4373. https://doi.org/10.3390/ijms24054373
Chicago/Turabian StyleMohideen, Asan M. S. H., Steinar D. Johansen, and Igor Babiak. 2023. "mtR_find: A Parallel Processing Tool to Identify and Annotate RNAs Derived from the Mitochondrial Genome" International Journal of Molecular Sciences 24, no. 5: 4373. https://doi.org/10.3390/ijms24054373
APA StyleMohideen, A. M. S. H., Johansen, S. D., & Babiak, I. (2023). mtR_find: A Parallel Processing Tool to Identify and Annotate RNAs Derived from the Mitochondrial Genome. International Journal of Molecular Sciences, 24(5), 4373. https://doi.org/10.3390/ijms24054373