
Cost-Effective Next Generation Sequencing-Based STR Typing with Improved Analysis of Minor, Degraded and Inhibitor-Containing DNA Samples
 ,
, 
Abstract
1. Introduction
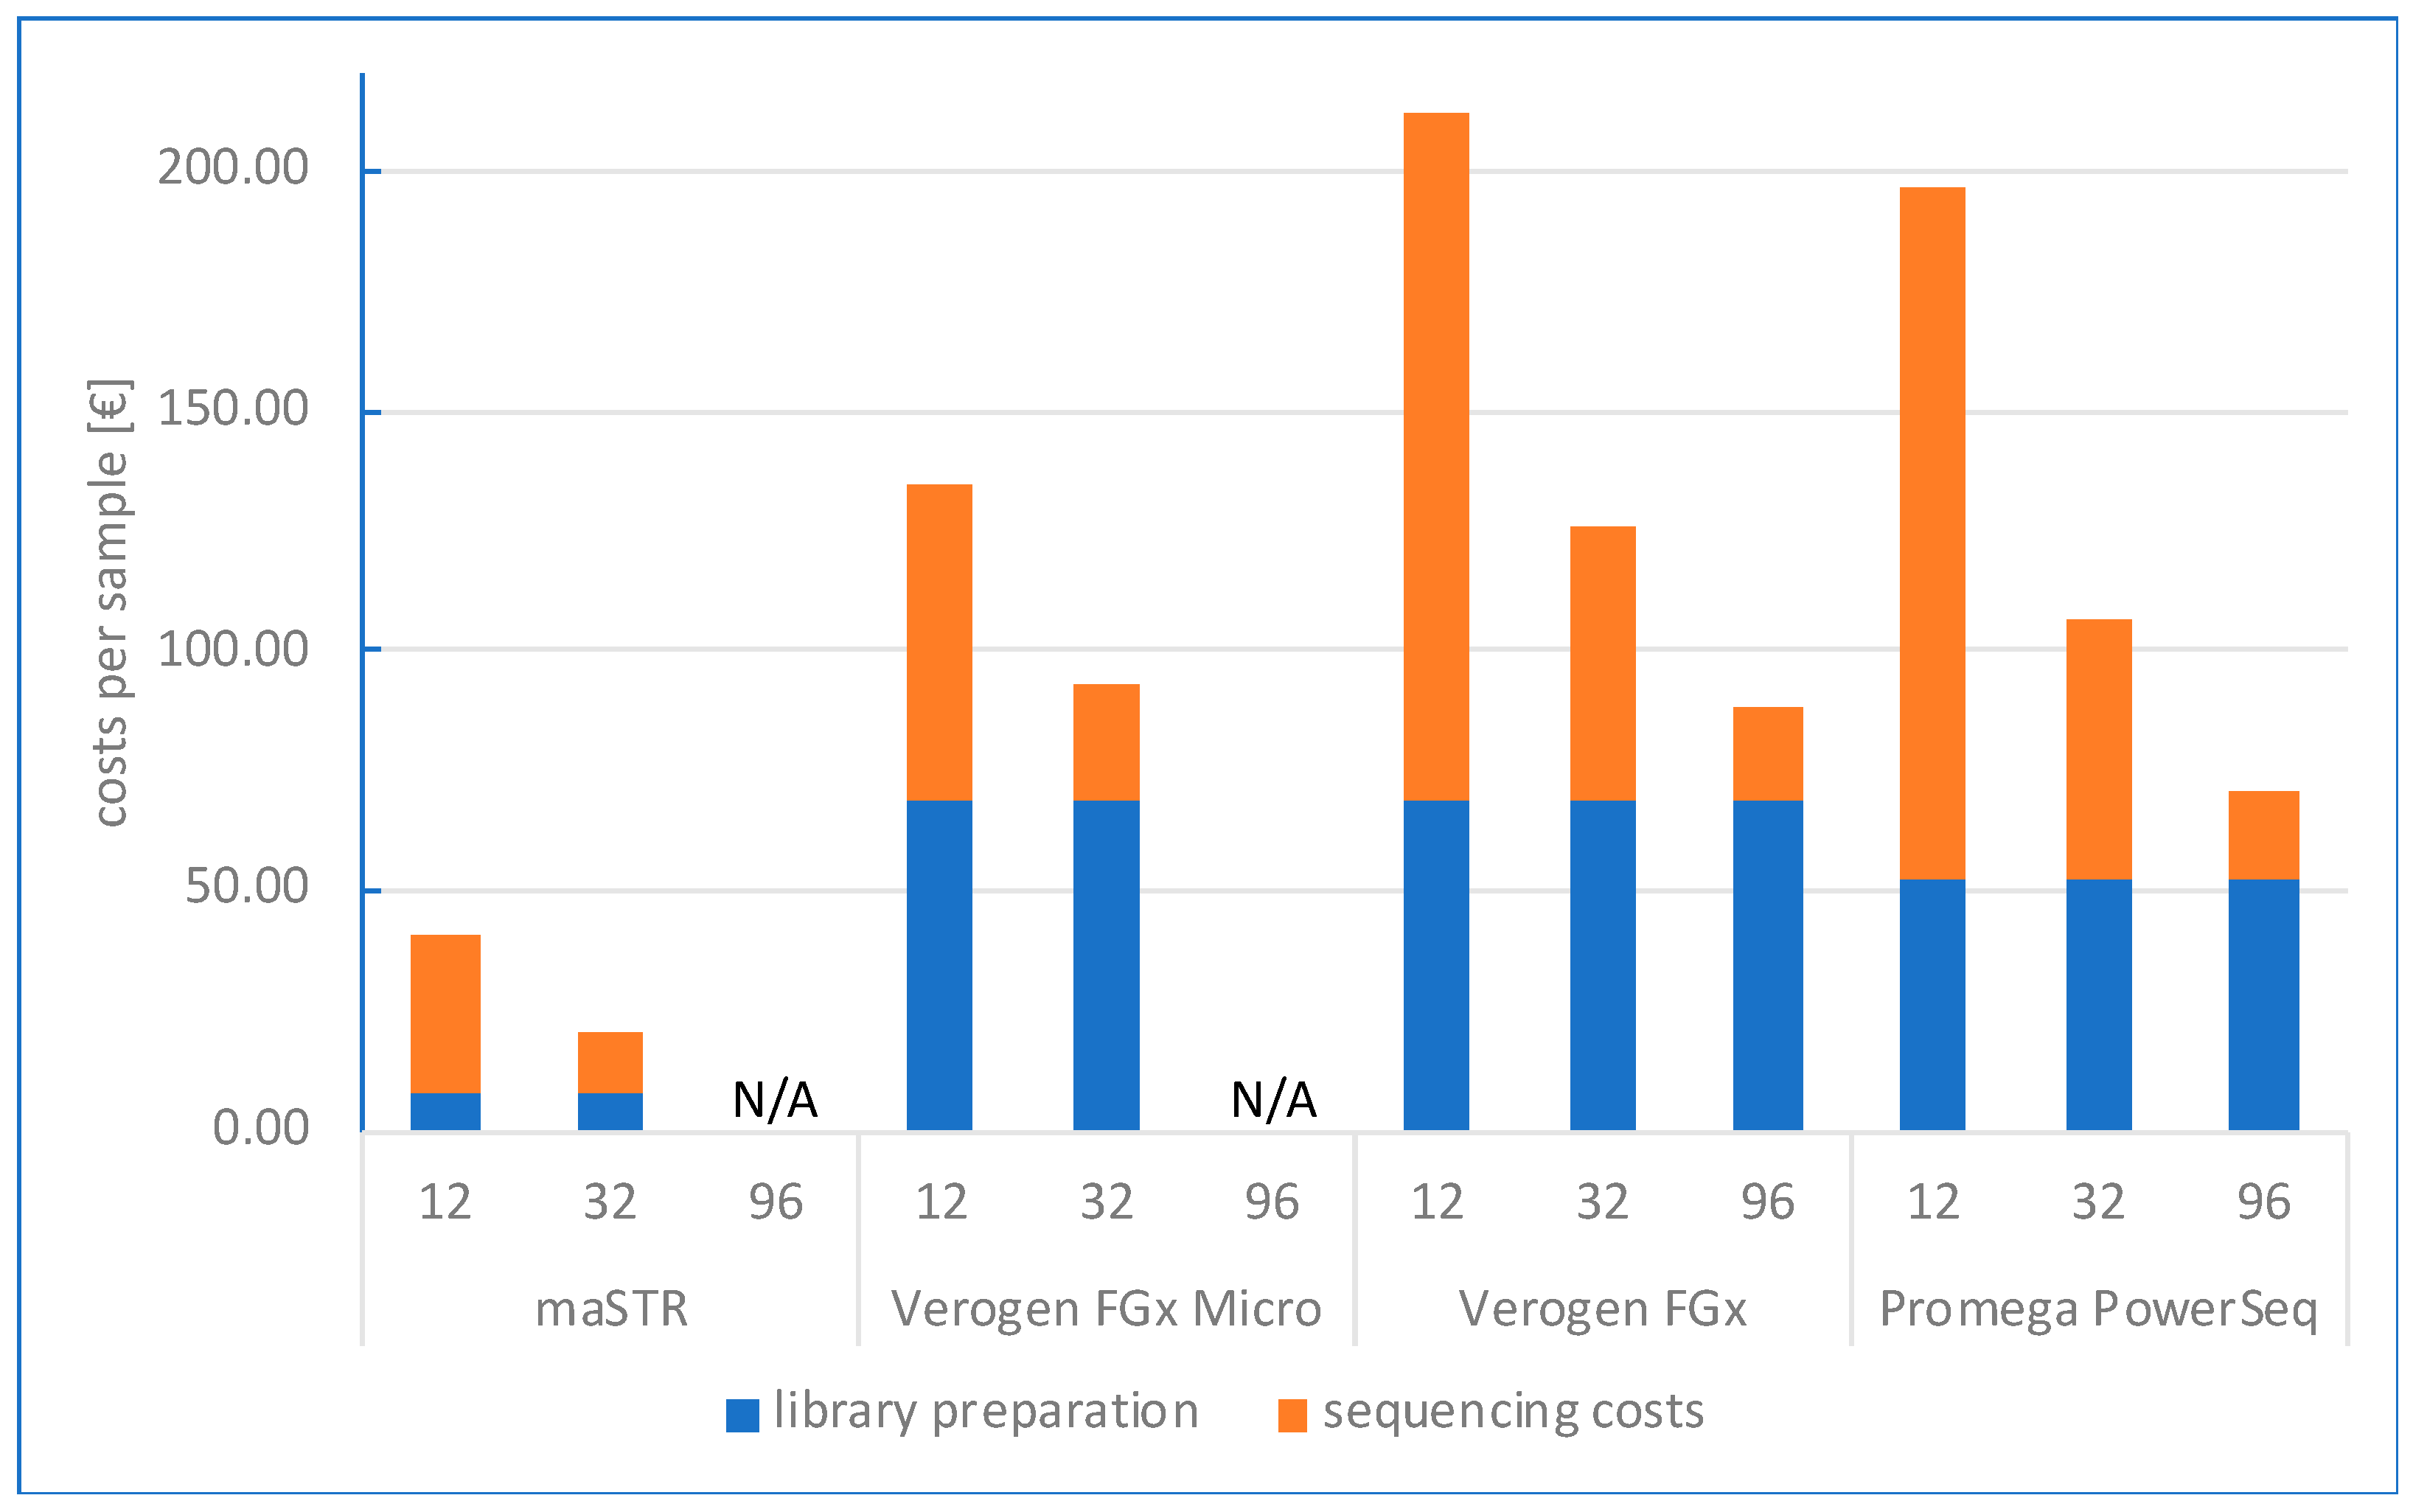
2. Results
2.1. Characteristics of the maSTR Assay
2.2. Study Design
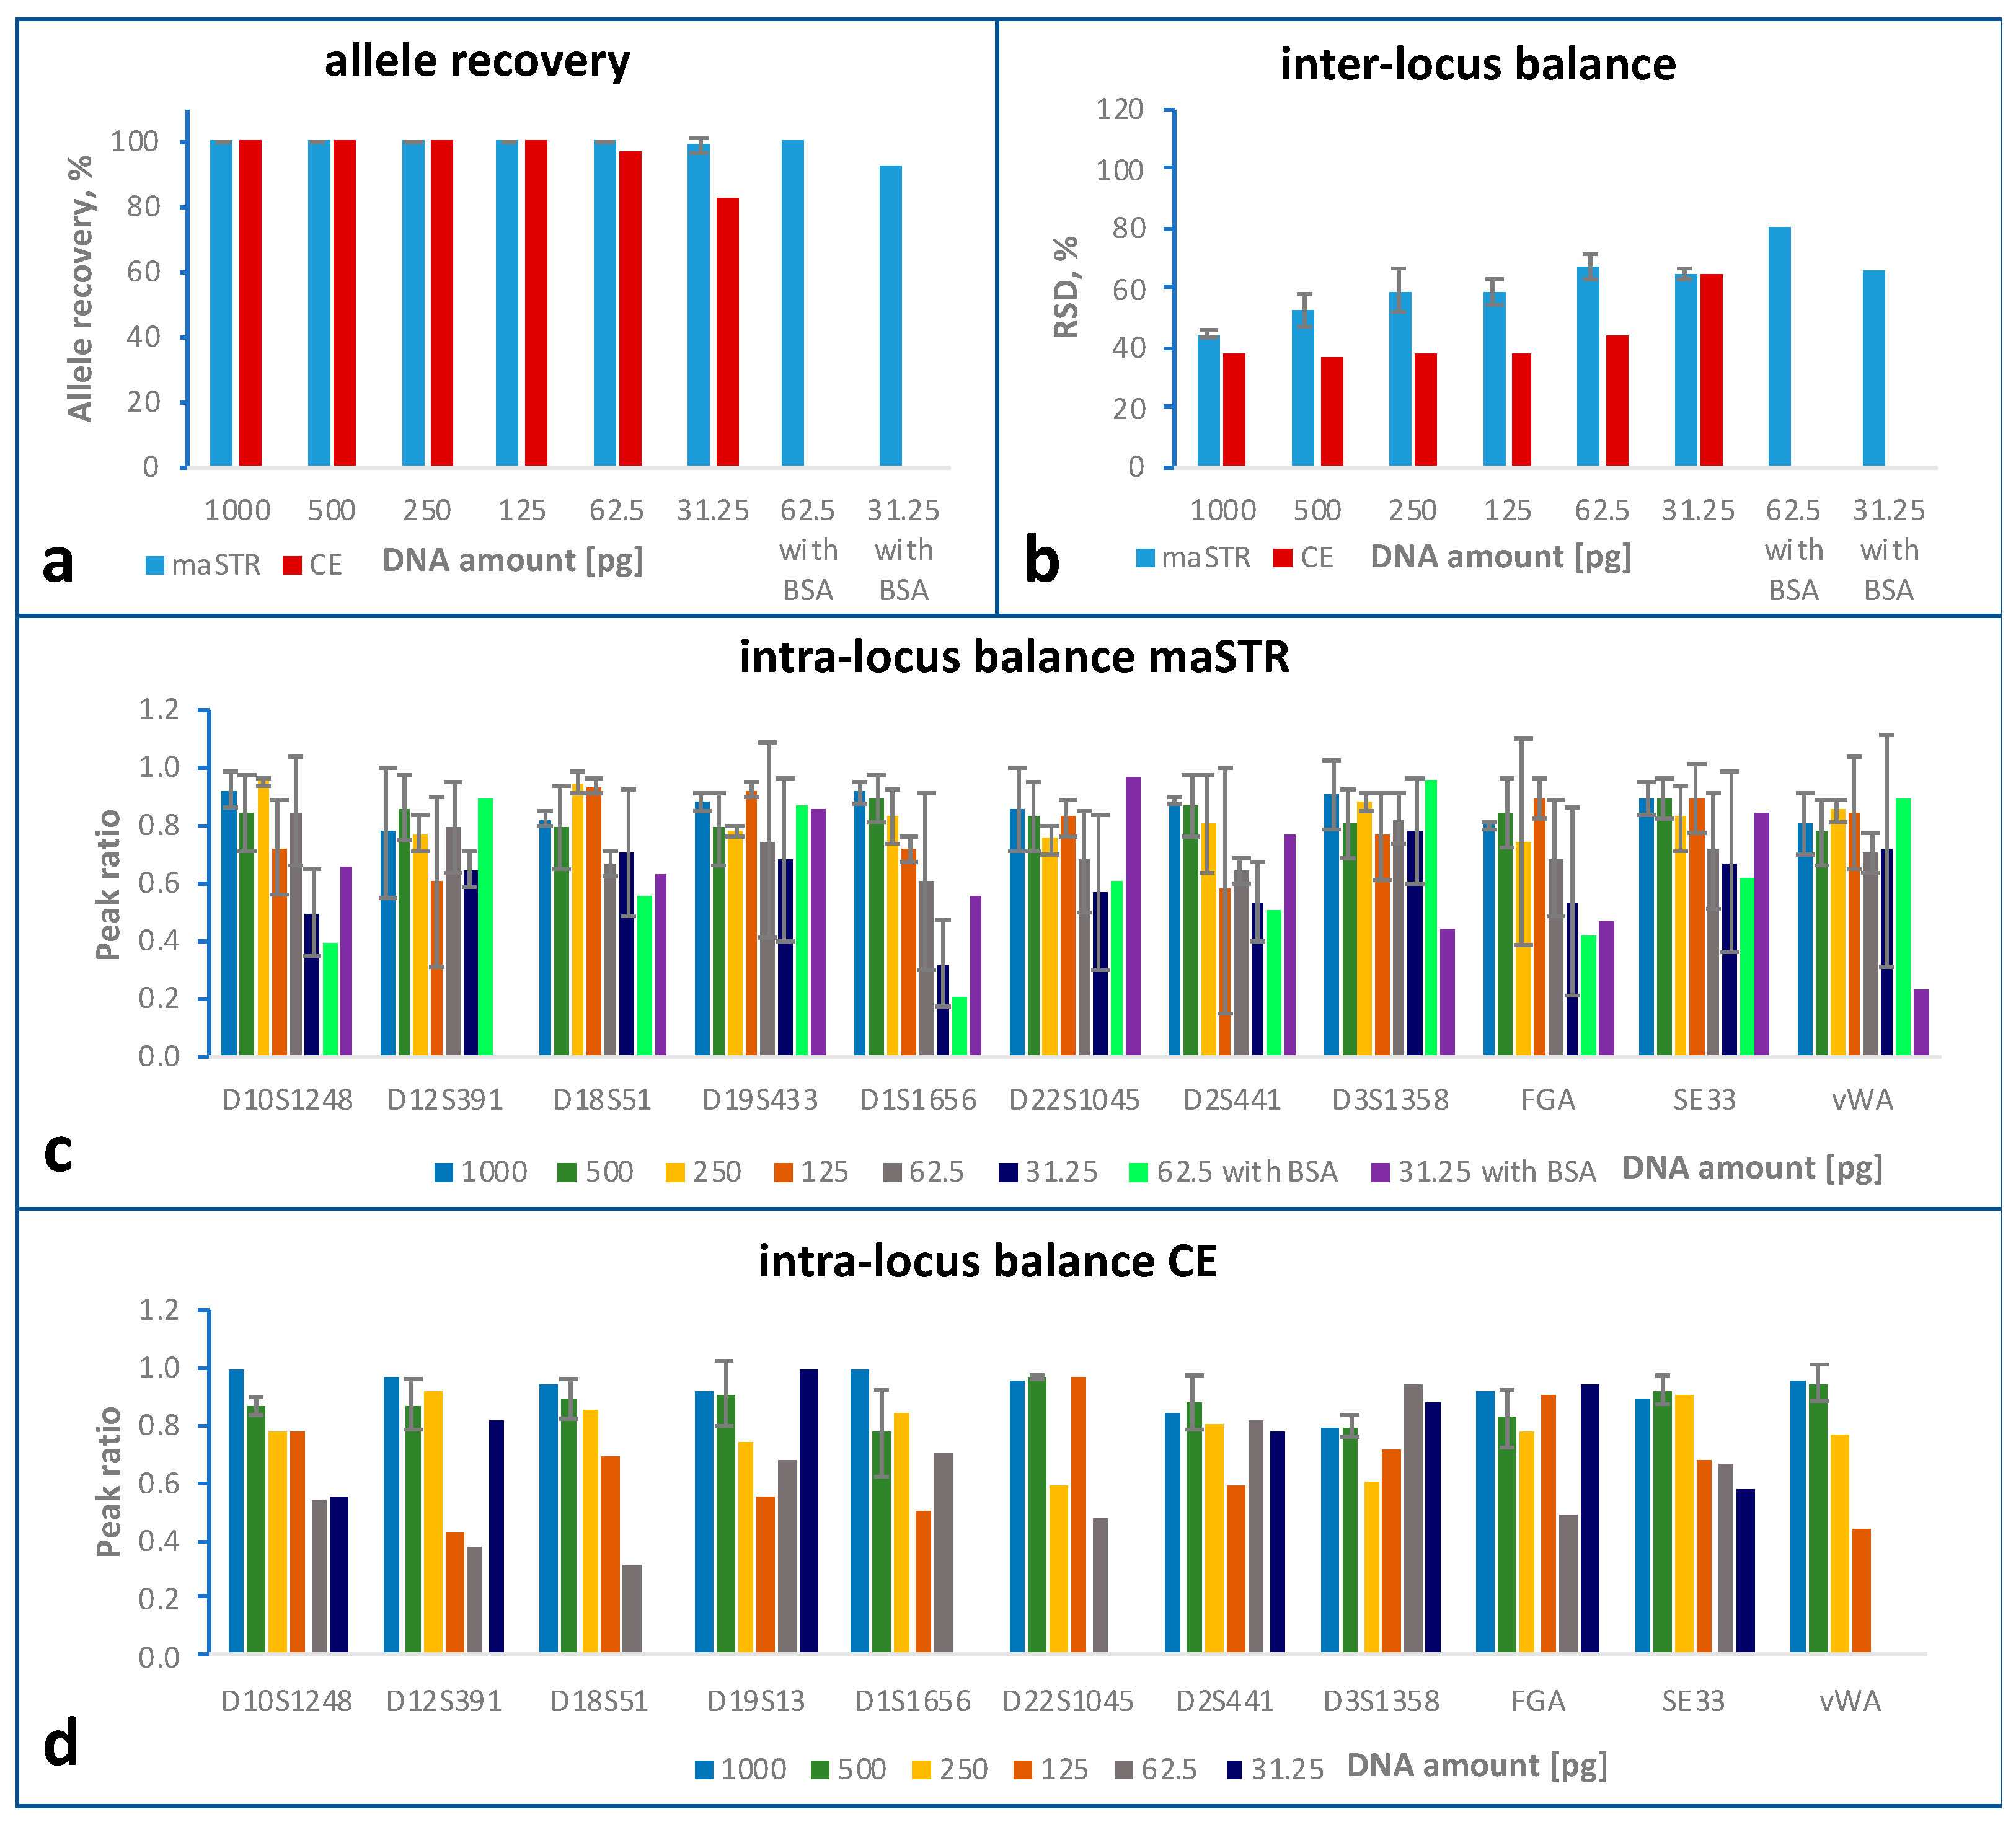
2.3. Sensitivity Study
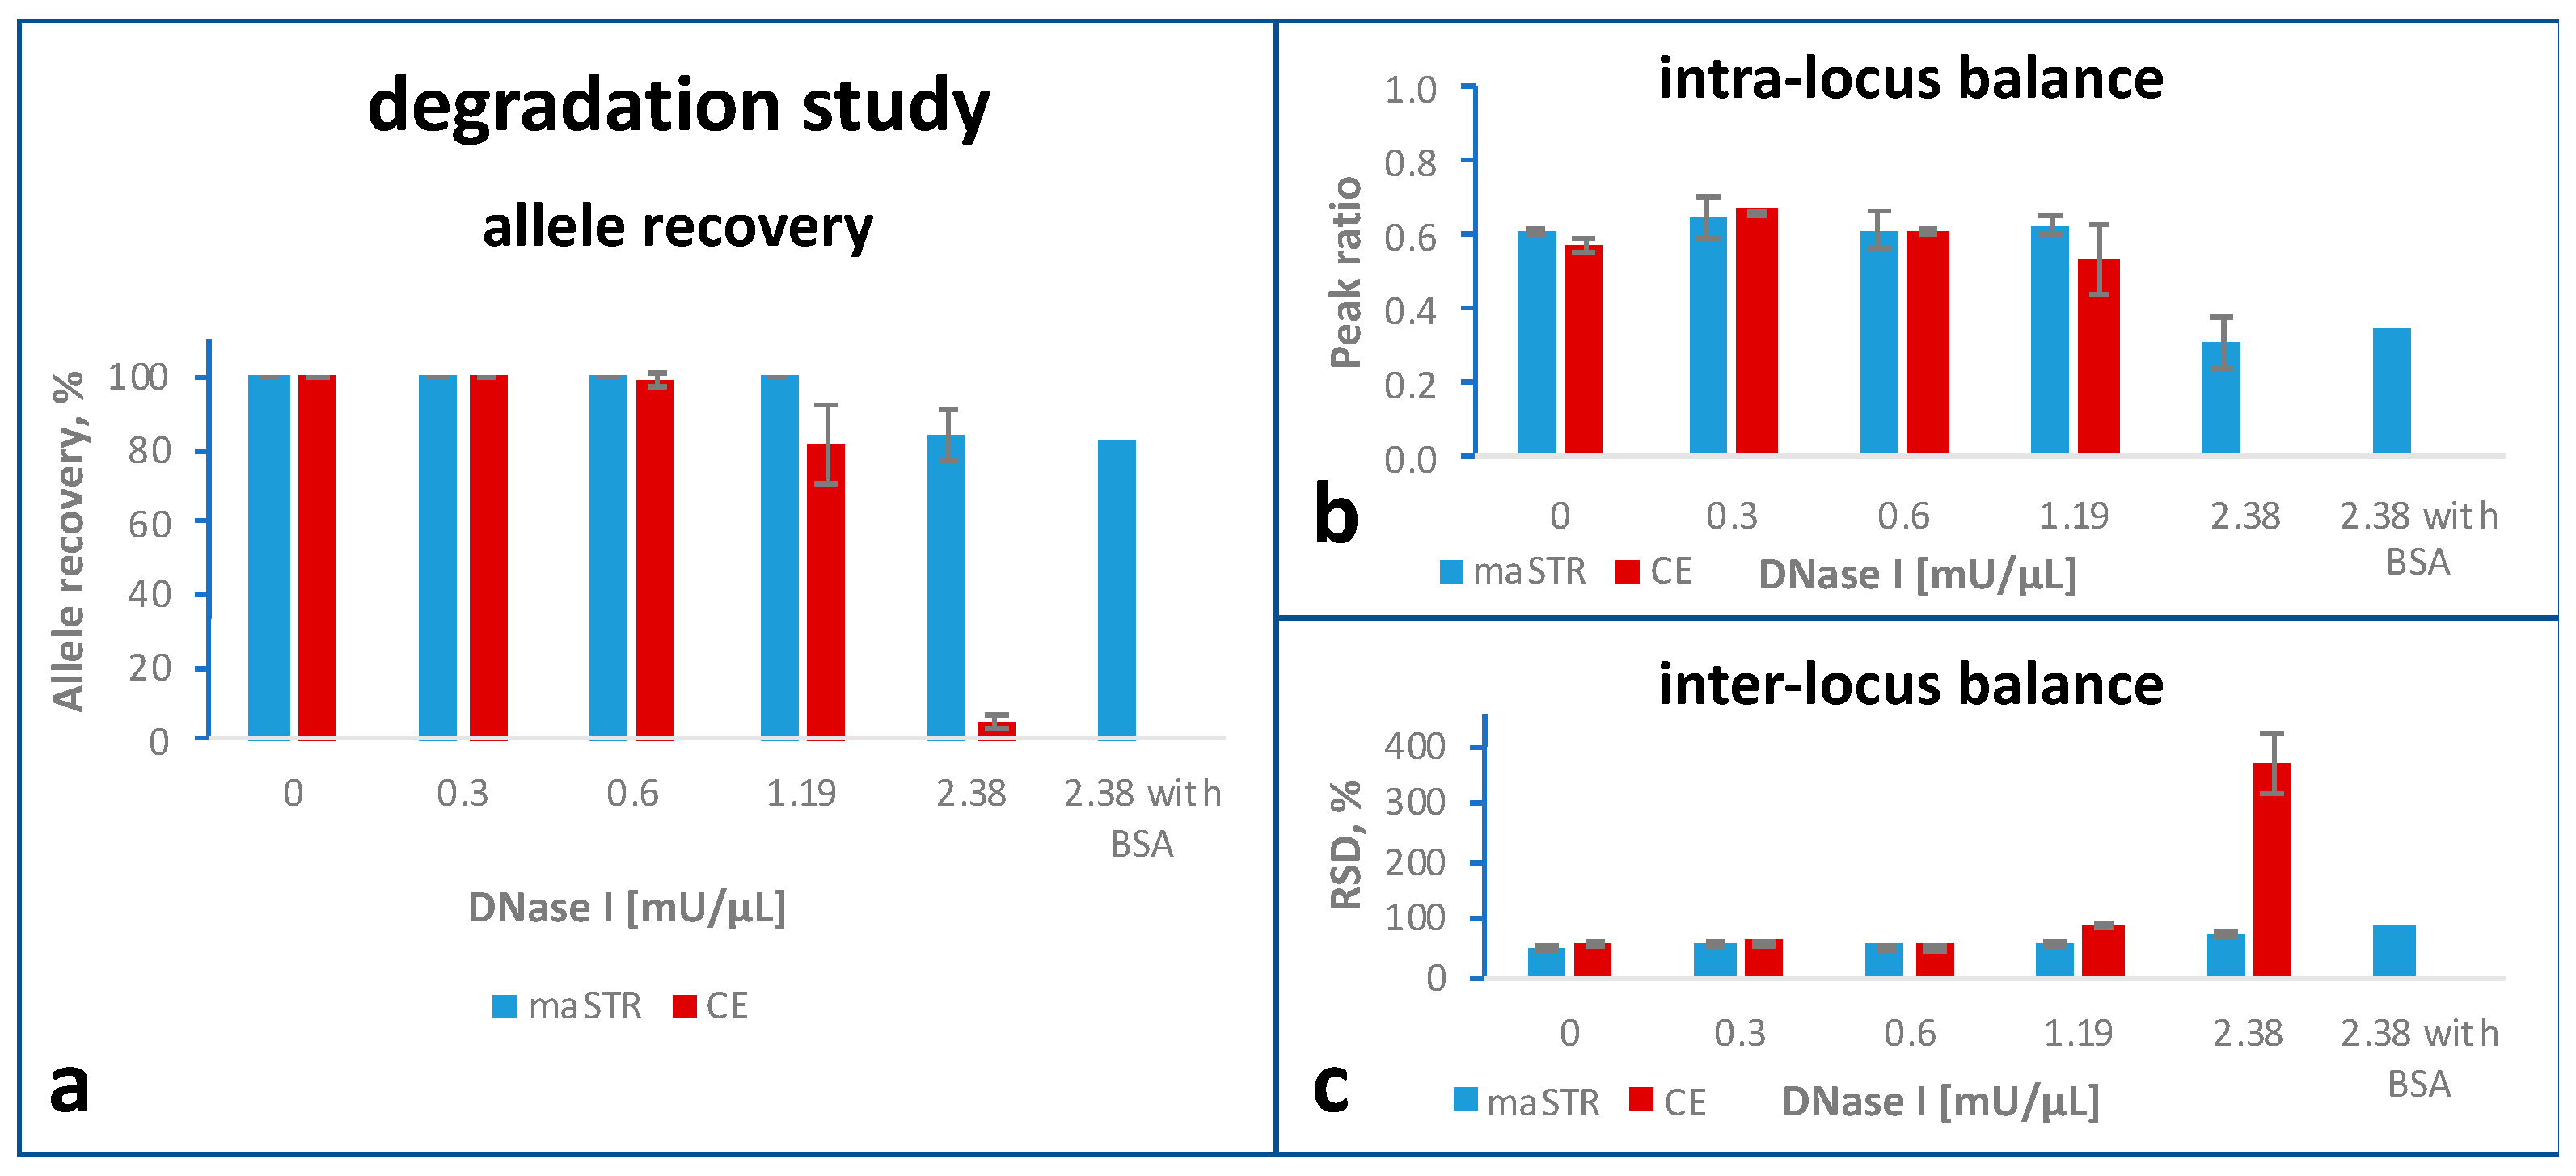
2.4. Degradation Study
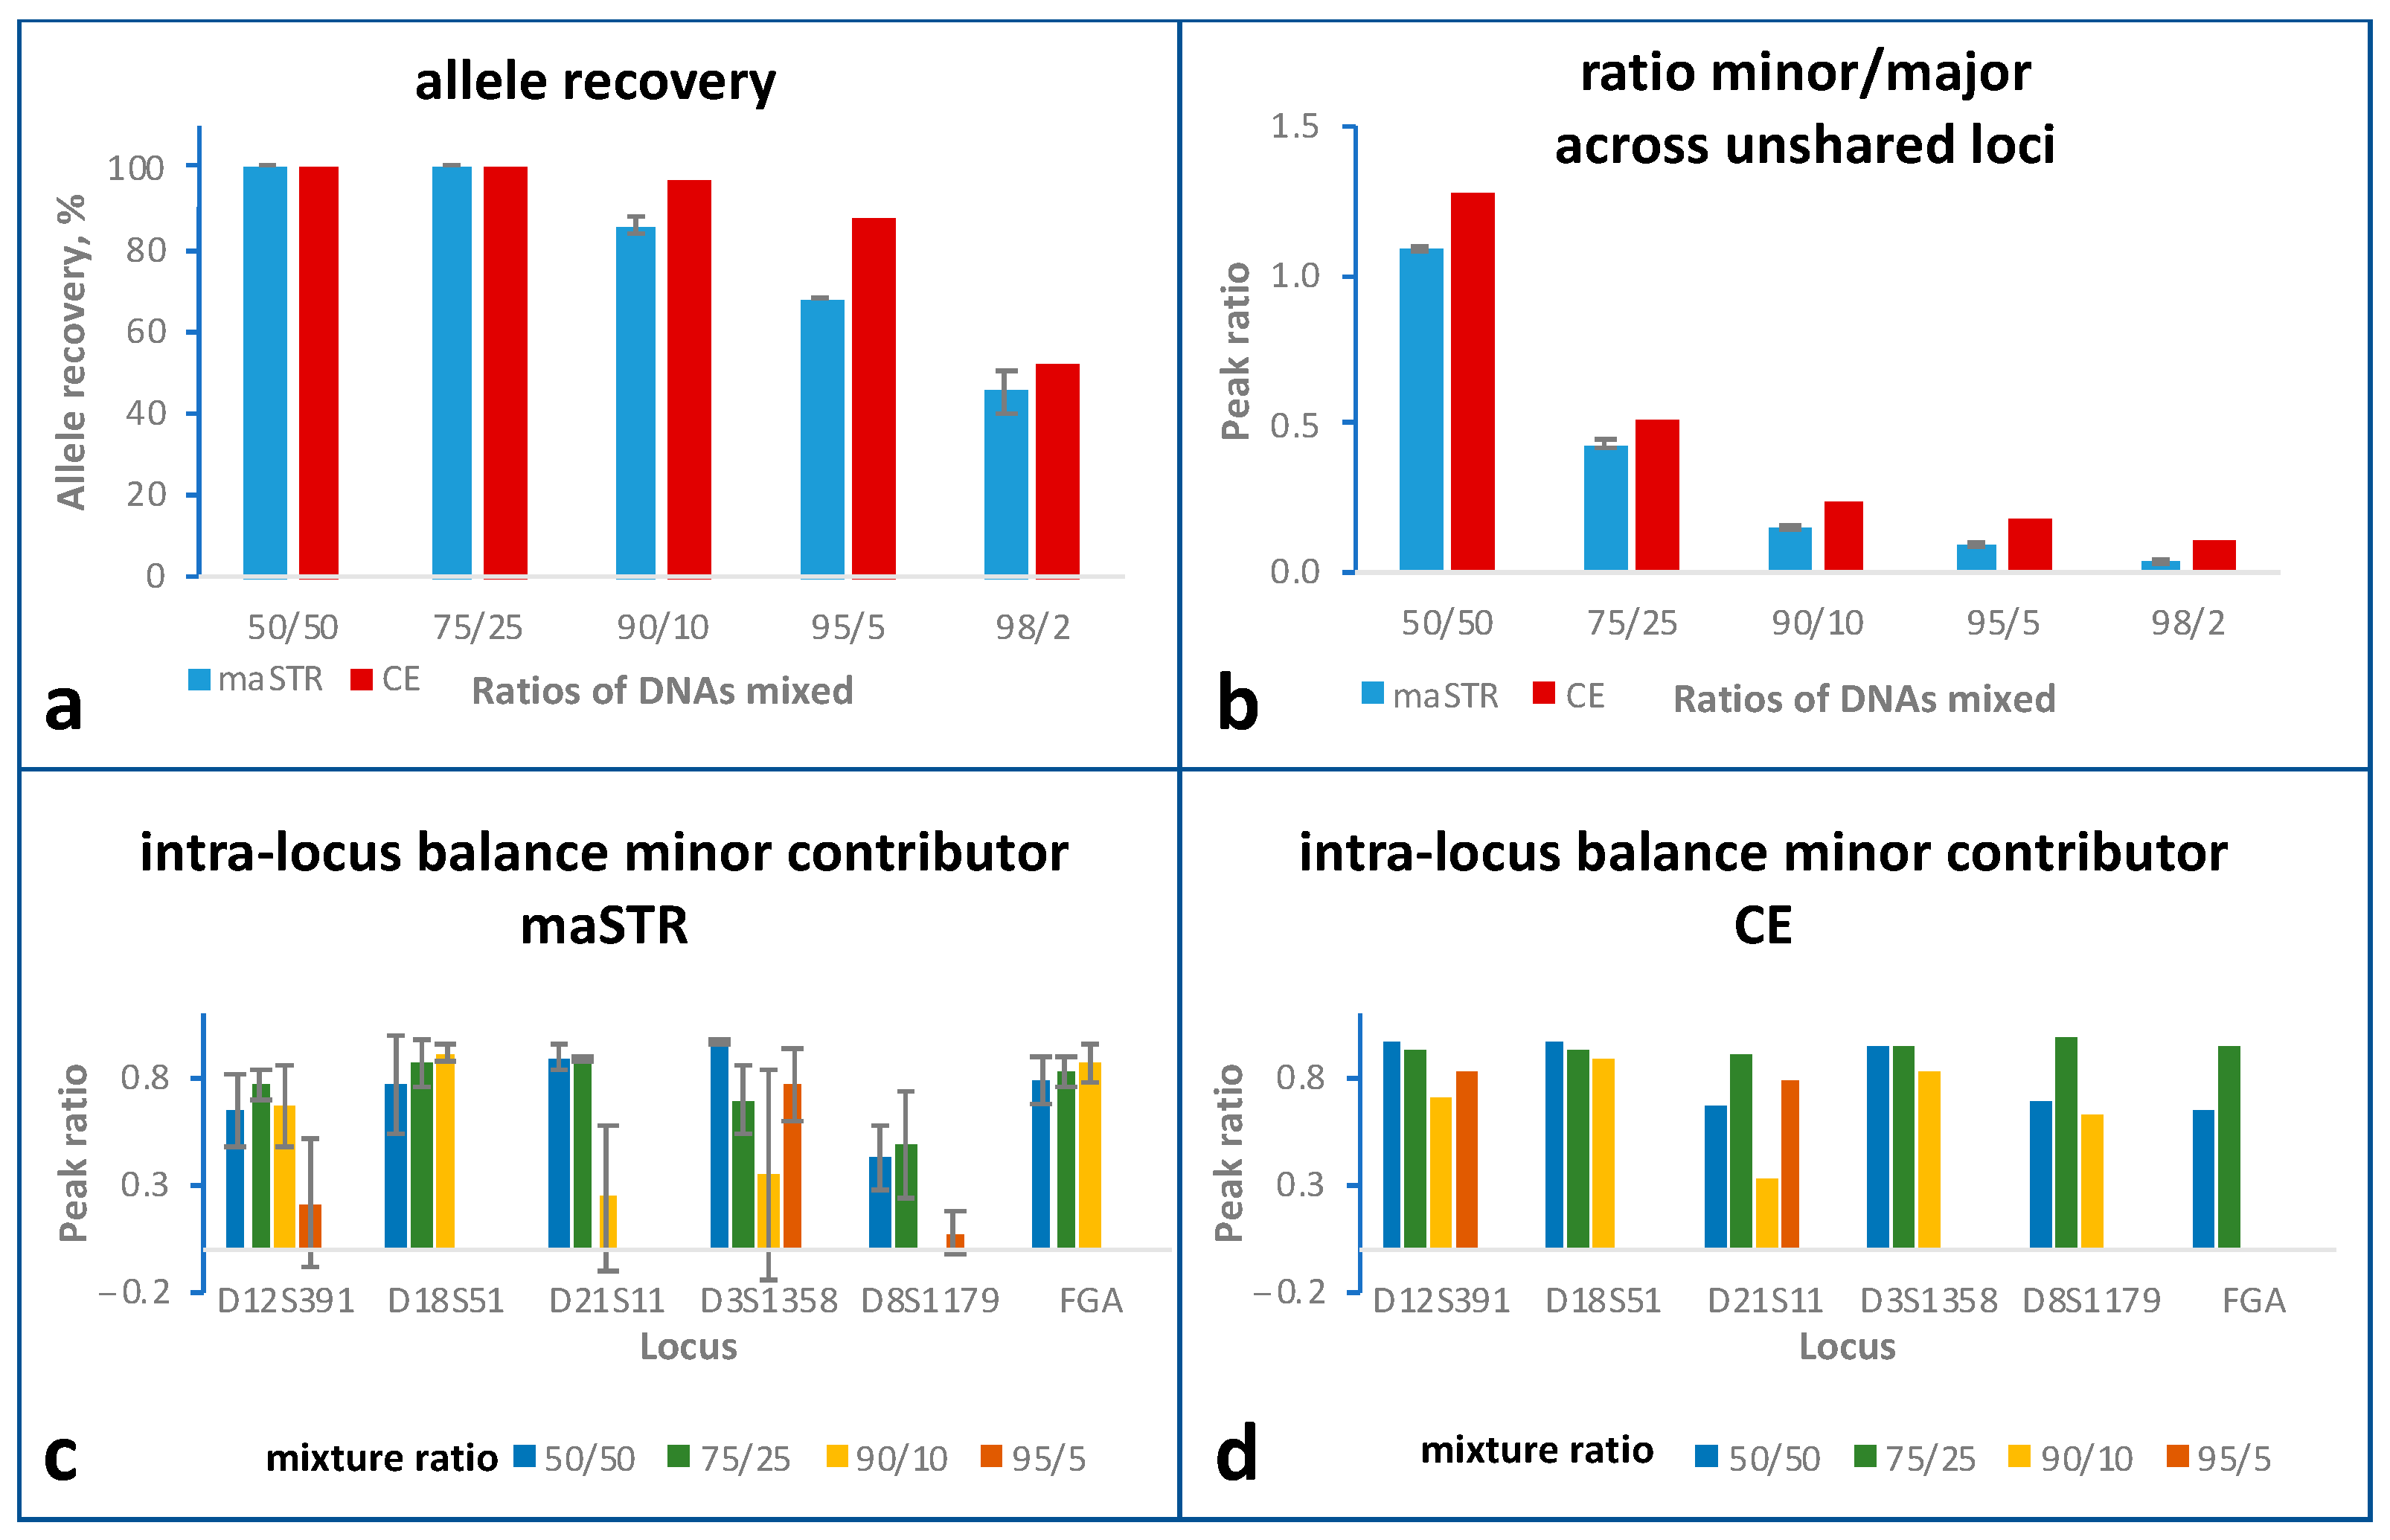
2.5. Mixture Studies
2.6. Inhibitor Studies
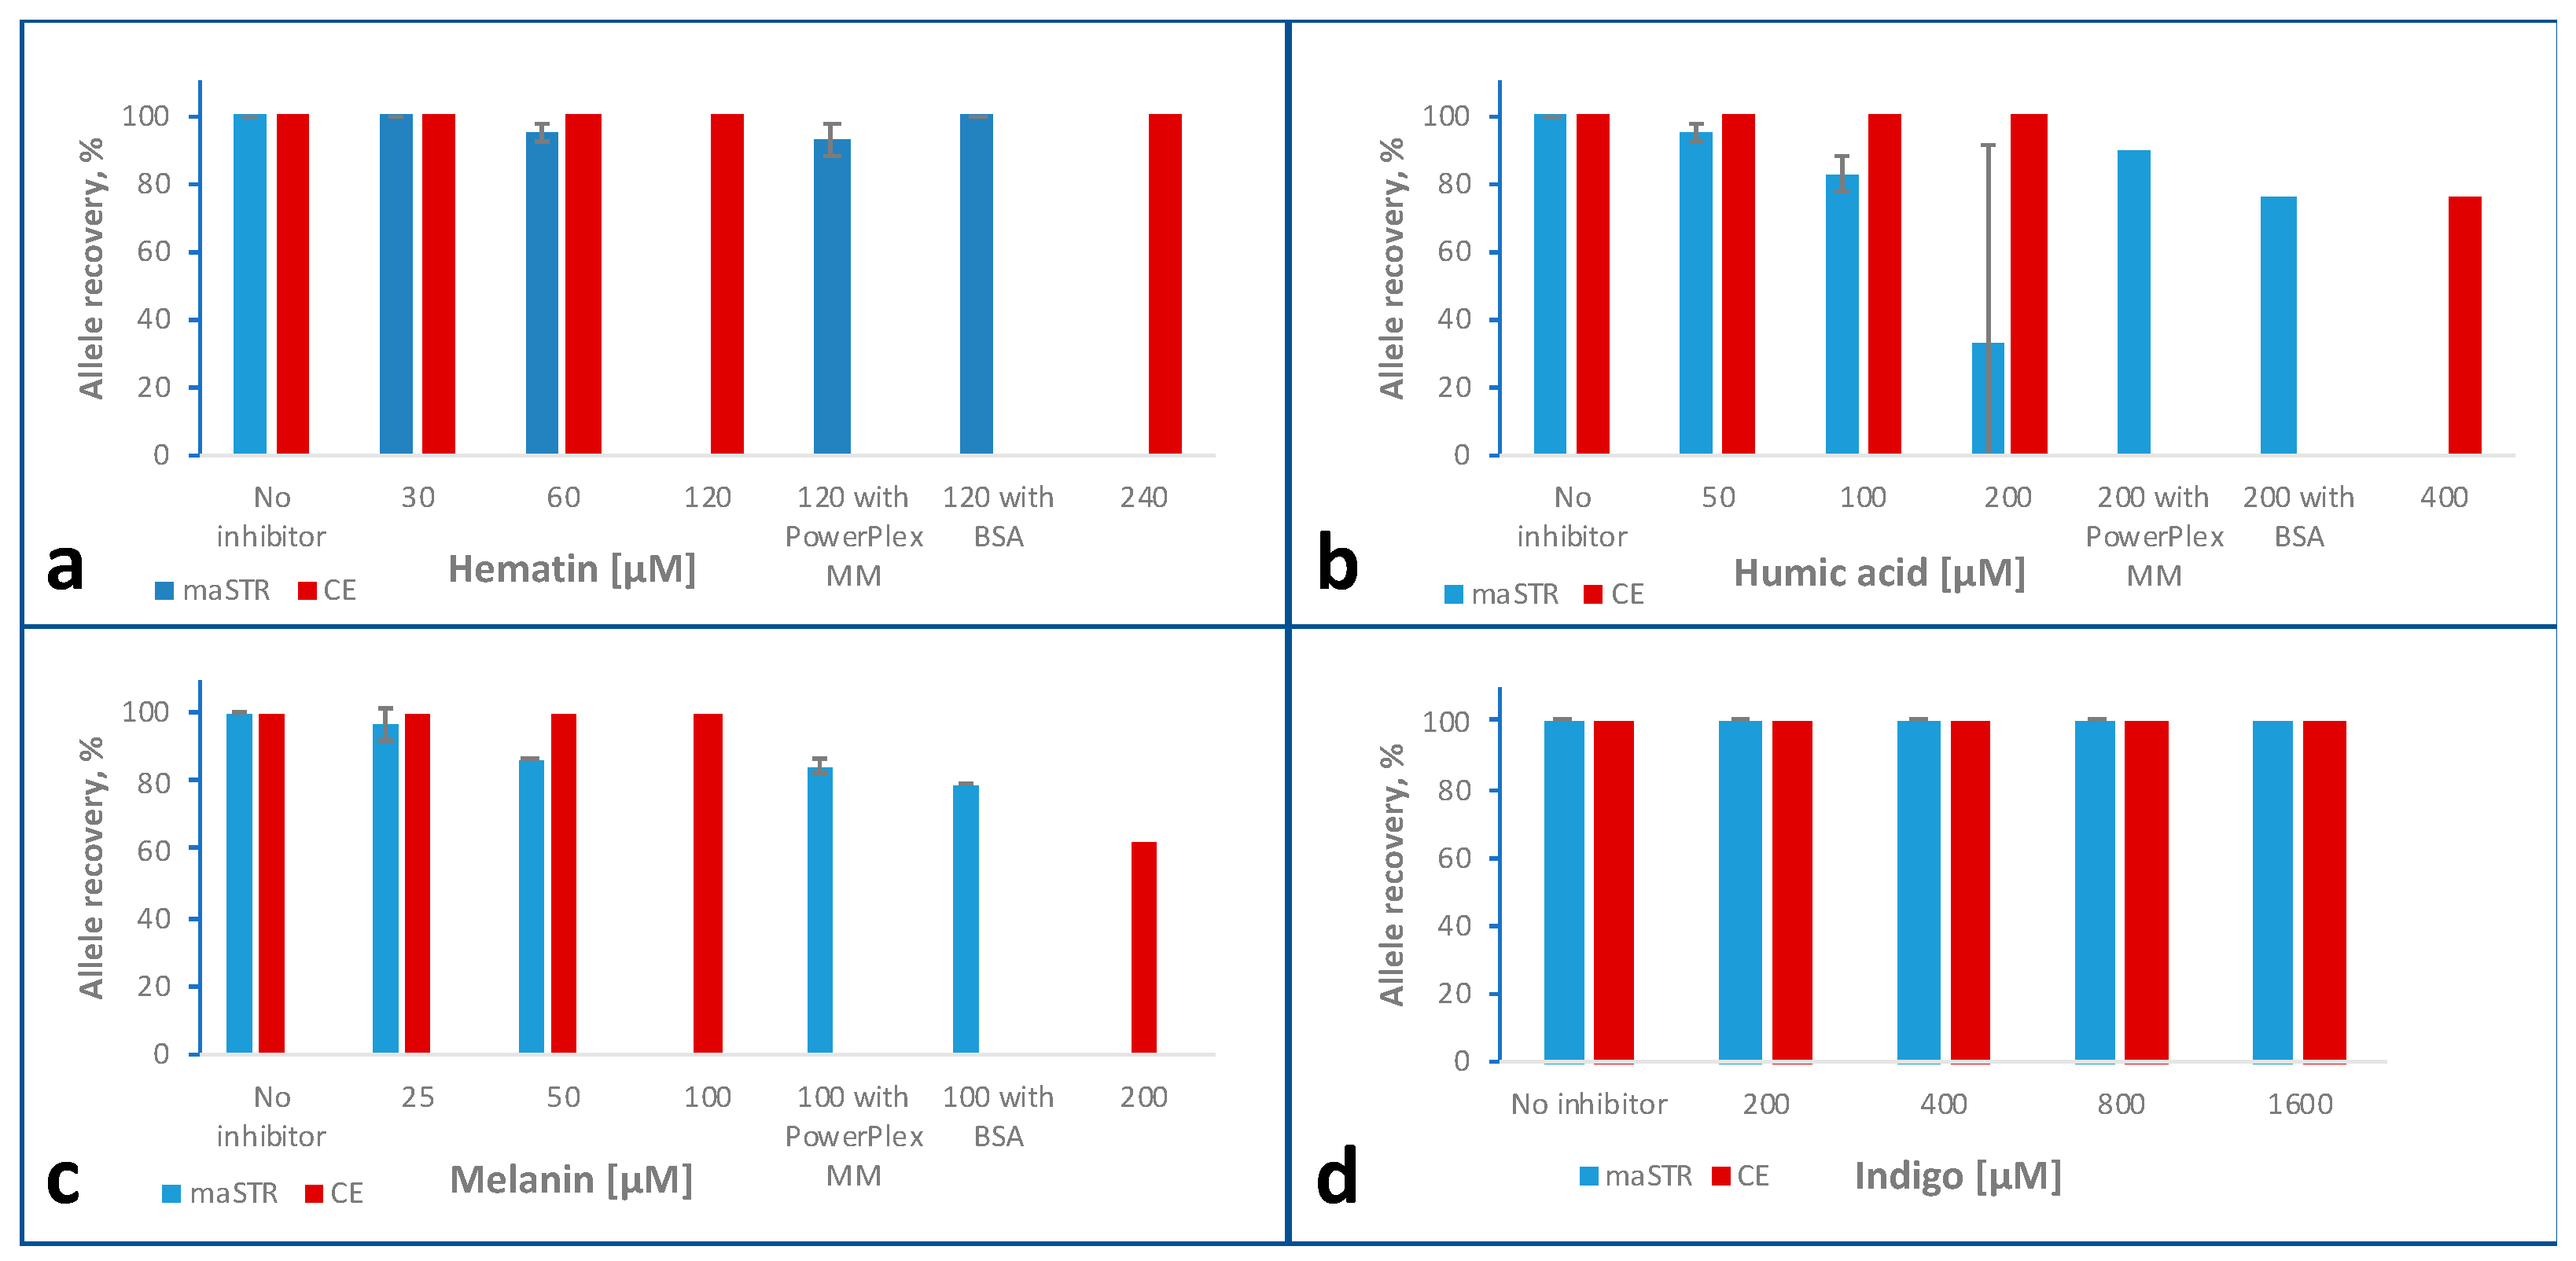
2.6.1. Hematin
2.6.2. Humic Acid
2.6.3. Melanin
2.6.4. Indigo
3. Discussion
4. Materials and Methods
4.1. Sample Preparation for Sensitivity, Mixture, Degradation and Inhibition Studies
4.2. Capillary Electrophoretic STR Analysis
4.3. NGS Library Preparation and Sequencing
4.4. Data Analysis
4.4.1. Bioinformatic Pipeline
4.4.2. Allele Recovery, Intra-Locus Balance and Inter-Locus Balance
Supplementary Materials
Author Contributions
Funding
Institutional Review Board Statement
Informed Consent Statement
Data Availability Statement
Acknowledgments
Conflicts of Interest
References
- Jobling, M.A.; Gill, P. Encoded evidence: DNA in forensic analysis. Nat. Rev. Genet. 2004, 5, 739–751. [Google Scholar] [CrossRef] [PubMed]
- Fregeau, C.J.; Fourney, R.M. DNA typing with fluorescently tagged short tandem repeats: A sensitive and accurate approach to human identification. Biotechniques 1993, 15, 100–119. [Google Scholar] [PubMed]
- Kimpton, C.P.; Gill, P.; Walton, A.; Urquhart, A.; Millican, E.S.; Adams, M. Automated DNA profiling employing multiplex amplification of short tandem repeat loci. PCR Methods Appl. 1993, 3, 13–22. [Google Scholar] [CrossRef] [PubMed]
- Welch, L.A.; Gill, P.; Phillips, C.; Ansell, R.; Morling, N.; Parson, W.; Palo, J.U.; Bastisch, I. European Network of Forensic Science Institutes (ENFSI): Evaluation of new commercial STR multiplexes that include the European Standard Set (ESS) of markers. Forensic Sci. Int. Genet. 2012, 6, 819–826. [Google Scholar] [CrossRef]
- Budowle, B.; Eisenberg, A.J.; van Daal, A. Validity of low copy number typing and applications to forensic science. Croat. Med. J. 2009, 50, 207–217. [Google Scholar] [CrossRef]
- Tucker, V.C.; Hopwood, A.J.; Sprecher, C.J.; McLaren, R.S.; Rabbach, D.R.; Ensenberger, M.G.; Thompson, J.M.; Storts, D.R. Developmental validation of the PowerPlex® ESX 16 and PowerPlex® ESX 17 Systems. Forensic Sci. Int. Genet. 2012, 6, 124–131. [Google Scholar] [CrossRef]
- Ensenberger, M.G.; Lenz, K.A.; Matthies, L.K.; Hadinoto, G.M.; Schienman, J.E.; Przech, A.J.; Morganti, M.W.; Renstrom, D.T.; Baker, V.M.; Gawrys, K.M.; et al. Developmental validation of the PowerPlex® Fusion 6C System. Forensic Sci. Int. Genet. 2016, 21, 134–144. [Google Scholar] [CrossRef]
- Kraemer, M.; Prochnow, A.; Bussmann, M.; Scherer, M.; Peist, R.; Steffen, C. Developmental validation of QIAGEN Investigator® 24plex QS Kit and Investigator® 24plex GO! Kit: Two 6-dye multiplex assays for the extended CODIS core loci. Forensic Sci. Int. Genet. 2017, 29, 9–20. [Google Scholar] [CrossRef]
- Ludeman, M.J.; Zhong, C.; Mulero, J.J.; Lagace, R.E.; Hennessy, L.K.; Short, M.L.; Wang, D.Y. Developmental validation of GlobalFiler PCR amplification kit: A 6-dye multiplex assay designed for amplification of casework samples. Int. J. Leg. Med. 2018, 132, 1555–1573. [Google Scholar] [CrossRef]
- Alaeddini, R. Forensic implications of PCR inhibition—A review. Forensic Sci. Int. Genet. 2012, 6, 297–305. [Google Scholar] [CrossRef]
- Wilson, I.G. Inhibition and facilitation of nucleic acid amplification. Appl. Environ. Microbiol. 1997, 63, 3741–3751. [Google Scholar] [CrossRef]
- Radstrom, P.; Knutsson, R.; Wolffs, P.; Lovenklev, M.; Lofstrom, C. Pre-PCR processing: Strategies to generate PCR-compatible samples. Mol. Biotechnol. 2004, 26, 133–146. [Google Scholar] [CrossRef]
- Alaeddini, R.; Walsh, S.J.; Abbas, A. Forensic implications of genetic analyses from degraded DNA—A review. Forensic Sci. Int. Genet. 2010, 4, 148–157. [Google Scholar] [CrossRef]
- Opel, K.L.; Chung, D.T.; Drabek, J.; Butler, J.M.; McCord, B.R. Developmental validation of reduced-size STR Miniplex primer sets. J. Forensic Sci. 2007, 52, 1263–1271. [Google Scholar] [CrossRef]
- Coble, M.D.; Butler, J.M. Characterization of new miniSTR loci to aid analysis of degraded DNA. J. Forensic Sci. 2005, 50, 43–53. [Google Scholar] [CrossRef]
- Ballard, D.; Winkler-Galicki, J.; Wesoly, J. Massive parallel sequencing in forensics: Advantages, issues, technicalities, and prospects. Int. J. Leg. Med. 2020, 134, 1291–1303. [Google Scholar] [CrossRef]
- Wang, Z.; Zhou, D.; Wang, H.; Jia, Z.; Liu, J.; Qian, X.; Li, C.; Hou, Y. Massively parallel sequencing of 32 forensic markers using the Precision ID GlobalFiler NGS STR Panel and the Ion PGM System. Forensic Sci. Int. Genet. 2017, 31, 126–134. [Google Scholar] [CrossRef]
- Jager, A.C.; Alvarez, M.L.; Davis, C.P.; Guzman, E.; Han, Y.; Way, L.; Walichiewicz, P.; Silva, D.; Pham, N.; Caves, G.; et al. Developmental validation of the MiSeq FGx Forensic Genomics System for Targeted Next Generation Sequencing in Forensic DNA Casework and Database Laboratories. Forensic Sci. Int. Genet. 2017, 28, 52–70. [Google Scholar] [CrossRef]
- Moura-Neto, R.; King, J.L.; Mello, I.; Dias, V.; Crysup, B.; Woerner, A.E.; Budowle, B.; Silva, R. Evaluation of Promega PowerSeq Auto/Y systems prototype on an admixed sample of Rio de Janeiro, Brazil: Population data, sensitivity, stutter and mixture studies. Forensic Sci. Int. Genet. 2021, 53, 102516. [Google Scholar] [CrossRef]
- Gettings, K.B.; Kiesler, K.M.; Faith, S.A.; Montano, E.; Baker, C.H.; Young, B.A.; Guerrieri, R.A.; Vallone, P.M. Sequence variation of 22 autosomal STR loci detected by next generation sequencing. Forensic Sci. Int. Genet. 2016, 21, 15–21. [Google Scholar] [CrossRef]
- Kim, E.H.; Lee, H.Y.; Yang, I.S.; Jung, S.E.; Yang, W.I.; Shin, K.J. Massively parallel sequencing of 17 commonly used forensic autosomal STRs and amelogenin with small amplicons. Forensic Sci. Int. Genet. 2016, 22, 1–7. [Google Scholar] [CrossRef] [PubMed]
- Specifications for the MiSeq System. Available online: https://www.illumina.com/systems/sequencing-platforms/miseq/specifications.html (accessed on 22 October 2022).
- Cluster Density Guidelines for Illumina Sequencing Platforms Using Non-Patterned Flow Cells. Available online: https://support.illumina.com/bulletins/2016/10/cluster-density-guidelines-for-illumina-sequencing-platforms-.html (accessed on 22 October 2022).
- Macville, M.; Schrock, E.; Padilla-Nash, H.; Keck, C.; Ghadimi, B.M.; Zimonjic, D.; Popescu, N.; Ried, T. Comprehensive and definitive molecular cytogenetic characterization of HeLa cells by spectral karyotyping. Cancer Res. 1999, 59, 141–150. [Google Scholar] [PubMed]
- King, J.L.; Woerner, A.E.; Mandape, S.N.; Kapema, K.B.; Moura-Neto, R.S.; Silva, R.; Budowle, B. STRait Razor Online: An enhanced user interface to facilitate interpretation of MPS data. Forensic Sci. Int. Genet. 2021, 52, 102463. [Google Scholar] [CrossRef] [PubMed]
- Ganschow, S.; Silvery, J.; Kalinowski, J.; Tiemann, C. toaSTR: A web application for forensic STR genotyping by massively parallel sequencing. Forensic Sci. Int. Genet. 2018, 37, 21–28. [Google Scholar] [CrossRef]
- Warshauer, D.H.; King, J.L.; Budowle, B. STRait Razor v2.0: The improved STR Allele Identification Tool—Razor. Forensic Sci. Int. Genet. 2015, 14, 182–186. [Google Scholar] [CrossRef]
- Sharma, V.; van der Plaat, D.A.; Liu, Y.; Wurmbach, E. Analyzing degraded DNA and challenging samples using the ForenSeq DNA Signature Prep kit. Sci. Justice 2020, 60, 243–252. [Google Scholar] [CrossRef]
- Calafell, F.; Anglada, R.; Bonet, N.; Gonzalez-Ruiz, M.; Prats-Munoz, G.; Rasal, R.; Lalueza-Fox, C.; Bertranpetit, J.; Malgosa, A.; Casals, F. An assessment of a massively parallel sequencing approach for the identification of individuals from mass graves of the Spanish Civil War (1936–1939). Electrophoresis 2016, 37, 2841–2847. [Google Scholar] [CrossRef]
- Fattorini, P.; Previdere, C.; Carboni, I.; Marrubini, G.; Sorcaburu-Cigliero, S.; Grignani, P.; Bertoglio, B.; Vatta, P.; Ricci, U. Performance of the ForenSeqTM DNA Signature Prep kit on highly degraded samples. Electrophoresis 2017, 38, 1163–1174. [Google Scholar] [CrossRef]
- ForenSeq DNA Signature Prep Reference Guide. Available online: https://verogen.com/wp-content/uploads/2022/01/forenseq-dna-signature-prep-reference-guide-PCR1-vd2018005-d.pdf (accessed on 20 October 2022).
- Precision ID GlobalFilerTM NGS STR Panel v2 with the HID Ion S5TM/HID Ion GeneStudioTM S5 System Application Guide. Available online: https://assets.thermofisher.com/TFS-Assets/LSG/manuals/MAN0016129_PrecisionIDSTRIonS5_UG.pdf (accessed on 3 November 2022).
- Zeng, X.; King, J.; Hermanson, S.; Patel, J.; Storts, D.R.; Budowle, B. An evaluation of the PowerSeq Auto System: A multiplex short tandem repeat marker kit compatible with massively parallel sequencing. Forensic Sci. Int. Genet. 2015, 19, 172–179. [Google Scholar] [CrossRef]
- Rolf, B.; Schurenkamp, M.; Junge, A.; Brinkmann, B. Sequence polymorphism at the tetranucleotide repeat of the human beta-actin related pseudogene H-beta-Ac-psi-2 (ACTBP2) locus. Int. J. Leg. Med. 1997, 110, 69–72. [Google Scholar] [CrossRef]
- Mardis, E.; McCombie, W.R. Library Quantification Using SYBR Green-Quantitative Polymerase Chain Reaction (qPCR). Cold Spring Harb. Protoc. 2017, 2017, pdb.prot094714. [Google Scholar] [CrossRef]
- Sidstedt, M.; Steffen, C.R.; Kiesler, K.M.; Vallone, P.M.; Radstrom, P.; Hedman, J. The impact of common PCR inhibitors on forensic MPS analysis. Forensic Sci. Int. Genet. 2019, 40, 182–191. [Google Scholar] [CrossRef]
- Ragazzo, M.; Carboni, S.; Caputo, V.; Buttini, C.; Manzo, L.; Errichiello, V.; Puleri, G.; Giardina, E. Interpreting Mixture Profiles: Comparison between Precision ID GlobalFiler NGS STR Panel v2 and Traditional Methods. Genes 2020, 11, 591. [Google Scholar] [CrossRef]
- van der Gaag, K.J.; de Leeuw, R.H.; Hoogenboom, J.; Patel, J.; Storts, D.R.; Laros, J.F.J.; de Knijff, P. Massively parallel sequencing of short tandem repeats—Population data and mixture analysis results for the PowerSeq system. Forensic Sci. Int. Genet. 2016, 24, 86–96. [Google Scholar] [CrossRef]
- Clark, J.R.; Scott, S.D.; Jack, A.L.; Lee, H.; Mason, J.; Carter, G.I.; Pearce, L.; Jackson, T.; Clouston, H.; Sproul, A.; et al. Monitoring of chimerism following allogeneic haematopoietic stem cell transplantation (HSCT): Technical recommendations for the use of short tandem repeat (STR) based techniques, on behalf of the United Kingdom National External Quality Assessment Service for Leucocyte Immunophenotyping Chimerism Working Group. Br. J. Haematol. 2015, 168, 26–37. [Google Scholar] [CrossRef]
- Cusick, M.F.; Clark, L.; Tu, T.; Goforth, J.; Zhang, X.; LaRue, B.; Gutierrez, R.; Jindra, P.T. Performance characteristics of chimerism testing by next generation sequencing. Hum. Immunol. 2022, 83, 61–69. [Google Scholar] [CrossRef] [PubMed]
- Bossuyt, V.; Buza, N.; Ngo, N.T.; Much, M.A.; Asis, M.C.; Schwartz, P.E.; Hui, P. Cancerous ‘floater’: A lesson learned about tissue identity testing, endometrial cancer and microsatellite instability. Mod. Pathol. 2013, 26, 1264–1269. [Google Scholar] [CrossRef] [PubMed]
- Tsongalis, G.J.; Berman, M.M. Application of forensic identity testing in a clinical setting. Diagn. Mol. Pathol. 1997, 6, 111–114. [Google Scholar] [CrossRef] [PubMed]
- Yohe, S.; Thyagarajan, B. Review of Clinical Next-Generation Sequencing. Arch. Pathol. Lab. Med. 2017, 141, 1544–1557. [Google Scholar] [CrossRef] [PubMed]
- Nims, R.W.; Sykes, G.; Cottrill, K.; Ikonomi, P.; Elmore, E. Short tandem repeat profiling: Part of an overall strategy for reducing the frequency of cell misidentification. Vitr. Cell. Dev. Biol. Anim. 2010, 46, 811–819. [Google Scholar] [CrossRef]
- 16S Metagenomic Sequencing Library Preparation. Available online: https://support.illumina.com/content/dam/illumina-support/documents/documentation/chemistry_documentation/16s/16s-metagenomic-library-prep-guide-15044223-b.pdf (accessed on 20 October 2022).
- Sullivan, K.M.; Mannucci, A.; Kimpton, C.P.; Gill, P. A rapid and quantitative DNA sex test: Fluorescence-based PCR analysis of X-Y homologous gene amelogenin. Biotechniques 1993, 15, 636–638, 640–641. [Google Scholar]
- Lareu, M.V.; Barral, S.; Salas, A.; Pestoni, C.; Carracedo, A. Sequence variation of a hypervariable short tandem repeat at the D1S1656 locus. Int. J. Leg. Med. 1998, 111, 244–247. [Google Scholar] [CrossRef]
- STRidER. Available online: https://strider.online (accessed on 21 November 2022).
- Martin, M. Cutadapt Removes Adapter Sequences from High-Throughput Sequencing Reads. EMBnet J. 2011, 17, 10–12. [Google Scholar] [CrossRef]
- Bolger, A.M.; Lohse, M.; Usadel, B. Trimmomatic: A flexible trimmer for Illumina sequence data. Bioinformatics 2014, 30, 2114–2120. [Google Scholar] [CrossRef]
- Aronesty, E. Comparison of Sequencing Utility Programs. TOBIOIJ 2013, 7, 1–8. [Google Scholar] [CrossRef]
- Walsh, P.S.; Fildes, N.J.; Reynolds, R. Sequence analysis and characterization of stutter products at the tetranucleotide repeat locus vWA. Nucleic Acids Res. 1996, 24, 2807–2812. [Google Scholar] [CrossRef]
- Aponte, R.; Gettings, K.; Duewer, D.; Coble, M.; Vallone, P. Sequence-based Analysis of Stutter at STR Loci: Characterization and Utility. Forensic Sci. Int. Genet. Suppl. Ser. 2015, 5, e456–e458. [Google Scholar] [CrossRef]


| Allele 1 | maSTR | ESX17 | |
|---|---|---|---|
| D10S1248 | 13 | 102 | 103 |
| D12S391 | 19 | 165 | 150 |
| D16S539 | 11 | 154 | 301 |
| D18S51 | 18 | 144 | 330 |
| D19S433 | 14 | 151 | 227 |
| D1S1656 | 17 | 153 | 169 |
| D21S11 | 29 | 174 | 223 |
| D22S1045 | 17 | 123 | 109 |
| D2S1338 | 23 | 146 | 249 |
| D2S441 | 12 | 122 | 104 |
| D3S1358 | 16 | 122 | 131 |
| D8S1179 | 13 | 103 | 227 |
| FGA | 22 | 141 | 296 |
| SE33 | 25.2 | 246 | 351 |
| TH01 | 7 | 92 | 168 |
| vWA | 17 | 127 | 152 |
| AMEL | X/Y | 106/112 | 87/93 |
| STR Locus | DNA Donor | Classification | No. of Repeats | Sequence of Repeat Region (5′ to 3′) |
|---|---|---|---|---|
| D21S11 | A5 | allele | 29 | [TCTA]4[TCTG]6[TCTA]3TA[TCTA]3TCA[TCTA]2TCCATA[TCTA]11 |
| B5 | stutter 1 | 29 | [TCTA]6[TCTG]5[TCTA]3TA[TCTA]3TCA[TCTA]2TCCATA[TCTA]10 | |
| allele | 30 | [TCTA]6[TCTG]5[TCTA]3TA[TCTA]3TCA[TCTA]2TCCATA[TCTA]11 | ||
| SE33 | A5 | allele | 30.2 | CT[CTTT]2CCTTC[CTTT]17TT[CTTT]13CT[CTTT]3CT[CTTT]2 |
| B5 | allele | 30.2 | CT[CTTT]2CCTTCCTTC[CTTT]19TT[CTTT]11CT[CTTT]3CT[CTTT]1 |
| Locus | Sequence 5′-3′ 1 | Amplicon Size Range (bp) 2 | Reference 4 | |
|---|---|---|---|---|
| AMEL | Fwd | CCCTGGGCTCTGTAAAGAA | 106–112 | [46] |
| Rev | ATCAGAGCTTAAACTGGGAAGCTG | |||
| D10S1248 | Fwd | TTAATGAATTGAACAAATGAGTGAG | 54–122 | [15] |
| Rev | CAACTCTGGTTGTATTGTCTTCAT | |||
| D12S391 | Fwd | TCAACAGGATCAATGGATGCA | 149–193 | tp |
| Rev | ACTGTCATGAGATTTTTCAGCCT | |||
| D16S539 | Fwd | TGGGAGCAAACAAAGGCAGA | 142–166 | tp |
| Rev | AGCATGTATCTATCATCCATCTCTG | [21] | ||
| D18S51 | Fwd | CTGAGTGACAAATTGAGACCTTG | 112–164 | [21] |
| Rev | GTTGCTACTATTTCTTTTCTTTTTCTC | |||
| D19S443 | Fwd | GCAAAAAGCTATAATTGTACCAC | 99–169 3 | [21] |
| Rev | AAAAATCTTCTCTCTTTCTTCCTCTC | |||
| D1S1656 | Fwd | GTGTTGCTCAAGGGTCAACT | 125–168 | [47] |
| Rev | GAGAAATAGAATCACTAGGGAACC | |||
| D21S11 | Fwd | AATTCCCCAAGTGAATTGCC | 156–200 | [21] |
| Rev | GGTAGATAGACTGGATAGATAGACGA | |||
| D22S1045 | Fwd | AGCTGCTATGGGGGCTAGAT | 102–129 | tp |
| Rev | CGAATGTATGATTGGCAATATTTTT | [15] | ||
| D2S1338 | Fwd | TGGAAACAGAAATGGCTTGG | 58-162 | [15] |
| Rev | AGTTATTCAGTAAGTTAAAGGATTGC | |||
| D2S441 | Fwd | GGCTACAGGAATCATGAGCCA | 106–138 | tp |
| Rev | GAGCTAAGTGGCTGTGGTGT | |||
| D3S13358 | Fwd | CAGTCCAATCTGGGTGACAG | 102–134 | [21] |
| Rev | ATCAACAGAGGCTTGCATGT | |||
| D8S1179 | Fwd | TTTTTGTATTTCATGTGTACATTCGT | 83–119 | [21] |
| Rev | GTAGATTATTTTCACTGTGGGGAA | |||
| FGA | Fwd | AAATAAAATTAGGCATATTTACAAGC | 121-173 | [21] |
| Rev | GCCAGCAAAAAAGAAAGGAA | |||
| SE33 | Fwd | GAAAGAGACAAAGAGAGTTAG | 180–290 | [21] |
| Rev | ACATCTCCCCTACCGCTATAG | |||
| TH01 | Fwd | GATTCCCATTGGCCTGTTC | 84–104 | [21] |
| Rev | CAGGTCACAGGGAACACAGA | |||
| vWA | Fwd | GAATAATCAGTATGTGACTTGGATTG | 103–143 | [21] |
| Rev | TGATAAATACATAGGATGGATGG |
Disclaimer/Publisher’s Note: The statements, opinions and data contained in all publications are solely those of the individual author(s) and contributor(s) and not of MDPI and/or the editor(s). MDPI and/or the editor(s) disclaim responsibility for any injury to people or property resulting from any ideas, methods, instructions or products referred to in the content. |
© 2023 by the authors. Licensee MDPI, Basel, Switzerland. This article is an open access article distributed under the terms and conditions of the Creative Commons Attribution (CC BY) license (https://creativecommons.org/licenses/by/4.0/).
Share and Cite
Poethe, S.-S.; Holtel, J.; Biermann, J.-P.; Riemer, T.; Grabmüller, M.; Madea, B.; Thiele, R.; Jäger, R. Cost-Effective Next Generation Sequencing-Based STR Typing with Improved Analysis of Minor, Degraded and Inhibitor-Containing DNA Samples. Int. J. Mol. Sci. 2023, 24, 3382. https://doi.org/10.3390/ijms24043382
Poethe S-S, Holtel J, Biermann J-P, Riemer T, Grabmüller M, Madea B, Thiele R, Jäger R. Cost-Effective Next Generation Sequencing-Based STR Typing with Improved Analysis of Minor, Degraded and Inhibitor-Containing DNA Samples. International Journal of Molecular Sciences. 2023; 24(4):3382. https://doi.org/10.3390/ijms24043382
Chicago/Turabian StylePoethe, Sara-Sophie, Julia Holtel, Jan-Philip Biermann, Trine Riemer, Melanie Grabmüller, Burkhard Madea, Ralf Thiele, and Richard Jäger. 2023. "Cost-Effective Next Generation Sequencing-Based STR Typing with Improved Analysis of Minor, Degraded and Inhibitor-Containing DNA Samples" International Journal of Molecular Sciences 24, no. 4: 3382. https://doi.org/10.3390/ijms24043382
APA StylePoethe, S.-S., Holtel, J., Biermann, J.-P., Riemer, T., Grabmüller, M., Madea, B., Thiele, R., & Jäger, R. (2023). Cost-Effective Next Generation Sequencing-Based STR Typing with Improved Analysis of Minor, Degraded and Inhibitor-Containing DNA Samples. International Journal of Molecular Sciences, 24(4), 3382. https://doi.org/10.3390/ijms24043382