Figure 1.
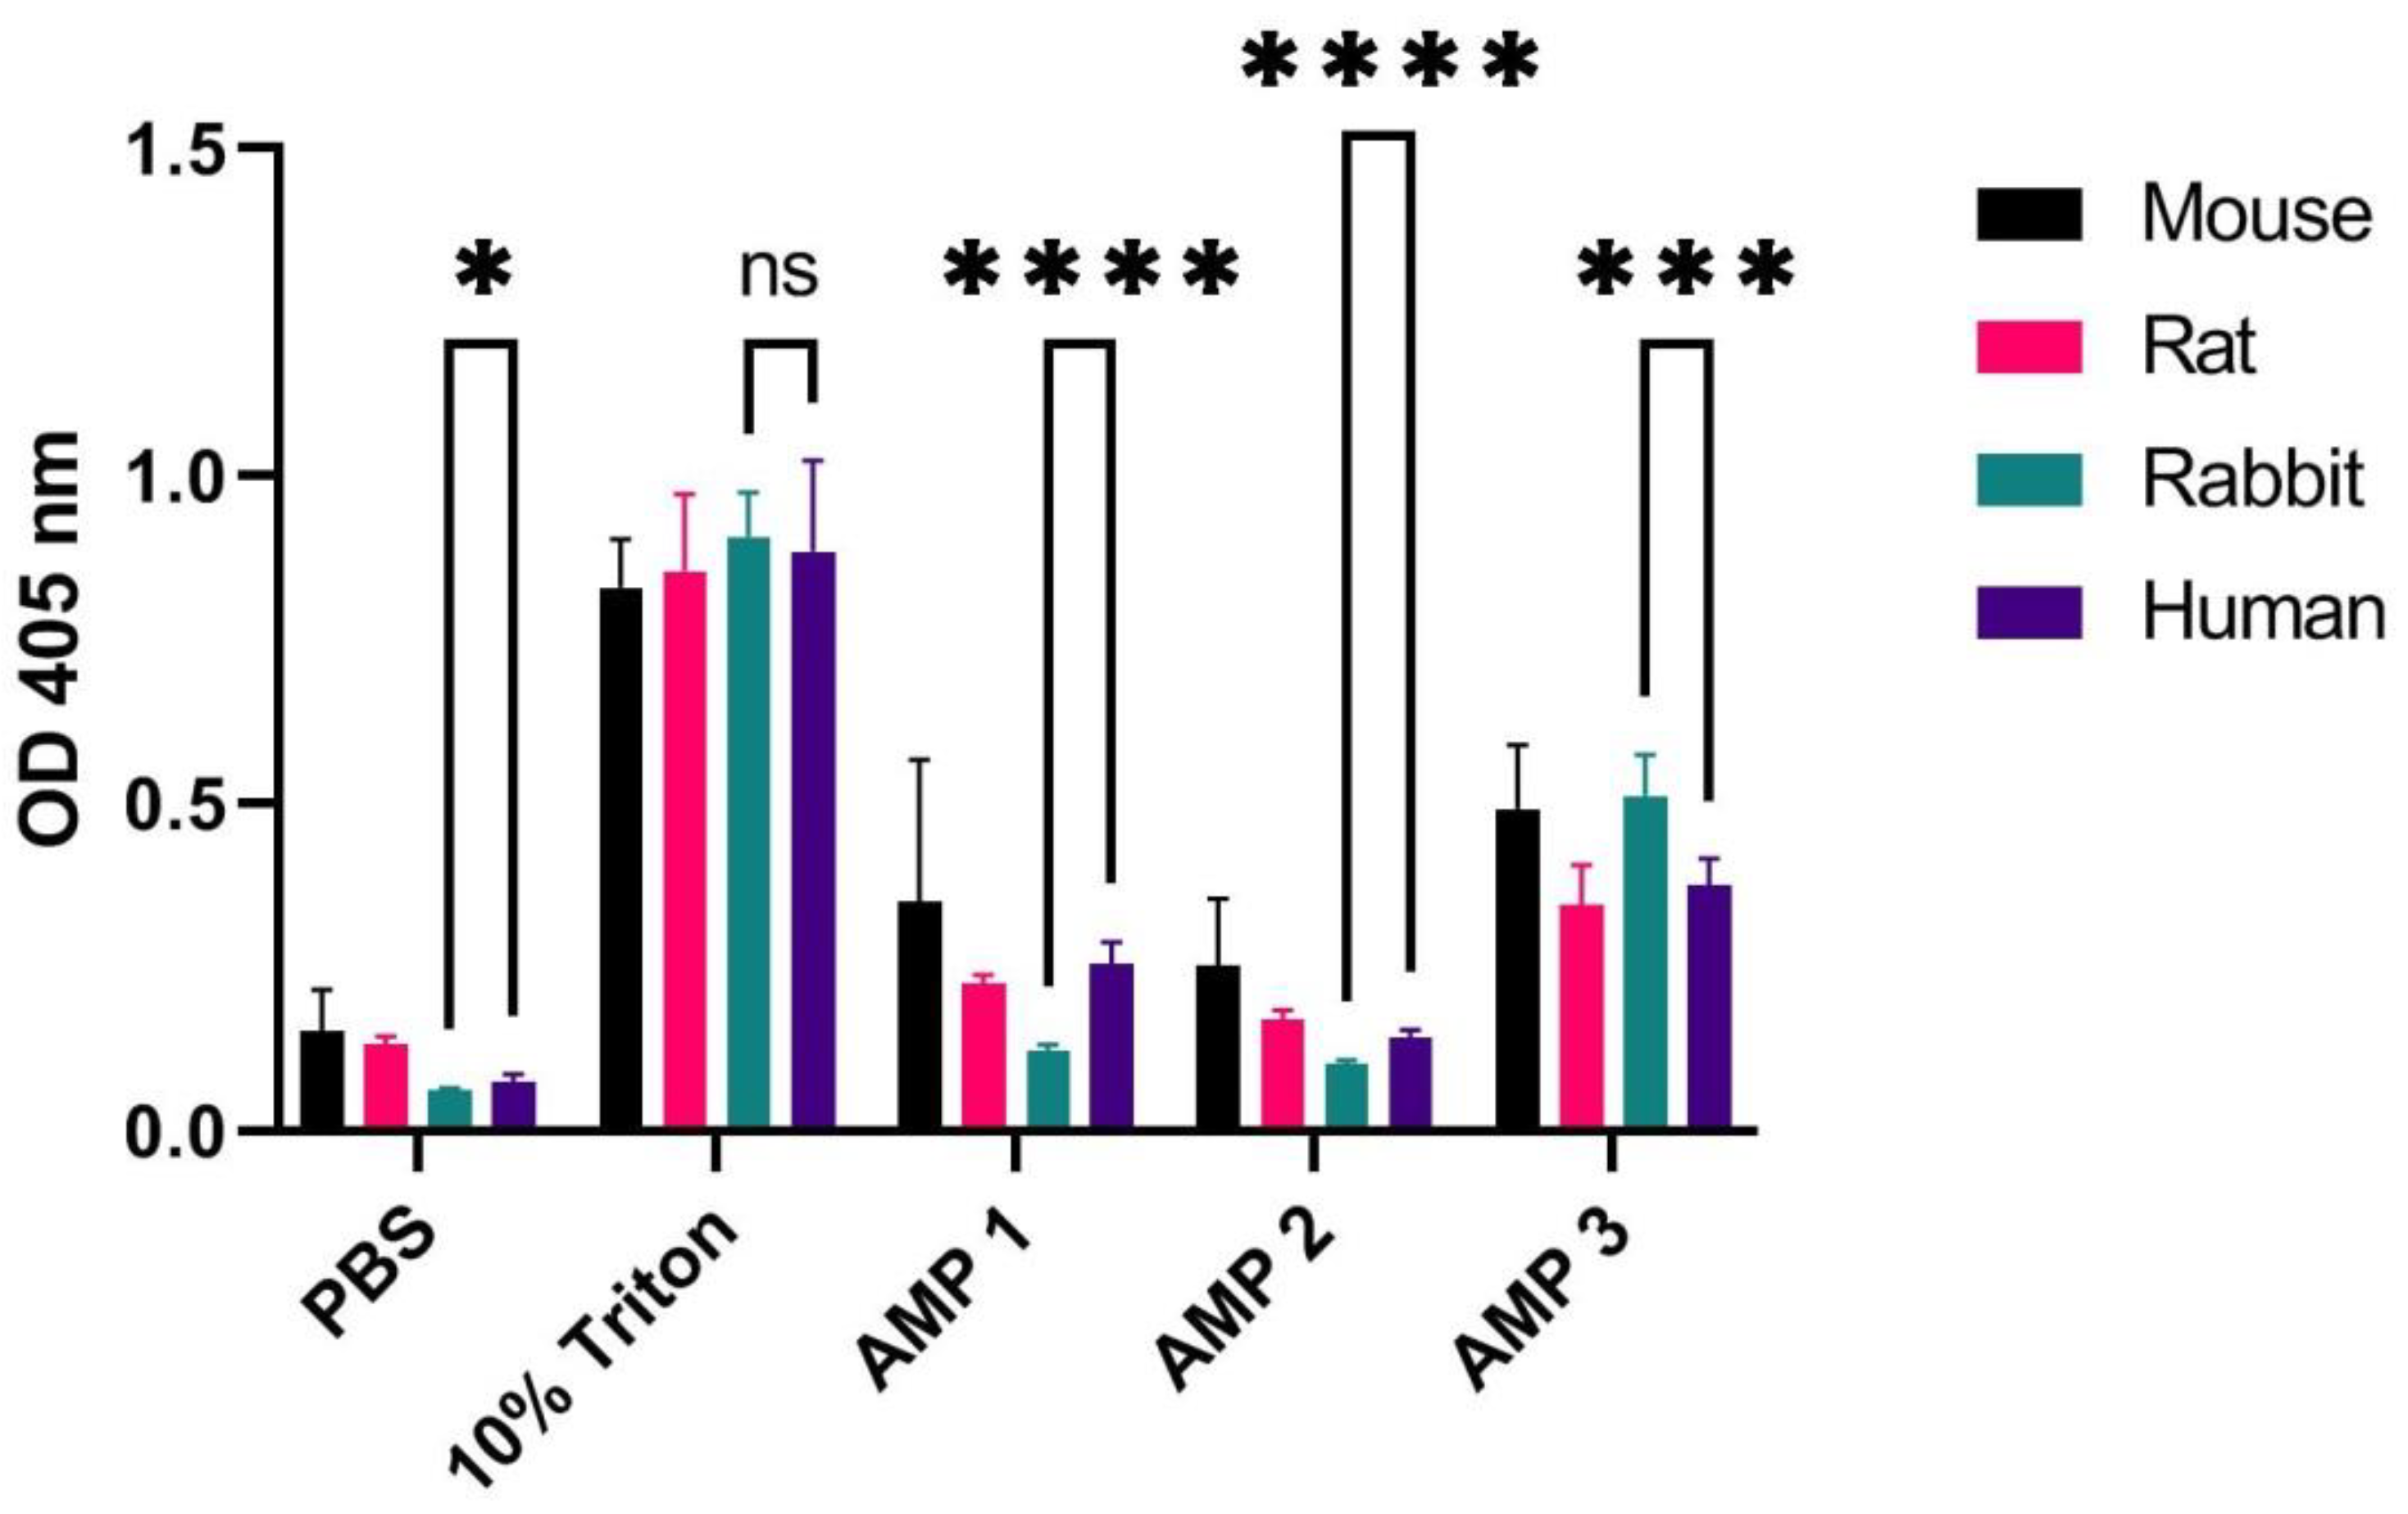
OD measurements at 405 nm (Y-axis) of free hemoglobin in a 1% erythrocyte solution originating from a mouse, rat, rabbit, and human, incubated for 60 min at 37 °C with PBS (negative control), 10% Triton X-100 (positive control), or AMPs 1, 2 or 3 (at concentrations of 100 µM). Average values from three experimental replicates, each containing two technical replicates, are presented with error bars (SD) included in plots. Significantly different data as defined from unpaired
t-test is indicated by asterisks for comparison of human and rabbit samples (
p-values: * < 0.05 *** < 0.001 **** < 0.0001 ns: non-significant). See
Table S1 for
p-values from comparison of all species.
Figure 1.
OD measurements at 405 nm (Y-axis) of free hemoglobin in a 1% erythrocyte solution originating from a mouse, rat, rabbit, and human, incubated for 60 min at 37 °C with PBS (negative control), 10% Triton X-100 (positive control), or AMPs 1, 2 or 3 (at concentrations of 100 µM). Average values from three experimental replicates, each containing two technical replicates, are presented with error bars (SD) included in plots. Significantly different data as defined from unpaired
t-test is indicated by asterisks for comparison of human and rabbit samples (
p-values: * < 0.05 *** < 0.001 **** < 0.0001 ns: non-significant). See
Table S1 for
p-values from comparison of all species.
Figure 2.
OD measurements at 405 nm (Y-axis) of free hemoglobin in 1% erythrocyte solutions originating from 10 different human individuals, as well as blood pooled from all individuals, incubated for 60 min at 37 °C with PBS (negative control), 10% Triton X-100 (positive control), dH2O, or AMPs 1, 2, or 3 (100 µM). Average values from three experimental replicates, each containing two technical replicates, are presented with error bars (SD) included in plots.
Figure 3.
OD measurements at 405 nm (Y-axis) of free hemoglobin in 1%, 2%, and 5% erythrocyte (EC) solution of pooled blood originating from 10 different human individuals, incubated for 60 min at 37 °C with PBS (negative control), 10% Triton X-100 (positive control), dH2O, or AMPs 1, 2, or 3 (100 µM). Average values from three experimental replicates, each containing two technical replicates, are presented with error bars (SD) and included in plots.
Figure 4.
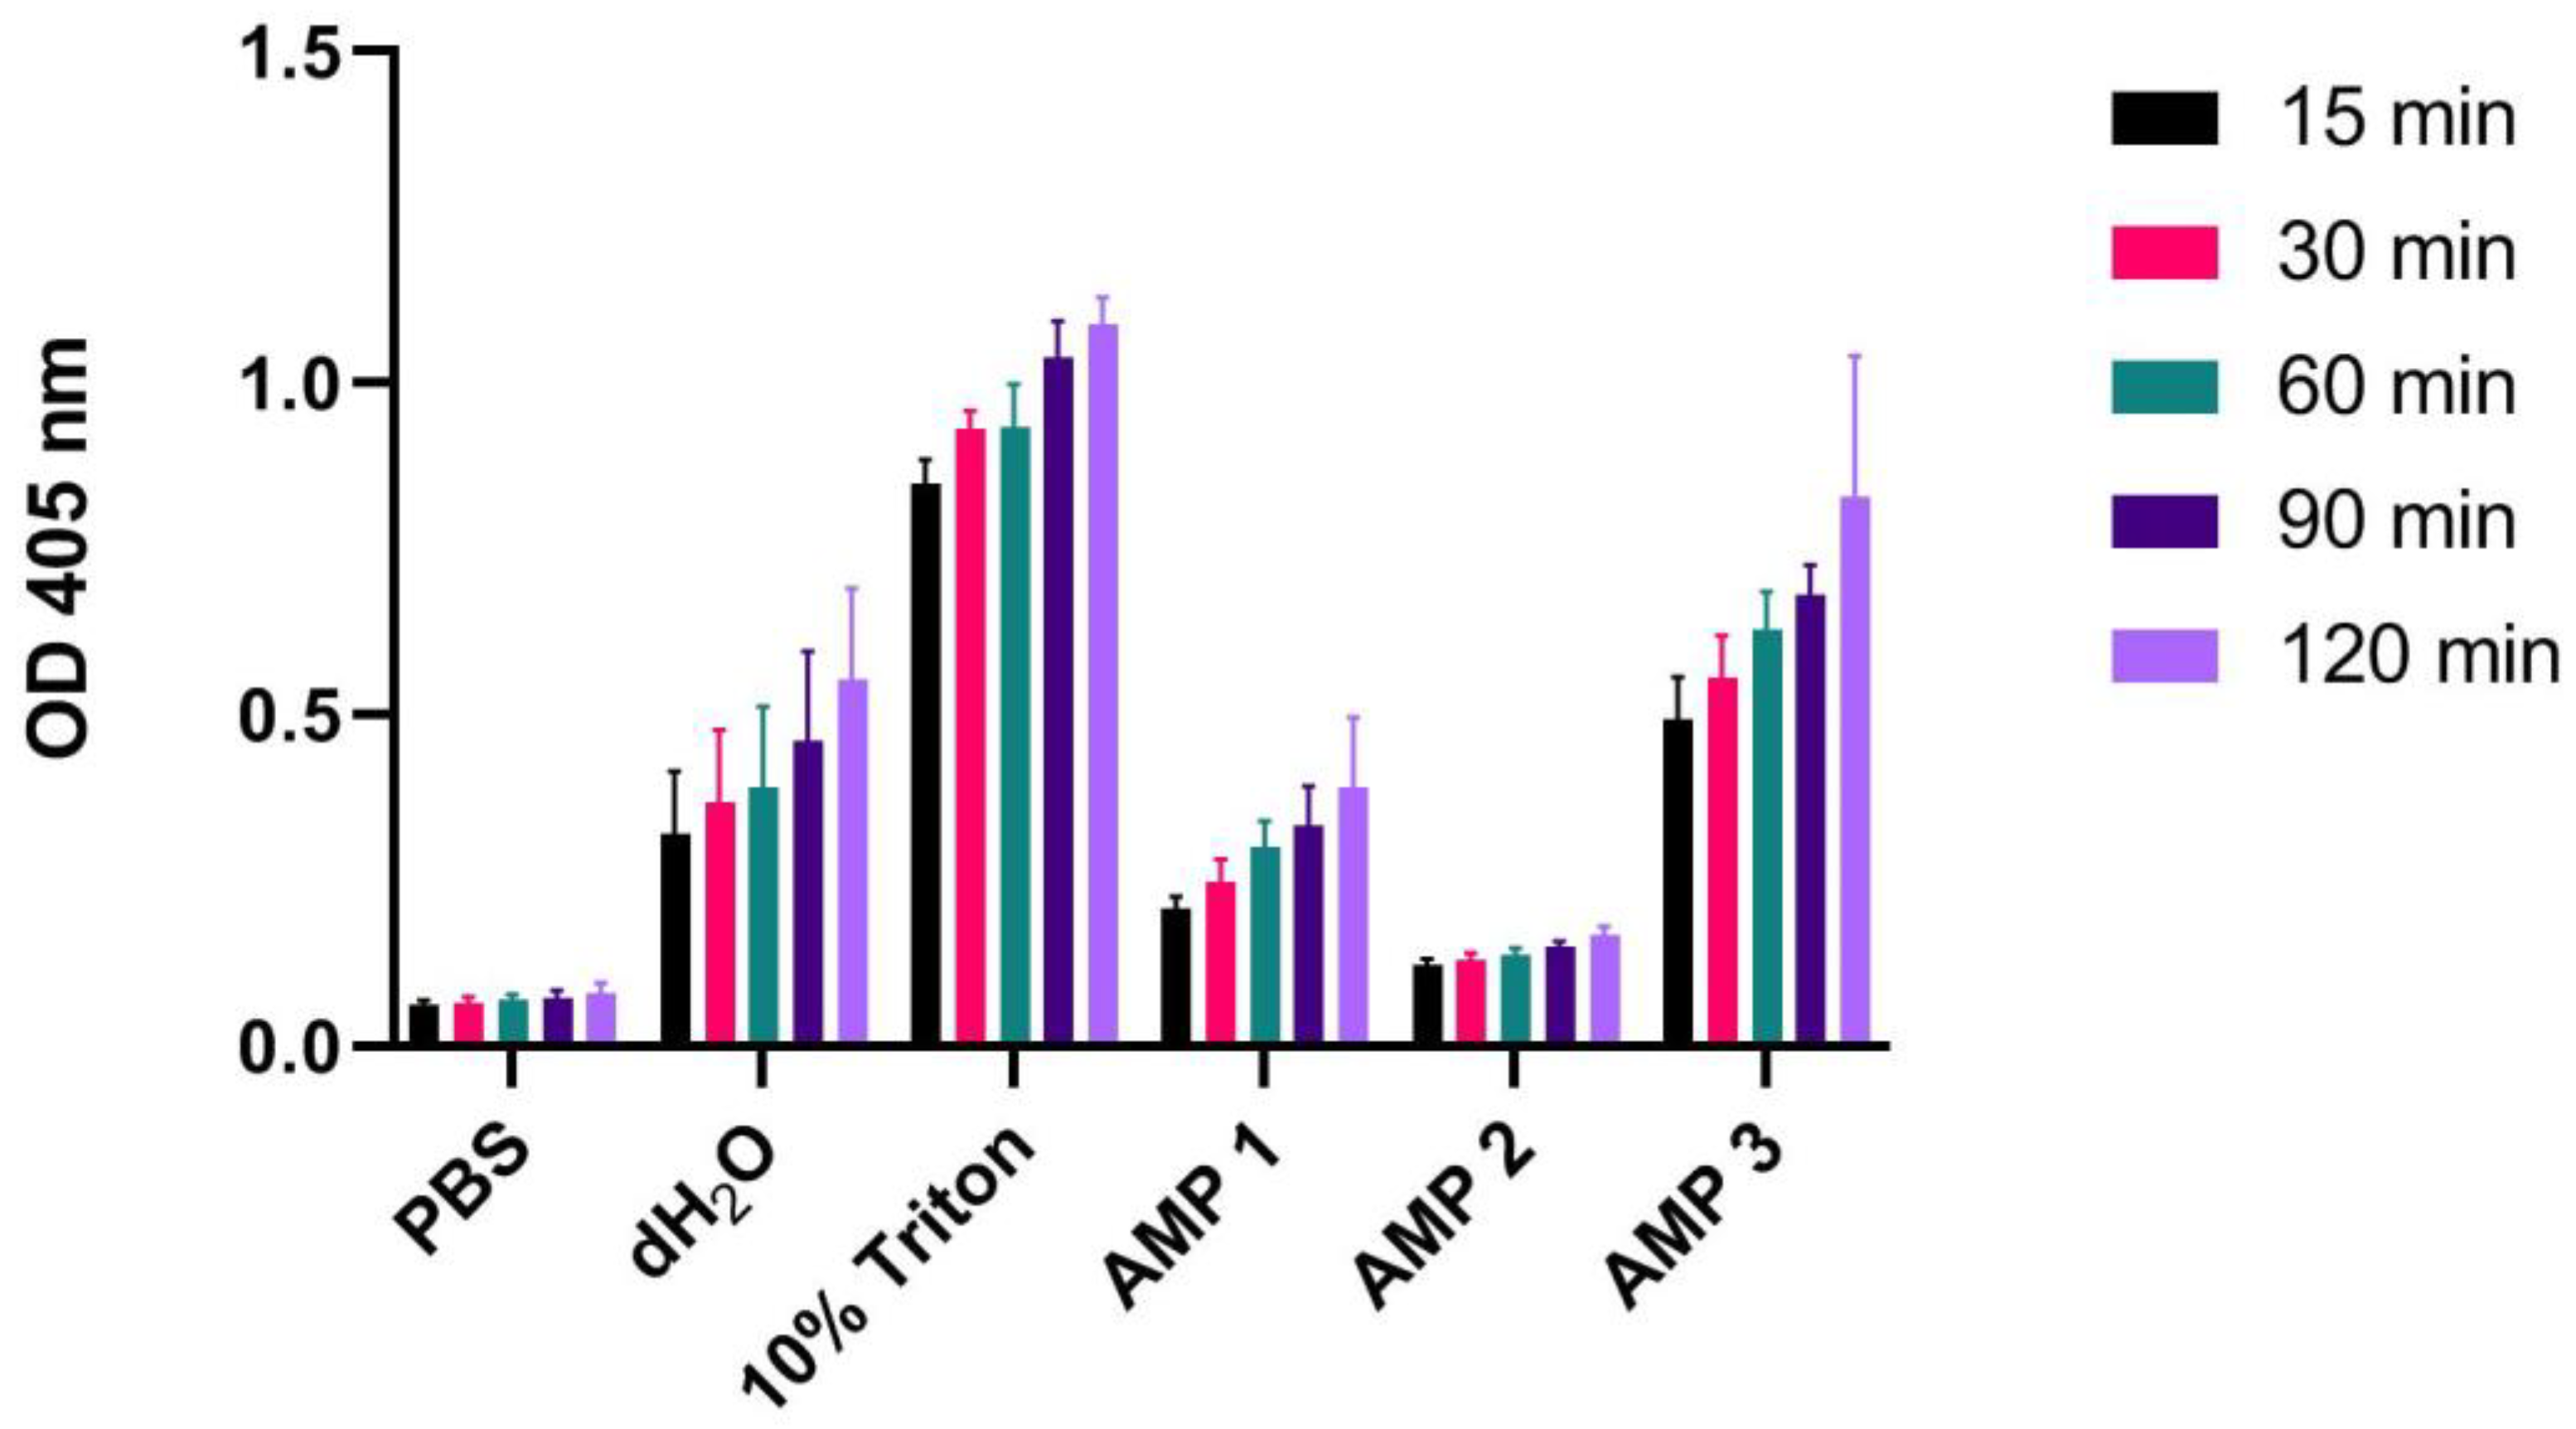
OD measurements at 405 nm (Y-axis) of free hemoglobin in a 1% human erythrocyte solution incubated for 15, 30, 60, 90 or 120 min at 37 °C with PBS (negative control), 10% Triton X-100 (positive control), dH2O or AMPs 1, 2 or 3 (100 µM). Average values from three experimental replicates, each containing two technical replicates, are presented with error bars (SD) included in plots.
Figure 4.
OD measurements at 405 nm (Y-axis) of free hemoglobin in a 1% human erythrocyte solution incubated for 15, 30, 60, 90 or 120 min at 37 °C with PBS (negative control), 10% Triton X-100 (positive control), dH2O or AMPs 1, 2 or 3 (100 µM). Average values from three experimental replicates, each containing two technical replicates, are presented with error bars (SD) included in plots.
Figure 5.
OD measurements at 405 nm (Y-axis) of free hemoglobin in a 1% erythrocyte solution sourced from a mouse, rat, rabbit, and human treated with different concentrations of Triton X-100 (A), Tween (B), and SDS (C), as well as ACS or dH2O (D). Erythrocytes were incubated for 60 min at 37 °C. Average values from three experimental replicates, each containing two technical replicates, are presented with error bars (SD) included in plots. Significantly different data as defined from unpaired t-test is indicated by asterisks (p-values: * < 0.05 ** < 0.01 *** < 0.001 **** < 0.0001 ns: non-significant).
Figure 6.
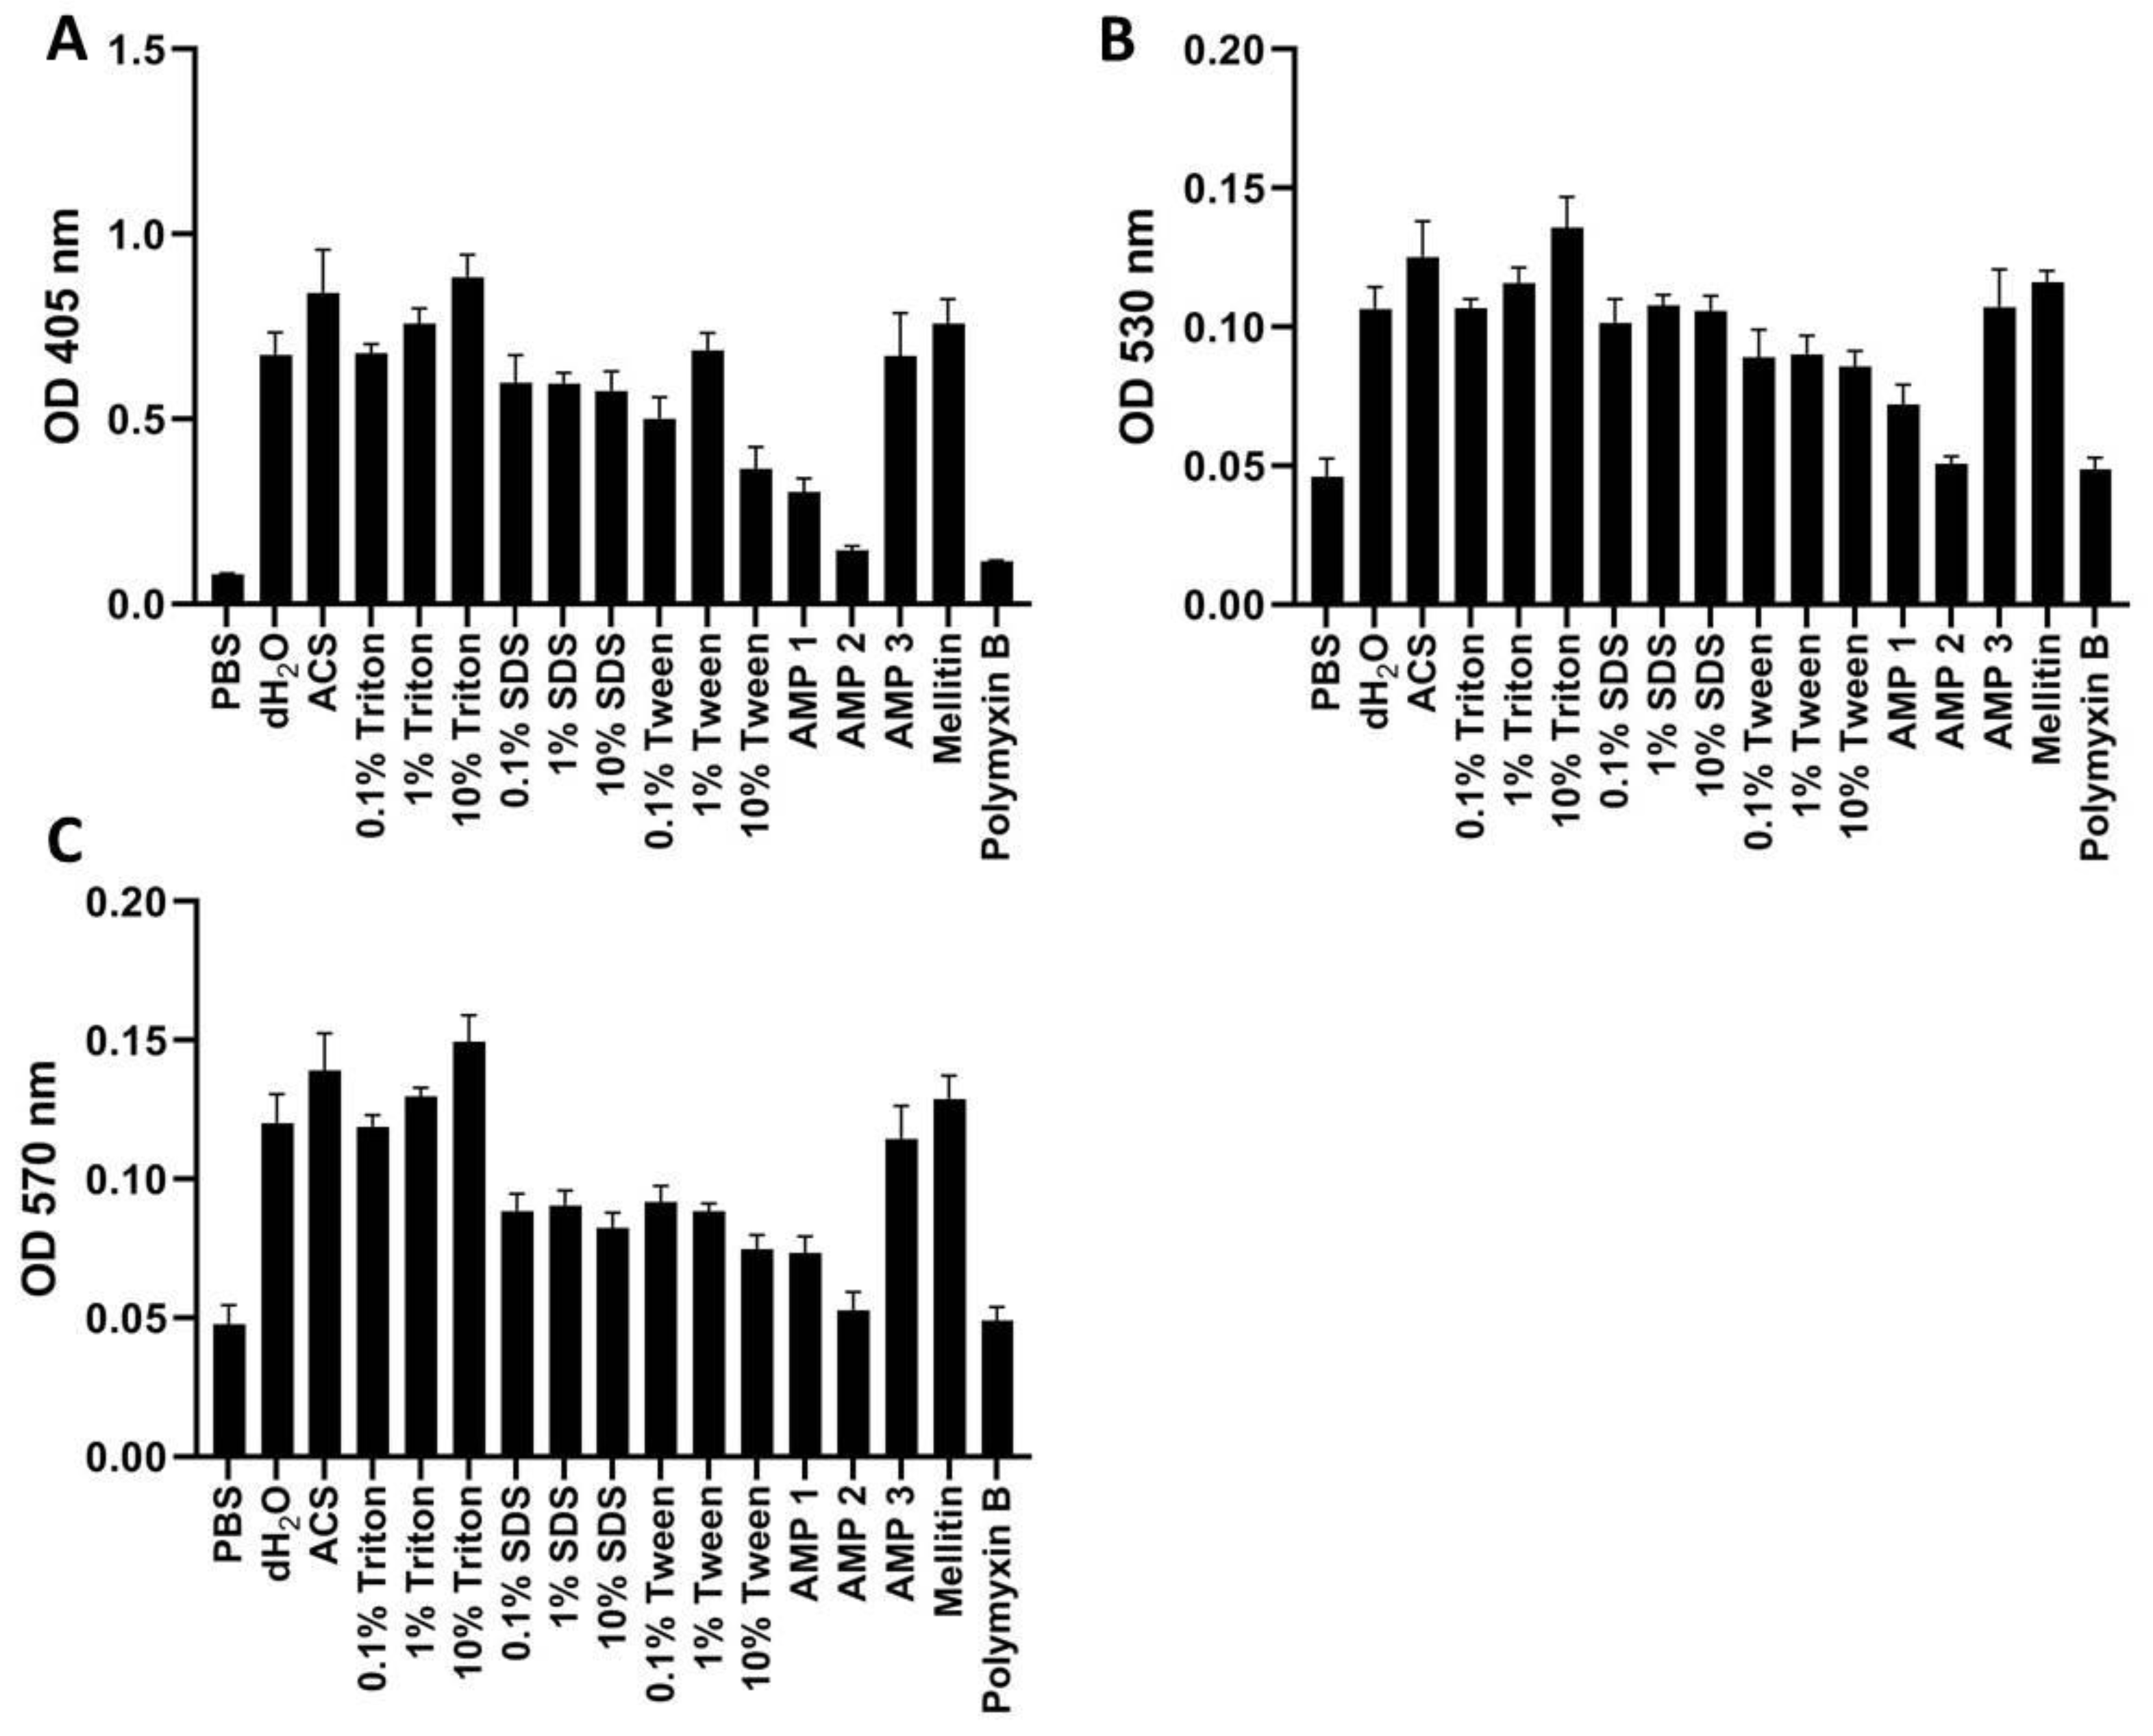
OD measurements of free hemoglobin in human whole blood at 405 nm (A), 530 nm (B), or 570 nm (C). Samples were treated with PBS (negative control), AMPs 1, 2, 3, melittin, or polymyxin B (all at 100 μM), as well as with dH2O, ACS, or different concentrations of Triton X-100, Tween, or SDS. All samples were incubated for 60 min at 37 °C. Average values from three experimental replicates, each containing two technical replicates, are presented with error bars (SD) included in plots.
Figure 6.
OD measurements of free hemoglobin in human whole blood at 405 nm (A), 530 nm (B), or 570 nm (C). Samples were treated with PBS (negative control), AMPs 1, 2, 3, melittin, or polymyxin B (all at 100 μM), as well as with dH2O, ACS, or different concentrations of Triton X-100, Tween, or SDS. All samples were incubated for 60 min at 37 °C. Average values from three experimental replicates, each containing two technical replicates, are presented with error bars (SD) included in plots.
Figure 7.
OD measurements of free hemoglobin in 1% washed human erythrocytes at 405 nm (A), 530 nm (B), or 570 nm (C). Samples were treated with PBS (negative control), AMPs 1, 2, 3, melittin or polymyxin B (all at 100 μM), as well as with dH2O, ACS, or different concentrations of Triton X-100, Tween, or SDS. All samples were incubated for 60 min at 37 °C. Average values from three experimental replicates, each containing two technical replicates, are presented with error bars (SD) included in plots.
Figure 8.
OD measurements at 405 nm (Y-axis) of free hemoglobin in a 1% human erythrocyte solution incubated with PBS, dH2O, ACS, Triton X-100, SDS, Tween, AMPs 1, 2, or 3 (100 μM), or polymyxin B (100 μM) for 60 min at 37 °C in polystyrene (black bars) or polypropylene (red bars) tubes. Average values from three experimental replicates, each containing two technical replicates, are presented with error bars (SD) included in plots. Significantly different data as defined from paired t-test is indicated by asterisks (ns: non-significant).
Figure 9.
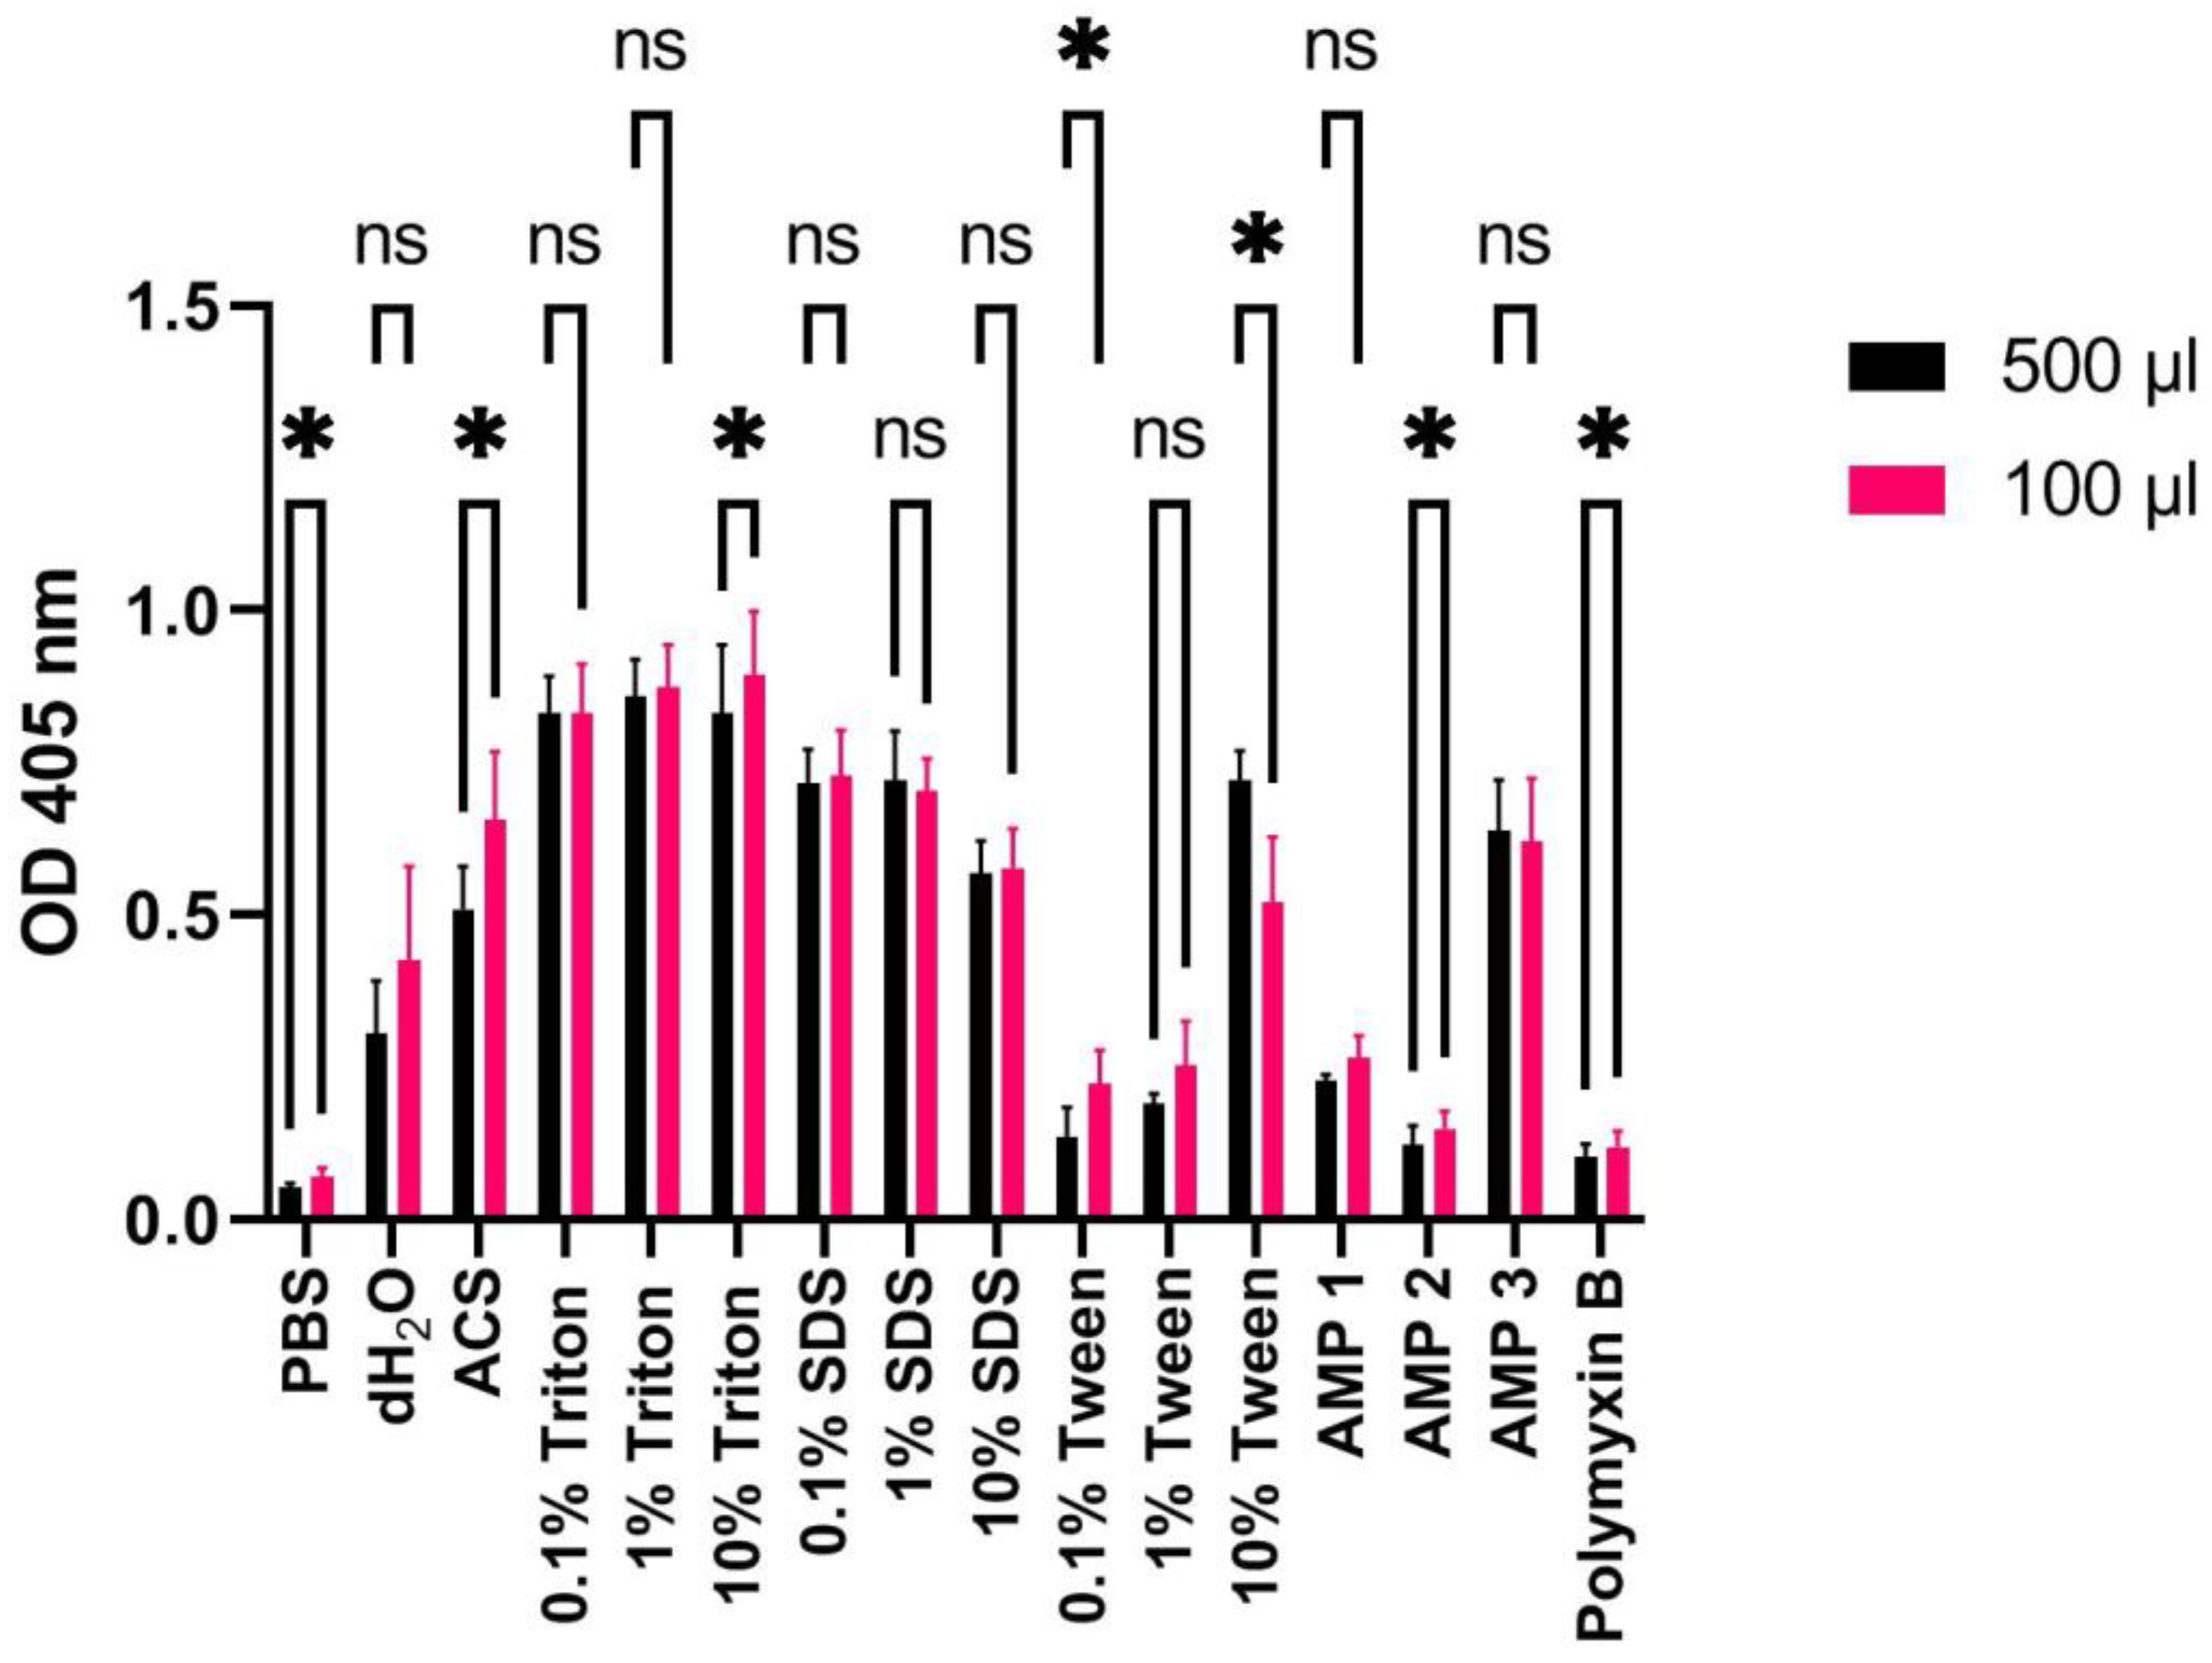
OD measurements at 405 nm (Y-axis) of free hemoglobin in a 1% human erythrocyte solution incubated with PBS, dH2O, ACS, Triton X-100, SDS, Tween, AMPs 1, 2, or 3 (100 μM), or polymyxin B (100 μM) for 60 min at 37 °C using high (500 μL: black bars) or low (100 μL; red bars) volumes. Average values from three experimental replicates, each containing two technical replicates, are presented with error bars (SD) included in plots. Significantly different data as defined from paired t-test is indicated by asterisks (p-values: * < 0.05 ns: non-significant).
Figure 9.
OD measurements at 405 nm (Y-axis) of free hemoglobin in a 1% human erythrocyte solution incubated with PBS, dH2O, ACS, Triton X-100, SDS, Tween, AMPs 1, 2, or 3 (100 μM), or polymyxin B (100 μM) for 60 min at 37 °C using high (500 μL: black bars) or low (100 μL; red bars) volumes. Average values from three experimental replicates, each containing two technical replicates, are presented with error bars (SD) included in plots. Significantly different data as defined from paired t-test is indicated by asterisks (p-values: * < 0.05 ns: non-significant).
Table 1.
Calculated hemolysis ratios (in %) according to Equation (1) for AMPs 1, 2, and 3 (100 µM) when using 1% mouse, rat, rabbit, and human erythrocyte solution. Normalization was performed on data averaged from three experimental replicates each containing two technical replicates using 10% Triton X-100 and PBS samples as positive and negative controls, respectively.
| Species | AMP 1 | AMP 2 | AMP 3 |
|---|
| Mouse | 29.2 ± 32 | 14.9 ± 14.9 | 50.1 ± 14.4 |
| Rat | 12.9 ± 1.7 | 5.2 ± 1.9 | 29.5 ± 8.2 |
| Rabbit | 7.1 ± 1.1 | 4.6 ± 0.7 | 53.2 ± 7.4 |
| Human | 22.3 ± 4 | 8.5 ± 1.4 | 37 ± 5.1 |
Table 2.
Calculated hemolysis ratios (in %) according to Equation (1) for dH2O and AMPs 1, 2, and 3 when testing 1% erythrocytes from different human individuals as well as a sample consisting of pooled blood from all 10 individuals. Normalization was performed on data averaged from three experimental replicates, each containing two technical replicates, and using 10% Triton X and PBS samples as positive and negative control, respectively.
| Human Ind. | dH2O | AMP 1 | AMP 2 | AMP 3 |
|---|
| # 1 | 38 ± 12.3 | 21.9 ± 4 | 8.2 ± 1.3 | 36.4 ± 5 |
| # 2 | 57.7 ± 12.2 | 23 ± 2.8 | 10 ± 0.7 | 39.3 ± 6 |
| # 3 | 50.8 ± 8.8 | 23.7 ± 2.1 | 9.8 ± 0.8 | 49.4 ± 8.5 |
| # 4 | 47.2 ± 5.6 | 21.3 ± 3 | 10.4 ± 0.9 | 43.6 ± 4.2 |
| # 5 | 38.8 ± 12.1 | 19.7 ± 3.7 | 11 ± 1 | 38.3 ± 7.3 |
| # 6 | 36.2 ± 10.8 | 19.6 ± 4.7 | 6.4 ± 0.7 | 45.7 ± 6.4 |
| # 7 | 49.6 ± 15.2 | 18.8 ± 4 | 8.9 ± 0.8 | 37.7 ± 6.9 |
| # 8 | 49.4 ± 16.9 | 21.7 ± 8.6 | 9.1 ± 1.1 | 45.6 ± 9.2 |
| # 9 | 49.1 ± 22.5 | 22.9 ± 6.8 | 9.6 ± 1 | 42.1 ± 4.7 |
| # 10 | 39.4 ± 10.7 | 25.1 ± 13 | 9.8 ± 0.7 | 50.3 ± 4.6 |
| Pooled | 32.6 ± 7.3 | 22.7 ± 6.6 | 12.4 ± 3.1 | 45.4 ± 4.8 |
Table 3.
Calculated hemolysis ratios according to Equation (1) for AMPs 1, 2, and 3 (100 µM) on 1%, 2%, and 5% pooled human erythrocyte solutions. Normalization was performed on data averaged from three experimental replicates, each containing two technical replicates, using 10% Triton X-100 and PBS samples as positive and negative controls, respectively.
Calculated
Hemolysis (%) | dH2O | AMP 1 | AMP 2 | AMP 3 |
|---|
| 1% erythrocytes | 32.6 ± 7.3 | 22.7 ± 6.6 | 12.4 ± 3.1 | 45.4 ± 4.8 |
| 2% erythrocytes | 27.1 ± 2.7 | 13.7 ± 4.3 | 5.6 ± 0.8 | 41.1 ± 3.2 |
| 5% erythrocytes | 22.7 ± 9 | 10.8 ± 3.2 | 5.0 ± 3.3 | 45.7 ± 8.2 |
Table 4.
Calculated hemolysis ratios according to Equation (1) for dH2O, AMPs 1, 2, and 3 (100 µM) incubated (15–120 min) with a 1% human erythrocyte solution. Normalization was performed on data averaged from three biological replicates, each containing two technical replicates, using 10% Triton X-100 and PBS samples as positive and negative control, respectively.
| Incubation Time | dH2O | AMP 1 | AMP 2 | AMP 3 |
|---|
| 15 min | 32.8 ± 12.1 | 18.5 ± 2.3 | 7.8 ± 1.1 | 54.8 ± 8.2 |
| 30 min | 34.8 ± 12.7 | 20.9 ± 4 | 7.4 ± 1.2 | 56.6 ± 7.4 |
| 60 min | 37.1 ±14.2 | 26.6 ± 4.7 | 7.8 ± 1.3 | 64.6 ± 6.8 |
| 90 min | 40.1 ±13.9 | 26.9 ± 6 | 8 ± 0.8 | 63 ± 4.5 |
| 120 min | 47 ± 13.6 | 30.6 ± 10.6 | 8.6 ± 1.4 | 74.3 ± 21.1 |
Table 5.
Calculated hemolysis ratios according to Equation (1) for AMPs 1, 2, 3, melittin or polymyxin B (PMB) (all at 100 μM) as well as for dH2O or ACS from measurements at 405, 530 and 570 nm on human whole blood. Measurements from samples with 10% SDS (positive control) or 10% Triton X-100 (positive control at 570 nm) and PBS (negative control) were used as 100% and 0% hemolysis for the normalization. Normalization was performed on data averaged from three experimental replicates, each containing two technical replicates.
| Wavelength | dH2O | ACS | AMP 1 | AMP 2 | AMP 3 | Melittin | PMB |
|---|
| 405 nm | 98.2 ± 0.4 | 97.8 ± 1.3 | 3.3 ± 3.2 | 0.4 ± 0.2 | 15.5 ± 7.1 | 98.3 ± 1.4 | 3.1 ± 1.1 |
| 530 nm | 38.4 ± 8.5 | 28.1 ± 4.5 | 0.4 ± 0.7 | 0.2 ± 0.4 | 2.7 ± 1.4 | 36.6 ± 8.7 | 3 ± 2.4 |
| 570 nm | 62.8 ± 1.4 | 45.1 ± 7.7 | 0.4 ± 1.2 | −0.1 ± 0.3 | 3.8 ± 2.1 | 54 ± 15.5 | 4.5 ± 1.8 |
Table 6.
Calculated hemolysis ratios according to Equation (1) for AMPs 1, 2, and 3, melittin and polymyxin B (PMB) (all at 100 μM), as well as for dH2O and ACS from measurements at 405, 530, and 570 nm on 1% washed human erythrocytes. Measurements from samples with 10% Triton X-100 (positive control) and PBS (negative control) were used as 100% and 0% hemolysis for the normalization. Normalization was performed on data averaged from three experimental replicates, each containing two technical replicates.
| Wavelength | dH2O | ACS | AMP 1 | AMP 2 | AMP 3 | Melittin | PMB |
|---|
| 405 nm | 73.9 ± 7.5 | 94.7 ± 14.4 | 27.7 ± 4.6 | 8.2 ± 1.4 | 73.5 ± 14.4 | 84.4 ± 8.1 | 4.4 ± 0.3 |
| 530 nm | 67.6 ± 8.7 | 88.5 ± 14.3 | 29.2 ± 8 | 5.2 ± 3 | 68.4 ± 15 | 78.4 ± 4.3 | 3.0 ± 4.7 |
| 570 nm | 71.2 ± 10.3 | 89.7 ± 13.4 | 25.3 ± 5.9 | 4.8 ± 6.6 | 65.7 ± 11.6 | 79.8 ± 8.2 | 1.3 ± 4.7 |
Table 7.
Calculated hemolysis ratios according to Equation (1) for dH2O, ACS, AMPs 1, 2, and 3 (100 μM) or polymyxin B (PMB–100 μM) from measurements at 405 nm on 1% washed human erythrocytes incubated in polystyrene or polypropylene tubes. Measurements from samples with 10% Triton X-100 (positive control) and PBS (negative control) were used as 100% and 0% hemolysis for the normalization. Normalization was performed on data averaged from three experimental replicates, each containing two technical replicates.
| | dH2O | ACS | AMP 1 | AMP 2 | AMP 3 | PMB |
|---|
| Polystyrene | 43.1 ± 18.6 | 71.2 ± 13.4 | 23.8 ± 4.3 | 9.7 ± 3.4 | 66.7 ± 12.7 | 6.1 ± 3.1 |
| Polypropylene | 29.5 ± 6 | 52.3 ± 9.2 | 19 ± 0.7 | 8.2 ± 2.6 | 57.5 ± 13.2 | 3.2 ± 1 |
Table 8.
Calculated hemolysis ratios according to Equation (1) for dH2O, ACS, and AMPs 1, 2, and 3 (100 μM) or polymyxin B (PMB–100 μM) from measurements at 405 nm on 1% washed human erythrocytes. Total volumes during incubation were 100 or 500 μL. Measurements from samples with 10% Triton X-100 (positive control) and PBS (negative control) were used as 100% and 0% hemolysis for the normalization. Normalization was performed on data averaged from three experimental replicates, each containing two technical replicates.
| | dH2O | ACS | AMP 1 | AMP 2 | AMP 3 | PMB |
|---|
| 100 μL | 43.1 ± 18.6 | 71.2 ± 13.4 | 23.8 ± 4.3 | 9.7 ± 3.4 | 66.7 ± 12.7 | 6.1 ± 3.1 |
| 500 μL | 31.4 ± 10.7 | 56.7 ± 8.8 | 21.9 ± 1.2 | 8.8 ± 3.9 | 72.7 ± 10.4 | 6.1 ± 2.8 |


 ,
, 


