

4-Methylumbelliferone Targets Revealed by Public Data Analysis and Liver Transcriptome Sequencing

 , , and
Abstract
1. Introduction
2. Results
2.1. Analysis of 4 MU Targets and Open Access Data Bases
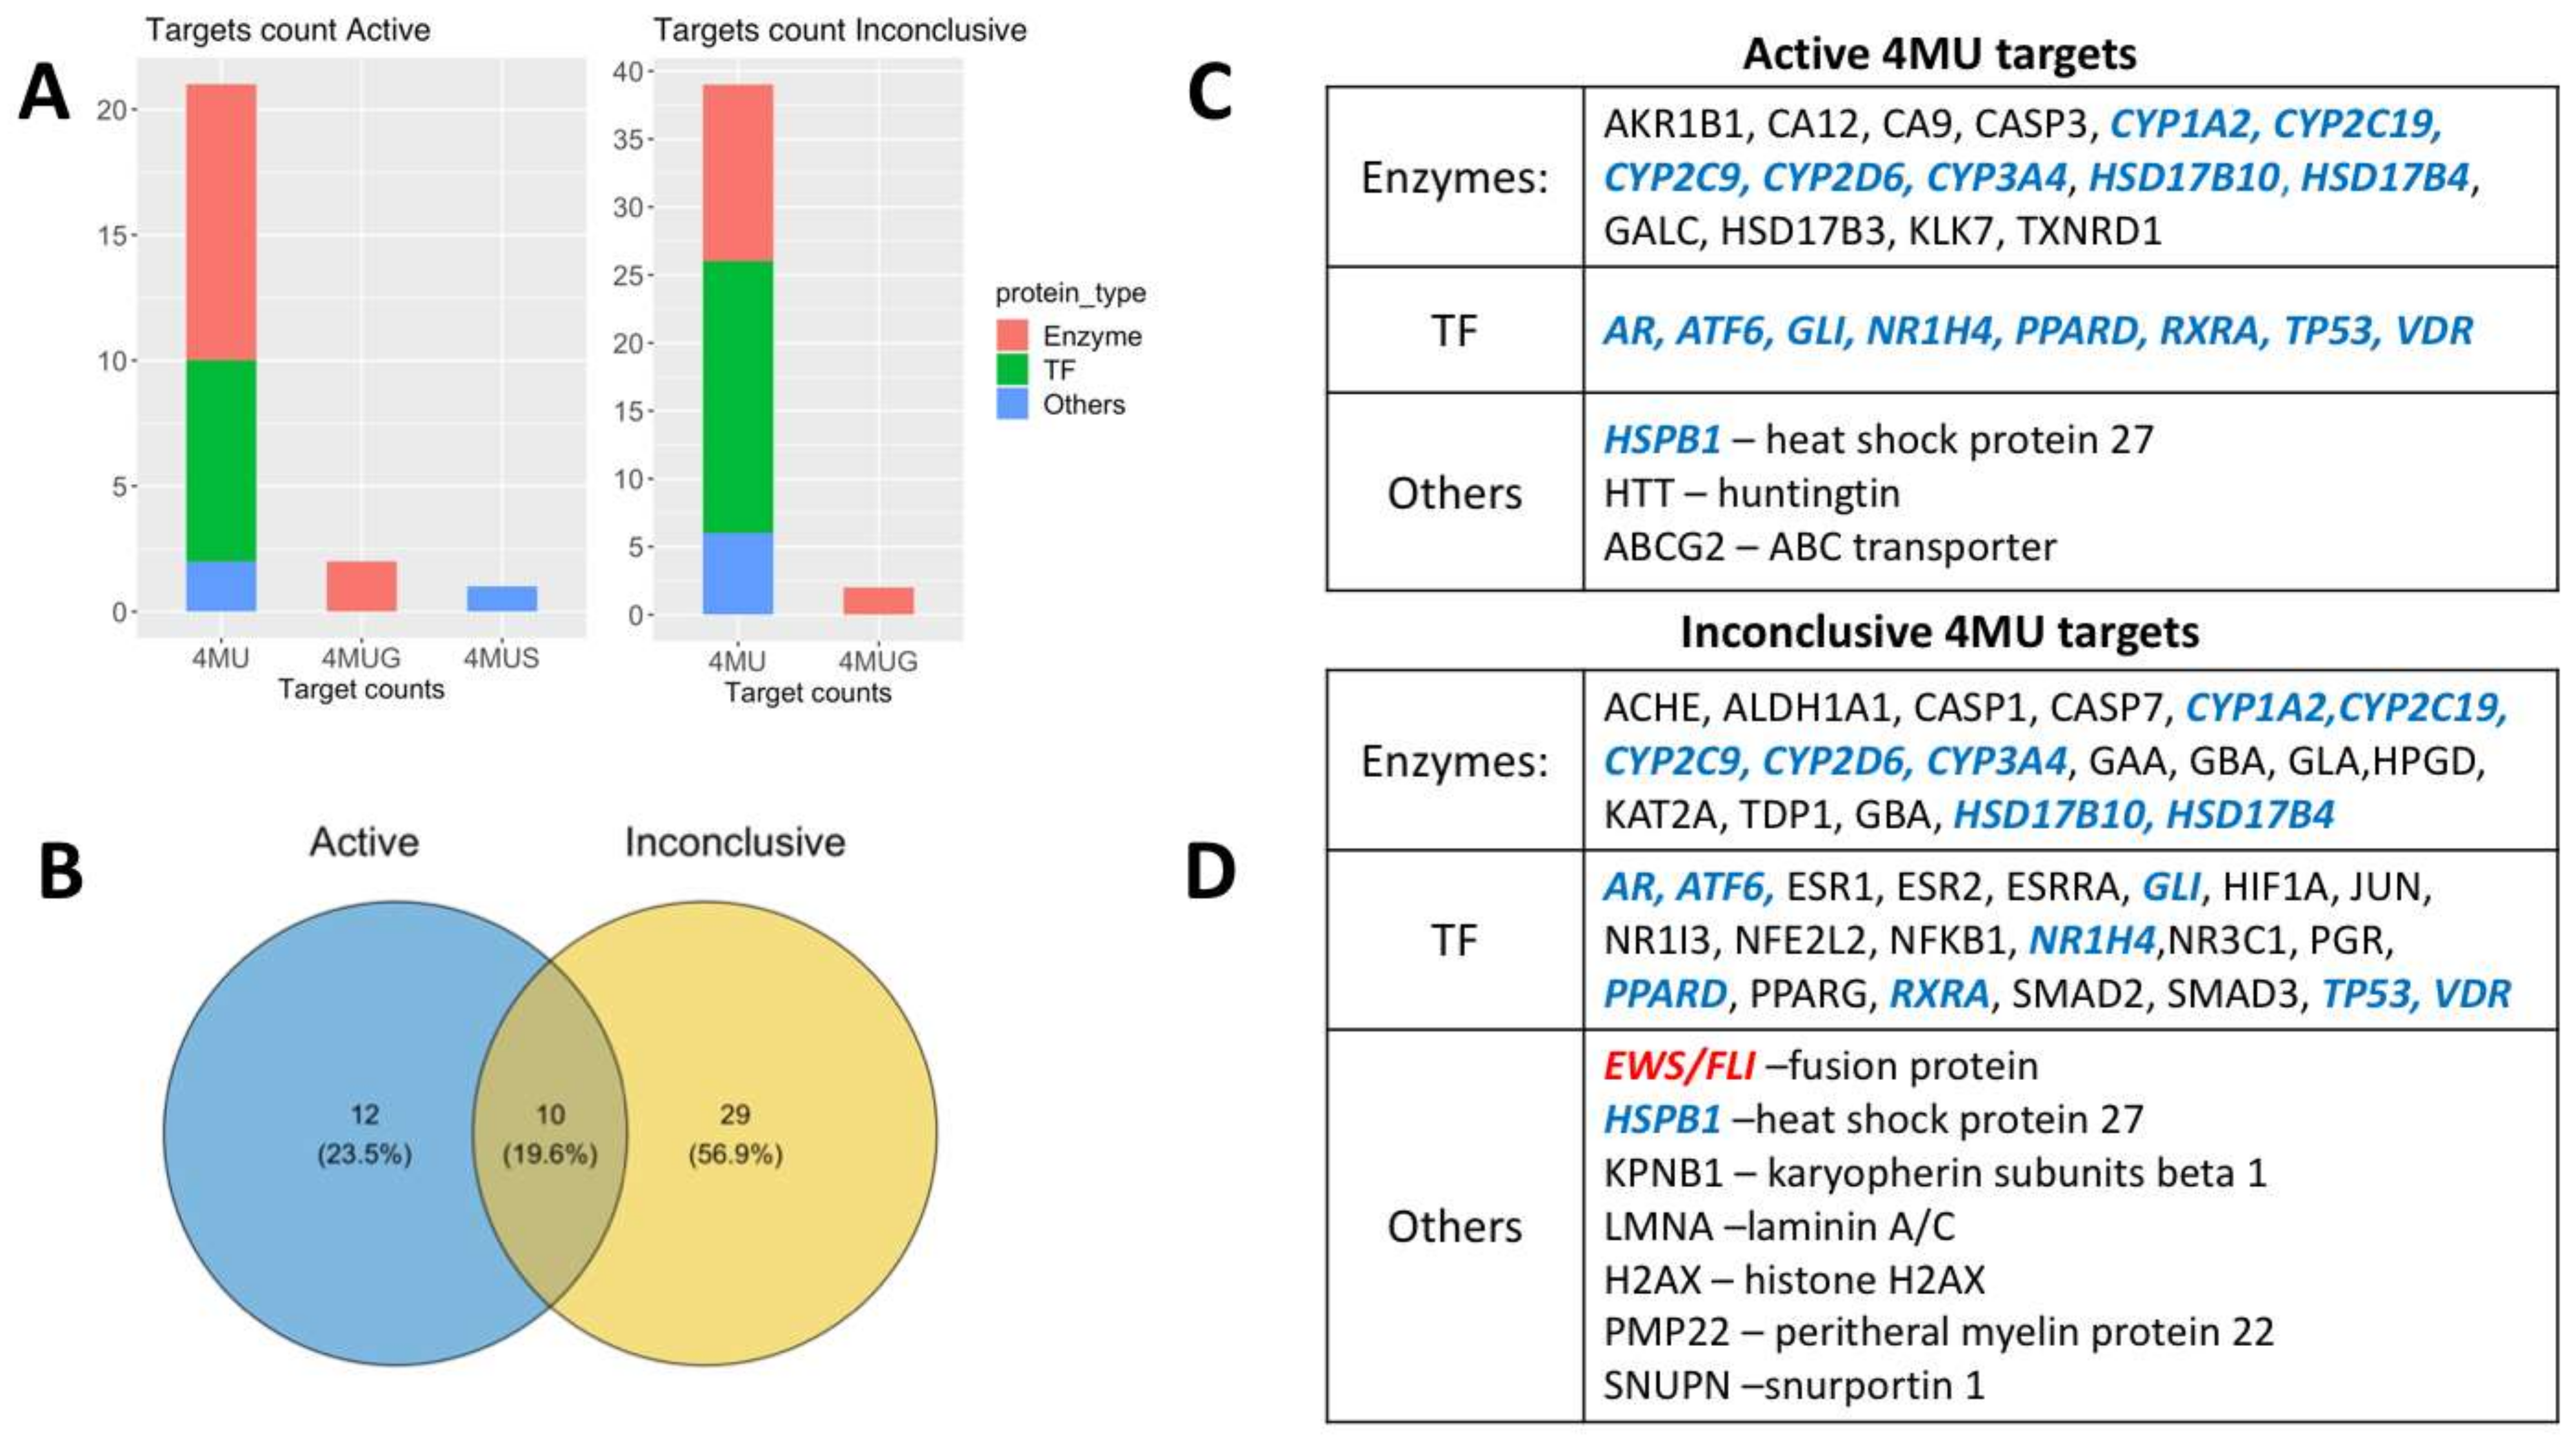
2.1.1. Potential 4MU Biological Targets Revealed by PubChem BioAssay Data
2.1.2. 4MU Target Proteins Revealed by Analysis of Affected Molecular Pathways
- (i)
- Huntingtin protein (HTT) is involved in axonal transport. The mutation of the Huntingtin gene causes Huntington’s disease. Treatment with 4MU leads to cytoprotection in the cell model of Huntington’s disease (PubChem bioassay AID 1471).
- (ii)
- PMP22 is integrated into the myelin sheath of Schwann cells and is involved in Charcot–Marie–Tooth disease. Treatment with 4MU inhibits the PMP22 expression in Swann cells.
- (iii)
- Nuclear Lamin A (LMNA), a nuclear envelope scaffold protein involved in chromatin organisation, remodelling, and double stranded break DNA repair [94]. Mutations in LMNA cause the development of Hutchinson-Gilford syndrome, characterised by early premature ageing. Moreover, 4MU modulates the expression of Lamin A (PubChem Bioassay 1487).
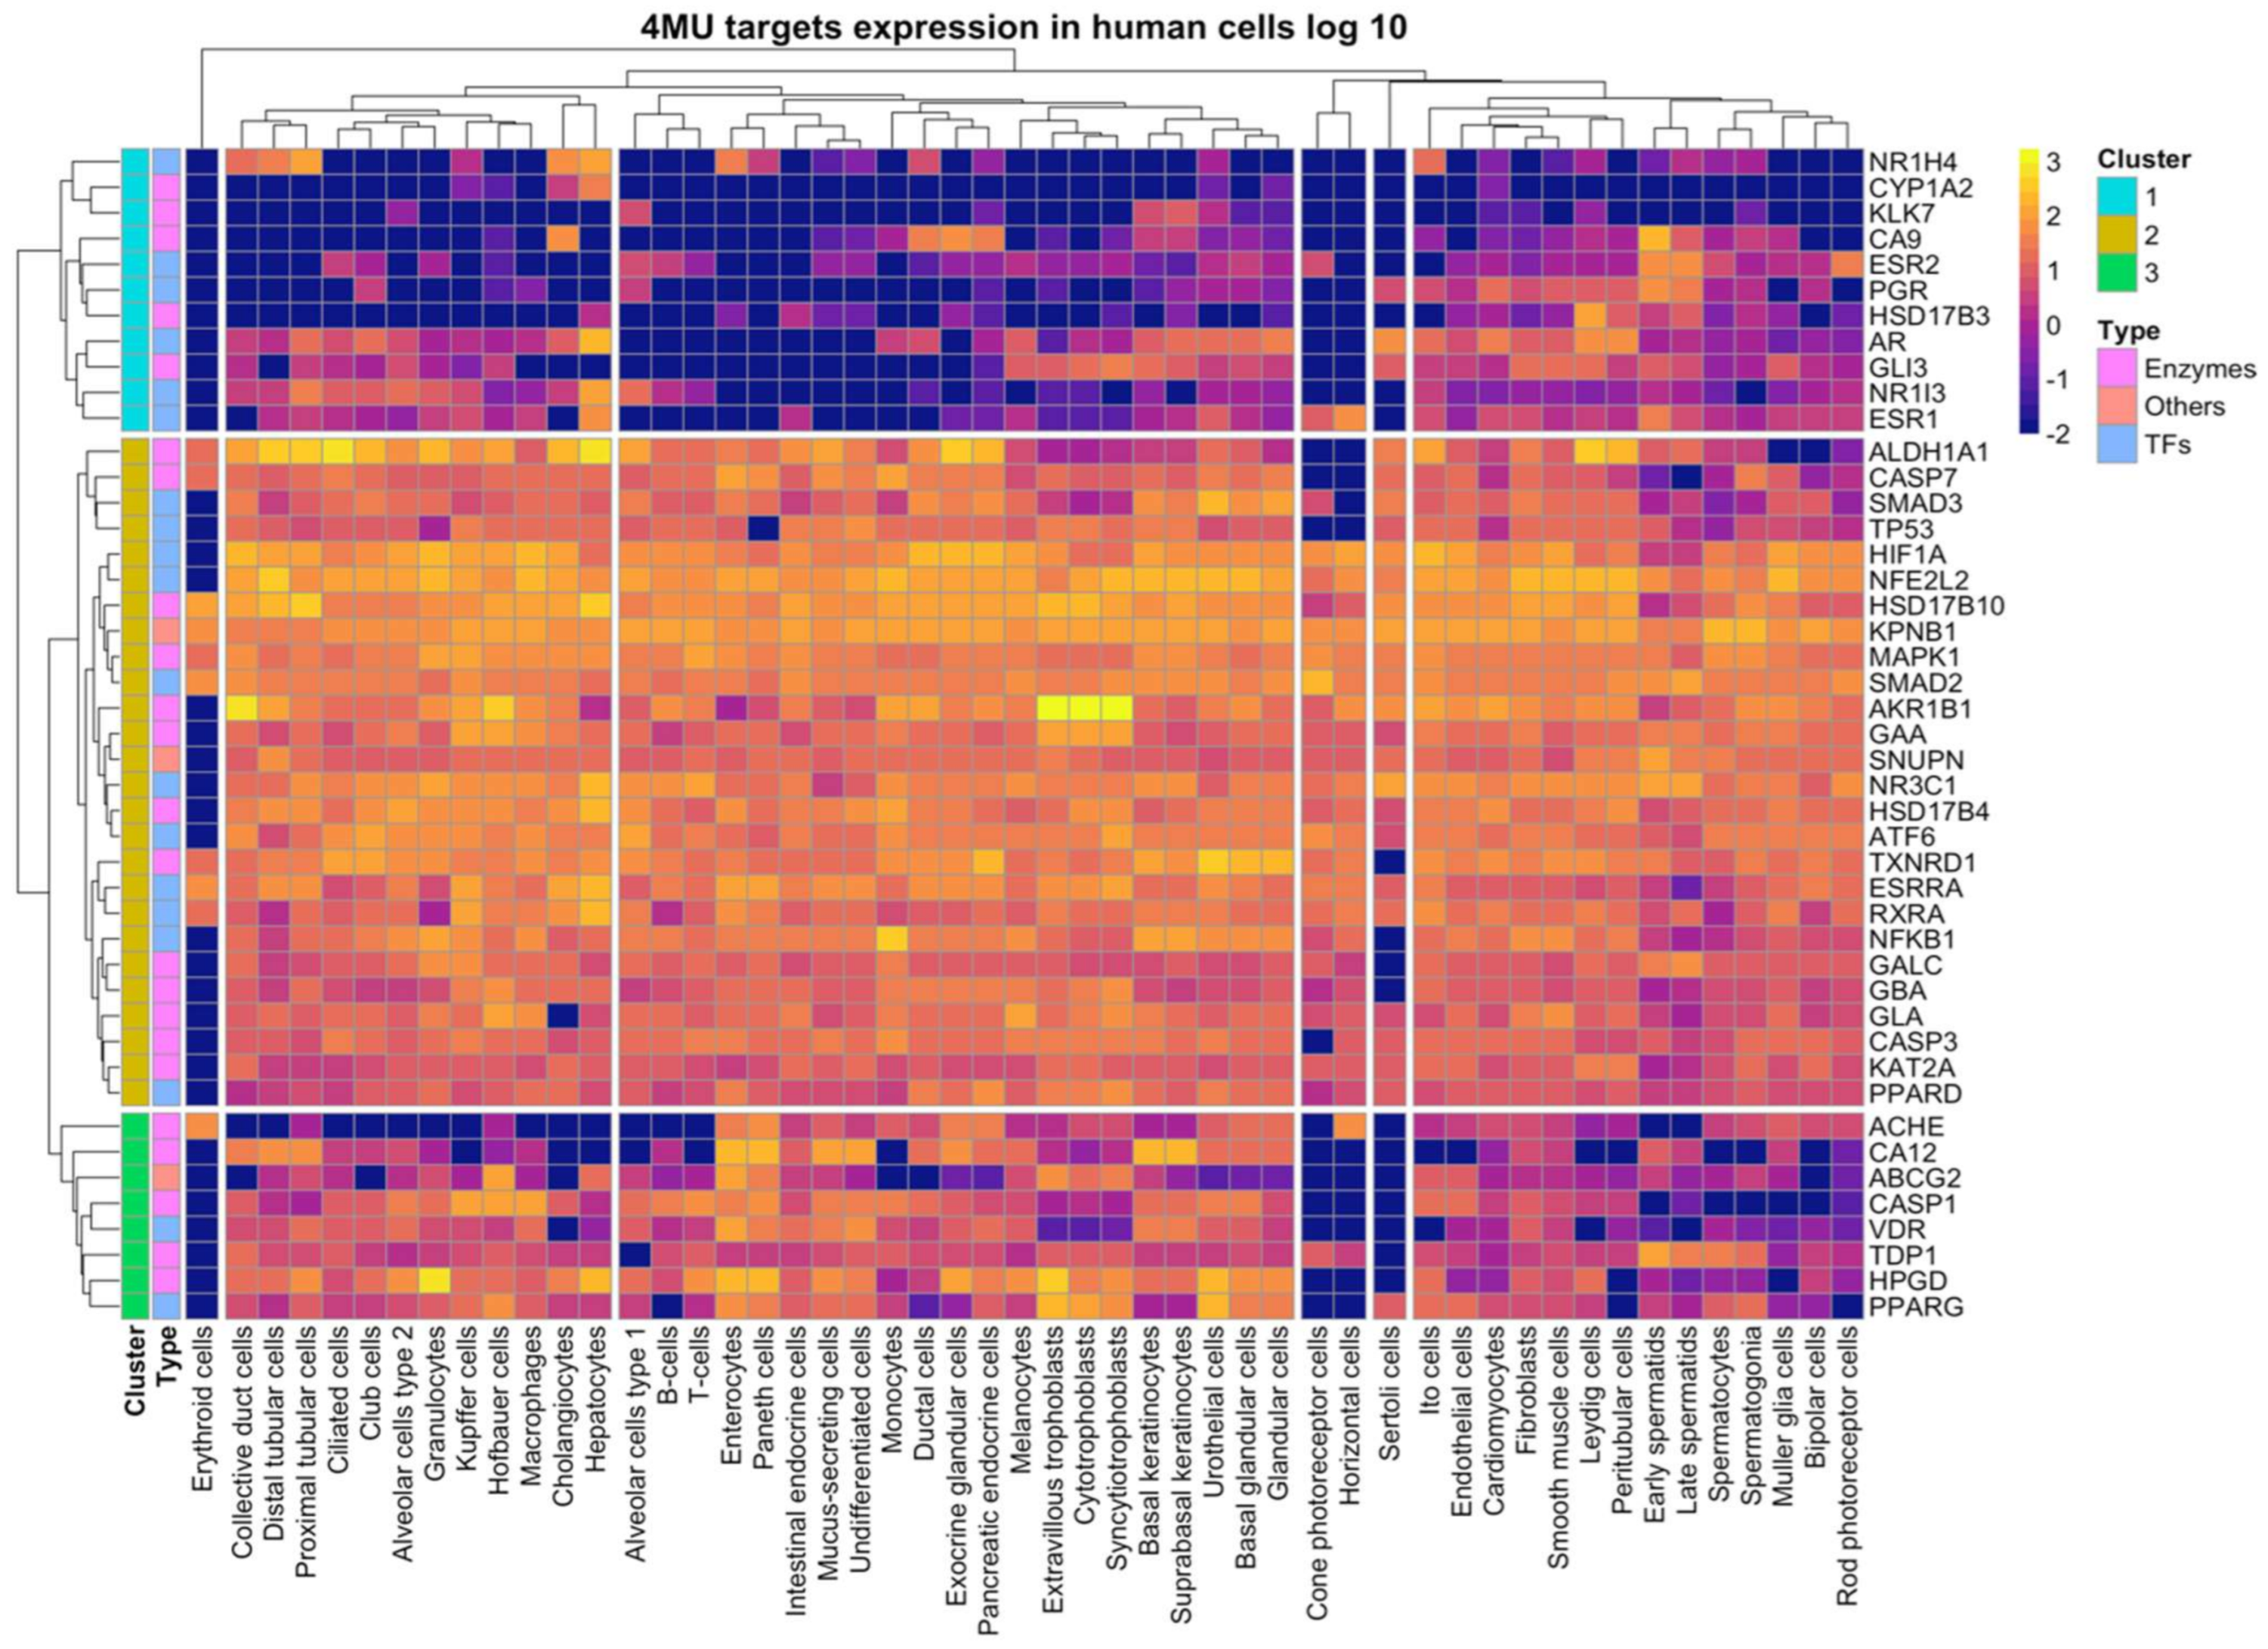
2.1.3. 4MU Target Proteins Revealed by Analysis of Gene Expression in Various Human Cell Types
2.2. Experimental Analysis of 4MU Effect on Liver Transcriptome and Glycogene Storage
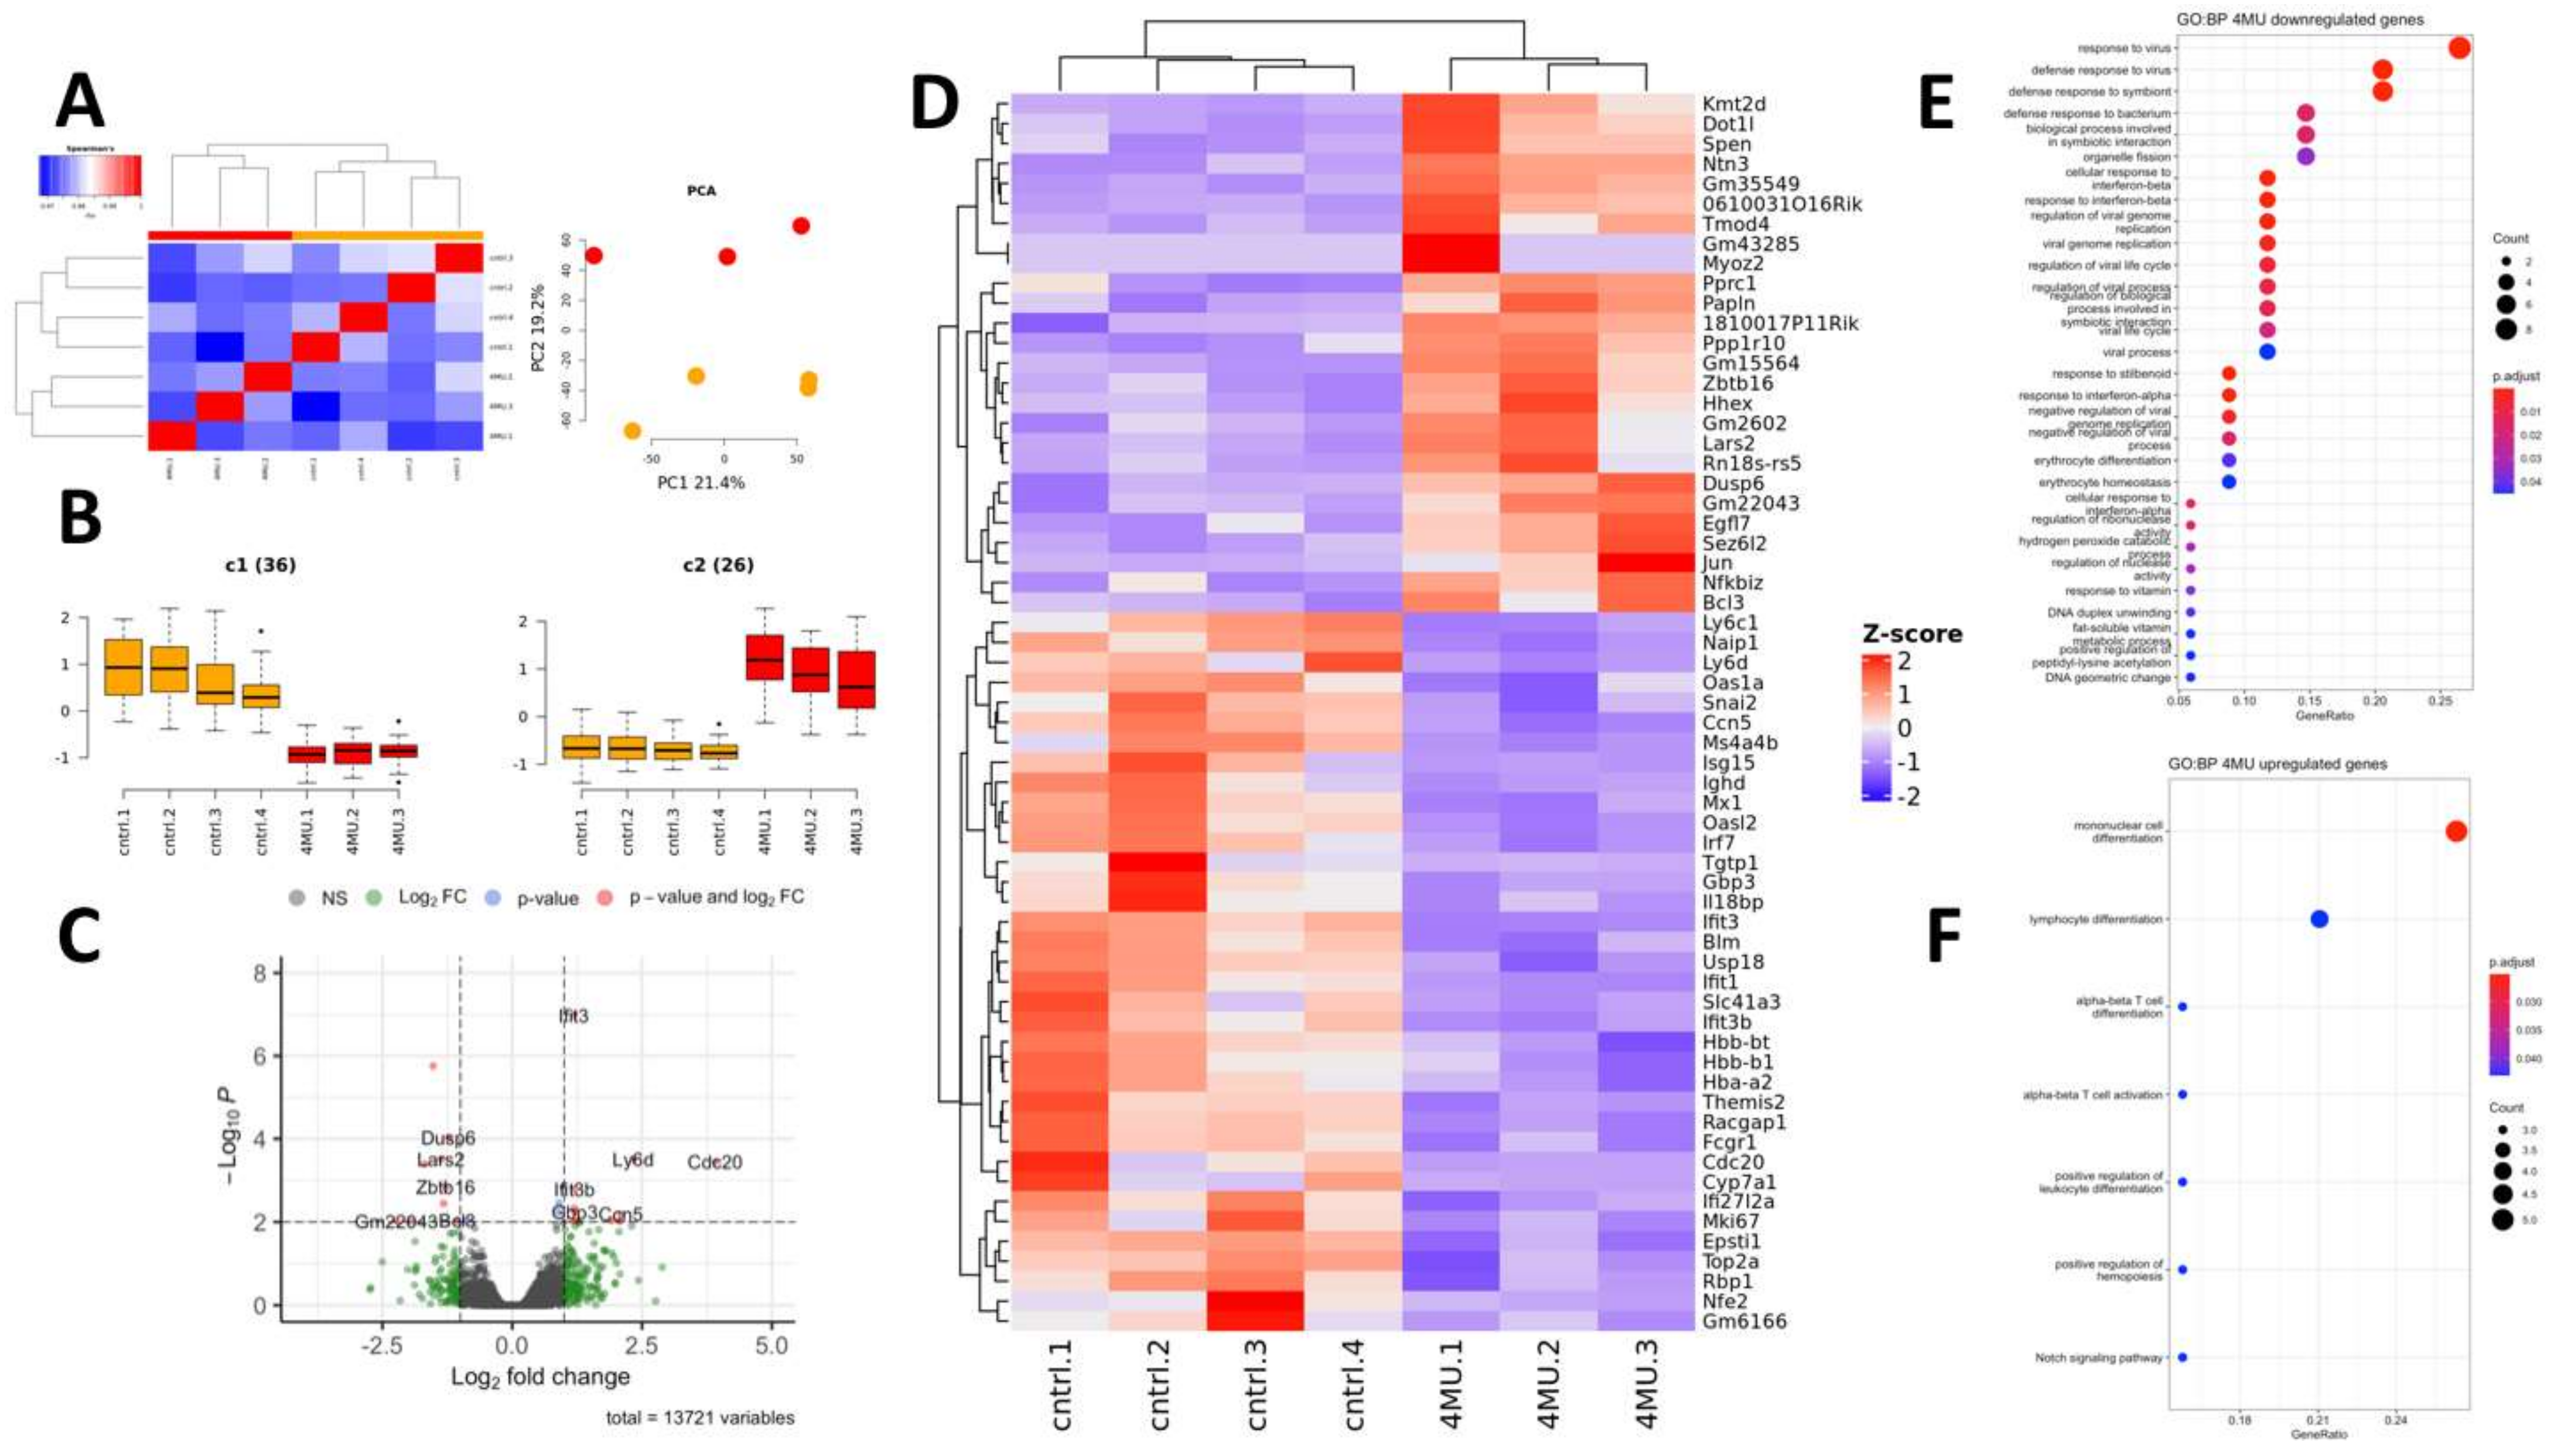
2.2.1. Effect of 4MU Treatment on the Gene Expression Profile of Normal Mouse Liver
2.2.2. Effect of 4MU on Glycogen Storage in the Liver
3. Discussion
4. Materials and Methods
5. Conclusions
Author Contributions
Funding
Institutional Review Board Statement
Informed Consent Statement
Data Availability Statement
Acknowledgments
Conflicts of Interest
References
- Nagy, N.; Kuipers, H.F.; Frymoyer, A.R.; Ishak, H.D.; Bollyky, J.B.; Wight, T.N.; Bollyky, P.L. 4-Methylumbelliferone Treatment and Hyaluronan Inhibition as a Therapeutic Strategy in Inflammation, Autoimmunity, and Cancer. Front. Immunol. 2015, 6, 123. [Google Scholar] [CrossRef] [PubMed]
- Vitale, D.L.; Icardi, A.; Rosales, P.; Spinelli, F.M.; Sevic, I.; Alaniz, L.D. Targeting the Tumor Extracellular Matrix by the Natural Molecule 4-Methylumbelliferone: A Complementary and Alternative Cancer Therapeutic Strategy. Front. Oncol. 2021, 11, 3938. [Google Scholar] [CrossRef] [PubMed]
- Piccioni, F.; Malvicini, M.; Garcia, M.G.; Rodriguez, A.; Atorrasagasti, C.; Kippes, N.; Piedra Buena, I.T.; Rizzo, M.M.; Bayo, J.; Aquino, J.; et al. Antitumor Effects of Hyaluronic Acid Inhibitor 4-Methylumbelliferone in an Orthotopic Hepatocellular Carcinoma Model in Mice. Glycobiology 2012, 22, 400–410. [Google Scholar] [CrossRef] [PubMed]
- Saito, T.; Tamura, D.; Nakamura, T.; Makita, Y.; Ariyama, H.; Komiyama, K.; Yoshihara, T.; Asano, R. 4-Methylumbelliferone Leads to Growth Arrest and Apoptosis in Canine Mammary Tumor Cells. Oncol. Rep. 2013, 29, 335–342. [Google Scholar] [CrossRef]
- Saito, T.; Dai, T.; Asano, R. The Hyaluronan Synthesis Inhibitor 4-Methylumbelliferone Exhibits Antitumor Effects against Mesenchymal-like Canine Mammary Tumor Cells. Oncol. Lett. 2013, 5, 1068–1074. [Google Scholar] [CrossRef]
- Andreichenko, I.N.; Tsitrina, A.A.; Fokin, A.V.; Gabdulkhakova, A.I.; Maltsev, D.I.; Perelman, G.S.; Bulgakova, E.V.; Kulikov, A.M.; Mikaelyan, A.S.; Kotelevtsev, Y.V. 4-Methylumbelliferone Prevents Liver Fibrosis by Affecting Hyaluronan Deposition, FSTL1 Expression and Cell Localization. Int. J. Mol. Sci. 2019, 20, 6301. [Google Scholar] [CrossRef]
- Collum, S.D.; Molina, J.G.; Hanmandlu, A.; Bi, W.; Pedroza, M.; Mertens, T.C.J.; Wareing, N.; Wei, W.; Wilson, C.; Sun, W.; et al. Adenosine and Hyaluronan Promote Lung Fibrosis and Pulmonary Hypertension in Combined Pulmonary Fibrosis and Emphysema. Dis. Model. Mech. 2019, 12, dmm038711. [Google Scholar] [CrossRef]
- Terabe, K.; Ohashi, Y.; Tsuchiya, S.; Ishizuka, S.; Knudson, C.B.; Knudson, W. Chondroprotective Effects of 4-Methylumbelliferone and Hyaluronan Synthase-2 Overexpression Involve Changes in Chondrocyte Energy Metabolism. J. Biol. Chem. 2019, 294, 17799–17817. [Google Scholar] [CrossRef]
- Idota, M.; Ishizuka, S.; Hiraiwa, H.; Yamashita, S.; Oba, H.; Kawamura, Y.; Sakaguchi, T.; Haga, T.; Mizuno, T.; Kawashima, I.; et al. 4-Methylumbelliferone Suppresses Catabolic Activation in Anterior Cruciate Ligament-Derived Cells via a Mechanism Independent of Hyaluronan Inhibition. J. Orthop. Surg. Res. 2021, 16, 507. [Google Scholar] [CrossRef]
- Kakizaki, I.; Takagaki, K.; Endo, Y.; Kudo, D.; Ikeya, H.; Miyoshi, T.; Baggenstoss, B.A.; Tlapak-Simmons, V.L.; Kumari, K.; Nakane, A.; et al. Inhibition of Hyaluronan Synthesis in Streptococcus Equi FM100 by 4-Methylumbelliferone. Eur. J. Biochem. 2002, 269, 5066–5075. [Google Scholar] [CrossRef]
- Nakamura, T.; Funahashi, M.; Takagaki, K.; Munakata, H.; Endo, M.; Tanaka, K.; Saito, Y. Effect of 4-Methylumbelliferone on Cell-Free Synthesis of Hyaluronic Acid. IUBMB Life 1997, 43, 263–268. [Google Scholar] [CrossRef]
- Kultti, A.; Pasonen-Seppänen, S.; Jauhiainen, M.; Rilla, K.J.; Kärnä, R.; Pyöriä, E.; Tammi, R.H.; Tammi, M.I. 4-Methylumbelliferone Inhibits Hyaluronan Synthesis by Depletion of Cellular UDP-Glucuronic Acid and Downregulation of Hyaluronan Synthase 2 and 3. Exp. Cell Res. 2009, 315, 1914–1923. [Google Scholar] [CrossRef]
- Nagy, N.; Gurevich, I.; Kuipers, H.F.; Ruppert, S.M.; Marshall, P.L.; Xie, B.J.; Sun, W.; Malkovskiy, A.V.; Rajadas, J.; Grandoch, M.; et al. 4-Methylumbelliferyl Glucuronide Contributes to Hyaluronan Synthesis Inhibition. J. Biol. Chem. 2019, 294, 7864–7877. [Google Scholar] [CrossRef]
- Gandhi, N.S.; Mancera, R.L. The Structure of Glycosaminoglycans and Their Interactions with Proteins. Chem. Biol. Drug Des. 2008, 72, 455–482. [Google Scholar] [CrossRef]
- Rilla, K.; Pasonen-Seppänen, S.; Rieppo, J.; Tammi, M.; Tammi, R. The Hyaluronan Synthesis Inhibitor 4-Methylumbelliferone Prevents Keratinocyte Activation and Epidermal Hyperproliferation Induced by Epidermal Growth Factor. J. Investig. Dermatol. 2004, 123, 708–714. [Google Scholar] [CrossRef]
- Tsitrina, A.A.; Krasylov, I.V.; Maltsev, D.I.; Andreichenko, I.N.; Moskvina, V.S.; Ivankov, D.N.; Bulgakova, E.V.; Nesterchuk, M.; Shashkovskaya, V.; Dashenkova, N.O.; et al. Inhibition of Hyaluronan Secretion by Novel Coumarin Compounds and Chitin Synthesis Inhibitors. Glycobiology 2021, 31, 959–974. [Google Scholar] [CrossRef]
- Kuipers, H.F.; Rieck, M.; Gurevich, I.; Nagy, N.; Butte, M.J.; Negrin, R.S.; Wight, T.N.; Steinman, L.; Bollyky, P.L. Hyaluronan Synthesis Is Necessary for Autoreactive T-Cell Trafficking, Activation, and Th1 Polarization. Proc. Natl. Acad. Sci. USA 2016, 113, 1339–1344. [Google Scholar] [CrossRef]
- McKallip, R.J.; Ban, H.; Uchakina, O.N. Treatment with the Hyaluronic Acid Synthesis Inhibitor 4-Methylumbelliferone Suppresses LPS-Induced Lung Inflammation. Inflammation 2015, 38, 1250–1259. [Google Scholar] [CrossRef]
- Sim, M.-O.; Ham, J.R.; Lee, H.-I.; Seo, K.-I.; Lee, M.-K. Long-Term Supplementation of Umbelliferone and 4-Methylumbelliferone Alleviates High-Fat Diet Induced Hypertriglyceridemia and Hyperglycemia in Mice. Chem.-Biol. Interact. 2014, 216, 9–16. [Google Scholar] [CrossRef]
- Grandoch, M.; Flögel, U.; Virtue, S.; Maier, J.K.; Jelenik, T.; Kohlmorgen, C.; Feldmann, K.; Ostendorf, Y.; Castañeda, T.R.; Zhou, Z.; et al. 4-Methylumbelliferone Improves the Thermogenic Capacity of Brown Adipose Tissue. Nat. Metab. 2019, 1, 546–559. [Google Scholar] [CrossRef]
- Nagy, N.; Kaber, G.; Johnson, P.Y.; Gebe, J.A.; Preisinger, A.; Falk, B.A.; Sunkari, V.G.; Gooden, M.D.; Vernon, R.B.; Bogdani, M.; et al. Inhibition of Hyaluronan Synthesis Restores Immune Tolerance during Autoimmune Insulitis. J. Clin. Investig. 2015, 125, 3928–3940. [Google Scholar] [CrossRef] [PubMed]
- Mueller, A.M.; Yoon, B.H.; Sadiq, S.A. Inhibition of Hyaluronan Synthesis Protects against Central Nervous System (CNS) Autoimmunity and Increases CXCL12 Expression in the Inflamed CNS. J. Biol. Chem. 2014, 289, 22888–22899. [Google Scholar] [CrossRef] [PubMed]
- Yoshioka, Y.; Kozawa, E.; Urakawa, H.; Arai, E.; Futamura, N.; Zhuo, L.; Kimata, K.; Ishiguro, N.; Nishida, Y. Suppression of Hyaluronan Synthesis Alleviates Inflammatory Responses in Murine Arthritis and in Human Rheumatoid Synovial Fibroblasts. Arthritis Rheum. 2013, 65, 1160–1170. [Google Scholar] [CrossRef] [PubMed]
- Bollyky, P.L.; Evanko, S.P.; Wu, R.P.; Potter-Perigo, S.; Long, S.A.; Kinsella, B.; Reijonen, H.; Guebtner, K.; Teng, B.; Chan, C.K.; et al. Th1 Cytokines Promote T-Cell Binding to Antigen-Presenting Cells via Enhanced Hyaluronan Production and Accumulation at the Immune Synapse. Cell. Mol. Immunol. 2010, 7, 211–220. [Google Scholar] [CrossRef]
- Mahaffey, C.L.; Mummert, M.E. Hyaluronan Synthesis Is Required for IL-2-Mediated T Cell Proliferation. J. Immunol. 2007, 179, 8191–8199. [Google Scholar] [CrossRef]
- Rodríguez, M.M.; Onorato, A.; Cantero, M.J.; Domínguez, L.; Bayo, J.; Fiore, E.; García, M.; Atorrasagasti, C.; Canbay, A.; Malvicini, M.; et al. 4-Methylumbelliferone-Mediated Polarization of M1 Macrophages Correlate with Decreased Hepatocellular Carcinoma Aggressiveness in Mice. Sci. Rep. 2021, 11, 6310. [Google Scholar] [CrossRef]
- Abildgaard, C.; Rizza, S.; Christiansen, H.; Schmidt, S.; Dahl, C.; Abdul-Al, A.; Christensen, A.; Filomeni, G.; Guldberg, P. Screening of Metabolic Modulators Identifies New Strategies to Target Metabolic Reprogramming in Melanoma. Sci. Rep. 2021, 11, 4390. [Google Scholar] [CrossRef]
- PubChem Statistics. Available online: https://pubchemdocs.ncbi.nlm.nih.gov/statistics (accessed on 1 June 2022).
- Soreq, H.; Seidman, S. Acetylcholinesterase—New Roles for an Old Actor. Nat. Rev. Neurosci. 2001, 2, 294–302. [Google Scholar] [CrossRef]
- Khayami, R.; Hashemi, S.R.; Kerachian, M.A. Role of Aldo-Keto Reductase Family 1 Member B1 (AKR1B1) in the Cancer Process and Its Therapeutic Potential. J. Cell. Mol. Med. 2020, 24, 8890–8902. [Google Scholar] [CrossRef]
- Petrosino, J.M.; DiSilvestro, D.; Ziouzenkova, O. Aldehyde Dehydrogenase 1A1: Friend or Foe to Female Metabolism? Nutrients 2014, 6, 950–973. [Google Scholar] [CrossRef]
- Doyen, J.; Parks, S.; Marcié, S.; Pouysségur, J.; Chiche, J. Knock-down of Hypoxia-Induced Carbonic Anhydrases IX and XII Radiosensitizes Tumor Cells by Increasing Intracellular Acidosis. Front. Oncol. 2013, 2, 199. [Google Scholar] [CrossRef]
- Pastorekova, S.; Gillies, R.J. The Role of Carbonic Anhydrase IX in Cancer Development: Links to Hypoxia, Acidosis, and Beyond. Cancer Metastasis Rev. 2019, 38, 65–77. [Google Scholar] [CrossRef]
- Supuran, C.T. Carbonic Anhydrases: Novel Therapeutic Applications for Inhibitors and Activators. Nat. Rev. Drug Discov. 2008, 7, 168–181. [Google Scholar] [CrossRef]
- Thornberry, N.A.; Bull, H.G.; Calaycay, J.R.; Chapman, K.T.; Howard, A.D.; Kostura, M.J.; Miller, D.K.; Molineaux, S.M.; Weidner, J.R.; Aunins, J.; et al. A Novel Heterodimeric Cysteine Protease Is Required for Interleukin-1βprocessing in Monocytes. Nature 1992, 356, 768–774. [Google Scholar] [CrossRef]
- Gaggero, A.; Ambrosis, A.D.; Mezzanzanica, D.; Piazza, T.; Rubartelli, A.; Figini, M.; Canevari, S.; Ferrini, S. A Novel Isoform of Pro-Interleukin-18 Expressed in Ovarian Tumors Is Resistant to Caspase-1 and -4 Processing. Oncogene 2004, 23, 7552–7560. [Google Scholar] [CrossRef]
- Ball, D.P.; Taabazuing, C.Y.; Griswold, A.R.; Orth, E.L.; Rao, S.D.; Kotliar, I.B.; Vostal, L.E.; Johnson, D.C.; Bachovchin, D.A. Caspase-1 Interdomain Linker Cleavage Is Required for Pyroptosis. Life Sci. Alliance 2020, 3, 1–11. [Google Scholar] [CrossRef]
- Nicholson, D.W.; Ali, A.; Thornberry, N.A.; Vaillancourt, J.P.; Ding, C.K.; Gallant, M.; Gareau, Y.; Griffin, P.R.; Labelle, M.; Lazebnik, Y.A. Identification and Inhibition of the ICE/CED-3 Protease Necessary for Mammalian Apoptosis. Nature 1995, 376, 37–43. [Google Scholar] [CrossRef]
- Thorn, C.F.; Aklillu, E.; Klein, T.E.; Altman, R.B. PharmGKB Summary: Very Important Pharmacogene Information for CYP1A2. Pharm. Genom. 2012, 22, 73–77. [Google Scholar] [CrossRef]
- Zhou, S.-F.; Yang, L.-P.; Zhou, Z.-W.; Liu, Y.-H.; Chan, E. Insights into the Substrate Specificity, Inhibitors, Regulation, and Polymorphisms and the Clinical Impact of Human Cytochrome P450 1A2. AAPS J. 2009, 11, 481–494. [Google Scholar] [CrossRef]
- Roig-Zamboni, V.; Cobucci-Ponzano, B.; Iacono, R.; Ferrara, M.C.; Germany, S.; Bourne, Y.; Parenti, G.; Moracci, M.; Sulzenbacher, G. Structure of Human Lysosomal Acid α-Glucosidase–a Guide for the Treatment of Pompe Disease. Nat. Commun. 2017, 8, 1111. [Google Scholar] [CrossRef]
- Paciotti, S.; Albi, E.; Parnetti, L.; Beccari, T. Lysosomal Ceramide Metabolism Disorders: Implications in Parkinson’s Disease. J. Clin. Med. 2020, 9, 594. [Google Scholar] [CrossRef] [PubMed]
- Wendell, S.G.; Golin-Bisello, F.; Wenzel, S.; Sobol, R.W.; Holguin, F.; Freeman, B.A. 15-Hydroxyprostaglandin Dehydrogenase Generation of Electrophilic Lipid Signaling Mediators from Hydroxy ω-3 Fatty Acids. J. Biol. Chem. 2015, 290, 5868–5880. [Google Scholar] [CrossRef] [PubMed]
- Yang, S.-Y.; He, X.-Y.; Miller, D. HSD17B10: A Gene Involved in Cognitive Function through Metabolism of Isoleucine and Neuroactive Steroids. Mol. Genet. Metab. 2007, 92, 36–42. [Google Scholar] [CrossRef] [PubMed]
- Zschocke, J.; Ruiter, J.P.; Brand, J.; Lindner, M.; Hoffmann, G.F.; Wanders, R.J.; Mayatepek, E. Progressive Infantile Neurodegeneration Caused by 2-Methyl-3-Hydroxybutyryl-CoA Dehydrogenase Deficiency: A Novel Inborn Error of Branched-Chain Fatty Acid and Isoleucine Metabolism. Pediatr. Res. 2000, 48, 852–855. [Google Scholar] [CrossRef]
- Mendonca, B.B.; Gomes, N.L.; Costa, E.M.F.; Inacio, M.; Martin, R.M.; Nishi, M.Y.; Carvalho, F.M.; Tibor, F.D.; Domenice, S. 46,XY Disorder of Sex Development (DSD) Due to 17β-Hydroxysteroid Dehydrogenase Type 3 Deficiency. J. Steroid Biochem. Mol. Biol. 2017, 165, 79–85. [Google Scholar] [CrossRef]
- Rebourcet, D.; Mackay, R.; Darbey, A.; Curley, M.K.; Jørgensen, A.; Frederiksen, H.; Mitchell, R.T.; O’Shaughnessy, P.J.; Nef, S.; Smith, L.B. Ablation of the Canonical Testosterone Production Pathway via Knockout of the Steroidogenic Enzyme HSD17B3, Reveals a Novel Mechanism of Testicular Testosterone Production. FASEB J. 2020, 34, 10373–10386. [Google Scholar] [CrossRef]
- Violante, S.; Achetib, N.; van Roermund, C.W.T.; Hagen, J.; Dodatko, T.; Vaz, F.M.; Waterham, H.R.; Chen, H.; Baes, M.; Yu, C.; et al. Peroxisomes Can Oxidize Medium- and Long-Chain Fatty Acids through a Pathway Involving ABCD3 and HSD17B4. FASEB J. 2019, 33, 4355–4364. [Google Scholar] [CrossRef]
- Wang, Y.; Guo, Y.R.; Liu, K.; Yin, Z.; Liu, R.; Xia, Y.; Tan, L.; Yang, P.; Lee, J.-H.; Li, X.-J.; et al. KAT2A Coupled with the α-KGDH Complex Acts as a Histone H3 Succinyltransferase. Nature 2017, 552, 273–277. [Google Scholar] [CrossRef]
- Zieger, K.; Weiner, J.; Kunath, A.; Gericke, M.; Krause, K.; Kern, M.; Stumvoll, M.; Klöting, N.; Blüher, M.; Heiker, J.T. Ablation of Kallikrein 7 (KLK7) in Adipose Tissue Ameliorates Metabolic Consequences of High Fat Diet-Induced Obesity by Counteracting Adipose Tissue Inflammation in Vivo. Cell. Mol. Life Sci. 2018, 75, 727–742. [Google Scholar] [CrossRef]
- Kunath, A.; Weiner, J.; Krause, K.; Rehders, M.; Pejkovska, A.; Gericke, M.; Biniossek, M.L.; Dommel, S.; Kern, M.; Ribas-Latre, A.; et al. Role of Kallikrein 7 in Body Weight and Fat Mass Regulation. Biomedicines 2021, 9, 131. [Google Scholar] [CrossRef]
- Cargnello, M.; Roux, P.P. Activation and Function of the MAPKs and Their Substrates, the MAPK-Activated Protein Kinases. Microbiol. Mol. Biol. Rev. 2011, 75, 50–83. [Google Scholar] [CrossRef]
- Interthal, H.; Chen, H.J.; Champoux, J.J. Human Tdp1 Cleaves a Broad Spectrum of Substrates, Including Phosphoamide Linkages. J. Biol. Chem. 2005, 280, 36518–36528. [Google Scholar] [CrossRef]
- Hofman, E.R.; Boyanapalli, M.; Lindner, D.J.; Weihua, X.; Hassel, B.A.; Jagus, R.; Gutierrez, P.L.; Kalvakolanu, D.V. Thioredoxin Reductase Mediates Cell Death Effects of the Combination of Beta Interferon and Retinoic Acid. Mol. Cell. Biol. 1998, 18, 6493–6504. [Google Scholar] [CrossRef]
- Yu, I.-C.; Lin, H.-Y.; Sparks, J.D.; Yeh, S.; Chang, C. Androgen Receptor Roles in Insulin Resistance and Obesity in Males: The Linkage of Androgen-Deprivation Therapy to Metabolic Syndrome. Diabetes 2014, 63, 3180–3188. [Google Scholar] [CrossRef]
- Kovats, S. Estrogen Receptors Regulate Innate Immune Cells and Signaling Pathways. Cell. Immunol. 2015, 294, 63–69. [Google Scholar] [CrossRef]
- Masuyama, H.; Hiramatsu, Y. Potential Role of Estradiol and Progesterone in Insulin Resistance through Constitutive Androstane Receptor. J. Mol. Endocrinol. 2011, 47, 229–239. [Google Scholar] [CrossRef]
- DeZwaan-McCabe, D.; Sheldon, R.D.; Gorecki, M.C.; Guo, D.-F.; Gansemer, E.R.; Kaufman, R.J.; Rahmouni, K.; Gillum, M.P.; Taylor, E.B.; Teesch, L.M.; et al. ER Stress Inhibits Liver Fatty Acid Oxidation While Unmitigated Stress Leads to Anorexia-Induced Lipolysis and Both Liver and Kidney Steatosis. Cell Rep. 2017, 19, 1794–1806. [Google Scholar] [CrossRef]
- Chen, X.; Zhang, F.; Gong, Q.; Cui, A.; Zhuo, S.; Hu, Z.; Han, Y.; Gao, J.; Sun, Y.; Liu, Z.; et al. Hepatic ATF6 Increases Fatty Acid Oxidation to Attenuate Hepatic Steatosis in Mice Through Peroxisome Proliferator–Activated Receptor α. Diabetes 2016, 65, 1904–1915. [Google Scholar] [CrossRef]
- Wang, Y.; Vera, L.; Fischer, W.H.; Montminy, M. The CREB Coactivator CRTC2 Links Hepatic ER Stress and Fasting Gluconeogenesis. Nature 2009, 460, 534–537. [Google Scholar] [CrossRef]
- Matissek, S.J.; Elsawa, S.F. GLI3: A Mediator of Genetic Diseases, Development and Cancer. Cell Commun. Signal. 2020, 18, 54. [Google Scholar] [CrossRef]
- Matz-Soja, M.; Rennert, C.; Schönefeld, K.; Aleithe, S.; Boettger, J.; Schmidt-Heck, W.; Weiss, T.S.; Hovhannisyan, A.; Zellmer, S.; Klöting, N.; et al. Hedgehog Signaling Is a Potent Regulator of Liver Lipid Metabolism and Reveals a GLI-Code Associated with Steatosis. eLife 2016, 5, e13308. [Google Scholar] [CrossRef] [PubMed]
- Masoud, G.N.; Li, W. HIF-1α Pathway: Role, Regulation and Intervention for Cancer Therapy. Acta Pharm. Sin. B 2015, 5, 378–389. [Google Scholar] [CrossRef]
- Huppke, P.; Weissbach, S.; Church, J.A.; Schnur, R.; Krusen, M.; Dreha-Kulaczewski, S.; Kühn-Velten, W.N.; Wolf, A.; Huppke, B.; Millan, F.; et al. Activating de Novo Mutations in NFE2L2 Encoding NRF2 Cause a Multisystem Disorder. Nat. Commun. 2017, 8, 818. [Google Scholar] [CrossRef] [PubMed]
- Liu, T.; Zhang, L.; Joo, D.; Sun, S.-C. NF-ΚB Signaling in Inflammation. Signal Transduct. Target. Ther. 2017, 2, 1–9. [Google Scholar] [CrossRef] [PubMed]
- Ma, K.; Saha, P.K.; Chan, L.; Moore, D.D. Farnesoid X Receptor Is Essential for Normal Glucose Homeostasis. J. Clin. Investig. 2006, 116, 1102–1109. [Google Scholar] [CrossRef]
- Shen, L.-L.; Liu, H.; Peng, J.; Gan, L.; Lu, L.; Zhang, Q.; Li, L.; He, F.; Jiang, Y. Effects of Farnesoid X Receptor on the Expression of the Fatty Acid Synthetase and Hepatic Lipase. Mol. Biol. Rep. 2011, 38, 553–559. [Google Scholar] [CrossRef]
- Stayrook, K.R.; Bramlett, K.S.; Savkur, R.S.; Ficorilli, J.; Cook, T.; Christe, M.E.; Michael, L.F.; Burris, T.P. Regulation of Carbohydrate Metabolism by the Farnesoid X Receptor. Endocrinology 2005, 146, 984–991. [Google Scholar] [CrossRef]
- Pustylnyak, Y.A.; Gulyaeva, L.F.; Pustylnyak, V.O. Noncanonical Constitutive Androstane Receptor Signaling in Gene Regulation. Int. J. Mol. Sci. 2020, 21, 6735. [Google Scholar] [CrossRef]
- Escoter-Torres, L.; Caratti, G.; Mechtidou, A.; Tuckermann, J.; Uhlenhaut, N.H.; Vettorazzi, S. Fighting the Fire: Mechanisms of Inflammatory Gene Regulation by the Glucocorticoid Receptor. Front. Immunol. 2019, 10, 1859. [Google Scholar] [CrossRef]
- Peters, J.M.; Shah, Y.M.; Gonzalez, F.J. The Role of Peroxisome Proliferator-Activated Receptors in Carcinogenesis and Chemoprevention. Nat. Rev. Cancer 2012, 12, 181–195. [Google Scholar] [CrossRef]
- Ma, F.; Liu, S.-Y.; Razani, B.; Arora, N.; Li, B.; Kagechika, H.; Tontonoz, P.; Núñez, V.; Ricote, M.; Cheng, G. Retinoid X Receptor α Attenuates Host Antiviral Response by Suppressing Type I Interferon. Nat. Commun. 2014, 5, 5494. [Google Scholar] [CrossRef]
- Ma, X.; Warnier, M.; Raynard, C.; Ferrand, M.; Kirsh, O.; Defossez, P.-A.; Martin, N.; Bernard, D. The Nuclear Receptor RXRA Controls Cellular Senescence by Regulating Calcium Signaling. Aging Cell 2018, 17, e12831. [Google Scholar] [CrossRef]
- Massagué, J.; Wotton, D. Transcriptional Control by the TGF-Beta/Smad Signaling System. EMBO J. 2000, 19, 1745–1754. [Google Scholar] [CrossRef]
- Blank, U.; Karlsson, S. The Role of Smad Signaling in Hematopoiesis and Translational Hematology. Leukemia 2011, 25, 1379–1388. [Google Scholar] [CrossRef]
- Zou, M.-L.; Chen, Z.-H.; Teng, Y.-Y.; Liu, S.-Y.; Jia, Y.; Zhang, K.-W.; Sun, Z.-L.; Wu, J.-J.; Yuan, Z.-D.; Feng, Y.; et al. The Smad Dependent TGF-β and BMP Signaling Pathway in Bone Remodeling and Therapies. Front. Mol. Biosci. 2021, 8, 593310. [Google Scholar] [CrossRef]
- Aubrey, B.J.; Strasser, A.; Kelly, G.L. Tumor-Suppressor Functions of the TP53 Pathway. Cold Spring Harb. Perspect. Med. 2016, 6, a026062. [Google Scholar] [CrossRef]
- Lin, R. Crosstalk between Vitamin D Metabolism, VDR Signalling, and Innate Immunity. Biomed. Res. Int. 2016, 2016, 1375858. [Google Scholar] [CrossRef]
- Kongsbak, M.; Levring, T.B.; Geisler, C.; von Essen, M.R. The Vitamin D Receptor and T Cell Function. Front. Immunol. 2013, 4, 148. [Google Scholar] [CrossRef]
- Taylor, N.M.I.; Manolaridis, I.; Jackson, S.M.; Kowal, J.; Stahlberg, H.; Locher, K.P. Structure of the Human Multidrug Transporter ABCG2. Nature 2017, 546, 504–509. [Google Scholar] [CrossRef]
- Dickey, J.S.; Redon, C.E.; Nakamura, A.J.; Baird, B.J.; Sedelnikova, O.A.; Bonner, W.M. H2AX: Functional Roles and Potential Applications. Chromosoma 2009, 118, 683–692. [Google Scholar] [CrossRef]
- Arrigo, A.-P. Mammalian HspB1 (Hsp27) Is a Molecular Sensor Linked to the Physiology and Environment of the Cell. Cell Stress Chaperones 2017, 22, 517–529. [Google Scholar] [CrossRef] [PubMed]
- Leavitt, B.R.; Kordasiewicz, H.B.; Schobel, S.A. Huntingtin-Lowering Therapies for Huntington Disease: A Review of the Evidence of Potential Benefits and Risks. JAMA Neurol. 2020, 77, 764–772. [Google Scholar] [CrossRef] [PubMed]
- Stelma, T.; Leaner, V.D. KPNB1-Mediated Nuclear Import Is Required for Motility and Inflammatory Transcription Factor Activity in Cervical Cancer Cells. Oncotarget 2017, 8, 32833–32847. [Google Scholar] [CrossRef] [PubMed]
- Andrés, V.; González, J.M. Role of A-Type Lamins in Signaling, Transcription, and Chromatin Organization. J. Cell Biol. 2009, 187, 945–957. [Google Scholar] [CrossRef]
- Burke, B.; Stewart, C.L. The Nuclear Lamins: Flexibility in Function. Nat. Rev. Mol. Cell Biol. 2013, 14, 13–24. [Google Scholar] [CrossRef]
- Mittendorf, K.F.; Marinko, J.T.; Hampton, C.M.; Ke, Z.; Hadziselimovic, A.; Schlebach, J.P.; Law, C.L.; Li, J.; Wright, E.R.; Sanders, C.R.; et al. Peripheral Myelin Protein 22 Alters Membrane Architecture. Sci. Adv. 2017, 3, e1700220. [Google Scholar] [CrossRef]
- Serfecz, J.; Bazick, H.; Al Salihi, M.O.; Turner, P.; Fields, C.; Cruz, P.; Renne, R.; Notterpek, L. Downregulation of the Human Peripheral Myelin Protein 22 Gene by MiR-29a in Cellular Models of Charcot–Marie–Tooth Disease. Gene 2019, 26, 455–464. [Google Scholar] [CrossRef]
- Strasser, A.; Dickmanns, A.; Lührmann, R.; Ficner, R. Structural Basis for M3G-Cap-Mediated Nuclear Import of Spliceosomal UsnRNPs by Snurportin1. EMBO J. 2005, 24, 2235–2243. [Google Scholar] [CrossRef]
- Kidana, K.; Tatebe, T.; Ito, K.; Hara, N.; Kakita, A.; Saito, T.; Takatori, S.; Ouchi, Y.; Ikeuchi, T.; Makino, M.; et al. Loss of Kallikrein-related Peptidase 7 Exacerbates Amyloid Pathology in Alzheimer’s Disease Model Mice. EMBO Mol. Med. 2018, 10, e8184. [Google Scholar] [CrossRef]
- Talieri, M.; Mathioudaki, K.; Prezas, P.; Alexopoulou, D.K.; Diamandis, E.P.; Xynopoulos, D.; Ardavanis, A.; Arnogiannaki, N.; Scorilas, A. Clinical Significance of Kallikrein-Related Peptidase 7 (KLK7) in Colorectal Cancer. Thromb. Haemost. 2009, 101, 741–747. [Google Scholar] [CrossRef]
- Chen, J.-Q.; Liang, B.-H.; Li, H.-P.; Mo, Z.-Y.; Zhu, H.-L. Roles of Kallikrein-Related Peptidase in Epidermal Barrier Function and Related Skin Diseases. Int. J. Dermatol. Venereol. 2019, 2, 150–155. [Google Scholar] [CrossRef]
- Ivanov, S.V.; Kuzmin, I.; Wei, M.-H.; Pack, S.; Geil, L.; Johnson, B.E.; Stanbridge, E.J.; Lerman, M.I. Down-Regulation of Transmembrane Carbonic Anhydrases in Renal Cell Carcinoma Cell Lines by Wild-Type von Hippel-Lindau Transgenes. Proc. Natl. Acad. Sci. USA 1998, 95, 12596–12601. [Google Scholar] [CrossRef]
- Gonzalo, S.; Kreienkamp, R.; Askjaer, P. Hutchinson-Gilford Progeria Syndrome: A Premature Aging Disease Caused by LMNA Gene Mutations. Ageing Res. Rev. 2017, 33, 18–29. [Google Scholar] [CrossRef]
- Zhao, H.; Huang, X.; Halicka, H.D.; Darzynkiewicz, Z. Detection of Histone H2AX Phosphorylation on Ser-139 as an Indicator of DNA Damage. Curr. Protoc. Cytom. 2019, 89, e55. [Google Scholar] [CrossRef]
- Malhotra, D.; Portales-Casamar, E.; Singh, A.; Srivastava, S.; Arenillas, D.; Happel, C.; Shyr, C.; Wakabayashi, N.; Kensler, T.W.; Wasserman, W.W.; et al. Global Mapping of Binding Sites for Nrf2 Identifies Novel Targets in Cell Survival Response through ChIP-Seq Profiling and Network Analysis. Nucleic Acids Res. 2010, 38, 5718–5734. [Google Scholar] [CrossRef]
- Sies, H.; Berndt, C.; Jones, D.P. Oxidative Stress. Annu. Rev. Biochem. 2017, 86, 715–748. [Google Scholar] [CrossRef]
- Cuadrado, A.; Martín-Moldes, Z.; Ye, J.; Lastres-Becker, I. Transcription Factors NRF2 and NF-ΚB Are Coordinated Effectors of the Rho Family, GTP-Binding Protein RAC1 during Inflammation. J. Biol. Chem. 2014, 289, 15244–15258. [Google Scholar] [CrossRef]
- Song, M.-K.; Ryoo, I.-G.; Ryu, D.; Lee, S.-H.; Kwak, M.-K. NFE2L2 (Nrf2) Attenuates Tgf-Β1 Signaling by Elevation of Smad7 in Mouse Mesangial MES-13 Cells. FASEB J. 2018, 32, 562.12. [Google Scholar] [CrossRef]
- Harris, A.J.; Thompson, A.R.; Whyte, M.K.; Walmsley, S.R. HIF-Mediated Innate Immune Responses: Cell Signaling and Therapeutic Implications. HP 2014, 2, 47–58. [Google Scholar] [CrossRef]
- Brewer, J.A.; Khor, B.; Vogt, S.K.; Muglia, L.M.; Fujiwara, H.; Haegele, K.E.; Sleckman, B.P.; Muglia, L.J. T-Cell Glucocorticoid Receptor Is Required to Suppress COX-2-Mediated Lethal Immune Activation. Nat. Med. 2003, 9, 1318–1322. [Google Scholar] [CrossRef]
- Gruver-Yates, A.L.; Quinn, M.A.; Cidlowski, J.A. Analysis of Glucocorticoid Receptors and Their Apoptotic Response to Dexamethasone in Male Murine B Cells During Development. Endocrinology 2014, 155, 463–474. [Google Scholar] [CrossRef]
- Chen, Y.; Zhang, J.; Ge, X.; Du, J.; Deb, D.K.; Li, Y.C. Vitamin D Receptor Inhibits Nuclear Factor ΚB Activation by Interacting with IκB Kinase β Protein. J. Biol. Chem. 2013, 288, 19450–19458. [Google Scholar] [CrossRef]
- Li, T.; Francl, J.M.; Boehme, S.; Chiang, J.Y.L. Regulation of Cholesterol and Bile Acid Homeostasis by the CYP7A1/SREBP2/MiR-33a Axis. Hepatology 2013, 58, 1111–1121. [Google Scholar] [CrossRef] [PubMed]
- Hunter, M.P.; Wilson, C.M.; Jiang, X.; Cong, R.; Vasavada, H.; Kaestner, K.H.; Bogue, C.W. The Homeobox Gene Hhex Is Essential for Proper Hepatoblast Differentiation and Bile Duct Morphogenesis. Dev. Biol. 2007, 308, 355–367. [Google Scholar] [CrossRef] [PubMed]
- Xing, X.; Burgermeister, E.; Geisler, F.; Einwächter, H.; Fan, L.; Hiber, M.; Rauser, S.; Walch, A.; Röcken, C.; Ebeling, M.; et al. Hematopoietically Expressed Homeobox Is a Target Gene of Farnesoid X Receptor in Chenodeoxycholic Acid-Induced Liver Hypertrophy. Hepatology 2009, 49, 979–988. [Google Scholar] [CrossRef] [PubMed]
- Behrens, A.; Sibilia, M.; David, J.-P.; Möhle-Steinlein, U.; Tronche, F.; Schütz, G.; Wagner, E.F. Impaired Postnatal Hepatocyte Proliferation and Liver Regeneration in Mice Lacking C-Jun in the Liver. EMBO J. 2002, 21, 1782–1790. [Google Scholar] [CrossRef]
- Gupta, S.; Stravitz, R.T.; Dent, P.; Hylemon, P.B. Down-Regulation of Cholesterol 7α-Hydroxylase (CYP7A1) Gene Expression by Bile Acids in Primary Rat Hepatocytes Is Mediated by the c-Jun N-Terminal Kinase Pathway. J. Biol. Chem. 2001, 276, 15816–15822. [Google Scholar] [CrossRef]
- Ishikawa, H.; Hayakawa, M.; Baatartsogt, N.; Kakizawa, N.; Ohto-Ozaki, H.; Maruyama, T.; Miura, K.; Suzuki, K.; Rikiyama, T.; Ohmori, T. IκBζ Regulates the Development of Nonalcoholic Fatty Liver Disease through the Attenuation of Hepatic Steatosis in Mice. Sci. Rep. 2022, 12, 11634. [Google Scholar] [CrossRef]
- Chen, S.; Qian, J.; Shi, X.; Gao, T.; Liang, T.; Liu, C. Control of Hepatic Gluconeogenesis by the Promyelocytic Leukemia Zinc Finger Protein. Mol. Endocrinol. 2014, 28, 1987–1998. [Google Scholar] [CrossRef]
- Wan, Y.; Nordeen, S.K. Overlapping but Distinct Gene Regulation Profiles by Glucocorticoids and Progestins in Human Breast Cancer Cells. Mol. Endocrinol. 2002, 16, 1204–1214. [Google Scholar] [CrossRef]
- Fahnenstich, J.; Nandy, A.; Milde-Langosch, K.; Schneider-Merck, T.; Walther, N.; Gellersen, B. Promyelocytic Leukaemia Zinc Finger Protein (PLZF) Is a Glucocorticoid- and Progesterone-induced Transcription Factor in Human Endometrial Stromal Cells and Myometrial Smooth Muscle Cells. Mol. Hum. Reprod. 2003, 9, 611–623. [Google Scholar] [CrossRef]
- Yang, Y.M.; Noureddin, M.; Liu, C.; Ohashi, K.; Kim, S.Y.; Ramnath, D.; Powell, E.E.; Sweet, M.J.; Roh, Y.S.; Hsin, I.-F.; et al. Hyaluronan Synthase 2–Mediated Hyaluronan Production Mediates Notch1 Activation and Liver Fibrosis. Sci. Transl. Med. 2019, 11, eaat9284. [Google Scholar] [CrossRef]
- Chiang, J.Y.L.; Ferrell, J.M. Up to Date on Cholesterol 7 Alpha-Hydroxylase (CYP7A1) in Bile Acid Synthesis. Liver Res. 2020, 4, 47–63. [Google Scholar] [CrossRef]
- Park, W.I.; Park, M.J.; An, J.K.; Choi, Y.H.; Kim, H.Y.; Cheong, J.; Yang, U.S. Bile Acid Regulates C-Jun Expression through the Orphan Nuclear Receptor SHP Induction in Gastric Cells. Biochem. Biophys. Res. Commun. 2008, 369, 437–443. [Google Scholar] [CrossRef]
- Poutanen, M.; Penning, T.M. Biology and Clinical Relevance of Hydroxysteroid (17beta) Dehydrogenase Enzymes. Mol. Cell. Endocrinol. 2019, 489, 1–2. [Google Scholar] [CrossRef]
- Saloniemi, T.; Jokela, H.; Strauss, L.; Pakarinen, P.; Poutanen, M. The Diversity of Sex Steroid Action: Novel Functions of Hydroxysteroid (17β) Dehydrogenases as Revealed by Genetically Modified Mouse Models. J. Endocrinol. 2012, 212, 27–40. [Google Scholar] [CrossRef]
- Liu, S.; Huang, C.; Li, D.; Ren, W.; Zhang, H.; Qi, M.; Li, X.; Yu, L. Molecular Cloning and Expression Analysis of a New Gene for Short-Chain Dehydrogenase/Reductase 9. Acta Biochim. Pol. 2007, 54, 213–218. [Google Scholar] [CrossRef]
- Abul-Husn, N.S.; Cheng, X.; Li, A.H.; Xin, Y.; Schurmann, C.; Stevis, P.; Liu, Y.; Kozlitina, J.; Stender, S.; Wood, G.C.; et al. A Protein-Truncating HSD17B13 Variant and Protection from Chronic Liver Disease. N. Engl. J. Med. 2018, 378, 1096–1106. [Google Scholar] [CrossRef]
- Pirola, C.J.; Garaycoechea, M.; Flichman, D.; Arrese, M.; San Martino, J.; Gazzi, C.; Castaño, G.O.; Sookoian, S. Splice Variant Rs72613567 Prevents Worst Histologic Outcomes in Patients with Nonalcoholic Fatty Liver Disease [S]. J. Lipid Res. 2019, 60, 176–185. [Google Scholar] [CrossRef]
- Mao, X.; Gluck, N.; Li, D.; Maine, G.N.; Li, H.; Zaidi, I.W.; Repaka, A.; Mayo, M.W.; Burstein, E. GCN5 Is a Required Cofactor for a Ubiquitin Ligase That Targets NF-KappaB/RelA. Genes Dev. 2009, 23, 849–861. [Google Scholar] [CrossRef]
- Aseem, S.O.; Jalan-Sakrikar, N.; Chi, C.; Navarro-Corcuera, A.; De Assuncao, T.M.; Hamdan, F.H.; Chowdhury, S.; Banales, J.M.; Johnsen, S.A.; Shah, V.H.; et al. Epigenomic Evaluation of Cholangiocyte Transforming Growth Factor-β Signaling Identifies a Selective Role for Histone 3 Lysine 9 Acetylation in Biliary Fibrosis. Gastroenterology 2021, 160, 889–905.e10. [Google Scholar] [CrossRef]
- Walton, K.L.; Johnson, K.E.; Harrison, C.A. Targeting TGF-β Mediated SMAD Signaling for the Prevention of Fibrosis. Front. Pharmacol. 2017, 8, 461. [Google Scholar] [CrossRef] [PubMed]
- Zisser, A.; Ipsen, D.H.; Tveden-Nyborg, P. Hepatic Stellate Cell Activation and Inactivation in NASH-Fibrosis—Roles as Putative Treatment Targets? Biomedicines 2021, 9, 365. [Google Scholar] [CrossRef]
- Shang, H.; Liu, X.; Guo, H. Knockdown of Fstl1 Attenuates Hepatic Stellate Cell Activation through the TGF-β1/Smad3 Signaling Pathway. Mol. Med. Rep. 2017, 16, 7119–7123. [Google Scholar] [CrossRef] [PubMed]
- Mahmoud, A.M.; Hozayen, W.G.; Hasan, I.H.; Shaban, E.; Bin-Jumah, M. Umbelliferone Ameliorates CCl4-Induced Liver Fibrosis in Rats by Upregulating PPARγ and Attenuating Oxidative Stress, Inflammation, and TGF-Β1/Smad3 Signaling. Inflammation 2019, 42, 1103–1116. [Google Scholar] [CrossRef] [PubMed]
- Human Protein Atlas Database. Available online: https://www.proteinatlas.org/humanproteome/single+cell+type (accessed on 3 June 2022).
- Bolger, A.M.; Lohse, M.; Usadel, B. Trimmomatic: A Flexible Trimmer for Illumina Sequence Data. Bioinformatics 2014, 30, 2114–2120. [Google Scholar] [CrossRef]
- Kim, D.; Paggi, J.M.; Park, C.; Bennett, C.; Salzberg, S.L. Graph-Based Genome Alignment and Genotyping with HISAT2 and HISAT-Genotype. Nat. Biotechnol. 2019, 37, 907–915. [Google Scholar] [CrossRef]
- Liao, Y.; Smyth, G.K.; Shi, W. The R Package Rsubread Is Easier, Faster, Cheaper and Better for Alignment and Quantification of RNA Sequencing Reads. Nucleic Acids Res. 2019, 47, e47. [Google Scholar] [CrossRef]
- Robinson, M.D.; McCarthy, D.J.; Smyth, G.K. EdgeR: A Bioconductor Package for Differential Expression Analysis of Digital Gene Expression Data. Bioinformatics 2010, 26, 139–140. [Google Scholar] [CrossRef]
- ClusterProfiler: An R Package for Comparing Biological Themes Among Gene Clusters|OMICS: A Journal of Integrative Biology. Available online: https://www.liebertpub.com/doi/10.1089/omi.2011.0118 (accessed on 3 June 2022).
- BioPlanet. Available online: https://tripod.nih.gov/bioplanet/ (accessed on 3 June 2022).
- Gene Ontology. Available online: http://geneontology.org/ (accessed on 3 June 2022).


| Protein | Full Name | Function | Ref. |
|---|---|---|---|
| Enzymes | |||
| ACHE | Acetylcholinesterase | Primary cholinesterase of the human body which breaks down the neurotransmitter acetylcholine | [29] |
| AKR1B1 | Aldo-keto reductase family 1 member B1 | Catalyses the NADPH-dependent reduction of a wide variety of carbonyl-containing compounds to their corresponding alcohols. Displays enzymatic activity towards endogenous metabolites such as aromatic and aliphatic aldehydes, ketones, monosaccharides, bile acids and xenobiotics substrates. The overexpression of AKR1B1 is associated with inflammation and carcinogenesis | [30] |
| ALDH1A1 | Aldehyde dehydrogenase 1A1 | Is the second enzyme of the major oxidative pathway of alcohol metabolism, oxidise retinal to retinoic acid. The enzyme involved in adipogenesis, glucose tolerance and abdominal fat formation | [31] |
| CA9, CA12 | Carboxylic anhydrase 9 and 12 | Zinc metalloenzyme catalyse CO2 hydration to bicarbonate and H+ and regulate pH level, acid-base homeostasis and fluid balance. Expression induced by hypoxia and implicated in cancer development and adaptation to acidosis. | [32,33,34] |
| CASP1 | Caspase 1 | Is a part of the inflammasome complex, which initiates a proinflammatory response through the cleavage of IL1B and IL18 | [35,36,37] |
| CASP3 | Caspase 3 | Involved in the activation of apoptosis, sterol regulatory element-binding proteins (SCREBPs) and CASP7 | [38] |
| CASP7 | Caspase 7 | Involved in activation of apoptosis | [38] |
| CYP1A2 | Cytochrome P450 1A2 | Involved in the metabolism of aromatic compounds, xenobiotics, drugs and steroids | [39,40] |
| GAA | Acid alpha-glucosidase | The key enzymes of lysosomal glycogen breakdown. | [41] |
| GALC GBA GLA | Galactocerebroside beta Glucosylceramidase beta Alpha-galactosidase A | Involved in the glycosamide degradation in lysosomes and membrane turnover | [42] |
| HPGD | 15-Hydroxyprostaglandin dehydrogenase | Catalyses the oxidation of a broad array of hydroxylated polyunsaturated fatty acids (mainly eicosanoids and docosanoids, including prostaglandins, lipoxins and resolvins), yielding their corresponding keto (oxo) metabolites | [43] |
| HSD17B10 | 17-β-Hydroxysteroid dehydrogenase 10 | Involved in steroid metabolism, Isoleucine and branched-chained fatty acids mitochondrial oxidation. | [44,45] |
| HSD17B3 | 17β-Hydroxysteroid dehydrogenase 3 | Convert androstenedione to testosterone in testis | [46,47] |
| HSD17B4 | 17β-Hydroxysteroid dehydrogenase 4 | Involved in peroxisomal beta-oxidation of fatty acids and fatty acid derivatives | [48] |
| KAT2A | Histone acetyltransferase KAT2A | Catalyses succinylation of histone H3 with a maximum frequency around the transcription start sites of genes | [49] |
| KLK7 | Kallikrein-related peptidase 7 | Involved in the continuous shedding of cells from the skin surface and insulin proteolytic cleavage, regulation of body weight, energy metabolism, insulin sensitivity and obesity-associated adipose tissue dysfunction | [50,51] |
| MAPK1 | Mitogen-activated protein kinase 1 | Also known as ERK2 and regulates diverse cellular programs by relaying extracellular signals to intracellular responses | [52] |
| TDP1 | Tyrosyl-DNA phosphodiesterase 1 | Hydrolyses the phosphodiester bond between a DNA 3′ end and a tyrosyl moiety and is involved in double break DNA repair | [53] |
| TXNRD1 | Thioredoxin reductase 1 | Involved in actin polymerisation and membrane protrusion formation, estrogen receptor signalling, enhances apoptosis in cancer cells after INF gamma and retinoic acid treatment | [54] |
| Transcription factors | |||
| AR ESR1 ESR2 ESRRA PGR | Androgen receptor Estrogen receptor alpha Estrogen receptor beta Estrogen-related receptor alpha Progesterone receptor | Nuclear receptors regulate sex-dependent steroid hormone signalling and modulate the immune response, adipose tissue metabolism, insulin sensitivity, and glucose homeostasis. | [55,56,57] |
| ATF6 | Activating transcription factor 6 | The key TF controls the protein quality in the endoplasmic reticulum. It interacts with the PPARA-RXR complex and regulates liver fatty acid oxidation and glucose metabolism. | [58,59,60] |
| GLI3 | Zinc finger protein GLI3 | Mediates Sonic hedgehog signalling in many tissues. It represses lipid synthesis in the liver at a transcriptional level, and disruption of this pathway leads to steatosis. It is involved in immune cell development and maturation. | [61,62] |
| HIF1A | Hypoxia-inducible factor 1-alpha | The primary sensor of oxygen supply. Activation of the HIF-pathway shifts glucose metabolism from oxidative phosphorylation to glycolysis. | [63] |
| NFE2L2 | Nuclear factor erythroid 2-related factor 2 | Involved in immediate reaction to oxidative stress, hypoxia, toxins and infections | [64] |
| NFkB | Nuclear factor NF-kappa-B p105 subunit | The key TF orchestrates inflammatory responses to different stimuli. | [65] |
| NR1H4 | Farnesoid X receptor | The primary receptor for bile acids, which is involved in the regulation of bile acid synthesis and degradation, glucose and fatty acid metabolism | [66,67,68] |
| NR1I3 | Constitutive androstane receptor | The primary xenobiotic sensor. Natural ligands include androstanes and their derivatives. It regulates the expression of genes involved in drug and xenobiotic transformation and excretion. Its activation inhibits gluconeogenesis in hepatocytes and stimulates their proliferation. | [69] |
| NR3C1 | Glucocorticoid receptor | Mediates cortisol and others glucocorticoids effects and controls genes involved in the development, metabolism and immune response. | [70] |
| PPARD PPARG | Peroxisome proliferator-activated receptor delta Peroxisome proliferator-activated receptor gamma | The nuclear receptors for free fatty acids, eicosanoids and vitamin B3. They have a central role in the regulation of glucose and lipid homeostasis | [71] |
| RXRA | Retinoid X receptor alpha | Serves as the main heterodimerisation partner for type II nuclear receptors (LXR, PPARs, VDR, NR1H4 and NR1I2). RXRA is involved in regulating fatty acid and cholesterol metabolism, innate immunity and cellular senescence. | [72,73] |
| SMAD2 SMAD3 | Mothers against decapentaplegic homolog 2 Mothers against decapentaplegic homolog 3 | The Smad-signaling pathway, which operates downstream of the transforming growth factor-β (TGF-β) superfamily of ligands, regulates a diverse set of biological processes, including proliferation, differentiation and apoptosis, in many different organ systems | [74,75,76] |
| TP53 | Tumour protein P53 | Plays a fundamental role in regulating the cell cycle, apoptosis, and genomic stability. | [77] |
| VDR | Vitamin D receptor | The primary regulator of Ca metabolism and immune response. | [78,79] |
| Others | |||
| ABCG2 | ABC transporter G2 | The main transporter of physiological compounds, dietary toxins, xenobiotics and drugs outside the cells. | [80] |
| H2AX | H2A histone family member X | Histone which is involved in double break DNA repair, chromatin remodelling and nuclear envelope stabilisation | [81] |
| HSPB1 | Heat shock protein 27 | The main molecular chaperon which involved in protein refolding under stress conditions. | [82] |
| HTT | Huntingtin | A protein which underlines Huntington’s disease development and usually is involved in axonal transport | [83] |
| KPNB1 | Importin subunit beta-1 | The nuclear importin mediates the transport of various proteins into the cell nucleus. | [84] |
| LMNA | Lamin A/C | Nuclear Lamin A is a scaffold protein of the inner nuclear envelope, which regulates nuclear membrane stability and inner nuclear architecture | [85,86] |
| PMP22 | Peripheral myelin protein 22 | Comprise 2–5% of peripheral myelin proteins and critical for nerve membrane ultrastructure | [87,88] |
| SNUPN | Snurportin1 | The protein mediates (m3G)-cap-dependent nuclear import of spliceosomal RNA-protein complexes | [89] |
| Effect | Protein Type | Target Name | Acname | Acvalue, μM | AID | qHTS Assay |
|---|---|---|---|---|---|---|
| Activation | Enzymes | CASP3 | NULL | 24.35 | 463141 | Absorbance-based |
| GAA | Potency | 25.12 | 2112 | Fluorescence-based | ||
| GALC | Potency | 28.18 | 1159614 | Fluorescence-based | ||
| GBA | Potency | 14.13 | 2101 | Fluorescence-based | ||
| KLK7 | NULL | 7 | 652039, 686949 | Fluorescence-based | ||
| TFs | ATF6 | Potency | 40.72 | 1159516, 1159519 | Fluorescence-based | |
| HIF1A | Potency | 46.22–48.97 | 1224846, 1224894 | Fluorescence-based | ||
| NFE2L2 | Potency | 33.49–61.13 | 743202, 743219 | FRET-based | ||
| NFkB | IC50 | 24.54 | 1159509, 1159518 | Fluorescence-based | ||
| RXRA | Potency | 22.32 | 1159527 | Fluorescence-based | ||
| TP53 | Potency | 61.13 | 651631, 720552 | FRET-based | ||
| Others | H2AX | Potency | 39.08–89.76 | 1224845 | TR-FRET-based | |
| Inhibition | Enzymes | AKR1B1 | IC50 | 24.5 | 516862 | Absorbance based |
| ALDH1A1 | Potency | 15.85 | 1030 | Fluorescence-based | ||
| ACHE | Potency | 6.17–89.36 | 1347398 | Fluorescence-based | ||
| CA12 | Ki | 8.1 | 641826 | Colorimetric CO2 Hydration | ||
| CA9 | Ki | 0.56 | 641825 | Colorimetric CO2 Hydration | ||
| CASP1 | Potency | 12.59 | 900 | Fluorescence-based | ||
| CASP7 | Potency | 12.59 | 889 | Fluorescence-based | ||
| CYP1A2 | NULL | 3.98 | 1851, 410 | Luciferase-based | ||
| GLA | Potency | 19.95–28.18 | 1467, 2107 | Fluorescence-based | ||
| HPGD | Potency | 35.48 | 894 | Fluorescence-based | ||
| HSD17B3 | IC50 | 1 | 452459 | Cell-based assays | ||
| HSD17B4 | Potency | 10 | 893, 886 | Fluorescence-based | ||
| HSD17B10 | Potency | 2.51 | ||||
| KAT2A | Potency | 11.22 | 504327 | Fluorescence-based | ||
| MAPK1 | Potency | 39.81 | 995 | AlphaScreen-Based | ||
| TXNRD1 | Potency | 50.12 | 588453 | Fluorescence-based | ||
| TDP1 | Potency | 20.6 | 686978 | Luciferase-based | ||
| TFs | GLI3 | Potency | 15.36–29.48 | 1259369, 1259392 | Luciferase-based | |
| NR1I3 | Potency | 43.28 | 1224893 | Luciferase-based | ||
| Others | KPNB1 | Potency | 70.8 | 540263 | FRET-based | |
| SNUPN | Potency | 70.8 | ||||
| Both | TFs | AR | Potency | 20.04 | 743054, 743036, 743035, 1259243, 743040 | FRET-based, Fluorescence-based, Luciferase -based |
| ESR1 | Potency | 30.9–54.48 | 743069, 743079 | FRET-based | ||
| ESR2 | Potency | 23.54 | 1259377,1259378, 1259394 | FRET-based | ||
| ESRRA | Potency | 13.69 | 1224848,1259403,1259404 | Luciferase-based | ||
| NR1H4 | Potency | 38.15 | 743217, 743220, 743239 | FRET-based | ||
| NR3C1 | Potency | 43.64–48.97 | 720691, 720725, 720719 | FRET-based | ||
| PGR | Potency | 48.56 | 1346784, 1346795, 1347031 | FRET-based | ||
| PPARD | Potency | 35.14 | 743226, 743212, 743227,743215 | FRET-based | ||
| PPARG | Potency | 39.57 | 743191, 743094, 743140, 743199 | FRET-based | ||
| SMAD2 | Potency | 48.97 | 1346859, 1346924, 1347032, 1347035 | FRET-based | ||
| SMAD3 | Potency | 48.97 | ||||
| VDR | Potency | 28.71 | 743223, 743242, 743222, 743241 | FRET-based |
| Gene Name | Gene ID | Description | Function |
|---|---|---|---|
| Down regulated | |||
| Ly6d | 17068 | lymphocyte antigen 6 complex locus D | Surface markers of immune cells |
| Ly6c1 | 17067 | lymphocyte antigen 6 complex locus C1 | |
| Themis2 | 230787 | thymocyte selection associated family member 2 | |
| Ms4a4b | 60361 | membrane spanning 4 domains subfamily A member 4B | |
| Tgtp1 | 21822 | T cell specific GTPase 1 | Involved in interferon signalling and response |
| Mx1 | 17857 | MX dynamin like GTPase 1 | |
| Epsti1 | 108670 | epithelial stromal interaction 1 (breast) | |
| Ifit1 | 15957 | interferon induced protein with tetratricopeptide repeats 1 | |
| Ifit3 | 15959 | interferon induced protein with tetratricopeptide repeats 3 | |
| Ifit3b | 667370 | interferon induced protein with tetratricopeptide repeats 3B | |
| Gbp3 | 55932 | guanylate binding protein 3 | |
| Isg15 | 100038882 | ISG15 ubiquitin like modifier | |
| Il18bp | 16068 | interleukin 18 binding protein | |
| Usp18 | 24110 | ubiquitin specific peptidase 18 | |
| Irf7 | 54123 | interferon regulatory factor 7 | |
| Oasl2 | 23962 | 2′ 5′ oligoadenylate synthetase like 2 | |
| Ifi27l2a | 76933 | interferon alpha inducible protein 27 like 2A | |
| Oas1a | 246730 | 2′ 5′ oligoadenylate synthetase 1A | |
| Naip1 | 17940 | NLR family apoptosis inhibitory protein 1 | |
| Cdc20 | 107995 | cell division cycle 20 | involved in cell division and DNA stability |
| Mki67 | 17345 | antigen identified by monoclonal antibody Ki 67 | |
| Ccn5 | 22403 | cellular communication network factor 5 | |
| Racgap1 | 26934 | Rac GTPase activating protein 1 | |
| Top2a | 21973 | topoisomerase (DNA) II alpha | |
| Blm | 12144 | Bloom syndrome RecQ like helicase | |
| Nfe2 | 18022 | nuclear factor erythroid derived 2 | TF—regulated maturation, differentiation and epithelial-mesenchymal transition |
| Snai2 | 20583 | snail family zinc finger 2 | |
| Hba-a2 | 110257 | hemoglobin alpha adult chain 2 | Involved in oxygen transport |
| Hbb-b1 | 15129 | hemoglobin beta adult major chain | |
| Hbb-bt | 101488143 | hemoglobin beta adult t chain | |
| Rbp1 | 19659 | retinol binding protein 1 cellular | involved in the transport of retinol |
| Ighd | 380797 | immunoglobulin heavy constant delta | antigen and immunoglobulin receptor binding activity |
| Slc41a3 | 71699 | solute carrier family 41 member 3 | mitochondrial Mg2+ transporter |
| Cyp7a1 | 13122 | cytochrome P450 family 7 subfamily a polypeptide 1 | enzymes of bile acid production |
| Up regulated | |||
| Bcl3 | 12051 | B cell leukemia/lymphoma 3 | involved in the modulation of transcriptional activity, histone acetylation |
| Spen | 56381 | spen family transcription repressor | |
| Dot1l | 208266 | DOT1 like histone H3 methyltransferase (S. cerevisiae) | |
| Kmt2d | 381022 | lysine (K) specific methyltransferase 2D | |
| Dusp6 | 67603 | dual specificity phosphatase 6 | |
| Ppp1r10 | 52040 | protein phosphatase 1 regulatory subunit 10 | |
| Lars2 | 102436 | leucyl tRNA synthetase mitochondrial | mitochondrial biogenesis |
| Pprc1 | 226169 | peroxisome proliferative activated receptor gamma coactivator related 1 | |
| Egfl7 | 353156 | EGF like domain 7 | extracellular matrix remodelling |
| Ntn3 | 18209 | netrin 3 | |
| Papln | 170721 | papilin proteoglycan like sulfated glycoprotein | |
| Myoz2 | 59006 | myozenin 2 | cells differentiation |
| Tmod4 | 50874 | tropomodulin 4 | |
| Sez6l2 | 233878 | seizure related 6 homolog like 2 | |
| Hhex | 15242 | hematopoietically expressed homeobox | TF—regulated of differentiation, inflammatory responses and metabolism |
| Jun | 16476 | jun proto oncogene | |
| Nfkbiz | 80859 | nuclear factor of kappa light polypeptide gene enhancer in B cells inhibitor zeta | |
| Zbtb16 | 235320 | zinc finger and BTB domain containing 16 | |
Disclaimer/Publisher’s Note: The statements, opinions and data contained in all publications are solely those of the individual author(s) and contributor(s) and not of MDPI and/or the editor(s). MDPI and/or the editor(s) disclaim responsibility for any injury to people or property resulting from any ideas, methods, instructions or products referred to in the content. |
© 2023 by the authors. Licensee MDPI, Basel, Switzerland. This article is an open access article distributed under the terms and conditions of the Creative Commons Attribution (CC BY) license (https://creativecommons.org/licenses/by/4.0/).
Share and Cite
Tsitrina, A.A.; Halimani, N.; Andreichenko, I.N.; Sabirov, M.; Nesterchuk, M.; Dashenkova, N.O.; Romanov, R.; Bulgakova, E.V.; Mikaelyan, A.; Kotelevtsev, Y. 4-Methylumbelliferone Targets Revealed by Public Data Analysis and Liver Transcriptome Sequencing. Int. J. Mol. Sci. 2023, 24, 2129. https://doi.org/10.3390/ijms24032129
Tsitrina AA, Halimani N, Andreichenko IN, Sabirov M, Nesterchuk M, Dashenkova NO, Romanov R, Bulgakova EV, Mikaelyan A, Kotelevtsev Y. 4-Methylumbelliferone Targets Revealed by Public Data Analysis and Liver Transcriptome Sequencing. International Journal of Molecular Sciences. 2023; 24(3):2129. https://doi.org/10.3390/ijms24032129
Chicago/Turabian StyleTsitrina, Alexandra A., Noreen Halimani, Irina N. Andreichenko, Marat Sabirov, Mikhail Nesterchuk, Nataliya O. Dashenkova, Roman Romanov, Elena V. Bulgakova, Arsen Mikaelyan, and Yuri Kotelevtsev. 2023. "4-Methylumbelliferone Targets Revealed by Public Data Analysis and Liver Transcriptome Sequencing" International Journal of Molecular Sciences 24, no. 3: 2129. https://doi.org/10.3390/ijms24032129
APA StyleTsitrina, A. A., Halimani, N., Andreichenko, I. N., Sabirov, M., Nesterchuk, M., Dashenkova, N. O., Romanov, R., Bulgakova, E. V., Mikaelyan, A., & Kotelevtsev, Y. (2023). 4-Methylumbelliferone Targets Revealed by Public Data Analysis and Liver Transcriptome Sequencing. International Journal of Molecular Sciences, 24(3), 2129. https://doi.org/10.3390/ijms24032129