
Supramolecular Nature of Multicomponent Crystals Formed from 2,2′-Thiodiacetic Acid with 2,6-Diaminopurine or N9-(2-Hydroxyethyl)adenine


 , , , , and
Abstract
:
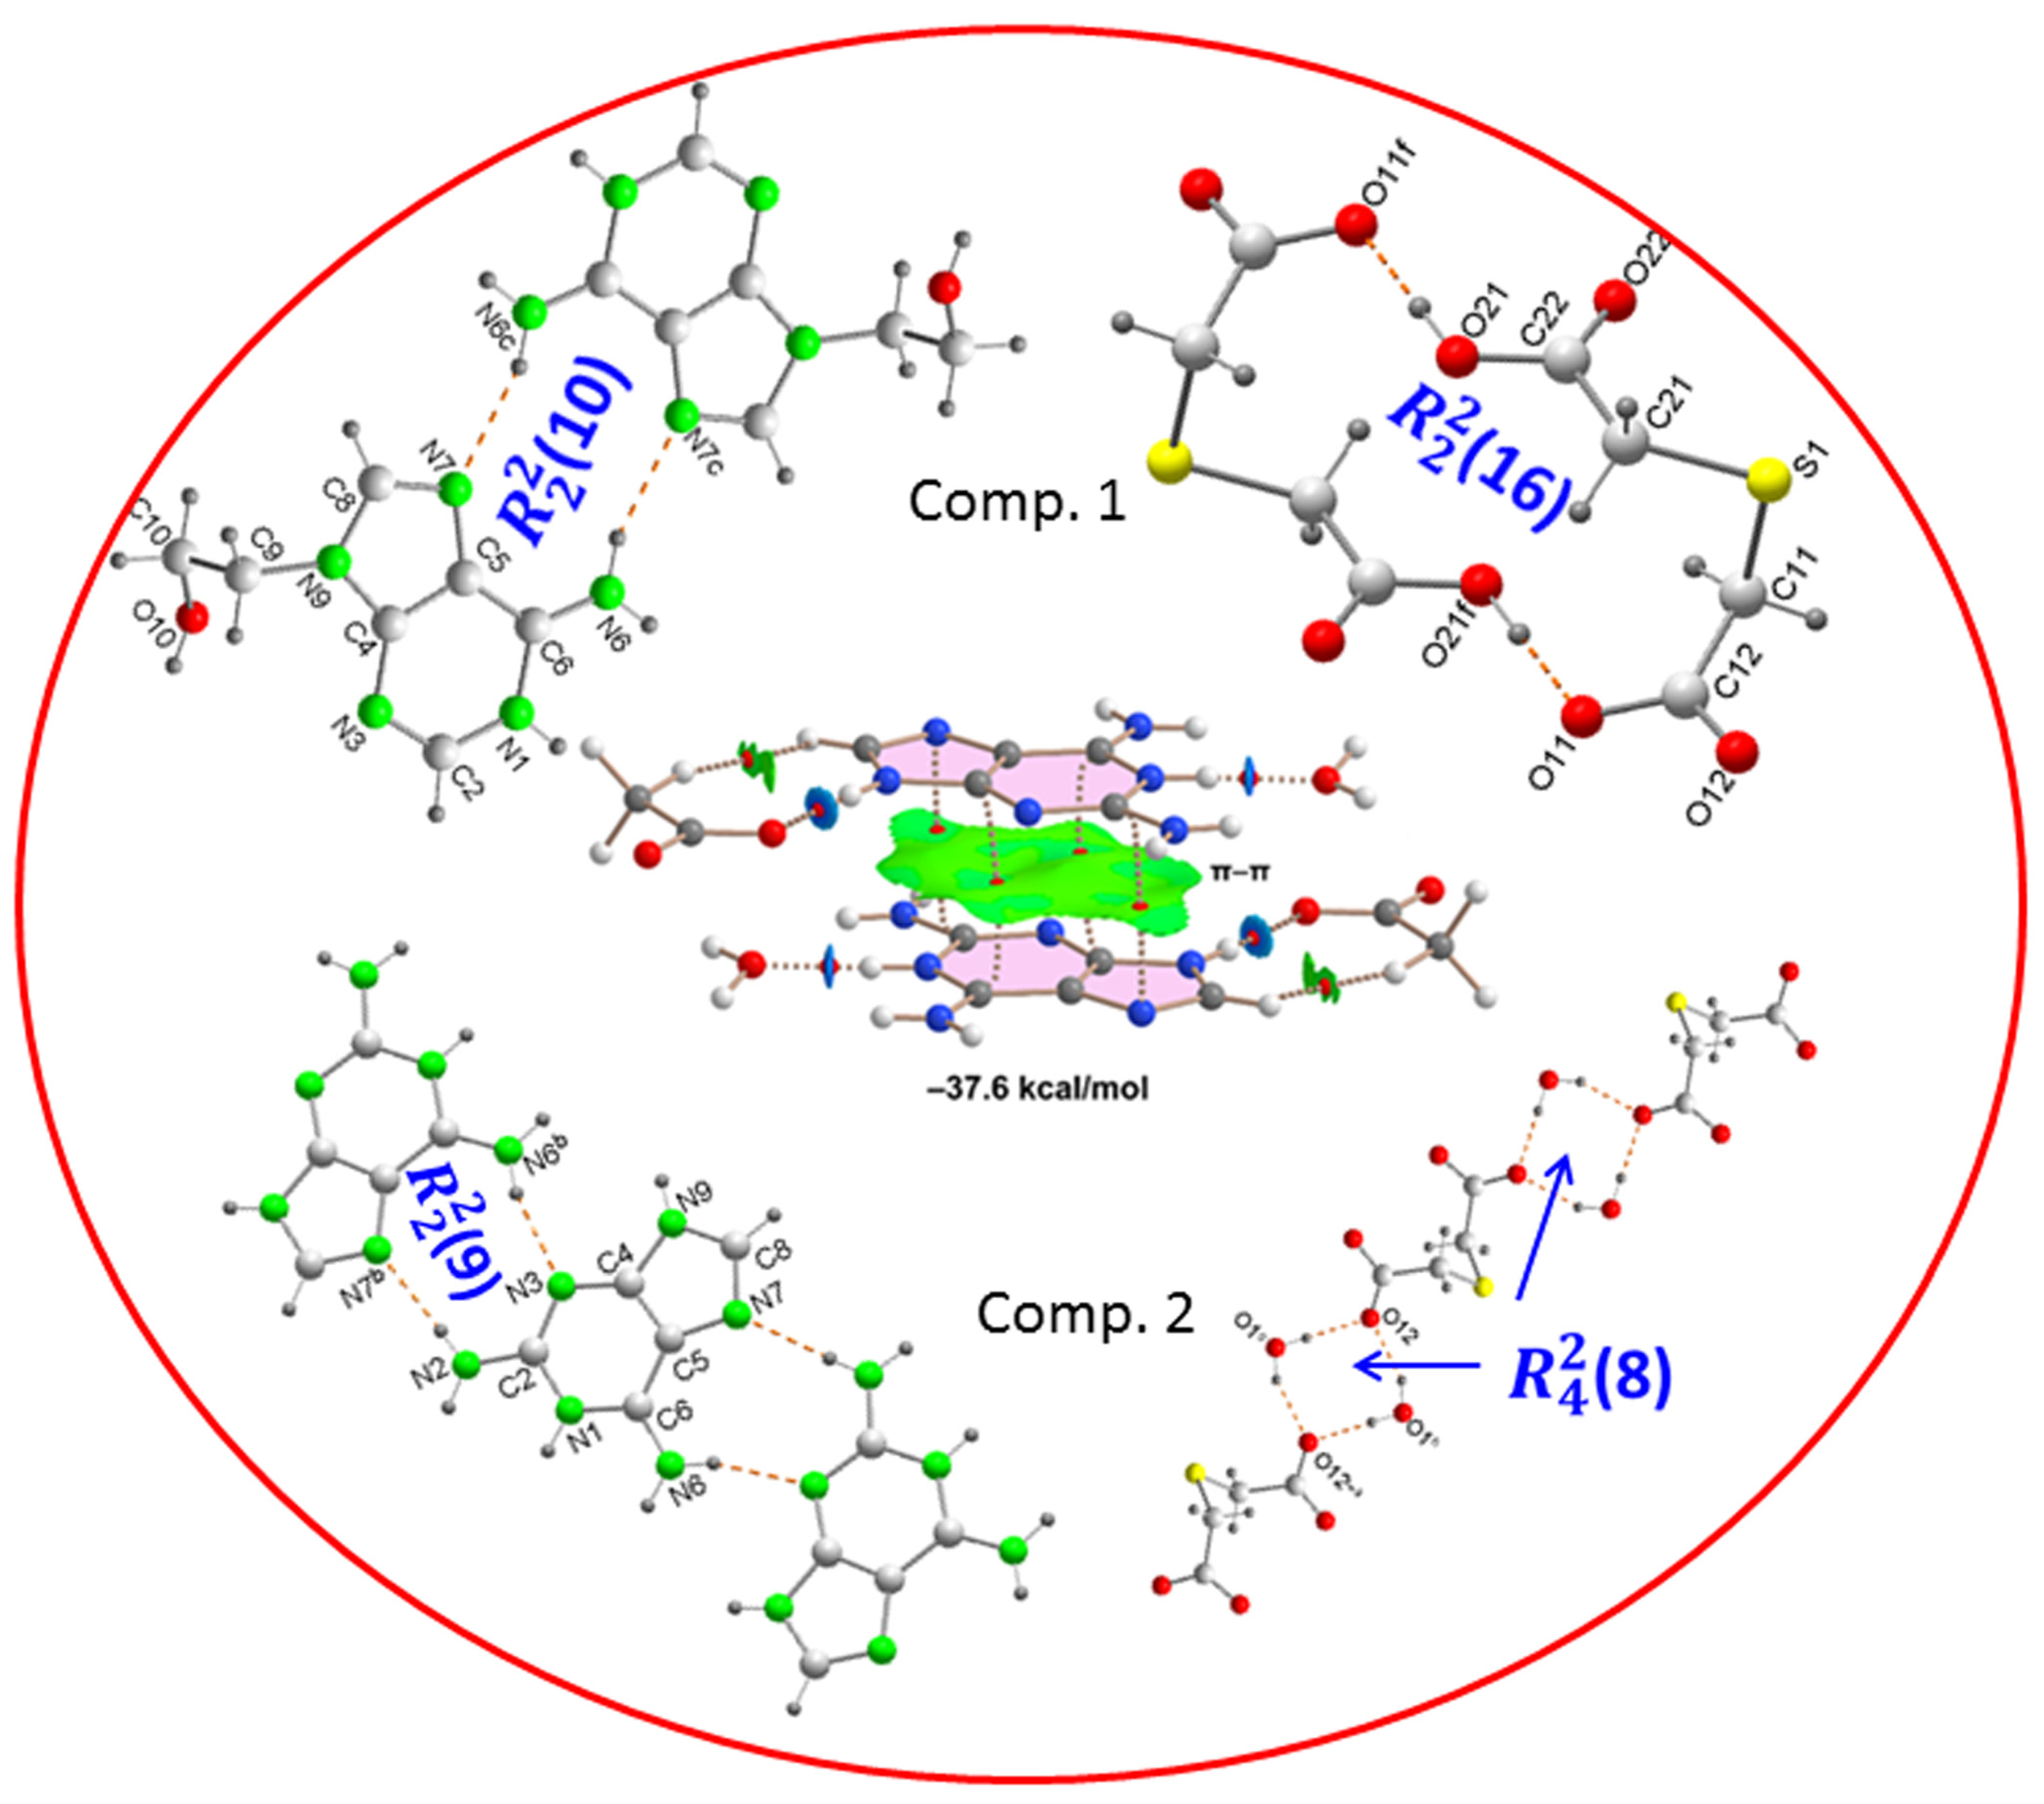
1. Introduction
2. Discussion and Results
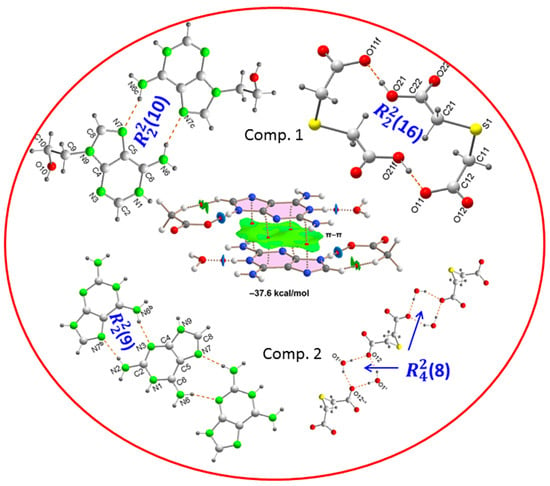
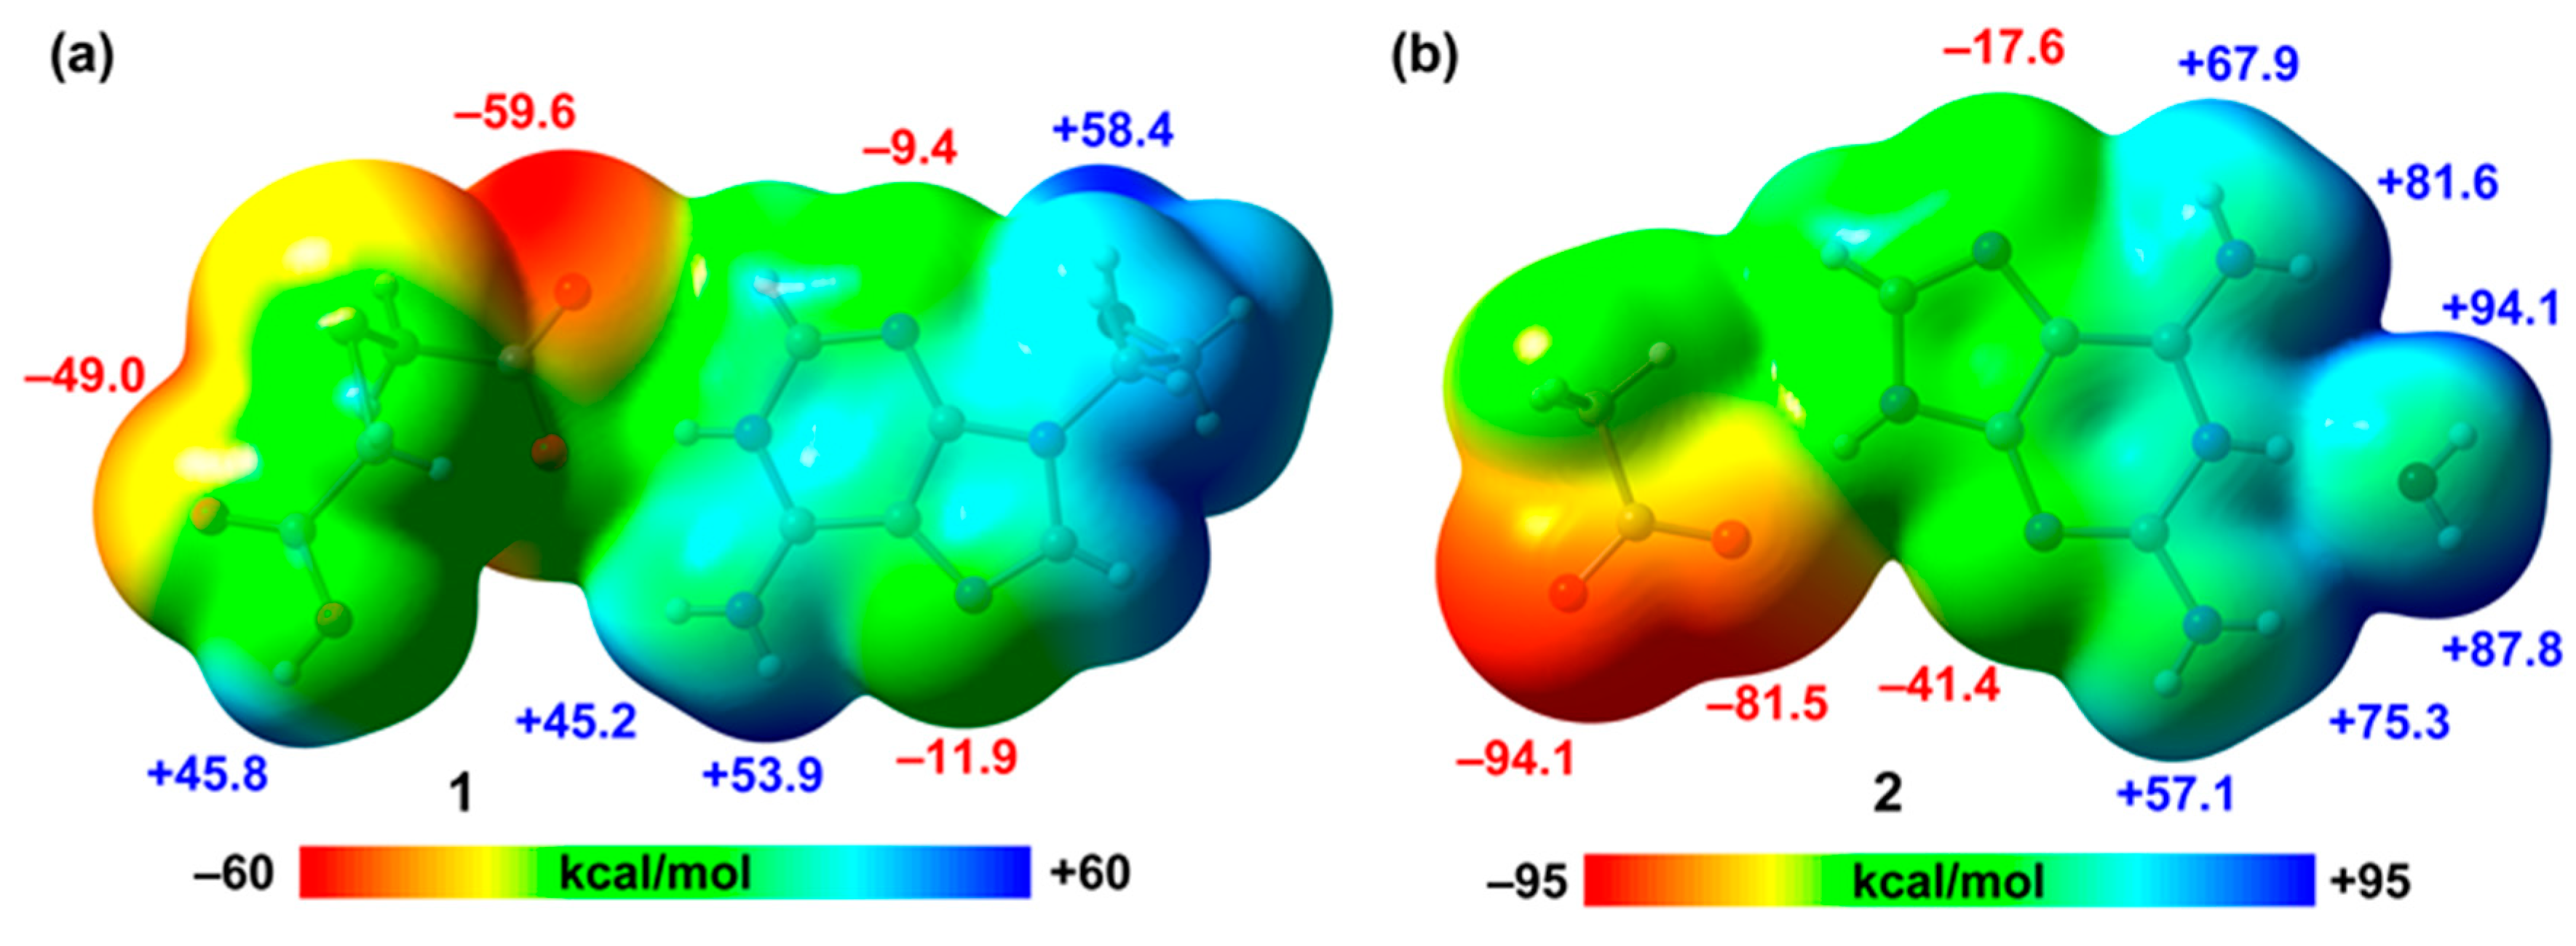
2.1. Structural Description and Supramolecular Analysis
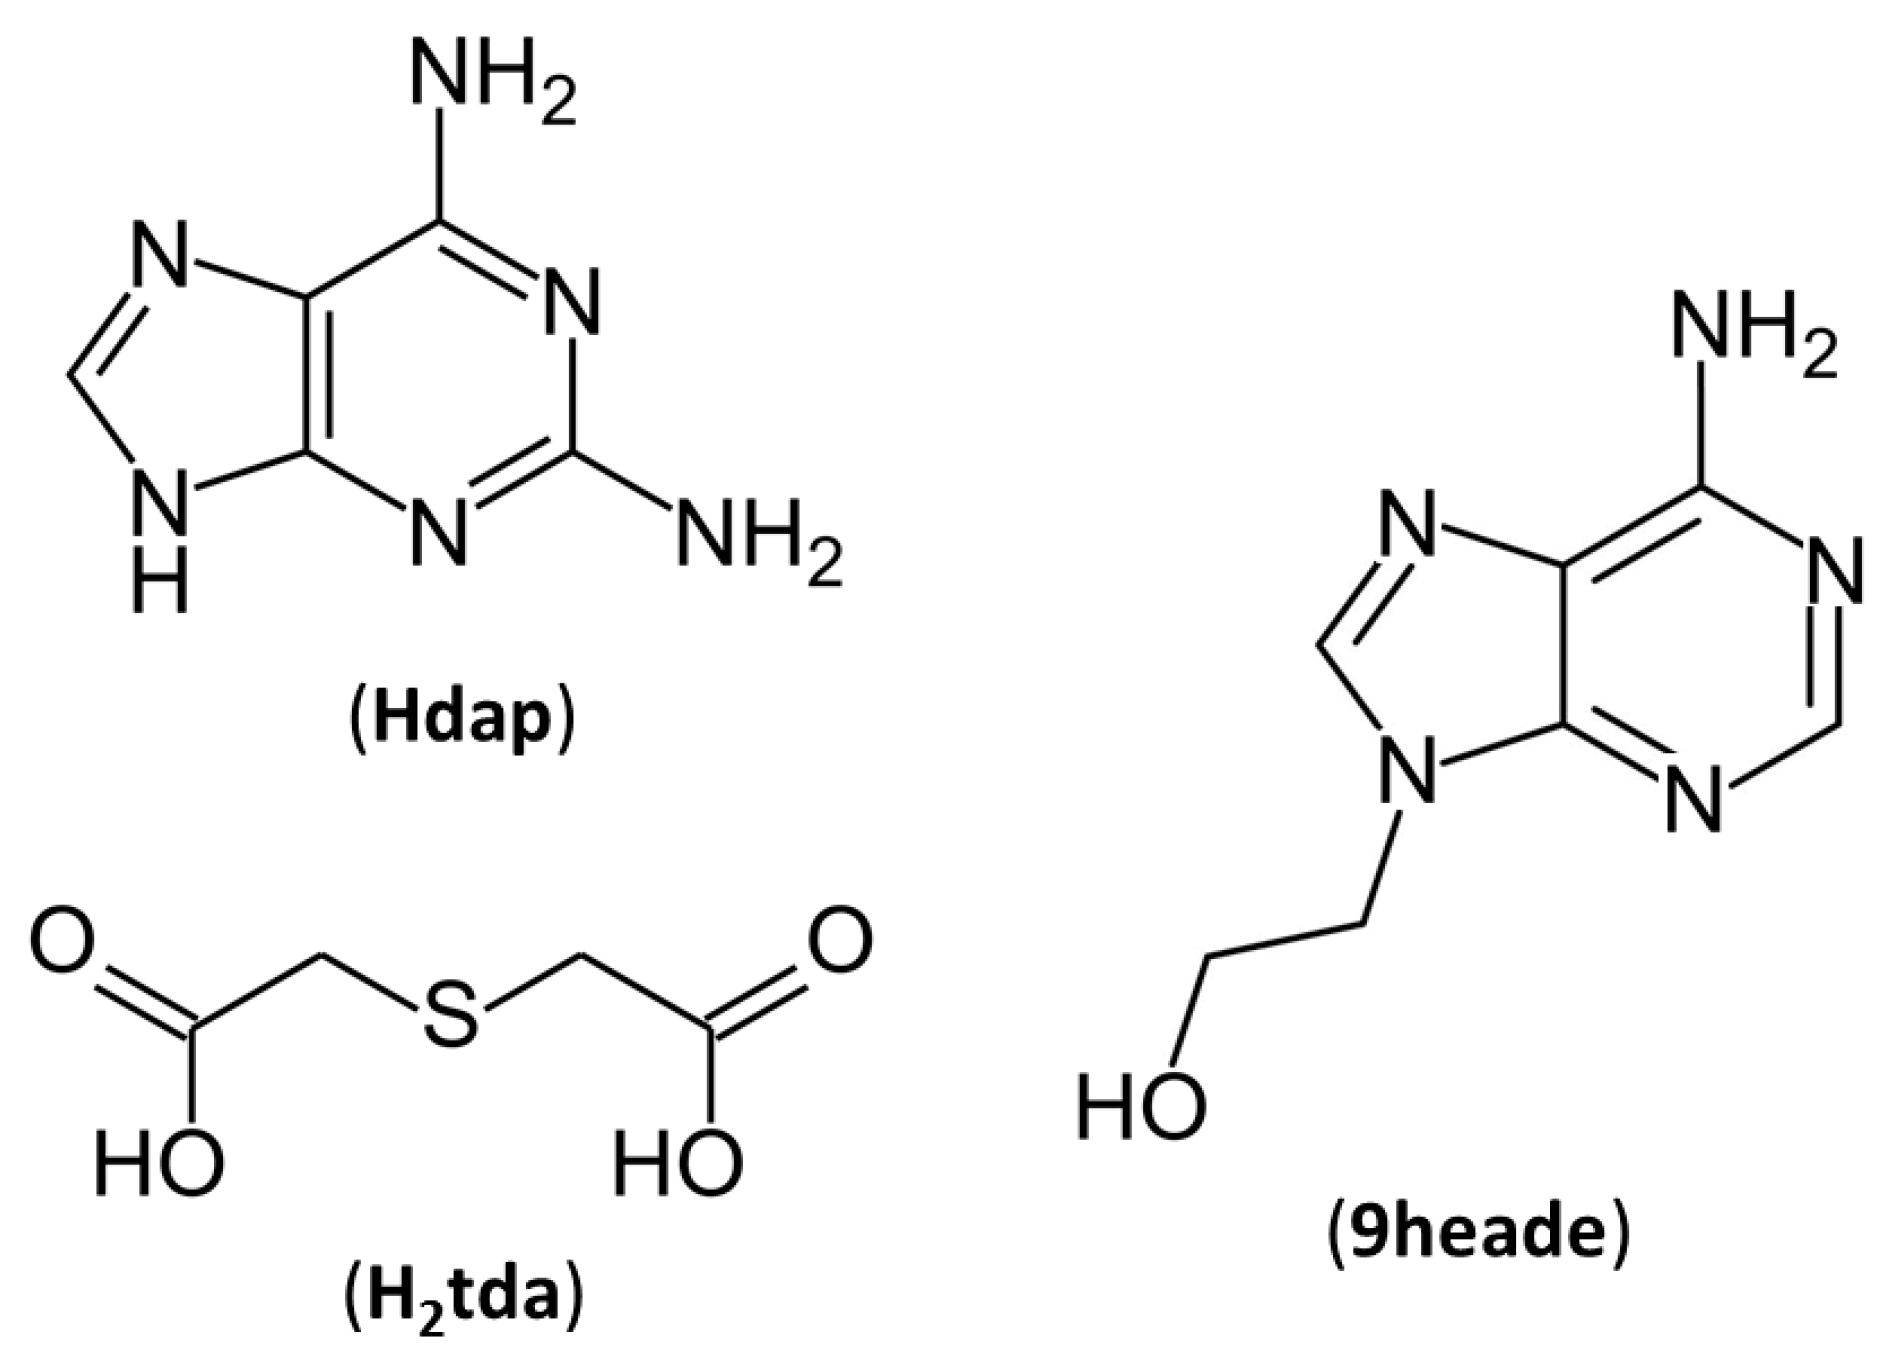
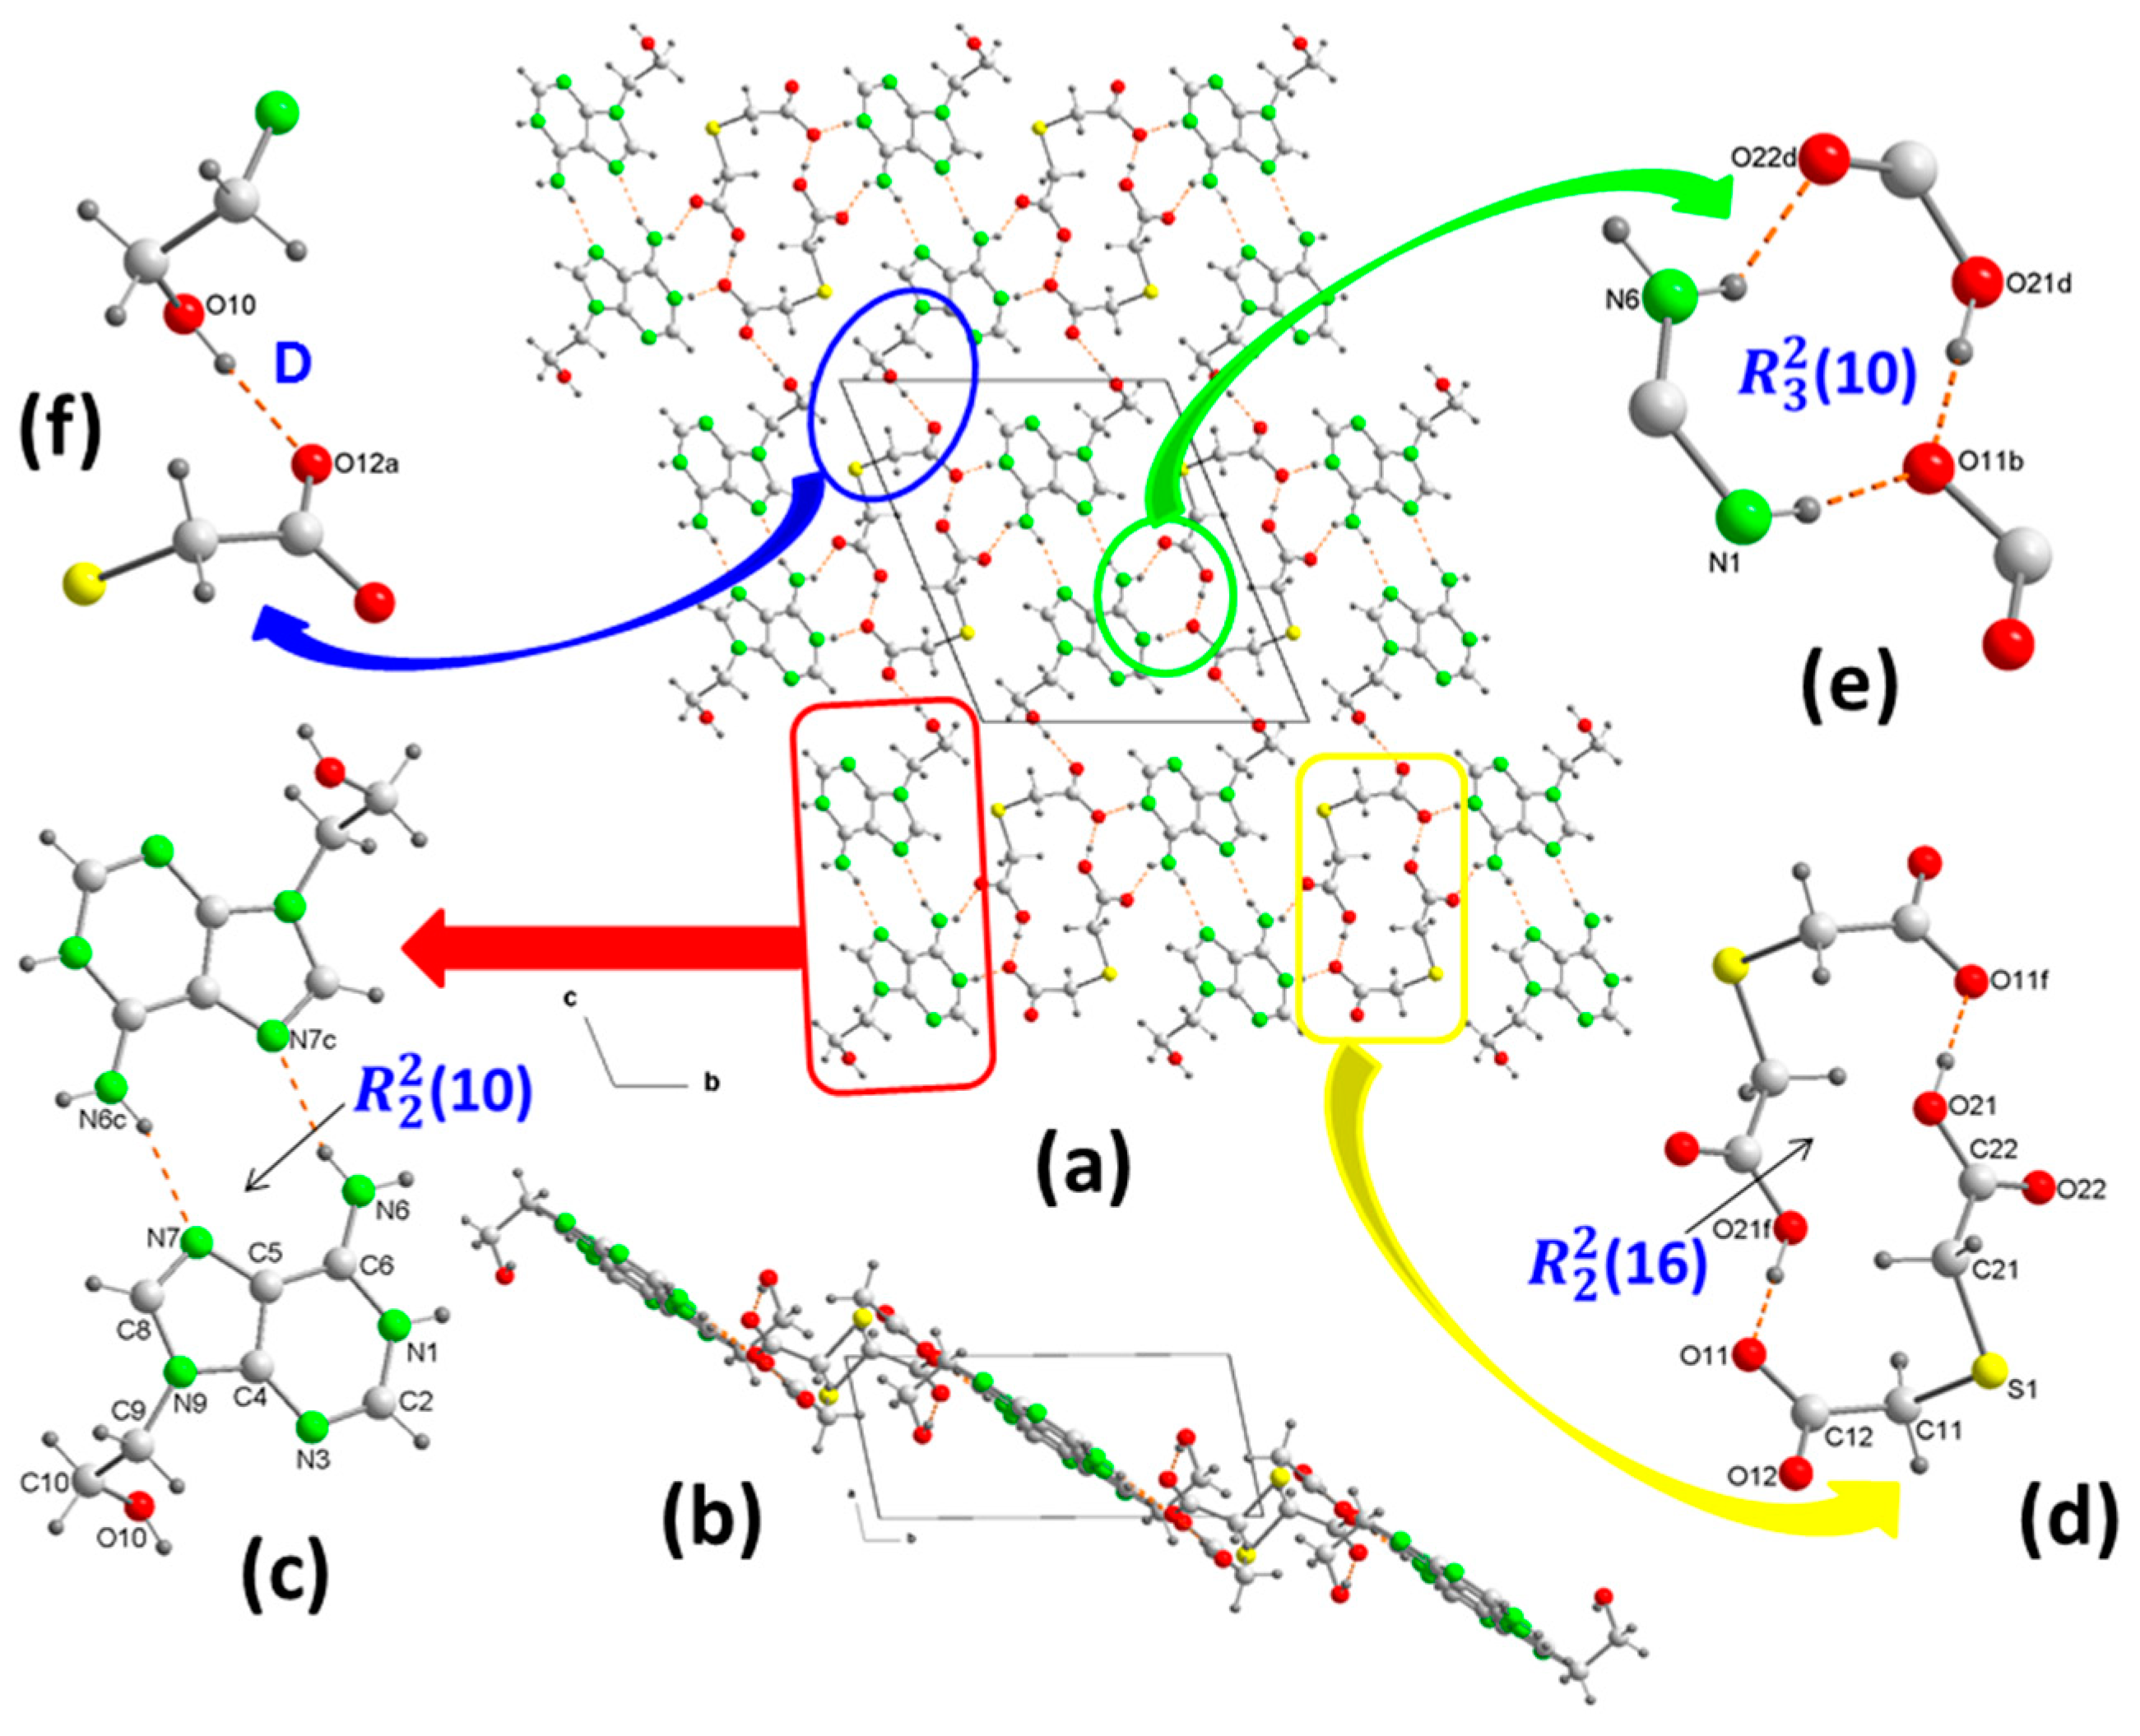
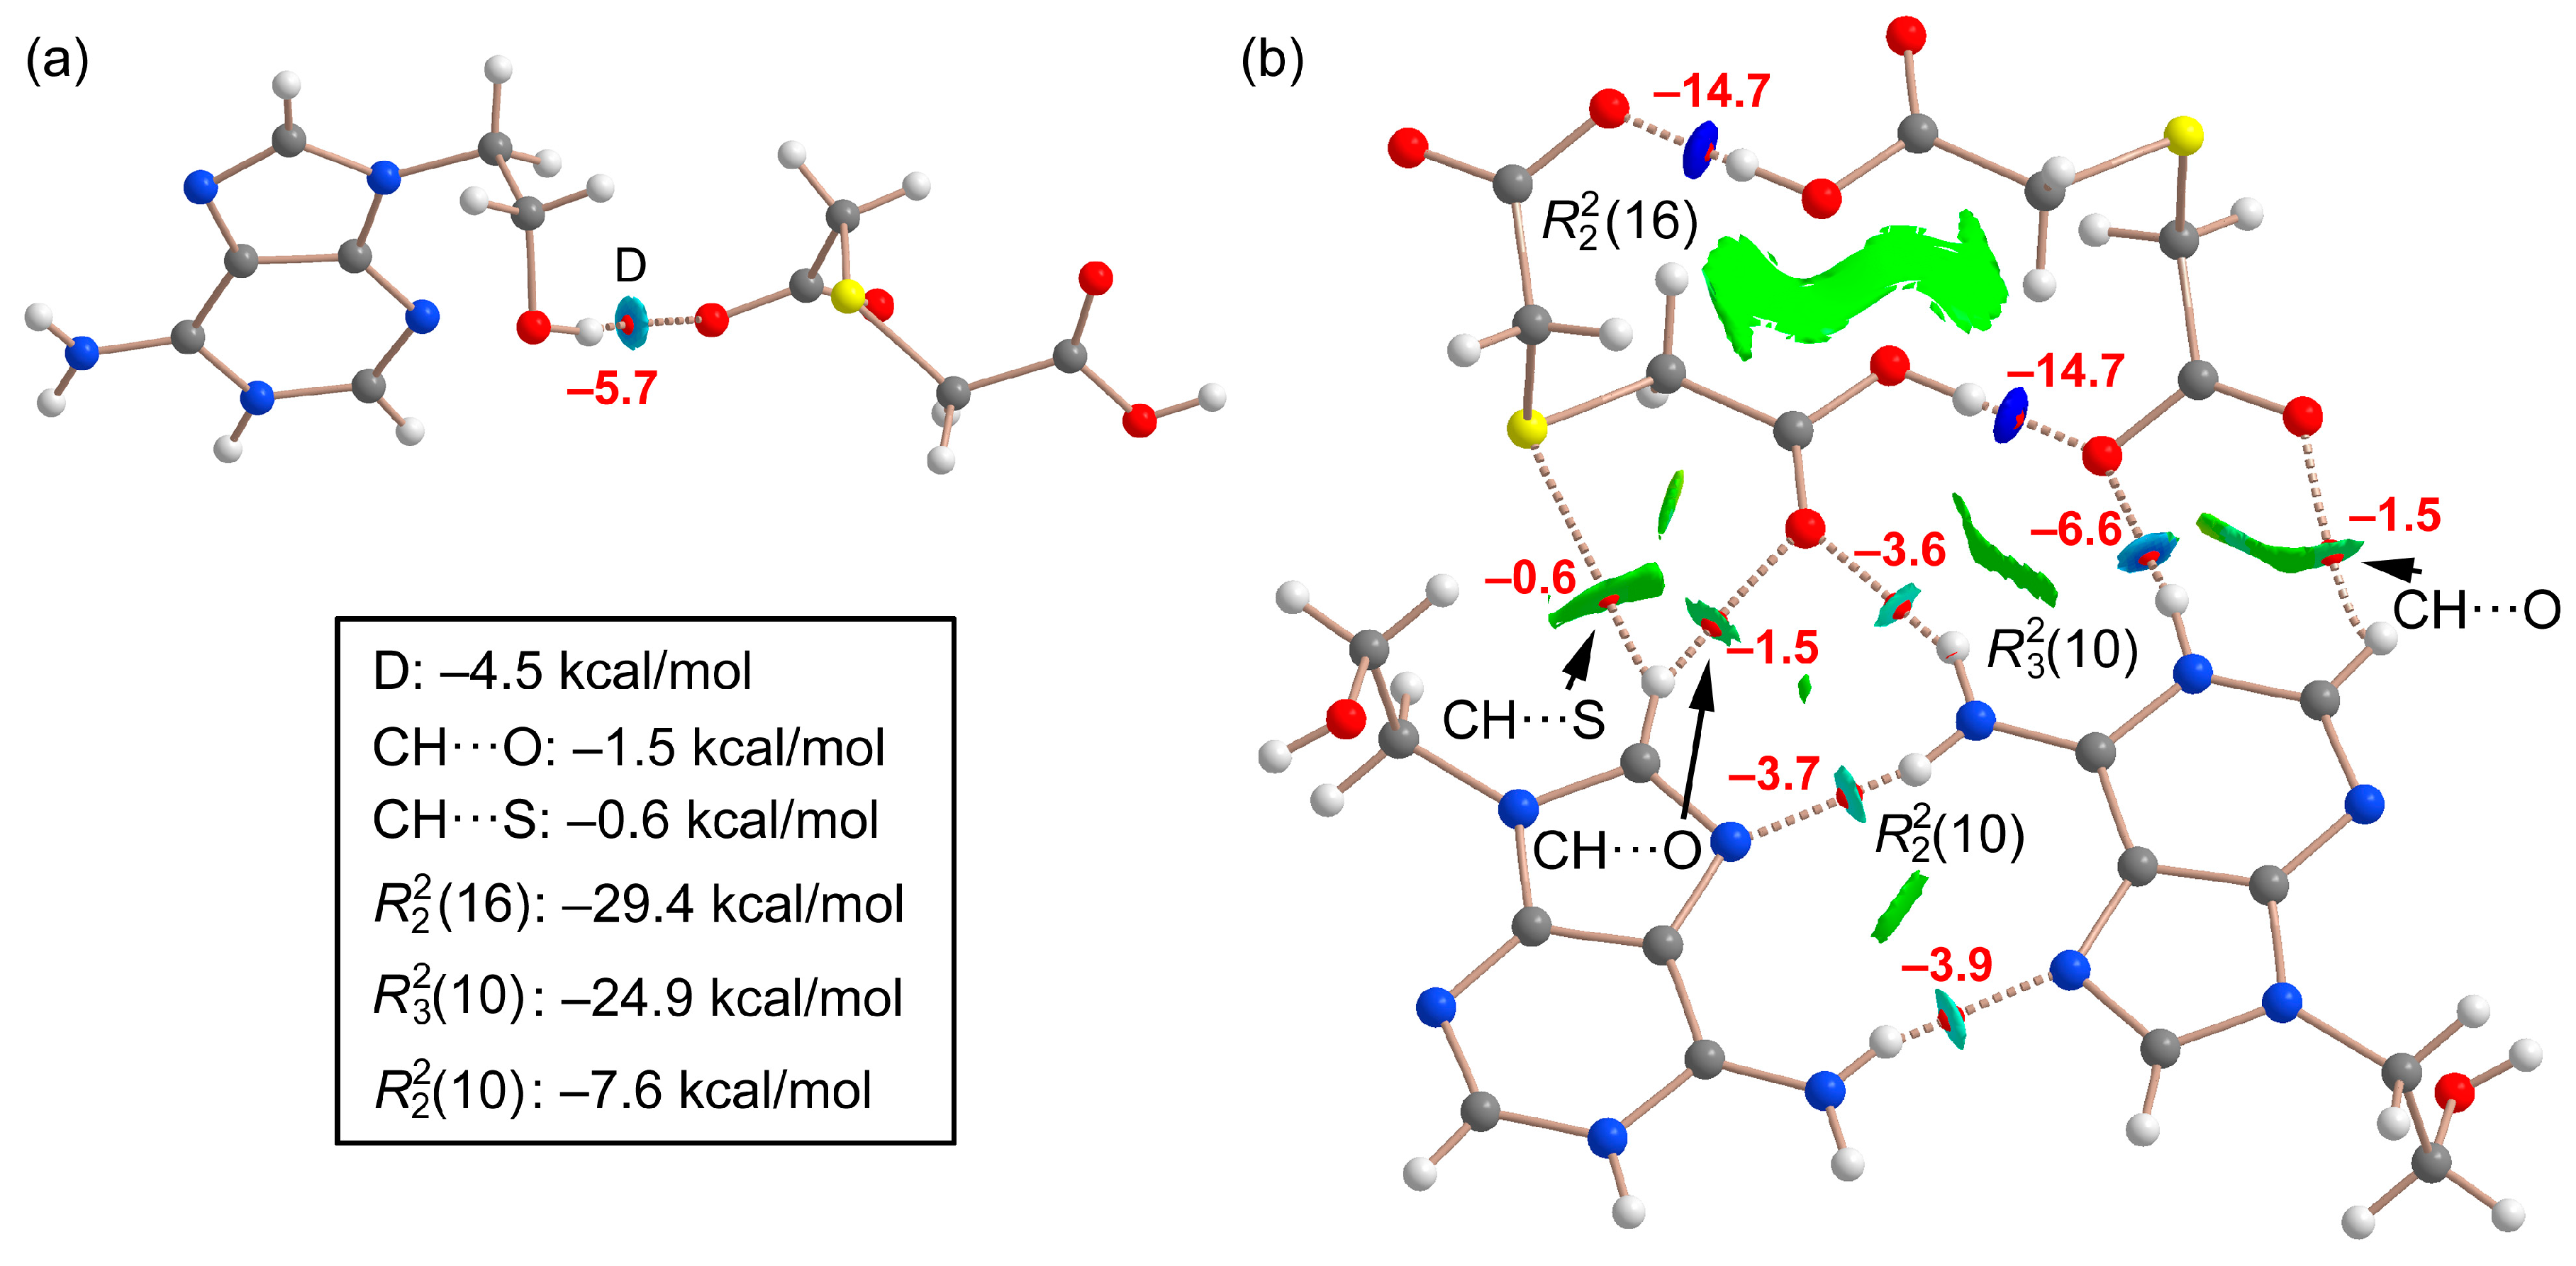
2.1.1. [(H9Heade+)(Htda–), 1:1] Salt, 1
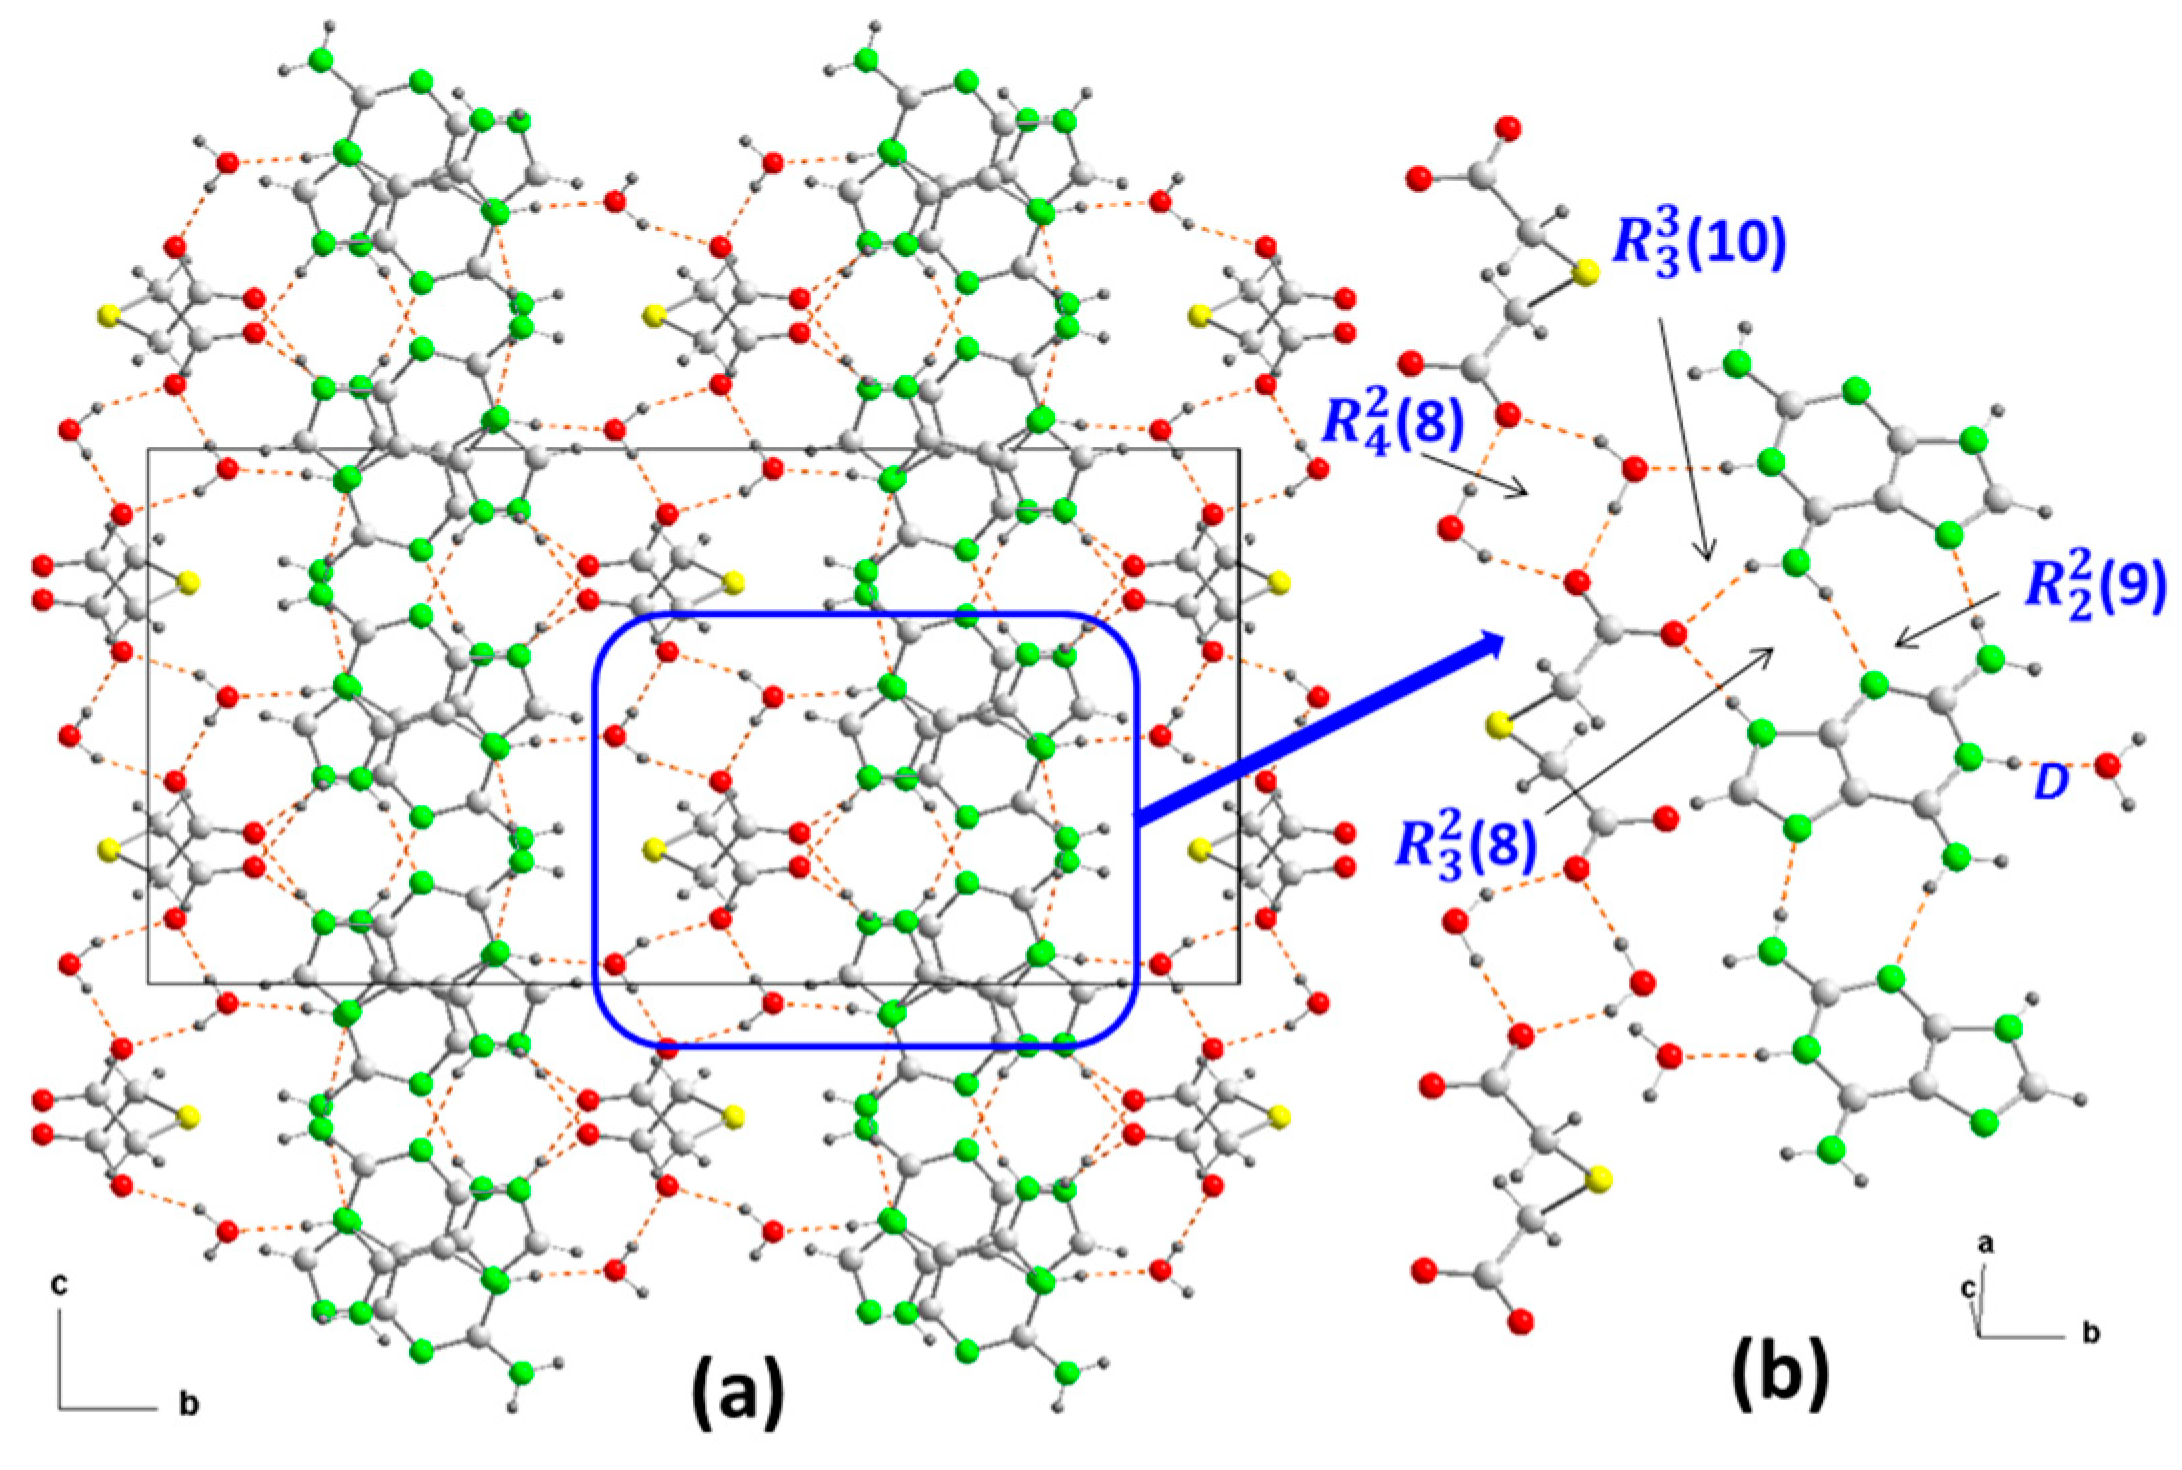
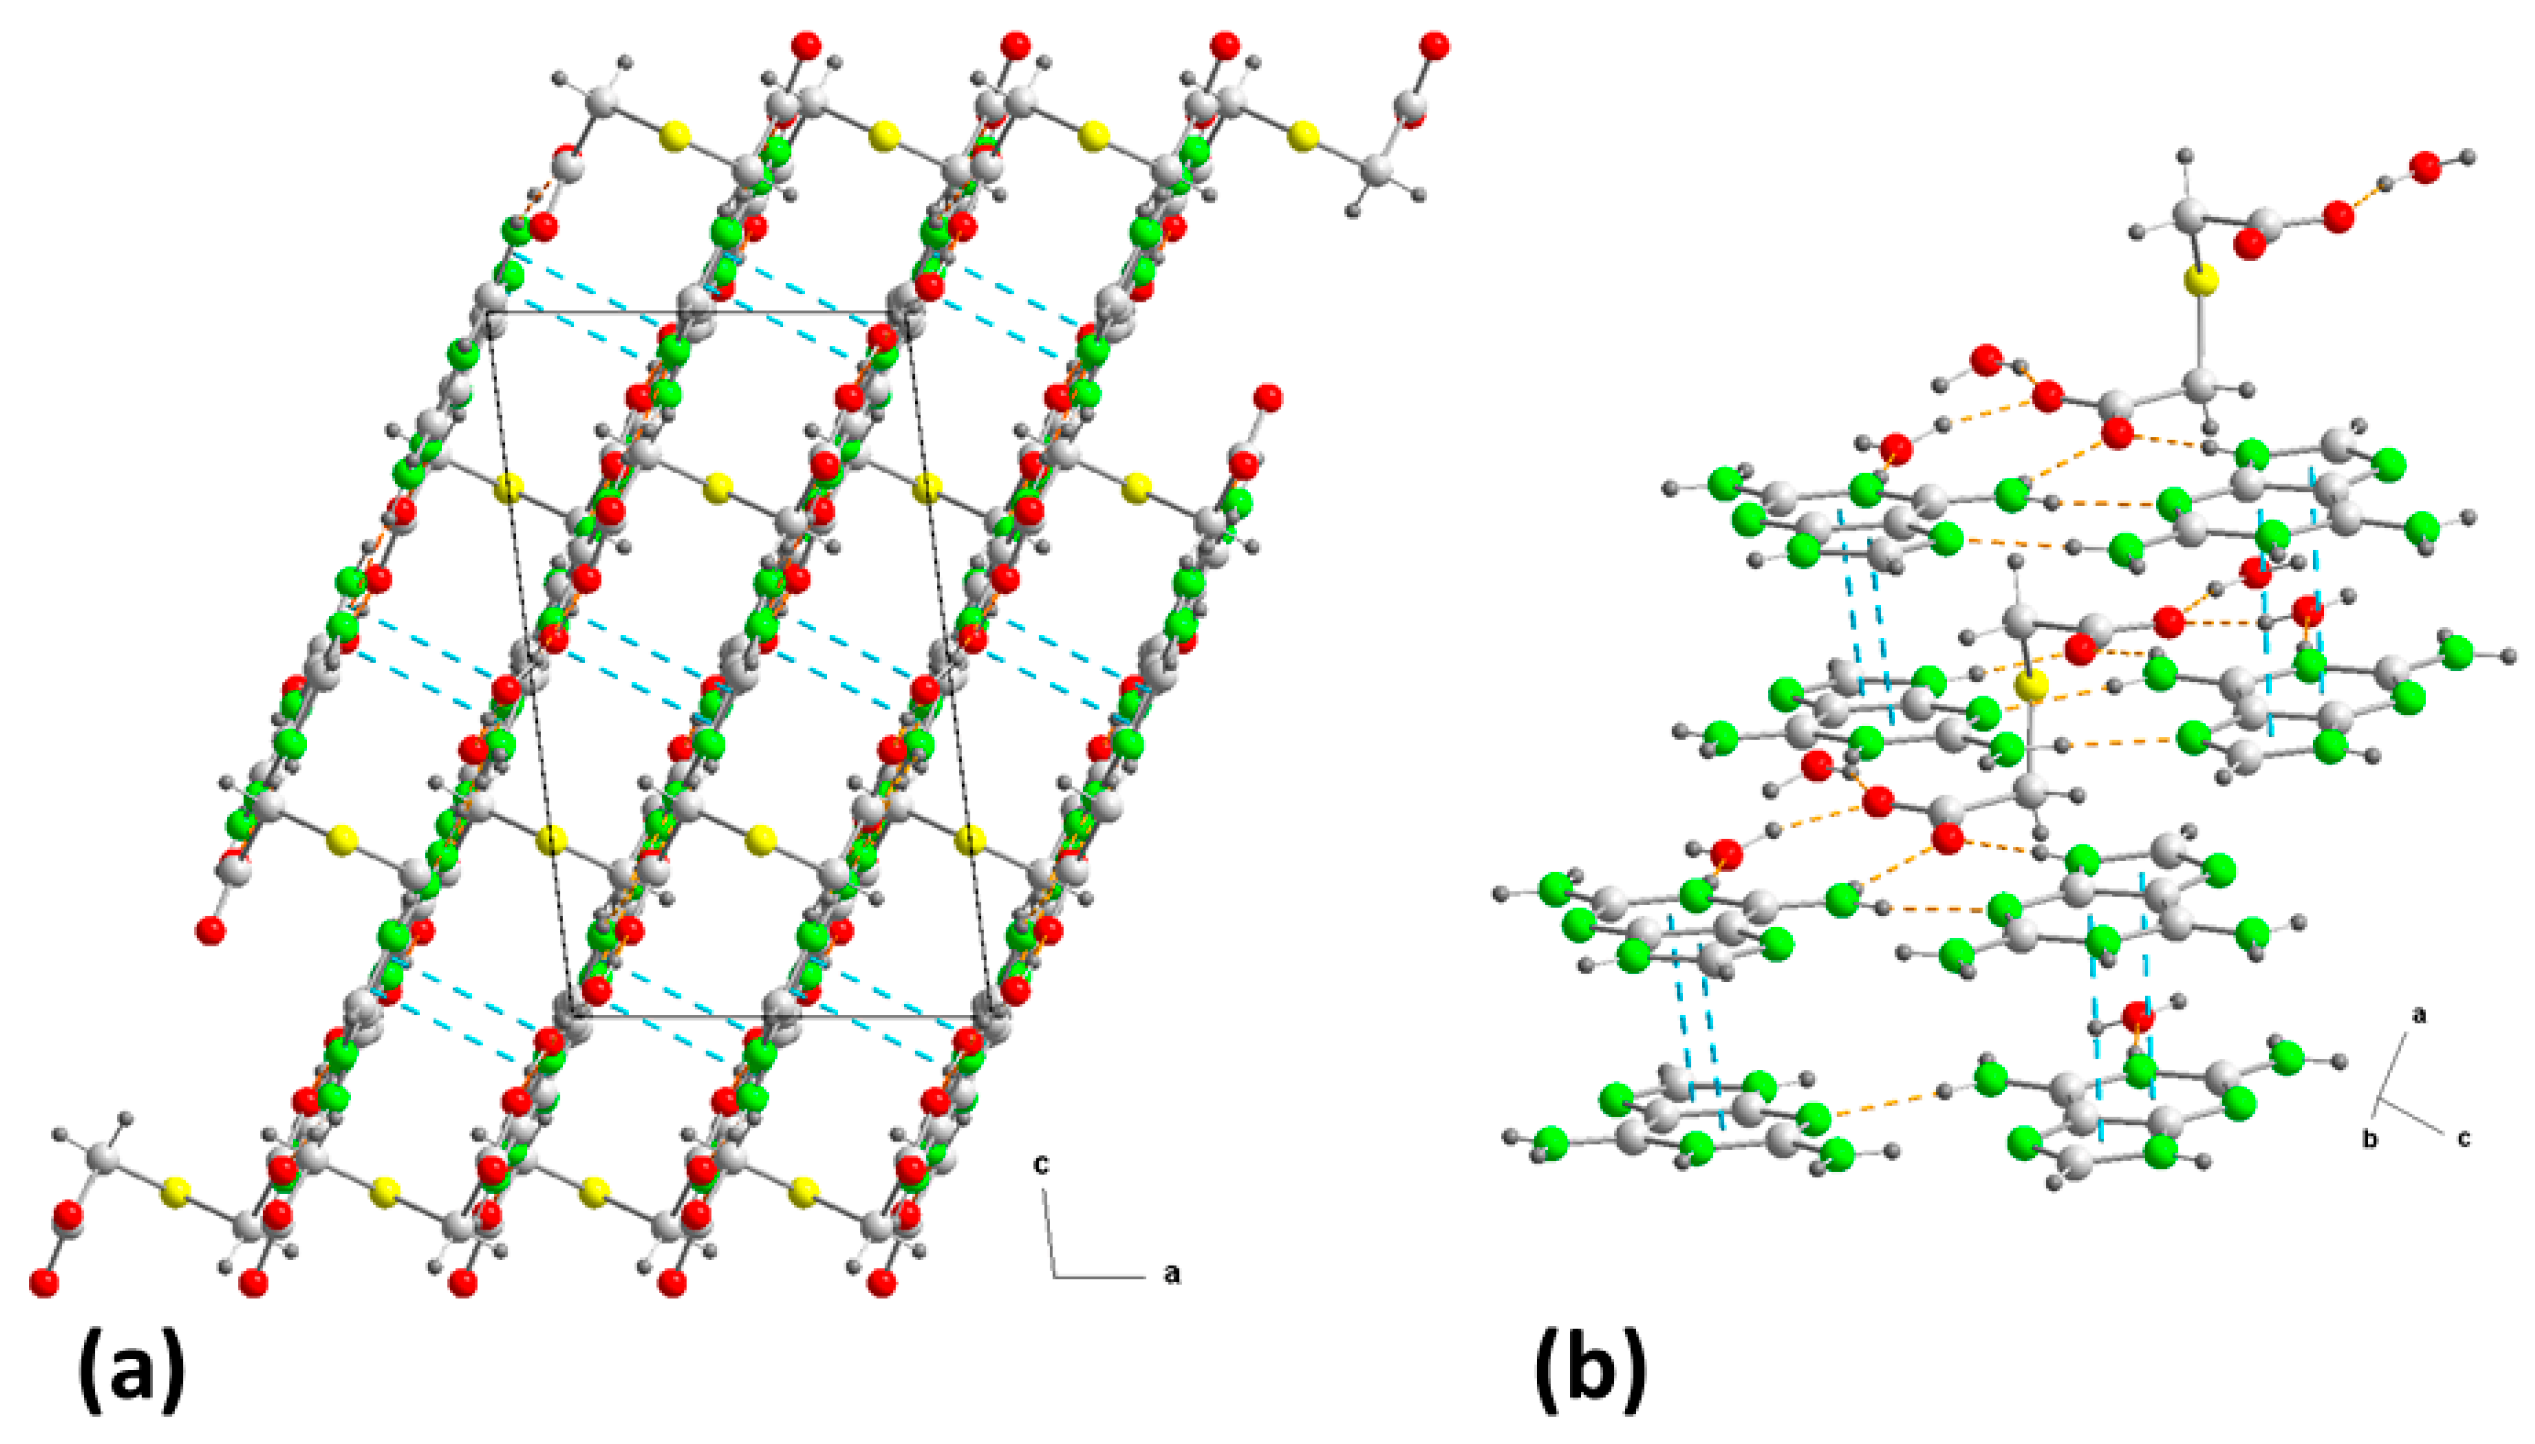
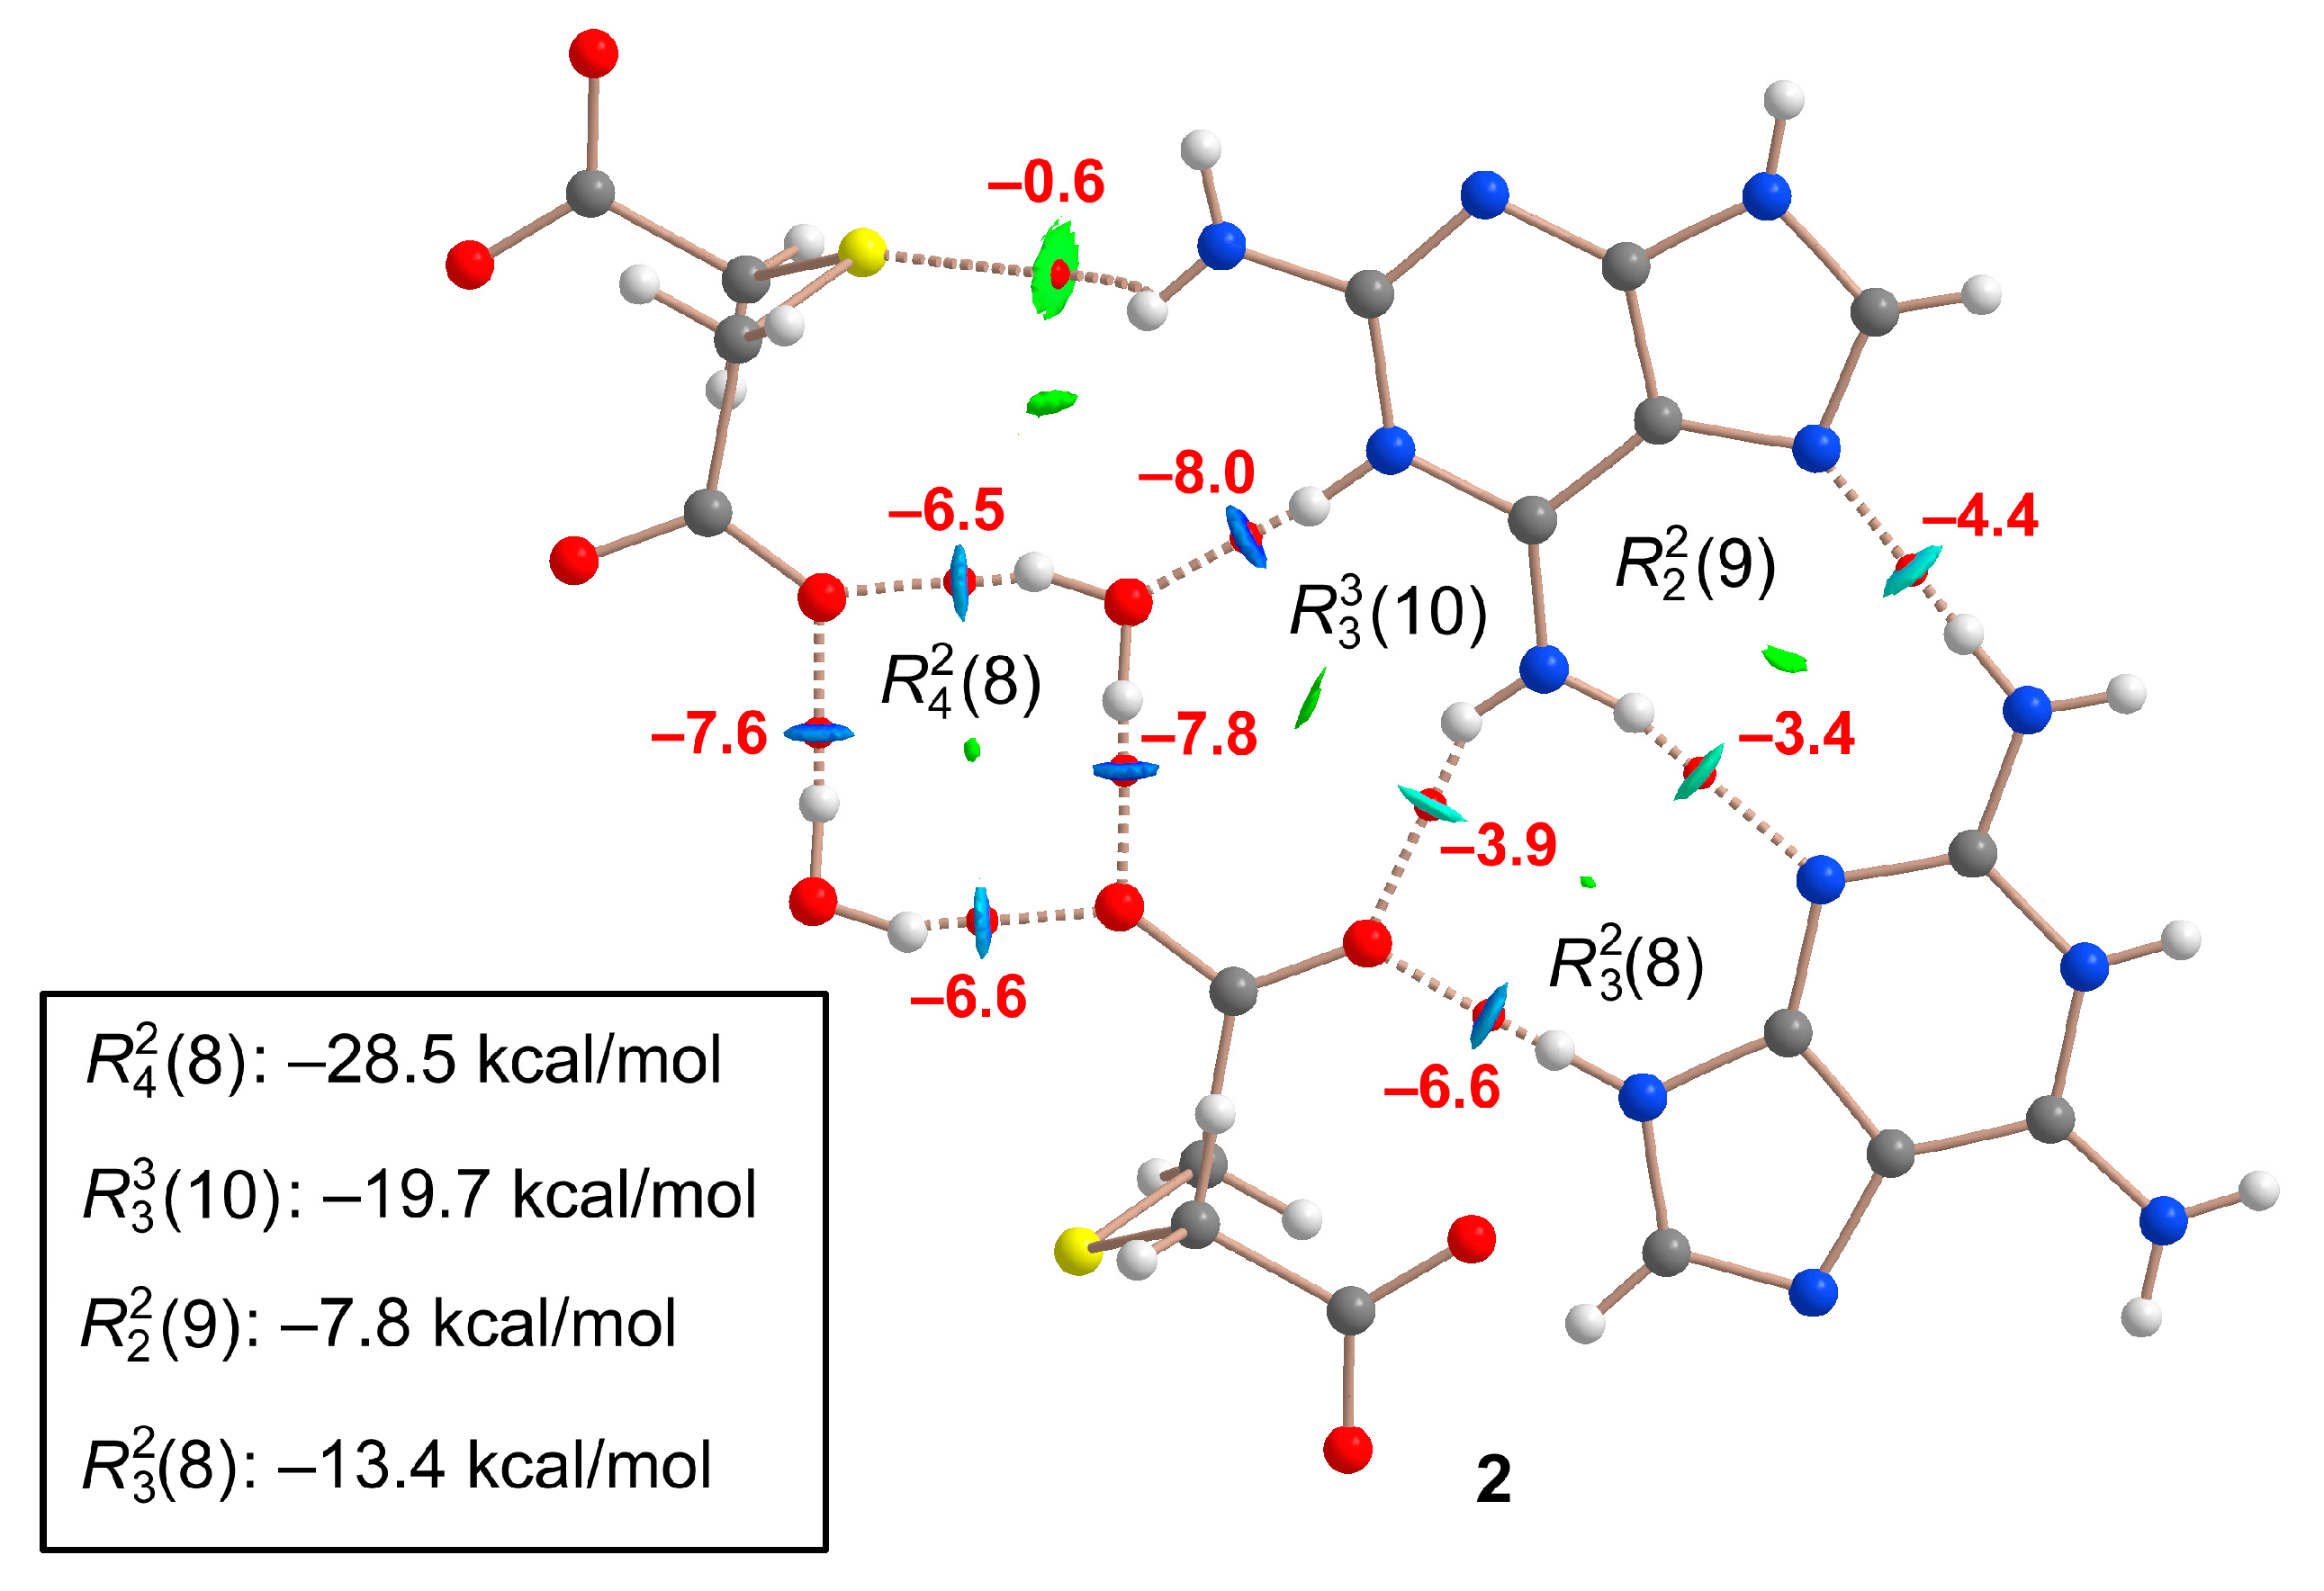
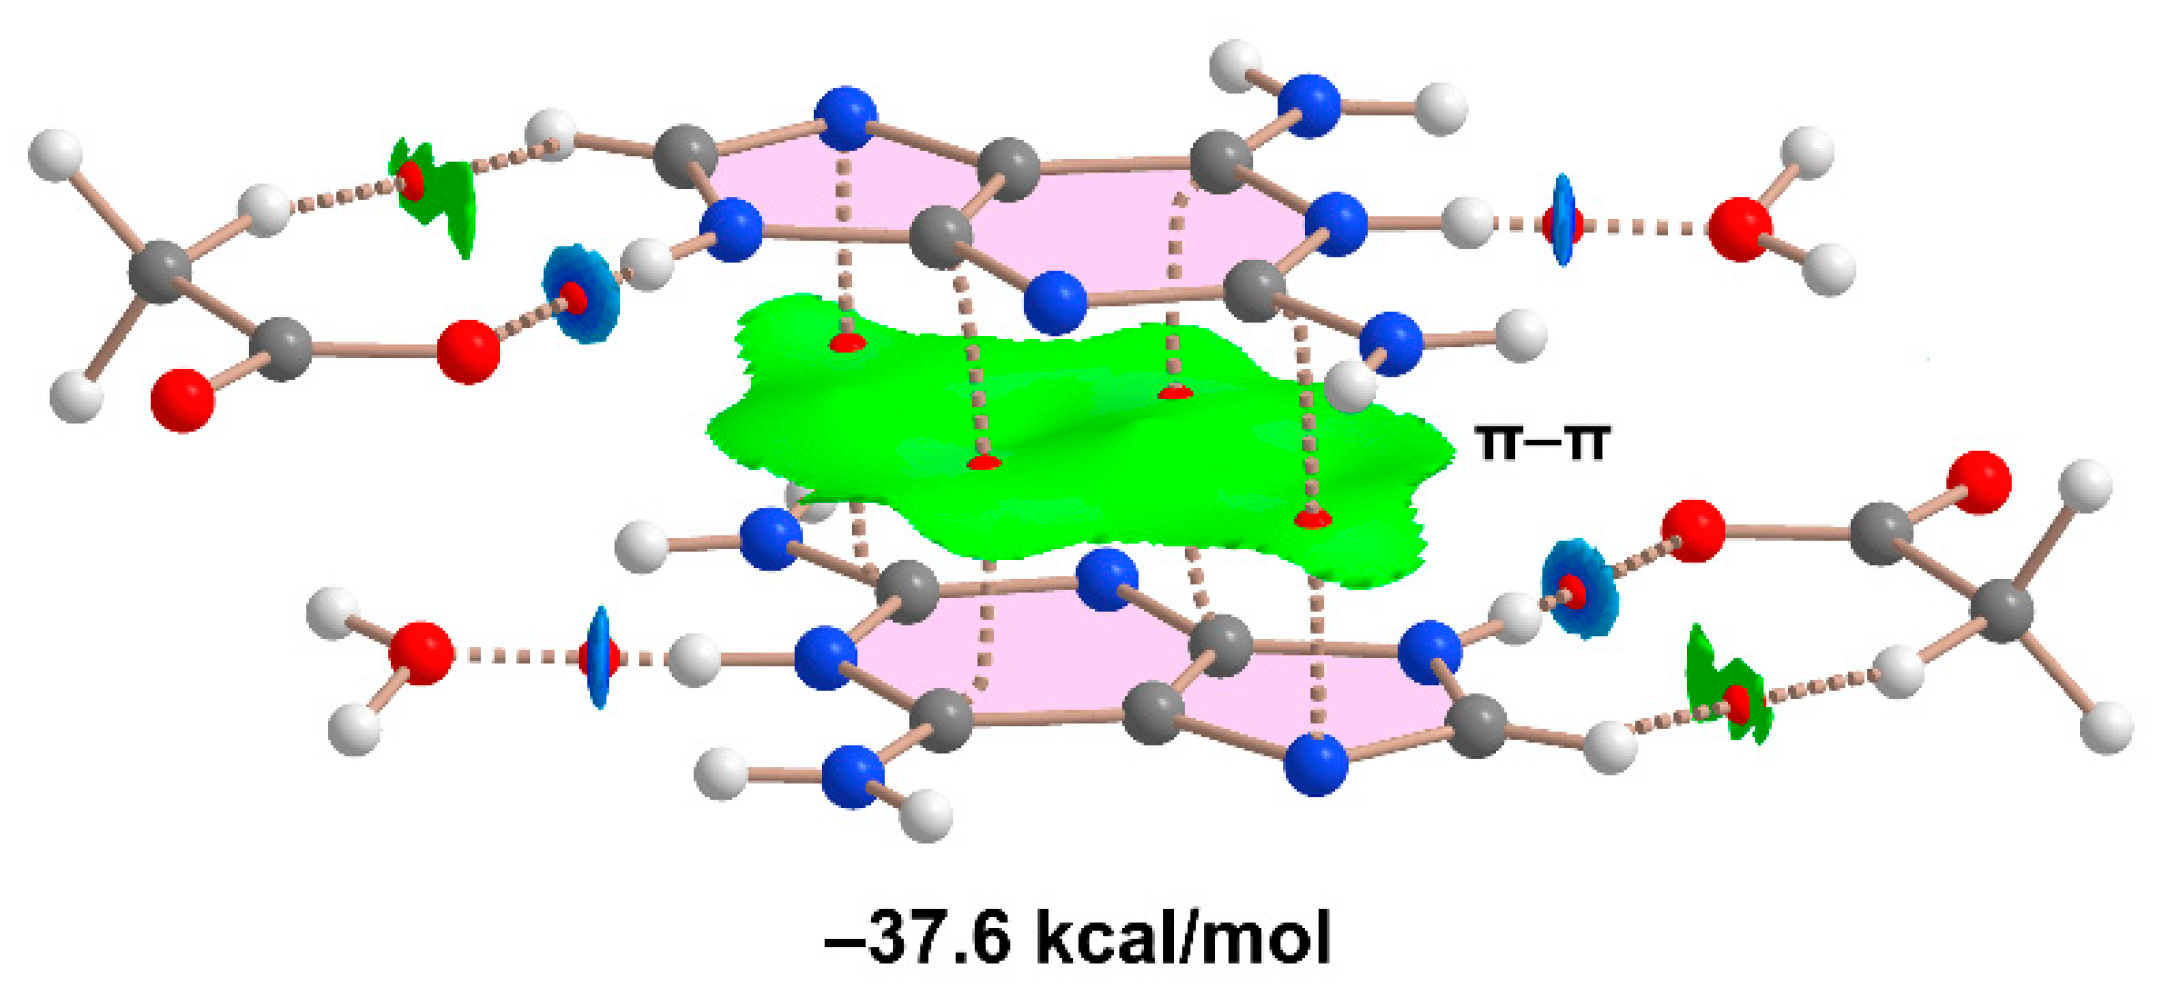
2.1.2. [(Hdap+)2(tda2−)·2H2O, 2:1:2] Salt Hydrate, 2
2.2. IR Spectra
2.3. 1H and 13C Spectroscopic Analysis
2.4. Salt–Co-Crystal Continuum
- (1)
- When carboxylic acids are used as conformers, an analysis of the C–O bond distances can distinguish between solid features of salt or co-crystal character. If both C–O distances differ by less than 0.03 Å the compound must be considered as a salt, whereas when one suspects a co-crystal structure, the distances C=O and C–OH within the carboxyl group differ by more than 0.08 Å [30]. In the compounds studied here, the distances for C=O and C–OH exhibit values of 1.235/1.221 and 1.283/1.308 for 1, and 1.224 Å and 1.231 Å for 2, respectively, resulting in differences of 0.048 and 0.087 Å for the two carboxylic groups of 1, and of 0.007 for 2. These values align with those found in salts containing carboxylic acids as coformers, indicating proton transfer from the acid to the base. However, at 1 the value found for the second carboxylic group, which is slightly higher than 0.08 A, is consistent with the absence of proton transfer and, consequently, the veracity of the method proposed by Gobetto et al. [30].
- (2)
- As an alternative approach to assessing the equilibrium between co-crystallization and proton transfer in a range of acid–base reactions, Aakeröy et al. [31] conducted a comparative analysis of crystal data involving a series of salts and co-crystals. Their study revealed that the average ratio of the carbonyl, C=O bond distance to the C–OH bond distance in co-crystals is 1.08, while the ratio of the C–O/C–O bond distance for the carboxylate anion is 1.02. Applying this concept to the compounds studied, the C–O/C–O ratios obtained are 1.039–1.071 Å for 1 and 1.005 Å for 2. These values strongly support the inference that 2 is a salt, while 1 comprises deprotonated and neutral carboxylic groups, validating the assignment previously deduced from IR spectra and ΔpKa values for these systems studied. Furthermore, these values align consistently with calculations for other multicomponent crystals involving thiodiacetic acid as a coformer, as previously documented [8,9,10,11,12,13,14].
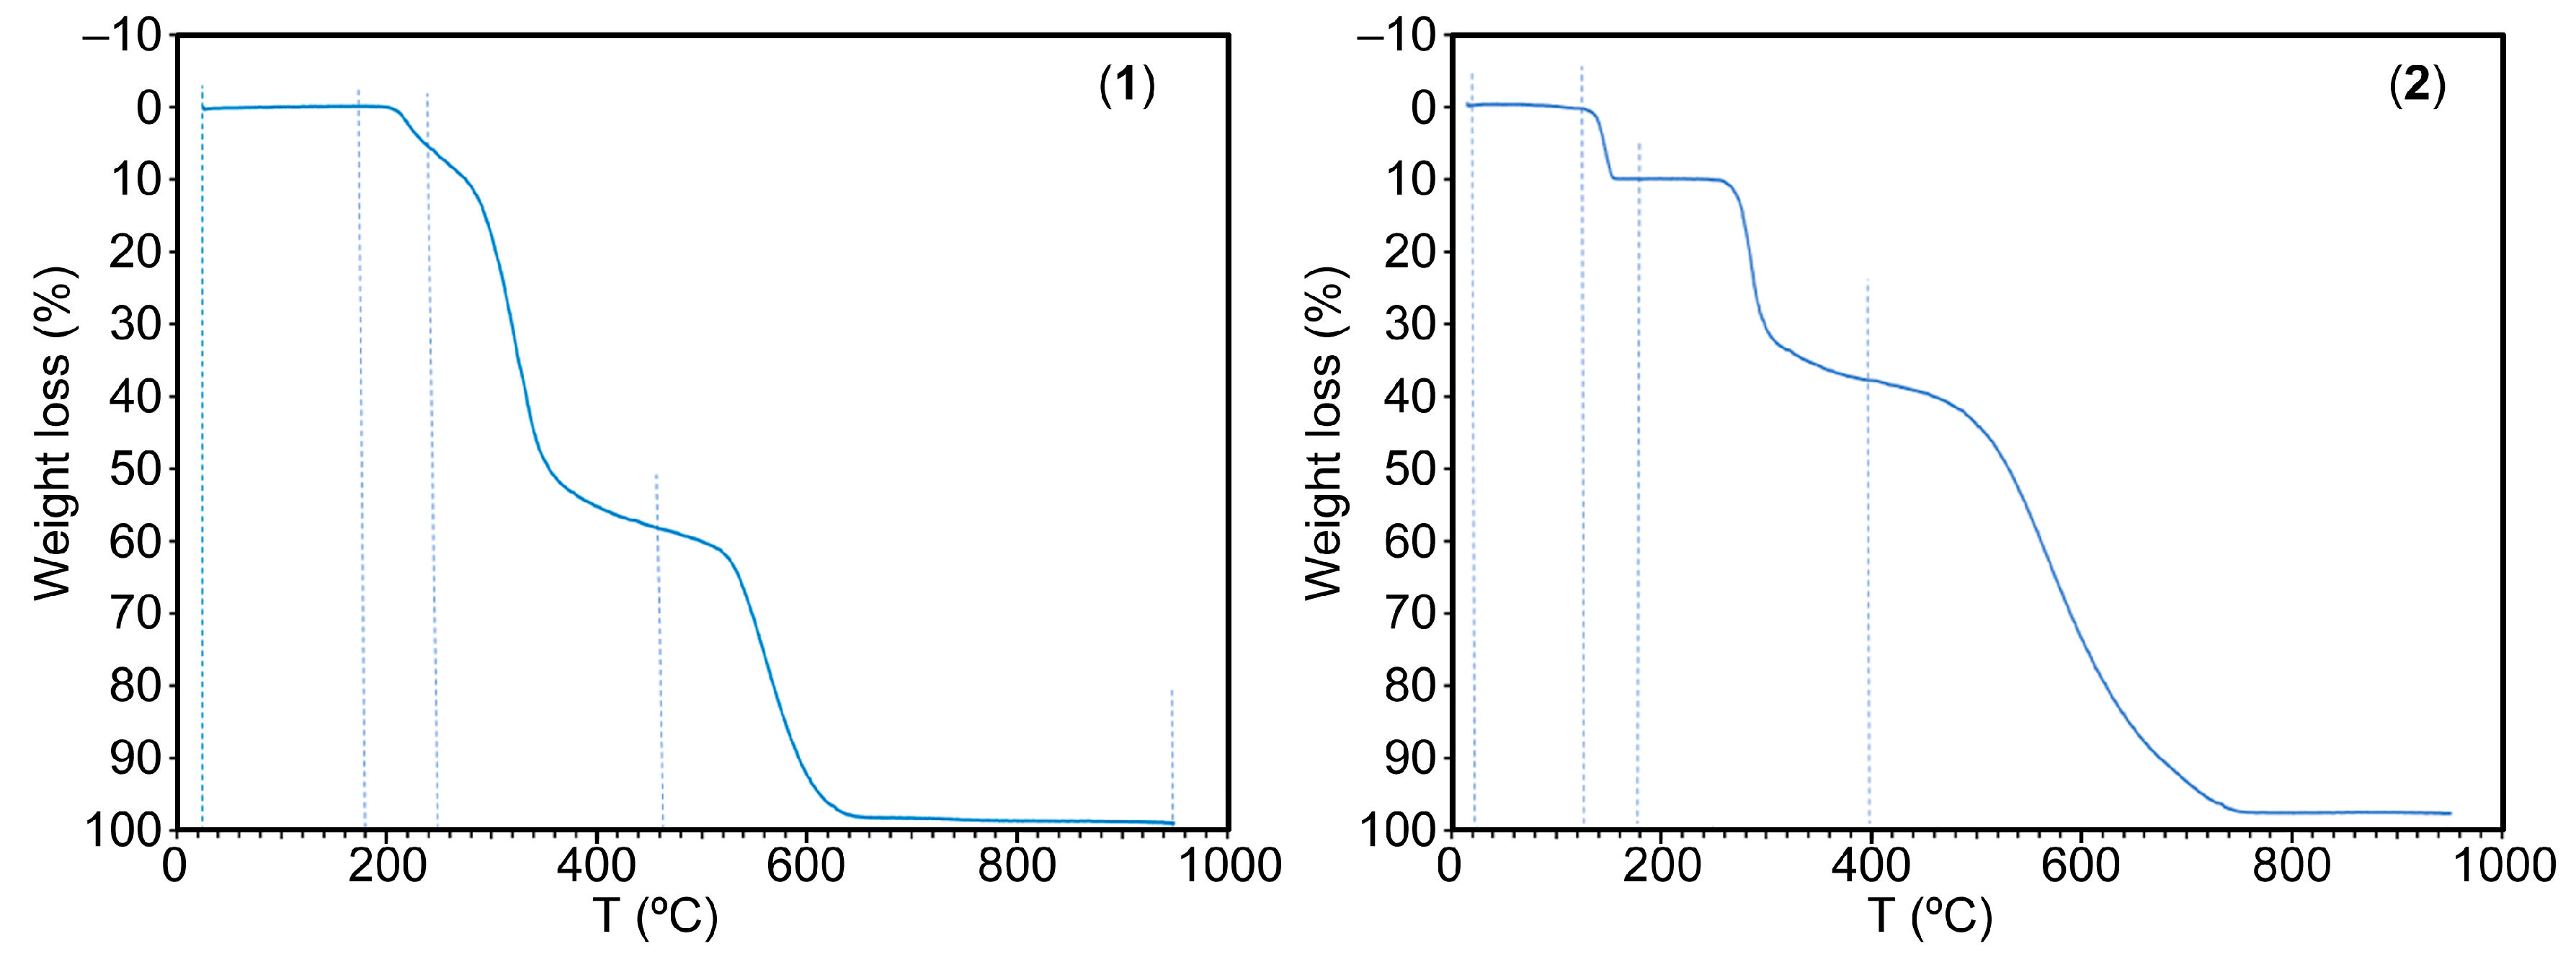
2.5. Thermal Analysis
2.6. DSC Analysis
2.7. DFT Calculations
3. Materials and Methods
3.1. Instrumentation
3.2. Single-Crystal X-ray Diffraction
3.3. Preparation of Crystals 1 and 2
3.3.1. Crystals of [(H9Heade+)(Htda–)], 1
3.3.2. Crystals of [(Hdap+)2(tda2–)]·2H2O, 2
3.4. DFT Calculations
4. Conclusions
Supplementary Materials
Author Contributions
Funding
Institutional Review Board Statement
Informed Consent Statement
Data Availability Statement
Acknowledgments
Conflicts of Interest
References
- Kavanagh, O.N.; Walker, G.; Lusi, M. Graph-Set Analysis Helps to Understand Charge Transfer in a Novel Ionic Cocrystal When the ΔpKa Rule Fails. Cryst. Growth Des. 2019, 19, 5308–5313. [Google Scholar] [CrossRef]
- Grothe, E.; Meekes, H.; Vlieg, E.; ter Horst, J.H.; de Gelder, R. Solvates, Salts, and Cocrystals: A Proposal for a Feasible Classification System. Cryst. Growth Des. 2016, 16, 3237–3243. [Google Scholar] [CrossRef]
- Bolla, G.; Sarma, B.; Nangia, A.K. Crystal Engineering of Pharmaceutical Cocrystals in the Discovery and Development of Improved Drugs. Chem. Rev. 2022, 122, 11514–11603. [Google Scholar] [CrossRef]
- Childs, S.L.; Stahly, G.P.; Park, A. The Salt-Cocrystal Continuum: The Influence of Crystal Structure on Ionization State. Mol. Pharm. 2007, 4, 323–338. [Google Scholar] [CrossRef]
- Shi, L.; Chen, Z.; Kafafy, H.; Zhang, Z.; Zhu, G.; Yao, J.; Zhang, G. Synthesis, powder diffraction pattern, crystal structure determination of the pharmaceutical co-crystal of levetiracetam and 3,5-dinitrosalicylic acid. Powder Diffr. 2023, 1–9. [Google Scholar] [CrossRef]
- Liu, M.; Qian, Y.; Wu, Y.; Zhang, F. Multicomponent synthesis of di-aryl dithiocarbamates via electron donor–acceptor photoactivation with thianthrenium salts. Green Chem. 2023, 25, 3852–3856. [Google Scholar] [CrossRef]
- Ilardi, E.A.; Vitaku, E.; Njardarson, J.T. Data-Mining for Sulfur and Fluorine: An Evaluation of Pharmaceuticals To Reveal Opportunities for Drug Design and Discovery. J. Med. Chem. 2014, 57, 2832–2842. [Google Scholar] [CrossRef]
- Bałczewski, P.; Biczak, R.; Turek, M.; Pawłowska, B.; Różycka-Sokołowska, E.; Marciniak, B.; Deska, M.; Skalik, J. Ammonium 2,2′-thiodiacetates—Selective and environmentally safe Herbicides. Ecotoxicol. Environ. Saf. 2018, 163, 408–416. [Google Scholar] [CrossRef]
- Pedireddi, V.R. Design and Synthesis of Novel Aza-Aromatic Host-Guest Complexes: Crystal Structures of 1,7-Phenanthroline with Thiodipropionic and Thiodiglycolic Acids. Cryst. Growth Des. 2001, 1, 383–385. [Google Scholar] [CrossRef]
- Aakeröy, C.B.; Beatty, A.M.; Helfrich, B.A. A High-Yielding Supramolecular Reaction. J. Am. Chem. Soc. 2002, 124, 14425–14432. [Google Scholar] [CrossRef]
- Pedireddi, V.R.; Chatterjee, S.; Ranganathan, A.; Rao, C.N.R. A Study of Supramolecular Hydrogen Bonded Complexes formed by Aliphatic Dicarboxylic Acids with Azaaromatic Donors. Tetrahedron 1998, 54, 9457–9474. [Google Scholar] [CrossRef]
- Ranganathan, A.; Kulkarni, G.U.; Rao, C.N.R. An Experimental Charge Density Study of the N–H+⋯O− Bonds in a Proton-Transfer System in Comparison with Regular N–H⋯O and O–H⋯N Hydrogen Bonds. Isr. J. Chem. 2004, 44, 145–156. [Google Scholar] [CrossRef]
- Tsaggeos, K.; Masiera, N.; Niwicka, A.; Dokorou, V.; Siskos, M.G.; Skoulika, S.; Michaelides, A. Crystal Structure, Thermal Behavior, and Photochemical Reactivity of a Series of Co-Crystals of trans-1,2-Bis(4-pyridyl) Ethylene with Dicarboxylic Acids. Cryst. Growth Des. 2012, 12, 2187–2194. [Google Scholar] [CrossRef]
- Gomathi, V.; Theivarasu, C. Hydrogen-bonded assemblies in the molecular crystals of 2200-thiodiacetic acid with ethylenediamine and o-phenylenediamine. Acta Cryst. 2017, C73, 97–103. [Google Scholar] [CrossRef]
- Kitade, Y.; Hayashi, M.; Yatome, C.; Ghajima, M.; Nagase, H. Inhibitory Effect on the HT-1080 Tumor Cell Invasion in Vitro Using 9-(2′-hydroxyethyl) Adenine 2′-Phosphates. Bioorg. Med. Chem. Lett. 1997, 7, 833–836. [Google Scholar] [CrossRef]
- Doleželová, E.; Klejch, T.; Špaček, P.; Slapničková, M.; Guddat, L.; Hocková, D.; Zíková, A. Acyclic nucleoside phosphonates with adenine nucleobase inhibit Trypanosoma brucei adenine phosphoribosyltransferase in vitro. Sci. Rep. 2021, 11, 13317. [Google Scholar] [CrossRef] [PubMed]
- Cooperwood, J.S.; Gumina, G.; Boudinot, F.D.; Chu, C.K. Nucleoside and Nucleotide Prodrugs. In Recent Advances in Nucleosides: Chemistry and Chemotherapy; Elsevier: Amsterdam, The Netherlands, 2002; pp. 91–147. [Google Scholar]
- Szabla, R.; Zdrowowicz, M.; Spisz, P.; Green, N.J.; Stadlbauer, P.; Kruse, H.; Šponer, J.; Rak, J. 2,6-diaminopurine promotes repair of DNA lesions under prebiotic conditions. Nat. Commun. 2021, 12, 3018. [Google Scholar] [CrossRef] [PubMed]
- Kapinos, L.E.; Operschall, B.P.; Larsen, E.; Sigel, H. Understanding the Acid–Base Properties of Adenosine: The Intrinsic Basicities of N1, N3 and N7. Chem. Eur. J. 2011, 17, 8156–8164. [Google Scholar] [CrossRef] [PubMed]
- Reinert, H.; Weiss, R. Chemical complex behavior of pyrimidine derivatives. XI. Stability constants of some purine and pyrimidine-copper complexes. Hoppe-Seylers Z. Physiol. Chem. 1969, 350, 1310–1320. [Google Scholar] [CrossRef]
- Arena, G.; Musumeci, S.; Rizzareli, E.; Sammartano, S. Potentiometric Investigation of Simple and Mixed Complexes of Cupric Ion in Aqueous Solution. Inorg. Chim. Acta 1978, 27, 31–35. [Google Scholar] [CrossRef]
- Cruz-Cabeza, A.J.; Lusi, M.; Wheatcroft, H.P.; Bond, A.D. The role of solvation in proton transfer reactions: Implications for predicting salt/co-crystal formation using the ΔpKa rule. Faraday Discuss. 2022, 235, 446–466. [Google Scholar] [CrossRef]
- Paul, S. The Crystal Structure of Thiodiglycollic Acid. Acta Crystallogr. 1967, 23, 490–494. [Google Scholar] [CrossRef]
- Takenaka, A.; Shibata, M.; Sasada, Y. Three Crystalline Forms of N9-(2-hydroxyethyl)adenine Resulting from the Different Stacking of Hydrogen-Bonded Layers. Acta Crystallogr. Sect. C Cryst. Struct. Commun. 1986, 42, 1336–1340. [Google Scholar] [CrossRef]
- Alduhaish, O.; Arman, H.D.; Wang, H.; Alfooty, K.; Chenen, B. Solvent Dependent Structures of Hydrogen-Bonded Organic Frameworks of 2,6-Diaminopurine. Cryst. Growth Des. 2014, 14, 3634–3638. [Google Scholar] [CrossRef]
- Atria, A.M.; Garland, M.T.; Baggio, R. 2,6-Diamino-9H-purine monohydrate and bis(2,6-diamino-9H-purin-1-ium) 2-(2-carboxylatophenyl)acetate heptahydrate: Two simple structures with very complex hydrogen-bonding schemes. Acta Cryst. 2010, C66, o547–o552. [Google Scholar] [CrossRef]
- Socrates, G. (Ed.) Infrared and Raman Characteristic Group Frequencies—Tables and Charts, 3rd ed.; John Wiley & Sons, Ltd.: Chichester, UK, 2001. [Google Scholar]
- Bellamy, L.J. The Infrared Spectra of Complex Molecules, 3rd ed.; John Willey and Sons: New York, NY, USA, 1975; Volume 1. [Google Scholar]
- Nakanishi, K. Infrared Absorption Spectroscopy-Practial, 4th ed.; Holden-Day Inc.: San Francisco, CA, USA, 1966. [Google Scholar]
- Cerreia Vioglio, P.; Chierotti, M.R.; Gobetto, R. Pharmaceutical aspects of salt and cocrystal forms of APIs and characterization challenges. Adv. Drug Deliv. Rev. 2017, 117, 86–110. [Google Scholar] [CrossRef]
- Aakeröy, C.B.; Rajbanshi, A.; Li, Z.J.; Desper, J. Mapping out the synthetic landscape for re-crystallization, co-crystallization and salt formation. CrystEngComm 2010, 12, 4231–4239. [Google Scholar] [CrossRef]
- Emamian, S.; Lu, T.; Kruse, H.; Emamian, H. Exploring Nature and Predicting Strength of Hydrogen Bonds: A Correlation Analysis Between Atoms-in-Molecules Descriptors, Binding Energies, and Energy Components of Symmetry-Adapted Perturbation Theory. J. Comput. Chem. 2019, 40, 2868–2881. [Google Scholar] [CrossRef]
- Sheldrick, G.M. SADABS, Program for Empirical Absorption Correction of Area Detector Data; University of Göttingen: Göttingen, Germany, 2001. [Google Scholar]
- Sheldrick, G.M. SHELXT—Integrated space-group and crystal structure Determination. Acta Crystallogr. 2015, A71, 3–8. [Google Scholar] [CrossRef]
- Putz, H.; Brandenburg, K. Diamond—Crystal and Molecular Structure Visualization, version 4.6.2; Crystal Impact GbR: Bonn, Germany, 2020. [Google Scholar]
- Frisch, M.J.; Trucks, G.W.; Schlegel, H.B.; Scuseria, G.E.; Robb, M.A.; Cheeseman, J.R.; Scalmani, G.; Barone, V.; Petersson, G.A.; Nakatsuji, H.; et al. Gaussian 16; Revision B.01; Gaussian, Inc.: Wallingford, CT, USA, 2016. [Google Scholar]
- Grimme, S.; Antony, J.; Ehrlich, S.; Krieg, H. A consistent and accurate ab initio parametrization of density functional dispersion correction (DFT-D) for the 94 elements H-Pu. J. Chem. Phys. 2010, 132, 154104–154118. [Google Scholar] [CrossRef] [PubMed]
- Weigend, F. Accurate Coulomb-fitting basis sets for H to Rn. Phys. Chem. Chem. Phys. 2006, 8, 1057–1065. [Google Scholar] [CrossRef]
- Boys, S.F.; Bernardi, F. The calculation of small molecular interactions by the differences of separate total energies. Some procedures with reduced errors. J. Mol. Phys. 1970, 19, 553–566. [Google Scholar] [CrossRef]
- Bader, R.F.W. A Bond Path: A Universal Indicator of Bonded Interactions. J. Phys. Chem. A 1998, 102, 7314–7323. [Google Scholar] [CrossRef]
- Todd, A.; Keith, T.K. AIMAll, Version 13.05.06; Gristmill Software: Overland Park, KS, USA, 2013. [Google Scholar]
- Contreras-García, J.; Johnson, E.R.; Keinan, S.; Chaudret, R.; Piquemal, J.-P.; Beratan, D.N.; Yang, W. NCIPLOT: A Program for Plotting Noncovalent Interaction Regions. J. Chem. Theory Comput. 2011, 7, 625–632. [Google Scholar] [CrossRef]
- Johnson, E.R.; Keinan, S.; Mori-Sánchez, P.; Contreras-García, J.; Cohen, A.J.; Yang, W. Revealing Noncovalent Interactions. J. Am. Chem. Soc. 2010, 132, 6498–6506. [Google Scholar] [CrossRef]


| Comp. | D–H⋯A | D–H | H⋯A | D⋯A | ∠DHA | Symmetry Code |
|---|---|---|---|---|---|---|
| 1 | O10–H10⋯O12 (a) | 0.84(3) | 1.91(3) | 2.741(2) | 171(2) | −x + 1, −y, −z |
| O21–H21⋯O11 (f) | 0.91(2) | 1.60(3) | 2.505(2) | 179(2) | x, −y, −z + 1 | |
| N1–H1⋯O11 (b) | 0.89(2) | 1.88(2) | 2.765(2) | 171(2) | x, y + 1, z | |
| N1–H1⋯O12 (b) | 0.89(2) | 2.38(2) | 2.999(2) | 127.4(2) | x, y + 1, z | |
| N6–H6A⋯N7 (c) | 0.85(2) | 2.11(2) | 2.928(2) | 163(2) | −x + 1, −y + 1, −z + 1 | |
| N6–H6B⋯O22 (d) | 0.88(2) | 2.07(2) | 2.849(2) | 146.9(2) | −x, −y + 1, −z + 1 | |
| C2–H2⋯O12 (b) | 0.95 | 2.52 | 3.096(2) | 118.9 | x, y + 1, z | |
| C8–H8⋯O22 (e) | 0.95 | 2.37 | 3.233(2) | 150.7 | x + 1, y, z | |
| C9–H9A⋯S1 (e) | 0.99 | 3.03 | 3.748(2) | 130.6 | x + 1, y, z | |
| C11–H11A⋯O21 (f) | 0.99 | 2.57 | 3.319(2) | 132.6 | −x, −y, −z + 1 | |
| C11–H11B⋯O10 (g) | 0.99 | 2.42 | 3.365(2) | 160.4 | −x, −y, −z | |
| C21–H21A⋯O21 (h) | 0.99 | 2.60 | 3.375(2) | 135.5 | −x + 1, −y, −z + 1 | |
| C21–H21B⋯O22 (e) | 0.99 | 2.27 | 3.252(2) | 172.7 | x + 1, y, z | |
| 2 | N1–H1⋯O1 (b) | 1.08(4) | 1.56(4) | 2.637(5) | 177(4) | x + 1/2, −y + 1/2, z − 1/2 |
| N2–H2A⋯N7 © | 0.93(5) | 1.99(5) | 2.920(5) | 172(4) | x + 1/2, −y + 1/2, z + 1/2 | |
| N6–H6A⋯O11 (d) | 0.96(5) | 1.92(5) | 2.805(5) | 152(4) | −x + 1/2, −y + 1/2, −z | |
| N6–H6B⋯N3 (e) | 0.94(5) | 2.07(5) | 2.991(5) | 166(4) | X − 1/2, −y + 1/2, z − 1/2 | |
| N9–H9⋯O11 (a) | 0.93(5) | 1.79(5) | 2.713(5) | 175(4) | −x + 1, y, −z + 1/2 | |
| O1–H1A⋯O12 (f) | 1.00(10) | 1.62(10) | 2.607(6) | 170(8) | −x, y, −z + 1/2 | |
| O1–H1B⋯O12 (g) | 0.79(10) | 1.93(10) | 2.628(6) | 146(10) | x, −y, z + 1/2 |
| π⋯π | Cg(I)⋯Cg(J) | α |
|---|---|---|
| Cg(1)⋯Cg(2) (i) | 3.476 | 0.202 |
| Cg(2)⋯Cg(1) (i) | 3.476 | 0.202 |
| Cg(2)⋯Cg(2) (i) | 3.391 | 0 |
| Compound | 1 | 2 |
|---|---|---|
| Empirical formula | C11H15N5O5S | C14H22N12O6S |
| Formula weight | 329.34 | 486.49 |
| Temperature/K | 100(2) | 299(2) |
| Wavelength/Å | 0.71073 | 1.54178 |
| Crystal system | Triclinic | Monoclinic |
| Space group | P | C2/c |
| Unit cell dimensions | ||
| a/Å | 4.7676(2) | 7.1171(8) |
| b/Å | 11.8744(5) | 24.422(3) |
| c/Å | 13.3350(6) | 12.0629(18) |
| α/º | 111.563(1) | 90 |
| β/º | 94.144(2) | 96.949(8) |
| γ/º | 99.129(2) | 90 |
| Volume/Å–3 | 686.15(5) | 2081.3(5) |
| Z | 2 | 4 |
| Calc. density/Mg/m3 | 1.594 | 1.553 |
| Absorp. coefc./mm–1 | 0.271 | 1.949 |
| F(000) | 344 | 1016 |
| Crystal size/mm | 0.21 × 0.11 × 0.04 | 0.12 × 0.10 × 0.08 |
| θ range/° | 2.950–30.504 | 3.620–67.156 |
| Limiting indices/h,k,l | −6/6, −16/16, −18/18 | −7/8, −28/25, −14/13 |
| Refl. collect/unique [Rint] | 31591/4178 [0.0820] | 8717/1856 [0.1315] |
| Completeness θ/°, % | 25.242, 99.8 | 67.679, 97.9 |
| Absorp. correct. | Semi-empirical | Semi-empirical |
| Max./min. transm. | 1.000/0.935 | 1.000/0.773 |
| Data/parameters | 4178/214 | 1856/174 |
| Goodness-of-fit on F2 | 1.077 | 1.019 |
| Final R indices | R1 = 0.0494, wR2 = 0.0880 | R1 = 0.0681, wR2 = 0.1208 |
| R indices (all data) | R1 = 0.0765, wR2 = 0.1001 | R1 = 0.1360, wR2 = 0.1483 |
| Largest dif. peak/hole e.Å–3 | 0.537/−0.352 | 0.409/−0.298 |
| CCDC number | 2191905 | 2191904 |
Disclaimer/Publisher’s Note: The statements, opinions and data contained in all publications are solely those of the individual author(s) and contributor(s) and not of MDPI and/or the editor(s). MDPI and/or the editor(s) disclaim responsibility for any injury to people or property resulting from any ideas, methods, instructions or products referred to in the content. |
© 2023 by the authors. Licensee MDPI, Basel, Switzerland. This article is an open access article distributed under the terms and conditions of the Creative Commons Attribution (CC BY) license (https://creativecommons.org/licenses/by/4.0/).
Share and Cite
Belmont-Sánchez, J.C.; Choquesillo-Lazarte, D.; García-Rubiño, M.E.; Matilla-Hernández, A.; Niclós-Gutiérrez, J.; Castiñeiras, A.; Frontera, A. Supramolecular Nature of Multicomponent Crystals Formed from 2,2′-Thiodiacetic Acid with 2,6-Diaminopurine or N9-(2-Hydroxyethyl)adenine. Int. J. Mol. Sci. 2023, 24, 17381. https://doi.org/10.3390/ijms242417381
Belmont-Sánchez JC, Choquesillo-Lazarte D, García-Rubiño ME, Matilla-Hernández A, Niclós-Gutiérrez J, Castiñeiras A, Frontera A. Supramolecular Nature of Multicomponent Crystals Formed from 2,2′-Thiodiacetic Acid with 2,6-Diaminopurine or N9-(2-Hydroxyethyl)adenine. International Journal of Molecular Sciences. 2023; 24(24):17381. https://doi.org/10.3390/ijms242417381
Chicago/Turabian StyleBelmont-Sánchez, Jeannette Carolina, Duane Choquesillo-Lazarte, María Eugenia García-Rubiño, Antonio Matilla-Hernández, Juan Niclós-Gutiérrez, Alfonso Castiñeiras, and Antonio Frontera. 2023. "Supramolecular Nature of Multicomponent Crystals Formed from 2,2′-Thiodiacetic Acid with 2,6-Diaminopurine or N9-(2-Hydroxyethyl)adenine" International Journal of Molecular Sciences 24, no. 24: 17381. https://doi.org/10.3390/ijms242417381
APA StyleBelmont-Sánchez, J. C., Choquesillo-Lazarte, D., García-Rubiño, M. E., Matilla-Hernández, A., Niclós-Gutiérrez, J., Castiñeiras, A., & Frontera, A. (2023). Supramolecular Nature of Multicomponent Crystals Formed from 2,2′-Thiodiacetic Acid with 2,6-Diaminopurine or N9-(2-Hydroxyethyl)adenine. International Journal of Molecular Sciences, 24(24), 17381. https://doi.org/10.3390/ijms242417381