

Discovery of GABA Aminotransferase Inhibitors via Molecular Docking, Molecular Dynamic Simulation, and Biological Evaluation

 ,
,  ,
,
Abstract
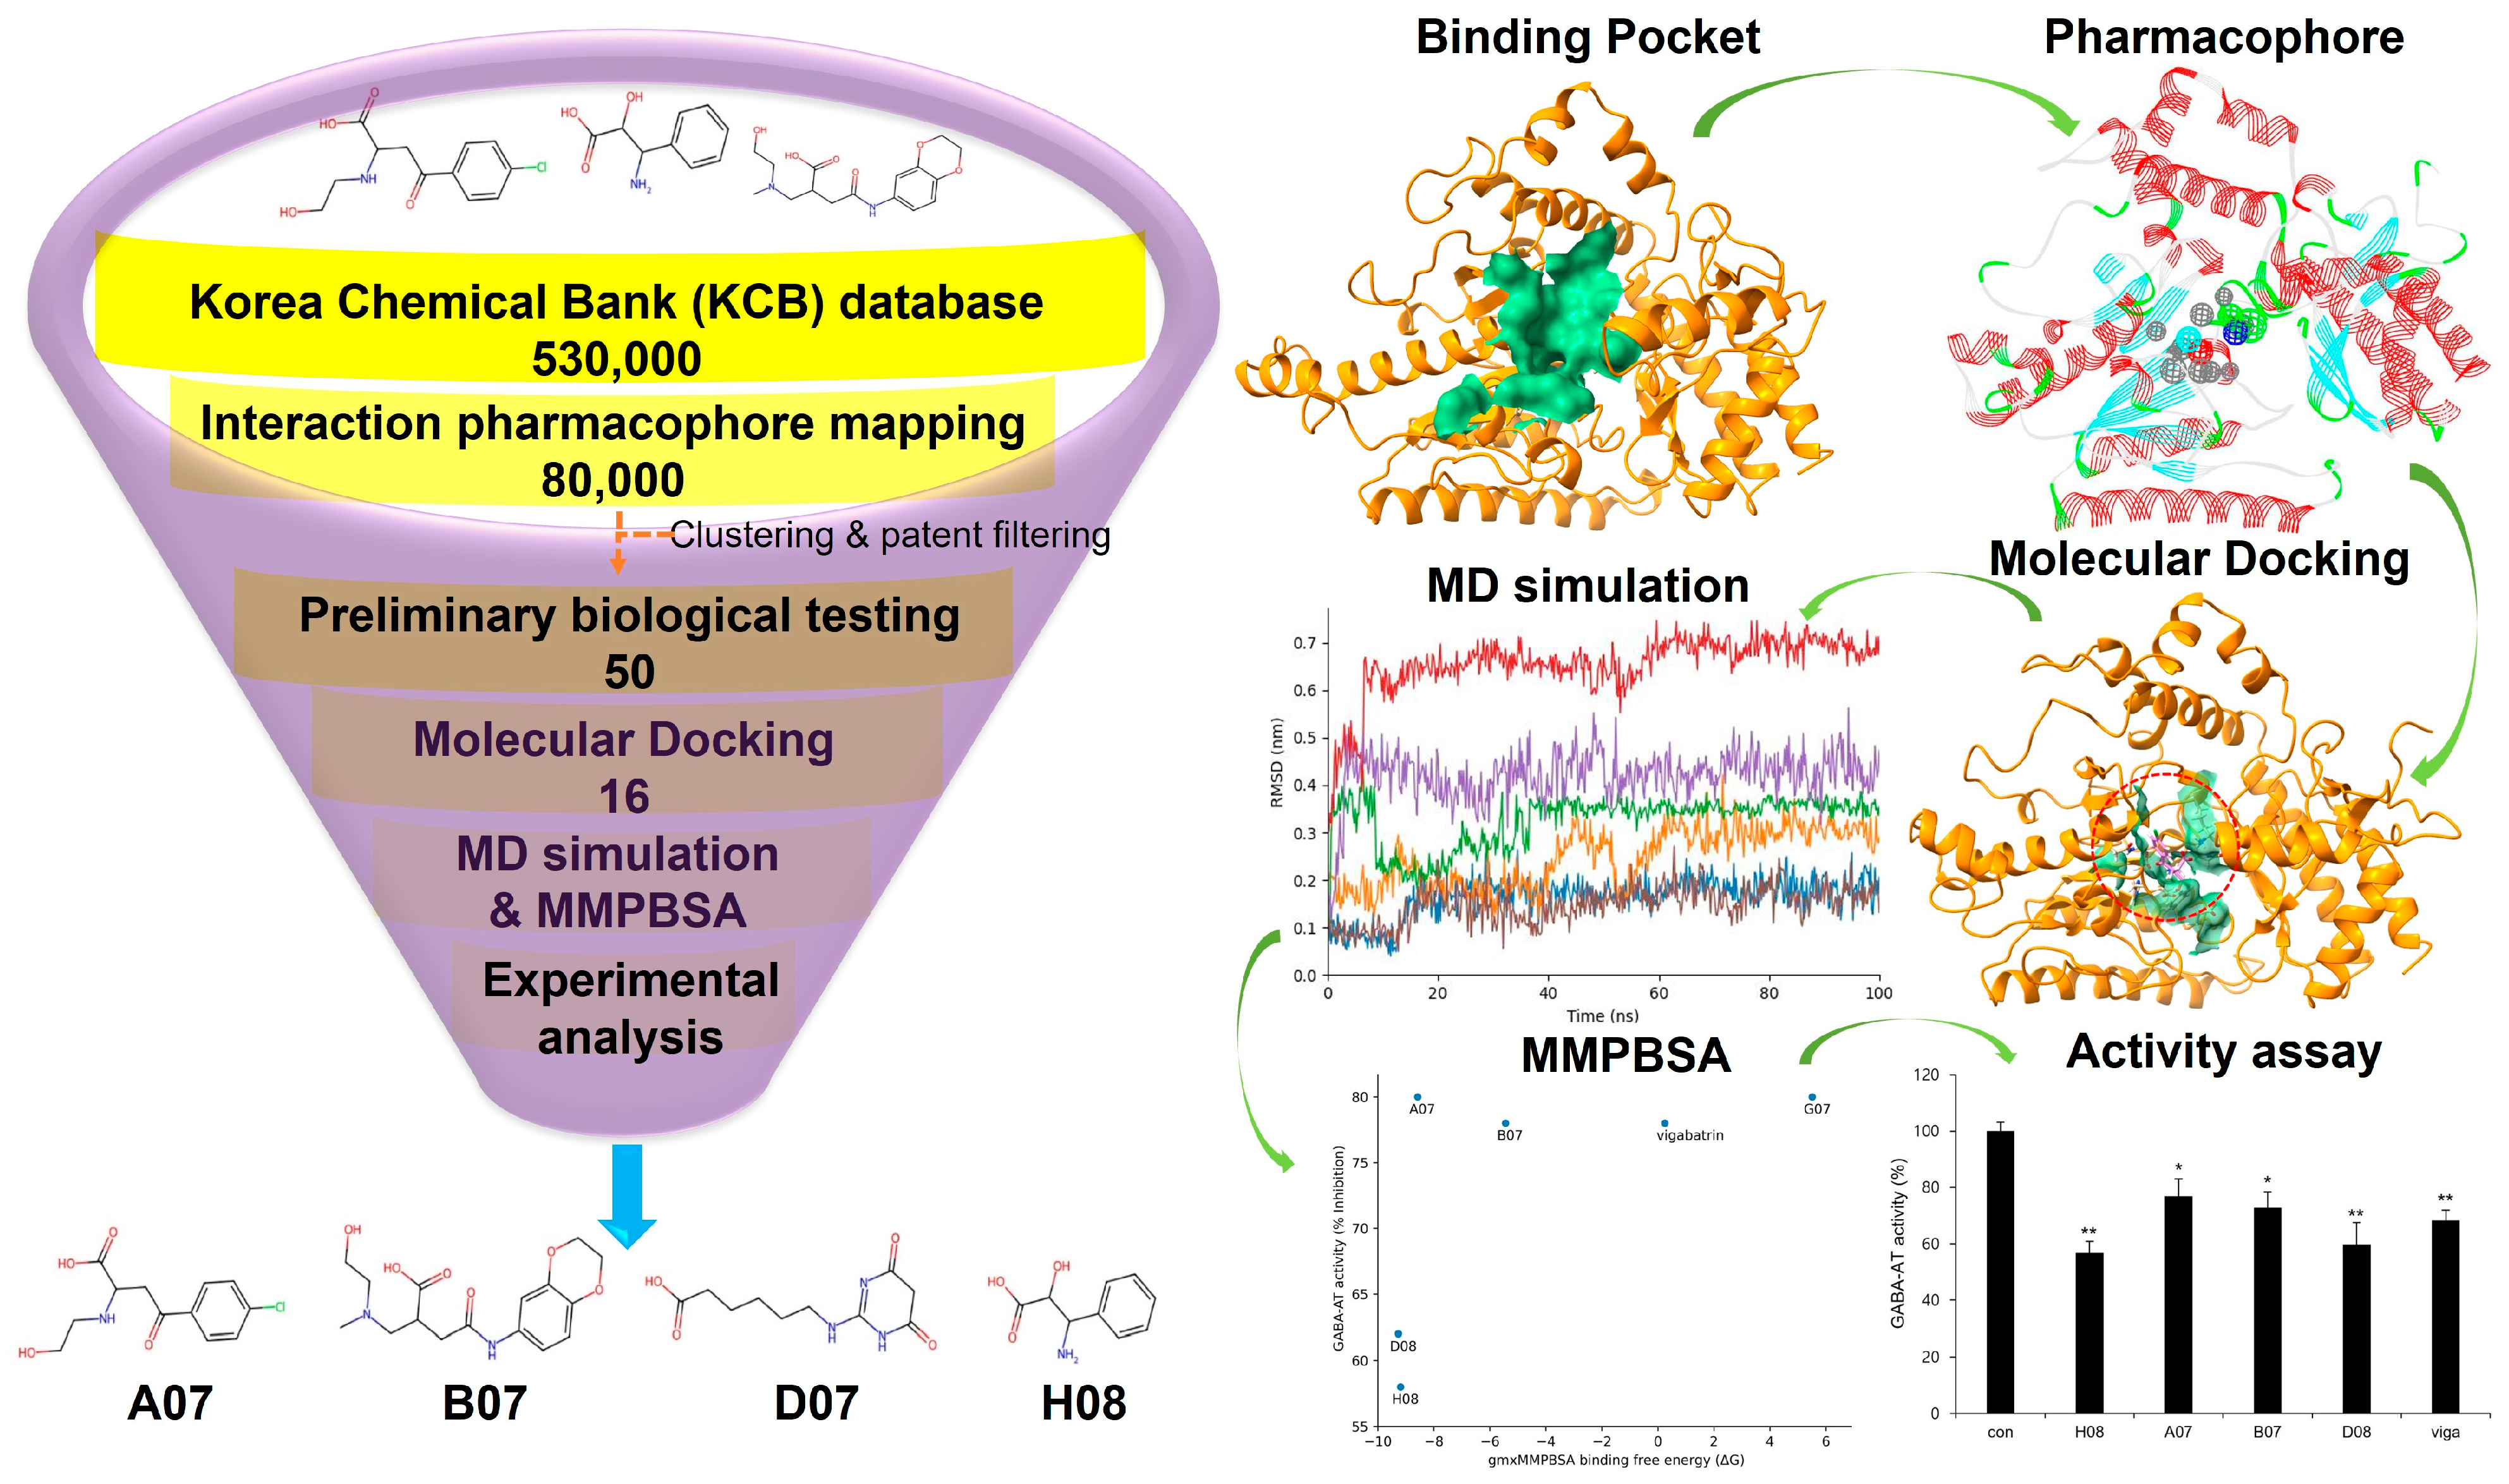
:1. Introduction
2. Results and Discussion
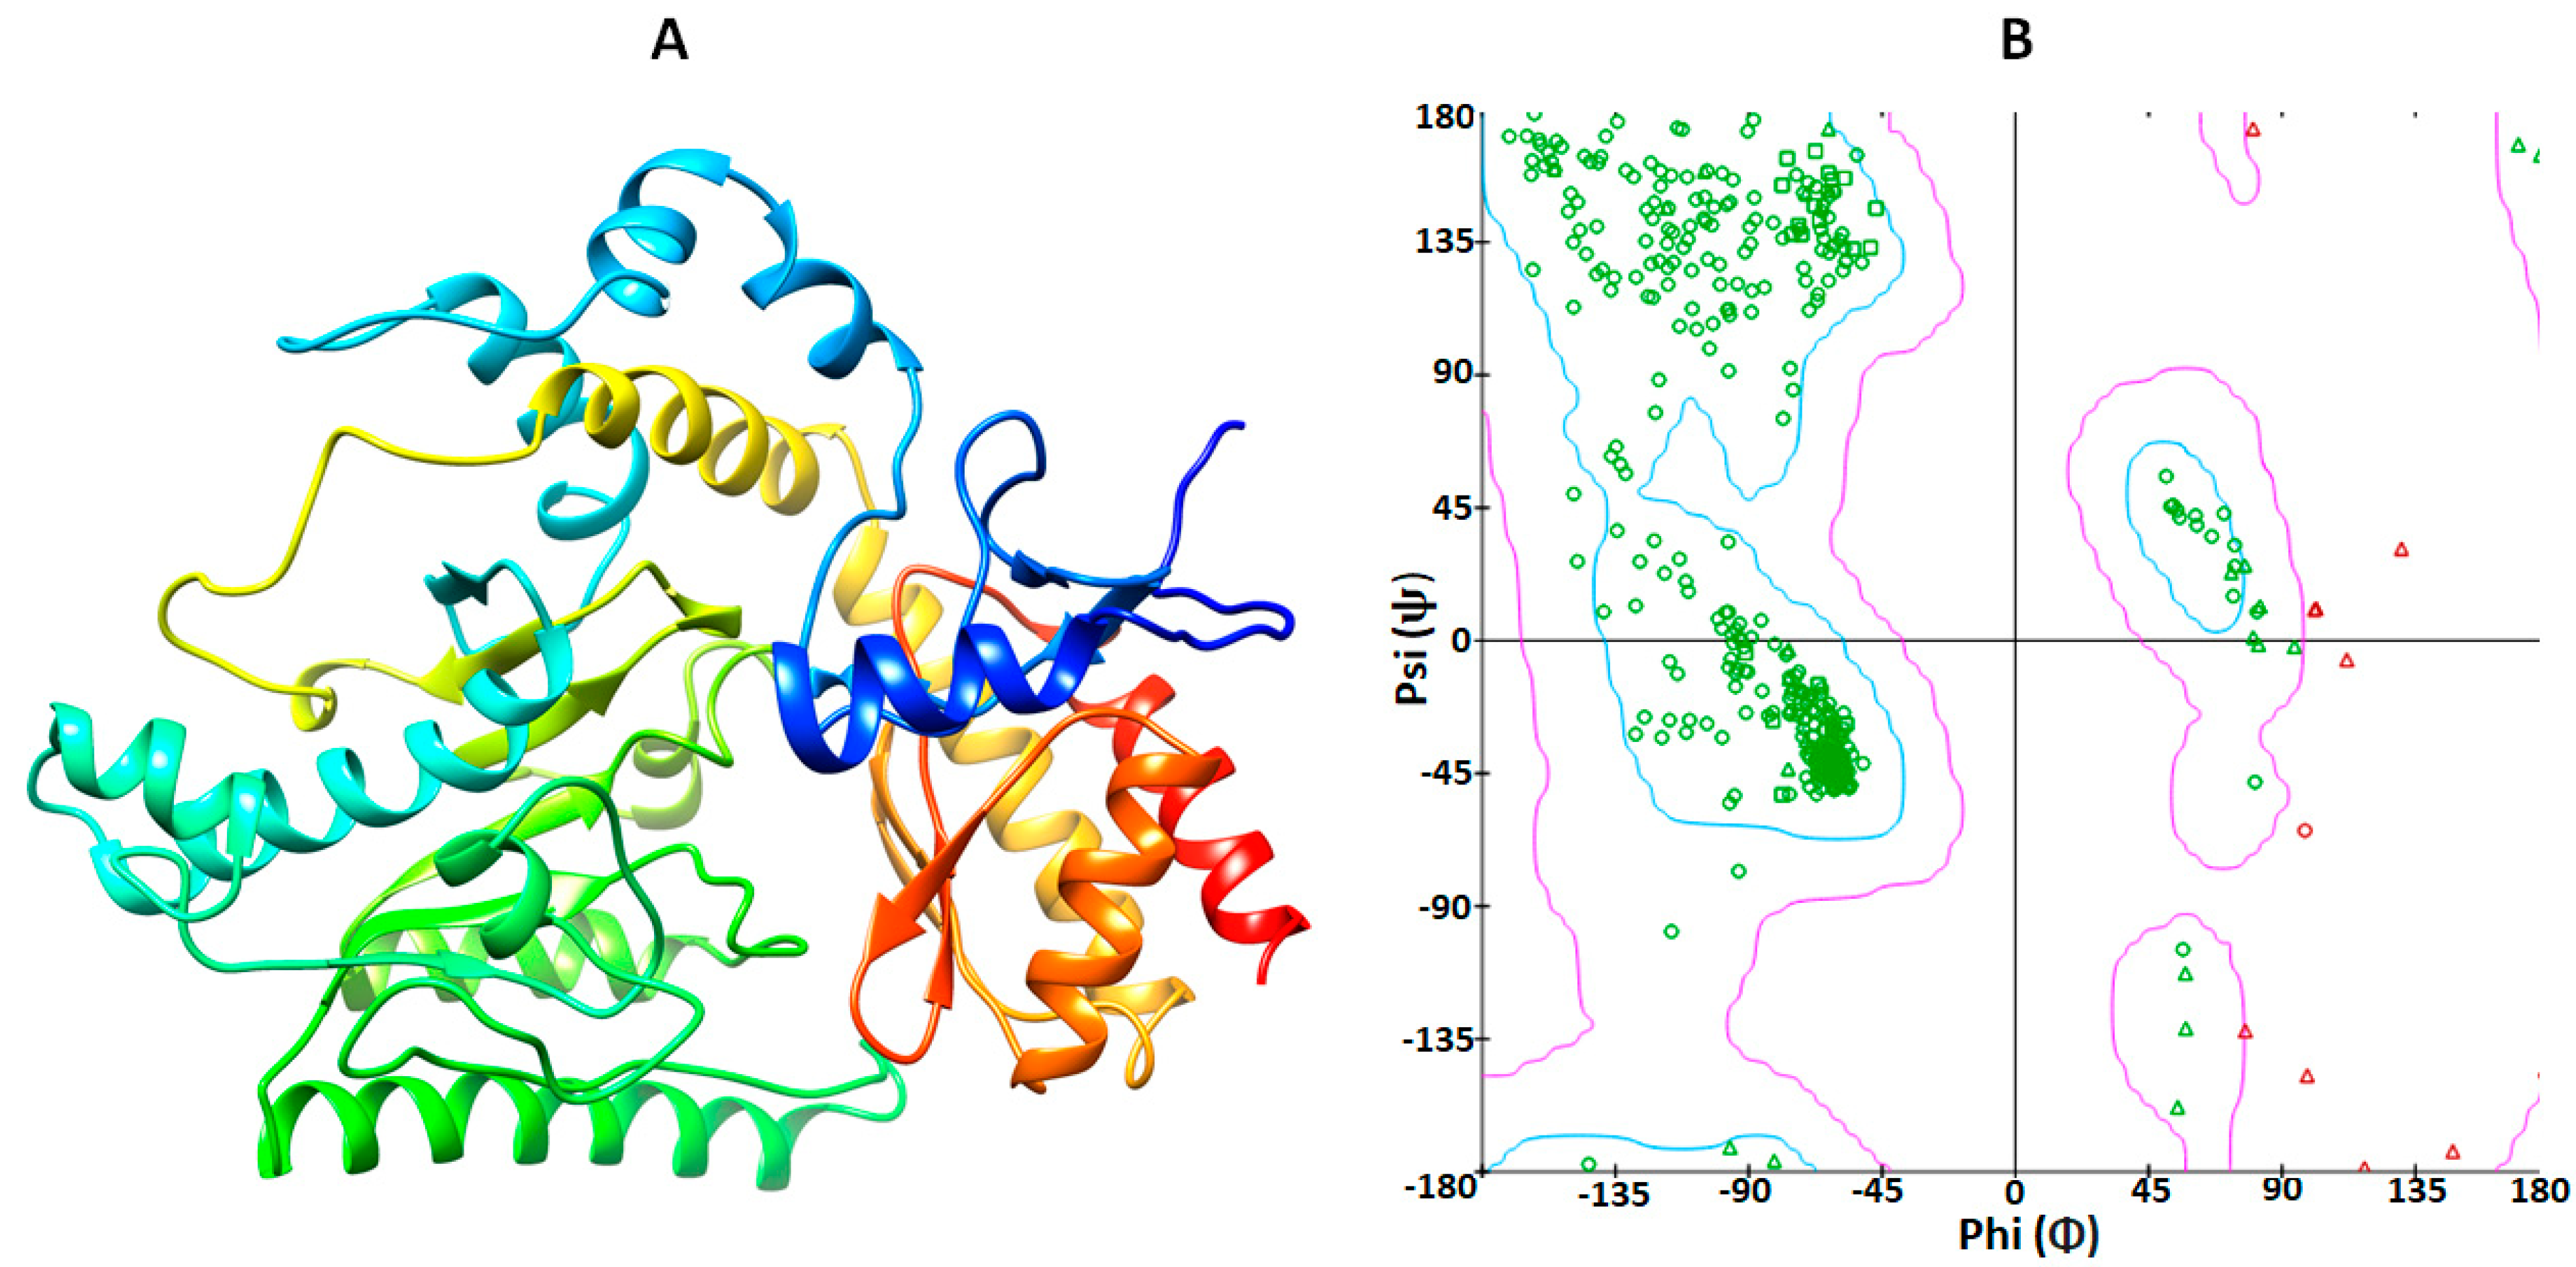
2.1. Structural Analysis of GABA-AT Protein
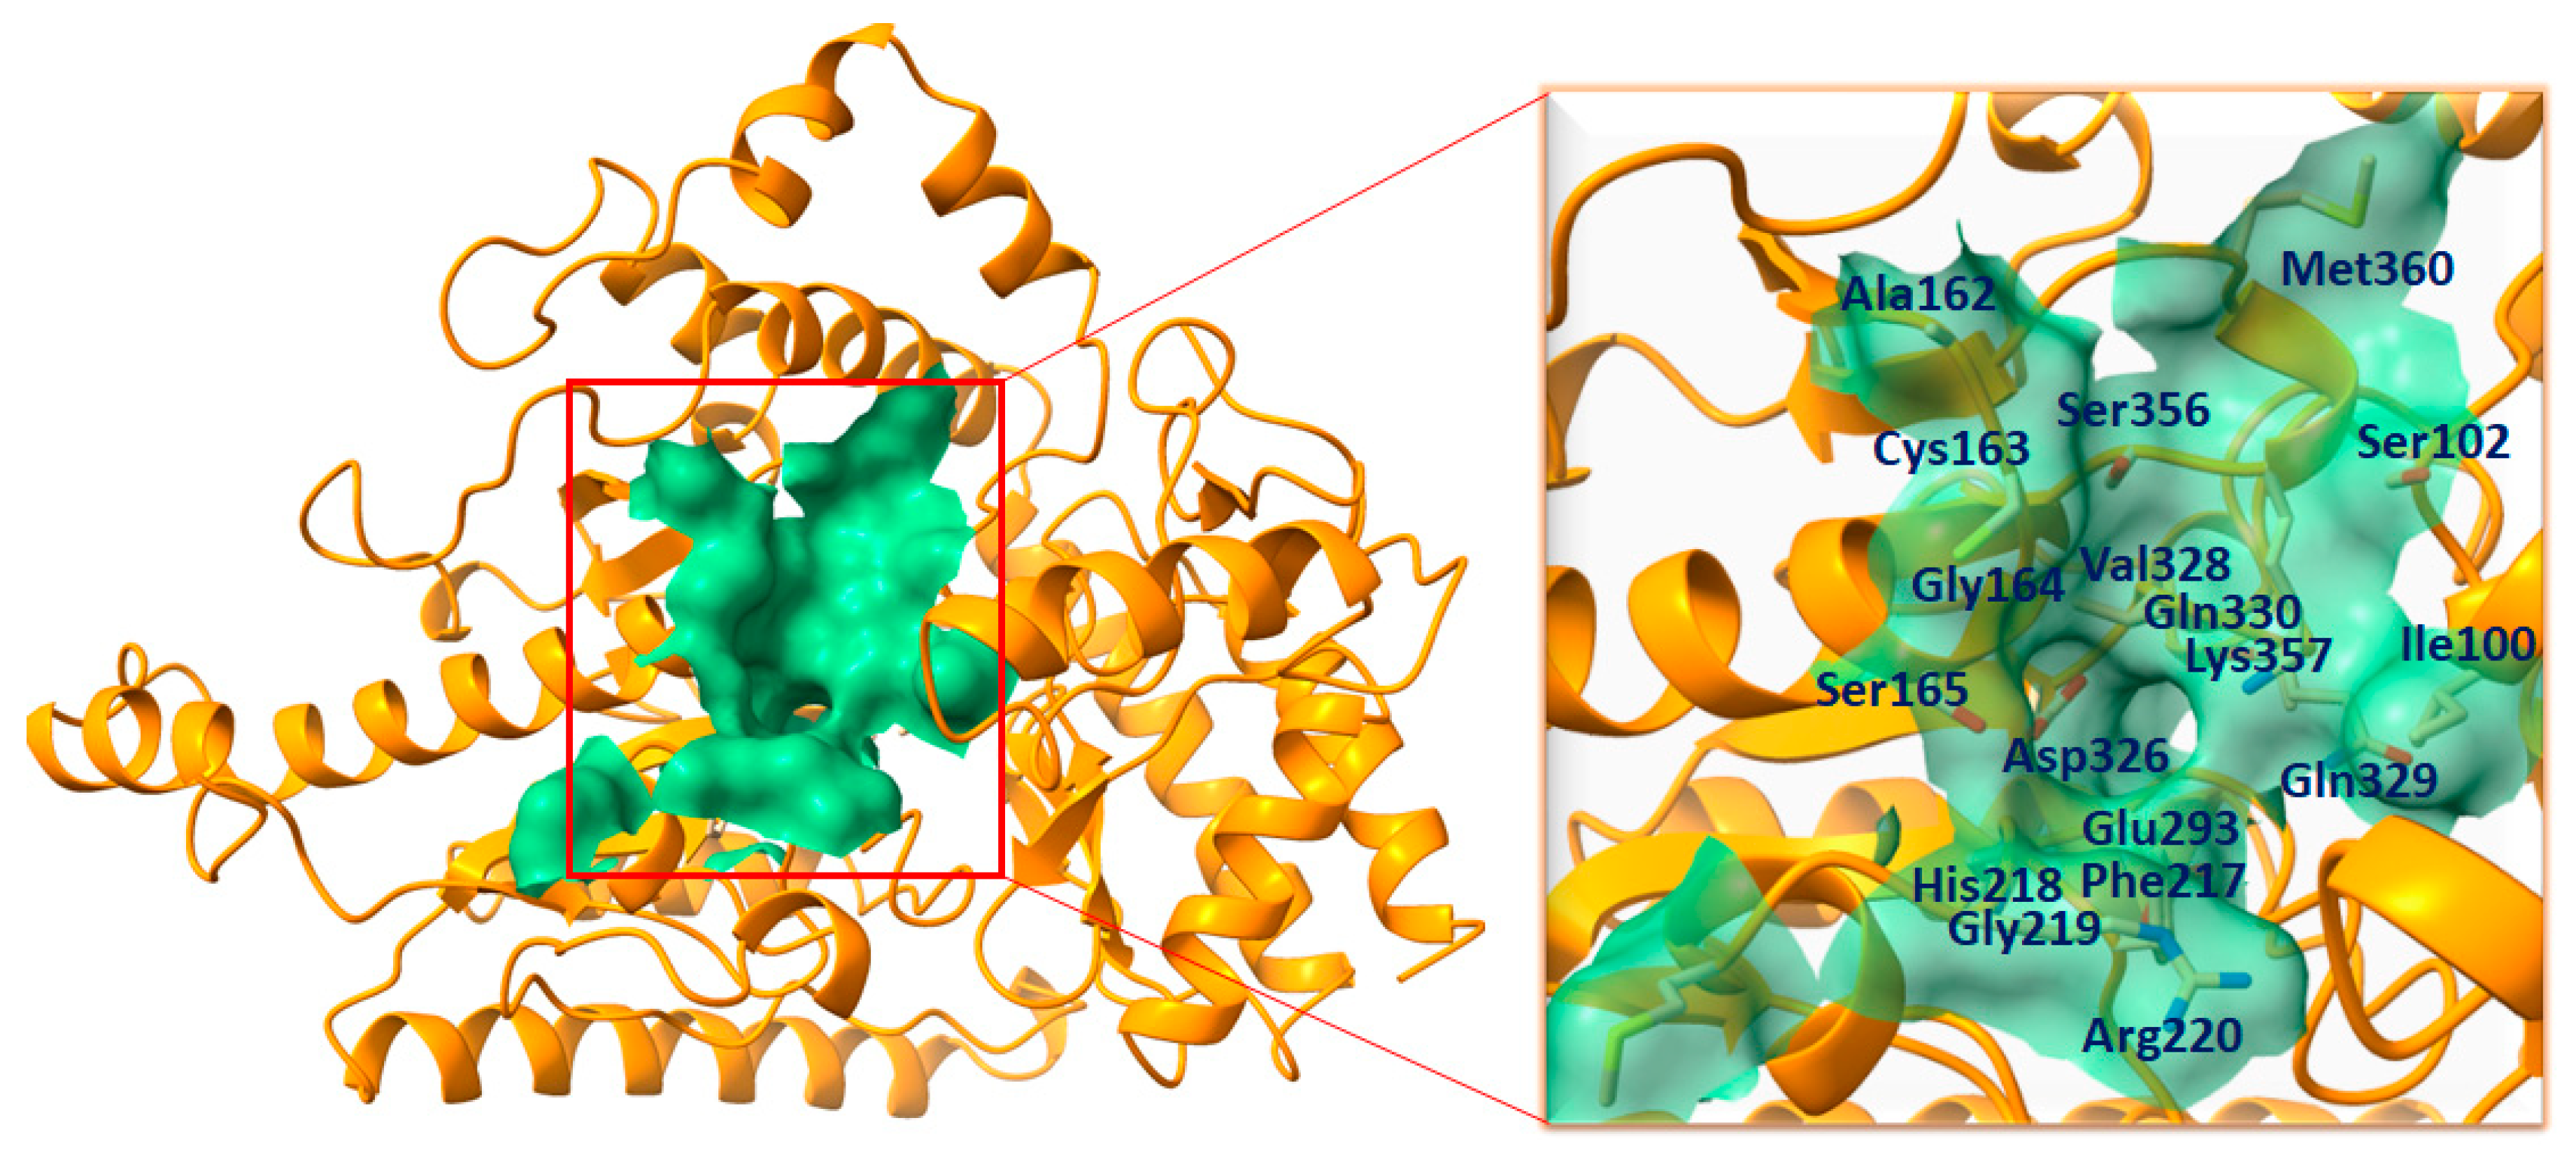
2.2. Binding Pocket Analysis
2.3. Pharmacophore Analysis
2.4. Molecular Docking Analysis
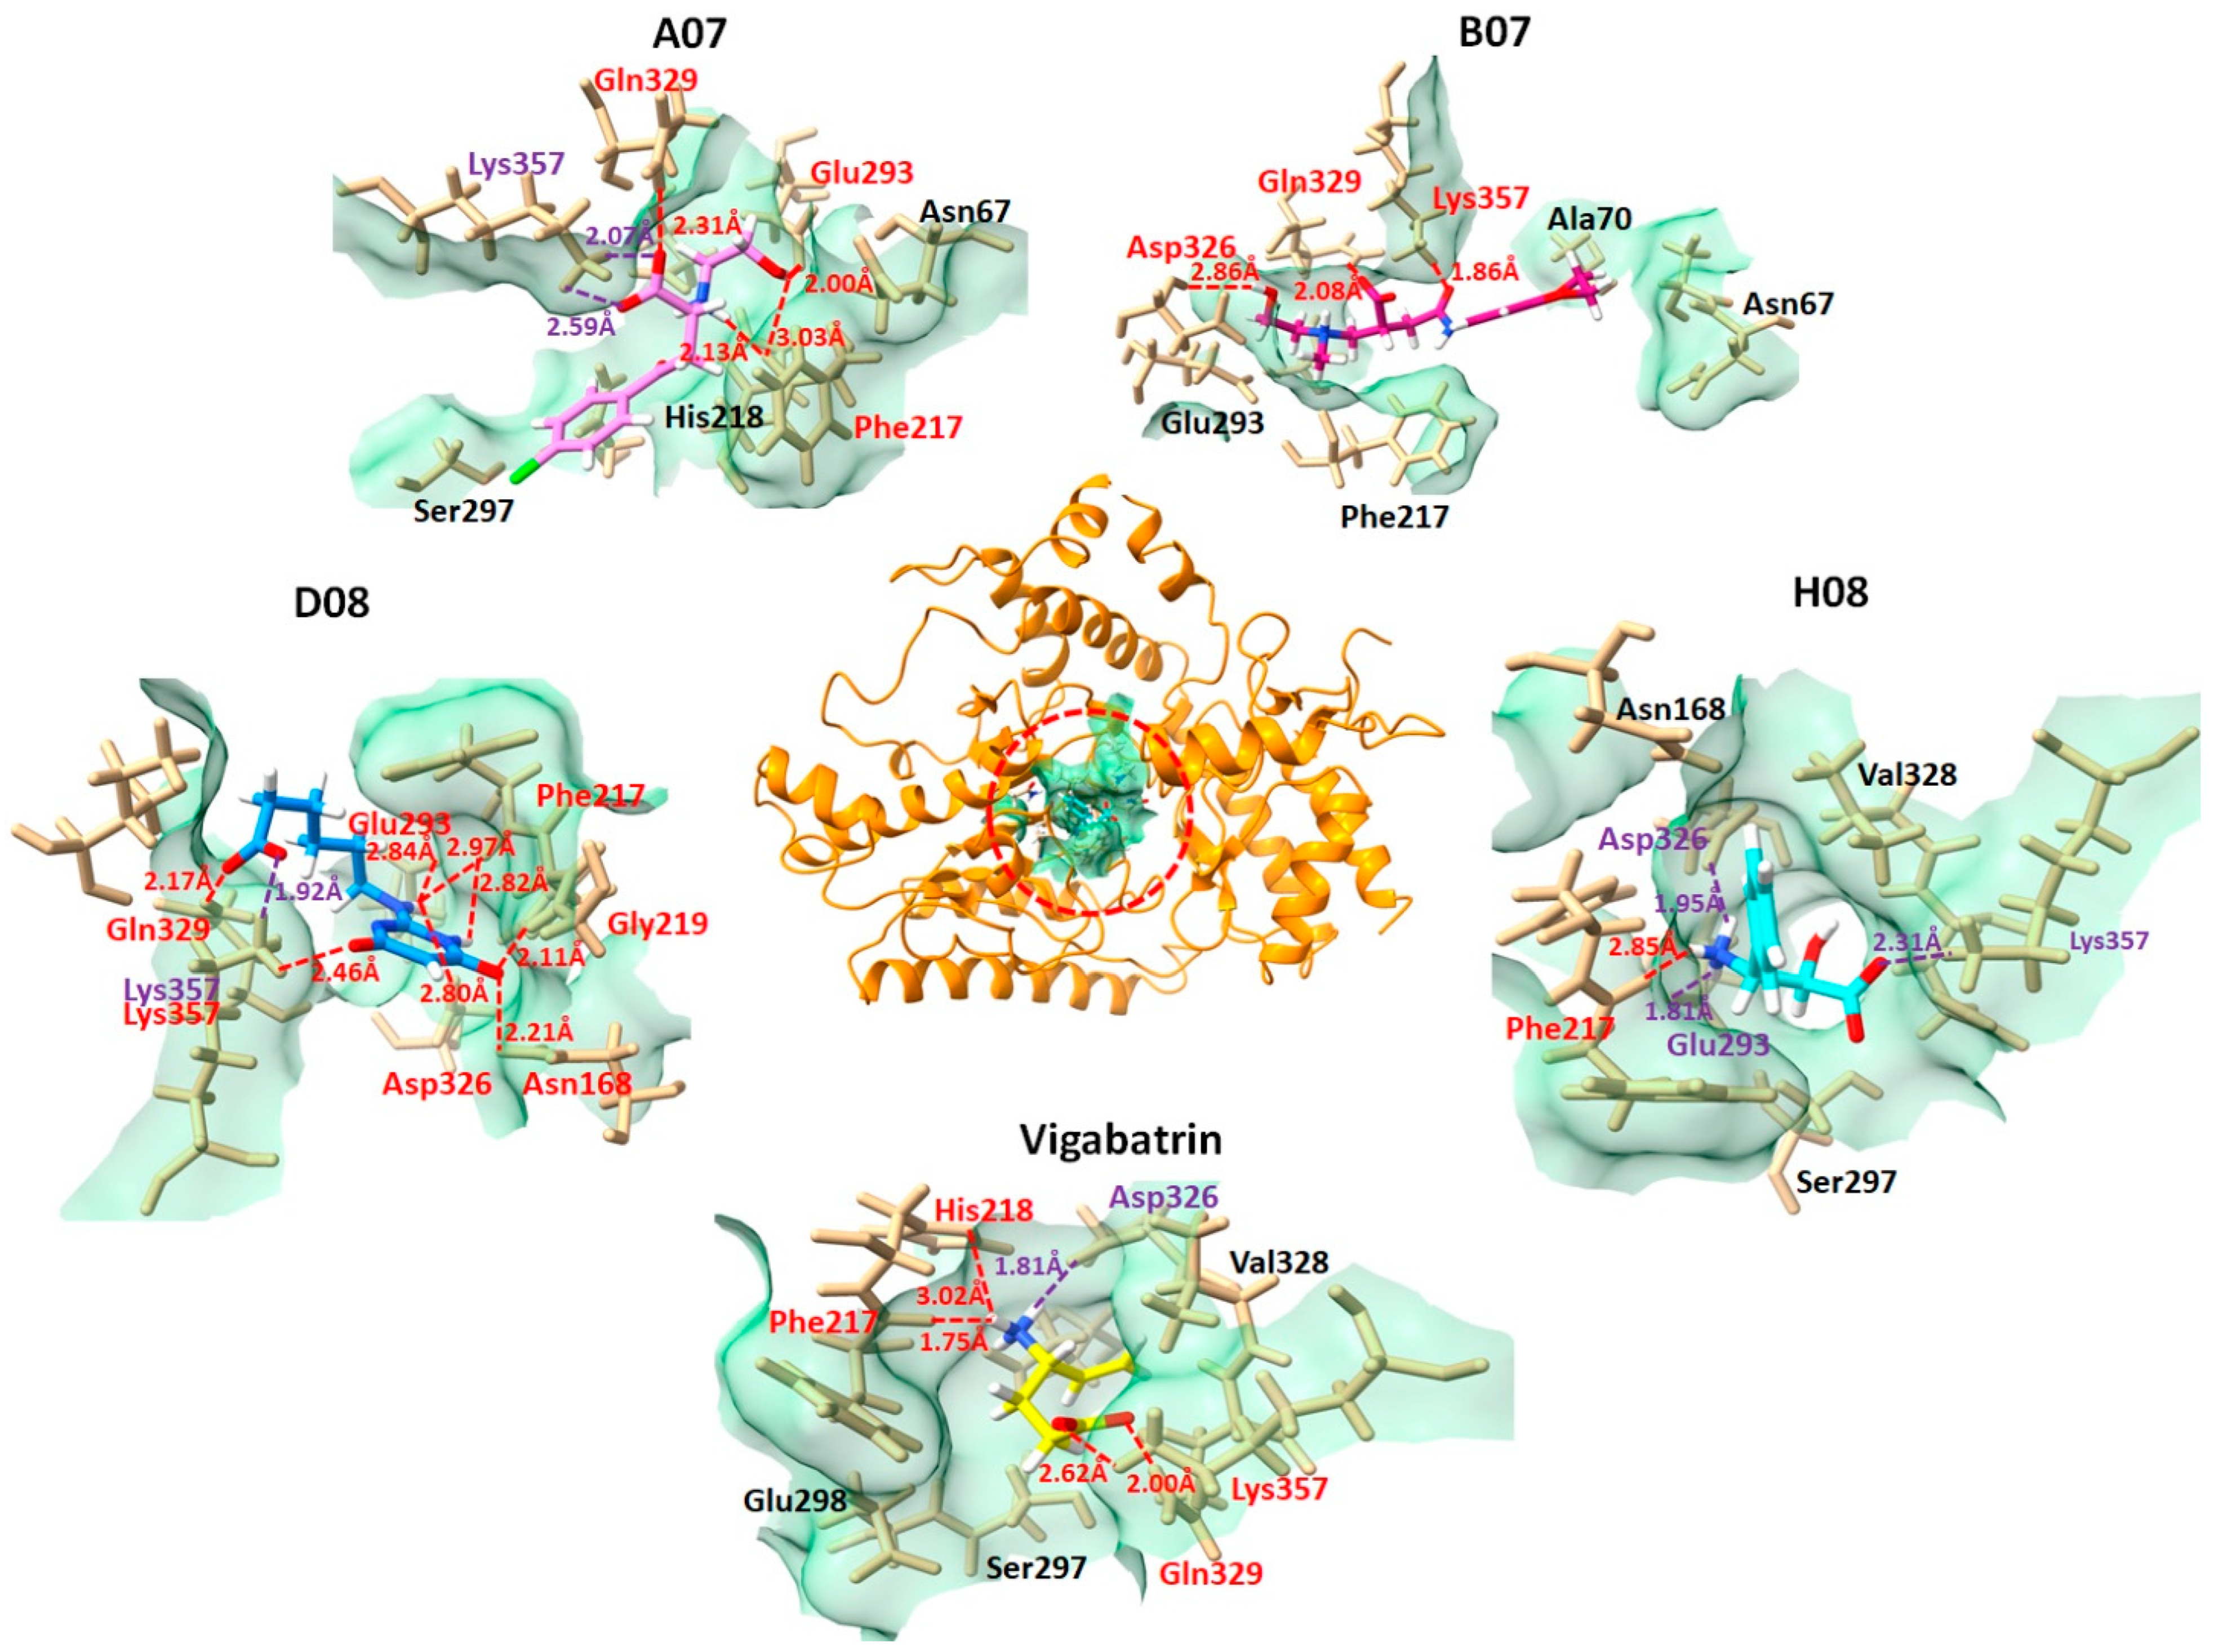
2.5. Binding Interaction Analysis against GABA-AT
2.6. Molecular Dynamics Simulation
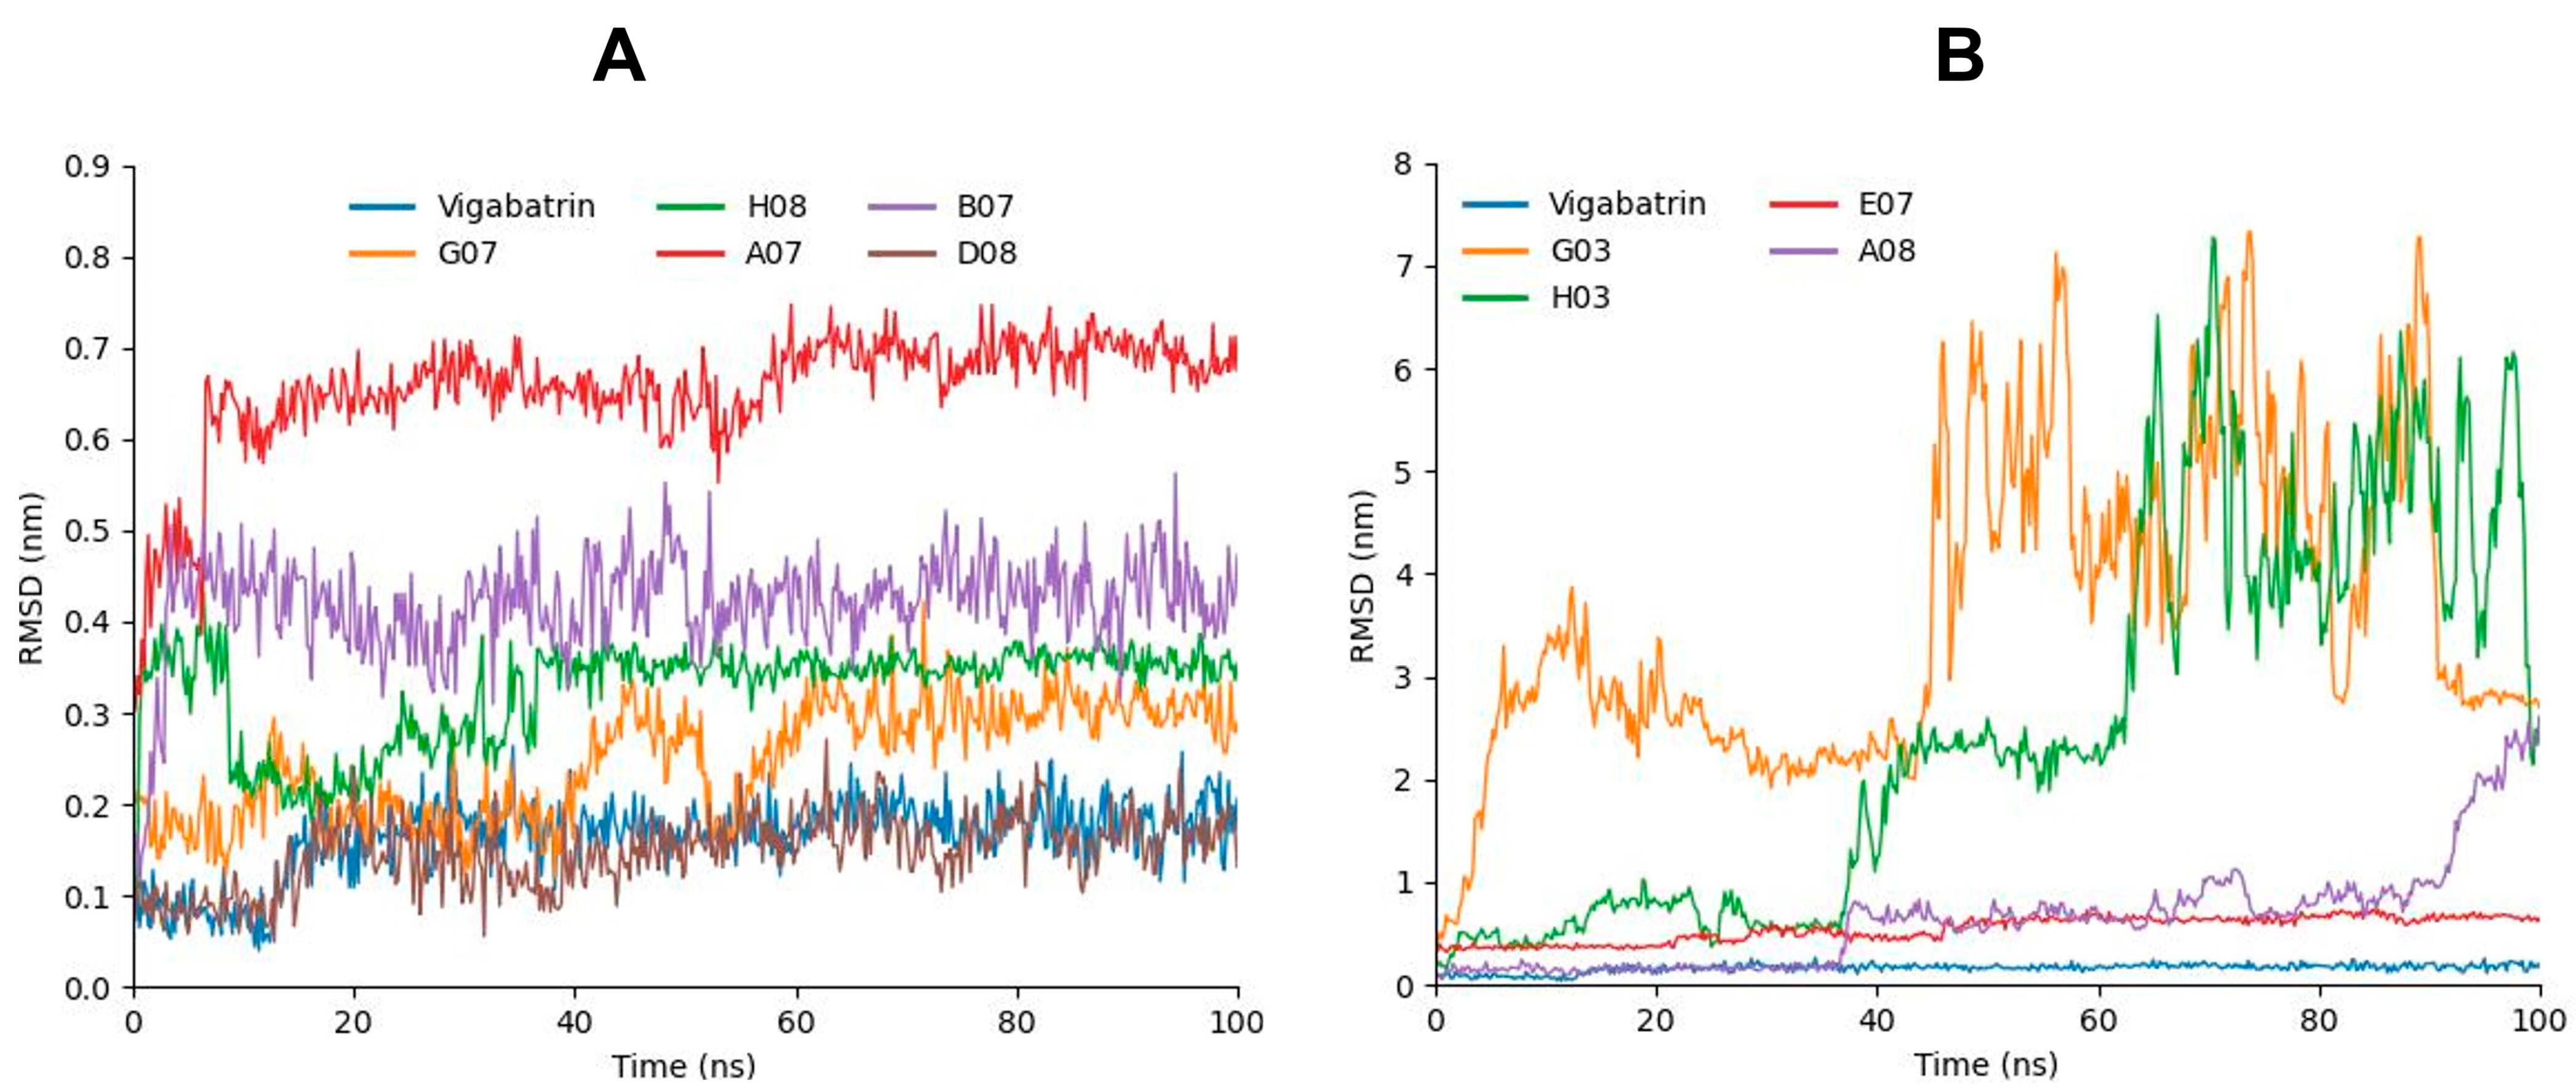
2.7. RMSD Analysis
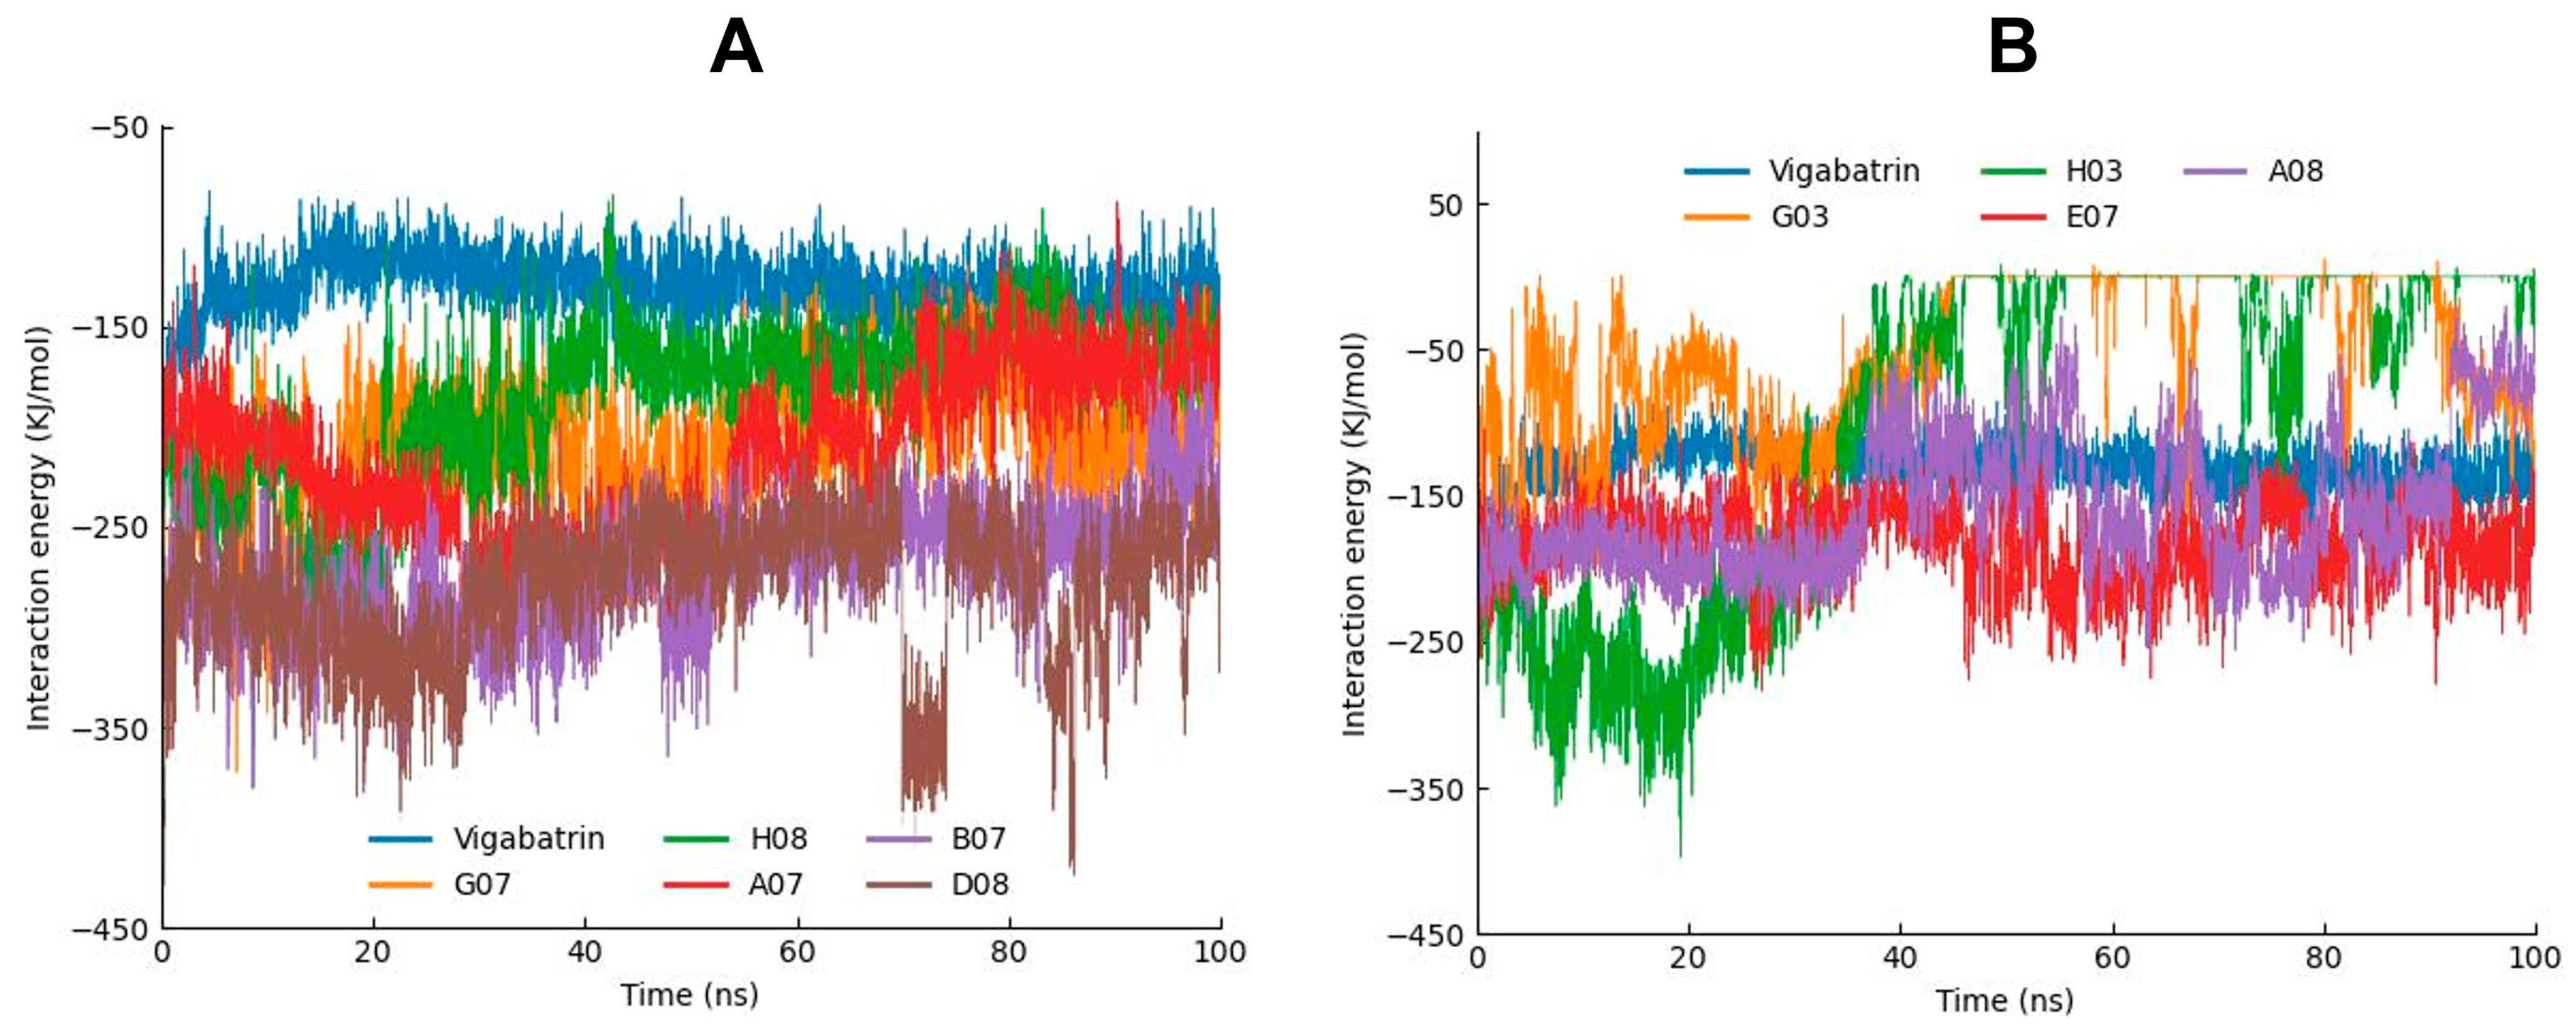
2.8. MD Interaction Energy Analysis
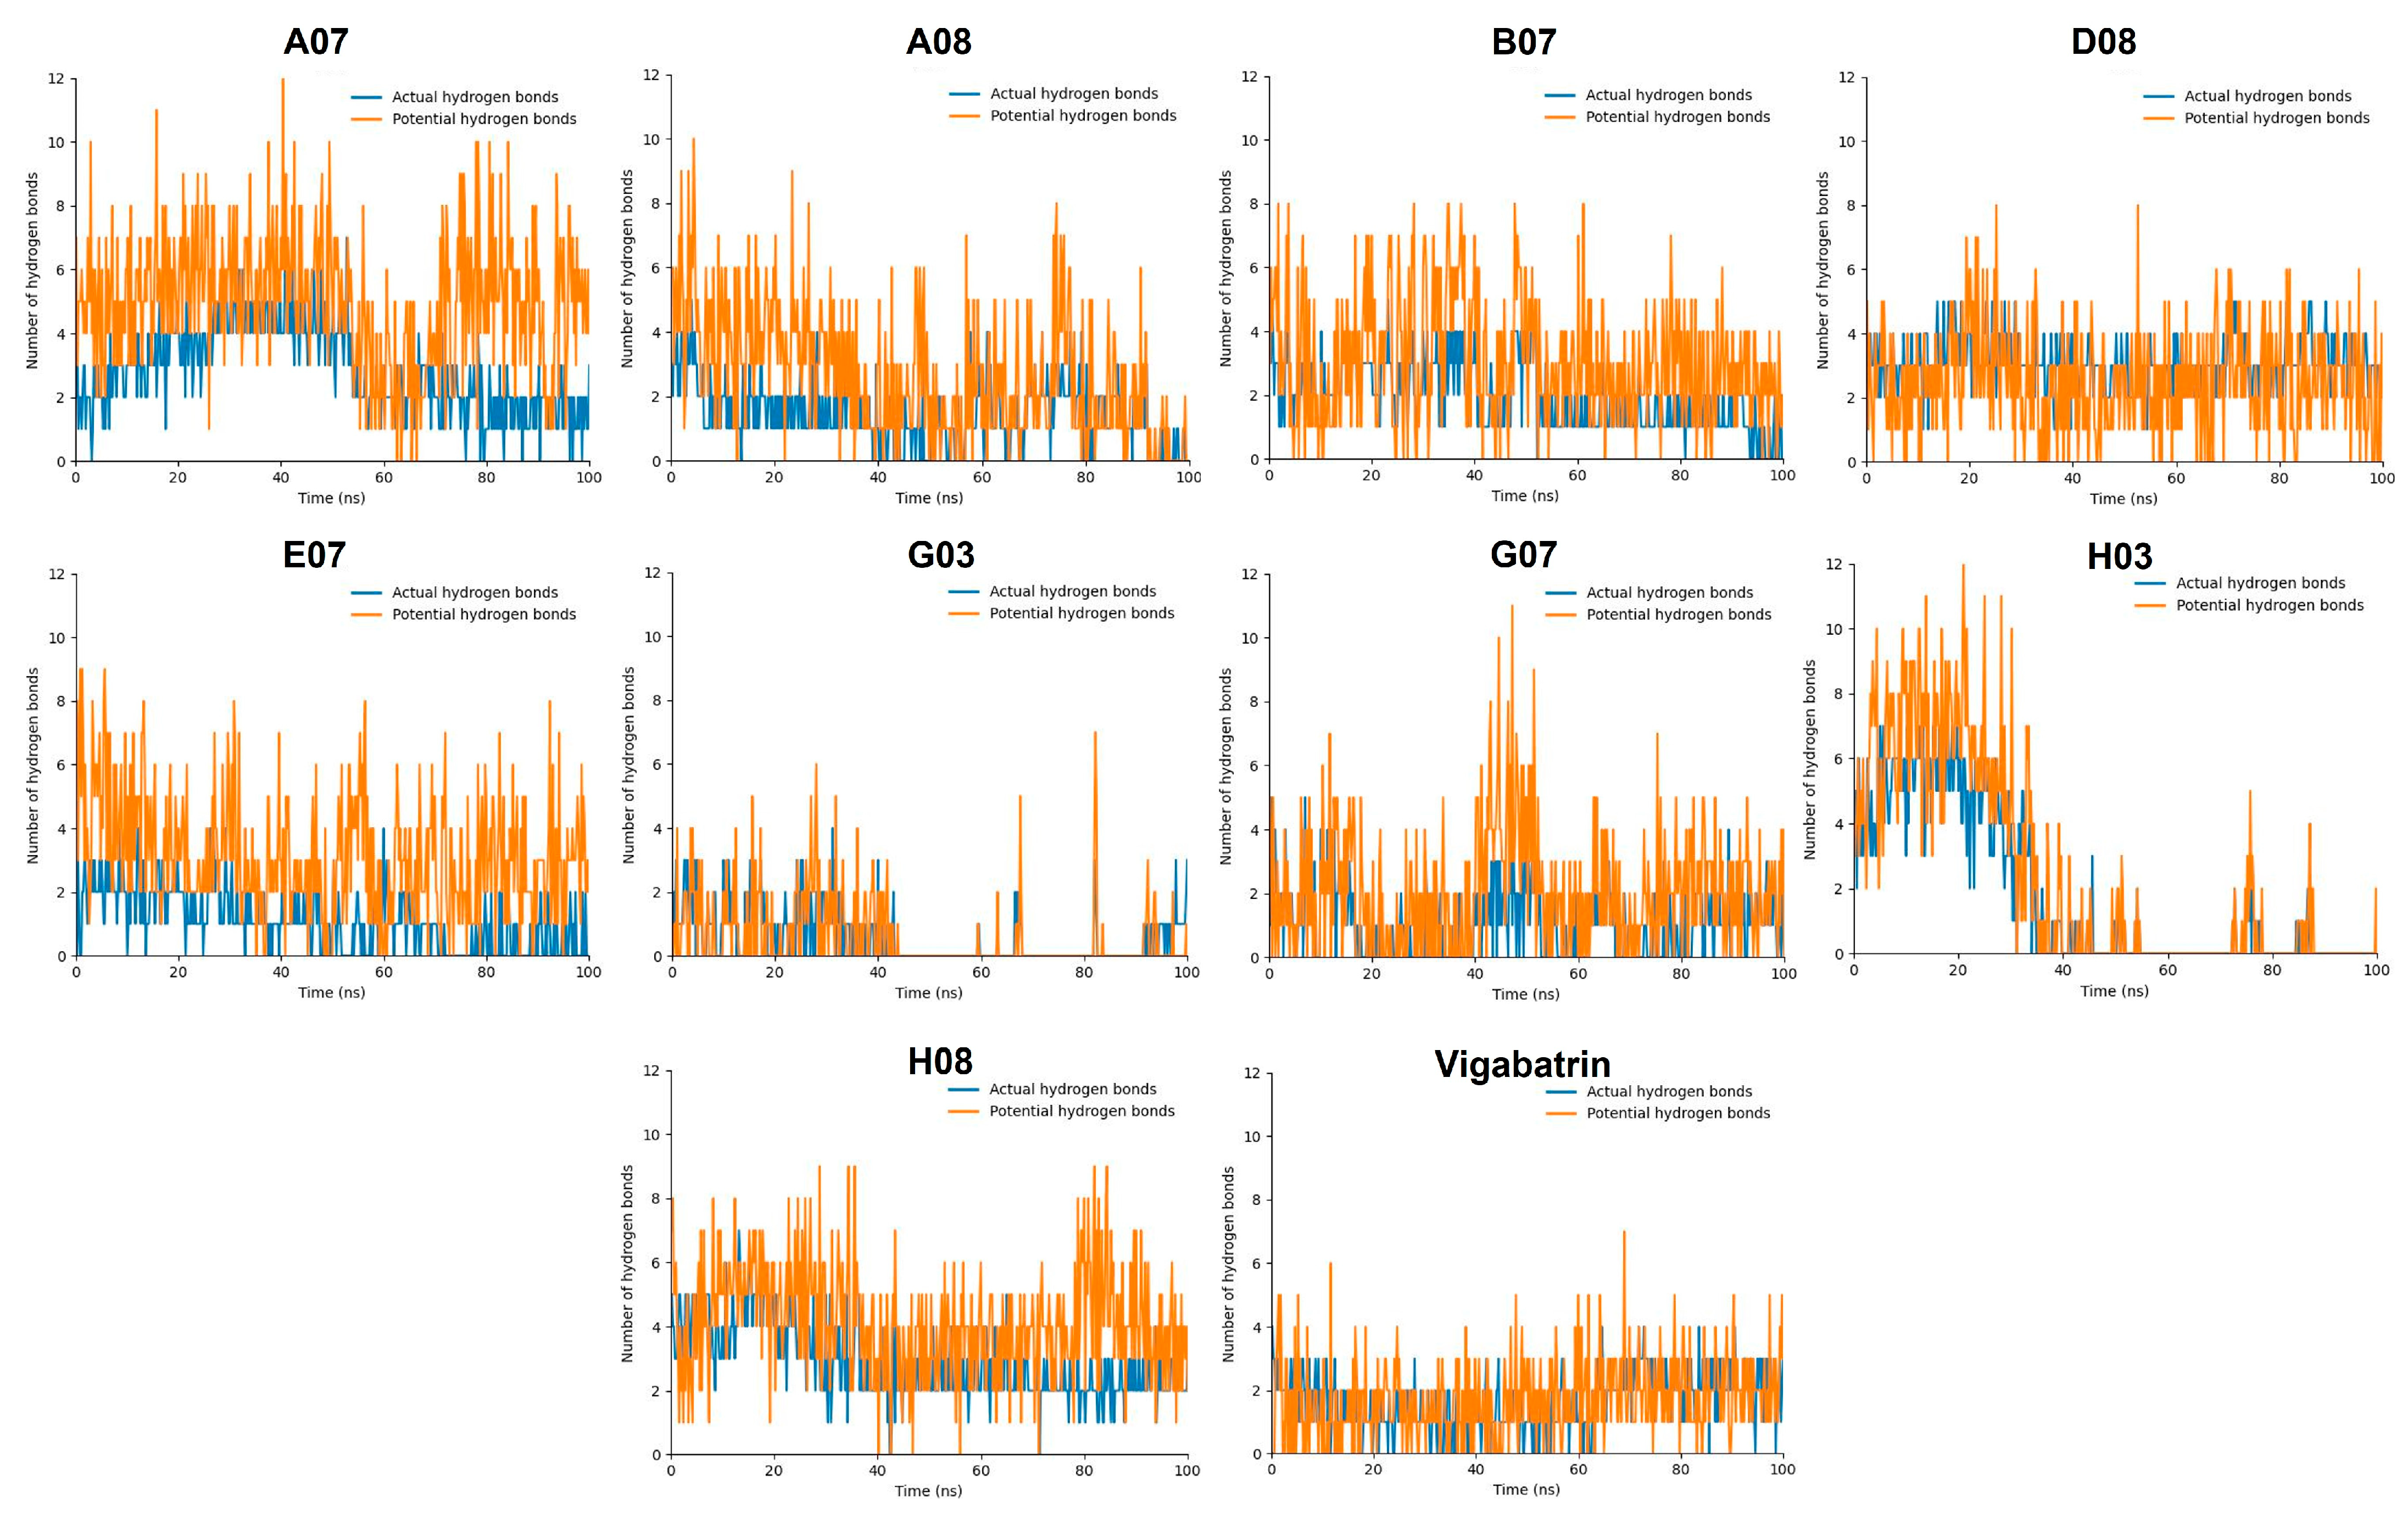
2.9. Hydrogen Bond Plot Analysis
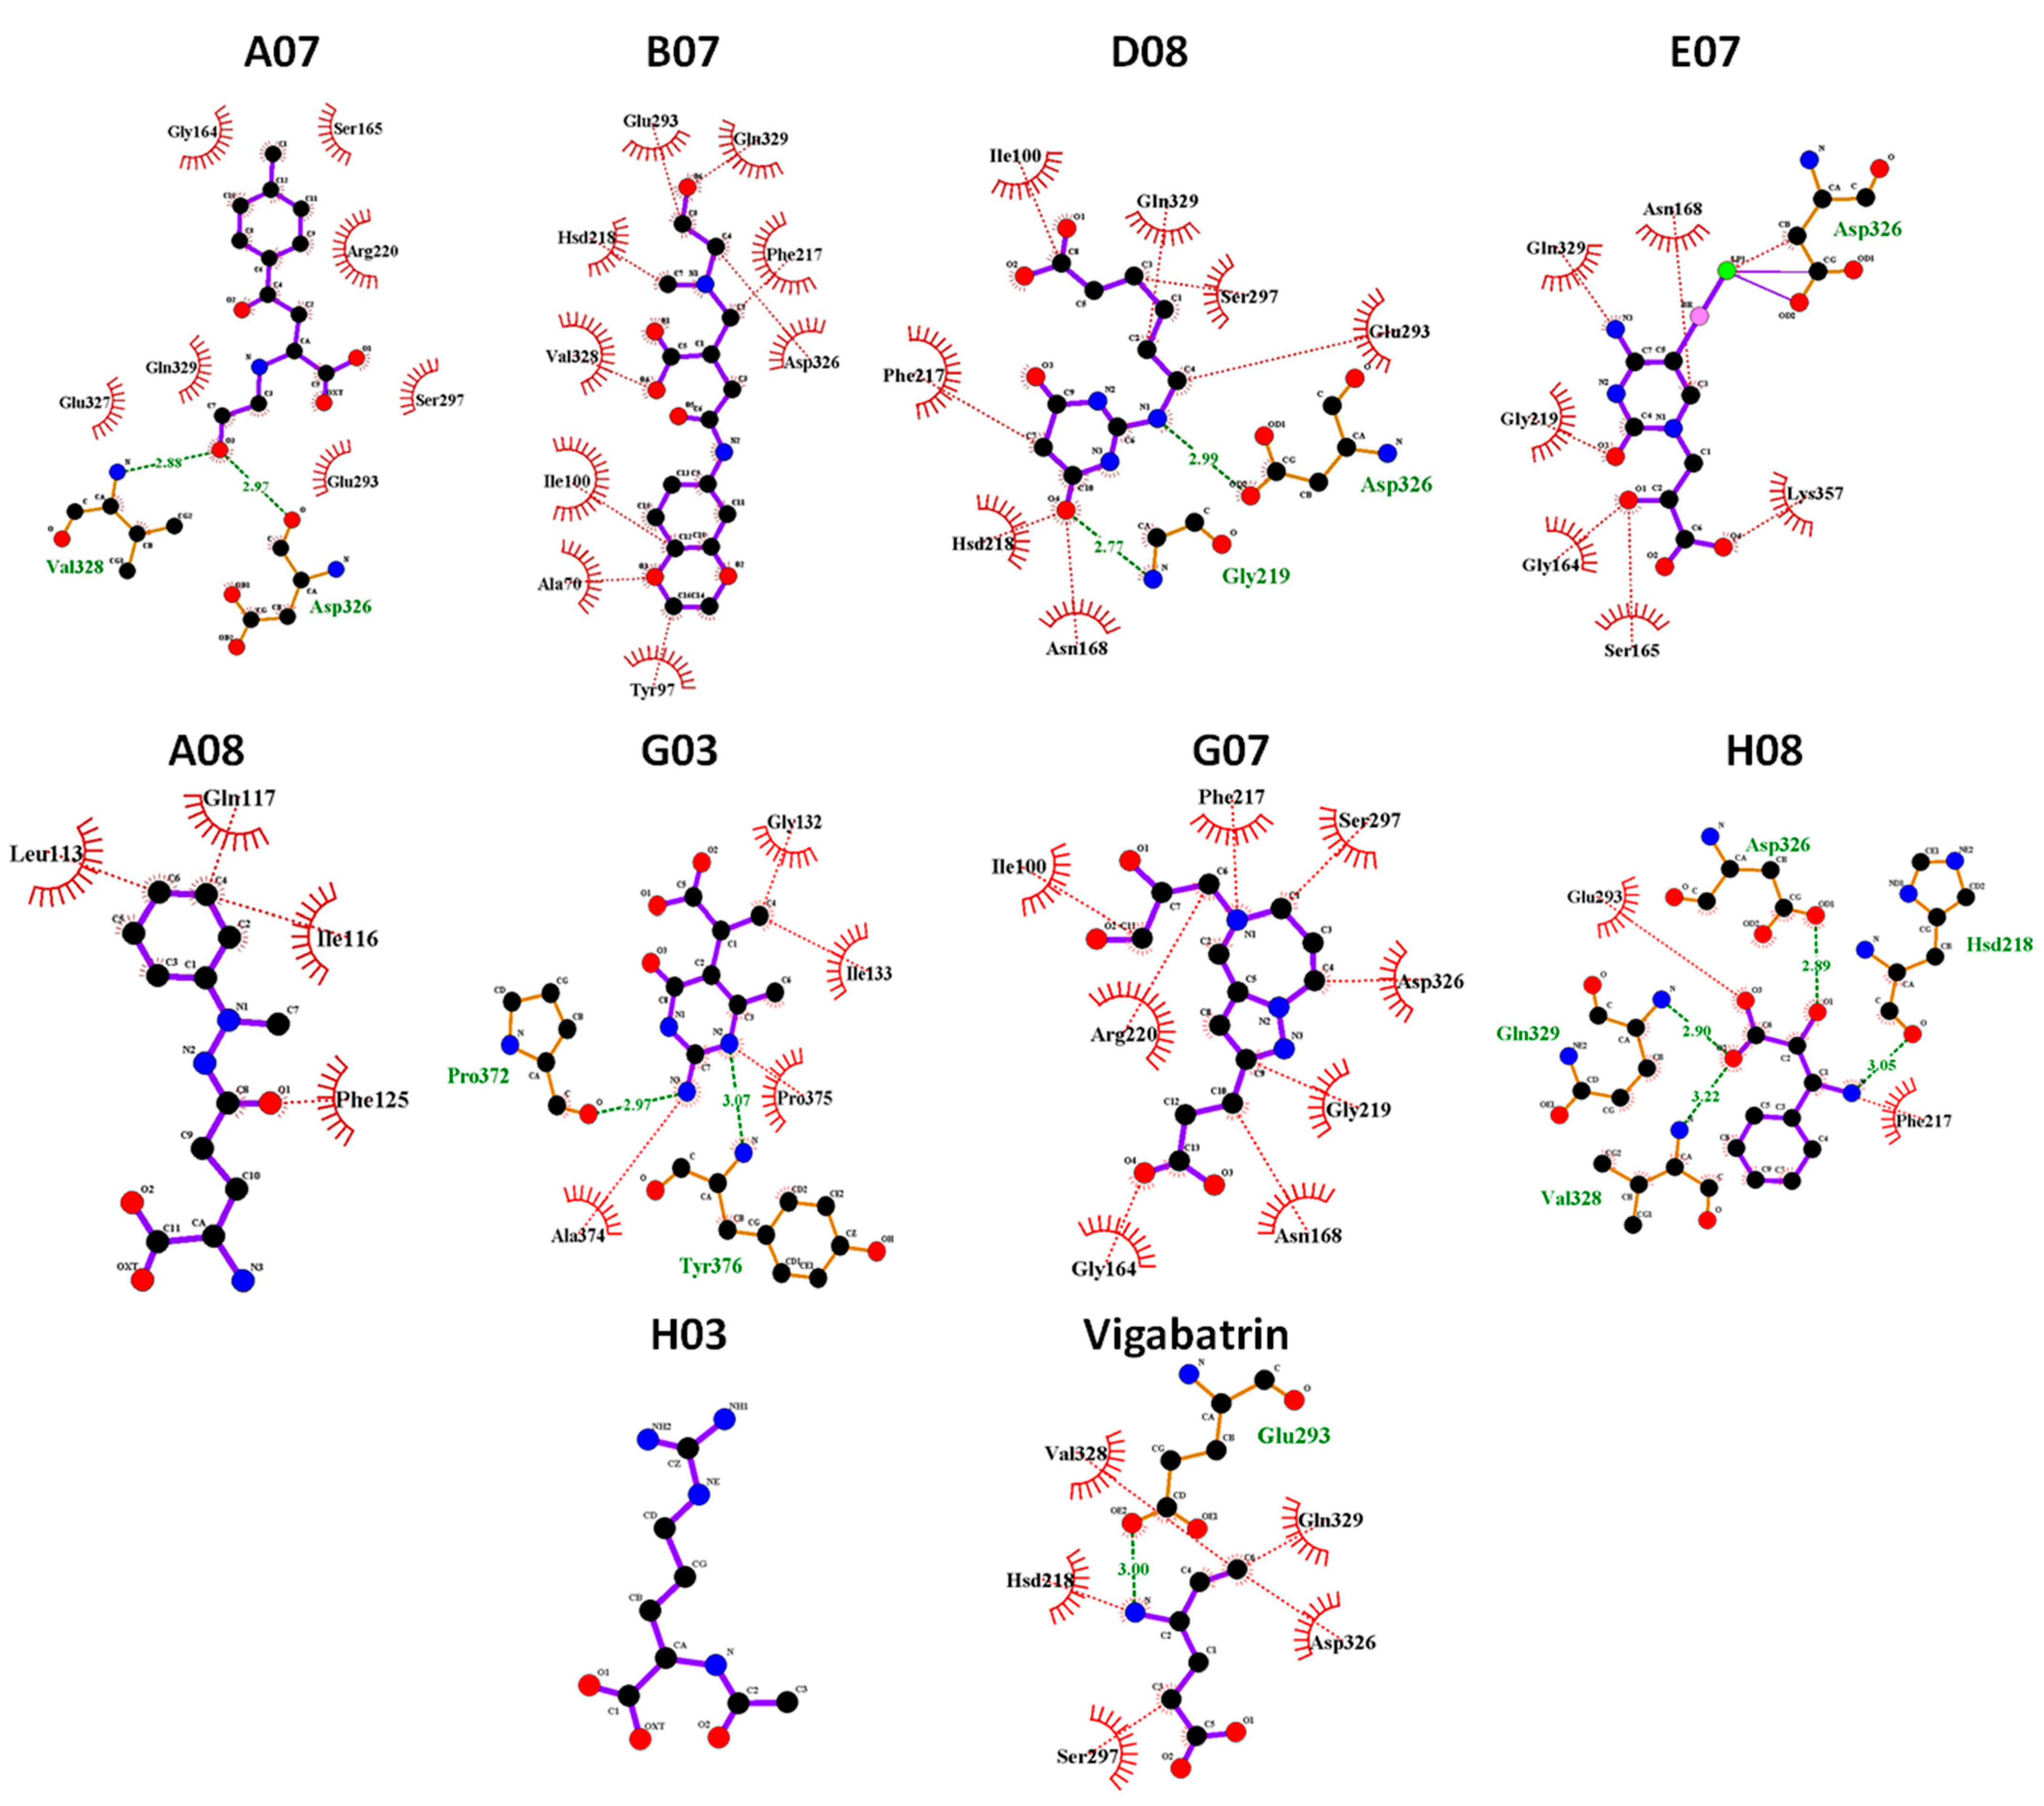
2.10. MD Binding Mode Analysis
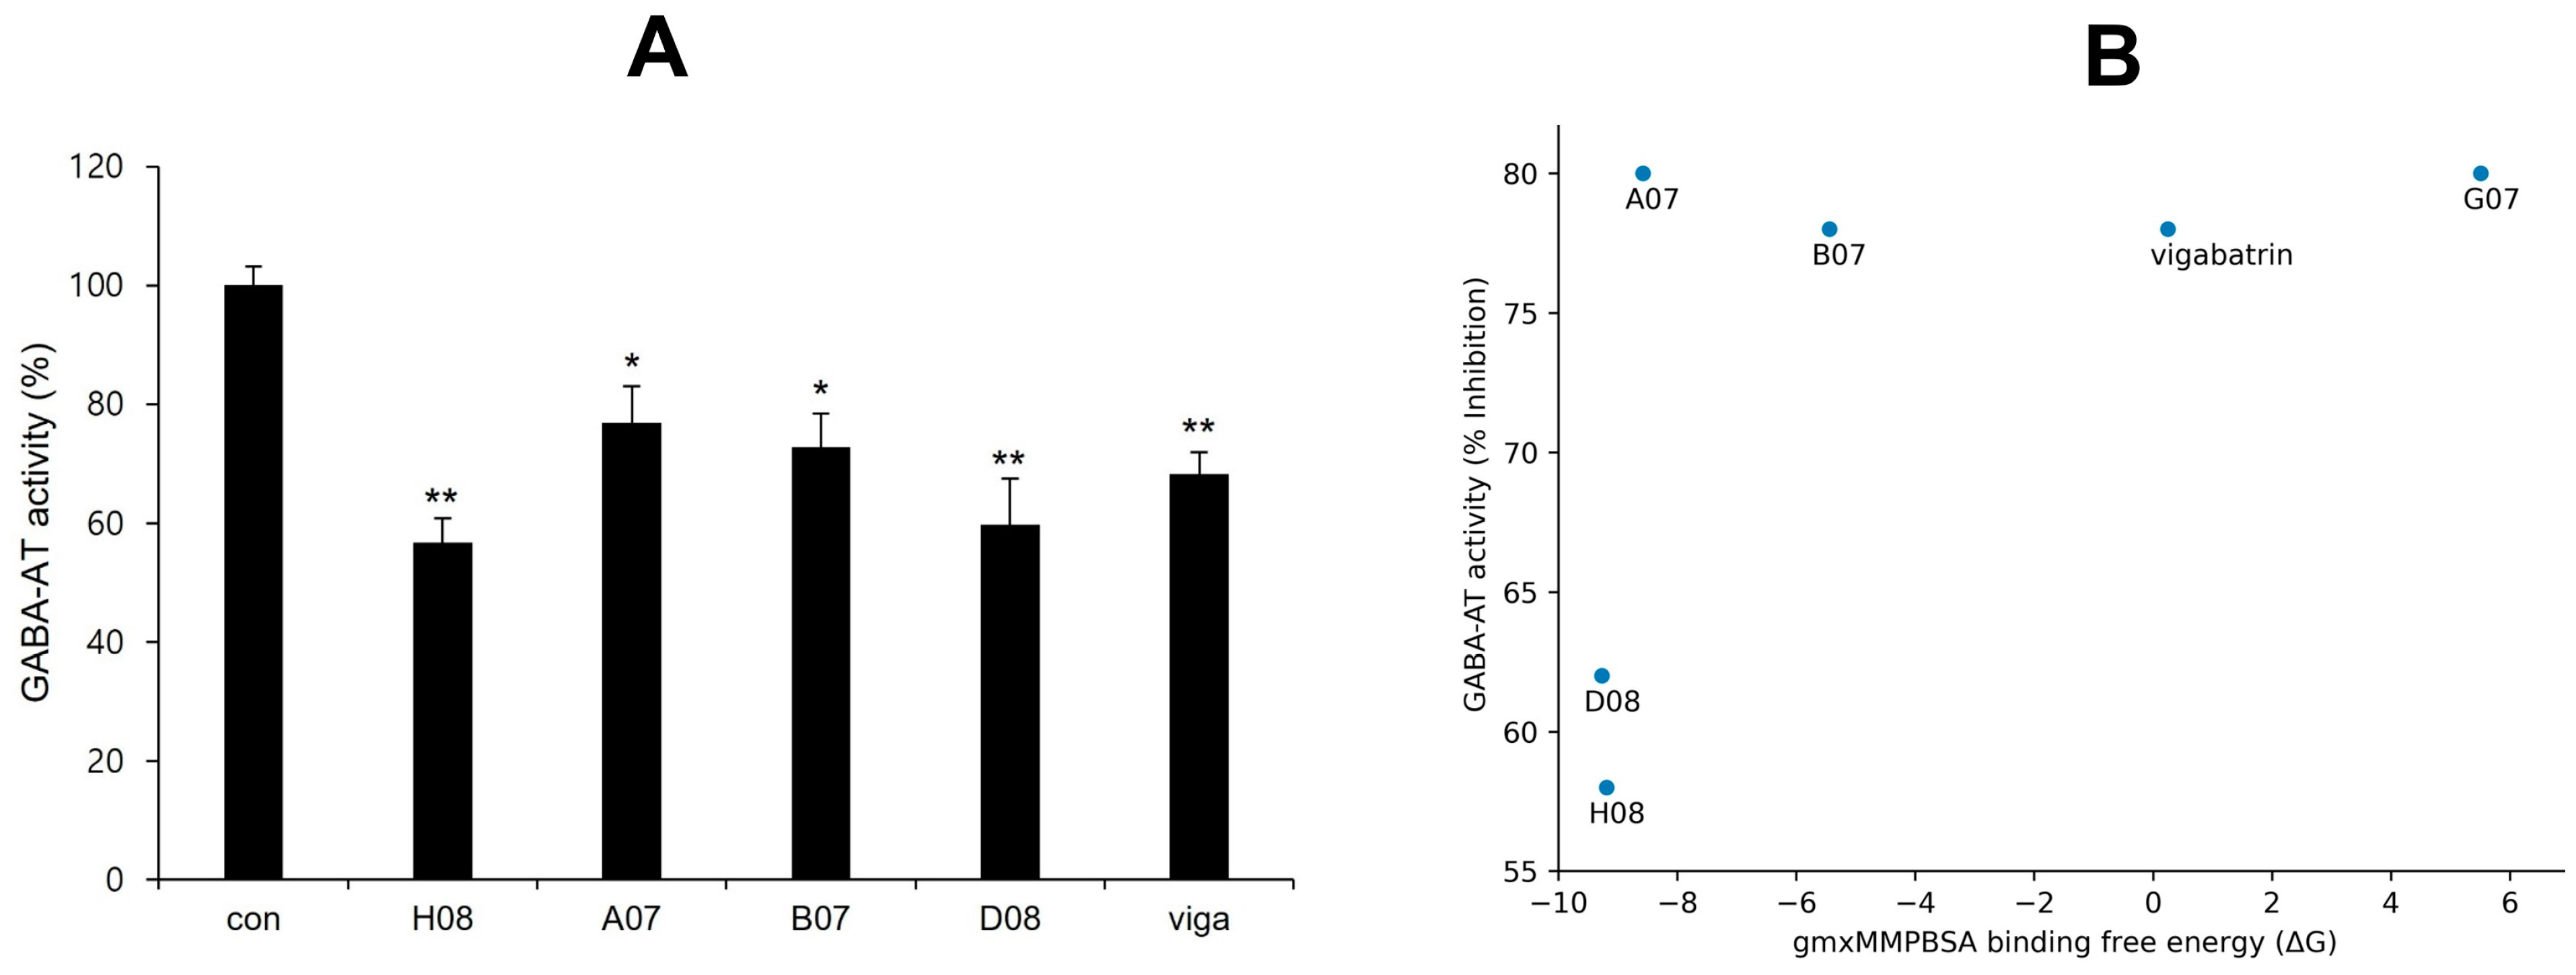
2.11. gmx_MMPBSA Binding Free Energy Calculation
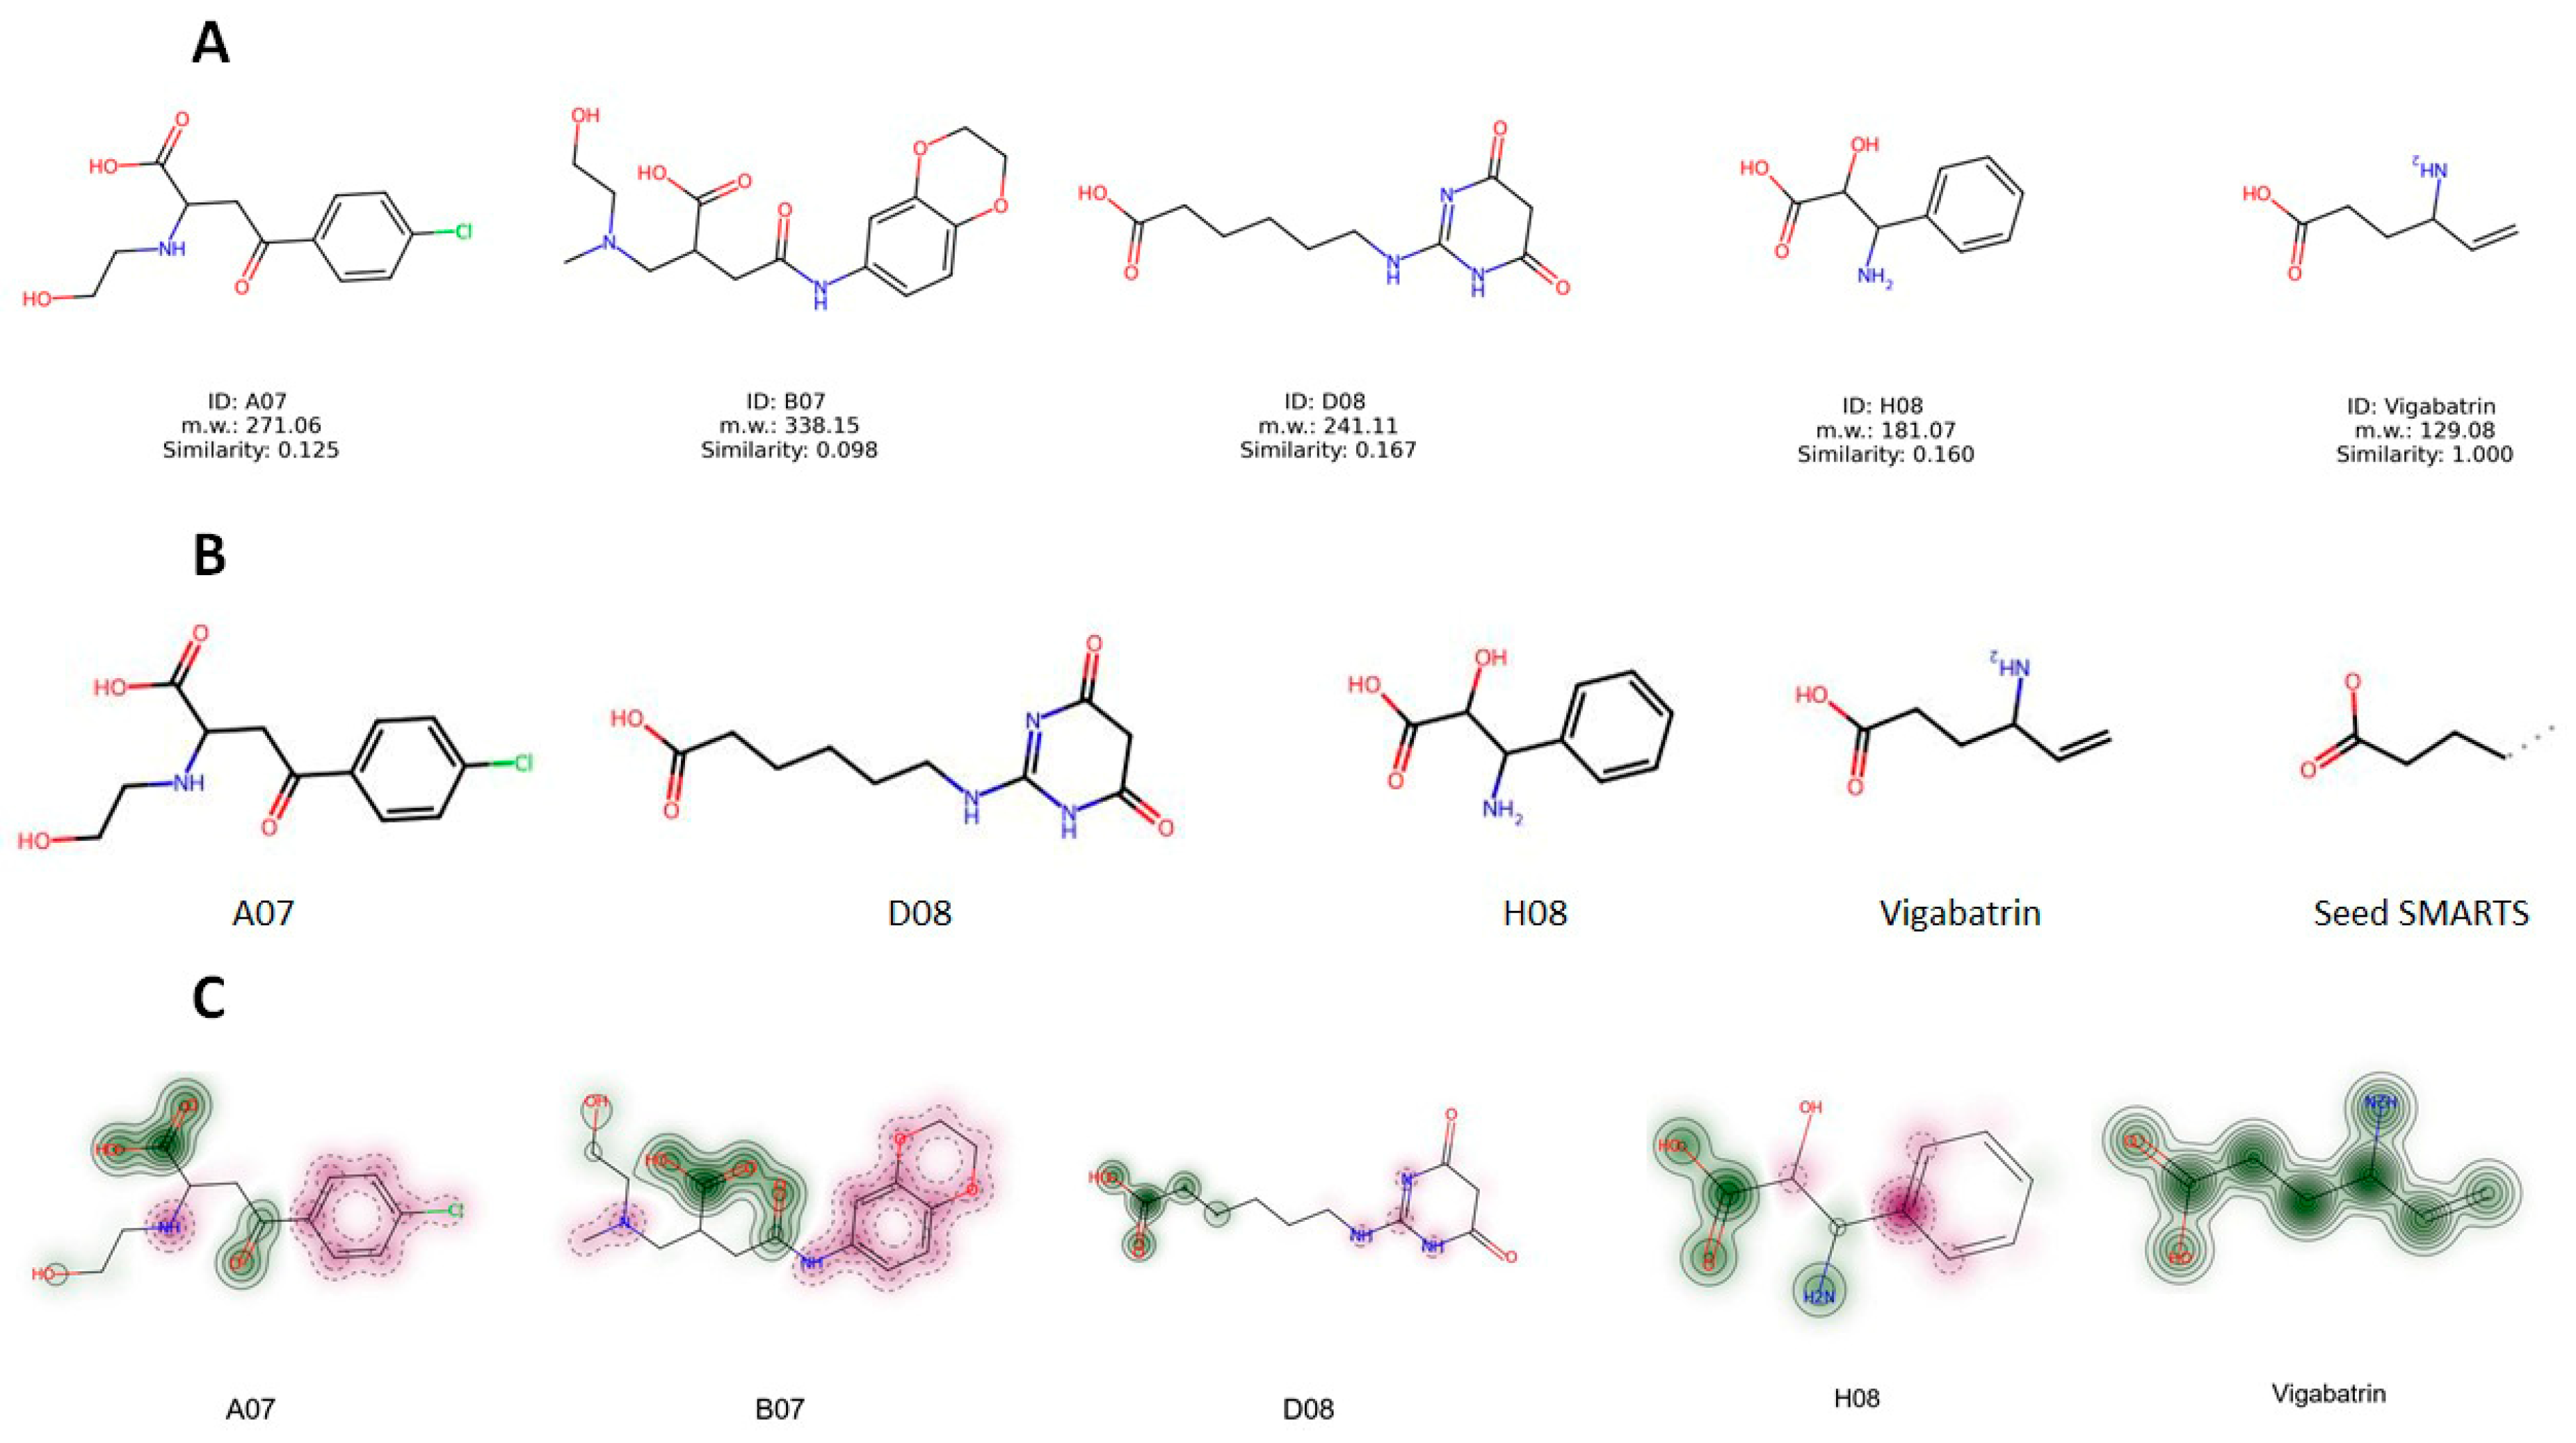
2.12. Structure Evaluation, Similarity Comparison, and Common Substructure Finding
2.13. Experimental Validation of GABA-AT Inhibition
3. Materials and Methods
3.1. GABA Structure Retrieval
3.2. Prediction of Active Binding Site
3.3. Pharmacophore Modeling and Molecular Docking Analysis
3.4. Molecular Dynamic Simulation
3.5. gmx_MMPBSA Binding Free Energy Calculation
3.6. Experimental Reagents and Cell Culture
3.7. Resazurin-Based Assay for GABA-AT Activity Determination
3.8. Statistical Analysis
4. Conclusions
Supplementary Materials
Author Contributions
Funding
Institutional Review Board Statement
Informed Consent Statement
Data Availability Statement
Acknowledgments
Conflicts of Interest
References
- Sander, J.W. Epileptic Seizures. In Encyclopedia of the Neurological Sciences, 2nd ed.; Aminoff, M.J., Daroff, R.B., Eds.; Academic Press: Oxford, UK, 2014; pp. 175–177. [Google Scholar]
- Milligan, T.A. Epilepsy: A clinical overview. Am. J. Med. 2021, 134, 840–847. [Google Scholar] [CrossRef] [PubMed]
- Łątka, K.; Jończyk, J.; Bajda, M. γ-Aminobutyric acid transporters as relevant biological target: Their function, structure, inhibitors and role in the therapy of different diseases. Int. J. Biol. Macromol. 2020, 158, 750–772. [Google Scholar] [CrossRef] [PubMed]
- Peerboom, C.; Wierenga, C.J. The postnatal GABA shift: A developmental perspective. Neurosci. Biobehav. Rev. 2021, 124, 179–192. [Google Scholar] [CrossRef] [PubMed]
- Samardzic, J.; Jadzic, D.; Hencic, B.; Jancic, J.; Strac, D.S. Introductory chapter: GABA/Glutamate balance: A key for normal brain functioning. In GABA and Glutamate—New Developments in Neurotransmission Research; Samardzic, J., Ed.; InTech: Rijeka, Croatia, 2018; pp. 1–9. [Google Scholar]
- Hampe, C.S.; Mitoma, H.; Manto, M. GABA and glutamate: Their transmitter role in the CNS and pancreatic islets. In GABA And Glutamate—New Developments in Neurotransmission Research; InTech: Rijeka, Croatia, 2018. [Google Scholar]
- Patri, M. Synaptic transmission and amino acid neurotransmitters. In Neurochemical Basis of Brain Function and Dysfunction; IntechOpen: London, UK, 2019. [Google Scholar]
- Knoflach, F.; Hernandez, M.-C.; Bertrand, D. GABAA receptor-mediated neurotransmission: Not so simple after all. Biochem. Pharmacol. 2016, 115, 10–17. [Google Scholar] [CrossRef]
- Ghit, A.; Assal, D.; Al-Shami, A.S.; Hussein, D.E.E. GABA(A) receptors: Structure, function, pharmacology, and related disorders. J. Genet. Eng. Biotechnol. 2021, 19, 123. [Google Scholar] [CrossRef]
- Herbison, A.E.; Moenter, S.M. Depolarising and hyperpolarising actions of GABA(A) receptor activation on gonadotrophin-releasing hormone neurones: Towards an emerging consensus. J. Neuroendocrinol. 2011, 23, 557–569. [Google Scholar] [CrossRef]
- Sallard, E.; Letourneur, D.; Legendre, P. Electrophysiology of ionotropic GABA receptors. Cell. Mol. Life Sci. 2021, 78, 5341–5370. [Google Scholar] [CrossRef]
- Patel, A.; Gokulgandhi, M.; Khurana, V.; Mitra, A.K. 5—Transporters and receptors in the posterior segment of the eye. In Ocular Transporters and Receptors; Mitra, A.K., Ed.; Woodhead Publishing: Cambridge, UK, 2013; pp. 169–205. [Google Scholar]
- Madsen, K.K.; White, H.S.; Schousboe, A. Neuronal and non-neuronal GABA transporters as targets for antiepileptic drugs. Pharmacol. Ther. 2010, 125, 394–401. [Google Scholar] [CrossRef]
- Wiens, S.C.; Trudeau, V.L.J.C.B.; Molecular, P.P.A.; Physiology, I. Thyroid hormone and γ-aminobutyric acid (GABA) interactions in neuroendocrine systems. Comp. Biochem. Physiol. A Mol. Integr. Physiol. 2006, 144, 332–344. [Google Scholar] [CrossRef]
- Magnaghi, V. GABA and neuroactive steroid interactions in glia: New roles for old players? Curr. Neuropharmacol. 2007, 5, 47–64. [Google Scholar] [CrossRef]
- Kang, S.; Liu, L.; Wang, T.; Cannon, M.; Lin, P.; Fan, T.W.M.; Scott, D.A.; Wu, H.-J.J.; Lane, A.N.; Wang, R. GAB functions as a bioenergetic and signalling gatekeeper to control T cell inflammation. Nat. Metab. 2022, 4, 1322–1335. [Google Scholar] [CrossRef]
- Silverman, R.B. Design and Mechanism of GABA Aminotransferase Inactivators. Treatments for Epilepsies and Addictions. Chem. Rev. 2018, 118, 4037–4070. [Google Scholar] [CrossRef]
- Nugraha, R.Y.B.; Jeelani, G.; Nozaki, T. Physiological roles and metabolism of γ-aminobutyric acid (GABA) in parasitic protozoa. Trends Parasitol. 2022, 38, 462–477. [Google Scholar] [CrossRef]
- Dahiya, D.; Manuel, J.V.; Nigam, P.S. An overview of bioprocesses employing specifically selected microbial catalysts for γ-aminobutyric acid production. Microorganisms 2021, 9, 2457. [Google Scholar] [CrossRef]
- Storici, P.; De Biase, D.; Bossa, F.; Bruno, S.; Mozzarelli, A.; Peneff, C.; Silverman, R.B.; Schirmer, T. Structures of gamma-aminobutyric acid (GABA) aminotransferase, a pyridoxal 5′-phosphate, and [2Fe-2S] cluster-containing enzyme, complexed with gamma-ethynyl-GABA and with the antiepilepsy drug vigabatrin. J. Biol. Chem. 2004, 279, 363–373. [Google Scholar] [CrossRef]
- Aldana, B.I.; Zhang, Y.; Jensen, P.; Chandrasekaran, A.; Christensen, S.K.; Nielsen, T.T.; Nielsen, J.E.; Hyttel, P.; Larsen, M.R.; Waagepetersen, H.S.; et al. Glutamate-glutamine homeostasis is perturbed in neurons and astrocytes derived from patient iPSC models of frontotemporal dementia. Mol. Brain 2020, 13, 125. [Google Scholar] [CrossRef]
- Yogeswara, I.B.A.; Maneerat, S.; Haltrich, D. Glutamate Decarboxylase from Lactic Acid Bacteria—A Key Enzyme in GABA Synthesis. Microorganisms 2020, 8, 1923. [Google Scholar] [CrossRef]
- Silverman, R.B. The 2011 EB Hershberg Award for important discoveries in medicinally active substances:(1 S, 3 S)-3-amino-4-difluoromethylenyl-1-cyclopentanoic acid (CPP-115), a GABA aminotransferase inactivator and new treatment for drug addiction and infantile spasms. J. Med. Chem. 2012, 55, 567–575. [Google Scholar] [CrossRef]
- Huang, D.; Alexander, P.B.; Li, Q.-J.; Wang, X.-F. GABAergic signaling beyond synapses: An emerging target for cancer therapy. J. Med. Chem. 2022, 55, 567–575. [Google Scholar] [CrossRef] [PubMed]
- Feng, Y.; Wei, Z.-H.; Liu, C.; Li, G.-Y.; Qiao, X.-Z.; Gan, Y.-J.; Zhang, C.-C.; Deng, Y.-C. Genetic variations in GABA metabolism and epilepsy. Seizure 2022, 101, 22–29. [Google Scholar] [CrossRef]
- Lee, H.H.C.; McGinty, G.E.; Pearl, P.L.; Rotenberg, A. Understanding the Molecular Mechanisms of Succinic Semialdehyde Dehydrogenase Deficiency (SSADHD): Towards the Development of SSADH-Targeted Medicine. Int. J. Mol. Sci. 2022, 23, 2606. [Google Scholar] [CrossRef] [PubMed]
- Yasir, M.; Park, J.; Han, E.-T.; Park, W.S.; Han, J.-H.; Kwon, Y.-S.; Lee, H.-J.; Chun, W. Computational Exploration of the Effects of Mutations on GABA Aminotransferase in GABA Aminotransferase Deficiency. Int. J. Mol. Sci. 2023, 24, 10933. [Google Scholar] [CrossRef]
- Yasir, M.; Park, J.; Han, E.-T.; Park, W.S.; Han, J.-H.; Kwon, Y.-S.; Lee, H.-J.; Hassan, M.; Kloczkowski, A.; Chun, W.J.M. Exploration of Flavonoids as Lead Compounds against Ewing Sarcoma through Molecular Docking, Pharmacogenomics Analysis, and Molecular Dynamics Simulations. Molecules 2023, 28, 414. [Google Scholar] [CrossRef] [PubMed]
- Wu, Y.; Brooks, C.L., III. Flexible CDOCKER: Hybrid Searching Algorithm and Scoring Function with Side Chain Conformational Entropy. J. Chem. Inf. Model. 2021, 61, 5535–5549. [Google Scholar] [CrossRef]
- Yasir, M.; Park, J.; Han, E.-T.; Park, W.S.; Han, J.-H.; Kwon, Y.-S.; Lee, H.-J.; Chun, W. Computational Exploration of Licorice for Lead Compounds against Plasmodium vivax Duffy Binding Protein Utilizing Molecular Docking and Molecular Dynamic Simulation. Molecules 2023, 28, 3358. [Google Scholar] [CrossRef] [PubMed]
- Laskowski, R.A.; Swindells, M.B. LigPlot+: Multiple ligand-protein interaction diagrams for drug discovery. J. Chem. Inf. Model. 2011, 51, 2778–2786. [Google Scholar] [CrossRef] [PubMed]
- Menduti, G.; Vitaliti, A.; Capo, C.R.; Lettieri-Barbato, D.; Aquilano, K.; Malaspina, P.; Rossi, L. SSADH Variants Increase Susceptibility of U87 Cells to Mitochondrial Pro-Oxidant Insult. Int. J. Mol. Sci. 2020, 21, 4374. [Google Scholar] [CrossRef]
- Yasir, M.; Park, J.; Han, E.T.; Park, W.S.; Han, J.H.; Kwon, Y.S.; Lee, H.J.; Chun, W. Machine Learning-Based Drug Repositioning of Novel Janus Kinase 2 Inhibitors Utilizing Molecular Docking and Molecular Dynamic Simulation. J. Chem. Inf. Model. 2023, 63, 6487–6500. [Google Scholar] [CrossRef]
- Lee, Y.; Yoon, S.B.; Hong, H.; Kim, H.Y.; Jung, D.; Moon, B.S.; Park, W.K.; Lee, S.; Kwon, H.; Park, J.; et al. Discovery of GSK3β Inhibitors through In Silico Prediction-and-Experiment Cycling Strategy, and Biological Evaluation. Molecules 2022, 27, 3825. [Google Scholar] [CrossRef]
- Yasir, M.; Park, J.; Han, E.-T.; Park, W.S.; Han, J.-H.; Kwon, Y.-S.; Lee, H.-J.; Chun, W. Vismodegib Identified as a Novel COX-2 Inhibitor via Deep-Learning-Based Drug Repositioning and Molecular Docking Analysis. ACS Omega 2023, 8, 34160–34170. [Google Scholar] [CrossRef]
- Jo, S.; Kim, T.; Iyer, V.G.; Im, W. CHARMM-GUI: A web-based graphical user interface for CHARMM. J. Comput. Chem. 2008, 29, 1859–1865. [Google Scholar] [CrossRef]
- Valdés-Tresanco, M.S.; Valdés-Tresanco, M.E.; Valiente, P.A.; Moreno, E. gmx_MMPBSA: A new tool to perform end-state free energy calculations with GROMACS. J. Chem. Theory Comput. 2021, 17, 6281–6291. [Google Scholar] [CrossRef]
- King, E.; Aitchison, E.; Li, H.; Luo, R. Recent developments in free energy calculations for drug discovery. Front. Mol. Biosci. 2021, 8, 712085. [Google Scholar] [CrossRef]
- Jung, M.J.; Lippert, B.; Metcalf, B.W.; Schechter, P.J.; Böhlen, P.; Sjoerdsma, A. The effect of 4-amino hex-5-ynoic acid (gamma-acetylenic GABA, gammma-ethynyl GABA) a catalytic inhibitor of GABA transaminase, on brain GABA metabolism in vivo. J. Neurochem. 1977, 28, 717–723. [Google Scholar] [CrossRef]
- Ippolito, J.E.; Piwnica-Worms, D. A fluorescence-coupled assay for gamma aminobutyric acid (GABA) reveals metabolic stress-induced modulation of GABA content in neuroendocrine cancer. PLoS ONE 2014, 9, e88667. [Google Scholar] [CrossRef]

| Compounds | CDocker Energy | CDocker Interaction Energy |
|---|---|---|
| D07 | −72.6 | −75.1 |
| F07 | −72.1 | −71.2 |
| B08 | −60.5 | −53.4 |
| A07 | −59.4 | −57.3 |
| H08 | −58.5 | −53.3 |
| B07 | −57.4 | −60.5 |
| C08 | −56.8 | −56.3 |
| A08 | −56.6 | −52.7 |
| H03 | −55.3 | −55.6 |
| Vigabatrin | −53.7 | −56.3 |
| D08 | −52.2 | −54.6 |
| G03 | −49.1 | −38.1 |
| G06 | −46.6 | −59.5 |
| E07 | −44.8 | −47.9 |
| E04 | −38.5 | −48.7 |
| G07 | −30.9 | −51.1 |
| H06 | −17.6 | −41.4 |
| Compounds | Coul-SR | LJ-SR | Total |
|---|---|---|---|
| G03 | −22.7 | −29.2 | −51.9 |
| H03 | −59.1 | −37.6 | −96.8 |
| A07 | −101.4 | −113.1 | −214.6 |
| B07 | −151.9 | −121.1 | −273.0 |
| G07 | −83.1 | −126.9 | −210.0 |
| E07 | −89.6 | −92.4 | −182.0 |
| A08 | −81.2 | −77.6 | −158.8 |
| D08 | −174.6 | −106.7 | −281.2 |
| H08 | −116.4 | −69.6 | −186.0 |
| Vigabatrin | −62.6 | −68.3 | −130.9 |
| Sr | Compounds | ΔG(TOTAL) | Standard Deviation |
|---|---|---|---|
| 1 | A07 | −8.58 | 8.02 |
| 2 | B07 | −5.44 | 5.12 |
| 3 | D08 | −9.27 | 5.87 |
| 4 | H08 | −9.19 | 6.04 |
| 5 | G07 | 5.51 | 7.19 |
| 6 | Vigabatrin | 0.25 | 4.23 |
| Similarity | A07 | B07 | D08 | H08 | Vigabatrin |
|---|---|---|---|---|---|
| A07 | - | 0.275 | 0.157 | 0.217 | 0.125 |
| B07 | 0.275 | - | 0.152 | 0.159 | 0.098 |
| D08 | 0.157 | 0.152 | - | 0.079 | 0.167 |
| H08 | 0.217 | 0.159 | 0.079 | - | 0.160 |
| Vigabatrin | 0.125 | 0.098 | 0.167 | 0.160 | - |
Disclaimer/Publisher’s Note: The statements, opinions and data contained in all publications are solely those of the individual author(s) and contributor(s) and not of MDPI and/or the editor(s). MDPI and/or the editor(s) disclaim responsibility for any injury to people or property resulting from any ideas, methods, instructions or products referred to in the content. |
© 2023 by the authors. Licensee MDPI, Basel, Switzerland. This article is an open access article distributed under the terms and conditions of the Creative Commons Attribution (CC BY) license (https://creativecommons.org/licenses/by/4.0/).
Share and Cite
Yasir, M.; Park, J.; Lee, Y.; Han, E.-T.; Park, W.S.; Han, J.-H.; Kwon, Y.-S.; Lee, H.-J.; Chun, W. Discovery of GABA Aminotransferase Inhibitors via Molecular Docking, Molecular Dynamic Simulation, and Biological Evaluation. Int. J. Mol. Sci. 2023, 24, 16990. https://doi.org/10.3390/ijms242316990
Yasir M, Park J, Lee Y, Han E-T, Park WS, Han J-H, Kwon Y-S, Lee H-J, Chun W. Discovery of GABA Aminotransferase Inhibitors via Molecular Docking, Molecular Dynamic Simulation, and Biological Evaluation. International Journal of Molecular Sciences. 2023; 24(23):16990. https://doi.org/10.3390/ijms242316990
Chicago/Turabian StyleYasir, Muhammad, Jinyoung Park, Yuno Lee, Eun-Taek Han, Won Sun Park, Jin-Hee Han, Yong-Soo Kwon, Hee-Jae Lee, and Wanjoo Chun. 2023. "Discovery of GABA Aminotransferase Inhibitors via Molecular Docking, Molecular Dynamic Simulation, and Biological Evaluation" International Journal of Molecular Sciences 24, no. 23: 16990. https://doi.org/10.3390/ijms242316990
APA StyleYasir, M., Park, J., Lee, Y., Han, E.-T., Park, W. S., Han, J.-H., Kwon, Y.-S., Lee, H.-J., & Chun, W. (2023). Discovery of GABA Aminotransferase Inhibitors via Molecular Docking, Molecular Dynamic Simulation, and Biological Evaluation. International Journal of Molecular Sciences, 24(23), 16990. https://doi.org/10.3390/ijms242316990