Article

Identifying Explainable Machine Learning Models and a Novel SFRP2+ Fibroblast Signature as Predictors for Precision Medicine in Ovarian Cancer

School of Life Sciences, Zhengzhou University, Zhengzhou 450001, China
*
Author to whom correspondence should be addressed.
These authors contributed equally to this work.
Int. J. Mol. Sci. 2023, 24(23), 16942; https://doi.org/10.3390/ijms242316942
Submission received: 25 September 2023 / Revised: 24 November 2023 / Accepted: 26 November 2023 / Published: 29 November 2023
(This article belongs to the Special Issue Machine Learning Applications in Bioinformatics and Biomedicine)

Abstract

:
Ovarian cancer (OC) is a type of malignant tumor with a consistently high mortality rate. The diagnosis of early-stage OC and identification of functional subsets in the tumor microenvironment are essential to the development of patient management strategies. However, the development of robust models remains unsatisfactory. We aimed to utilize artificial intelligence and single-cell analysis to address this issue. Two independent datasets were screened from the Gene Expression Omnibus (GEO) database and processed to obtain overlapping differentially expressed genes (DEGs) in stage II–IV vs. stage I diseases. Three explainable machine learning algorithms were integrated to construct models that could determine the tumor stage and extract important characteristic genes as diagnostic biomarkers. Correlations between cancer-associated fibroblast (CAF) infiltration and characteristic gene expression were analyzed using TIMER2.0 and their relationship with survival rates was comprehensively explored via the Kaplan–Meier plotter (KM-plotter) online database. The specific expression of characteristic genes in fibroblast subsets was investigated through single-cell analysis. A novel fibroblast subset signature was explored to predict immune checkpoint inhibitor (ICI) response and oncogene mutation through Tumor Immune Dysfunction and Exclusion (TIDE) and artificial neural network algorithms, respectively. We found that Support Vector Machine–Shapley Additive Explanations (SVM-SHAP), Extreme Gradient Boosting (XGBoost), and Random Forest (RF) successfully diagnosed early-stage OC (stage I). The area under the receiver operating characteristic curves (AUCs) of these models exceeded 0.990. Their overlapping characteristic gene, secreted frizzled-related protein 2 (SFRP2), was a risk factor that affected the overall survival of OC patients with stage II–IV disease (log-rank test: p < 0.01) and was specifically expressed in a fibroblast subset. Finally, the SFRP2+ fibroblast signature served as a novel predictor in evaluating ICI response and exploring pan-cancer tumor protein P53 (TP53) mutation (AUC = 0.853, 95% confidence interval [CI]: 0.829–0.877). In conclusion, the models based on SVM-SHAP, XGBoost, and RF enabled the early detection of OC for clinical decision making, and SFRP2+ fibroblast signature used in diagnostic models can inform OC treatment selection and offer pan-cancer TP53 mutation detection.

1. Introduction

Ovarian cancer (OC), cervical cancer, and endometrial cancer are commonly diagnosed diseases that affect the female reproductive organs [1,2,3]. Advanced-stage OC is estimated to have the highest mortality rate among gynecological cancers [4,5,6]. Approximately 90–95% of OC takes the form of primary tumors originating from epithelial cells, while the remaining 5–10% comprises primary cancers from other cell subtypes [3,6,7]. OC can be staged based on the extent of the spread [8,9]. In stage I, the tumor is confined to either the ovaries or fallopian tubes [8]; the 5-year survival rate of patients in this stage is approximately 89% [9,10]. In stage II, the tumor involves one or both ovaries and has spread within the pelvis. The 5-year survival rate of stage II OC patients is approximately 70%. Stage III involves the infiltration of one or both ovaries, with extra pelvic peritoneal metastasis or retroperitoneal lymph node metastasis confirmed cytologically or histologically. The 5-year survival rates for OC patients with stage III is approximately 36%. Stage IV signifies the presence of distant metastasis beyond the abdominal cavity. This includes positive pleural effusion cytology, metastasis to the parenchyma of the liver or spleen, metastasis to extra-abdominal organs (such as inguinal lymph nodes and lymph nodes outside the abdominal cavity), as well as transmural invasion of the intestinal tract. The 5-year survival rate of patients in this stage is low, at around 17%.
The treatment for OC patients generally includes surgical intervention, along with options for radiotherapy or chemotherapy [11,12]. Early-stage OC patients are candidates for comprehensive staging surgery, which is used to accurately determine the stage of the disease [11,13]; tumor cytoreductive surgery is suitable for moderate- to advanced-stage patients with extraovarian metastases [14]. Paclitaxel combined with carboplatin is the drug of choice for first-line neoadjuvant chemotherapy, and the combination chemotherapy of taxane/platinum or doxorubicin liposome/carboplatin is a common postoperative adjuvant chemotherapy [15,16]. Bevacizumab is a prominent drug in anti-angiogenic therapy. It is administered in combination with chemotherapy and is suitable for both first-line treatment and the treatment of relapsed OC cases [17,18,19]. Currently, olaparib, niraparib, and fluzoparib are poly ADP-ribose polymerase (PARP) inhibitors that have received marketing approval. These drugs have demonstratable effectiveness in the maintenance treatment of OC [20,21,22]. Due to the absence of noticeable symptoms in its early stages, the detection of OC in this stage is highly challenging [11,23]. The majority of OC cases are diagnosed at a late stage, which greatly reduces the effectiveness of curative treatments [5]. Consequently, the overall prognosis for OC is generally low [24,25]. The effectiveness of first-line chemotherapy is greater, but a significant proportion of patients will relapse, with a very short average recurrence time [26,27,28]. Therefore, the development of clinical biomarkers and robust predictive models that can accurately diagnose early-stage OC is of utmost urgency.
There has been a significant surge in the amount and complexity of data generated from individuals and biological experiments as a result of numerous research efforts and breakthroughs in the biomedical field in recent years. This presents both opportunities and challenges for precision medicine [29,30,31,32]. The exponential expansion of existing biomedical data has surpassed the capacity to utilize traditional methods to extract meaningful insights and conduct in-depth studies on irradicable diseases. This necessitates the development of novel approaches that can assist researchers in effectively handling and interpreting vast and intricate datasets [29,33]. There has been a growing trend in utilizing machine learning methods to meet specific requirements. Machine learning, an artificial intelligence technology, enables computers to learn from the large scale of data features, identify specific patterns, and automatically uncover correlations and distinctions among different objects. It facilitates the rapid construction of diagnostic and prognostic models and often demonstrates good predictive performance [31,34]. For instance, Liu created SVM models to detect early OC and prostate cancer [35]. Klein et al. applied five machine learning algorithms to jointly complete the subtype distinction of EOC tissue [36]. Gevaert et al. reported Least Squares Support Vector Machines (LS-SVMs) in the prediction of OC in advanced stages [37]. These studies constructed models with good performance in OC detection, but did not provide explanations regarding their underlying mechanisms in terms of the rank of feature importance. Explainable machine learning methods, such as Random Forest (RF) and Extreme Gradient Boosting (XGBoost), offer promising solutions to address this issue. RF is an algorithm that utilizes multiple trees during the training process. The fundamental component of RF is the decision tree, where each classification tree is constructed from a random subset of the input data, consisting of input and output variables [38,39]. XGBoost is another machine learning algorithm widely used in classification and regression tasks, which uses the principle of the gradient descent algorithm to boost weak learners, based on gradient boosting trees, and adopts an additive strategy [40,41,42]. Shapley Additive Explanations (SHAP), a “model explanation” package developed in Python, allows us to analyze each feature’s contribution to the model’s decision-making process [43,44,45]. Combining Support Vector Machine (SVM) and SHAP facilitates feature selection [46], making SVM models easier to follow, especially for applications that require interpretability. Indeed, several studies utilized the explainable machine learning models for various aspects of OC diagnosis and have achieved significant progress in this regard [47,48,49]. However, to our knowledge, the joint application of SVM-SHAP, XGBoost, and RF in the efficient diagnosis of OC in the early stage (stage I) remains unsatisfactory. It is worth conducting research on these interpretable machine learning models to explore their ability with excellent diagnostic performance in early-stage OC diagnosis and to identify characteristic genes as prognostic factors.
The tumor microenvironment (TME) plays an important role in a tumor’s development, which provides potential therapeutic targets for treating cancer [50,51]. Cancer-associated fibroblasts (CAFs) form protective structures that can promote the progression of matrix formation and unfavorable TME to support tumor growth [52]. CAFs can release a variety of cytokines that affect different signaling pathways to promote the proliferation of surrounding tumor cells within the TME [51]. CAFs are key stromal components of the metastatic niche that can secrete pro-metastatic cytokines to facilitate tumor dissemination, promoting cancer cell peritoneal metastasis in ovarian cancer patients [53]. CAFs also interact with immune components to mediate the formation of a suppressive antitumor microenvironment [54]; several CAF subtypes may promote chemoresistance by maintaining cancer cell stemness [55]. In addition, different subtypes of CAFs exhibit specific functions in tumor pathogenesis [56]. However, the co-enrichment between the expression level of feature genes yielded by interpretable machine learning methods and CAFs infiltrates abundance in OC patients, as well as their cellular location in the TME, are far from being investigated.
In this study, our primary aim was to construct robust explainable machine learning models that can effectively identify whether the tumor is confined to the ovaries or fallopian tubes. Then, we investigated the performance of intersecting important feature genes derived from explainable machine learning algorithms in relation to determining OC prognosis and its localization in fibroblast subpopulations. Finally, we evaluated a unique fibroblast signature characterized by a specific gene expression pattern as candidate indicators for diagnosing the sensitivity of OC patients to ICI therapy and the presence of tumor protein p53 (TP53) mutations in pan-cancer samples.

2. Results

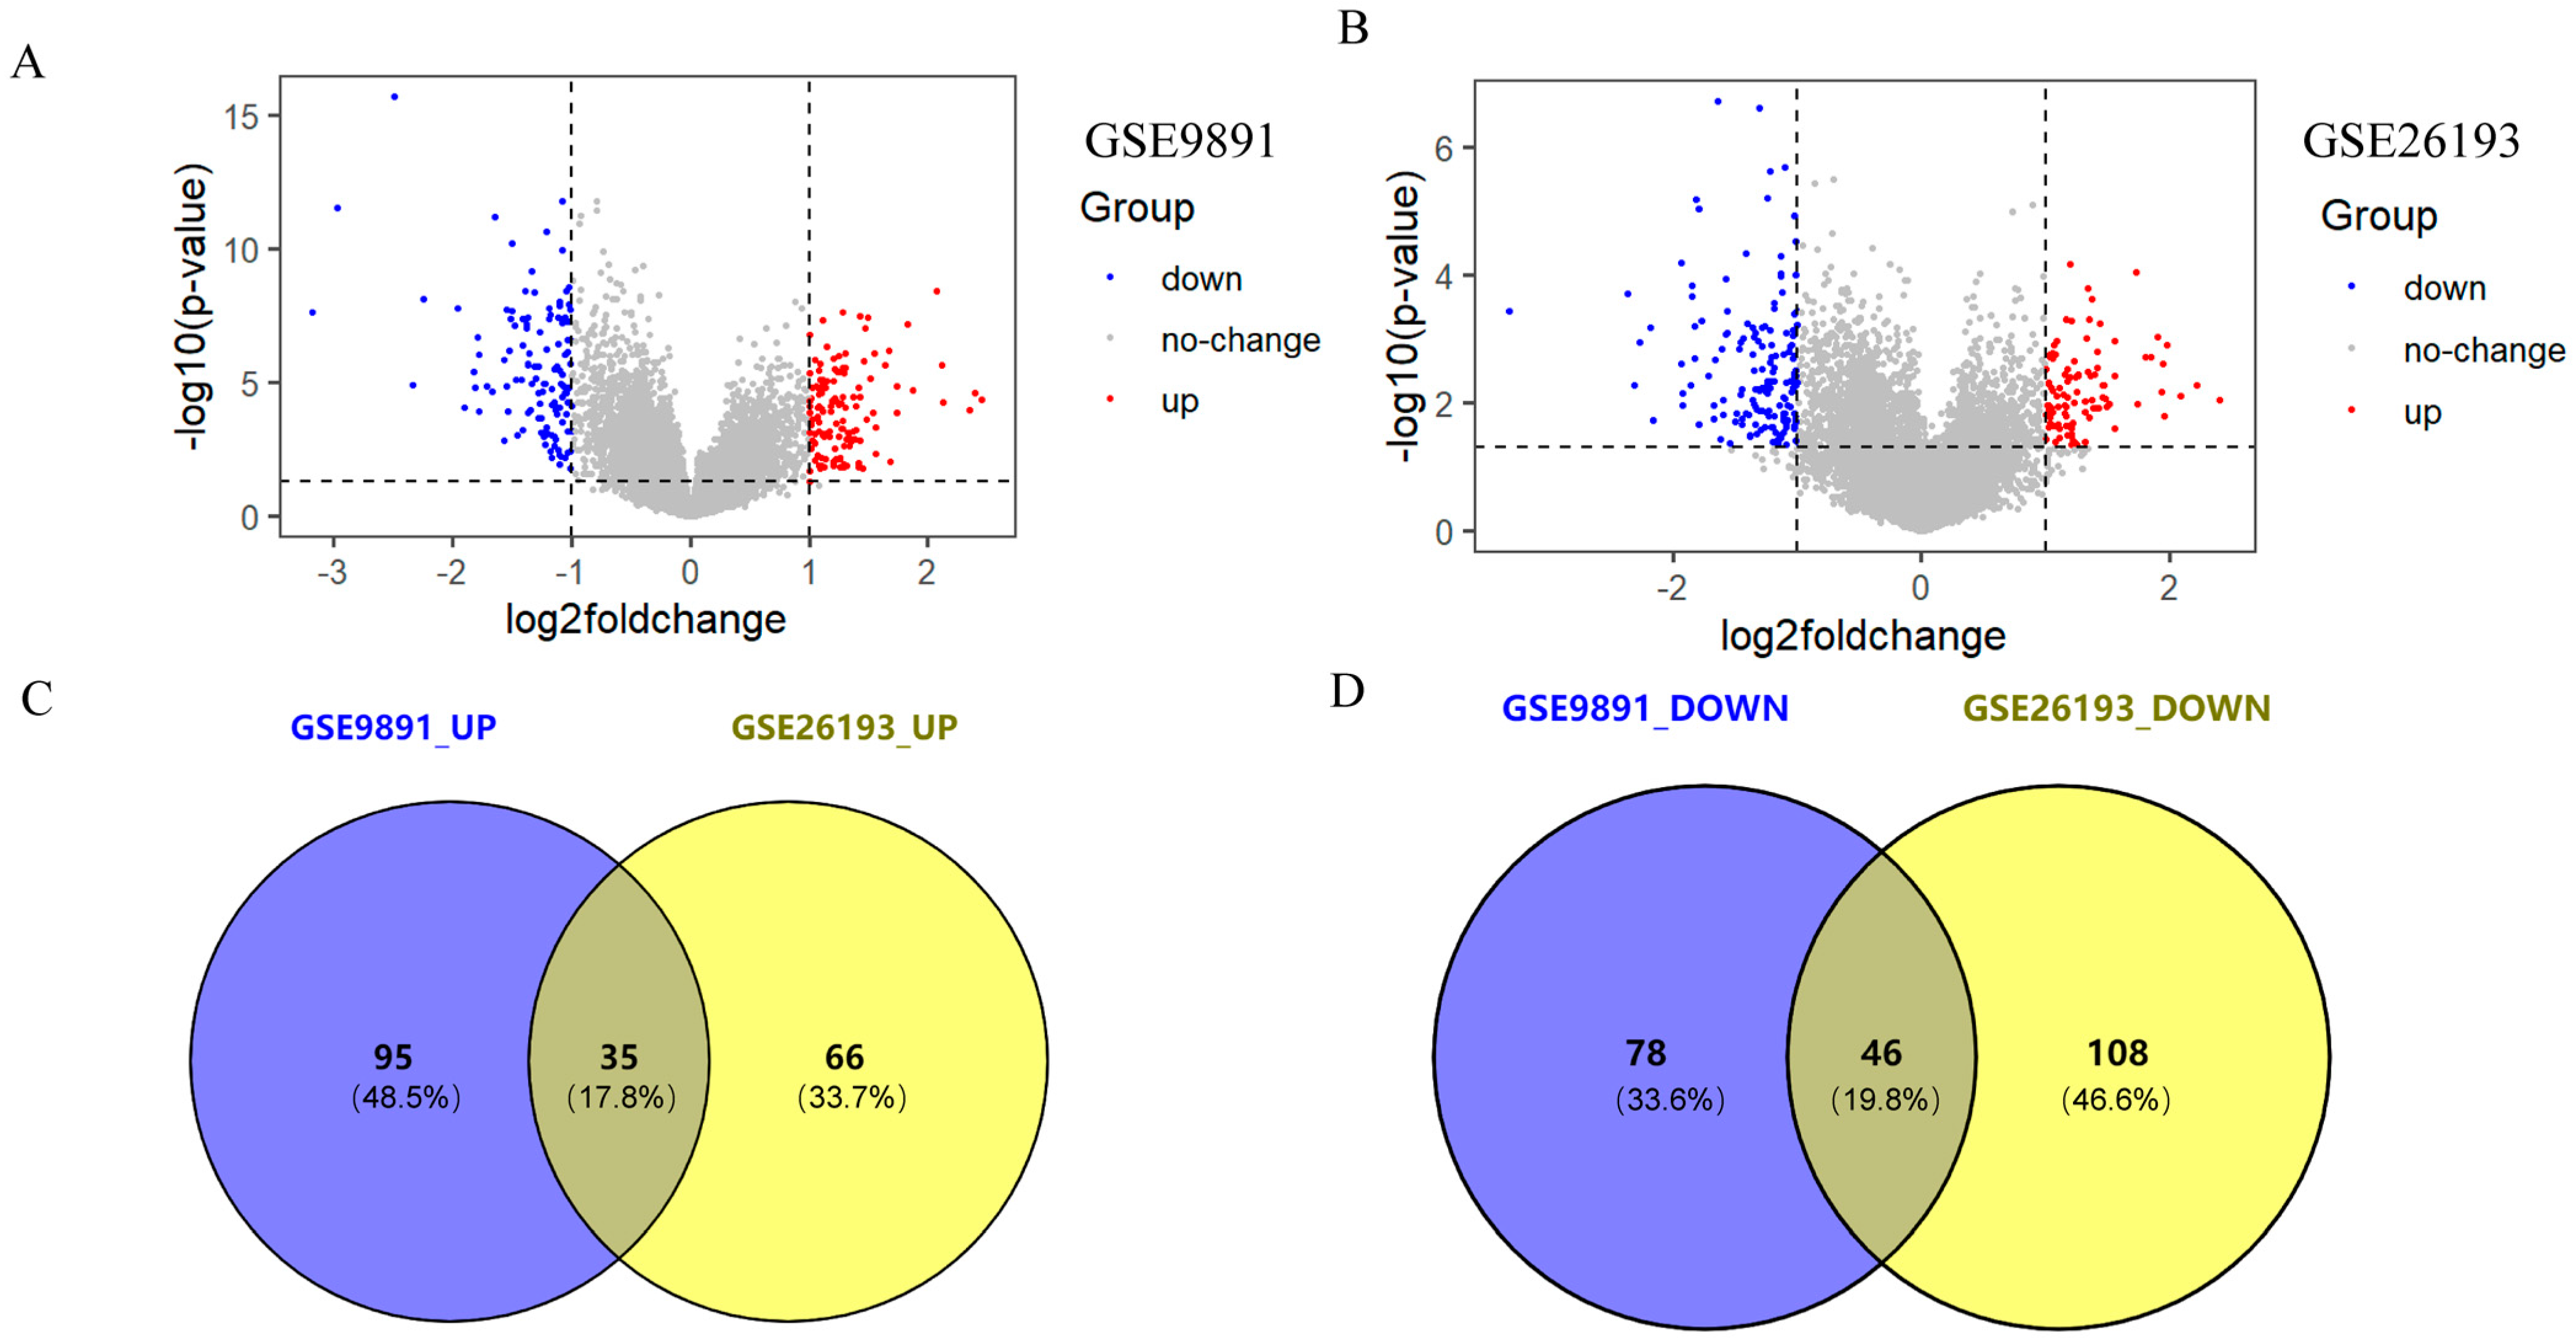
2.1. Acquisition of Differentially Expressed Genes (DEGs)

There were 254 DEGs in GSE9891, including 130 upregulated genes and 124 downregulated genes in stage II-IV patients compared to early-stage (stage I) patients (Figure 1A). Meanwhile, 255 DEGs were identified in GSE26193, including 101 upregulated genes and 154 downregulated genes (Figure 1B). Then, Veen analysis was utilized to identify the common upregulated and downregulated genes in both GSE9891 and GSE26193, resulting in a total of 81 overlapping DEGs, including 35 upregulated genes and 46 downregulated genes (Figure 1C,D).

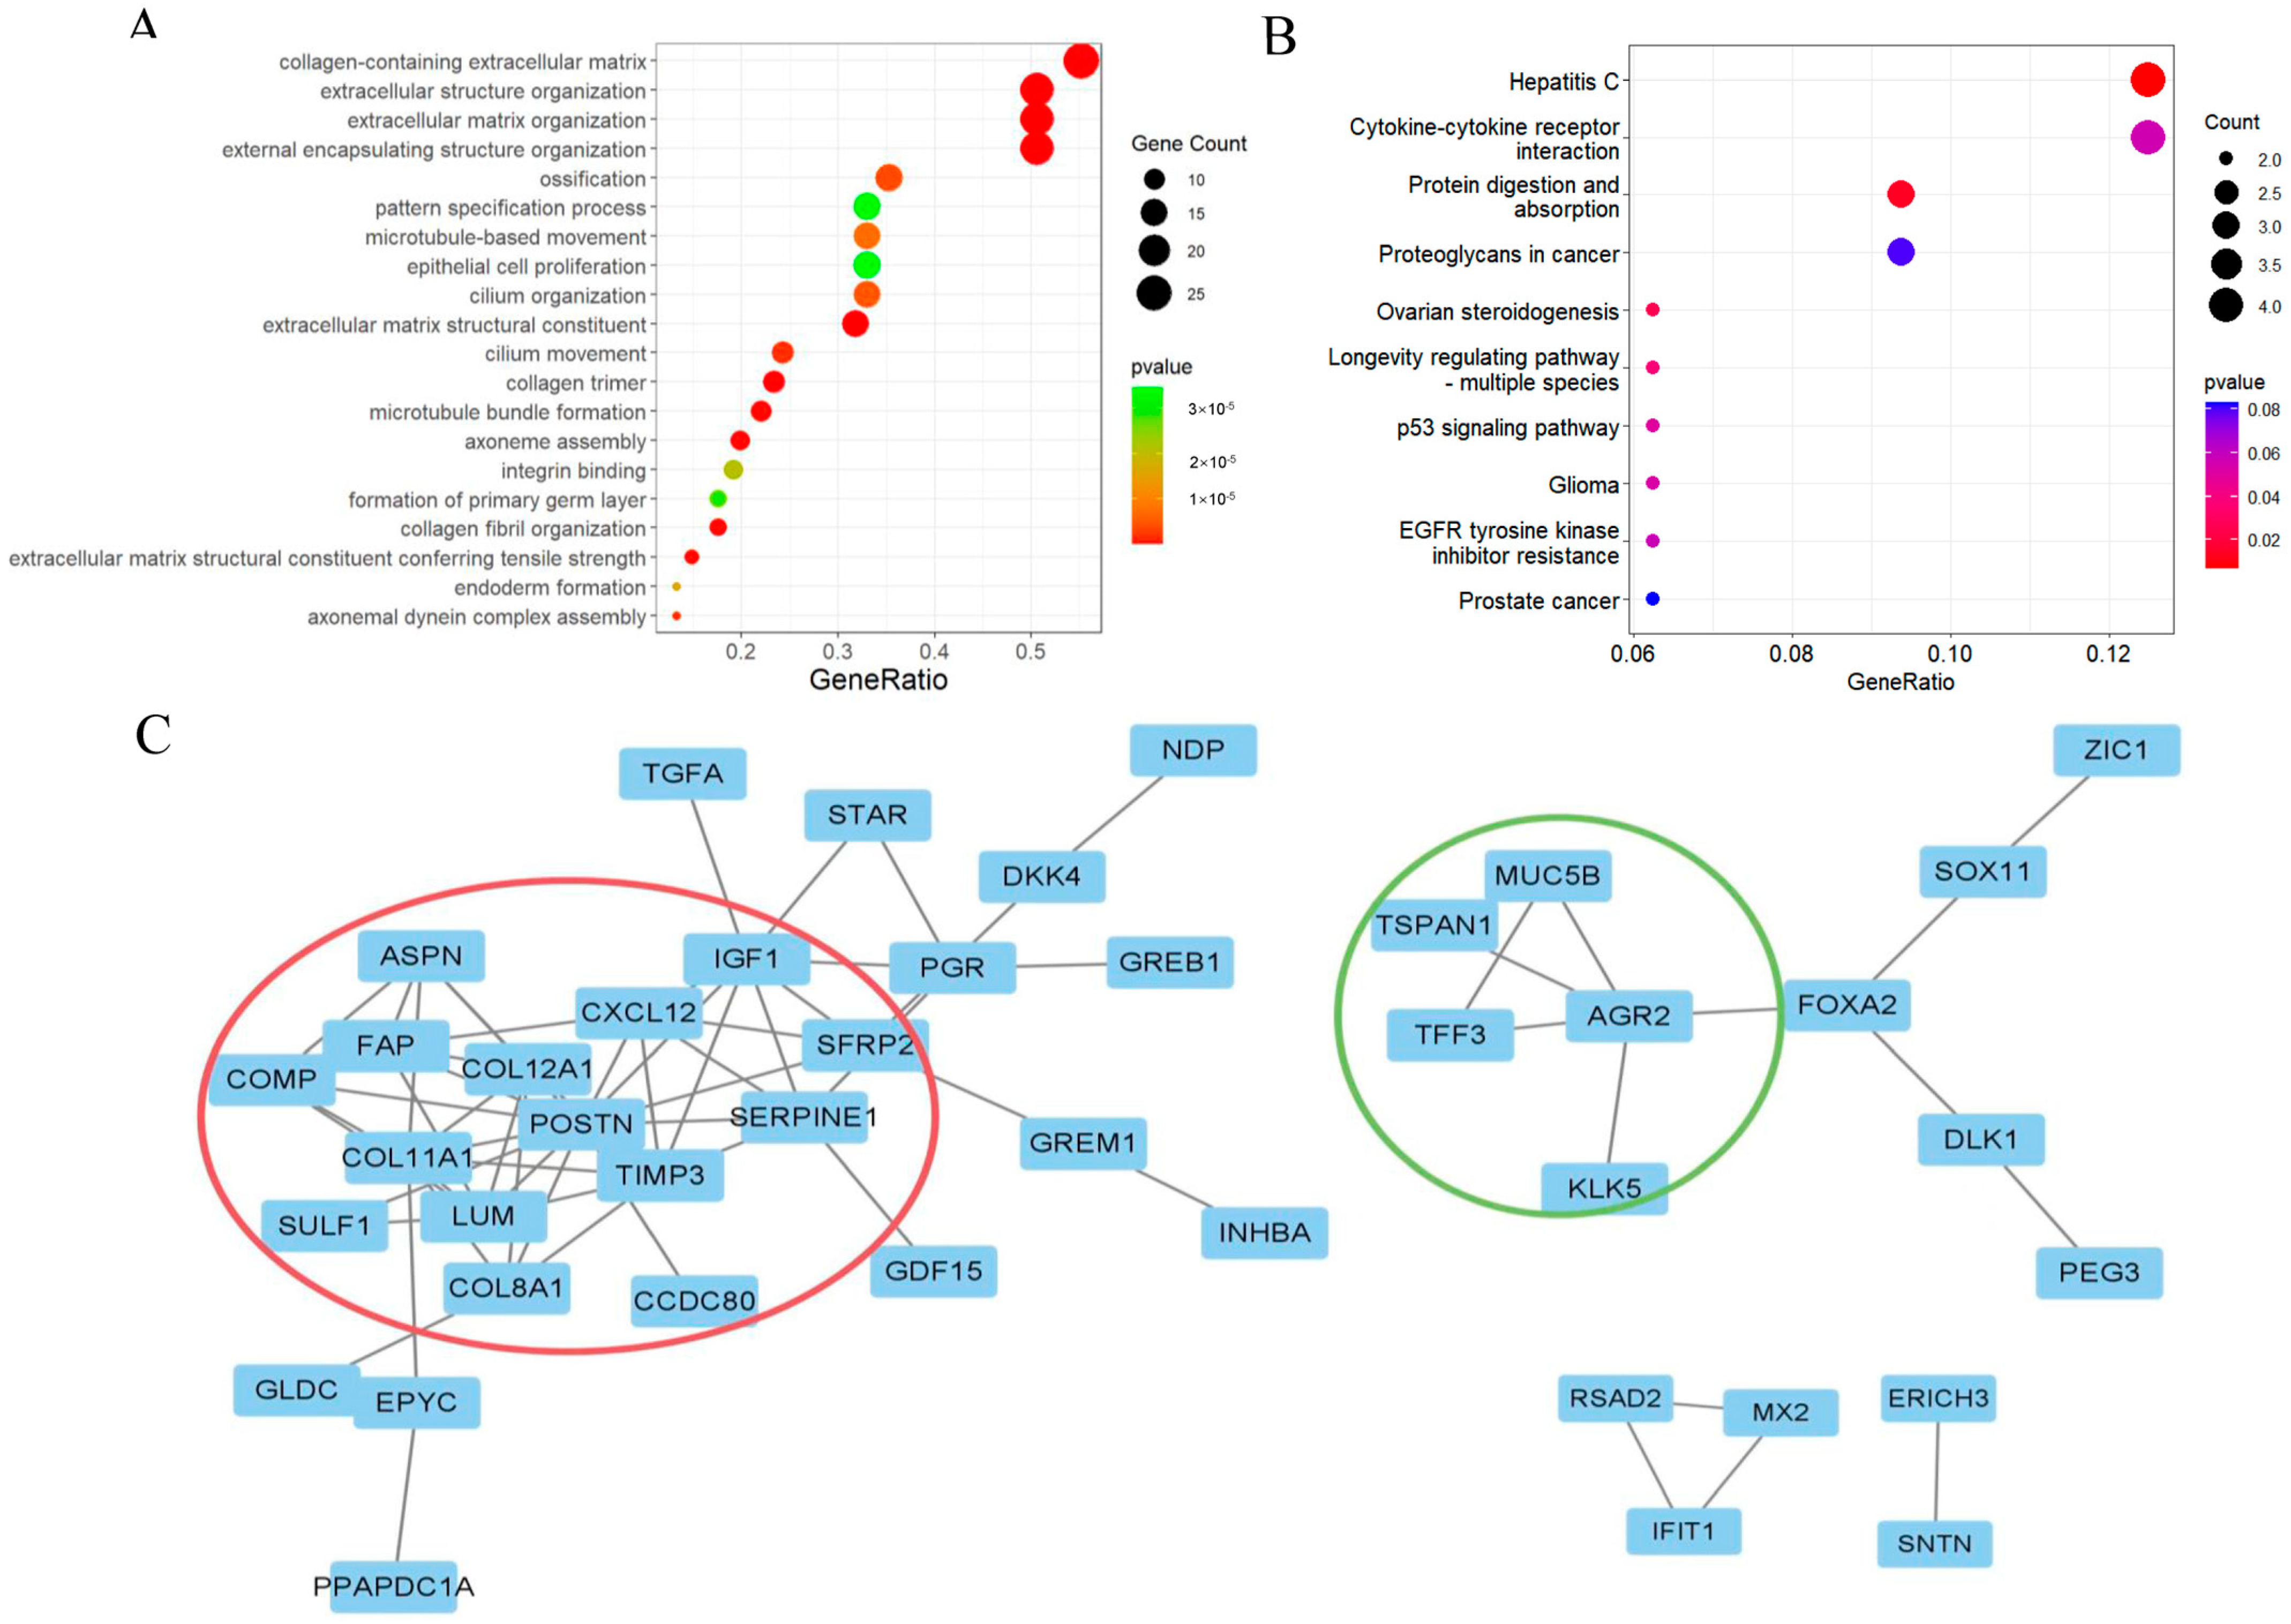
2.2. Functional Enrichment Analysis

Based on the results of the Gene Ontology (GO) analysis, the following biological functions were significantly enriched: collagen-containing extracellular matrix, extracellular structure organization, extracellular matrix organization, and external encapsulating structure organization (Figure 2A). The Kyoto Encyclopedia of Genes and Genomes (KEGG) analysis also revealed significant enrichment of pathways such as Hepatitis C, protein digestion and absorption (Figure 2B). Eighty-one differentially expressed genes were analyzed using the Search Tool for the Retrieval of Interacting Genes/Proteins (STRING) website, revealing interactions between their encoding proteins. The core Protein–Protein Interaction (PPI) network was constructed in STRING (Kmeans cluster) and visualized using Cytoscape, consisting of 42 nodes and 69 edges (Figure 2C).

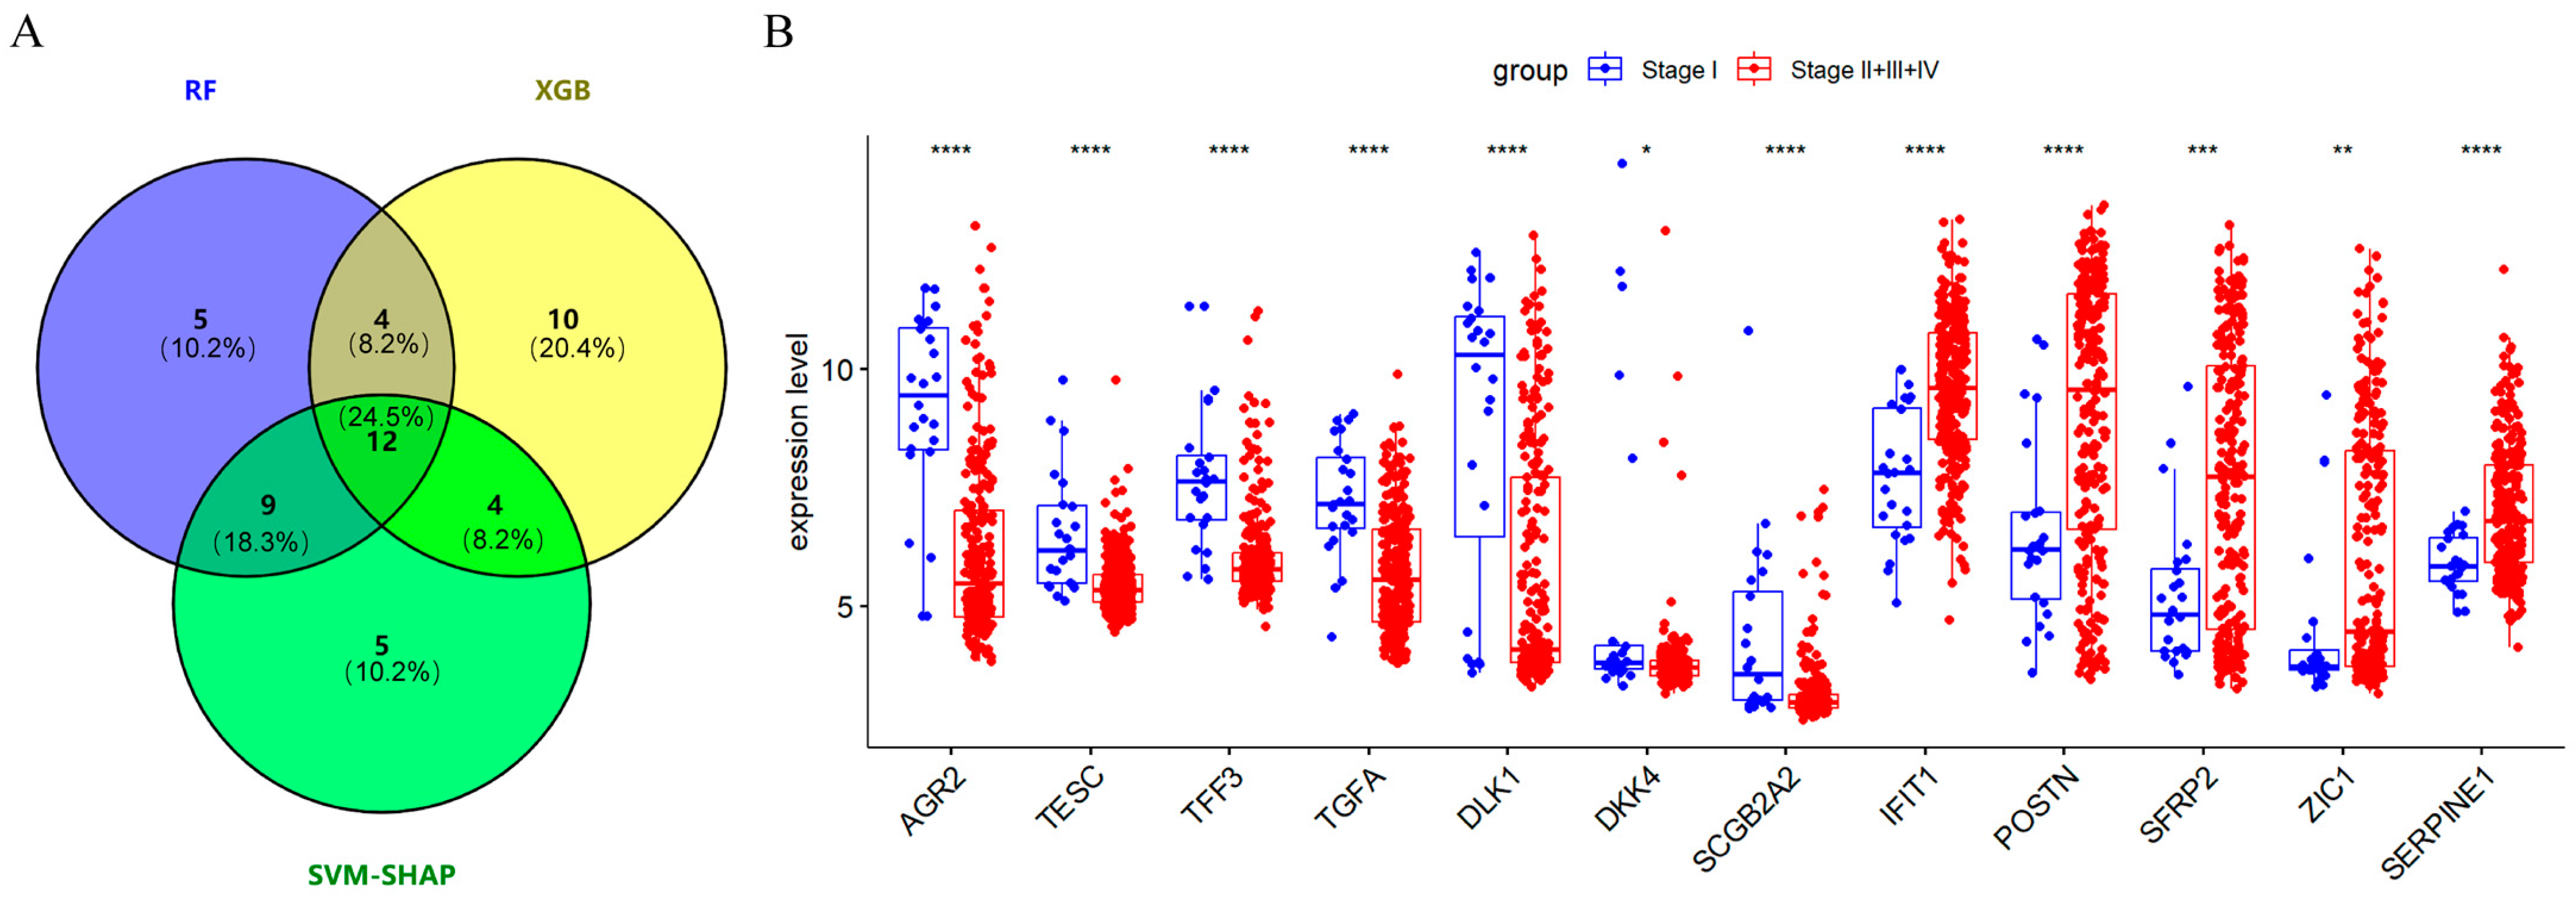
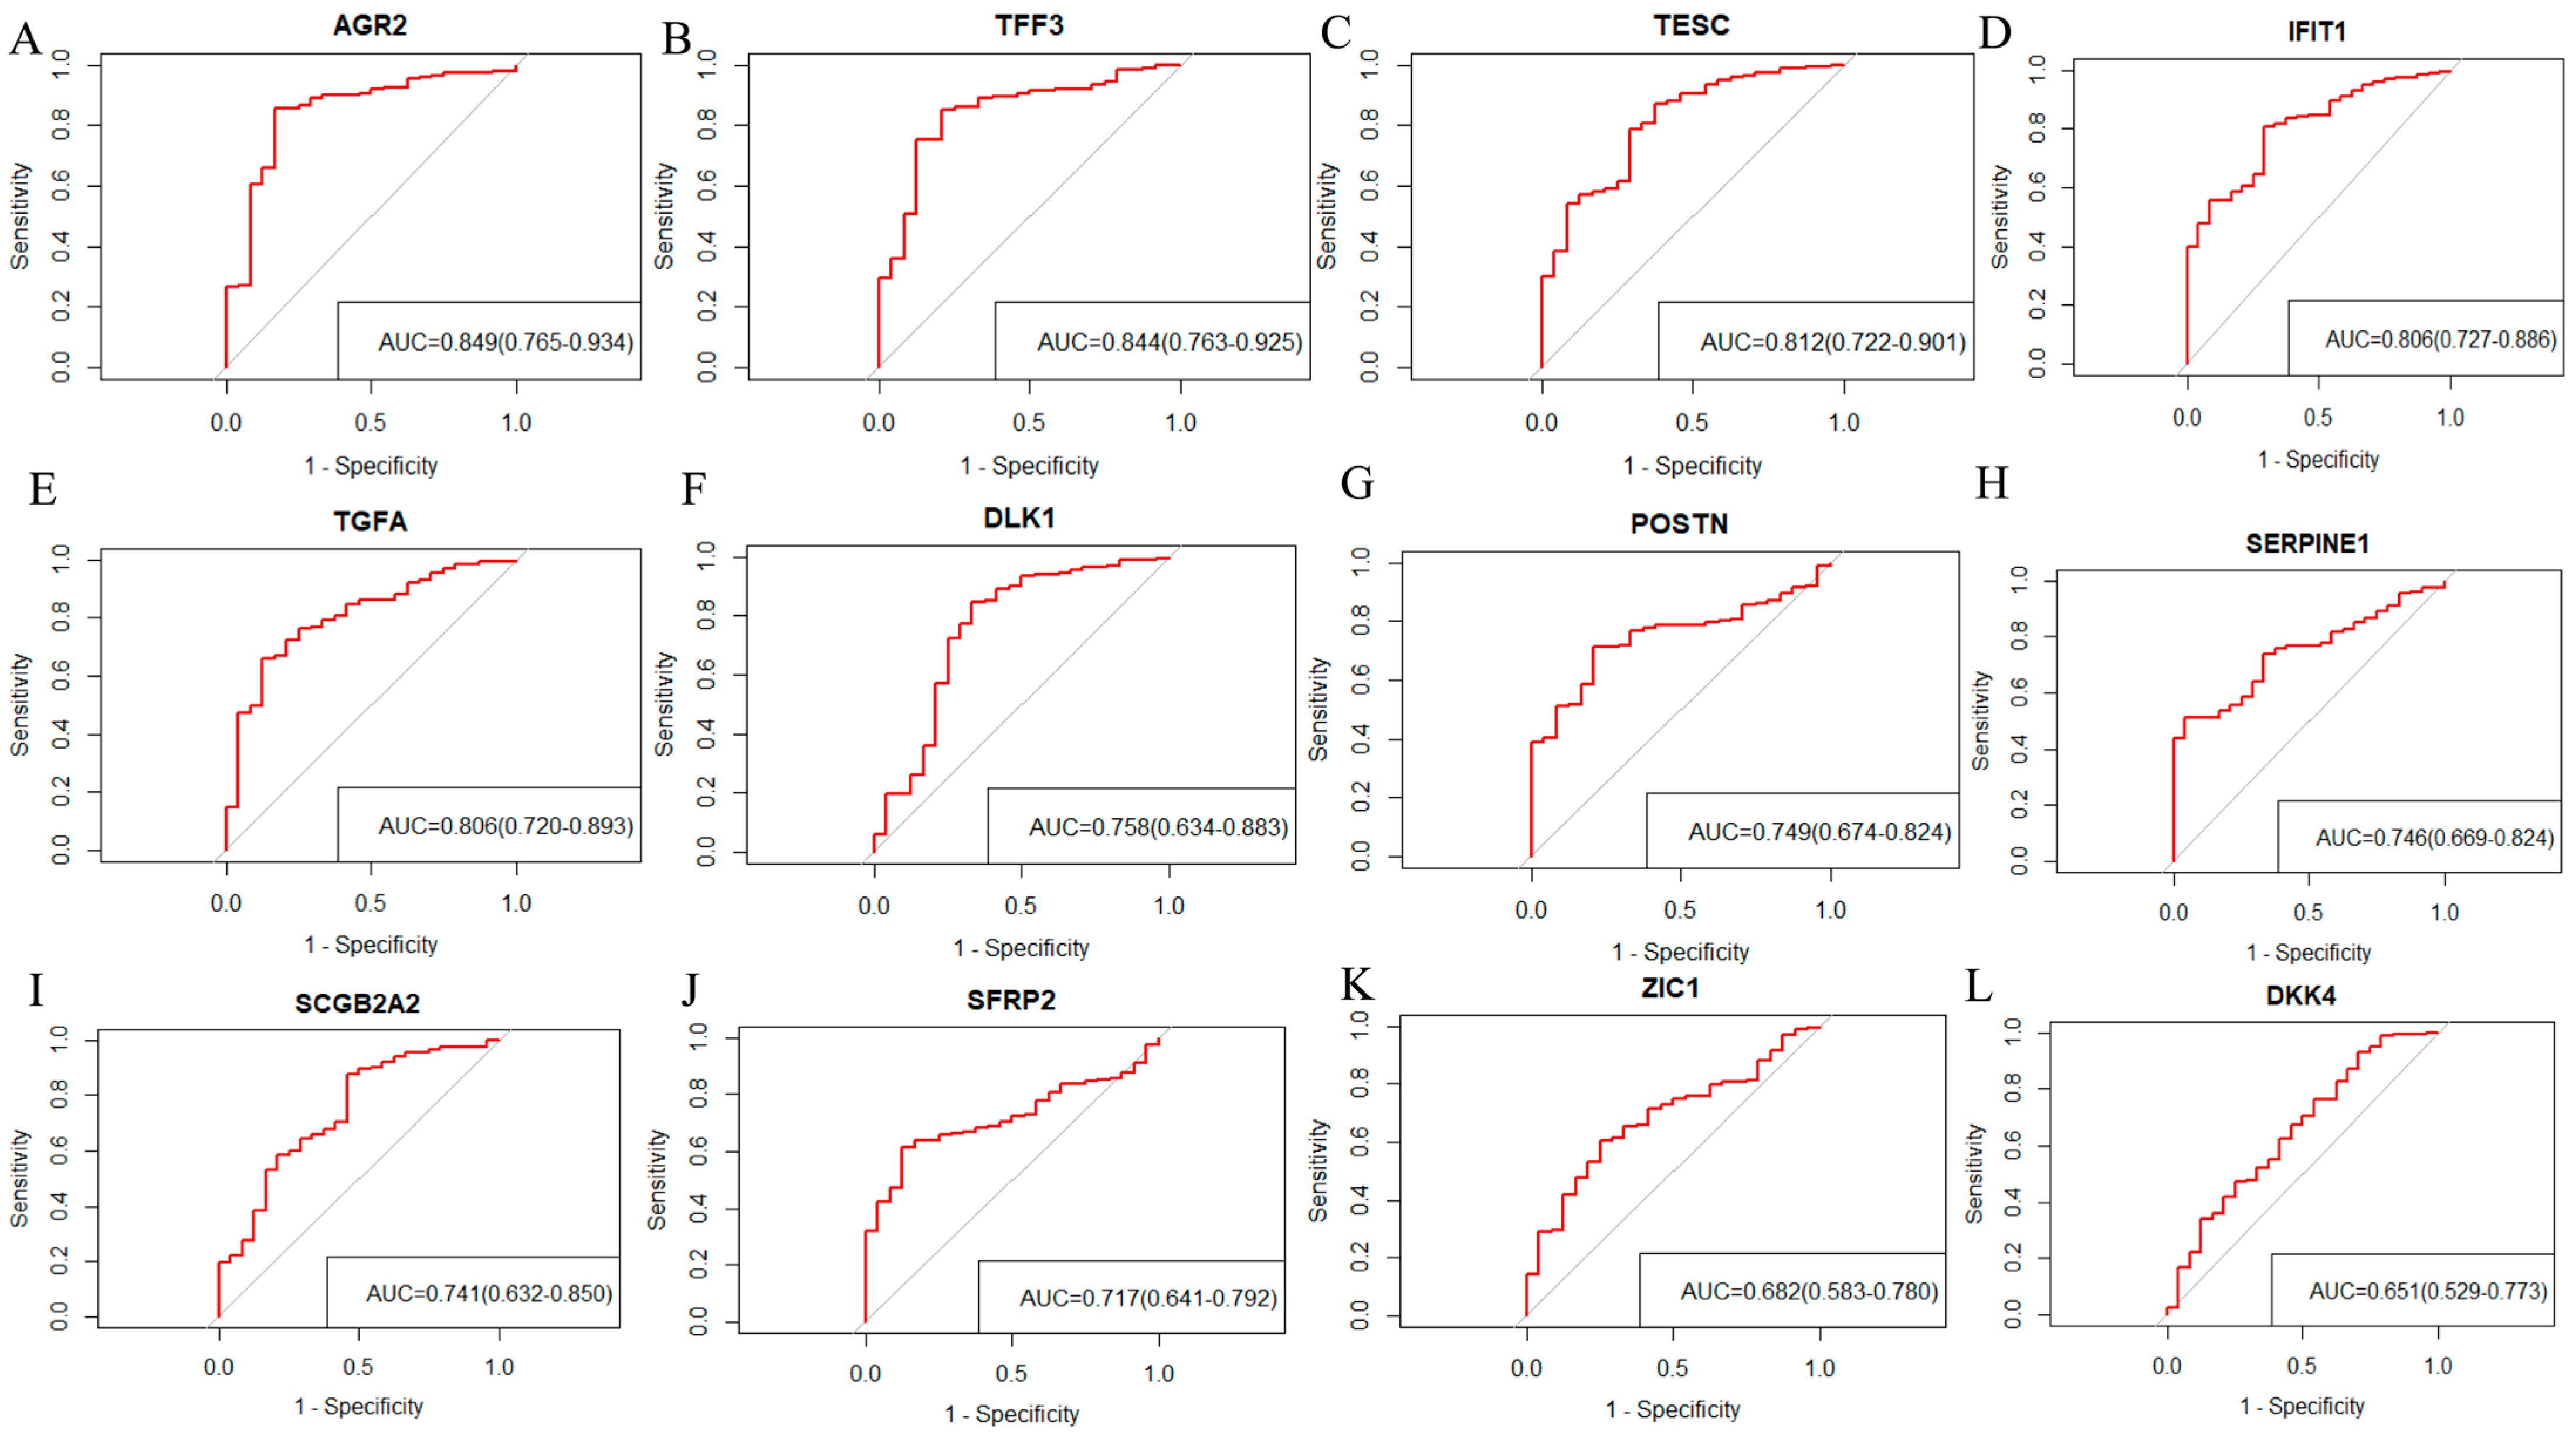
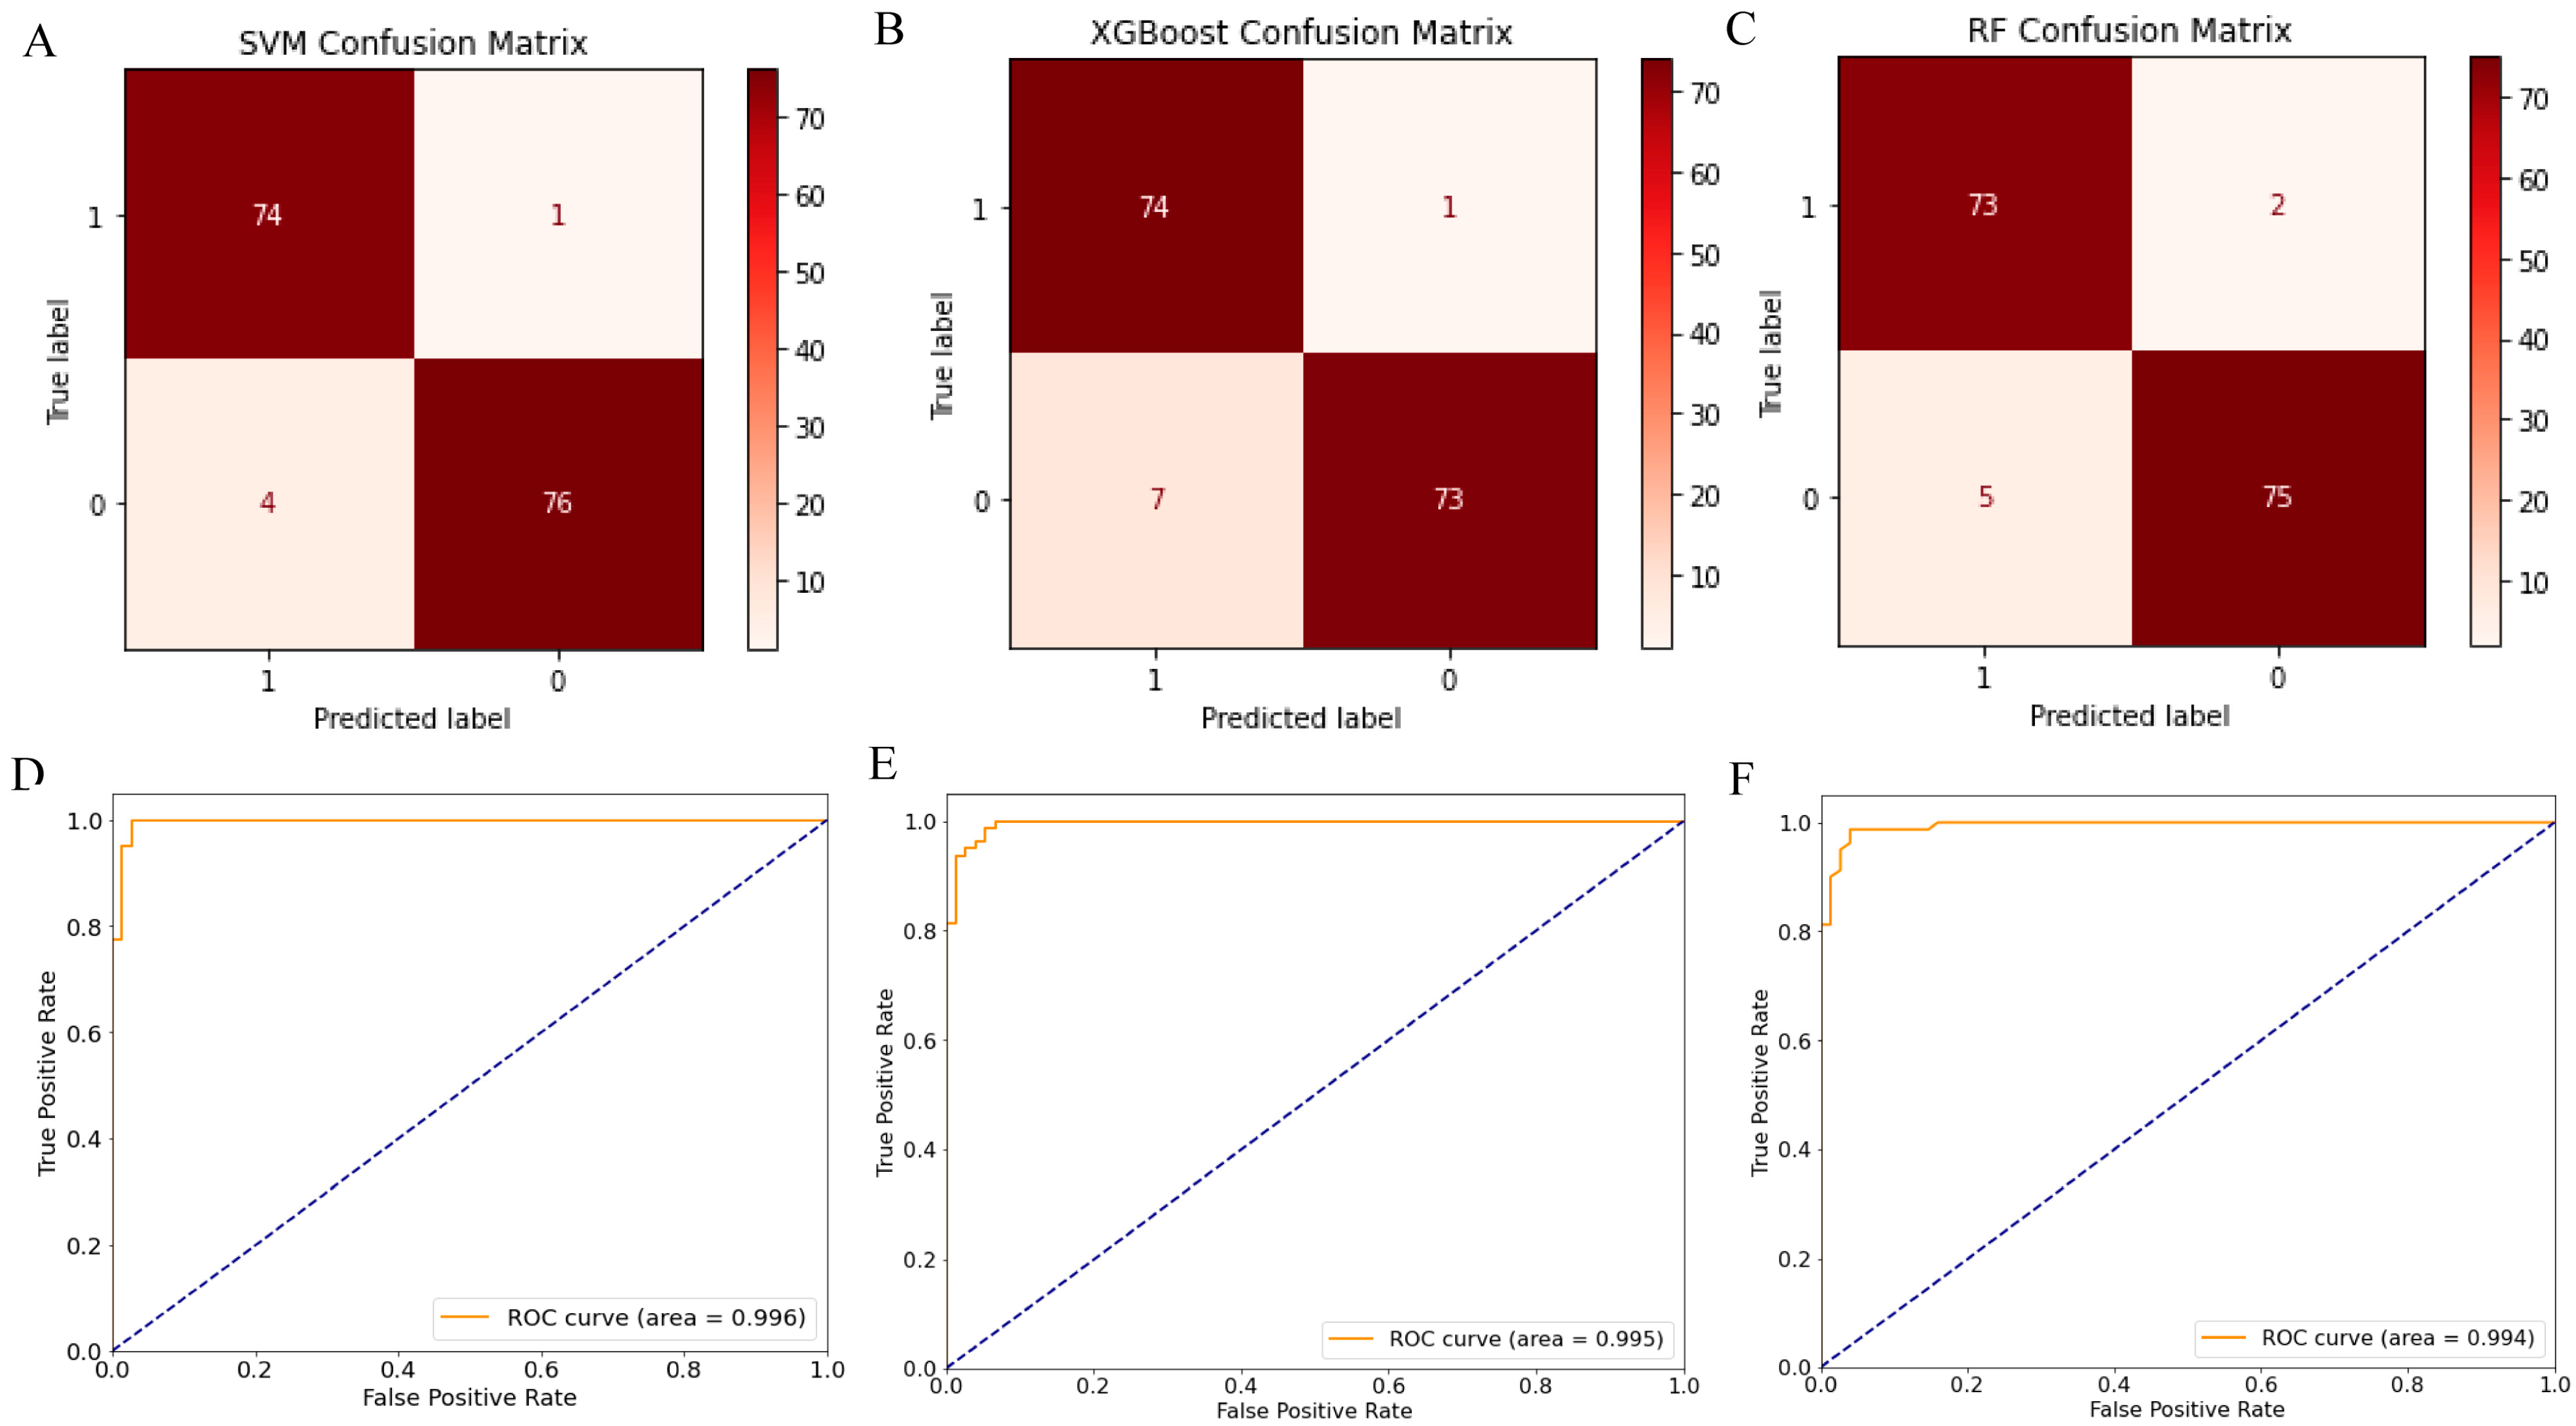
2.3. Screening 12 DEGs as Diagnostic Markers for Detecting Early-Stage OC Patients

The confusion matrices of each machine learning model were shown in Figure 3A–C. Alongside the area under curve (AUC) values with a 95% confidence interval (CI) of SVM-SHAP, XGBoost, and RF, these were used to predict whether the tumors of stage I OC patients were 0.996 (95% CI: 0.992–1.000), 0.995 (95% CI: 0.990–1.000) and 0.994 (95% CI: 0.985–1.000), respectively (Figure 3D–F). The clinical utility index (CUI) of the SVM model was 0.936–0.938, the XGBoost model was 0.900–0.901, and the RF model was 0.911–0.913, respectively. The CUI values of these models were greater than 0.81, indicating that these models may have excellent utility in clinical practice for the diagnosis of stage I ovarian cancer. Furthermore, the top 30 important feature genes were screened, among which AGR2, TESC, TFF3, TGFA, DLK1, DKK4, SCGB2A2, IFIT1, POSTN, SFRP2, ZIC1, and SERPINE1 were the overlapping important genes in three algorithms (Figure 4A), including seven downregulated genes (AGR2, TESC, TFF3, TGFA, DLK1, DKK4, and SCGB2A2) and five upregulated genes (IFIT1, POSTN, SFRP2, ZIC1, and SERPINE1) (Figure 4B). This study evaluated the diagnostic value of 12 feature genes as biomarkers for determining whether the tumor of ovarian cancer patients will metastasize outside the ovary, as shown in Figure 5. Genes such as AGR2, TFF3, TESC, IFIT1, TGFA, DLK1, POSTN, SERPINE1, SCGB2A2, and SFRP2 with AUC values between 0.7 and 0.9 can independently predict whether a tumor is localized in the ovaries or in the fallopian tubes (Figure 5).

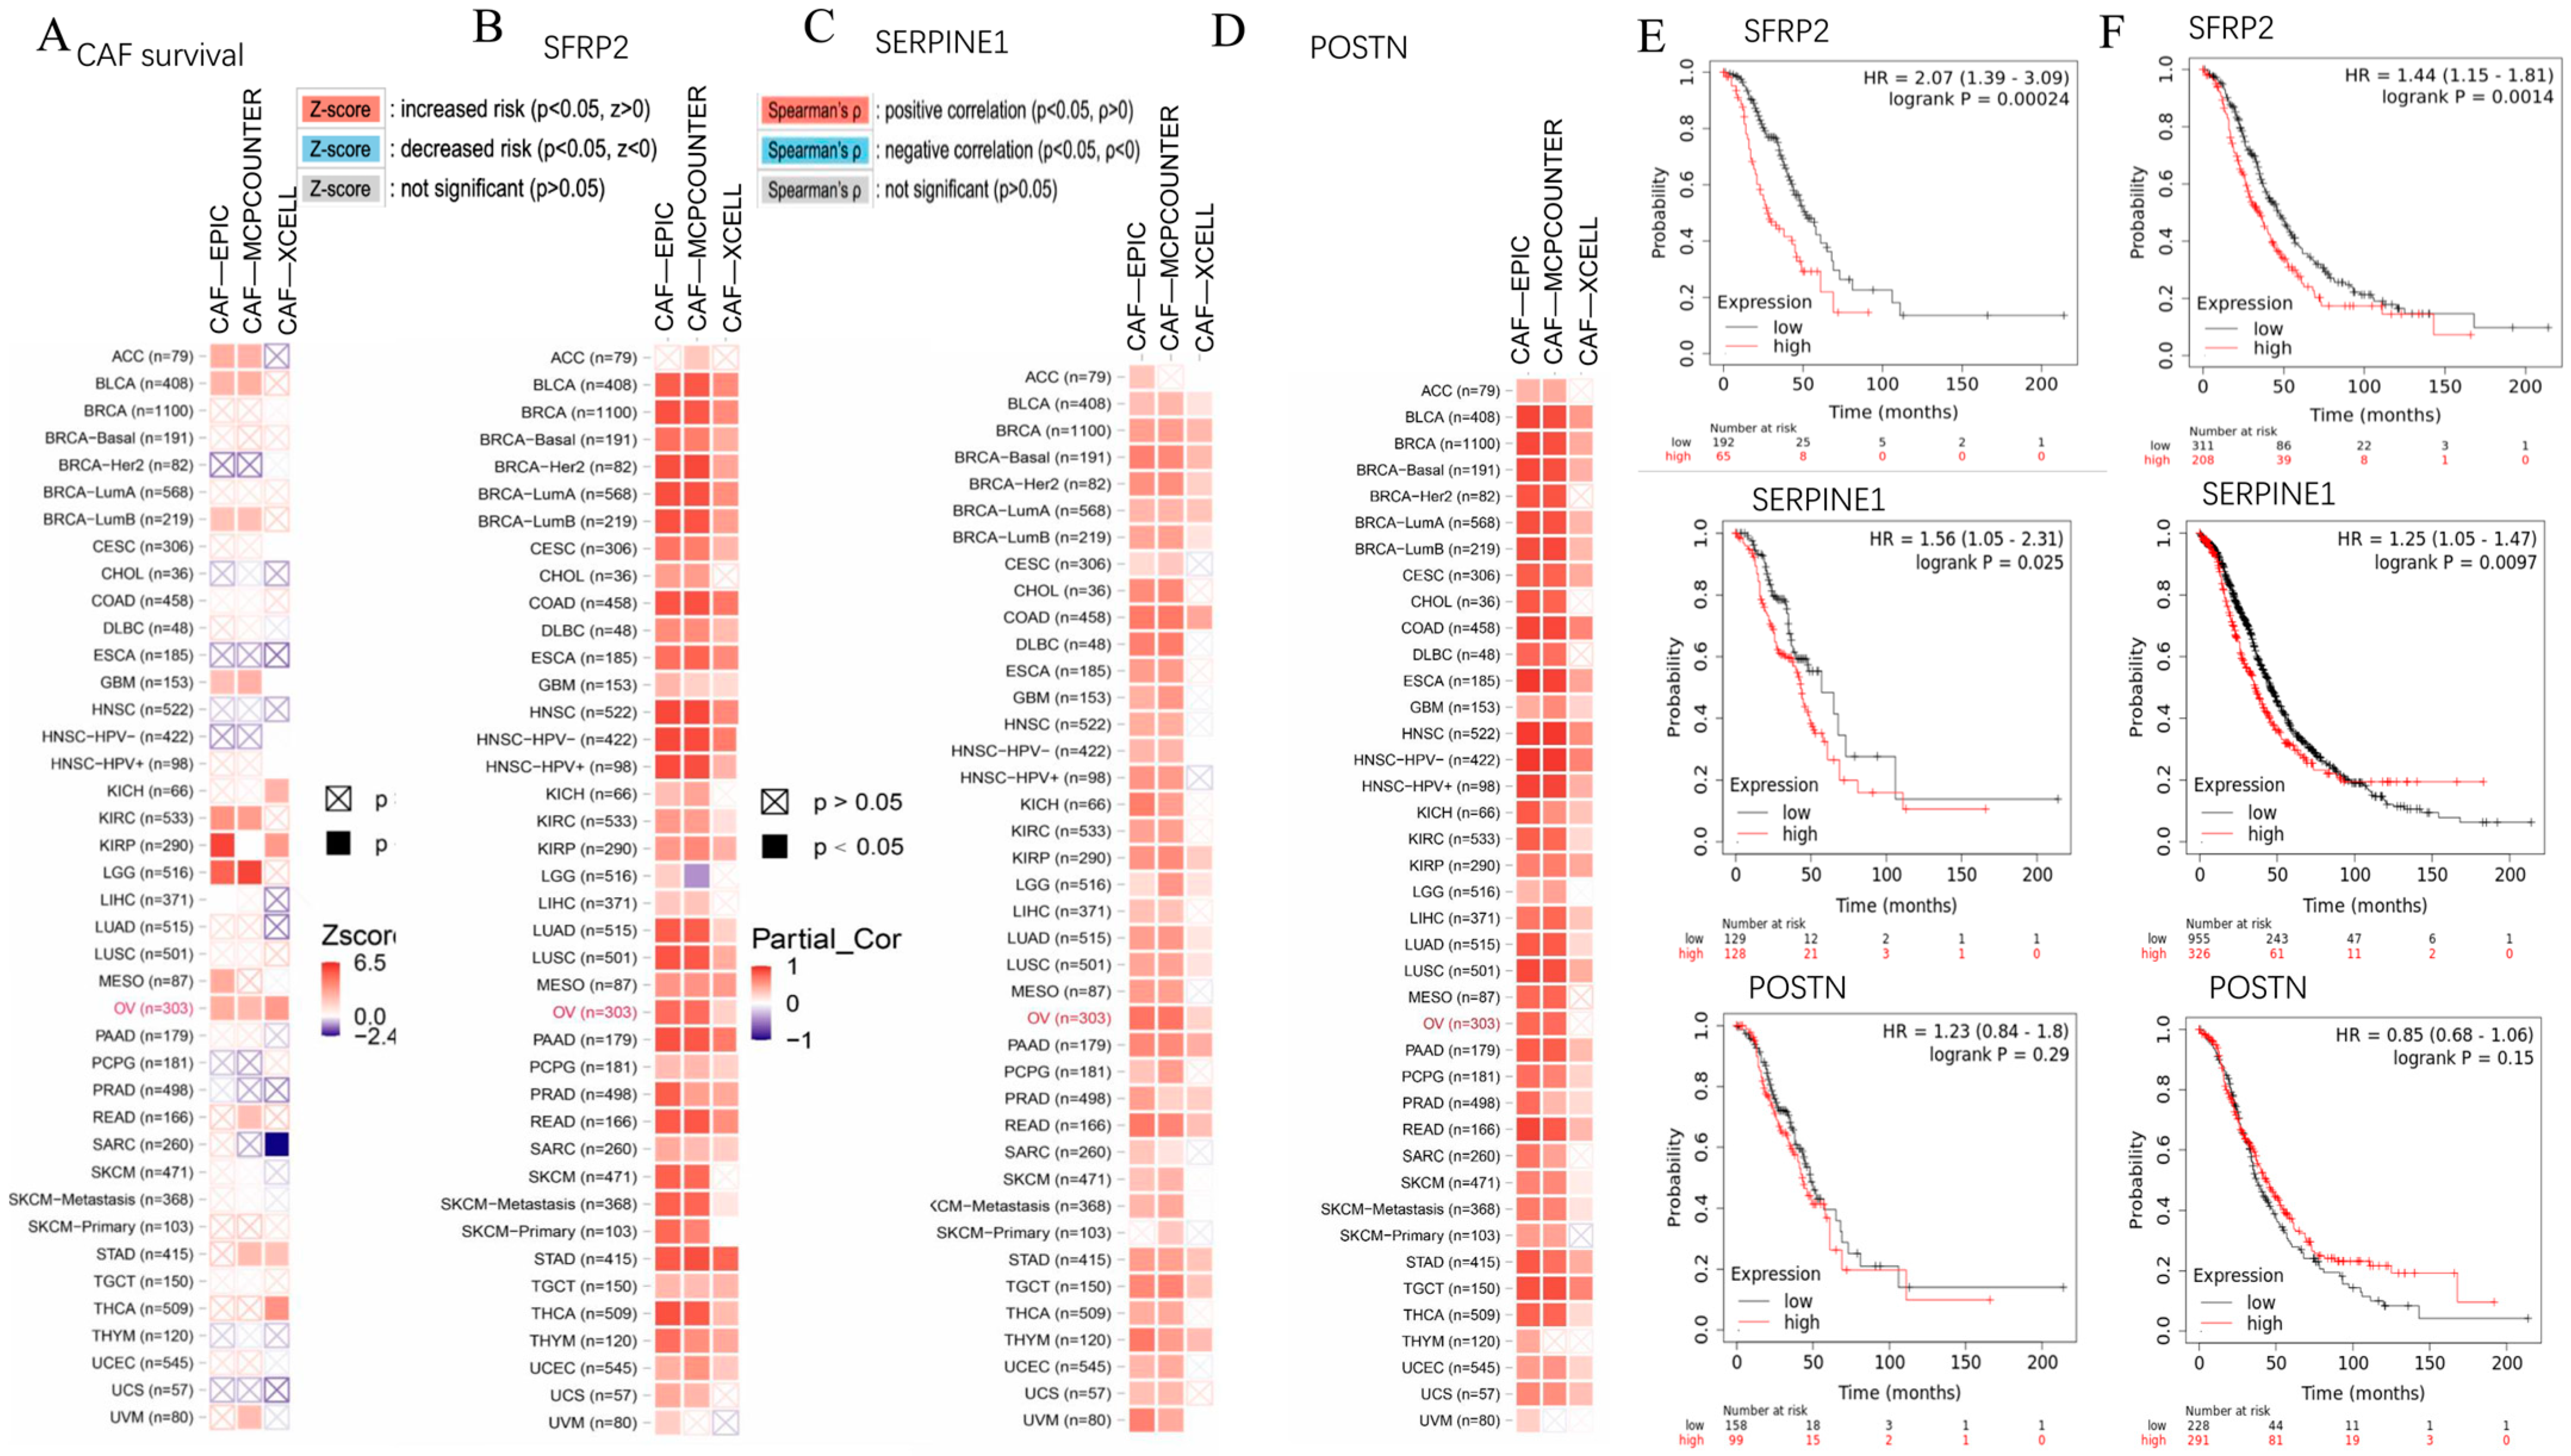
2.4. SFRP2 and SERPINE1 Were Intricately Linked to Cancer-Associated Fibroblasts and Associated with the Overall Survival of Patients in Moderate to Advanced-Stage OC

Through pan-cancer analysis, we discovered that the levels of CAF infiltrates’ abundances were risk factors that affected the overall survival rates of OC patients, as indicated by the three aforementioned deconvolution methods: EPIC, MCPcounter, and xCell (Figure 6A). Among the 12 featured genes (AGR2, TESC, TFF3, TGFA, DLK1, DKK4, SCGB2A2, IFIT1, POSTN, SFRP2, ZIC1, and SERPINE1), SFRP2 and SERPINE1 showed a positive association with the enrichment level of CAFs, as generated via three immune deconvolution methods (Figure 6B,C). POSTN showed a positive association with CAFs, as generated via two immune deconvolution methods (Figure 6D). The results of the Kaplan–Meier plots indicate that the higher expression levels of both SFRP2 and SERPINE1 are associated with lower survival rates in the GSE9891 individual dataset (stage: II + III + IV) and the entire OC datasets (stage: II + III + IV), respectively (Figure 6E,F). Additionally, the log-rank test comparing higher and lower levels of the SFRP2 groups demonstrated that the p-values were less than 0.01, indicating statistical significance. However, the expression levels of POSTN in OC patients did not show a significant correlation with survival rates.

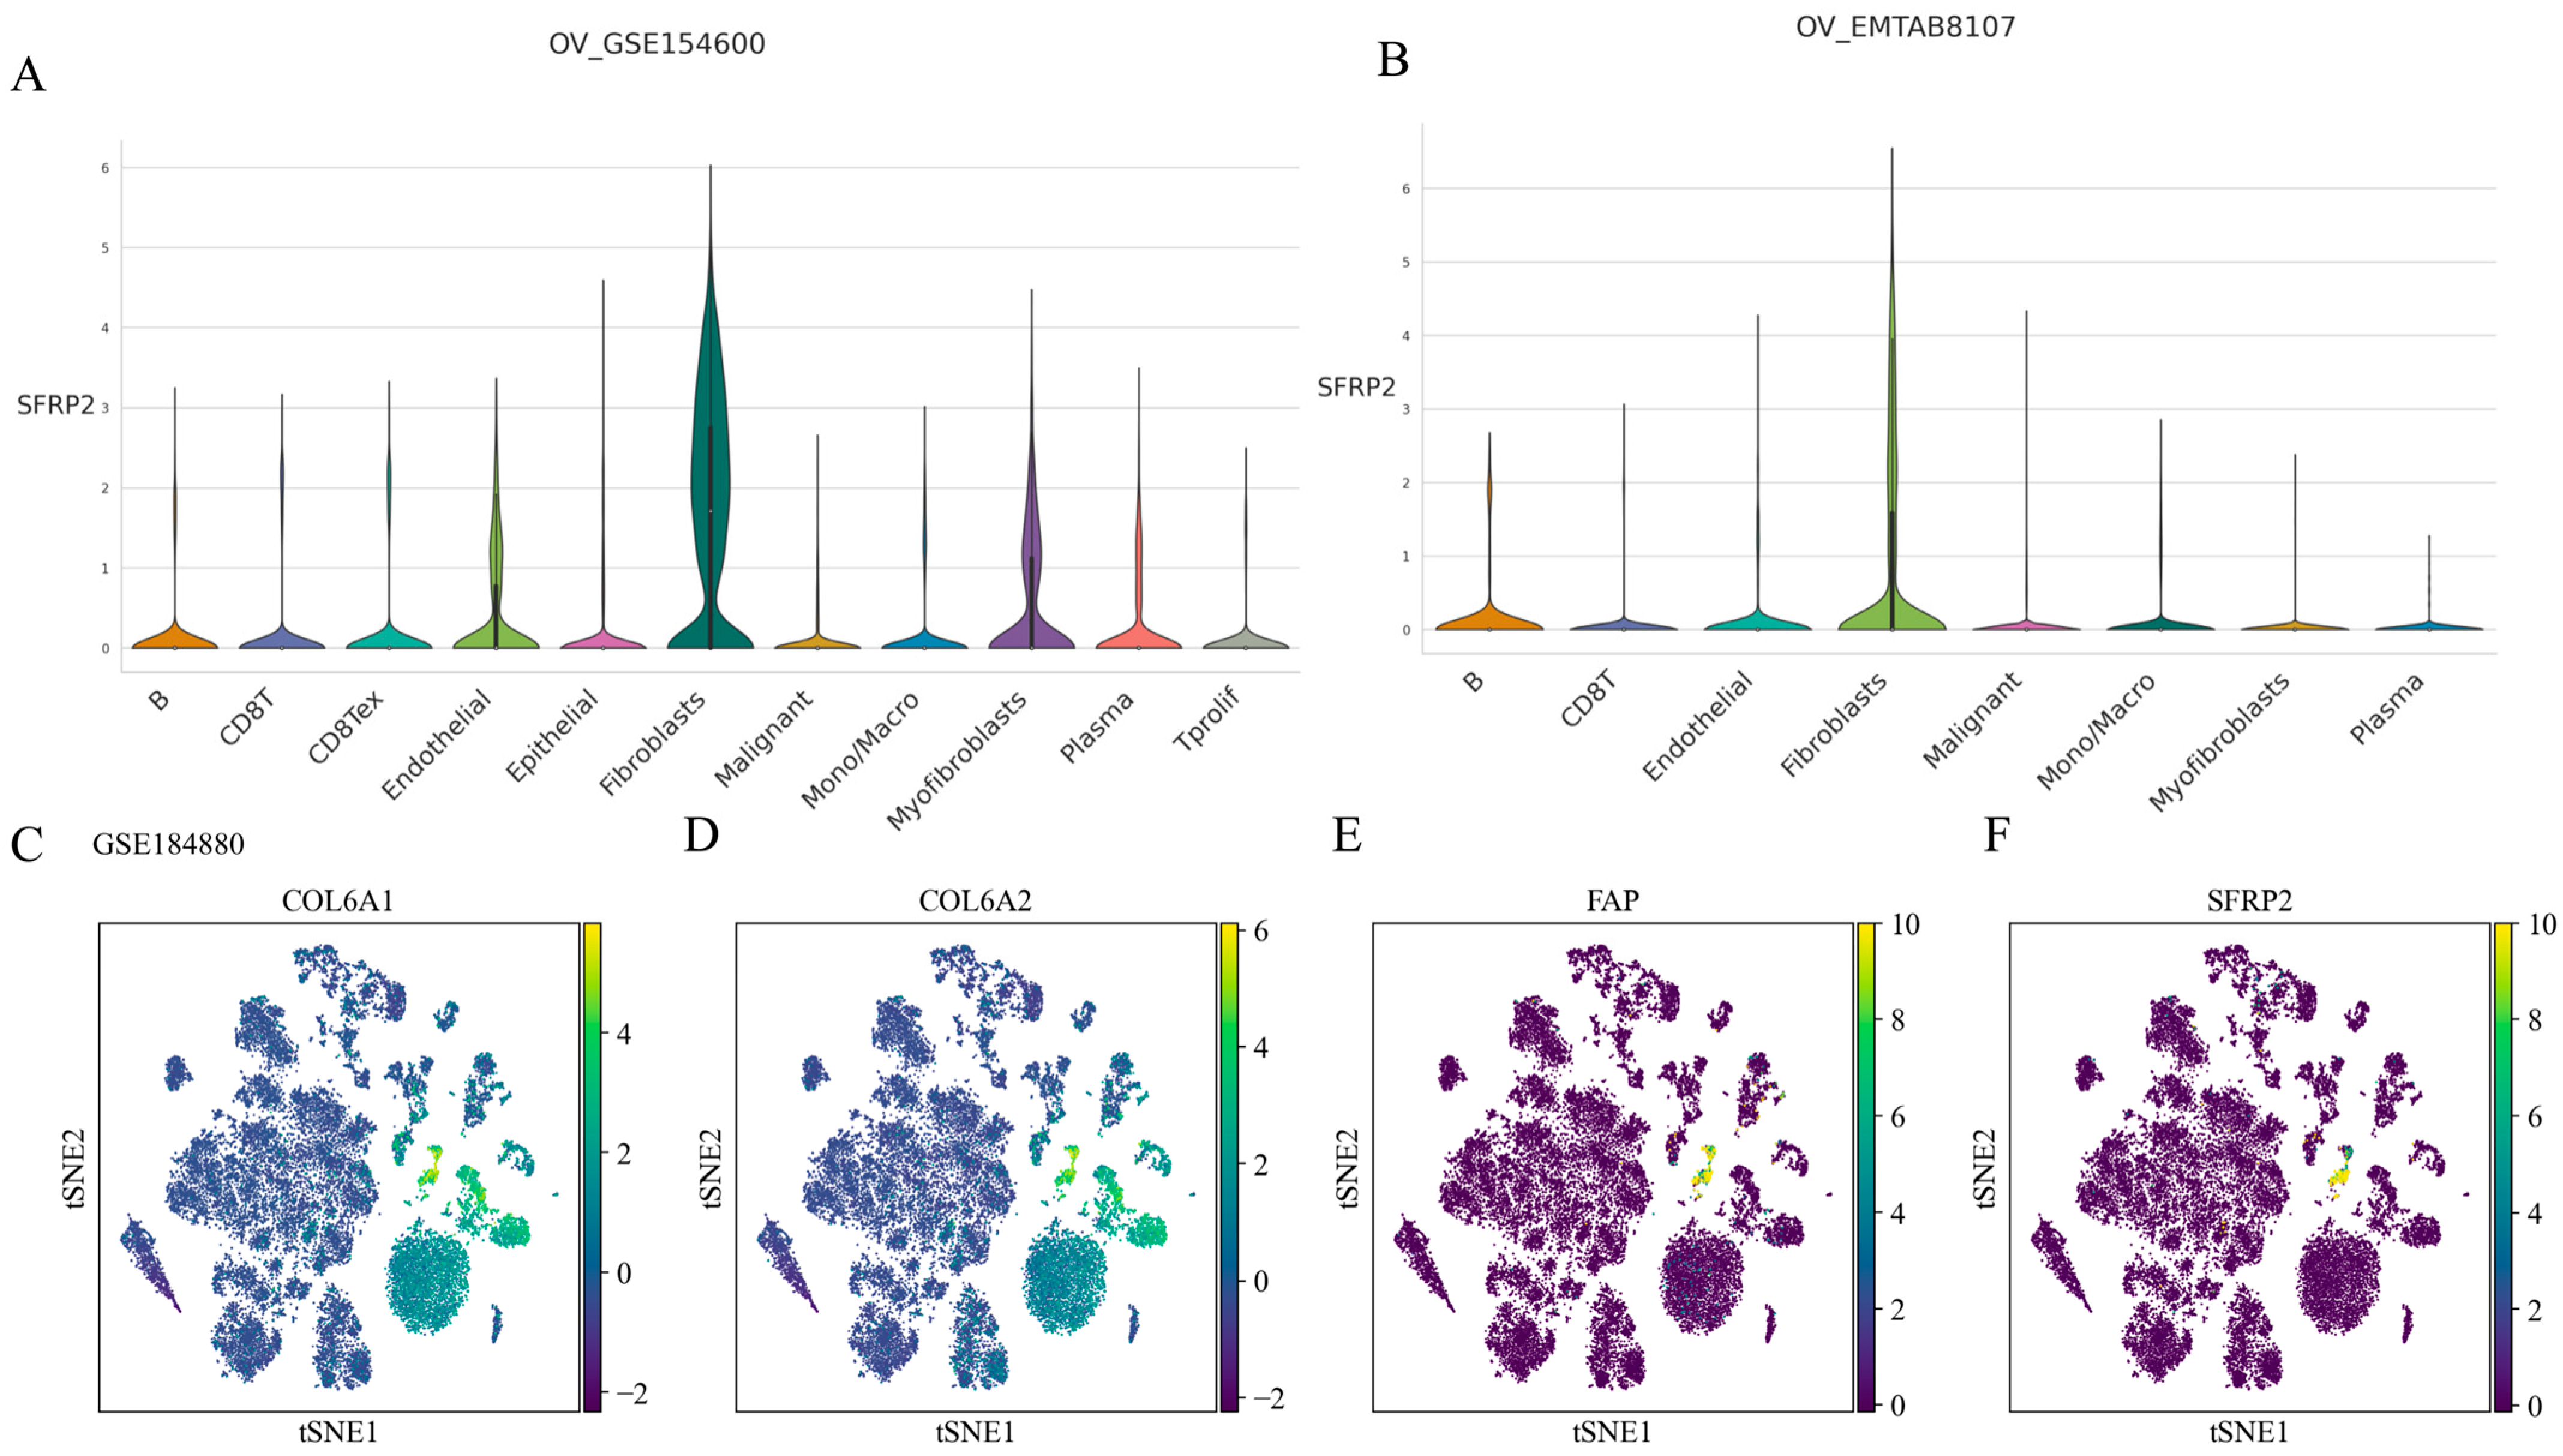
2.5. SFRP2 Might Define a Distinct CAF Subpopulation

SFRP2 was highly expressed in the fibroblast/myofibroblast subset in two independent datasets: GSE154600 (Figure 7A) and EMTAB8107 (Figure 7B), respectively. Furthermore, the violin plot demonstrates the distinct expression levels of SFRP2 in fibroblasts, suggesting the presence of a distinct subgroup. Consistently, single-cell RNA-seq analysis of nonmalignant tumor tissues and HGOSC tissues was utilized to investigate the distribution of SFRP2 in TME and a novel subset with the highest enrichment of SFRP2 and CAF markers (COL6A1, COL6A2, FAP) was identified (Figure 7C–F). These findings suggested the existence of a distinct CAF subgroup, which we named “SFRP2+ fibroblast”.

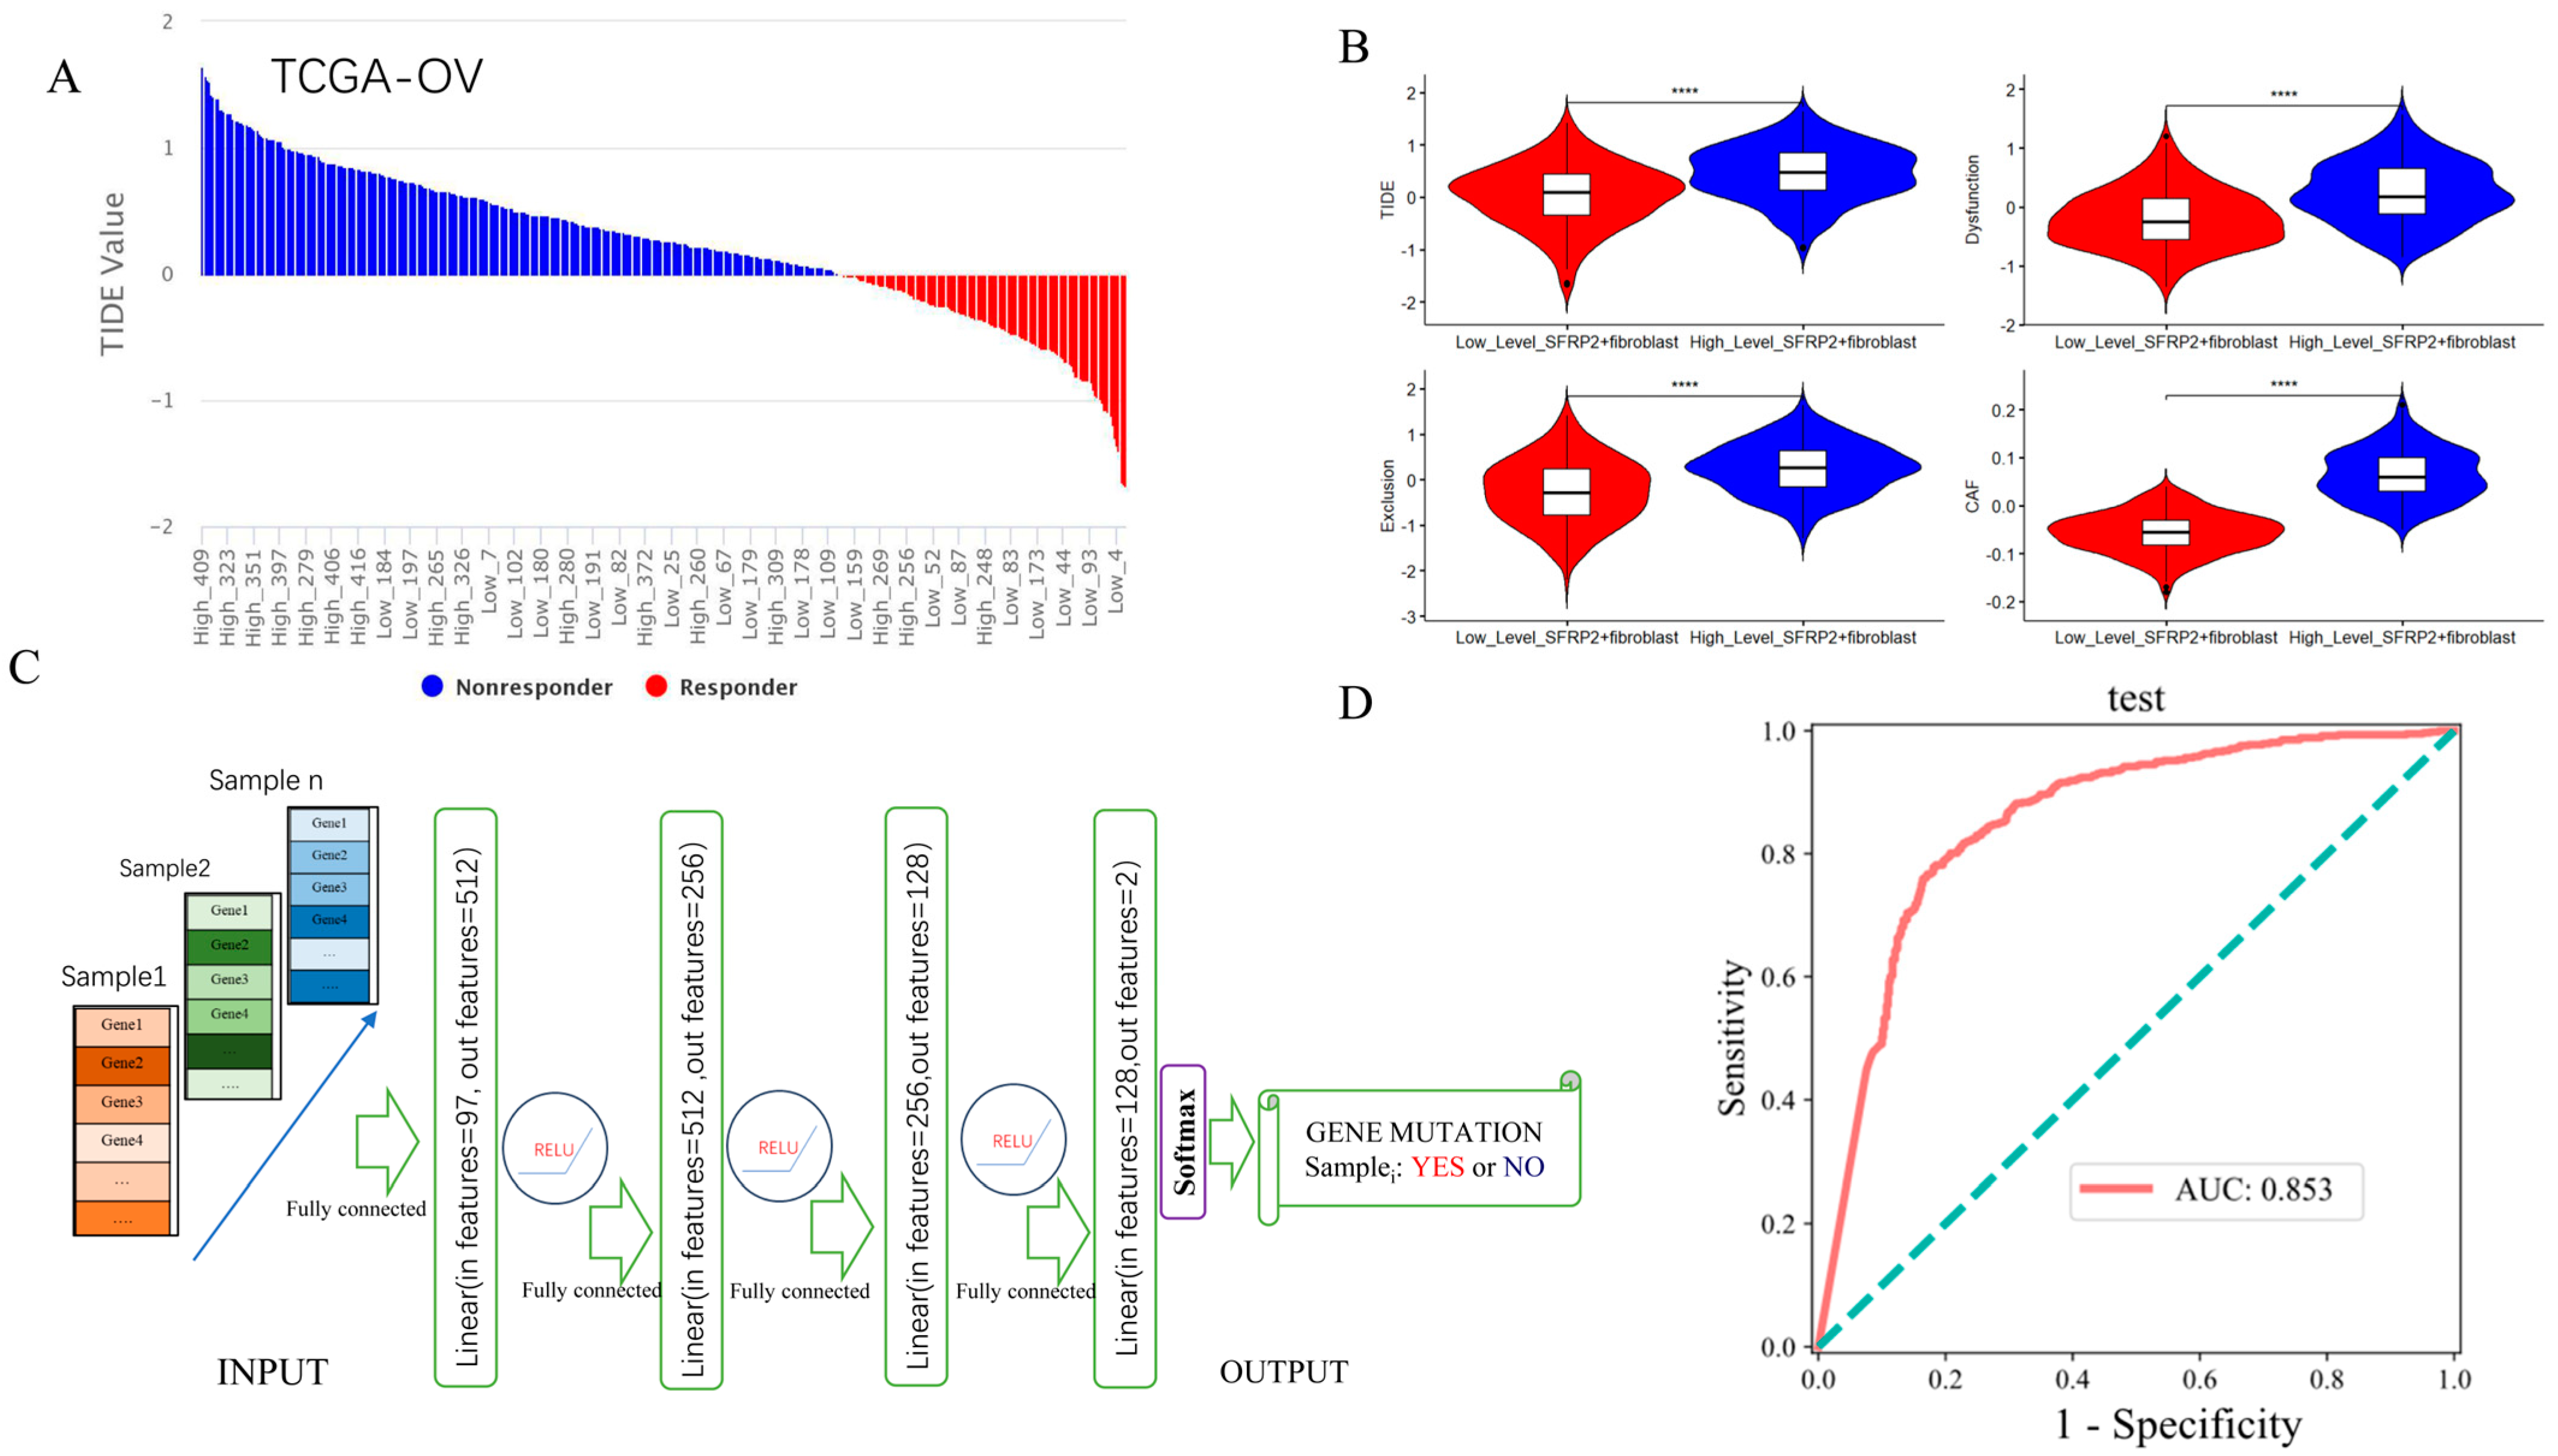
2.6. Contribution of SFRP2+ Fibroblast Signature in Predicting ICI Response and Detecting Pan-Cancer TP53 Mutation

As shown in Figure 8A, OC patients from The Cancer Genome Atlas (TCGA-OV) with higher enrichment levels of SFRP2+ fibroblast mainly appeared in immune checkpoint inhibitor (ICI) non-responders, whereas the lower enrichment level of SFRP2+ fibroblast mainly appeared in ICI responders (Figure 8A). Significant differences in Tumor Immune Dysfunction and Exclusion (TIDE) scores, Dysfunction scores, Exclusion scores, and CAF scores between the two distinct groups were also observed (Figure 8B). The gene set composed of the top 100 specific genes of SFRP2+ fibroblast was explored in the Tumor Immune Single Cell Hub 2 (TISCH2), a single-cell data source, and was consistently found to be highly enriched in the fibroblast subset across various tumor types, suggesting their utility in pan-cancer analyses. An artificial neural network model based on the SFRP2+ fibroblast signature was established, and the main architecture of this model was presented in Figure 8C. This model demonstrated excellent performance in the test dataset, with an AUC value exceeding 0.85 (95% CI: 0.829–0.877) to distinguish between patients who bear the TP53 mutation and those who do not (Figure 8D).

3. Discussion

Due to its inherent drug resistance and a high propensity for recurrence, the clinical outcomes of patients receiving therapies have fallen short of our expectations [12]. The 5-year survival rate remains stagnant at about 40%~50% [57,58]. The early diagnosis of OC can effectively improve survival rates, but only about 15% of OC patients are diagnosed in the early or local stages [59]. Thus, the construction of robust machine learning models for early diagnosis is a promising strategy for improving OC patients’ survival. To obtain input data suitable for machine learning, we primarily identified common DEGs that were upregulated and downregulated in OC patients in stages II–IV compared to those in the early stage in two independent GEO datasets. Through GO and KEGG pathway analysis, we found that common DEGs are related to tumor-associated signaling pathways and can regulate tumor progression [60]. In line with this, using these common DEGs as input, RF, SVM-SHAP, and XGBoost can distinguish stage I OC patients from patients in later stages. Compared with the general constructure of previous machine learning models, we used the Borderline Synthetic Minority Oversampling (BorderlineSMOTE) algorithm to uniformly optimize the data [61]. The importance of these three models using balanced data in predicting tumor stage was suggested by their high AUC values. Our results show that the machine learning models established with optimized balanced data performed better than those using unbalanced data.
The important feature genes employed in training outperformed models might also serve as diagnostic biomarkers themselves. The top 30 important features of each model were selected and intersected to obtain overlapping genes. One of them, SFRP2, is a member of the secreted frizzled-related protein (SFRP) family and a typical regulatory protein of the WNT pathway [62]; it has been reported as a co-factor for ten-eleven translocation 1 (TET1), contributing to the inhibition of tumor metastasis [63]. The stemness index (mRNAsi) has been quantified based on mRNA expression levels and SFRP2 was one of genes associated with OC prognosis [57]. Furthermore, our studies revealed that SFRP2 is a potential biomarker for the diagnosis of early-stage ovarian cancer with considerable AUC value and is associated with poor survival rates of OC patients in stages II-IV. Several studies reported that SFRP2 serves as a biomarker for breast cancer, in addition to various other cancers [64,65,66,67]. Our study underwent cross-validation with other studies highlighting the role of SFRP2 in cancers and may lead to more significant findings. Thus, SFRP2 may be an important gene with promising research prospects in pan-cancer.
The precise mechanism for obtaining the phenotype of CAF in cancers remains unclear. One of the principle underlying mechanisms may be the upregulation of SOX2, which could be inhibited by protein kinase Cζ (PKCζ) [68]. PKCζ deficiency can enable the upregulation of the WNT regulatory factor SFRP2, as SOX2 directly binds to the SFRP2 promoter. The inactivation of SFRP2 in CAFs impairs the induction of cancer cell migration and invasion and weakens the tumorigenicity of cancer cells in vivo [68]. This study highlights the potential role of SFRP2 in tumor pathogenesis. However, there are no reports detailing the cell subgroup localization of SFRP2 in the TME of OC. To address this issue, we performed single-cell analysis and found that SFRP2 is predominantly expressed in a unique subset of CAF in single-cell RNA-seq data from OC patients with nonmalignant tumor tissues and HGOSC tissues. Its functions are in need of further investigation.
Rapid progress is being made in the provision of valuable solutions, including diagnostic models based on extracellular matrix risk scores, autophagy-related signatures, and immune subtypes in the TME [69,70,71]. These models, which use transcriptome information, have clear feasibility with regard to screening an immunotherapy-advantage subgroup. As part of our research, the TIDE algorithm was employed to investigate the differences in immunotherapy response between OC patients with a higher and lower ssGSEA score for SFRP2+ fibroblast. We demonstrated that a significant majority of patients with high enrichment score of SFRP2+ fibroblast exhibited elevated TIDE scores, indicating that a high enrichment level of SFRP2+ fibroblast is correlated with a poor response to immunotherapy. The effectiveness of ICIs in ovarian cancer is limited; however, these findings based on the SFRP2+ fibroblast signature provide new insights for the assessment of immunotherapy and offer guidance on whether OC patients are likely to benefit from such treatments. As an interesting research direction in precision oncology, the detection of oncogene status in pan-cancer samples holds promise for advancing the clinical application of targeted therapy [72,73,74]. For some cases, knowing information about the oncogene status may have a significant impact on treatment options, facilitate appropriate clinical decision making, and guide the identification of suitable candidates for clinical trials. In this study, a deep artificial neural network-based predictive model was constructed by incorporating the SFRP2+ fibroblast signature to detect TP53 mutation. Using expression data from less than 100 specific genes of SFRP2+ fibroblast as input, the model can effectively identify whether a patient harbors a TP53 mutation, indicating the significance of tumor-associated fibroblast signature for deep learning and precision oncology. The pan-cancer analysis used in our model only included patients with TP53 mutation levels higher than 0.3, and whether setting an even higher TP53 mutation rate would be better to detect TP53 mutations has yet to be determined. However, this artificial neural network model could not directly provide information regarding the correlation between levels of SFRP2 expression and TP53 mutations. Further exploration of their correlation, such as correlation coefficients, may also facilitate the development of novel biomarkers.
In conclusion, our study provided computer-aided diagnostic models with good performance for OC patient management. We believe that integrating the traditional and artificial intelligence-based predictive models constructed in our study can further benefit cancer patients.
This study had some limitations. It is important to note that expression of SFRP2 and the presence of SFRP2+ fibroblast in OC tumor tissues are still in need of further experimental validation. Evaluating artificial-intelligence-based predictive models in independent cohorts is necessary for their clinical applications in the future.

4. Materials and Methods

4.1. Data Collection and Processing

The GEO database on the National Center for Biotechnology Information’s (NCBI’s) website was accessed using the keyword “Ovarian Cancer” to retrieve microarray datasets, including GSE9891 and GSE26193. The information page of each dataset was then accessed, and the corresponding expression matrix and GPL platform were downloaded. Clinical sample information with varying disease conditions was contained in each dataset, while the GPL platform contained gene probes that corresponded to the expression matrix. Using the “GEOquery” R package, the expression matrix of each microarray dataset was preliminarily processed. The total number of samples and staging of each dataset were then organized and listed. GSE9891 and GSE26193 were selected for in-depth research after being screened for their large total number of samples and relatively uniform sample staging.

4.2. Screening and Analysis of Overlapping DEGs

This study utilized the “LIMMA” R package to analyze the datasets of GSE9891 and GSE26193, in order to identify DEGs in stage II-IV diseases vs. stage I diseases, and generated a volcano plot to visualize the differences. Upregulated differentially expressed genes with statistical significance were those with p < 0.05 and fold change (FC) ≥ 2. Downregulated differentially expressed genes with statistical significance were those with p < 0.05 and FC ≤ 0.5. The intersection of upregulated and downregulated genes in GSE9891 and GSE26193 was observed to obtain the common differentially expressed genes. The expression data of these common genes in GSE9891 were collected, and each sample was matched with its pathological stage. The final output was a gene expression matrix with a gene symbol.

4.3. Functional Analysis of Overlapping DEGs

After screening the DEGs, the “clusterProfiler” R package was utilized to conduct GO and KEGG pathway enrichment analysis on the differentially expressed genes. The purpose of this was to clarify the functions of the selected differentially expressed genes and the main biological processes they participate in. The data type of DEGs was converted from “SYMBOL” to “ENTREZID”, ignoring cases in which the gene names and IDs did not match, and the remaining genes were used for GO and KEGG pathway enrichment analysis. A threshold of p < 0.05 was considered statistically significant. This study also used the STRING website to analyze core protein–protein interactions (PPIs) among the overlapping DEGs. The Cytoscape plugin (cytohHubba) was used to visualize the PPI network obtained from the STRING website.

4.4. Explainable Machine Learning

Three explainable machine learning models including SVM-SHAP, XGBoost, and RF were employed in this study. These machine learning models, which used expression levels of common DEGs as input, were established to stage tumors and to identify important features as biomarkers. To address the data imbalance, the BorderlineSMOTE algorithm was used to oversample the data and then machine learning was performed. The Random Forest algorithm was run using the “RandomForest Classifier” function in the sklearn library in Python, and the 30 most important features were selected using the feature_importances_function. The SVM algorithm was also run using the “svm” function in the sklearn library, and the top 30 important feature genes were selected using the SHAP package. The XGBoost model was operated using the “XGB Classifier” package and the 30 most important features were selected using the feature_importances_ function. The performance of the machine learning models was comprehensively evaluated based on the confusion matrices, accuracy (ACC), recall (REC), F1 score, and the area under the curve (AUC) of the highest ROC curve. Overlapping important features were further analyzed and studied using the above three machine learning models. To further determine whether the selected genes could serve as biomarkers for the staging of ovarian cancer tumors, ROC curves of overlapping genes were evaluated using the GSE9891 dataset and their importance was assessed based on an AUC with 95% CI. The CUIs (+CUI, −CUI) of the three explainable machine learning models were also calculated [75].

4.5. Pan-Cancer Bioinformatics Analysis Using the TIMER2 Website

The pan-cancer analysis of gene expression and its correlation with CAF infiltrates’ abundances, as well as the correlation with clinical outcome, was conducted using the interactive webtool TIMER2 (http://timer.cistrome.org/, accessed on 27 November 2022). EPIC, MCPcounter, and xCell algorithms provided by TIMER2 were utilized to calculate the CAF infiltrates’ abundances. Original data were downloaded from TIMER2 and further visualized using R packages.

4.6. Survival Analysis

The Kaplan–Meier plotter website was utilized to plot the survival curves of the overlapping genes in both the individual dataset GSE9891 (stage: II + III + IV) and the entire ovarian cancer datasets (stage: II + III + IV). Hazard ratios (HRs) with corresponding 95% confidence intervals and log-rank p-values were calculated. A log-rank p-value less than 0.05 was considered statistically significant, indicating a difference in survival between patients classified into high and low expression groups based on overlapping genes.

4.7. Single-Cell RNA Sequencing Analysis

Data processing and visualization were performed using the Scanpy toolkit in Python for the GSE184880 dataset. The general steps involved selecting cells and genes, retaining cells with a minimum of 400 genes, keeping genes that appeared in at least 5 cells, filtering out cells with a high level of mitochondrial genes, and performing data standardization. Cell subpopulation clustering was conducted, and the top 100 genes in each subpopulation were identified.
The expression level of SFRP2 in different cell subpopulations in OC was also explored via individual gene exploration functions provided by an scRNA-seq database named Tumor Immune Single-cell Hub 2 (TISCH2).

4.8. Single-Sample Gene Set Enrichment Analysis (ssGSEA)

The enrichment levels of a given gene set in a single sample were assessed primarily using a specialized GSEA method, ssGSEA, provided by the “GSVA” R package. It provides scores for cell subpopulations, functional pathways, and other gene sets within a single tumor sample [76].

4.9. Tumor Immune Dysfunction and Exclusion (TIDE) Analysis

TIDE (http://tide.dfci.harvard.edu/login/, accessed on 10 February 2023) was employed in TCGA-OV patients to predict ICI responses, including the assessment of TIDE, Dysfunction, Exclusion, and CAF scores. Patients with TIDE information were then split into a group with higher-level SFRP2+ fibroblast and a group with lower-level SFRP2+ fibroblast based on the median ssGSEA scores of a gene set composed of the top 100 specific genes in SFRP2+ fibroblast. The results were further visualized using the “ggpubr” R package.

4.10. Identification of Pan-Cancer TP53 Mutation by Artificial Neural Network

Pan-cancer mutation burden data, pan-cancer mutation information data, pan-cancer RNA-seq expression matrix data, and pan-cancer clinical information were downloaded from http://github.com/greenelab/pancancer (accessed on 16 March 2023). The data cleaning and screening processes were carried out according to the methods described in a previous study [73]. A total of 18 of 33 cancer types with a higher fraction of the TP53 mutation were employed in this study. The neural network prediction model uses the 97 intersection genes of the top 100 specific genes in SFRP2+ fibroblast and TCGA expression profile data as the input layer. The neural network contained three hidden layers and one output layer. The first hidden layer contains 512 neurons, the second hidden layer contained 256 neurons, and the third hidden layer contained 128 neurons, using the ReLU activation function. The ReLU activation function was used in each of the hidden layers. The output layer, which contains 2 neurons, used the Softmax activation function to predict whether there is a TP53 mutation in tumor patients. The neural network model using a train-to-test dataset ratio of 4:1, Cross-Entropy as a loss function, and RMSprop as an optimizer was trained for 50 epochs.

Author Contributions

Conceptualization, J.H., Z.Y. and D.Z.; methodology, Z.Y. and D.Z.; software, Z.Y. and D.Z.; validation, Z.Y. and D.Z.; formal analysis, Z.Y. and D.Z.; investigation, Z.Y. and D.Z.; resources, Z.Y. and D.Z.; data curation, Z.Y. and D.Z.; writing—original draft preparation, Z.Y. and D.Z.; writing—review and editing, J.H.; visualization, Z.Y. and D.Z.; supervision, J.H.; project administration, J.H.; funding acquisition, J.H. All authors have read and agreed to the published version of the manuscript.

Funding

This research and APC was funded by Zhengzhou University First-Class Course Project, grant number [2021ZZUKCLX057].

Institutional Review Board Statement

Not applicable.

Informed Consent Statement

Not applicable.

Data Availability Statement

R and python codes are available from the corresponding author. All original data are available in GEO and TCGA database.

Conflicts of Interest

The authors declare no conflict of interest.

References

  1. Fu, H.; Fu, Z.; Mao, M.; Si, L.; Bai, J.; Wang, Q.; Guo, R. Prevalence and prognostic role of PD-L1 in patients with gynecological cancers: A systematic review and meta-analysis. Crit. Rev. Oncol. Hematol. 2023, 189, 104084. [Google Scholar] [CrossRef] [PubMed]
  2. Esfandyari, S.; Elkafas, H.; Chugh, R.M.; Park, H.S.; Navarro, A.; Al-Hendy, A. Exosomes as Biomarkers for Female Reproductive Diseases Diagnosis and Therapy. Int. J. Mol. Sci. 2021, 22, 2165. [Google Scholar] [CrossRef] [PubMed]
  3. Lheureux, S.; Braunstein, M.; Oza, A.M. Epithelial ovarian cancer: Evolution of management in the era of precision medicine. CA Cancer J. Clin. 2019, 69, 280–304. [Google Scholar] [CrossRef] [PubMed]
  4. Huang, X.; Li, X.Y.; Shan, W.L.; Chen, Y.; Zhu, Q.; Xia, B.R. Targeted therapy and immunotherapy: Diamonds in the rough in the treatment of epithelial ovarian cancer. Front. Pharmacol. 2023, 14, 1131342. [Google Scholar] [CrossRef] [PubMed]
  5. Stewart, C.; Ralyea, C.; Lockwood, S. Ovarian Cancer: An Integrated Review. Semin. Oncol. Nurs. 2019, 35, 151–156. [Google Scholar] [CrossRef] [PubMed]
  6. Kwolek, D.G.; Gerstberger, S.; Tait, S.; Qiu, J.M. Ovarian, Uterine, and Vulvovaginal Cancers: Screening, Treatment Overview, and Prognosis. Med. Clin. N. Am. 2023, 107, 329–355. [Google Scholar] [CrossRef] [PubMed]
  7. Romero, I.; Bast, R.C., Jr. Minireview: Human ovarian cancer: Biology, current management, and paths to personalizing therapy. Endocrinology 2012, 153, 1593–1602. [Google Scholar] [CrossRef]
  8. Prat, J.; Oncology, F.C.O.G. Staging classification for cancer of the ovary, fallopian tube, and peritoneum. Int. J. Gynaecol. Obstet. 2014, 124, 1–5. [Google Scholar] [CrossRef]
  9. O’Shea, A.S. Clinical Staging of Ovarian Cancer. Methods Mol. Biol. 2022, 2424, 3–10. [Google Scholar] [CrossRef]
  10. Baldwin, L.A.; Huang, B.; Miller, R.W.; Tucker, T.; Goodrich, S.T.; Podzielinski, I.; DeSimone, C.P.; Ueland, F.R.; van Nagell, J.R.; Seamon, L.G. Ten-year relative survival for epithelial ovarian cancer. Obstet. Gynecol. 2012, 120, 612–618. [Google Scholar] [CrossRef]
  11. Arora, T.; Mullangi, S.; Lekkala, M.R. Ovarian Cancer. In StatPearls; StatPearls Publishing Copyright© 2023; StatPearls Publishing LLC.: Treasure Island, FL, USA, 2023. [Google Scholar]
  12. Akter, S.; Rahman, M.A.; Hasan, M.N.; Akhter, H.; Noor, P.; Islam, R.; Shin, Y.; Rahman, M.D.H.; Gazi, M.S.; Huda, M.N.; et al. Recent Advances in Ovarian Cancer: Therapeutic Strategies, Potential Biomarkers, and Technological Improvements. Cells 2022, 11, 650. [Google Scholar] [CrossRef] [PubMed]
  13. Kuroki, L.; Guntupalli, S.R. Treatment of epithelial ovarian cancer. BMJ 2020, 371, m3773. [Google Scholar] [CrossRef]
  14. Bristow, R.E.; Tomacruz, R.S.; Armstrong, D.K.; Trimble, E.L.; Montz, F.J. Survival Effect of Maximal Cytoreductive Surgery for Advanced Ovarian Carcinoma During the Platinum Era: A Meta-Analysis. J. Clin. Oncol. 2002, 20, 1248–1259, reprinted in J. Clin. Oncol. 2023, 41, 4065–4076. [Google Scholar] [CrossRef] [PubMed]
  15. Markman, M.; Liu, P.Y.; Wilczynski, S.; Monk, B.; Copeland, L.J.; Alvarez, R.D.; Jiang, C.; Alberts, D. Phase III randomized trial of 12 versus 3 months of maintenance paclitaxel in patients with advanced ovarian cancer after complete response to platinum and paclitaxel-based chemotherapy: A Southwest Oncology Group and Gynecologic Oncology Group trial. J. Clin. Oncol. 2003, 21, 2460–2465. [Google Scholar] [CrossRef]
  16. Ngoi, N.Y.; Syn, N.L.; Goh, R.M.; Goh, B.C.; Huang, R.Y.; Soon, Y.Y.; James, E.; Cook, A.; Clamp, A.; Tan, D.S. Weekly versus tri-weekly paclitaxel with carboplatin for first-line treatment in women with epithelial ovarian cancer. Cochrane Database Syst. Rev. 2022, 2, CD012007. [Google Scholar] [CrossRef] [PubMed]
  17. Luvero, D.; Milani, A.; Ledermann, J.A. Treatment options in recurrent ovarian cancer: Latest evidence and clinical potential. Ther. Adv. Med. Oncol. 2014, 6, 229–239. [Google Scholar] [CrossRef]
  18. Liu, J.F. Management of Advanced Ovarian, Fallopian Tube, and Primary Peritoneal Cancers. J. Natl. Compr. Cancer Netw. 2023, 21, 1–4. [Google Scholar] [CrossRef]
  19. Gonzalez-Martin, A.; Harter, P.; Leary, A.; Lorusso, D.; Miller, R.E.; Pothuri, B.; Ray-Coquard, I.; Tan, D.S.P.; Bellet, E.; Oaknin, A.; et al. Newly diagnosed and relapsed epithelial ovarian cancer: ESMO Clinical Practice Guideline for diagnosis, treatment and follow-up. Ann. Oncol. 2023, 34, 833–848. [Google Scholar] [CrossRef]
  20. Pujade-Lauraine, E.; Ledermann, J.A.; Selle, F.; Gebski, V.; Penson, R.T.; Oza, A.M.; Korach, J.; Huzarski, T.; Poveda, A.; Pignata, S.; et al. Olaparib tablets as maintenance therapy in patients with platinum-sensitive, relapsed ovarian cancer and a BRCA1/2 mutation (SOLO2/ENGOT-Ov21): A double-blind, randomised, placebo-controlled, phase 3 trial. Lancet Oncol. 2017, 18, 1274–1284. [Google Scholar] [CrossRef]
  21. Li, N.; Zhang, Y.; Wang, J.; Zhu, J.; Wang, L.; Wu, X.; Yao, D.; Wu, Q.; Liu, J.; Tang, J.; et al. Fuzuloparib Maintenance Therapy in Patients With Platinum-Sensitive, Recurrent Ovarian Carcinoma (FZOCUS-2): A Multicenter, Randomized, Double-Blind, Placebo-Controlled, Phase III Trial. J. Clin. Oncol. 2022, 40, 2436–2446. [Google Scholar] [CrossRef]
  22. Li, N.; Zhu, J.; Yin, R.; Wang, J.; Pan, L.; Kong, B.; Zheng, H.; Liu, J.; Wu, X.; Wang, L.; et al. Treatment With Niraparib Maintenance Therapy in Patients With Newly Diagnosed Advanced Ovarian Cancer: A Phase 3 Randomized Clinical Trial. JAMA Oncol. 2023, 9, 1230–1237. [Google Scholar] [CrossRef]
  23. Lheureux, S.; Gourley, C.; Vergote, I.; Oza, A.M. Epithelial ovarian cancer. Lancet 2019, 393, 1240–1253. [Google Scholar] [CrossRef]
  24. Griffiths, R.W.; Zee, Y.K.; Evans, S.; Mitchell, C.L.; Kumaran, G.C.; Welch, R.S.; Jayson, G.C.; Clamp, A.R.; Hasan, J. Outcomes after multiple lines of chemotherapy for platinum-resistant epithelial cancers of the ovary, peritoneum, and fallopian tube. Int. J. Gynecol. Cancer 2011, 21, 58–65. [Google Scholar] [CrossRef]
  25. Takeiwa, T.; Ikeda, K.; Horie-Inoue, K.; Inoue, S. Mechanisms of Apoptosis-Related Long Non-coding RNAs in Ovarian Cancer. Front. Cell Dev. Biol. 2021, 9, 641963. [Google Scholar] [CrossRef]
  26. Jayson, G.C.; Kohn, E.C.; Kitchener, H.C.; Ledermann, J.A. Ovarian cancer. Lancet 2014, 384, 1376–1388. [Google Scholar] [CrossRef] [PubMed]
  27. Ogundipe, O.D.; Olajubutu, O.; Adesina, S.K. Targeted drug conjugate systems for ovarian cancer chemotherapy. Biomed. Pharmacother. 2023, 165, 115151. [Google Scholar] [CrossRef] [PubMed]
  28. Konstantinopoulos, P.A.; Matulonis, U.A. Clinical and translational advances in ovarian cancer therapy. Nat. Cancer 2023, 4, 1239–1257. [Google Scholar] [CrossRef]
  29. Zhou, J.; Cao, W.; Wang, L.; Pan, Z.; Fu, Y. Application of artificial intelligence in the diagnosis and prognostic prediction of ovarian cancer. Comput. Biol. Med. 2022, 146, 105608. [Google Scholar] [CrossRef] [PubMed]
  30. Sheehy, J.; Rutledge, H.; Acharya, U.R.; Loh, H.W.; Gururajan, R.; Tao, X.; Zhou, X.; Li, Y.; Gurney, T.; Kondalsamy-Chennakesavan, S. Gynecological cancer prognosis using machine learning techniques: A systematic review of the last three decades (1990–2022). Artif. Intell. Med. 2023, 139, 102536. [Google Scholar] [CrossRef] [PubMed]
  31. Breen, J.; Allen, K.; Zucker, K.; Adusumilli, P.; Scarsbrook, A.; Hall, G.; Orsi, N.M.; Ravikumar, N. Artificial intelligence in ovarian cancer histopathology: A systematic review. NPJ Precis. Oncol. 2023, 7, 83. [Google Scholar] [CrossRef]
  32. Corti, C.; Cobanaj, M.; Dee, E.C.; Criscitiello, C.; Tolaney, S.M.; Celi, L.A.; Curigliano, G. Artificial intelligence in cancer research and precision medicine: Applications, limitations and priorities to drive transformation in the delivery of equitable and unbiased care. Cancer Treat Rev. 2023, 112, 102498. [Google Scholar] [CrossRef]
  33. Wang, R.; Pan, W.; Jin, L.; Li, Y.; Geng, Y.; Gao, C.; Chen, G.; Wang, H.; Ma, D.; Liao, S. Artificial intelligence in reproductive medicine. Reproduction 2019, 158, R139–R154. [Google Scholar] [CrossRef] [PubMed]
  34. Wu, X.; Li, W.; Tu, H. Big data and artificial intelligence in cancer research. Trends Cancer 2023. [Google Scholar] [CrossRef] [PubMed]
  35. Liu, Y. Serum proteomic pattern analysis for early cancer detection. Technol. Cancer Res. Treat. 2006, 5, 61–66. [Google Scholar] [CrossRef] [PubMed]
  36. Klein, O.; Kanter, F.; Kulbe, H.; Jank, P.; Denkert, C.; Nebrich, G.; Schmitt, W.D.; Wu, Z.; Kunze, C.A.; Sehouli, J.; et al. MALDI-Imaging for Classification of Epithelial Ovarian Cancer Histotypes from a Tissue Microarray Using Machine Learning Methods. Proteom. Clin. Appl. 2019, 13, e1700181. [Google Scholar] [CrossRef] [PubMed]
  37. Gevaert, O.; De Smet, F.; Van Gorp, T.; Pochet, N.; Engelen, K.; Amant, F.; De Moor, B.; Timmerman, D.; Vergote, I. Expression profiling to predict the clinical behaviour of ovarian cancer fails independent evaluation. BMC Cancer 2008, 8, 18. [Google Scholar] [CrossRef]
  38. Chaddad, A.; Niazi, T.; Probst, S.; Bladou, F.; Anidjar, M.; Bahoric, B. Predicting Gleason Score of Prostate Cancer Patients Using Radiomic Analysis. Front. Oncol. 2018, 8, 630. [Google Scholar] [CrossRef]
  39. Wei, W.; Li, Y.; Huang, T. Using Machine Learning Methods to Study Colorectal Cancer Tumor Micro-Environment and Its Biomarkers. Int. J. Mol. Sci. 2023, 24, 11133. [Google Scholar] [CrossRef]
  40. Chen, T.; Guestrin, C. XGBoost. In Proceedings of the 22nd ACM SIGKDD International Conference on Knowledge Discovery and Data Mining, San Francisco, CA, USA, 13–17 August 2016; pp. 785–794. [Google Scholar]
  41. Salehi, A.; Wang, L.; Coates, P.J.; Norberg Spaak, L.; Gu, X.; Sgaramella, N.; Nylander, K. Reiterative modeling of combined transcriptomic and proteomic features refines and improves the prediction of early recurrence in squamous cell carcinoma of head and neck. Comput. Biol. Med. 2022, 149, 105991. [Google Scholar] [CrossRef]
  42. Li, W.; Yin, Y.; Quan, X.; Zhang, H. Gene Expression Value Prediction Based on XGBoost Algorithm. Front. Genet. 2019, 10, 1077. [Google Scholar] [CrossRef]
  43. Hathaway, Q.A.; Roth, S.M.; Pinti, M.V.; Sprando, D.C.; Kunovac, A.; Durr, A.J.; Cook, C.C.; Fink, G.K.; Cheuvront, T.B.; Grossman, J.H.; et al. Machine-learning to stratify diabetic patients using novel cardiac biomarkers and integrative genomics. Cardiovasc. Diabetol. 2019, 18, 78. [Google Scholar] [CrossRef] [PubMed]
  44. Sorayaie Azar, A.; Babaei Rikan, S.; Naemi, A.; Bagherzadeh Mohasefi, J.; Pirnejad, H.; Bagherzadeh Mohasefi, M.; Wiil, U.K. Application of machine learning techniques for predicting survival in ovarian cancer. BMC Med. Inform. Decis. Mak. 2022, 22, 345. [Google Scholar] [CrossRef] [PubMed]
  45. Yagin, F.H.; Cicek, I.B.; Alkhateeb, A.; Yagin, B.; Colak, C.; Azzeh, M.; Akbulut, S. Explainable artificial intelligence model for identifying COVID-19 gene biomarkers. Comput. Biol. Med. 2023, 154, 106619. [Google Scholar] [CrossRef]
  46. Lai, Y.; Lin, X.; Lin, C.; Lin, X.; Chen, Z.; Zhang, L. Identification of endoplasmic reticulum stress-associated genes and subtypes for prediction of Alzheimer’s disease based on interpretable machine learning. Front. Pharmacol. 2022, 13, 975774. [Google Scholar] [CrossRef] [PubMed]
  47. Ahamad, M.M.; Aktar, S.; Uddin, M.J.; Rahman, T.; Alyami, S.A.; Al-Ashhab, S.; Akhdar, H.F.; Azad, A.; Moni, M.A. Early-Stage Detection of Ovarian Cancer Based on Clinical Data Using Machine Learning Approaches. J. Pers. Med. 2022, 12, 1211. [Google Scholar] [CrossRef] [PubMed]
  48. Wu, M.; Zhao, Y.; Dong, X.; Jin, Y.; Cheng, S.; Zhang, N.; Xu, S.; Gu, S.; Wu, Y.; Yang, J.; et al. Artificial intelligence-based preoperative prediction system for diagnosis and prognosis in epithelial ovarian cancer: A multicenter study. Front. Oncol. 2022, 12, 975703. [Google Scholar] [CrossRef]
  49. Liu, J.; Liu, L.; Antwi, P.A.; Luo, Y.; Liang, F. Identification and Validation of the Diagnostic Characteristic Genes of Ovarian Cancer by Bioinformatics and Machine Learning. Front. Genet. 2022, 13, 858466. [Google Scholar] [CrossRef] [PubMed]
  50. Yang, Y.; Yang, Y.; Yang, J.; Zhao, X.; Wei, X. Tumor Microenvironment in Ovarian Cancer: Function and Therapeutic Strategy. Front. Cell Dev. Biol. 2020, 8, 758. [Google Scholar] [CrossRef]
  51. Kalluri, R. The biology and function of fibroblasts in cancer. Nat. Rev. Cancer. 2016, 16, 582–598. [Google Scholar] [CrossRef]
  52. Lee, S.W.; Kwak, H.S.; Kang, M.H.; Park, Y.Y.; Jeong, G.S. Fibroblast-associated tumour microenvironment induces vascular structure-networked tumouroid. Sci. Rep. 2018, 8, 2365. [Google Scholar] [CrossRef]
  53. Cai, J.; Tang, H.; Xu, L.; Wang, X.; Yang, C.; Ruan, S.; Guo, J.; Hu, S.; Wang, Z. Fibroblasts in omentum activated by tumor cells promote ovarian cancer growth, adhesion and invasiveness. Carcinogenesis 2012, 33, 20–29. [Google Scholar] [CrossRef] [PubMed]
  54. Shani, O.; Vorobyov, T.; Monteran, L.; Lavie, D.; Cohen, N.; Raz, Y.; Tsarfaty, G.; Avivi, C.; Barshack, I.; Erez, N. Fibroblast-Derived IL33 Facilitates Breast Cancer Metastasis by Modifying the Immune Microenvironment and Driving Type 2 Immunity. Cancer Res. 2020, 80, 5317–5329. [Google Scholar] [CrossRef] [PubMed]
  55. Su, S.; Chen, J.; Yao, H.; Liu, J.; Yu, S.; Lao, L.; Wang, M.; Luo, M.; Xing, Y.; Chen, F.; et al. CD10(+)GPR77(+) Cancer-Associated Fibroblasts Promote Cancer Formation and Chemoresistance by Sustaining Cancer Stemness. Cell 2018, 172, 841–856.e16. [Google Scholar] [CrossRef] [PubMed]
  56. Zhang, M.; Chen, Z.; Wang, Y.; Zhao, H.; Du, Y. The Role of Cancer-Associated Fibroblasts in Ovarian Cancer. Cancers 2022, 14, 2637. [Google Scholar] [CrossRef] [PubMed]
  57. Yuan, H.; Yu, Q.; Pang, J.; Chen, Y.; Sheng, M.; Tang, W. The Value of the Stemness Index in Ovarian Cancer Prognosis. Genes 2022, 13, 993. [Google Scholar] [CrossRef] [PubMed]
  58. Kuryk, L.; Møller, A.S.W. Chimeric oncolytic Ad5/3 virus replicates and lyses ovarian cancer cells through desmoglein-2 cell entry receptor. J. Med. Virol. 2020, 92, 1309–1315. [Google Scholar] [CrossRef] [PubMed]
  59. Moufarrij, S.; Dandapani, M.; Arthofer, E.; Gomez, S.; Srivastava, A.; Lopez-Acevedo, M.; Villagra, A.; Chiappinelli, K.B. Epigenetic therapy for ovarian cancer: Promise and progress. Clin. Epigenetics 2019, 11, 7. [Google Scholar] [CrossRef]
  60. Wang, L.; Sun, T.; Li, S.; Zhang, Z.; Jia, J.; Shan, B. Protein anabolism is key to long-term survival in high-grade serous ovarian cancer. Transl. Oncol. 2021, 14, 100885. [Google Scholar] [CrossRef]
  61. Wang, K.J.; Adrian, A.M.; Chen, K.H.; Wang, K.M. A hybrid classifier combining Borderline-SMOTE with AIRS algorithm for estimating brain metastasis from lung cancer: A case study in Taiwan. Comput. Methods Programs Biomed. 2015, 119, 63–76. [Google Scholar] [CrossRef]
  62. Lin, H.; Angeli, M.; Chung, K.J.; Ejimadu, C.; Rosa, A.R.; Lee, T. sFRP2 activates Wnt/β-catenin signaling in cardiac fibroblasts: Differential roles in cell growth, energy metabolism, and extracellular matrix remodeling. Am. J. Physiol. Cell Physiol. 2016, 311, C710–C719. [Google Scholar] [CrossRef]
  63. Duan, H.; Yan, Z.; Chen, W.; Wu, Y.; Han, J.; Guo, H.; Qiao, J. TET1 inhibits EMT of ovarian cancer cells through activating Wnt/β-catenin signaling inhibitors DKK1 and SFRP2. Gynecol. Oncol. 2017, 147, 408–417. [Google Scholar] [CrossRef] [PubMed]
  64. Huang, C.; Ye, Z.; Wan, J.; Liang, J.; Liu, M.; Xu, X.; Li, L. Secreted Frizzled-Related Protein 2 Is Associated with Disease Progression and Poor Prognosis in Breast Cancer. Dis. Markers 2019, 2019, 6149381. [Google Scholar] [CrossRef]
  65. Lai, H.Y.; Chiu, C.C.; Kuo, Y.H.; Tsai, H.H.; Wu, L.C.; Tseng, W.H.; Liu, C.L.; Hsing, C.H.; Huang, S.K.; Li, C.F. High Stromal SFRP2 Expression in Urothelial Carcinoma Confers an Unfavorable Prognosis. Front. Oncol. 2022, 12, 834249. [Google Scholar] [CrossRef] [PubMed]
  66. Ma, F.; Plazyo, O.; Billi, A.C.; Tsoi, L.C.; Xing, X.; Wasikowski, R.; Gharaee-Kermani, M.; Hile, G.; Jiang, Y.; Harms, P.W.; et al. Single cell and spatial sequencing define processes by which keratinocytes and fibroblasts amplify inflammatory responses in psoriasis. Nat. Commun. 2023, 14. [Google Scholar] [CrossRef] [PubMed]
  67. Tang, D.; Liu, J.; Wang, D.R.; Yu, H.F.; Li, Y.K.; Zhang, J.Q. Diagnostic and prognostic value of the methylation status of secreted frizzled-related protein 2 in colorectal cancer. Clin. Investig. Med. 2011, 34, E88–E95. [Google Scholar] [CrossRef]
  68. Kasashima, H.; Duran, A.; Martinez-Ordonez, A.; Nakanishi, Y.; Kinoshita, H.; Linares, J.F.; Reina-Campos, M.; Kudo, Y.; L’Hermitte, A.; Yashiro, M.; et al. Stromal SOX2 Upregulation Promotes Tumorigenesis through the Generation of a SFRP1/2-Expressing Cancer-Associated Fibroblast Population. Dev. Cell 2021, 56, 95–110.e10. [Google Scholar] [CrossRef]
  69. Lu, X.; Ji, C.; Jiang, L.; Zhu, Y.; Zhou, Y.; Meng, J.; Gao, J.; Lu, T.; Ye, J.; Yan, F. Tumour microenvironment-based molecular profiling reveals ideal candidates for high-grade serous ovarian cancer immunotherapy. Cell Prolif. 2021, 54, e12979. [Google Scholar] [CrossRef]
  70. Geng, T.; Zheng, M.; Wang, Y.; Reseland, J.E.; Samara, A. An artificial intelligence prediction model based on extracellular matrix proteins for the prognostic prediction and immunotherapeutic evaluation of ovarian serous adenocarcinoma. Front. Mol. Biosci. 2023, 10, 1200354. [Google Scholar] [CrossRef]
  71. Ding, J.; Wang, C.; Sun, Y.; Guo, J.; Liu, S.; Cheng, Z. Identification of an Autophagy-Related Signature for Prognosis and Immunotherapy Response Prediction in Ovarian Cancer. Biomolecules 2023, 13, 339. [Google Scholar] [CrossRef]
  72. Donehower, L.A.; Soussi, T.; Korkut, A.; Liu, Y.; Schultz, A.; Cardenas, M.; Li, X.; Babur, O.; Hsu, T.K.; Lichtarge, O.; et al. Integrated Analysis of TP53 Gene and Pathway Alterations in The Cancer Genome Atlas. Cell Rep. 2019, 28, 1370–1384.e5. [Google Scholar] [CrossRef]
  73. Way, G.P.; Sanchez-Vega, F.; La, K.; Armenia, J.; Chatila, W.K.; Luna, A.; Sander, C.; Cherniack, A.D.; Mina, M.; Ciriello, G.; et al. Machine Learning Detects Pan-cancer Ras Pathway Activation in The Cancer Genome Atlas. Cell Rep. 2018, 23, 172–180.e3. [Google Scholar] [CrossRef] [PubMed]
  74. Nulsen, J.; Misetic, H.; Yau, C.; Ciccarelli, F.D. Pan-cancer detection of driver genes at the single-patient resolution. Genome Med. 2021, 13, 12. [Google Scholar] [CrossRef]
  75. Bolboaca, S.D. Medical Diagnostic Tests: A Review of Test Anatomy, Phases, and Statistical Treatment of Data. Comput. Math. Methods Med. 2019, 2019, 1891569. [Google Scholar] [CrossRef] [PubMed]
  76. Hänzelmann, S.; Castelo, R.; Guinney, J. GSVA: Gene set variation analysis for microarray and RNA-seq data. BMC Bioinform. 2013, 14, 7. [Google Scholar] [CrossRef] [PubMed]
Figure 1. Distribution of DEGs in the GEO datasets. (A) Volcanic map showing the distribution of dysregulated genes in dataset GSE9891. Blue scatter points are downregulated genes, red scatter points are upregulated genes, and gray scatter points are non-characteristic genes. (B) A volcanic map showing the distribution of dysregulated genes in dataset GSE26193. Blue scatter points are downregulated genes, red scatter points are upregulated genes, and gray scatter points are non-characteristic genes. (C) Venn diagram showing the number of upregulated genes in the datasets GSE9891 and GSE26193; the intersection part is the total number of upregulated genes in the two datasets, the remaining blue part is the number of upregulated genes unique to GSE9891, and the remaining yellow part is the number of upregulated genes unique to GSE26193. (D) Venn diagram showing the number of downregulated genes shared between datasets GSE9891 and GSE26193; the intersection part is the number of downregulated genes shared between the two datasets, the remaining blue part is the number of downregulated genes unique to GSE9891, and the remaining yellow part is the number of downregulated genes unique to GSE26193.
Ijms 24 16942 g001
Figure 2. Results of function enrichment analysis of overlapping DEGs. (A) Results of GO analysis of DEGs. (B) Results of KEGG analysis of DEGs. (C) PPI network analysis and visualization results of overlapping DEGs using Cytoscape.
Ijms 24 16942 g002
Figure 3. Performance analysis results including confusion matrix and receiver operating characteristic (ROC) curve of machine learning model. The red box in the confusion matrix is the number of samples predicted accurately, and the off-white box is the number of samples predicted incorrectly. The receiver operating characteristic (ROC) curve shows the area under the maximum curve (AUC), which can be used as a basis to judge the performance of a machine learning model. (A) Confusion matrix of Support Vector Machine (SVM) algorithm. (B) Confusion matrix of Extreme Gradient Lift (XGBoost) algorithm. (C) Confusion matrix of Random Forest (RF) algorithm. (D) ROC curve of SVM. (E) ROC curve of XGBoost. (F) ROC curve of RF.
Ijms 24 16942 g003
Figure 4. Number of feature genes screened using different machine learning algorithms and the difference in these genes’ expression level. The number of feature genes shared by the three machine learning model algorithms is shown in (A). Blue represents the number of feature genes screened by the Random Forest (RF) algorithm, yellow represents the number of feature genes screened by the Extreme Gradient Boost (XGBoost) algorithm, and green represents the number of feature genes screened by the Support Vector Machine (SVM) algorithm. (B) Comparison of expression levels of 12 characteristic genes in pathological stage I and other stages in GSE9891. * p < 0.05, ** p < 0.01, *** p < 0.001 and **** p < 0.0001.
Ijms 24 16942 g004
Figure 5. ROC curves of 12 characteristic genes. (AL) describe the ROC curves and AUC values of 12 characteristic genes.
Ijms 24 16942 g005
Figure 6. Co-enrichment of three characteristic genes with CAFs and Kaplan-Meier survival analysis. (A) Heatmaps demonstrate the correlation between enrichment level of CAFs and the survival risk of tumor patients through pan-cancer analysis. The font for OC is highlighted in red, while the font for other types of tumors is displayed in black. (BD) show the correlation between the enrichment levels of CAFs and expression levels of SFRP2, SERPINE1, and POSTN, respectively, via pan-cancer analysis. (E,F) represent the survival status of advanced OC patients with differential expression levels of genes SFRP2, SERPINE1, and POSTN, respectively, in the GSE9891 dataset and in the dataset encompassing all ovarian cancer patients.
Ijms 24 16942 g006
Figure 7. Identification of a novel CAF subset by Single-cell RNA sequencing analysis in OC. (A,B) Violin plot showing the expression levels of SFRP2 in each cell type in GSE154600 and EMTAB8107, respectively. (C,D) t-SNE plot showing cell clusters colored by COL6A1 and COL6A2. (E,F) t-SNE plot showing cell clusters colored by FAP and SFRP2.
Ijms 24 16942 g007
Figure 8. Top 100 specific genes from SFRP2+ fibroblast for predicting immune checkpoint inhibitor (ICI) responses and oncogene mutations. (A) Distribution of high-level SFRP2+ fibroblast and low-level SFRP2+ fibroblast among ICI responders and non-responders. (B) Violin plot showing differences in TIDE, Dysfunction, Exclusion, and CAF scores between the high-level SFRP2+ fibroblast and low-level SFRP2+ fibroblast groups within the TCGA−OV dataset. (C) Architecture diagram of the artificial neural network. (D) ROC curve of the performance of the model in testing sets for predicting TP53 mutation in pan-cancer. **** p < 0.0001.
Ijms 24 16942 g008
Disclaimer/Publisher’s Note: The statements, opinions and data contained in all publications are solely those of the individual author(s) and contributor(s) and not of MDPI and/or the editor(s). MDPI and/or the editor(s) disclaim responsibility for any injury to people or property resulting from any ideas, methods, instructions or products referred to in the content.

