Article

Bioactive Polyketides from the Natural Complex of the Sea Urchin-Associated Fungi Penicillium sajarovii KMM 4718 and Aspergillus protuberus KMM 4747

by
Elena V. Leshchenko
1,2,*,
Dmitrii V. Berdyshev
1,
Ekaterina A. Yurchenko
1,*,
Alexandr S. Antonov
1,
Gleb V. Borkunov
1,2,
Natalya N. Kirichuk
1,
Viktoria E. Chausova
1,
Anatoly I. Kalinovskiy
1,
Roman S. Popov
1,
Yuliya V. Khudyakova
1,
Ekaterina A. Chingizova
1,
Artur R. Chingizov
1,
Marina P. Isaeva
1 and
Anton N. Yurchenko
1
1
G.B. Elyakov Pacific Institute of Bioorganic Chemistry, Far Eastern Branch of the Russian Academy of Sciences, 159 Prospect 100-Letiya Vladivostoka, Vladivostok 690022, Russia
2
Institute of High Technologies and Advanced Materials, Far Eastern Federal University, Vladivostok 690922, Russia
*
Authors to whom correspondence should be addressed.
Int. J. Mol. Sci. 2023, 24(23), 16568; https://doi.org/10.3390/ijms242316568
Submission received: 31 October 2023 / Revised: 18 November 2023 / Accepted: 18 November 2023 / Published: 21 November 2023
(This article belongs to the Special Issue The Structures and Biologic Activity of Marine Natural Products)

Abstract

:
The marine-derived fungal strains KMM 4718 and KMM 4747 isolated from sea urchin Scaphechinus mirabilis as a natural fungal complex were identified as Penicillium sajarovii and Aspergillus protuberus based on Internal Transcribed Spacer (ITS), partial β-tubulin (BenA), and calmodulin (CaM) molecular markers as well as an ribosomal polymerase two, subunit two (RPB2) region for KMM 4747. From the ethyl acetate extract of the co-culture, two new polyketides, sajaroketides A (1) and B (2), together with (2′S)-7-hydroxy-2-(2′-hydroxypropyl)-5-methylchromone (3), altechromone A (4), norlichexanthone (5), griseoxanthone C (6), 1,3,5,6-tetrahydroxy-8-methylxanthone (7), griseofulvin (8), 6-O-desmethylgriseofulvin (9), dechlorogriseofulvin (10), and 5,6-dihydro-4-methyl-2H-pyran-2-one (11) were identified. The structures of the compounds were elucidated using spectroscopic analyses. The absolute configurations of the chiral centers of sajaroketides A and B were determined using time-dependent density functional theory (TDDFT)-based calculations of the Electronic Circular Dichroism (ECD) spectra. The inhibitory effects of these compounds on urease activity and the growth of Staphylococcus aureus, Escherichia coli, and Candida albicans were observed. Sajaroketide A, altechromone A, and griseofulvin showed significant cardioprotective effects in an in vitro model of S. aureus-induced infectious myocarditis.

1. Introduction

Marine microbial ecosystems are characterized by an uneven ratio between prokaryotes and eukaryotes. For example, an investigation of the microbial community during a natural Noctiluca scintillans algal bloom in the coastal area of Dongchong (Shenzhen, China) showed that, in addition to dinoflagellates, Bacteria and Archaea predominate in this community, and Fungi are represented by only four phyla in very small quantities [1]. This leads to considerable competition within the community and the production of exolites to control the competitors. A number of reports have confirmed that the produced secondary metabolites may be extensively involved in a variety of communication events among microorganisms when a bacteria–fungus co-culture produces bacteriostatic and fungicidal exolites [2]. From 2009 to 2019, various alkaloids, anthraquinones, cyclopeptides, macrolides, phenylpropanoids, polyketides, steroids, terpenoids, and others (153 compounds in total) with antimicrobial, cytotoxic, hemolytic, and anti-proliferative activities were isolated from marine microbial co-cultures [3]. The latest report by Li et al. described 194 compounds with cytotoxic, antibacterial, antifungal, antimalarial, and antifouling properties isolated from marine microbial co-cultures in 2012–2022 [4]. Our study of various marine fungus–fungus co-cultures resulted in the isolation of new cytotoxic and hemolytic metabolites [5,6,7].
In the course of our investigation of the fungal community of various marine substrates in the Sea of Japan, a natural fungal complex was isolated from the aboral surface of the sea urchin Scaphechinus mirabilis collected from Troitsa Bay and formed by only two strains, KMM 4718 and KMM 4747. The fungal species Penicillium sajarovii is one of three representatives of the Raistrickiorum series (Ramosa) and is phylogenetically close to the species P. raistrickii [8]. Various compounds have been reported to be isolated from P. raistrickii. Among them, there are benzo-fused 2,8-dioxabicyclo[3.3.1]nonane-contained spiroketals [9]; several p-terphenyl and xanthone derivatives together with griseofulvin-related metabolites [10]; indole diketopiperazine alkaloids and benzodiazepine derivatives [11]; radical scavenging phenetyltetrahydrofuranes [12]; and cytotoxic spiroditetrahydropyran polyketides [13]. The fungal species Aspergillus protuberus belongs to the Versicolores series (Nidulantes), which currently includes 17 species, and is phylogenetically close to the species A. versicolor, A. amoenus, A. tabacinus, and A. austroafricanus [8]. These fungi are well-known sources of polyketides, diketopiperazines, sterols, terpenoids, and meroterpenoids [14,15,16]. Penicillium and Aspergillus species are two of the most widespread fungal organisms on Earth, growing on many different substrates, and are permanent components of marine microbial communities [17,18]. Each of these studied fungi is a promising producer of various metabolites with a wide range of biological activities; therefore, studying their natural complex can yield interesting results.
Here, we report the isolation and structure elucidation, including absolute configuration determination, of 11 polyketides (Figure 1) from the natural complex of the sea urchin-associated fungi P. sajarovii KMM 4718 and A. protuberus KMM 4747. The antimicrobial and cytotoxic activities of the isolated compounds are also evaluated.

2. Results

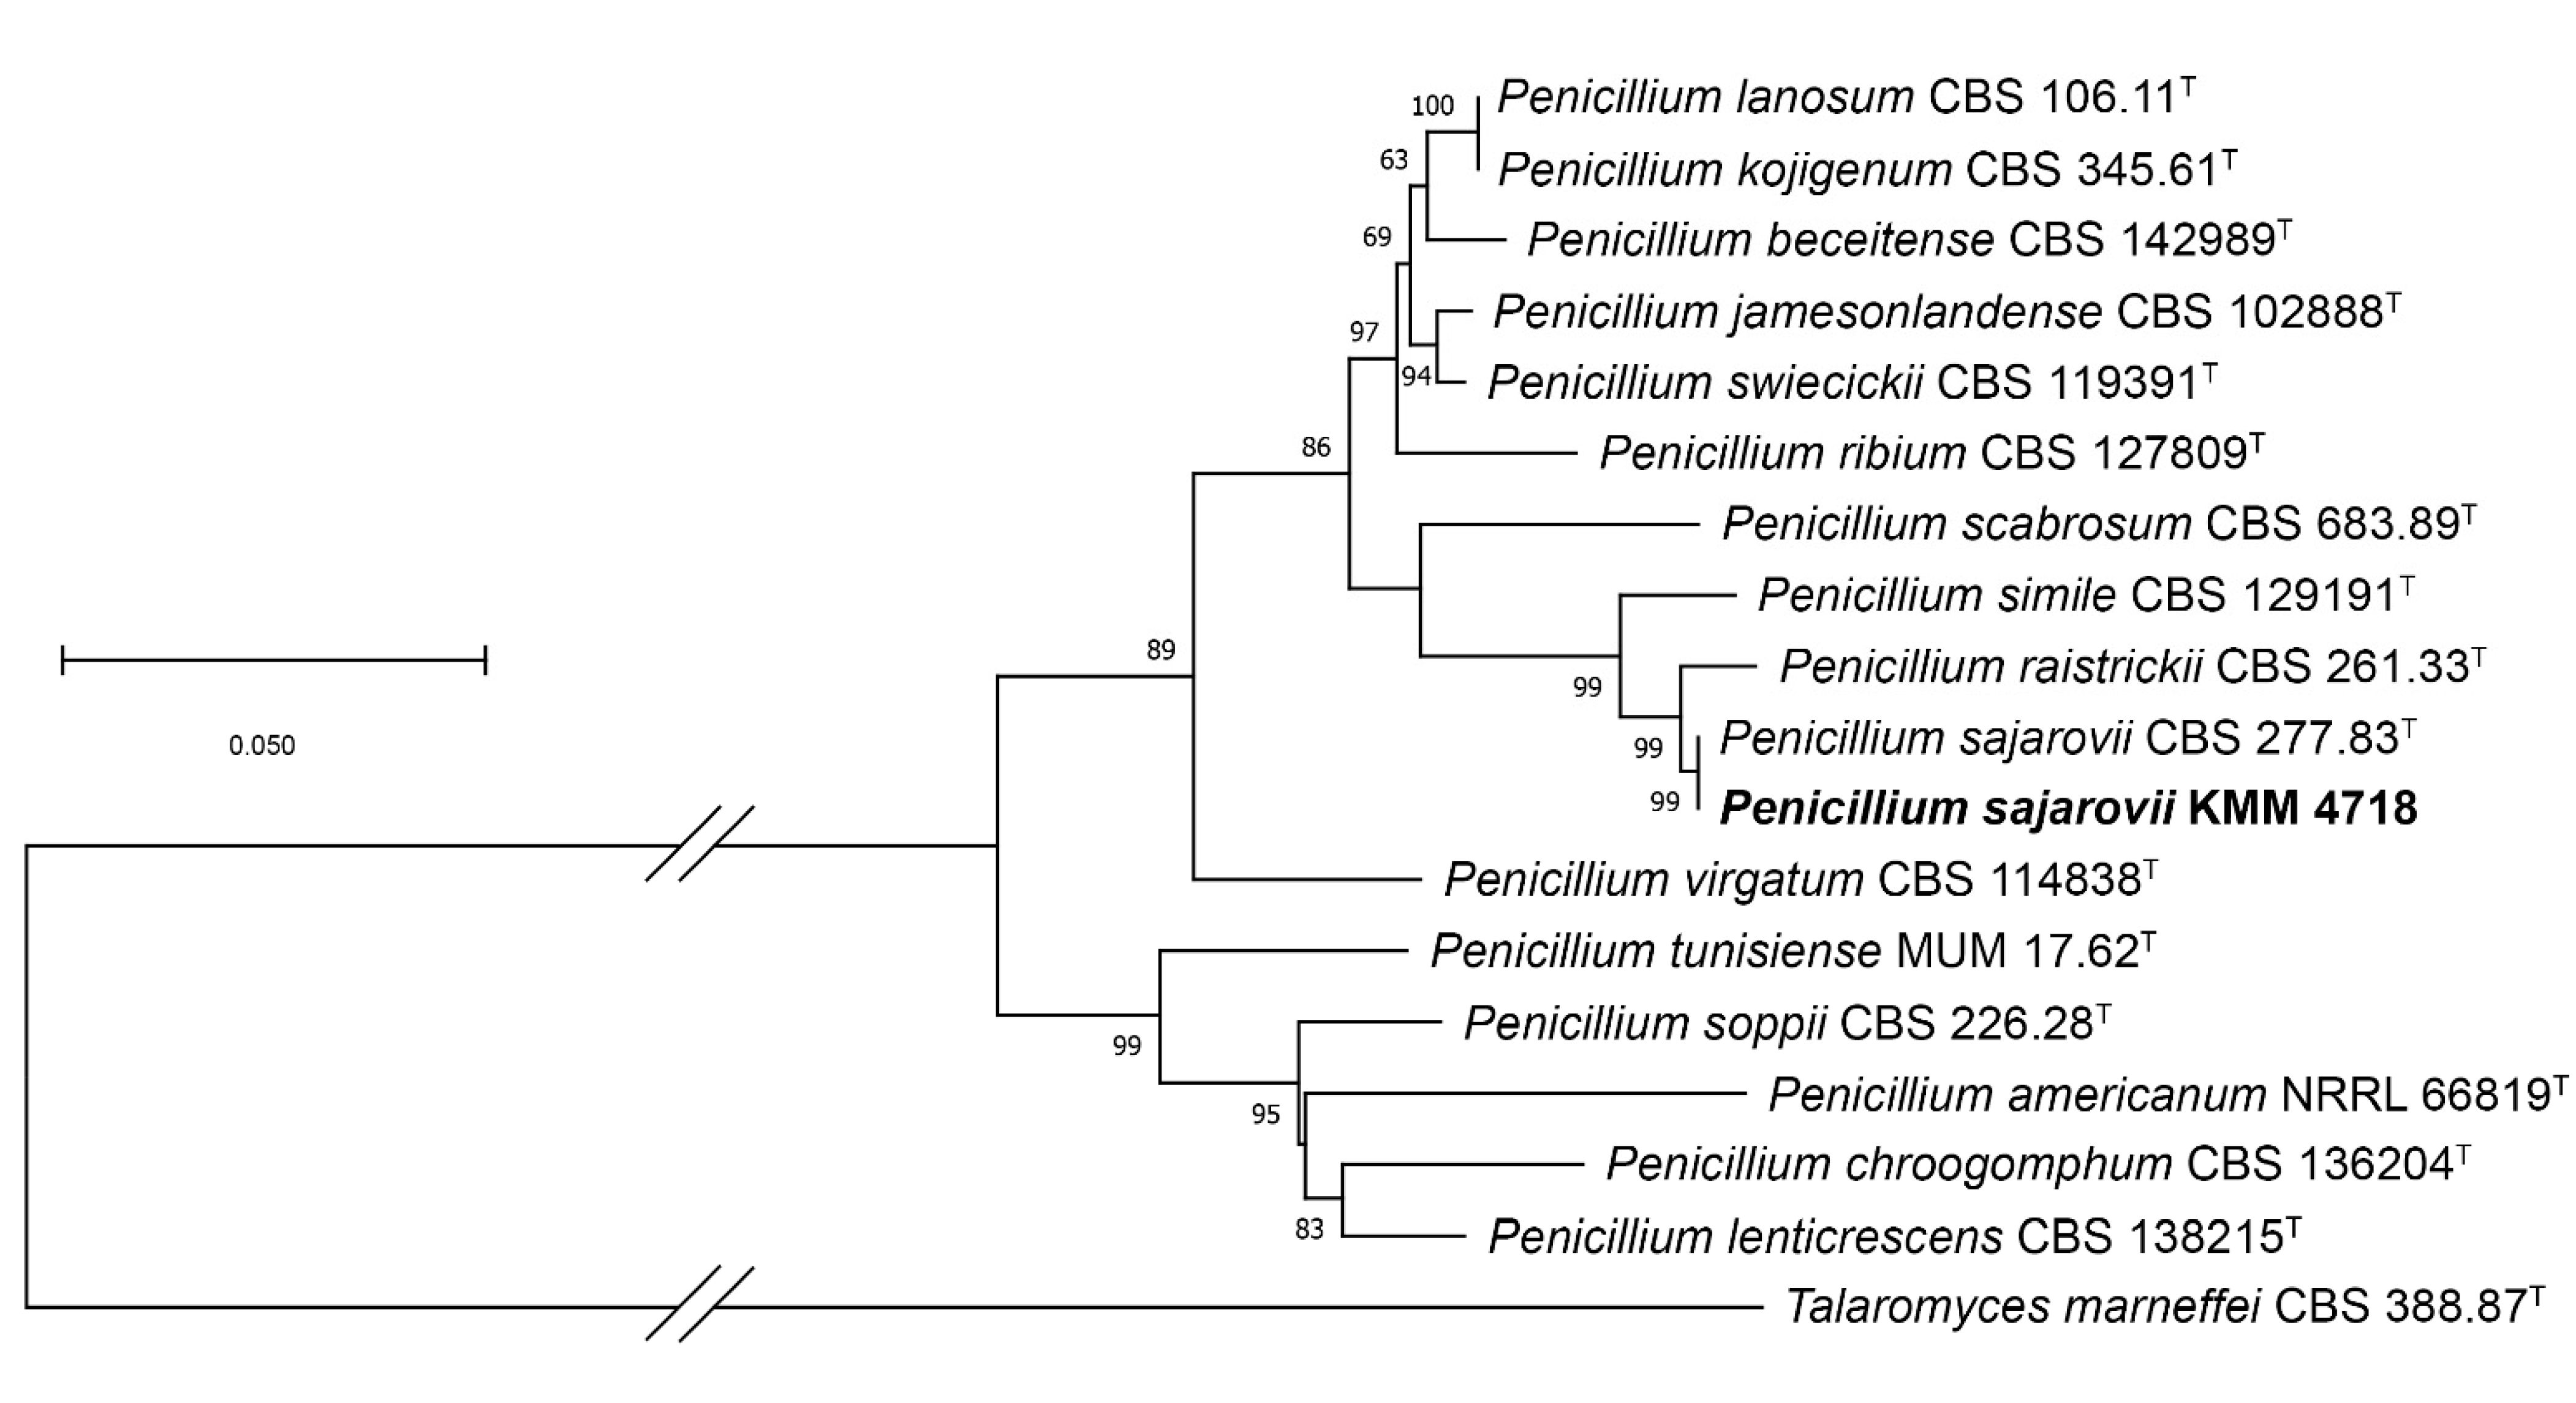
2.1. Molecular Identification of the Fungal Strains

In this study, to clarify the taxonomic position of the strains KMM 4718 and KMM 4747, we sequenced molecular markers, such as ITS, partial BenA, and CaM regions. Approximately 550–570 bp fragments of the ITS region, about 430–450 bp fragments of partial BenA, and about 500–520 bp fragments of the CaM gene were successfully amplified. In addition, a 940 bp fragment of the RPB2 gene was amplified for KMM 4747. A BLAST search showed that the ITS region, partial BenA, and CaM gene sequences of strain KMM 4718 were 100% identical to those of the ex-type strain Penicillium sajarovii CBS 277.83T. The phylogenetic ML tree of the concatenated ITS-BenA-CaM gene sequences clearly showed that the strain KMM 4718 clustered with ex-type strain Penicillium sajarovii CBS 277.83T (Figure 2).
A BLAST search showed that the ITS region was 100% identical to the sequence of the ex-type strain Aspergillus protuberus CBS 602.74T, whereas the partial BenA, CaM, and RPB2 gene sequences were more than 99% identical. The phylogenetic ML tree of the concatenated ITS-BenA-CaM-RPB2 gene sequences clearly showed that the strain KMM 4747 clustered with ex-type strain Aspergillus protuberus CBS 602.74T (Figure 3).

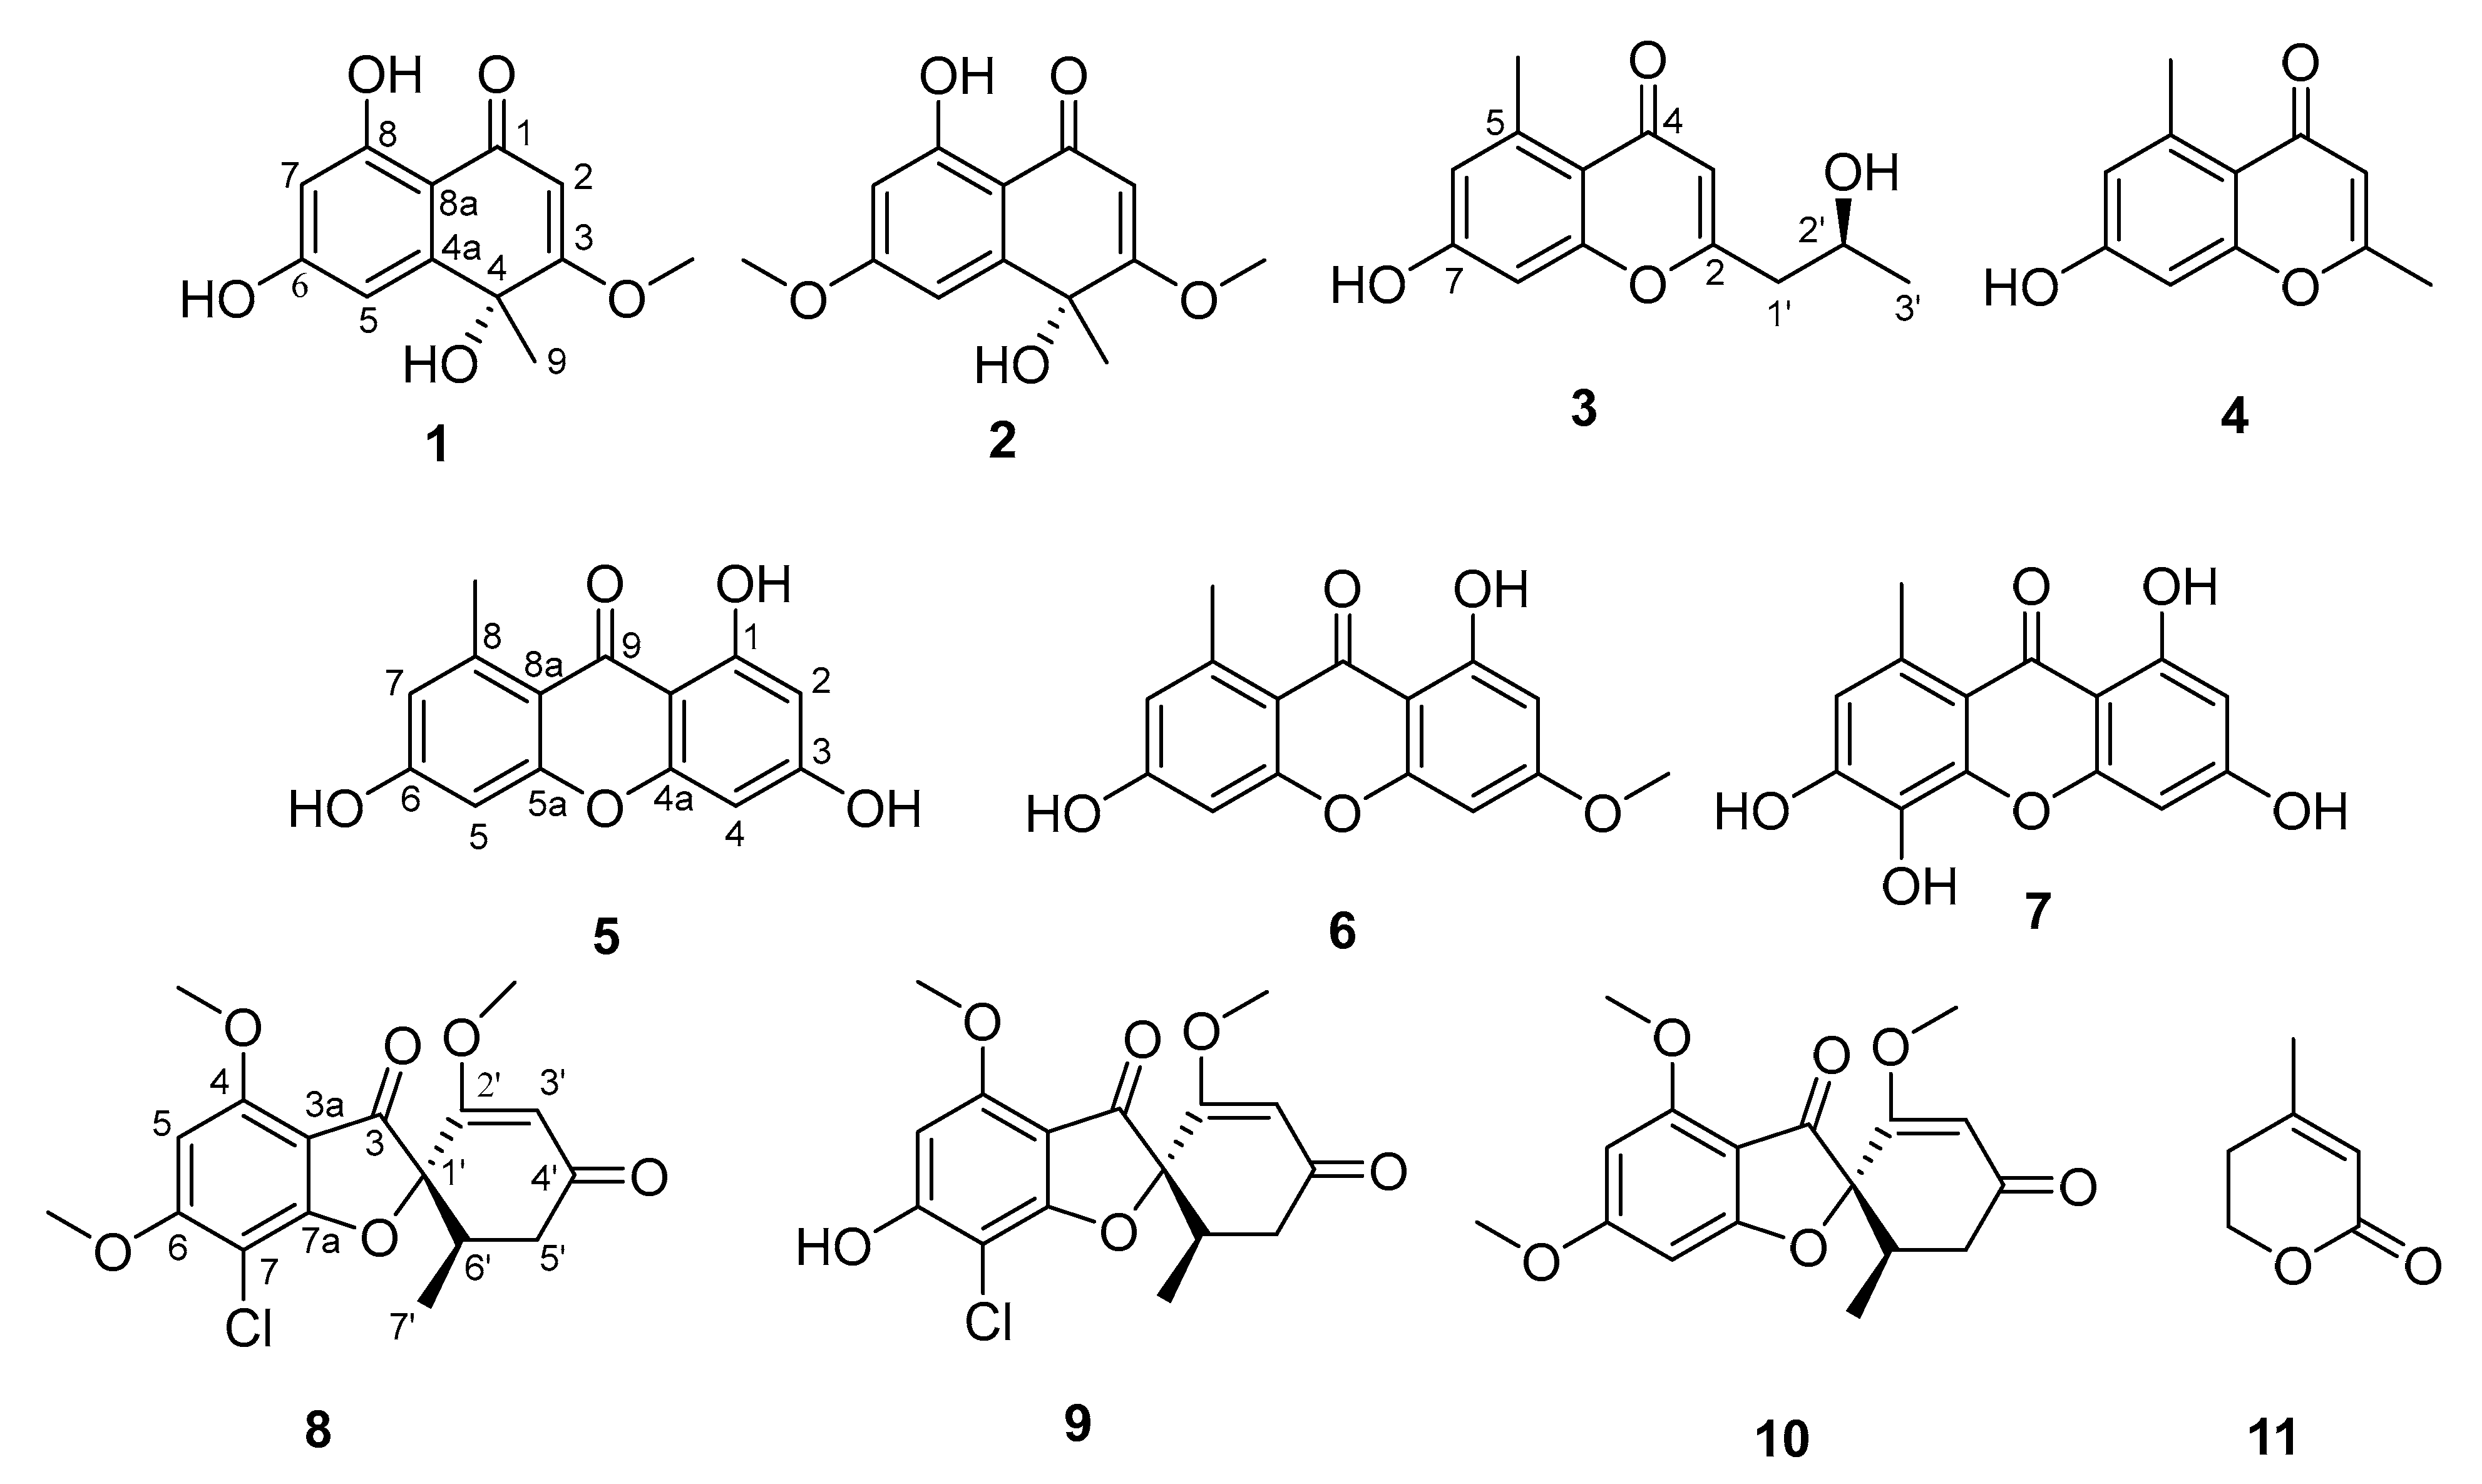
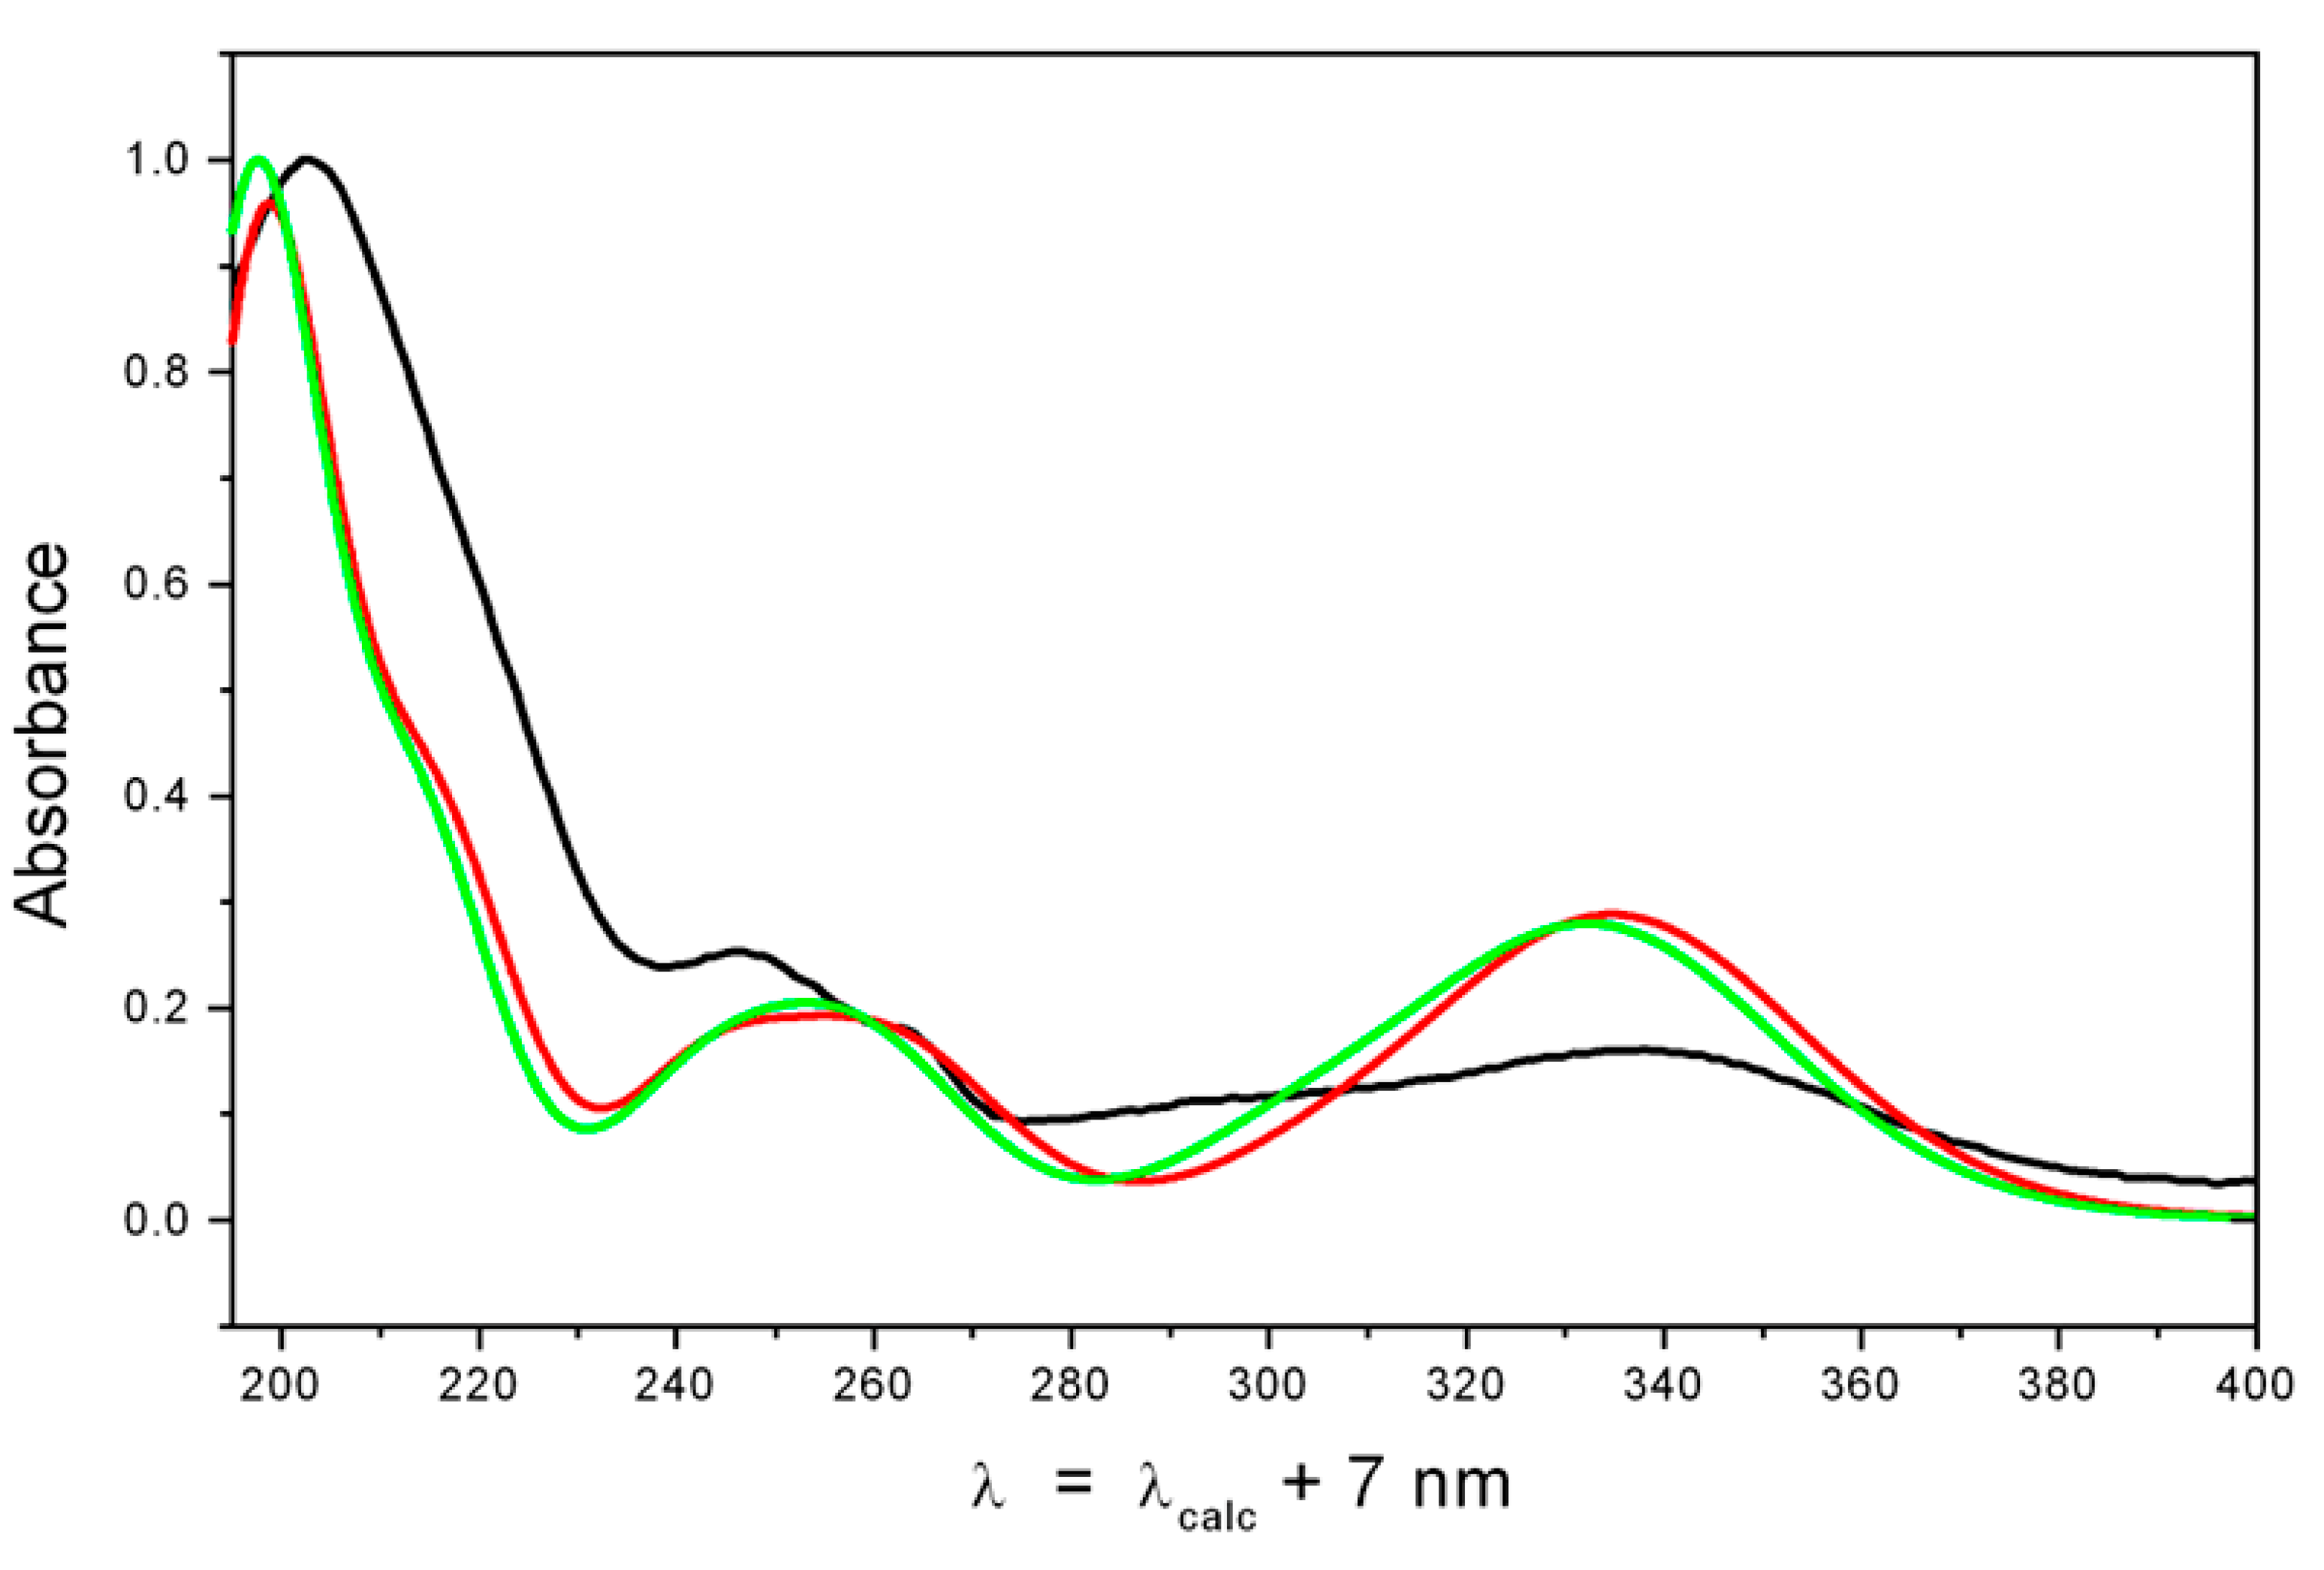
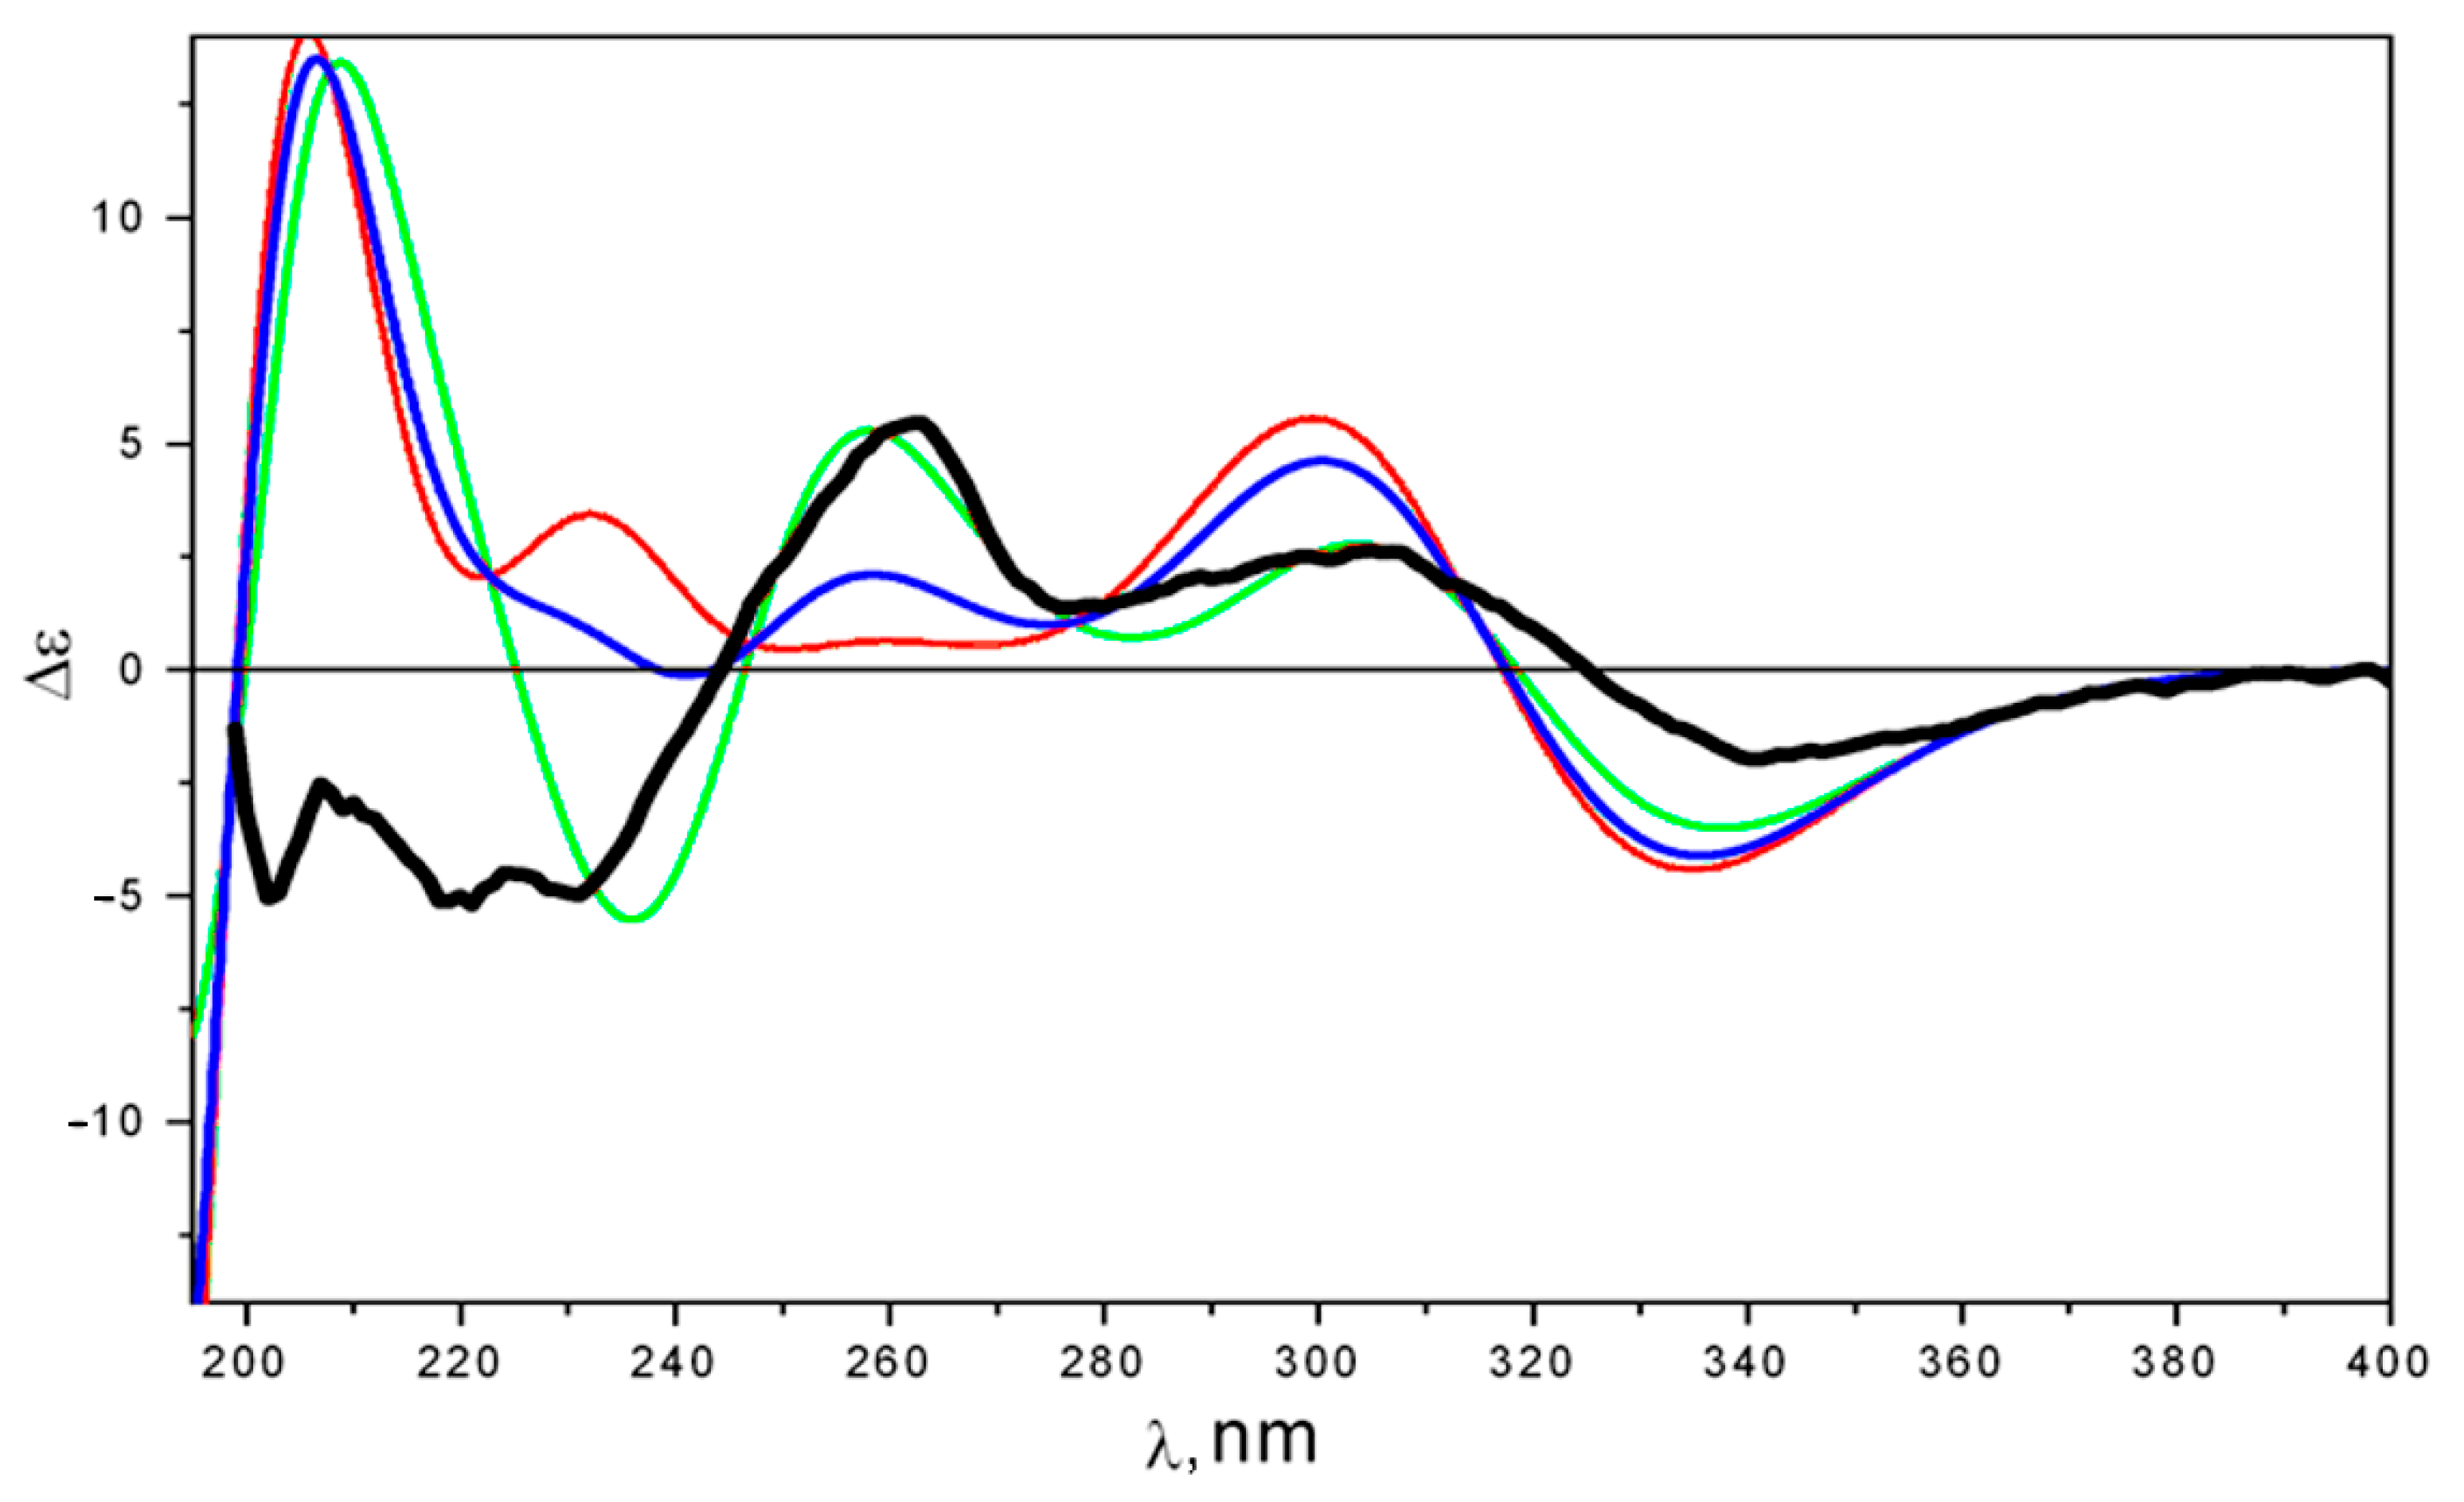
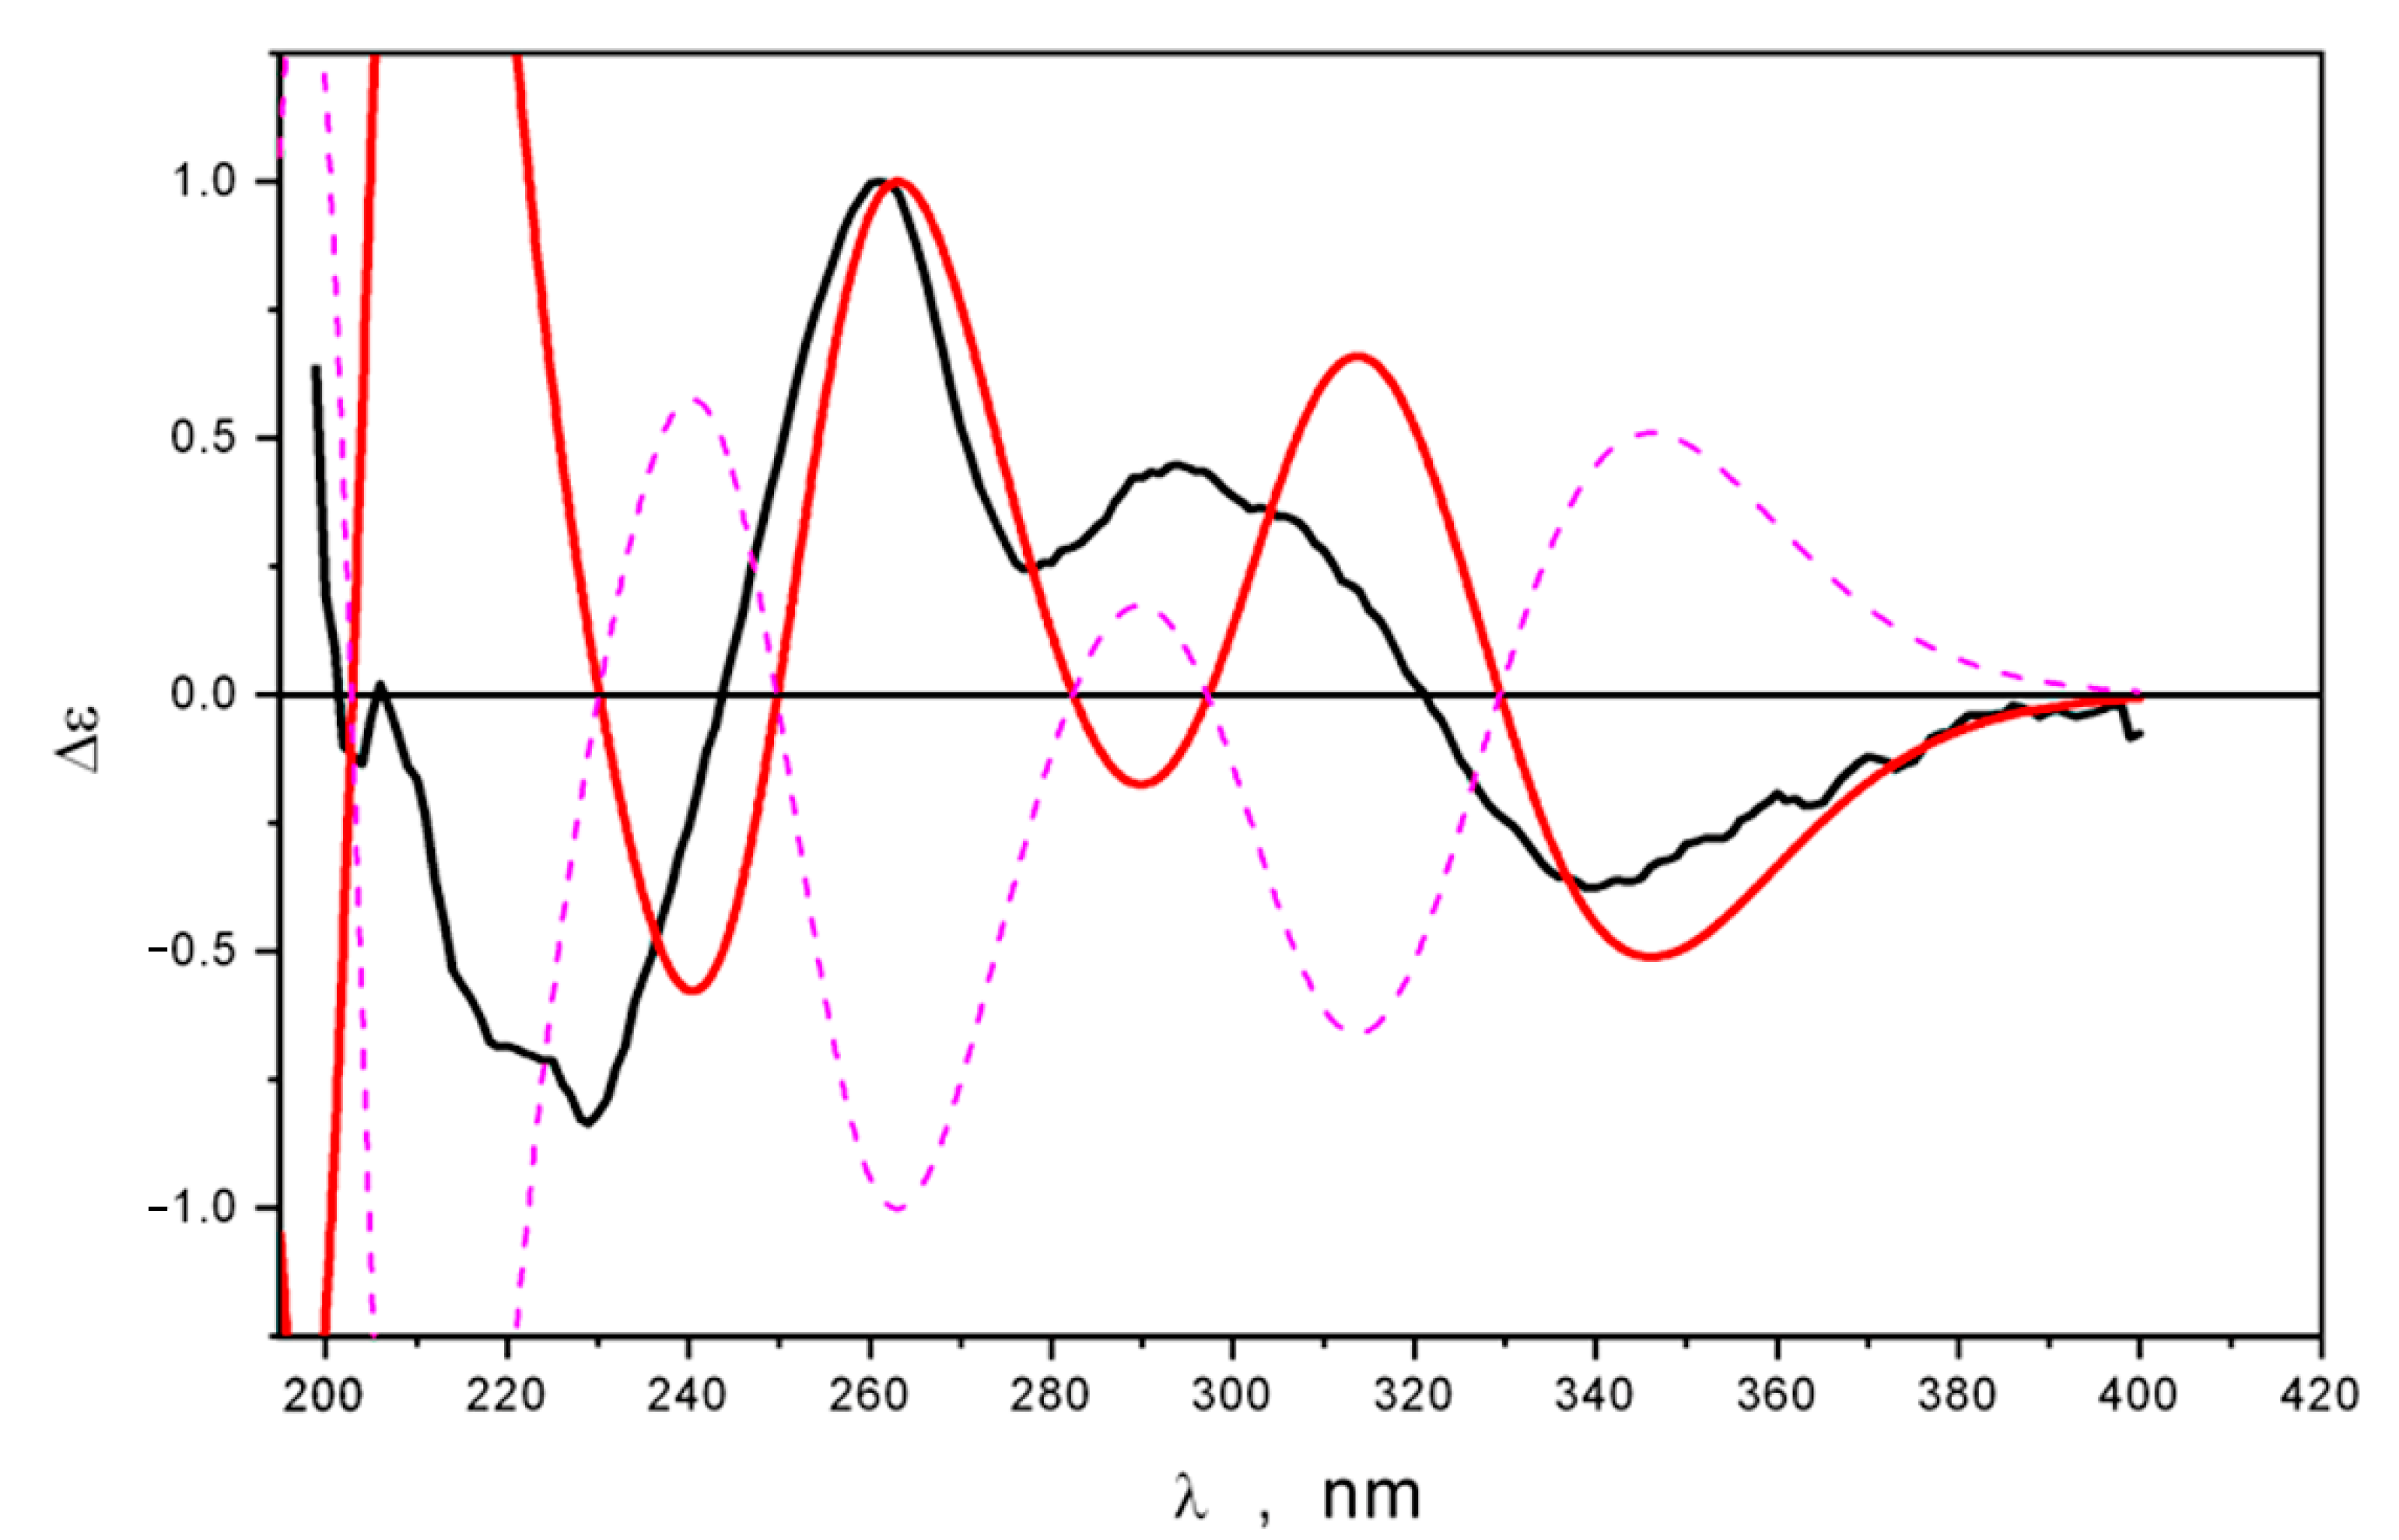
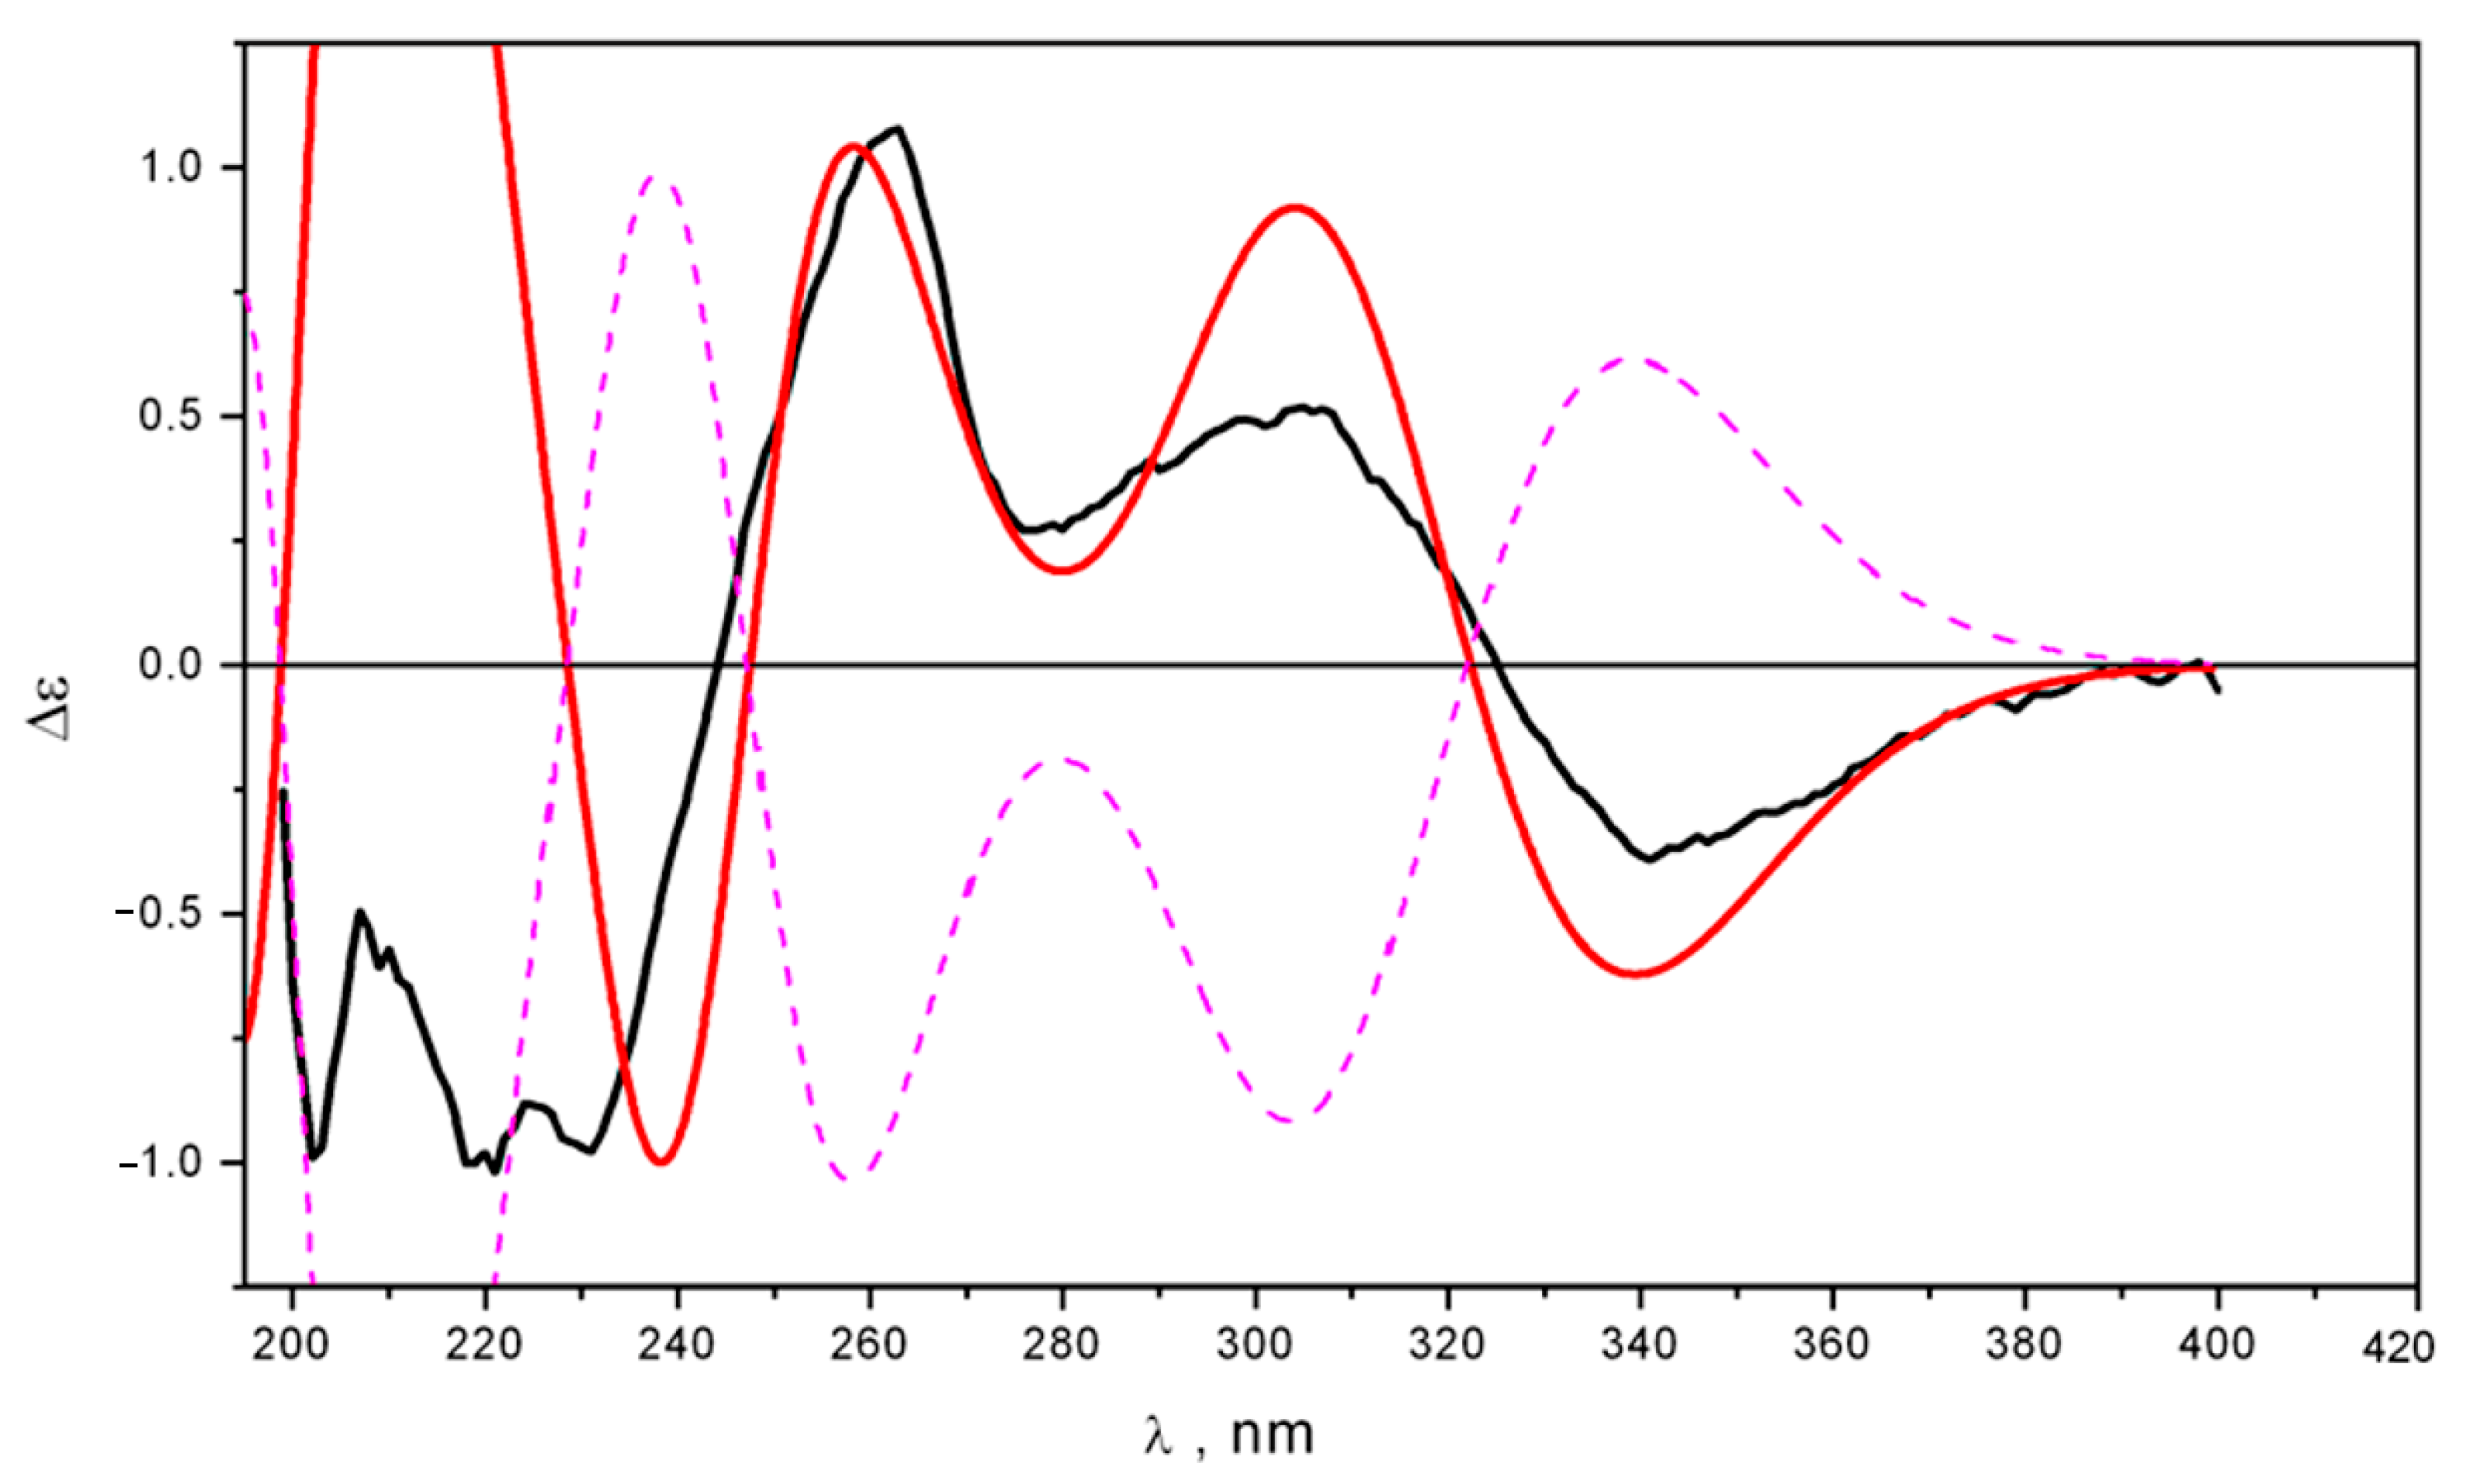
2.2. Structure Elucidation

The molecular formula of 1 was established to be C12H12O5 by HRESIMS (m/z 259.0576 [M + Na]+) (Figure S1) and was confirmed by 13C NMR analysis. A close inspection of 1H, 13C NMR (Table 1, Figures S2 and S3), DEPT, and HSQC data of 1 revealed the presence of two methyl groups (δH 1.60, δC 35.2), including one oxygen-bearing (δH 3.89, δC 56.9), three sp2 methines (δH 5.52, δC 99.6; δH 6.25, δC 102.4; δH 6.77, δC 106.1), an oxygenated quaternary sp3-carbon (δC 70.7), and five quaternary sp2-carbons (δC 107.5; δC 151.5), including four oxygen-bearing ones (δC 164.1, 164.4, 179.3, and 190.3). These data and seven degrees of unsaturation from the molecular formula suggest that compound 1 possesses two rings, including one aromatic system, one double bond, and one carbonyl. The HMBC correlations (Figure S7) from H-5 (δH 6.77) to C-4 (δC 70.7), C-7 (δC 102.4), C-8a (δC 107.5), and C-6 (δC 164.1); from H-7 (δH 6.25) to C-5 (δC 106.1) and C-8a; and from H-2 (δH 5.52) to C-4, C-8a, C-3 (δC 179.3), and C-1 (δC 190.3) revealed the structure of the naphthalenone framework with a Δ2 double bond and hydroxy groups at C-6 and C-8 in the ring A. The HMBC correlations from H3-9 (δH 1.60) to C-4, C-4a (δC 151.5), and C-3 established the location of the C-9 methyl group at C-4. The location of the methoxy group at C-3 was established based on the HMBC correlation from 3-OMe (δH 3.89) to C-3. The downfield chemical shift and remaining functionality of C-3 suggested an additional OH group at C-3. Thus, the planar structure of 1 was determined, and this compound was named sajaroketide A. It should be noted that sajaroketide A (1) is a derivative of the well-known fungal pentaketide flaviolin [19].
The molecular formula of 2 was established to be C13H14O5 by HRESIMS (m/z 273.0735 [M + Na]+) (Figure S1) and was confirmed by the 13C NMR spectrum. The 1H and 13C NMR data (Table 1, Figures S9–S14) observed for compound 2 closely resembled those obtained for 1, except for the additional methoxy group (δH 3.87, δC 55.9). The location of this group at C-6 was established based on the HMBC correlation from 6-OMe to C-6 (δC 166.1). Thus, the planar structure of 2 was determined to be the 6-O-methyl derivative of sajaroketide A, and this compound was named sajaroketide B.
Unfortunately, correlations in the ROESY spectrum were not informative and could not be used to establish the relative configurations of the stereocenters of 1 and 2. Thus, theoretical and experimental ECD spectra were compared to determine the absolute configurations of the chiral centers of sajaroketides A (1) and B (2). UV and ECD spectra were calculated for the most stable conformations of 1 and 2 using the time-dependent density functional theory (TDDFT_B3LYP). All calculations were performed with the Gaussian 16 suite of programs [20] using ultra-fine integration grids and very tight optimization convergence criteria.
The performed preliminary modeling showed that the signs and intensities of individual bands in their ECD spectra strongly depended on the large-amplitude motions (LAMs) occurring in these compounds—the internal rotations of hydroxy and methoxy groups around C(3)-O(3), C(4)-O(4), and C(6)-O(6) bonds, the tautomeric rearrangement, and the inversion-type motion of cycle “A”. For λ ≤ 240 nm, these dependencies complicated the task of the ECD spectral interpretation. The rigorous accounting of contributions from these LAMs to spectral properties must be performed based on some kind of intramolecular dynamics modeling—the Schrödinger equations for the motions along these LAMs’ degrees of freedom must be constructed and solved. This approach is far from the present standard theoretical scheme, which is generally used in a stereochemical analysis. An alternative to this is the approach where efforts are focused on the investigation of those parts of ECD spectra where individual bands are well separated and the influence of LAMs may be accounted for qualitatively and correctly, even based on the standard theoretical scheme with moderate improvements. The latter approach was used in this study, and the characteristic energy region chosen for the investigation was λ ≥ 230 nm. Calculations, performed at the “PCM level”, showed that conformation R-1_c1 was the most thermodynamically stable—its Gibbs free energy was minimal (Figure S42). The conformation 4R-1_c2 is less stable then 4R-1_c1 for about ΔG ≈ 0.45 kcal/mol. Figure 4 and Figure 5 demonstrate the UV and ECD spectra, respectively, for these two most stable conformations of 4R-1, calculated using TDDFT_B3LYP/cc-pvTz_PCM//B3LYP/cc-pvTz_PCM methods at the “PCM level” of theory.
While the UV spectra of 4R-1_c1 and 4R-1_c2 are nearly similar, their ECD spectra differ qualitatively in the 220 ≤ λ ≤ 270 nm region. The UV shift, obtained from a comparison of the theoretical statistically averaged and experimental UV spectra, was Δλ ≈ +7 nm. This UV shift value was used to construct the average ECD spectrum (Figure 5).
The theoretically averaged ECD spectrum of 4R-1 satisfactorily reproduced the experimental ECD spectrum of 1, except for the 200 ≤ λ ≤ 250 nm region. At the same time, the ECD spectrum of the “minor” conformer 4R-1_c2 was in very good agreement with the experiment at λ ≥ 230 nm. This may provide evidence that the PCM approach and standard theoretical scheme alone fail to account for the full measure of the compound-solvent interaction, and hence to correctly describe the thermodynamics of the conformational rearrangement process. To overcome these discrepancies, we used a more complex theoretical model, in which the direct modeling of sajaroketide A (1) interacting with two methanol molecules (4R-1&(CH3OH) × 2 and 4R-2&(CH3OH) × 2) was performed. The different variants of the intermolecular hydrogen-bond formation (IMHB) were modeled using the B3LYP/cc-pvTz_PCM approach. The optimized structures of the seven most stable conformations are shown in Figure S43.
We found that the thermodynamic equilibrium in cluster 4R-1&(CH3OH) × 2 was dislocated to the conformations of the 4R-1_c2 type (structures Direct_R-1_c–Direct_R-1_c5), and this prevalence governed the existence in the experimental ECD spectrum of the negative band at λ ≈ 230–240 nm. The relative intensities of the positive bands in the λ ≥ 255 nm diapason were also reproduced properly at the “direct level” than at the “PCM level” of theory (Figure 6). Therefore, the absolute structure of 1 is 4R (for demonstration, the theoretical ECD spectrum of 4S-1 is plotted in Figure 6 using a dashed line).
The experimental ECD and UV spectra of 2 were similar to those of 4R-1. A comparison of the theoretical ECD spectra of 4R-2 and 4S-2 calculated at the “direct level” of theory with the experimental one is shown in Figure 7. Spectra Δεexp and Δεcalc(4R-2) are in good qualitative agreement, while Δεcalc(4S-2) “fails” to reproduce experimental data throughout the diapason. Thus, the absolute structure of 2 is 4R (for demonstration, the theoretical ECD spectrum of 4S-2 is plotted in Figure 6 using a dashed line).
The molecular formula of compound 3 was determined to be C13H14O4 by HRESIMS (m/z 257.0788 [M + Na]+) (Figure S15), which corresponded to seven degrees of unsaturation. These data and a careful inspection of the 13C and 1H NMR spectra (Figures S16 and S17), including HSQC, HMBC, COSY, and DEPT experiments, as well as a comparison with the literature data, identify compound 3 as 7-hydroxy-2-(2′-hydroxypropyl)-5-methylchromone, a known metabolite of Penicillium solitum and P. griseofulvum [21,22,23]. A comparison of the specific optical rotation values of [α]D20 + 21.3 (for 3) and [α]D21 + 38.4 (for 7-hydroxy-2-(2′S-hydroxypropyl)-5-methylchromone in the literature data [22,24]) proved the absolute configuration of the stereo center in 3 as 2′S.
The structures of other isolated compounds were identified based on HRESIMS and NMR data with known fungal metabolites: altechromone A (4) [25], norlichexanthone (=fusarindin) (5) [26], griseoxanthone C (6) [27], 1,3,5,6-tetrahydroxy-8-methylxanthone (7) [10], griseofulvin (8), 6-O-desmethylgriseofulvin (9), dechlorogriseofulvin (10) [28], and 5,6-dihydro-4-methyl-2H-pyran-2-one (3-methyl-2-penten-5-olide) (11) [21].

2.3. Bioactivity of Isolated Compounds

2.3.1. Antimicrobial Activity

The effects of compounds 19 and 11 on urease enzyme activity as well as the growth of Staphylococcus aureus, Escherichia coli, and Candida albicans strains were tested, and the data are presented in Table 2. Compound 10 was not tested because its quantity was insufficient.
Urease is an important target for the treatment of urease-related bacterial infections [29]. In this study, several fungal metabolites showed a significant inhibition of urease activity in the cell-free test. So, the half-maximal inhibition of urease activity by norlichexanthone (5), griseofulvin (8), and 5,6-dihydro-4-methyl-2H-pyran-2-one (11) was observed at concentrations of 15.3, 10.1, and 11.4 µM, respectively (Table 2). New sajaroketide B (2), griseoxanthone C (6), and 1,3,5,6-tetrahydroxy-8-methylxanthone (7) inhibited urease activity by 50% at concentrations of 98.5, 97.3, and 100 µM, respectively. Compounds 1, 3, 4, and 9 had no effect on urease activity at concentrations of up to 100 µM.
New sajaroketide A (1) at 100 µM inhibited S. aureus and E. coli growth by 35.1% and 25.4%, respectively, whereas sajaroketide B (2) was inactive (Table 2). Chromone derivative 3, altechromone A (4), norlichexanthone (5), and griseofulvin (8) at concentrations of 100 µM inhibited S. aureus growth by 17.7%, 30.1%, 20.8%, and 11.5%, respectively. Moreover, compounds 4, 5, and 8 inhibited E. coli growth by 13.6%, 27.9%, and 16.8%, respectively. 6-O-Desmethylgriseofulvin (9) inhibited both S. aureus and E. coli growth by nearly 23%. Xanthon-related polyketide 7 at 100 µM inhibited only C. albicans growth by 15.4%. Compounds 6 and 11 did not affect the growth of all test strains.

2.3.2. Cytotoxic Activity

The cytotoxic activities of compounds 19 and 11 toward human hepatocarcinoma HepG2 and normal rat cardiomyocyte H9c2 cells were evaluated. Cell viability and the half-maximal concentration of the cytotoxic effects are presented in Table 3.
Sajaroketide A (1) at 100 µM decreased H9c2 cell viability by 34.6%. Sajaroketide B (2) at 100 µM decreased HepG2 and H9c2 cell viability values by 23.7% and 21.0%, respectively. Nevertheless, sajaroketides A (1) and B (2) were nontoxic to both cell lines at a concentration of 10 µM.
Chromone derivative 3 was non-toxic to HepG2 cells and decreased H9c2 cell viability by 25.7% at 100 µM. Altechromone A (4) was non-toxic to both cell lines at concentrations up to 100 µM.
Norlichexanthone (5) at 100 µM decreased HepG2 and H9c2 cell viability values by 47.4% and 51.0%, respectively; therefore, the IC50 was nearly 100 µM for both cell lines. Griseoxanthone C (6) at 100 µM decreased HepG2 and H9c2 cell viability values by 72.9% and 36.7%, respectively, and its IC50 was calculated as 64.7 µM for HepG2 cells and higher than 100 µM for H9c2 cells. Polyketide 7 at 100 µM decreased HepG2 and H9c2 cell viability values by 42.6 and 47.1 µM, respectively, so the IC50 was nearly 100 µM for both cell lines. Griseofulvin (8) at 100 µM diminished HepG2 cell viability by 60.1% and the IC50 was calculated as 77.8 µM. However, griseofulvin (8) at 100 µM decreased H9c2 cell viability only by 28.4%. Compound 11 at 100 µM affected HepG2 cell viability by 23.4% and did not affect H9c2 cell viability.

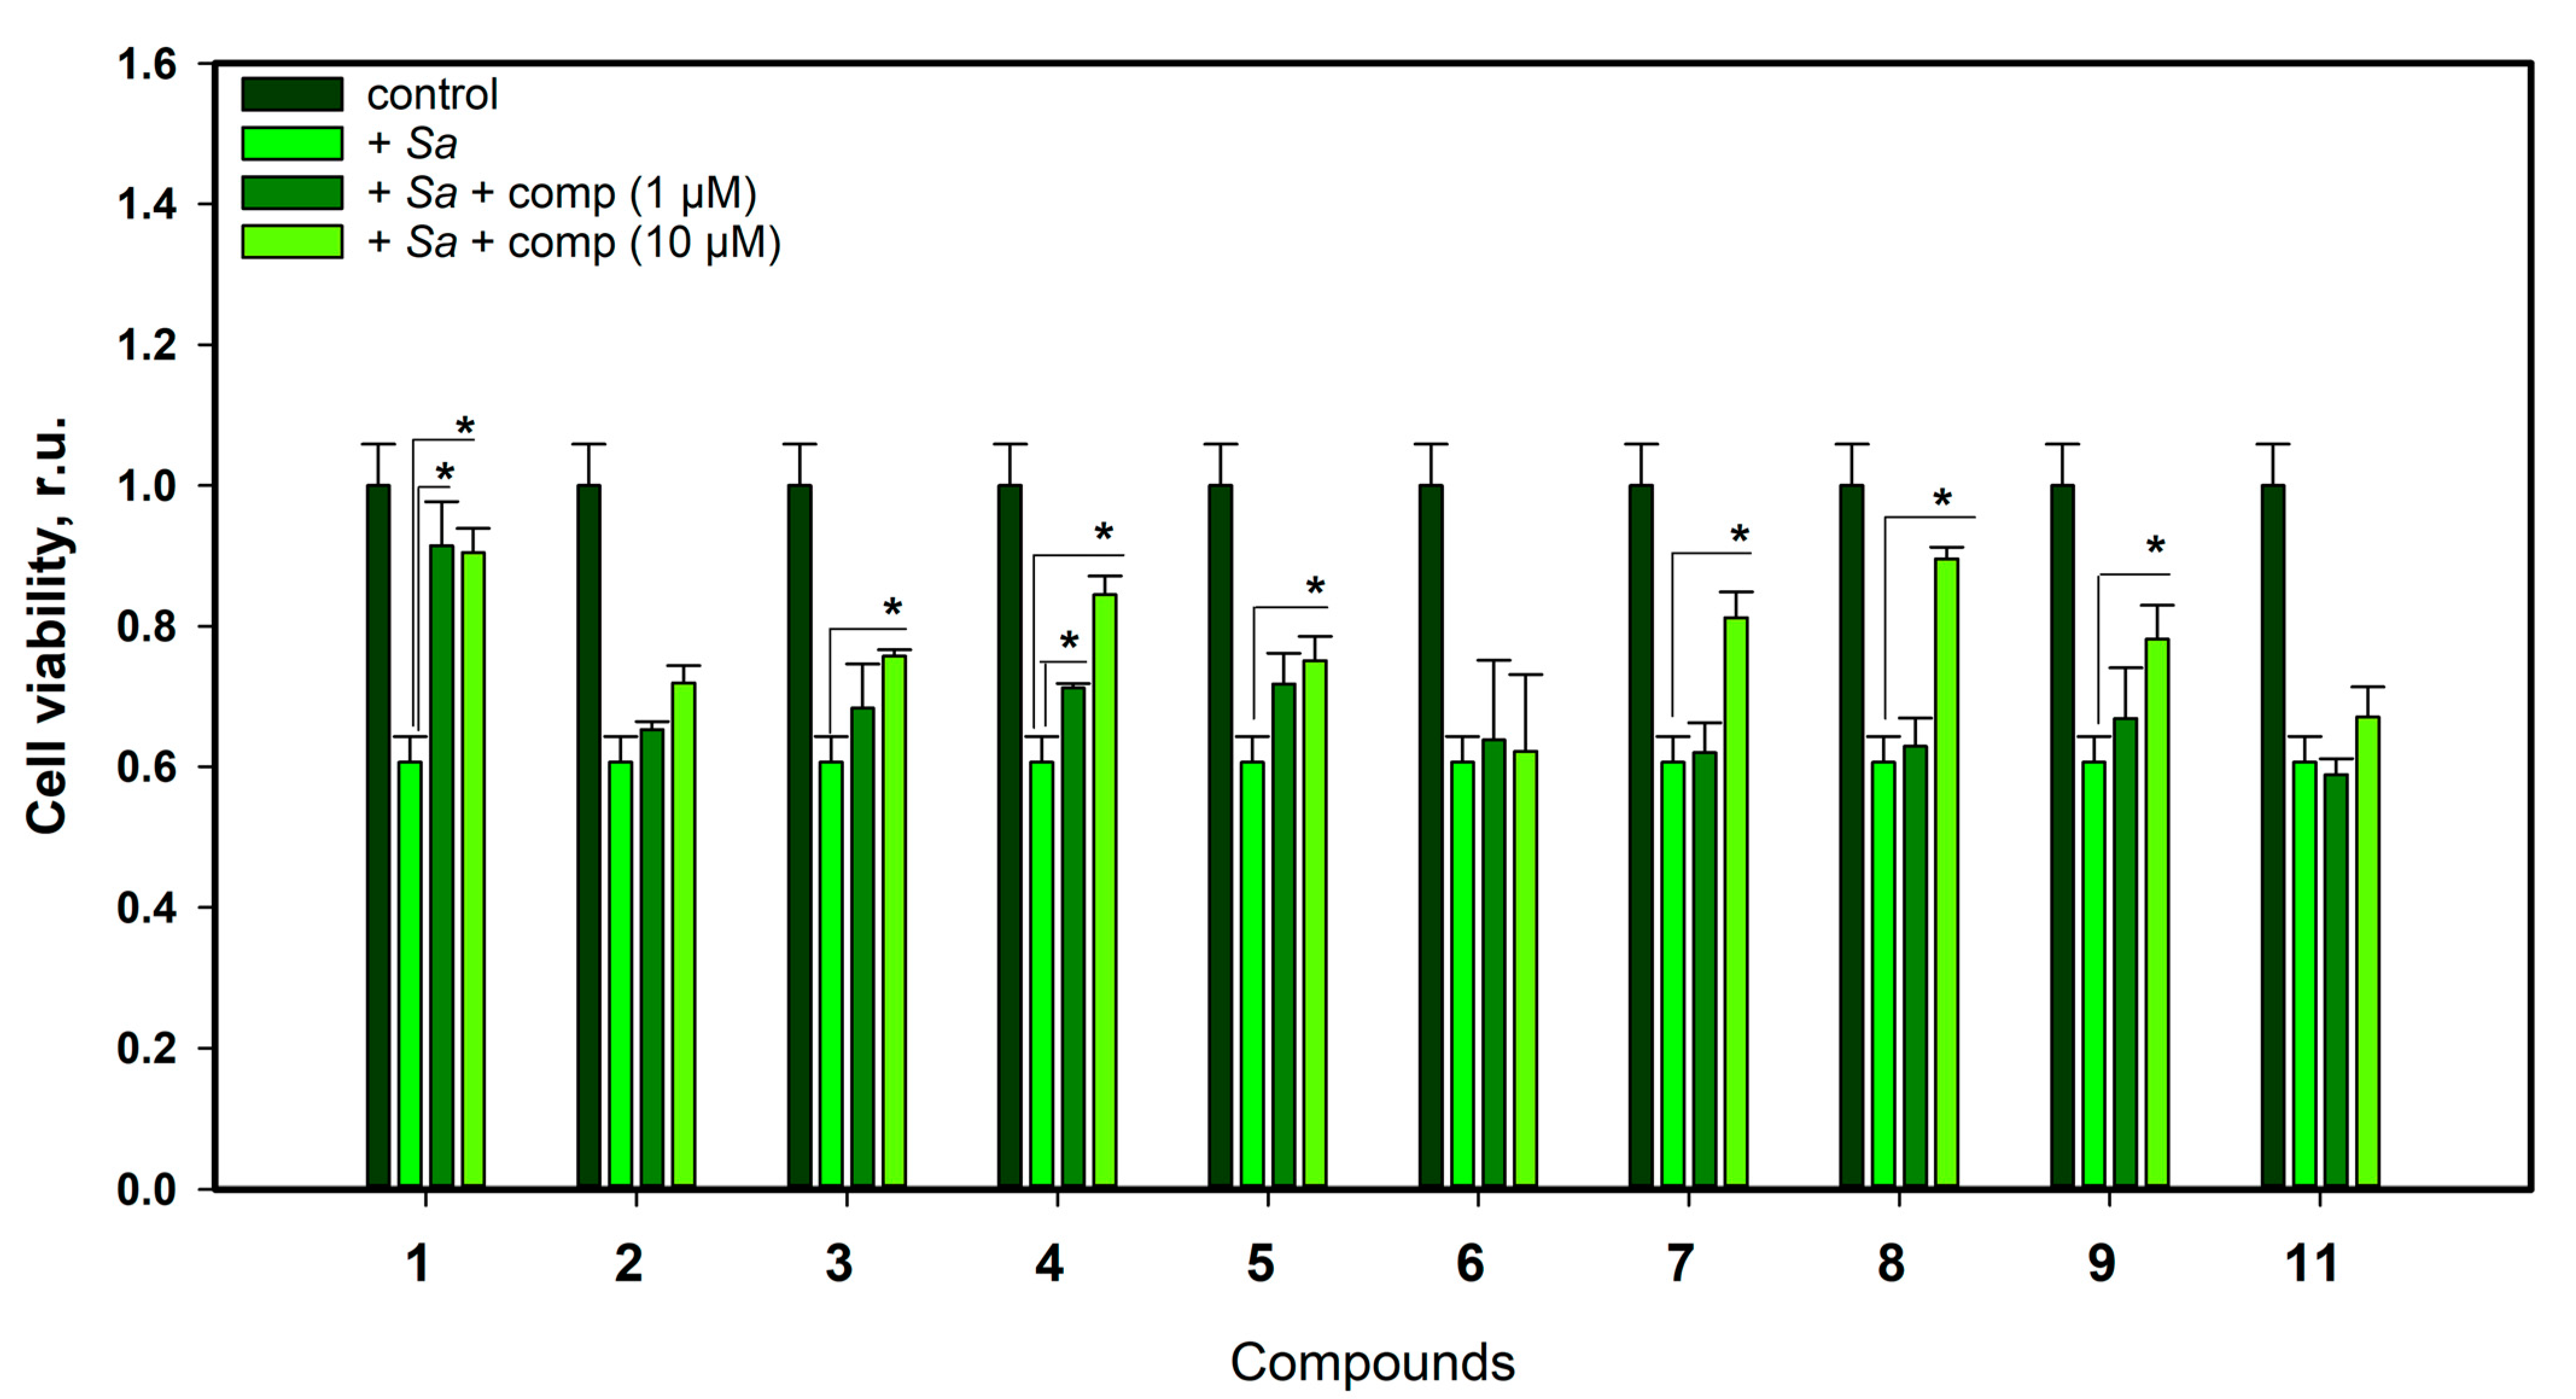
2.3.3. The Effect of Compounds against S. aureus Infection Damage of H9c2

The following step of the study was to determine the cytoprotective effects of compounds 19 and 11 in an in vitro model of infectious myocarditis when H9c2 cardiomyocytes were co-cultured with an S. aureus suspension. We treated S. aureus-infected H9c2 cells with the compounds 19 and 11 at concentrations of 1 and 10 µM and measured the viability of the cells by MTT as described in the Section 4 (Figure 8).
New sajaroketide A (1) increased the viability of S. aureus-infected H9c2 cardiomyocytes by 50.8% and 49.2% at 1 and 10 µM, respectively. Chromone derivative 3 at 10 µM increased the viability of these cells by 24.9%. Altechromone A (4) increased the viability of these cells by 17.4% and 39.9% at 1 and 10 µM, respectively. Norlichexanthone (5), xanthone derivative 7, griseofulvin (8), and 6-O-desmethylgriseofulvin (9) at 10 µM increased the viability of these cells by 23.9%, 33.9%, 47.7%, and 28.9%, respectively. Compounds 2, 6, and 11 did not show any statistical effect on the viability of S. aureus-infected H9c2 cardiomyocytes.

3. Discussion

Thus, 11 polyketides, including two new sajaroketides, A and B, were isolated from the natural complex of P. sajarovii KMM 4718 and A. protuberus KMM 4747 associated with sea urchin S. mirabilis.
The anti-infection effect of norlichexanthone (5) and griseofulvin (8) correlated with their influence on S. aureus growth and urease activity. Chromone derivative 3 and griseofulvin-related compound 9 did not show any effect on urease activity, but inhibited S. aureus growth and, so may have inhibited bacterial growth in the in vitro model of myocarditis. Xanthone derivative 7 did not show any effect on S. aureus growth, but inhibited the activity of urease, which might be of relevance to this case.
Griseofulvin is a known antifungal polyketide produced by various fungi [30]. It was approved by the Food and Drug Administration (FDA) in 1959 as an anti-dermatophyte drug with an anti-inflammatory effect, as well as improving coronary blood flow and decreasing blood pressure [31]. Moreover, the inhibition of tumor growth and several forms of cancer cell proliferation were found [32]. Griseofulvin, currently used per os for the treatment of scalp dermatophytosis, achieving smooth skin, and improving the nails, and our new data concerning its possibility to inhibit urease activity and its cardioprotective effect on in vitro infectious myocarditis are interesting subjects.
Sajaroketide A (1) and altechromone A (4) showed greater cytoprotective effects in these experiments. It has previously been published in the literature that altechromone A (4) was substantially active against Bacillus subtilis, Escherichia coli, Pseudomonas fluorescens, and Candida albicans with the MICs of 3.9, 3.9, 1.8, and 3.9 μg/mL, respectively [33]. In our experiments, altechromone A (4) not only inhibited the growth of S. aureus, but was also effective against the staphylococcal infection of cardiomyocytes H9c2. Sajaroketide A (1) inhibited the growth of S. aureus similar to altechromone A (4), but its effect on S. aureus-infected H9c2 cells was more significant at a concentration of 1 µM. The influences of 1 and 4 on urease activity were very poor, which indicated their effects on S. aureus defined by other mechanisms.
According to the Global Burden of Disease project, in 2019, 0.428 million cases of endocarditis were recorded worldwide and 0.0663 million of them led to the deaths of patients. Over 10 years (2010–2019), the number of cases increased by 29% and the number of deaths by 21.8%. In 2019, 4.06 million cases of cardiomyopathy and myocarditis of various origins were recorded worldwide, and almost 10% (0.34 million) of the cases resulted in the deaths of patients. Over 10 years (2010–2019), the number of cases increased by 20% and the number of deaths by 3.3%. It should be noted that a significant proportion (30%) of myocarditis was caused by alcohol intoxication, but drug damage and infectious effects (viral and bacterial) played a dominant role [34]. Thus, the discovery of new compounds effective against staphylococcal infections is a potential future study of sajaroketide A.

4. Materials and Methods

4.1. General Experimental Procedures

Optical rotations were measured on a PerkinElmer 343 polarimeter (PerkinElmer, Waltham, MA, USA) in MeOH. UV spectra were recorded on a Shimadzu UV-1601PC spectrometer (Shimadzu Corporation, Kyoto, Japan) in MeOH. ECD spectra were measured using a Chirascan-Plus CD Spectrometer (Leatherhead, UK) in MeOH. 1H and 13C NMR spectra were recorded in aceton-d6 on Bruker Avance-500 and Avance III-700 spectrometers (Bruker BioSpin GmbH, Rheinstetten, Germany) operating at 500 and 125 MHz and 700 and 176 MHz, respectively, using TMS as an internal standard. HRESIMS spectra were obtained using a Bruker maXis Impact II mass spectrometer (Bruker Daltonics GmbH, Rheinstetten, Germany).
Low-pressure liquid column chromatography was performed using Si gel KSK (50/100 μm, Imid Ltd., Krasnodar, Russia) and Gel ODS-A (12 nm, S—75 um, YMC Co., Ishikawa, Japan). Plates precoated with Si gel (5–17 μm, 4.5 × 6.0 cm, Imid) and Si gel60 RP-18 F254S (20 × 20 cm, Merck KGaA, Darmstadt, Germany) were used for thin-layer chromatography. Preparative HPLC was performed on Shimadzu LC-20 (Shimadzu, Kyoto, Japan) and Agilent 1100 (Agilent Technologies, Santa Clara, CA, USA) chromatographs using Shimadzu RID-20A (Shimadzu, Kyoto, Japan) and Agilent 1100 (Agilent Technologies, Santa Clara, CA, USA) refractometers and YMC ODS-AM (YMC Co., Ishikawa, Japan 5 μm, 250 × 10 mm), Synergi, Fusion-RP (Phenomenex, Torrance, CA, USA, 4 μm, 250 × 10 mm), Synergi, Hydro-RP (Phenomenex, 4 μm, 250 × 10 mm), and HyperClone ODS (Phenomenex, Torrance, CA, USA, 5 μm, 250 × 4.6 mm) columns.

4.2. Fungal Strains

The fungal culture used in this study was likely a natural fungal complex isolated from the aboral surface of the sea urchin S. mirabilis collected from the Sea of Japan (Troitsa bay). This complex is a co-culture of the filamentous fungi P. sajarovii and A. protuberus.
Initially, in the course of studying the metabolic profile of the fungal isolate, an isolate was selected that visually presented signs of a monoculture of P. sajarovii, both when growing on agar media for analytical cultivation (wort agar) and diagnostics (Czapek’s medium with yeast extract), and during further preparative cultivation on a medium with rice. During the microscopy of the culture, fragments of mycelium were found that did not belong to P. sajarovii and indicated the presence of a co-culture of a fungus of an unknown taxonomic affiliation, which was confirmed by a molecular genetic analysis. Subsequently, the components of the fungal complex were dispersed and their monocultures were obtained. The molecular genetic analysis of the second component of the fungal complex showed that it belonged to the species A. protuberus.
The resulting fungal strains were stored in the Collection of Marine Microorganisms (PIBOC FEB RAS, Vladivostok, Russia) as P. sajarovii KMM 4718 and A. protuberus KMM 4747.

4.3. DNA Extraction and Amplification

Genomic DNA were isolated from fungal mycelia (mycelium) grown on MEA (malt extract agar) at 25 °C for 7 days, using the MagJET Plant Genomic DNA Kit (Thermo Fisher Scientific, Waltham, MA, USA), according to the manufacturer’s protocol. PCR was conducted using GoTaq Flexi DNA Polymerase (Promega, Madison, WI, USA). For the amplification of the ITS regions, the standard primer pair ITS1 and ITS4 was used [35]. The reaction profile was an initial denaturation at 95 °C for 300 s, followed by 10 cycles of 95 °C for 20 s, 52 °C for 30 s, and 72 °C for 90 s; then 25 cycles of 95 °C for 20 s, 55 °C for 30 s, and 72 °C for 90 s; and finally 72 °C for 300 s. For the amplification of the partial BenA genes, the standard primer pair Bt-2a and Bt-2b were used [36]. The reaction profile was 95 °C for 300 s, 35 cycles of 95 °C for 20 s, 60 °C for 20 s, and 72 °C for 90 s, and finally 72 °C for 300 s. For the amplification of the partial CaM genes, the degenerate primer pair cal_P/A_F (5′-TCYGAGTACAAGGAGGCSTT-3′) and cal_P/A_R (5′-CCRATGGAGGTCATRACGTG-3′) were used. For the strain KMM 4718, the reaction profile was an initial denaturation at 95 °C for 300 s, followed by 10 cycles of 95 °C for 20 s, 60 °C for 30 s, and 72 °C for 90 s; then 25 cycles of 95 °C for 20 s, 65 °C for 30 s, and 72 °C for 90 s; and finally 72 °C for 300 s. For the strain KMM 4747, the reaction profile was 95 °C for 300 s, 35 cycles of 95 °C for 20 s, 65 °C for 30 s, and 72 °C for 90 s, and finally 72 °C for 300 s. For the amplification of the partial RPB2 gene of the strain KMM 4747, the degenerate primer pair rpb2_Asp_For (5′-ACCCGWGTCACCCGTGAYCTTCA-3′) and rpb2_Asp_R (5′-TACTYGGRTGRATCTCGCAGT-3′) were used. The reaction profile was an initial denaturation at 95 °C for 300 s, followed by 10 cycles of 95 °C for 20 s, 55 °C for 30 s, and 72 °C for 90 s; then 25 cycles of 95 °C for 20 s, 60 °C for 30 s, and 72 °C for 90 s; and finally 72 °C for 420 s. The amplified ITS, BenA, CaM, and RPB2 genes were purified with the ExoSAP-IT™ PCR Product Cleanup Reagent (Thermo Fisher Scientific, Waltham, MA, USA). Sequencing was bidirectionally performed with the same primers on an Applied Biosystems SeqStudio Genetic Analyzer (Thermo Fisher Scientific, Waltham, MA, USA) using the Big Dye Terminator reagent kit, version 3.1. The gene sequences were deposited in GenBank under accession numbers OR431843 (KMM 4718) and OR431842 (KMM 4747) for ITS, OQ466617 (KMM 4718) and OQ466615 (KMM 4747) for partial BenA, OR451997 (KMM 4718) and OR451996 (KMM 4747) for partial CaM, and OR451998 (KMM 4747) for partial RPB2 (Table 4).

4.4. Phylogenetic Analysis

The ITS region, partial BenA and CaM gene sequences, fungal strain KMM 4718, and members of genus Penicillium (Ramosum), series Lanosa, Raistrickiorum, Scabrosa, Soppiorum, and Virgata were aligned by MEGA X software version 11.0.9 [37] using the Clustal W algorithm. The ex-type homologs were searched in the GenBank database (http://ncbi.nlm.nih.gov) using the BLASTN algorithm (http://www.ncbi.nlm.nih.gov/BLAST, accessed on 20 July 2023). The phylogenetic analysis was conducted using MEGA X software [37]. The ITS region and partial BenA and CaM gene sequences were concatenated into one alignment. A phylogenetic tree was constructed according to the maximum likelihood (ML) algorithm based on a general time-reversible model [38]. The tree topology was evaluated by 1000 bootstrap replicates. The Talaromyces marneffei CBS 388.87 T strain was used in the phylogenetic analysis as an outgroup (Table 4).
The ITS region, partial BenA, CaM, and RPB2 gene sequences, fungal strain KMM 4747, and members of genus Aspergillus, series Versicolores, were aligned by MEGA X software version 11.0.9 [37] using the Clustal W algorithm. The search for the ex-type homologs and phylogenetic analysis were performed as described above. The ITS region and partial BenA, CaM, and RPB2 gene sequences were concatenated into one alignment. A phylogenetic tree was constructed according to the maximum likelihood algorithm based on the Kimura 2-parameter model [39]. The tree topology was evaluated by 1000 bootstrap replicates. The Talaromyces marneffei CBS 388.87T strain was used in the phylogenetic analysis as the outgroup (Table 4).

4.5. Cultivation of Penicillium sajarovii KMM 4718 and Aspergillus protuberus KMM 4747

The fungi were grown stationary at 22 °C for 21 days in 100 Erlenmeyer flasks (500 mL), each containing 20 g of rice, 20 mg of yeast extract, 10 mg of KH2PO4, and 40 mL of natural sea water (Marine Experimental Station of G.B. Elyakov Pacific Institute of Bioorganic Chemistry, Troitsa (Trinity) Bay, Sea of Japan).

4.6. Extraction and Isolation

At the end of the incubation period, the mycelia and medium were homogenized and extracted with EtOAc (3 L). The obtained extract was dried in vacuo. The residue was dissolved in H2O−EtOH (4:1) (500 mL) and was extracted with n-hexane (0.3 L × 4) and EtOAc (0.3 L × 10). After the evaporation of the EtOAc layer, the residual material (60.182 g) was passed over a silica column (4 × 55 cm), which was eluted followed by a step gradient from 100% n-hexane to EtOAc (total volume: 50 L). Fractions of 250 mL were collected and combined based on the TLC results (Si gel, toluene–isopropanol, 6:1 and 3:1). As a result, 2 fractions were obtained: Pr-4718-6 (1.735 g) and Pr-4718-9 (4.398 g).
The n-hexane–EtOAc (80:20) fraction (Pr-4718-6, 1.735 g) was purified on a Gel ODS-A column eluted with MeOH–H2O (80:20) to yield the subfraction Pr-4718-6-80 (1.320 g), which was purified on a YMC-ODS-AM column eluted with CH3CN−H2O (60:40) to yield subfractions Pr-4718-6-80-1 (126 mg) and Pr-4718-6-80-3 (89 mg). Subfraction Pr-4718-6-80-1 (126 mg) was purified on a Hydro column eluted with CH3CN−H2O (45:55) to yield 2 (5.9 mg), 4 (2.4 mg), and 11 (1.5 mg). Subfraction Pr-4718-6-80-3 (89 mg) was purified on a Hydro column eluted with CH3CN−H2O (80:20) to yield subfractions Pr-4718-6-80-3-I (19 mg) and Pr-4718-6-80-3-II (30 mg). Subfraction Pr-4718-6-80-3-I (19 mg) was purified on a HyperClone column eluted with CH3CN−H2O (50:50) to yield 5 (8.2 mg). Subfraction Pr-4718-6-80-3-II (30 mg) was purified on a HyperClone column eluted with CH3CN−H2O (60:40) to yield 6 (7.9 mg).
The n-hexane–EtOAc (80:20) fraction (Pr-4718-9, 4.398 g) was purified on a Gel ODS-A column eluted with MeOH–H2O (80:20) to yield the subfraction Pr-4718-9-80 (2.118 g), which was purified on a YMC-ODS-AM column eluted with CH3CN−H2O (60:40) to yield subfraction Pr-4718-9-80-1 (239.7 mg). Subfraction Pr-4718-9-80-1 (239.7 mg) was purified on a Hydro column eluted with CH3CN−H2O (40:60) to yield subfractions Pr-4718-9-80-1-I (164.3 mg), Pr-4718-9-80-1-2 (4.9 mg), Pr-4718-9-80-1-3 (11.5 mg), and Pr-4718-9-80-1-10 (4.4 mg). Subfraction Pr-4718-9-80-1-2 was purified on a Hydro column eluted with CH3OH−H2O (65:35) and CH3CN−H2O (40:60) to yield 9 (2.5 mg). Subfraction Pr-4718-9-80-1-3 was purified on a Hydro column with CH3CN−H2O−TFA (50:50:0.1) to yield 7 (4.5 mg). Subfraction 4718-9-80-1-10 was purified on a YMC NEA (R)-NP column eluted with CH3OH−H2O (40:60) to yield 10 (1.0 mg). Subfraction Pr-4718-9-80-1-I (164.3 mg) was purified on a Hydro column eluted with CH3OH−H2O−TFA (55:45:0.1) to yield 1 (4.0 mg) and 3 (6.4 mg). Compound 8 (19 mg) was obtained by the crystallization of a poorly soluble precipitate from fraction Pr-4718-9.

4.7. Spectral Data

Sajaroketide A (1): yellow amorphous; [α]D 20 −1.38 (c 0.14 MeOH); UV (MeOH) λmax (log ε) 205 (4.67), 247 (4.02), 240 (3.99), 337 (3.77) and 277 (3.48) nm; CD (c 0.00022 M, MeOH), λmax (∆ε) 202 (−1.35), 218 (−1.37), 231 (−1.33), 263 (+1.47), 289 (+0.55), 300 (+0.67), 305 (+0.71), 307 (+0.70) and 340 (−0.52) nm; 1H and 13C NMR data, see Table 1, Supplementary Figures S2–S7; HRESIMS [M + Na]+ m/z 259.0576 (calcd. for C12H12O5Na 259.0577, ∆-0.4 ppm) (Figure S1).
Sajaroketide B (2): yellow amorphous; [α]D 20 +3.12 (c 0.19 MeOH); UV (MeOH) λmax (log ε) 275 (4.85), 238 (4.18), 247 (4.22), 338 (4.06) and 275 (3.56) nm; CD (c 0.00018 M, MeOH), λmax (∆ε) 204 (−0.26), 219 (−1.32), 229 (−1.60), 262 (+1.91), 294 (+0.86), 340 (−0.22), 364 (−0.49) and 273 (−0.27) nm; 1H and 13C NMR data, see Table 1, Supplementary Figures S9–S14; HRESIMS [M + Na]+ m/z 273.0735 (calcd. for C13H14O5Na 373.0733, ∆-0.6 ppm) (Figure S8).
(2′S)-7-hydroxy-2-(2′-hydroxypropyl)-5-methylchromone (3): yellow amorphous; [α]D 20 +21.3 (c 0.19 MeOH); UV (MeOH) λmax (log ε) 213 (3.39), 250 (3.33), 197 (3.31), 202 (3.28), 238 (3.27) and 259 (2.67) nm; CD (c 0.00063 M, MeOH), λmax (∆ε) 211 (-0.05), 224 (+0.58), 243 (+0.02), 250 (-1.12), 257 (+0.14), 273 (+0.32); 279 (+0.32), 289 (+0.32) nm; 1H NMR spectrum (500 MHz; acetone-d6; δ, ppm; J in Hz) 6.69 (1H, s, H-8), 6.66 (1H, s, H-6), 5.97 (1H, s, H-3), 4.20 (1H, m, H-2′), 2.71 (3H, s, H3-9), 2.66 (1H, dd, J = 14.5, 5.2, Ha-2′), 2.62 (1H, dd, J = 14.5, 5.2, Hb-2′), 1.25 (3H, d, J = 6.2, H3-3′) (Figure S16); 13C NMR spectrum (125 MHz; acetone-d6; δ, ppm) 179.4 (C-4), 165.5 (C-2), 161.5 (C-7), 160.6 (C-8a), 143.1 (C-5), 117.1 (C-6), 116.3 (C-4a), 112.8 (C-4), 101.6 (C-8), 65.5 (C-2′), 44.2 (C-1′), 23.7 (C-3′), 22.8 (C-9) (Figure S17); [M–H]- m/z 233.0820 (calcd. for C13H13O4 233.0819, ∆-0.4 ppm), HRESIMS [M + Na]+ m/z 257.0788 (calcd. for C13H14O4Na 357.0784, ∆-1.3 ppm (Figure S15).
Altechromone A (4): yellow amorphous; 1H NMR spectrum (500 MHz; acetone-d6; δ, ppm; J in Hz) 6.67 (1H, d, J = 2.2, H-8), 6.66 (1H, dd, J = 2.2, 0.7, H-6), 5.91 (1H, d, J = 0.7, H-3), 2.70 (3H, brs, H3-9), 2.28 (3H, d, J = 0.7, H3-10) (Figure S19); 13C NMR spectrum (125 MHz; acetone-d6; δ, ppm) 179.3 (C-4), 164.5 (C-2), 161.6 (C-7), 160.6 (C-8a), 143.1 (C-5), 117.1 (C-6), 116.0 (C-4a), 111.8 (C-4), 101.6 (C-8), 22.8 (C-9), 19.7 (C-10) (Figure S20); HRESIMS [M + Na]+ m/z 213.0522 (calcd. for C11H10O3Na 213.0522, ∆ 0.0 ppm; [M–H]- m/z 189.0559 (calcd. for C11H10O3 189.0557, ∆-1.1 ppm) (Figure S18).
Norlichexanthone (5): yellow amorphous; 1H NMR spectrum (500 MHz; acetone-d6; δ, ppm; J in Hz) 13.4 (1H, s, 1-OH), 6.70 (1H, brs, H-5), 6.70 (1H, brs, H-7), 6.30 (1H, d, J = 2.0, H-4), 6.19 (1H, d, J = 2.0, H-2), 2.78 (3H, s, 8-CH3) (Figure S22); 13C NMR spectrum (125 MHz; acetone-d6; δ, ppm) 181.7 (C-9), 164.2 (C-3), 163.6 (C-1), 162.2 (C-6), 158.9 (C-5a), 156.7 (C-4a), 143.1 (C-4a), 115.6 (C-7), 111.3 (C-8a), 102.5 (C-1a), 100.2 (C-5), 97.4 (C-2), 92.7 (C-4), 22.0 (8-CH3) (Figure S23); HRESIMS [M + Na]+ m/z 213.0522 (calcd. for C11H10O3Na 213.0522, ∆ 0.0 ppm; [M–H]- m/z 189.0559 (calcd. for C11H9O3 189.0557, ∆-1.1 ppm) (Figure S21).
Griseoxanthone C (6): orange amorphous; 1H NMR spectrum (300 MHz; acetone-d6; δ, ppm; J in Hz) 13.4 (1H, s, 1-OH), 6.71 (1H, brs, H-5), 6.71 (1H, brs, H-7), 6.40 (1H, d, J = 2.5, H-4), 6.25 (1H, d, J = 2.5, H-2), 2.78 (3H, s, 8-CH3) (Figure S25); 13C NMR spectrum (75 MHz; acetone-d6; δ, ppm) 181.7 (C-9), 167.1 (C-3), 164.7 (C-1), 163.6 (C-6), 160.4 (C-5a), 158.0 (C-4a), 144.6 (C-8), 117.0 (C-8a), 112.7 (C-7), 104.4 (C-1a), 101.6 (C-5), 97.6 (C-2), 92.6 (C-4), 56.3 (3-OCH3), 23.4 (8-CH3) (Figure S26); HRESIMS [M + Na]+ m/z 295.0575 (calcd. for C15H12O5Na 295.0577, ∆ 0.6 ppm; [M–H]- m/z 271.0612 (calcd. for C15H11O5 271.0612, ∆-0.1 ppm) (Figure S24).
1,3,5,6-Tetrahydroxy-8-methylxanthone (7): yellow amorphous 1H NMR spectrum (700 MHz; acetone-d6; δ, ppm; J in Hz) 13.4 (1H, s, 1-OH), 6.72 (1H, brs, H-7), 6.38 (1H, d, J = 2.2, H-4), 6.19 (1H, d, J = 2.2, H-2), 2.72 (3H, s, 8-CH3) (Figure S28); 13C NMR spectrum (175 MHz; acetone-d6; δ, ppm) 183.5 (C-9), 165.0 (C-3), 164.4 (C-1), 157.9 (C-4a), 150.9 (C-6), 148.0 (C-5a), 133.1 (C-8), 131.4 (C-5), 116.1 (C-7), 112.8 (C-8a), 103.6 (C-1a), 98.7 (C-2), 94.2 (C-4), 22.7 (8-CH3) (Figure S29); HRESIMS [M + Na]+ m/z 297.0372 (calcd. for C14H10O6Na 297.0370, ∆ -0.7 ppm; [M–H]- m/z 273.0409 (calcd. for C15H9O6 273.0405, ∆-1.5 ppm); [M + H]+ m/z 275.0553 (calcd. for C15H11O6 275.0550, ∆-0.9 ppm) (Figure S27).
Griseofulvin (8): colorless powder; 1H NMR spectrum (700 MHz; CDCl3; δ, ppm; J in Hz) 6.12 (1H, s, H-5), 5.53 (1H, s, H-3′), 4.02 (3H, s, 6-OCH3), 3.97 (3H, s, 4-OCH3), 3.60 (3H, s, 2′-OCH3), 3.01 (1H, dd, J = 16.8, 13.5, Ha-5′), 2.82 (1H, m, H-6′), 2.42 (1H, dd, J = 16.8, 4.7, Hb-5′), 0.95 (3H, d, J= 6.7, H-7′) (Figure S31); 13C NMR spectrum (175 MHz; CDCl3; δ, ppm) 197.1 (C-4′), 192.6 (C-3), 170.9 (C-2′), 169.7 (C-7a), 164.8 (C-6), 157.9 (C-4), 105.3 (C-3a), 105.0 (C-3′), 97.5 (C-7), 90.9 (C-1′), 89.7 (C-5), 57.1 (6-OCH3), 56.8 (2′-OCH3), 56.5 (4-OCH3), 40.2 (C-5′), 36.6 (C-6′), 14.4 (C-7′) (Figure S32); HRESIMS [M + Na]+ m/z 375.0613 (calcd. for C17H17ClO6Na 375.0606, ∆ -1.8 ppm; [M + H]+ m/z 353.0793 (calcd. for C17H18ClO6 353.0786, ∆-2.0 ppm) (Figure S30).
6-O-Desmethylgriseofulvin (9): yellow amorphous; 1H NMR spectrum (500 MHz; acetone-d6; δ, ppm; J in Hz) 6.50 (1H, s, H-5), 5.57 (1H, s, H-3′), 3.90 (3H, s, 4-OCH3), 3.72 (3H, s, 2′-OCH3), 2.88 (1H, m, Ha-5′), 2.85 (1H, m, H-6′), 2.39 (1H, d, J = 12.4, Hb-5′), 0.96 (3H, d, J = 6.7, H-7′) (Figure S34); 13C NMR spectrum (125 MHz; acetone-d6; δ, ppm) 196.8 (C-4′), 192.7 (C-3), 172.4 (C-2′), 171.9 (C-7a), 165.5 (C-6), 159.4 (C-4), 106.0 (C-3′), 105.9 (C-3a), 96.8 (C-7), 95.7 (C-5), 92.1 (C-1′), 58.0 (2′-OCH3), 57.3 (4-OCH3), 41.4 (C-5′), 37.9 (C-6′), 15.2 (C-7′) (Figure S35); HRESIMS [M + Na]+ m/z 362.0450 (calcd. for C16H15ClO6Na 361.0449, ∆ -0.3 ppm; [M–H]- m/z 337.0483 (calcd. for C16H14ClO6 337.0484, ∆ 0.3 ppm) (Figure S33).
Deschlorogriseofulvin (10): yellow amorphous; 1H NMR spectrum (500 MHz; acetone-d6; δ, ppm; J in Hz) 6.24 (1H, d, J = 1.9, H-5), 6.39 (1H, d, J = 1.9, H-7), 5.54 (3H, brs, H-3′), 3.99 (3H, s, 6-OCH3), 3.93 (3H, s, 4-OCH3), 3.71 (3H, s, 2′-OCH3), 2.89 (1H, m, Ha-5′), 2.77 (1H, m, H-6′), 2.34 (1H, dd, J = 16.3, 4.6, Hb-5′), 0.94 (3H, d, J = 6.6, H-7′) (Figure S37); 13C NMR spectrum (125 MHz; acetone-d6; δ, ppm) 196.8 (C-4′), 193.0 (C-3), 177.6 (C-7a), 172.8 (C-2′), 172.1 (C-6), 160.8 (C-4), 105.8 (C-3′), 105.7 (C-3a), 94.7 (C-7), 91.2 (C-1′), 90.4 (C-5), 57.8 (2′-OCH3), 57.5 (6-OCH3), 57.1 (4-OCH3), 41.4 (C-5′), 38.0 (C-6′), 15.3 (C-7′) (Figure S38); HRESIMS [M + Na]+ m/z 341.1008 (calcd. for C17H18O6Na 341.0996, ∆ -3.5 ppm; [M + H]+ m/z 319.1187 (calcd. for C17H19O6 319.1176, ∆-3.4 ppm) (Figure S36).
5,6-Dihydro-4-methyl-2H-pyran-2-one (11): colorless amorphous; 1H NMR spectrum (500 MHz; acetone-d6; δ, ppm; J in Hz) 5.70 (1H, q, J = 1.5, H-3), 4.32 (1H, d, J = 6.3, Ha-6), 4.31 (1H, d, J = 6.3, Hb-6), 2.42 (1H, d, J = 6.5, Ha-5), 2.41 (1H, d, J = 6.5, Hb-5), 1.99 (3H, brs, H3-7) (Figure S40); 13C NMR spectrum (125 MHz; acetone-d6; δ, ppm) 164.5 (C-2), 159.4 (C-4), 66.5 (C-6), 28.7 (C-5), 22.7 (C-4) (Figure S41); HRESIMS [M + Na]+ m/z 135.0413 (calcd. for C6H8O2Na 135.0417, ∆ 2.8 ppm) (Figure S39).

4.8. Quantum-Chemical Modeling

The quantum-chemical modeling of the geometry and spectroscopic properties of compounds 1 and 2 were performed using the Gaussian 16 package of programs [20]. Geometry optimizations and calculations of the IR spectra were conducted with B3LYP exchange-correlation functional, the polarization continuum model (PCM), and 6-311+G(d,p) and cc-pvTz split-valence basis sets.
The statistical weights (gim) of conformations were calculated via Gibbs free energies:
g i m = e Δ G i m / R T i e Δ G i m / R T
where index “m” denotes the most stable conformation and ΔGim = Gi − Gm are the relative Gibbs free energies.
The ECD spectra were calculated using the time-dependent density functional theory (TDDFT), B3LYP functional, PCM model, and cc-pvTz basis set. Thirty electronic transitions were calculated for each conformation of 1 and 2. The individual bands in the theoretical spectra were simulated as a Gauss-type functions with the bandwidth ζ = 0.28 eV. The UV shift Δλ = +7 nm was used for the best correspondence between the experimental and calculated spectra for 1 and 2.

4.9. Urease Inhibition Assay

A reaction mixture consisting of 25 µL of enzyme solution (urease from Canavalia ensiformis, Sigma, 1U final concentration) and 5 µL of test compounds dissolved in water (10–300.0 µM final concentration) was preincubated at 37 °C for 60 min in 96-well plates. Then, 55 µL of phosphate-buffered solution with 100 µM of urea was added to each well and incubated at 37 °C for 10 min. The urease inhibitory activity was estimated by determining ammonia production using the indophenol method. Briefly, 45 µL of phenol reagent (1% w/v phenol and 0.005% w/v sodium nitroprusside) and 70 µL of alkali reagent (0.5% w/v NaOH and 0.1% active chloride NaClO) were added to each well. The absorbance was measured after 50 min at 630 nm using a MultiskanFS microplate reader (Thermo Scientific Inc., Beverly, MA, USA). All reactions were performed in triplicate in a final volume of 200 µL. The pH was maintained at 7.3–7.5 in all assays. DMSO 5% was used as a positive control.

4.10. Antimicrobial Activity

The yeast-like fungi of Candida albicans KMM 455 and bacterial strains Staphylococcus aureus ATCC 21027 and Escherichia coli VKPM (B-7935) (Collection of Marine Microorganisms PIBOC FEB RAS) were cultured on solid-medium Mueller Hinton broth with agar (16.0 g/L) in a Petri dish at 37 °C for 24 h.
The assays were performed in 96-well microplates in appropriate Mueller Hinton broth. Each well contained 90 µL of bacterial or of a yeast-like fungi suspension (109 CFU/mL). Then, 10 µL of a compound diluted at concentrations ranging from 1.5 to 100.0 µM using a 2-fold dilution was added (DMSO concentration < 1%). Culture plates were incubated overnight at 37 °C, and the OD620 was measured using a Multiskan FS spectrophotometer (Thermo Scientific Inc., Beverly, MA, USA). The antibiotic gentamicin and antifungal agent nitrofungin were used as positive controls at 1 mg/mL; 1% DMSO in PBS served as a negative control.

4.11. Cell Culture

The rat cardiomyocyte H9c2 cells were kindly provided by Prof. Dr. Gunhild von Amsberg from the Martini-Klinik Prostate Cancer Center, University Hospital Hamburg-Eppendorf, Hamburg, Germany. The human hepatocarcinoma cell HepG2 was obtained from ATCC.
The HepG2 and H9c2 cells were cultured in DMEM medium (Biolot, St. Petersburg, Russia) containing 10% fetal bovine serum (Biolot, St. Petersburg, Russia) and 1% penicillin/streptomycin (Biolot, St. Petersburg, Russia) at 37 °C in a humidified atmosphere with 5% (v/v) CO2.

4.12. Cell Viability Assay

The HepG2 and H9c2 cells were seeded at concentrations of 5× 10³ and 3×10³ cell/well, respectively, and the experiments were started after 24 h. The compounds at concentrations up to 100 µM were added into the wells for 24 h, and the viability of the cells was measured by an MTT (3-(4,5-dimethylthiazol-2-yl)-2,5-diphenyltetrazolium bromide) assay, which was performed according to the manufacturer’s instructions (Sigma-Aldrich, Munich, Germany). All compounds were dissolved with DMSO so that the final concentration of DMSO in the cell culture was not more than 1%. Moreover, DMSO was used as a control. The absorbance of the resulting solution was measured at 570 nm with a microplate reader MultiscanFC (ThermoLabsystems Inc., Beverly, MA, USA). The results are presented as a percent of the control data and calculated IC50.

4.13. Staphylococcus aureus-Induced Infection of H9c2 Cardiomyocytes

The H9c2 cells were seeded at concentrations of 3 × 10³ cell/well. After 24 h, the cell culture media was changed with an S. aureus bacterial suspension (102 CFU/mL) prepared in full DMEM culture media. The investigated compounds at concentrations of 1 and 10 µM were added after 1 h and the cells were incubated for 48 h. The S. aureus suspension with compounds at the same concentrations was used as a control. MTT reagent was added to all wells and formazan production was detected with the microplate reader MultiscanFC (ThermoLabsystems Inc., Beverly, MA, USA). The viability of S. aureus-infected cells was calculated as:
Viability, relative units = (OD cells+Sa +comp − OD Sa+comp)/(OD cells+Sa − OD Sa)

4.14. Statistical Data Evaluation

All the data were obtained in three independent replicates, and the calculated values are expressed as a mean ± standard error mean (SEM). Student’s t-test was performed using SigmaPlot 14.0 (Systat Software Inc., San Jose, CA, USA) to determine the statistical significance. Differences were considered statistically significant at p < 0.05.

5. Conclusions

Thus, we reported the isolation and structure elucidation of two new polyketides, sajaroketides A (1) and B (2), together with known (2′S)-7-hydroxy-2-(2′-hydroxypropyl)-5-methylchromone (3), altechromone A (4), norlichexanthone (fusarindin) (5), griseoxanthone C (6), 1,3,5,6-tetrahydroxy-8-methylxanthone (7), griseofulvin (8), 6-O-desmethylgriseofulvin (9), dechlorogriseofulvin (10), and 5,6-dihydro-4-methyl-2H-pyran-2-one (11) from the natural complex of the marine-derived fungal strains Penicillium sajarovii KMM 4718 and Aspergillus protuberus KMM 4747 isolated from the sea urchin Scaphechinus mirabilis (Sea of Japan). The fungal strains P. sajarovii KMM 4718 and A. protuberus KMM 4747 were identified as and based on three molecular markers, ITS, BenA, CaM regions, as well as the RPB2 region for KMM 4747. The absolute configurations of the new compounds 1 and 2 were elucidated by quantum chemical calculations. The effects of these compounds on urease activity and the growth of Staphylococcus aureus, Escherichia coli, and Candida albicans were found. Sajaroketide A, altechromone A, and griseofulvin showed significant cardioprotective effects in an in vitro model of S. aureus-induced infectious myocarditis.

Supplementary Materials

The following supporting information can be downloaded at: https://www.mdpi.com/article/10.3390/ijms242316568/s1.

Author Contributions

Conceptualization, E.V.L. and A.N.Y.; methodology, E.V.L., D.V.B. and E.A.Y.; software, D.V.B.; investigation, D.V.B., E.A.Y., A.S.A., G.V.B., N.N.K., V.E.C., A.I.K., R.S.P., Y.V.K., E.A.C. and A.R.C.; resources, M.P.I. and A.N.Y.; data curation, E.V.L., E.A.Y., N.N.K., V.E.C. and R.S.P.; writing—original draft preparation, E.V.L., D.V.B. and E.A.Y.; writing—review and editing, A.N.Y.; visualization, E.V.L., D.V.B. and E.A.Y.; supervision, M.P.I. and A.N.Y.; project administration, E.V.L.; funding acquisition, M.P.I. All authors have read and agreed to the published version of the manuscript.

Funding

This research was funded by a grant from the Ministry of Science and Higher Education of Russian Federation 15.BRK.21.0004 (Contract No.: 075-15-2021-1052).

Institutional Review Board Statement

Not applicable.

Informed Consent Statement

Not applicable.

Data Availability Statement

The original data presented in the study are included in the article/Supplementary Materials; further inquiries can be directed to the corresponding authors.

Acknowledgments

This study was conducted using the equipment of the Collective Facilities Center “The Far Eastern Center for Structural Molecular Research (NMR/MS) PIBOC FEB RAS” and using the Collective Facilities Center “Collection of Marine Microorganisms PIBOC FEB RAS”.

Conflicts of Interest

The authors declare no conflict of interest.

References

  1. Zhou, J.; Lao, Y.-M.; Song, J.-T.; Jin, H.; Zhu, J.-M.; Cai, Z.-H. Temporal heterogeneity of microbial communities and metabolic activities during a natural algal bloom. Water Res. 2020, 183, 116020. [Google Scholar] [CrossRef]
  2. Liu, C.; Kakeya, H. Cryptic Chemical communication: Secondary metabolic responses revealed by microbial co-culture. Chem. Asian J. 2020, 15, 327–337. [Google Scholar] [CrossRef]
  3. Chen, J.; Zhang, P.; Ye, X.; Wei, B.; Emam, M.; Zhang, H.; Wang, H. The structural diversity of marine microbial secondary metabolites based on co-culture strategy: 2009–2019. Mar. Drugs 2020, 18, 449. [Google Scholar] [CrossRef]
  4. Li, X.; Xu, H.; Li, Y.; Liao, S.; Liu, Y. Exploring diverse bioactive secondary metabolites from marine microorganisms using co-culture strategy. Molecules 2023, 28, 6371. [Google Scholar] [CrossRef]
  5. Zhuravleva, O.I.; Belousova, E.B.; Oleinikova, G.K.; Antonov, A.S.; Khudyakova, Y.V.; Rasin, A.B.; Popov, R.S.; Menchinskaya, E.S.; Trinh, P.T.H.; Yurchenko, A.N.; et al. Cytotoxic drimane-type sesquiterpenes from co-culture of the marine-derived fungi Aspergillus carneus KMM 4638 and Beauveria felina (=Isaria felina) KMM 4639. Mar. Drugs 2022, 20, 584. [Google Scholar] [CrossRef]
  6. Afiyatullov, S.S.; Zhuravleva, O.I.; Antonov, A.S.; Berdyshev, D.V.; Pivkin, M.V.; Denisenko, V.A.; Popov, R.S.; Gerasimenko, A.V.; von Amsberg, G.; Dyshlovoy, S.A.; et al. Prenylated indole alkaloids from co-culture of marine-derived fungi Aspergillus sulphureus and Isaria felina. J. Antibiot. 2018, 71, 846–853. [Google Scholar] [CrossRef]
  7. Zhuravleva, O.I.; Kirichuk, N.N.; Denisenko, V.A.; Dmitrenok, P.S.; Yurchenko, E.A.; Min′ko, E.M.; Ivanets, E.V.; Afiyatullov, S.S. New diorcinol J produced by co-cultivation of marine fungi Aspergillus sulphureus and Isaria felina. Chem. Nat. Comp. 2016, 52, 227–230. [Google Scholar] [CrossRef]
  8. Houbraken, J.; Kocsube, S.; Visagie, C.M.; Yilmaz, N.; Wang, X.C.; Meijer, M.; Kraak, B.; Hubka, V.; Bensch, K.; Samson, R.A.; et al. Classification of Aspergillus, Penicillium, Talaromyces and related genera. Stud. Mycol. 2020, 95, 5–169. [Google Scholar] [CrossRef]
  9. Liu, W.Z.; Ma, L.Y.; Liu, D.S.; Huang, Y.L.; Wang, C.H.; Shi, S.S.; Pan, X.H.; Song, X.D.; Zhu, R.X. Peniciketals A-C, new spiroketals from saline soil derived Penicillium raistrichii. Org. Lett. 2014, 16, 90–93. [Google Scholar] [CrossRef]
  10. Belofsky, G.N.; Gloer, K.B.; Gloer, J.B.; Wicklow, D.T.; Dowd, P.F. New p-terphenyl and polyketide metabolites from the sclerotia of Penicillium raistrickii. J. Nat. Prod. 1998, 61, 1115–1119. [Google Scholar] [CrossRef]
  11. Li, J.; Hu, Y.; Hao, X.; Tan, J.; Li, F.; Qiao, X.; Chen, S.; Xiao, C.; Chen, M.; Peng, Z.; et al. Raistrickindole A, an anti-HCV oxazinoindole alkaloid from Penicillium raistrickii IMB17-034. J. Nat. Prod. 2019, 82, 1391–1395. [Google Scholar] [CrossRef]
  12. Liu, D.-S.; Rong, X.-G.; Kang, H.-H.; Ma, L.-Y.; Hamann, M.T.; Liu, W.-Z. Raistrickiones A−E from a highly productive strain of Penicillium raistrickii generated through thermo change. Mar. Drugs 2018, 16, 213. [Google Scholar] [CrossRef]
  13. Ma, L.-Y.; Liu, W.; Shen, L.; Huang, Y.-L.; Rong, X.-G.; Xu, Y.-Y.; Xue Dong, G. Spiroketals, isocoumarin, and indoleformic acid derivatives from saline soil derived fungus Penicillium raistrickii. Tetrahedron 2012, 68, 2276–2282. [Google Scholar] [CrossRef]
  14. Miao, F.-P.; Li, X.-D.; Liu, X.-H.; Cichewicz, R.H.; Ji, N.-Y. Secondary metabolites from an algicolous Aspergillus versicolor strain. Mar. Drugs 2012, 10, 131–139. [Google Scholar] [CrossRef]
  15. Ebada, S.; El-Neketi, M.; Ebrahim, W.; Mándi, A.; Kurtán, T.; Kalscheuer, R.; Müller, W.; Chaidir, C. Cytotoxic secondary metabolites from the endophytic fungus Aspergillus versicolor KU258497. Phytochem. Lett. 2018, 24, 88–93. [Google Scholar] [CrossRef]
  16. Elsbaey, M.; Tanaka, C.; Miyamoto, T. New secondary metabolites from the mangrove endophytic fungus Aspergillus versicolor. Phytochem. Lett. 2019, 32, 70–76. [Google Scholar] [CrossRef]
  17. Kirichuk, N.N.; Pivkin, M.V.; Matveeva, T.V. Three new Penicillium species from marine subaqueous soils. Mycol. Prog. 2017, 16, 15–26. [Google Scholar] [CrossRef]
  18. Jones, E.; Suetrong, S.; Sakayaroj, J.; Bahkali, A.; Abdel-Wahab, M.; Boekhout, T.; Pang, K.-L. Classification of marine Ascomycota, Basidiomycota, Blastocladiomycota and Chytridiomycota. Fungal Divers. 2015, 73, 1–72. [Google Scholar] [CrossRef]
  19. McGovern, E.P.; Bentley, R. Biosynthesis of flaviolin and 5,8-dihydroxy-2,7-dimethoxy-1,4-naphthoquinone. Biochemistry 1975, 14, 3138–3143. [Google Scholar] [CrossRef]
  20. Frisch, M.J.; Trucks, G.W.; Schlegel, H.B.; Scuseria, G.E.; Robb, M.A.; Cheeseman, J.R.; Scalmani, G.; Barone, V.; Petersson, G.A.; Nakatsuji, H.; et al. Gaussian 16 Rev. A.03; Gaussian, Inc.: Wallingford, CT, USA, 2016. [Google Scholar]
  21. He, Z.-H.; Wu, J.; Xu, L.; Hu, M.-Y.; Xie, M.-M.; Hao, Y.-J.; Li, S.-J.; Shao, Z.-Z.; Yang, X.-W. Chemical constituents of the deep-sea-derived Penicillium solitum. Mar. Drugs 2021, 19, 580. [Google Scholar] [CrossRef]
  22. Kashiwada, Y.; Nonaka, G.; Nishioka, I. Studies on Rhubarb (Rhei Rhizoma). V. Isolation and characterization of chromone and chromanone berivatives. Chem. Pharm. Bull. 1984, 32, 3493–3500. [Google Scholar] [CrossRef]
  23. Zhan, F.; Yang, T.; Han, Y.-p.; Li, G.-y. A new chlorinated diphenyl ether and five known polyketide metabolites from Penicillium griseofulvum cib-119. Nat. Prod. Res. 2013, 27, 1393–1397. [Google Scholar] [CrossRef]
  24. Khamthong, N.; Rukachaisirikul, V.; Tadpetch, K.; Kaewpet, M.; Phongpaichit, S.; Preedanon, S.; Sakayaroj, J. Tetrahydroanthraquinone and xanthone derivatives from the marine-derived fungus Trichoderma aureoviride PSU-F95. Arch. Pharmacal Res. 2012, 35, 461–468. [Google Scholar] [CrossRef]
  25. Königs, P.; Rinker, B.; Maus, L.; Nieger, M.; Rheinheimer, J.; Waldvogel, S.R. Structural revision and synthesis of altechromone A. J. Nat. Prod. 2010, 73, 2064–2066. [Google Scholar] [CrossRef]
  26. Kawakami, H.; Suzuki, C.; Yamaguchi, H.; Hara, K.; Komine, M.; Yamamoto, Y. Norlichexanthone produced by cultured endolichenic fungus induced from Pertusaria laeviganda and its antioxidant activity. Biosci. Biotechnol. Biochem. 2019, 83, 996–999. [Google Scholar] [CrossRef]
  27. Wang, Q.X.; Bao, L.; Yang, X.L.; Guo, H.; Yang, R.N.; Ren, B.; Zhang, L.X.; Dai, H.Q.; Guo, L.D.; Liu, H.W. Polyketides with antimicrobial activity from the solid culture of an endolichenic fungus Ulocladium sp. Fitoterapia 2012, 83, 209–214. [Google Scholar] [CrossRef]
  28. Li, Y.; Tan, Y.; Liu, J.; Zhou, X.; Zong, S.; Dong, J.; Liu, Y.; Yang, B. A new griseofulvin derivative from a soft coral-derived fungus Eupenicillium sp. Nat. Prod. Res. 2020, 34, 2971–2975. [Google Scholar] [CrossRef]
  29. Rego, Y.F.; Queiroz, M.P.; Brito, T.O.; Carvalho, P.G.; de Queiroz, V.T.; de Fátima, Â.; Macedo Jr, F. A review on the development of urease inhibitors as antimicrobial agents against pathogenic bacteria. J. Adv. Res. 2018, 13, 69–100. [Google Scholar] [CrossRef]
  30. Finkelstein, E.; Amichai, B.; Grunwald, M.H. Griseofulvin and its uses. Int. J. Antimicrob. Agents 1996, 6, 189–194. [Google Scholar] [CrossRef]
  31. Aris, P.; Wei, Y.; Mohamadzadeh, M.; Xia, X. Griseofulvin: An updated overview of old and current knowledge. Molecules 2022, 27, 7034. [Google Scholar] [CrossRef]
  32. Rathinasamy, K.; Jindal, B.; Asthana, J.; Singh, P.; Balaji, P.V.; Panda, D. Griseofulvin stabilizes microtubule dynamics, activates p53 and inhibits the proliferation of MCF-7 cells synergistically with vinblastine. BMC Cancer 2010, 10, 213. [Google Scholar] [CrossRef]
  33. Gu, W. Bioactive metabolites from Alternaria brassicicola ML-P08, an endophytic fungus residing in Malus halliana. World J. Microbiol. Biotechnol. 2009, 25, 1677–1683. [Google Scholar] [CrossRef]
  34. Abbafati, C.; Machado, D.B.; Cislaghi, B.; Salman, O.M.; Karanikolos, M.; McKee, M.; Abbas, K.M.; Brady, O.J.; Larson, H.J.; Trias-Llimós, S.; et al. Global burden of 369 diseases and injuries in 204 countries and territories, 1990–2019: A systematic analysis for the Global Burden of Disease Study 2019. Lancet 2020, 396, 1204–1222. [Google Scholar] [CrossRef]
  35. Scholin, C.A.; Herzog, M.; Sogin, M.; Anderson, D.M. Identification of group- and strain-specific genetic markers for globally distributed Alexandrium (Dinophyceae). II. Sequence analysis of a fragment of the LSU rRNA gene. J. Phycol. 1994, 30, 999–1011. [Google Scholar] [CrossRef]
  36. Glass, N.L.; Donaldson, G.C. Development of primer sets designed for use with the PCR to amplify conserved genes from filamentous ascomycetes. Appl. Environ. Microbiol. 1995, 61, 1323–1330. [Google Scholar] [CrossRef]
  37. Kumar, S.; Stecher, G.; Li, M.; Knyaz, C.; Tamura, K. MEGA X: Molecular evolutionary genetics analysis across computing platforms. Mol. Biol. Evol. 2018, 35, 1547. [Google Scholar] [CrossRef]
  38. Tavare, S. Some probabilistic and statistical problems in the analysis of DNA sequences. Lect. Math. Life Sci. 1986, 17, 57–86. [Google Scholar]
  39. Tamura, K.; Nei, M. Estimation of the number of nucleotide substitutions in the control region of mitochondrial DNA in humans and chimpanzees. Mol. Biol. Evol. 1993, 10, 512–526. [Google Scholar] [CrossRef]
Figure 1. Metabolites isolated from the natural complex of the fungi P. sajarovii KMM 4718 and A. protuberus KMM 4747 isolated from the sea urchin S. mirabilis.
Ijms 24 16568 g001
Figure 2. ML tree based on concatenated ITS-BenA-CaM gene sequences showing the phylogenetic position of strain KMM 4718 among members of the genus Penicillium (Ramosum), series Lanosa, Raistrickiorum, Scabrosa, Soppiorum, and Virgata. Bootstrap values (%) of 1000 replications. Nodes with confidence values higher than 50% are indicated. The scale bars represent 0.05 substitutions per site.
Ijms 24 16568 g002
Figure 3. ML tree based on concatenated ITS-BenA-CaM-RPB2 gene sequences showing the phylogenetic position of strain KMM 4747 among the members of the genus Aspergillus series Versicolores. Bootstrap values (%) of 1000 replications. Nodes with confidence values higher than 50% are indicated. The scale bars represent 0.1 substitutions per site.
Ijms 24 16568 g003
Figure 4. UV spectra of 1: experimental (black), calculated for 4R-1_c1 (red), and calculated for 4R-1_c2 (green). Theoretical spectra are calculated at the “PCM level” of theory.
Ijms 24 16568 g004
Figure 5. Experimental (black) and theoretical ECD spectra, calculated for 4R-1 at the TDDFT_B3LYP/cc-pvTZ_PCM//B3LYP/cc-pvTZ_PCM level of theory: calculated for 4R-1_c1 (red), 4R-1_c2 (green), and calculated averaged for 4R-1 (blue).
Ijms 24 16568 g005
Figure 6. Theoretical averaged ECD spectrum, calculated for 4R-1 (red) and 4S-1 (pink) using “Direct” modeling, compared with the experimental ECD spectrum of 1 (black).
Ijms 24 16568 g006
Figure 7. Theoretical averaged ECD spectrum, calculated for 4R-2 (red) and 4S-2 (pink) using “Direct” modeling, compared with the experimental ECD spectrum of 2 (black).
Ijms 24 16568 g007
Figure 8. The viability of S. aureus-infected H9c2 cardiomyocytes treated with compounds 19 and 11. The compounds at concentrations of 1 and 10 µM were added after 1 h of S. aureus infection. All the data are presented as means ± standard errors of means. The experiments are conducted in three independent replicates. Asterisk * indicates the significant differences at p ≤ 0.05.
Ijms 24 16568 g008
Table 1. 13C and 1H NMR spectroscopic data for compounds 12.
No12
δC, TypeδH, Mult. (J in Hz)δC, TypeδH, Mult. (J in Hz)
1190.3, C 190.4, C
299.6, CH5.52, s99.6, CH5.55, s
3179.3, C 179.6, C
470.7, C 70.9, C
4a151.5, C 151.1, C
5106.1, CH6.77, d (2.5)105.2, CH6.81, d (2.5)
6164.1, C 166.1, C
7102.4, CH6.25, d (2.5)100.6, CH6.35, d (2.5)
8164.4, C 164.7, C
8a107.5, C 108.0, C
932.5, CH31.60, s32.6, CH31.62, s
3-OMe56.9, CH33.89, s57.0, CH33.90, s
6-OMe 55.9, CH33.87, s
8-OH 13.2, s
Chemical shifts are measured at 125 and 500 MHz in acetone-d6.
Table 2. Inhibition of urease and antimicrobial activities of the compounds.
CompoundsInhibition of Urease Activity
IC50, µM
Inhibition of Microbial Growth 1, %
S. aureusE. coliC. albicans
1>100.035.1 ± 0.925.4 ± 1.0-
298.5 ± 0.8---
3>100.017.7 ± 0.3--
4>100.030.1 ± 1.213.6 ± 0.311.1 ± 1.3
515.3 ± 2.120.8 ± 6.527.9 ± 3.3-
697.3 ± 1.6---
7100.0--15.4 ± 2.1
810.1 ± 0.611.5 ± 4.316.8 ± 4.5-
9>100.023.0 ± 0.323.4 ± 1.8-
1111.4 ± 1.0---
1 Compounds are tested at a concentration of 100 µM.
Table 3. Cytotoxic activities of the compounds.
CompoundHepG2H9c2
Cell Viability, %IC50Cell Viability, %IC50
100 µM10 µM 100 µM10 µM
1106.8 ± 3.9107.5 ± 3.2>10065.4 ± 4.883.6 ± 4.4>100
276.9 ± 2.187.3 ± 4.1>10079.0 ± 3.496.0 ± 1.9>100
3101.4 ± 3.991.7 ± 1.5>10074.3 ± 3.296.4 ± 2.1>100
492.6 ± 4.199.2 ± 6.5>10096.5 ± 3.6110.3 ± 2.9>100
552.6 ± 3.088.0 ± 4.9>10049.0 ± 1.686.3 ± 6.397.4 ± 2.2
627.1 ± 2.485.7 ± 5.764.7 ± 0.863.3 ± 1.486.0 ± 4.8>100
757.4 ± 4.277.1 ± 1.4>10052.9 ± 1.598.0 ± 0.9>100
839.9 ± 0.781.0 ± 2.177.8 ± 1.371.6 ± 3.789.8 ± 2.7>100
984.2 ± 3.291.5 ± 6.8>10092.9 ± 3.7 97.4 ± 8.1>100
1176.6 ± 2.487.5 ± 5.3>10089.0 ± 2.995.9 ± 0.6>100
Table 4. The strains of the species used in the multi-locus phylogenetic analysis and GenBank accession numbers.
SpeciesStrain NumberGenBank Accession Number
ITSBenACaMRPB2
Penicillium simile Davolos et al.
Davolos et al., 2012
CBS 129191 TFJ376592FJ376595GQ979710
Penicillium sajarovii QuintanCBS
277.83 T
KC411724MN969397MN969295
Penicillium sajaroviiKMM 4718OR431843OQ466617OR451997
Penicillium raistrickii
G. Sm
CBS
261.33 T
AY373927KJ834485KJ867006
Penicillium lanosum WestlingCBS
106.11 T
DQ304540DQ285627FJ530974
Penicillium beceitense Guevara-Suarez et al. CBS 142989 TLT899780LT898229LT899764
Penicillium jamesonlandense Frisvad & Overy CBS 102888 TDQ267912DQ309448KJ866985
Penicillium swiecickii
Zaleski
CBS 119391 TAF033490KJ834494KJ866993
Penicillium ribium
Frisvad & Overy
CBS 127809 TDQ267916MN969395KJ866995
Penicillium scabrosum Frisvad et al. CBS
683.89 T
DQ267906DQ285610FJ530987
Penicillium chroogomphum
Xu et al.
CBS 136204 TKC594043KP684056KP684057
Penicillium americanum Jurjevic et al. NRRL 66819 TMK791278MK803427MK803428
Penicillium lenticrescens Visagie et al. CBS 138215 TKJ775675KJ775168KJ775404
Penicillium soppii
Zaleski
CBS
226.28 T
AF033488MN969399KJ867002
Penicillium tunisiense
Ouhibi et al.
MUM 17.62 TMG586956MG586970MG586974
Penicillium virgatum
Nirenberg & Kwasna
CBS 114838 TAJ748692KJ834500KJ866992
Penicillium kojigenum
Sm
CBS
345.61 T
AF033489KJ834463KJ867011
Aspergillus versicolor
(Vuill.) Tirab
CBS
583.65 T
EF652442EF652266EF652354EF652178
Aspergillus fructus
Jurjevic et al.
NRRL
239 T
EF652449EF652273EF652361EF652185
Aspergillus tabacinus Nakaz et al. CBS 122718 TEF652478EF652302EF652390EF652214
Aspergillus amoenus
Roberg
NRRL 4838 TEF652480JN853946JN854035JN853824
Aspergillus griseoaurantiacus
Visagie et al.
CBS 138191 TKJ775553KJ775086KJ775357KU866988
Aspergillus austroafricanus Jurjevic et al. CBS 145748 TJQ301891JN853963JN854025JN853814
Aspergillus hongkongensis Tsang et al. CBS 145671 TAB987907LC000552MN969320LC000578
Aspergillus protuberus Munt.-Cvetk CBS
602.74 T
EF652460EF652284EF652372EF652196
Aspergillus protuberusKMM 4747OR431842OQ466615OR451996OR451998
Aspergillus tennesseensis Jurjevic et al. CBS 145752 TJQ301895JN853976JN854017JN853806
Aspergillus cvjetkovicii Jurjevic et al. NRRL
227 T
EF652440EF652264EF652352EF652176
Aspergillus jensenii
Jurjevic et al.
NRRL 58600 TJQ301892JN854007JN854046JN853835
Aspergillus puulaauensis Jurjevic et al. CBS 145750 TJQ301893JN853979JN854034JN853823
Aspergillus venenatus Jurjevic et al. CBS 145753 TJQ301896JN854003JN854014JN853803
Aspergillus creber
Jurjevic et al.
CBS 145749 TJQ301889JN853980JN854043JN853832
Aspergillus sydowii
(Bainier & Sartory) Thom & Church
CBS
593.65 T
EF652450EF652274EF652362EF652186
Aspergillus subversicolor Jurjevic et al. CBS 145751 TJQ301894JN853970JN854010JN853799
Talaromyces marneffei (Segretain) Samson et al. CBS
388.87 T
JN899344JX091389KF741958KM023283
Note: ex-type strains Penicillium lusitanum MUM 18.49 (the sequence for the CaM gene is not established) and Aspergillus pepii CBS 142028 (the sequence for the RPB2 gene i not been established) are not used for the phylogenetic analysis.
Disclaimer/Publisher’s Note: The statements, opinions and data contained in all publications are solely those of the individual author(s) and contributor(s) and not of MDPI and/or the editor(s). MDPI and/or the editor(s) disclaim responsibility for any injury to people or property resulting from any ideas, methods, instructions or products referred to in the content.

