
Candidate Genes for IgA Nephropathy in Pediatric Patients: Exome-Wide Association Study

 , , , ,
  ,
,
Abstract
1. Introduction
2. Results
2.1. Clinical Characteristics
2.2. Morphological Analysis
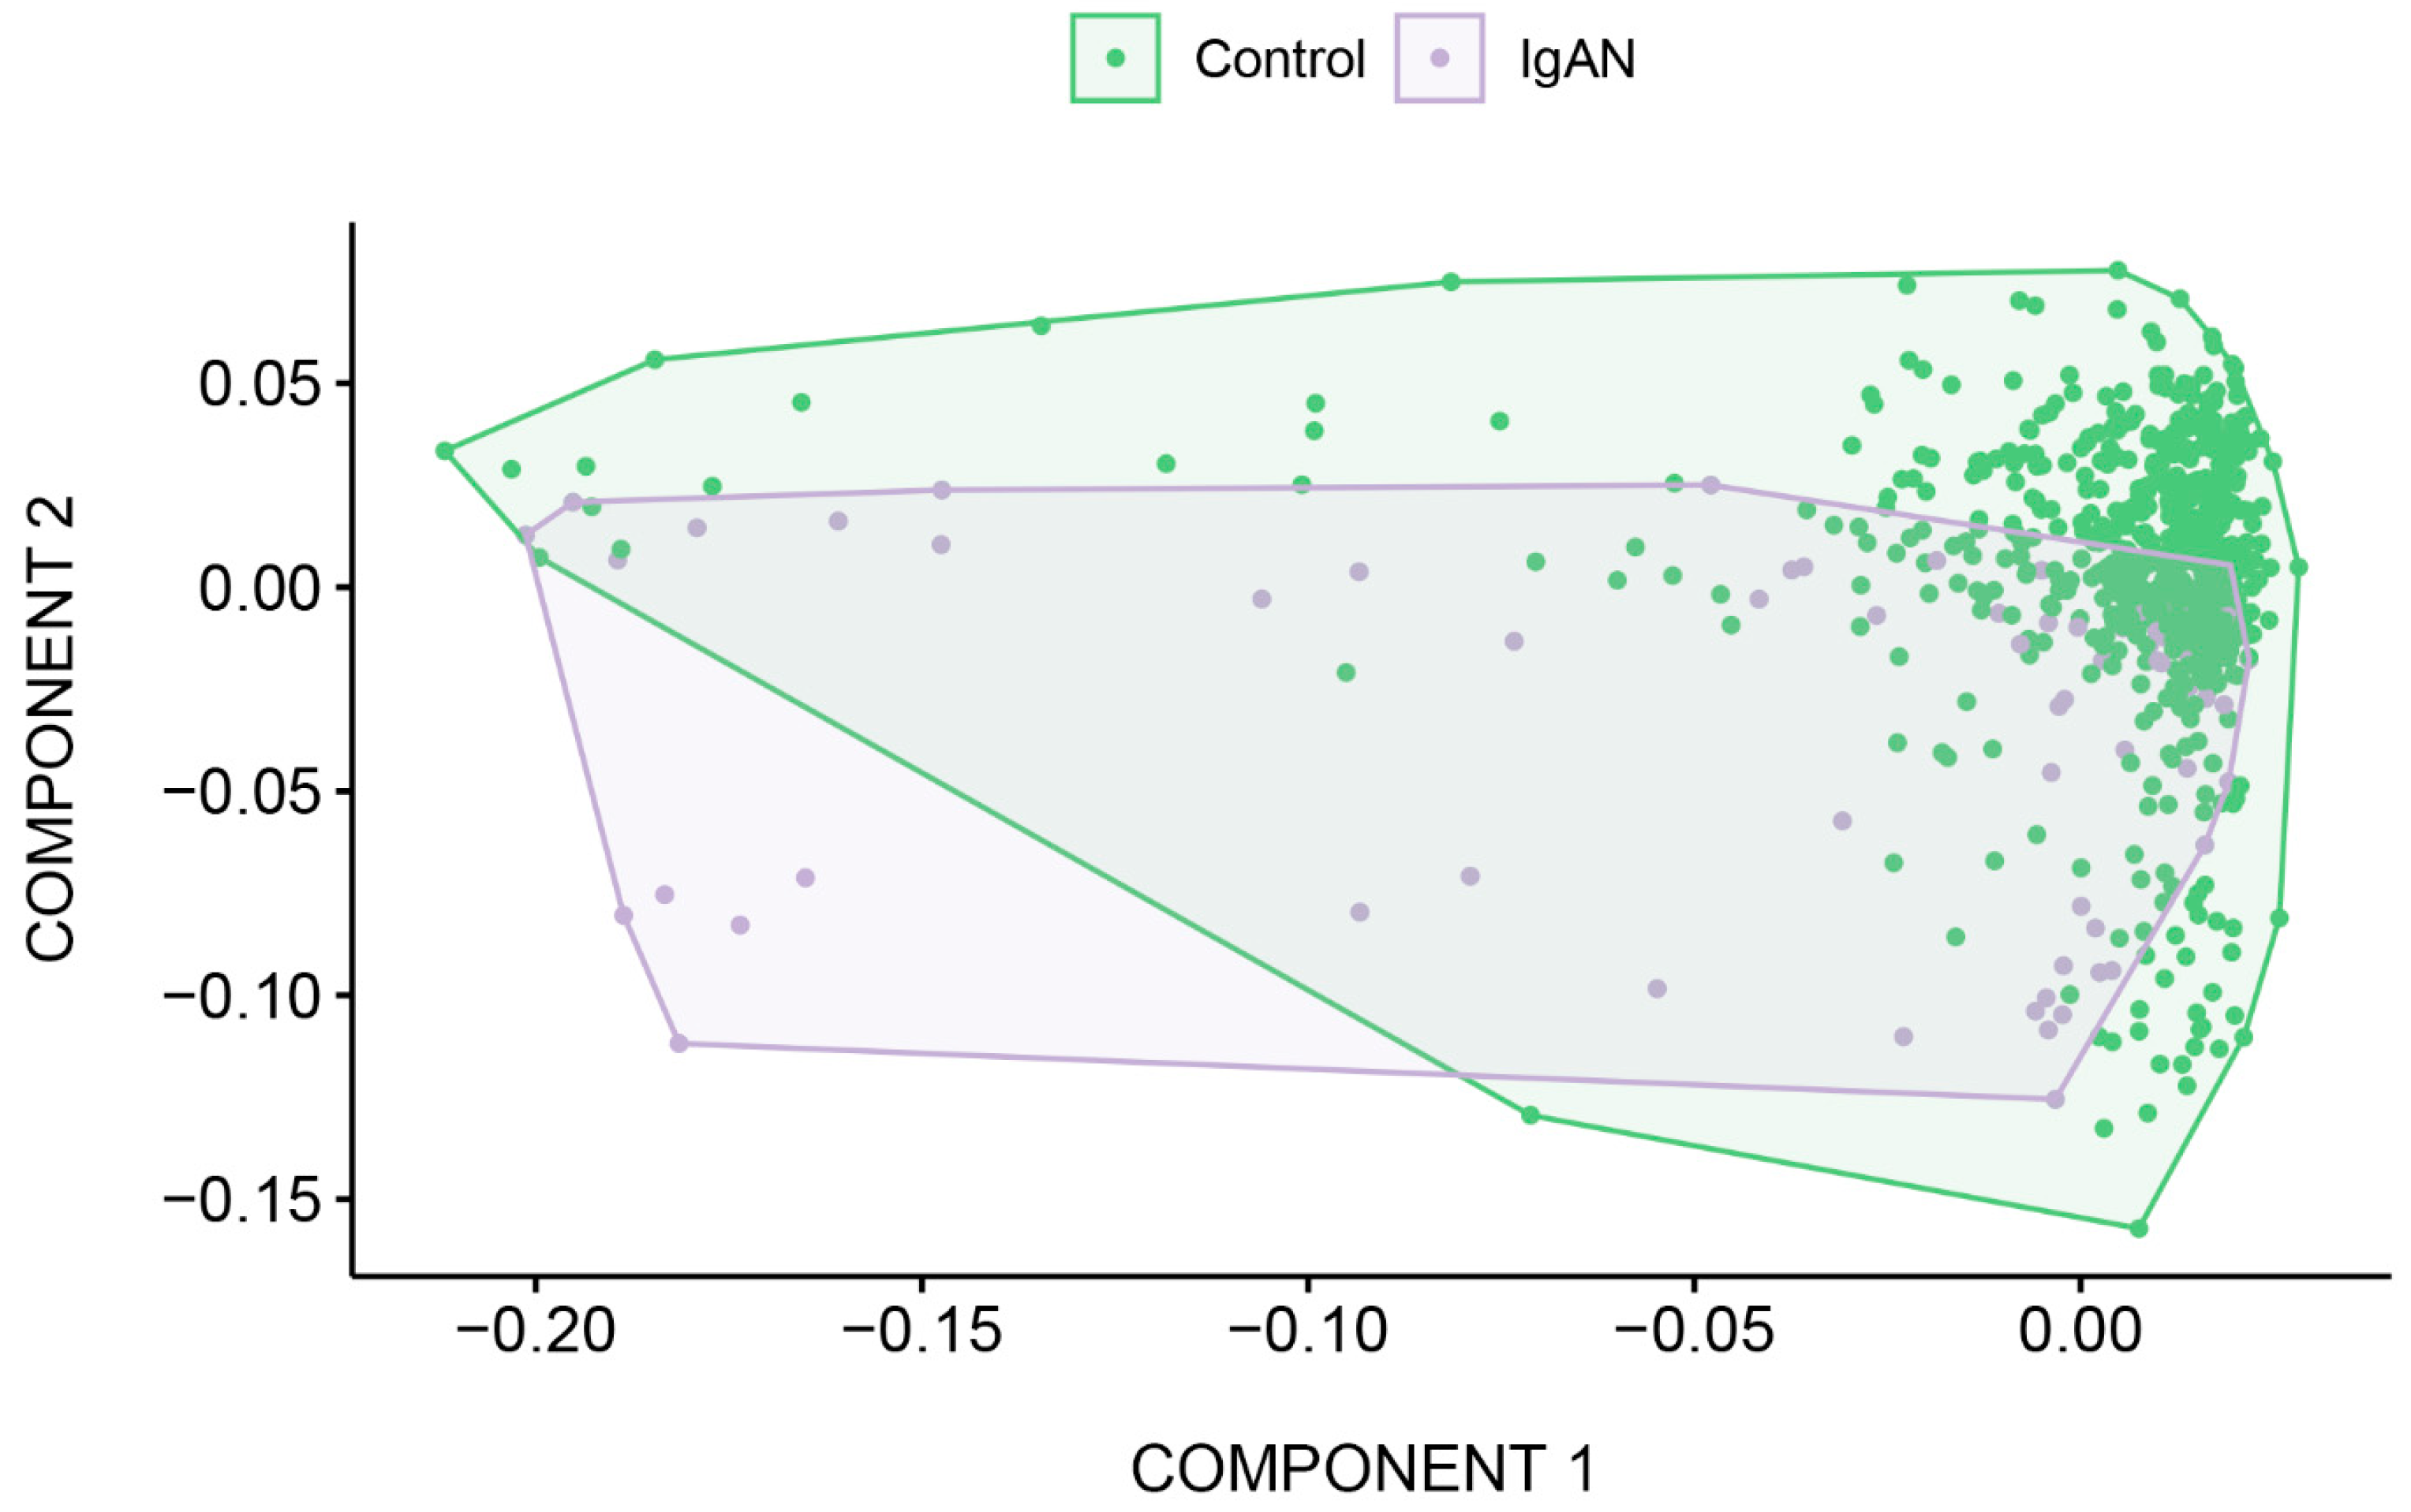
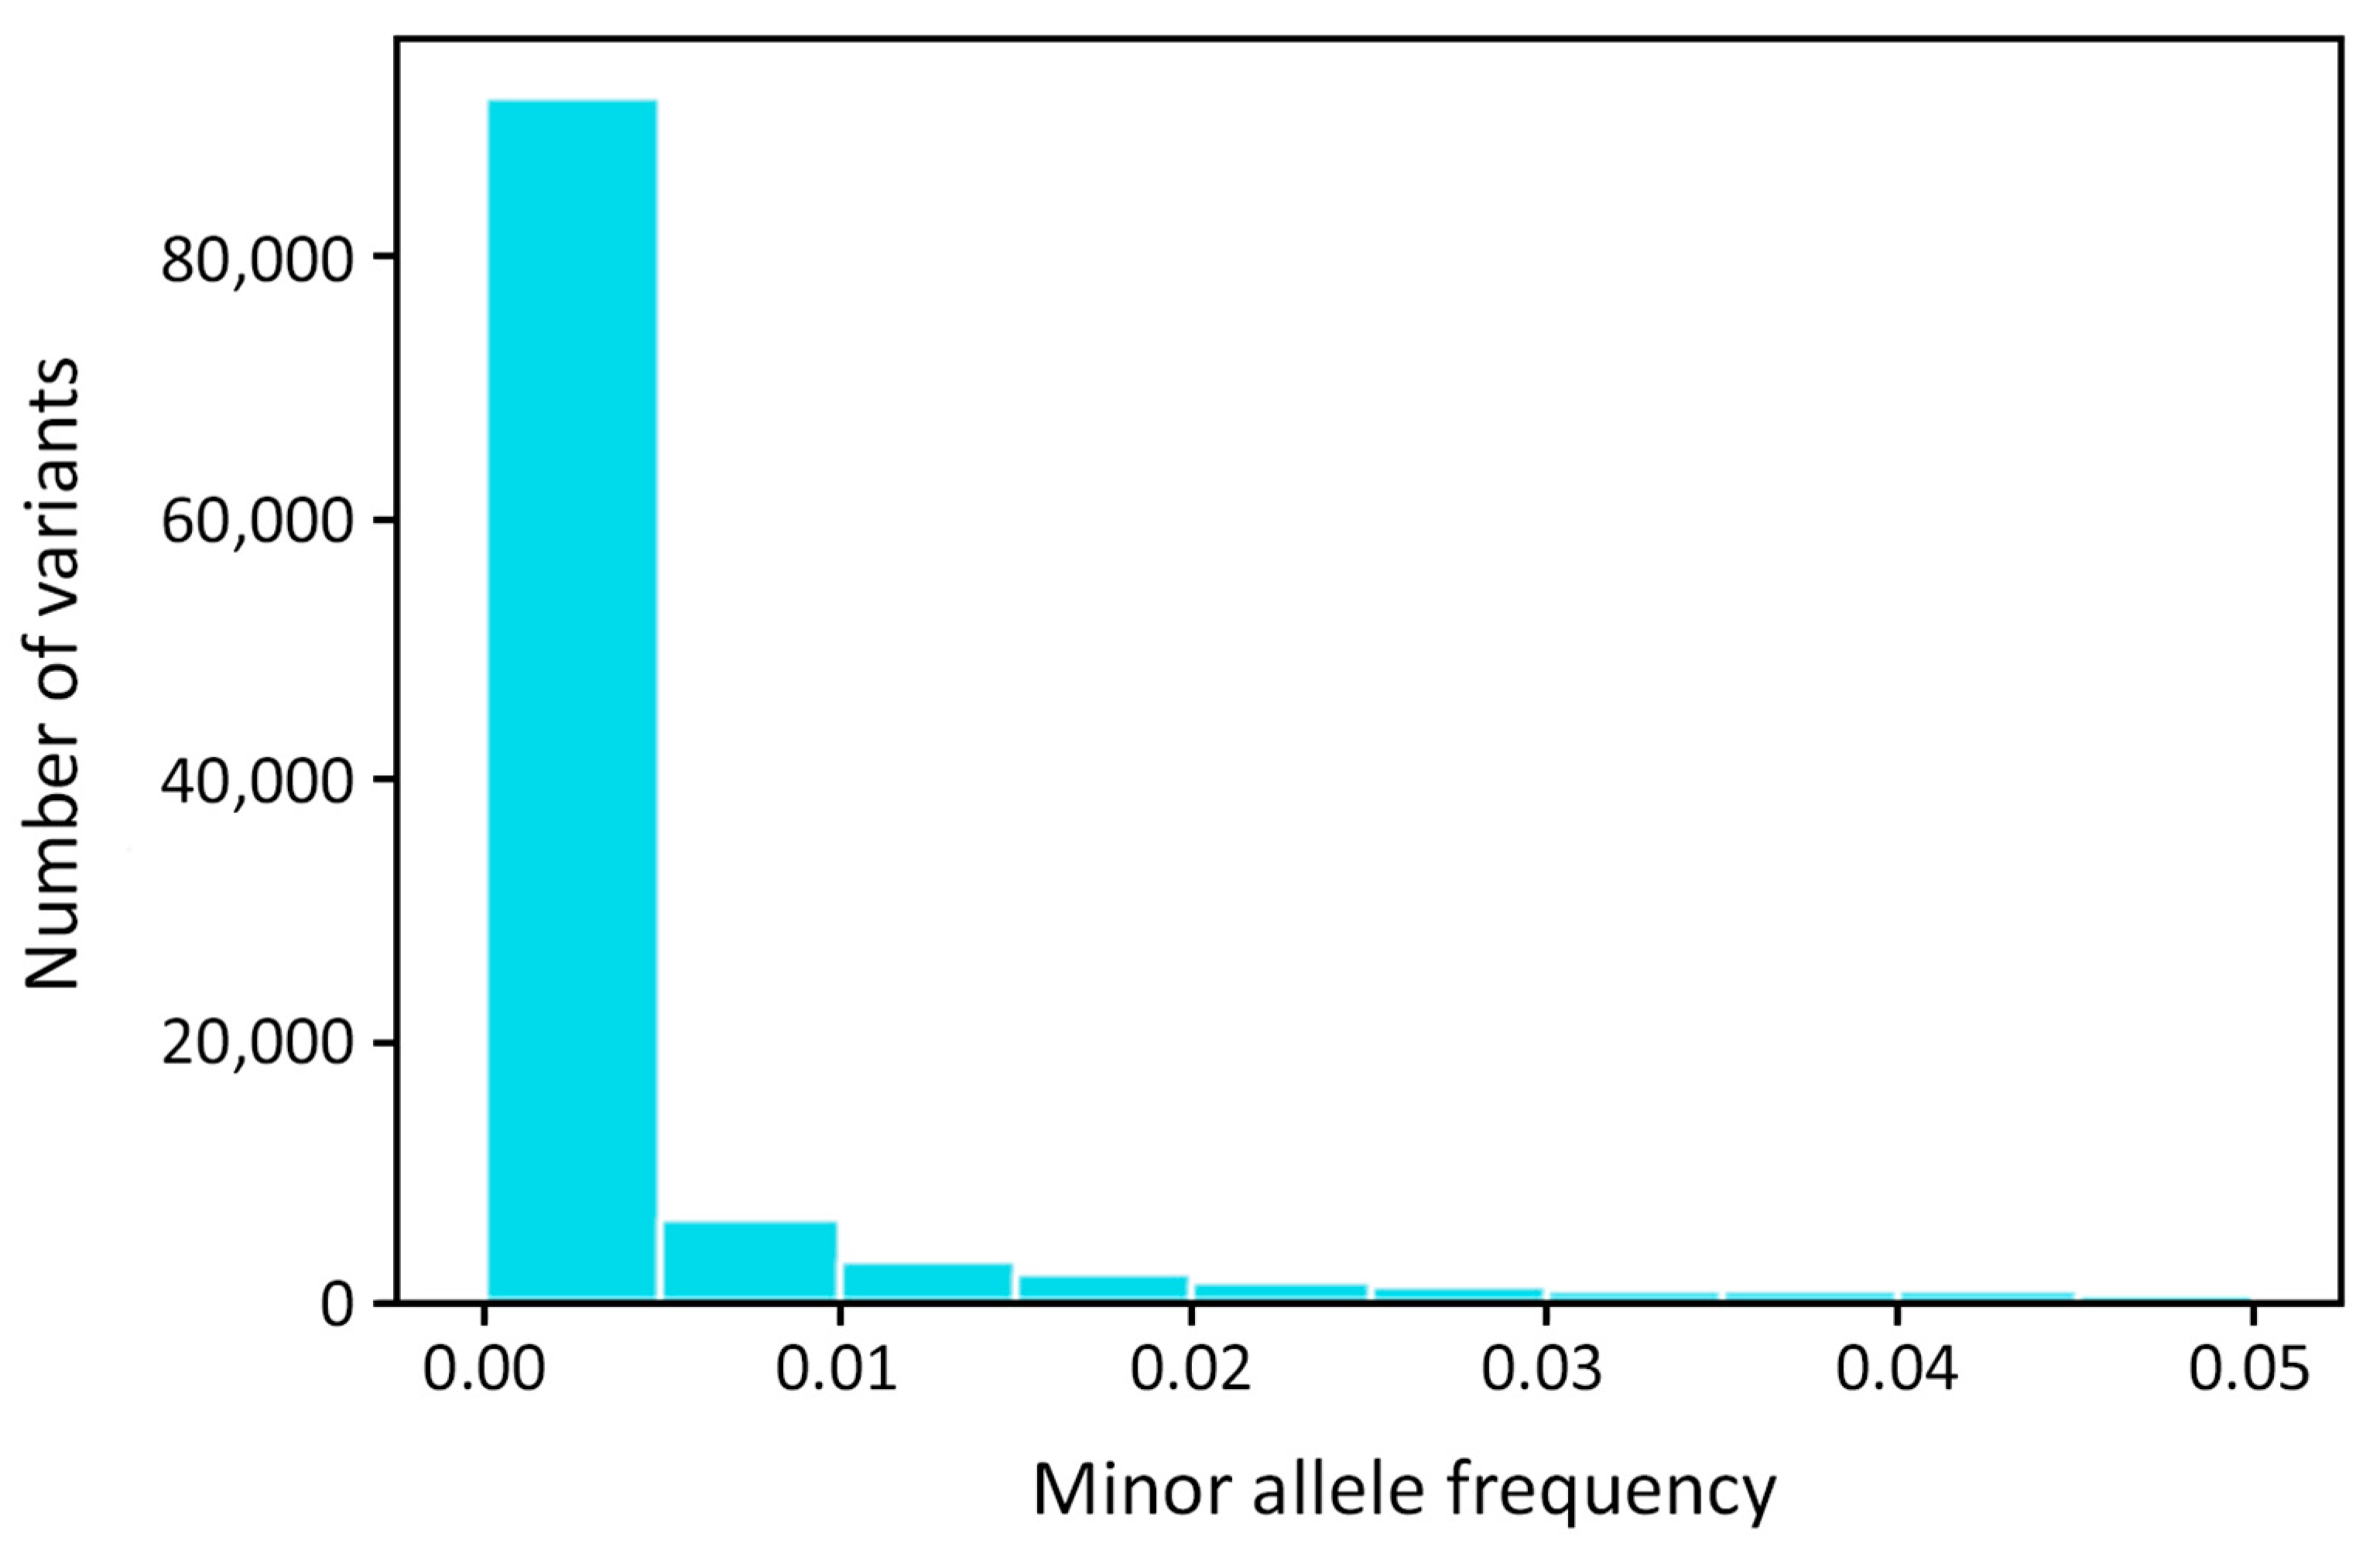
2.3. Description of the Sequencing Data
2.4. Exome-Wide Association Study of IgAN
2.5. Gene Set Enrichment and eQTL Analysis
2.6. Protein–Protein Interaction (PPI) Network Analysis of Potential Targets
2.7. Transcription Factor (TF) Binding Sites’ Enrichment Analysis
2.8. Frequency and Comparison of Allele Frequencies between IgAN Patients and Healthy Donors
3. Discussion
4. Materials and Methods
4.1. Ethics Statement
4.2. Patient Cohort
4.3. gDNA Extraction
4.4. Library Preparation and Enrichment
4.5. Sequencing
4.6. Control Samples
4.7. Raw Sequencing Data Analysis
4.8. Exome-Wide Association Study
4.9. Functional Enrichment Analysis and Transcription Factor (TF) Binding Preference Detection
4.10. HLA-Typing
4.11. Statistical Analysis
Author Contributions
Funding
Institutional Review Board Statement
Informed Consent Statement
Data Availability Statement
Conflicts of Interest
Appendix A


| Features | (n = 70) | |
|---|---|---|
| Sex | Male | 64.4% |
| Female | 35.6% | |
| Age of the onset, years | 10.3 ± 3.8 | |
| Serum creatinine level (mg/dL) | 46.5 ± 7.1 | |
| eGFR (mL/min/1.73m2) | 97.7 ± 26.9 | |
| Proteinuria (g/day/1.73m2) | 0.9 [0.5–2.0] | |
| Mean blood pressure (mm Hg) | 84.5 ± 12.42 | |
| Symptoms at the debut | persistent microscopic hematuria | 20.0% |
| macroscopic hematuria | 38.6% | |
| nephritic syndrome | 11.5% | |
| nephrotic syndrome | 25.7% | |
| acute kidney injury | 2.8% | |
| rapidly progressive glomerulonephritis | 1.4% | |
| Metrics | Mean | Min | Max |
|---|---|---|---|
| Single reads per sample | 79,494,574 | 41,389,840 | 162,054,108 |
| Estimated library size | 167,316,756 | 43,904,883 | 362,437,565 |
| Duplicates | 12.33 | 5.86 | 26.82 |
| On-target bases | 85.3% | 62% | 92% |
| Mean target coverage | 89.65 | 46.2 | 140 |
| Median target coverage | 80.62 | 42 | 128 |
| Width 10× | 96.9% | 94.3% | 97% |
| Width 20× | 95.2% | 85% | 97% |
| Width 30× | 91.2% | 70% | 96% |
| Gene | MARKER | CHR | BP | A1 | F_A | F_U | A2 | p | OR (95% CI) | BONF ADD | BONF DOM | BONF REC | R2 |
|---|---|---|---|---|---|---|---|---|---|---|---|---|---|
| LGALS8 | rs2244809 | 1 | 236,702,117 | T | 0.55 | 0.2849 | G | 1.274 × 10⁻¹⁰ | 3.067 (2.152–4.372) | 0.01239 | ns | 2.732 × 10⁻⁵ | 0.9507 (rs1041937); 0.865722 (rs2244808); 0.660795 (rs11807205) |
| rs2244808 | 236,702,153 | G | 0.6 | 0.3163 | A | 2.016 × 10⁻¹¹ | 3.242 (2.266–4.638) | 0.007593 | ns | 1.236 × 10⁻⁴ | 0.865722 (rs2244809); 0.822342 (rs1041937); 0.759458 (rs11807205) | ||
| rs1041937 | 236,702,210 | A | 0.4857 | 0.2857 | G | 1.08 × 10⁻⁶ | 2.361 (1.659–3.361) | ns | ns | 0.01863 | 0.822342 (rs2244808); 0.9507 (rs2244809); 0.668001 (rs11807205) | ||
| rs11807205 | 236,702,475 | A | 0.6286 | 0.3501 | G | 1.106 × 10⁻¹⁰ | 3.142 (2.188–4.511) | 0.02077 | ns | 8.544 × 10⁻⁴ | 0.759458 (rs2244808); 0.660795 (rs2244809); 0.668001 (rs1041937) | ||
| rs2254823 | 236,711,297 | A | 0.55 | 0.2849 | G | 1.274 × 10⁻¹⁰ | 3.067 (2.266–4.638) | 0.007593 | ns | 1.236 × 10⁻⁴ | 0.96159 | ||
| rs15701 | 236,711,323 | T | 0.6 | 0.3163 | A | 2.016 × 10⁻¹¹ | 3.242 (1.855–3.761) | ns | ns | 0.02441 | |||
| COX7A2L | rs12613284 | 2 | 42,562,787 | C | 0.5071 | 0.3462 | G | 1.685 × 10⁻⁴ | 1.944 (1.368 –2.761) | ns | ns | 0.043 | 0.991318 |
| rs10194796 | 42,562,821 | A | 0.5071 | 0.3454 | C | 1.555 × 10⁻⁴ | 1.95 (1.373–2.77) | ns | ns | 0.03463 | |||
| DNAH5 | rs6554808 | 5 | 13,735,147 | C | 0.6 | 0.3666 | A | 7.614 × 10⁻⁸ | 2.592 (1.814–3.703) | ns | ns | 3.987 × 10⁻⁴ | 0.85481 |
| rs2401811 | 13,737,700 | A | 0.5714 | 0.3611 | G | 1.157 × 10⁻⁶ | 2.359 (1.656–3.361) | ns | ns | 0.006805 | |||
| MYL10-CUX1 | rs740202 | 7 | 101,280,652 | T | 0.5929 | 0.4074 | G | 2.52 × 10⁻⁵ | 2.118 (1.485–3.022) | ns | ns | 0.006267 | 0.997391 |
| rs1636453 | 101,281,232 | A | 0.5929 | 0.4082 | T | 2.737 × 10⁻⁵ | 2.111 (1.48–3.012) | ns | ns | 0.007734 | |||
| OR4K3 | rs5807006 | 14 | 20,336,681 | A | 0.5429 | 0.2504 | AG | 2.464 × 10⁻¹³ | 3.555 (2.491–5.074) | ns | ns | 0.007604 | 0.734943 |
| rs1892239 | 14 | 20,336,733 | A | 0.45 | 0.2206 | G | 1.905 × 10⁻⁹ | 2.891 (2.021–4.137) | ns | ns | 0.00812 | ||
| OR4E1 | rs7144135 | 14 | 22,138,328 | G | 0.45 | 0.1915 | A | 1.905 × 10⁻¹² | 3.454 (2.407–4.956) | ns | ns | 9.527 × 10⁻⁴ | 0.996356 |
| rs970025 | 14 | 221,384,37 | A | 0.45 | 0.1907 | G | 1.538 × 10⁻¹² | 3.471 (2.419–4.981) | ns | ns | 6.463 × 10⁻⁴ | ||
| SYNE2 | rs10138253 | 14 | 64,520,416 | G | 0.3786 | 0.1586 | A | 1.301 × 10⁻¹⁰ | 3.233 (2.226–4.695) | ns | ns | 9.15 × 10⁻⁶ | 0.870958 |
| rs1255972 | 14 | 64,532,107 | A | 0.3429 | 0.1633 | G | 1.621 × 10⁻⁷ | 2.674 (1.83–3.907) | ns | ns | 0.001809 | ||
| FBN1 | rs11070641 | 15 | 48,701,029 | C | 0.4 | 0.2221 | T | 2.882 × 10⁻⁶ | 2.335 (1.624–3.356) | ns | ns | 6.838 × 10⁻⁴ | 0.871057 |
| rs4775760 | 15 | 48,701,612 | A | 0.4357 | 0.2386 | C | 4.227 × 10⁻⁷ | 2.464 (1.722–3.525) | ns | ns | 8.167 × 10⁻⁴ | ||
| LOC400499 | rs9932266 | 16 | 11,594,747 | G | 0.5214 | 0.3053 | T | 2.285 × 10⁻⁷ | 2.479 (1.743–3.526) | ns | ns | 2.209 × 10⁻⁵ | 0.860027 |
| rs4781105 | 16 | 11,596,040 | C | 0.5071 | 0.3148 | G | 4.606 × 10⁻⁶ | 2.24 (1.576–3.185) | ns | ns | 1.181 × 10⁻⁴ | ||
| CRISPLD2-ZDHHC7 | rs2646133 | 16 | 84,953,145 | A | 0.4929 | 0.3383 | G | 2.826 × 10⁻⁴ | 1.901 (1.338–2.700) | ns | ns | 0.03866 | 0.739664 (rs2646130); 0.988681 (rs2646132); 0.988681 (rs60944306) |
| rs2646132 | 16 | 84,953,232 | C | 0.4929 | 0.3367 | T | 2.417 × 10⁻⁴ | 1.914 (1.347–2.719) | ns | ns | 0.031 | 1 (rs60944306); 0.988681 (rs2646133); 0.747952 (rs2646130) | |
| rs60944306 | 16 | 84,953,233 | A | 0.4929 | 0.3367 | C | 2.417 × 10⁻⁴ | 1.914 (1.347–2.719) | ns | ns | 0.031 | 0.747952 (rs2646130); 1 (rs2646132); 0.988681 (rs2646133) | |
| rs2646130 | 16 | 84,953,351 | G | 0.4571 | 0.2645 | A | 1.59 × 10⁻⁶ | 2.341 (1.642–3.339) | ns | ns | 0.002581 | 0.747952 (rs2646132); 0.739664 (rs2646133); 0.747952 (rs60944306) | |
| KRBA2 | rs1695213 | 17 | 8,279,324 | T | 0.6 | 0.3344 | C | 5.215× 10⁻¹⁰ | 2.986 (2.088–4.27) | ns | ns | 1.967 × 10⁻⁷ | 0.907883 |
| RPL26 | rs422679 | 17 | 8,285,398 | T | 0.6214 | 0.3579 | C | 1.166 × 10⁻⁹ | 2.945 (2.054–4.222) | ns | ns | 4.826 × 10⁻⁶ | |
| CEP192 | rs9783903 | 18 | 13,000,210 | A | 0.5429 | 0.3595 | G | 2.159 × 10⁻⁵ | 2.116 (1.488–3.007) | ns | ns | 0.01879 | 0.976515 |
| CEP192 | rs1787008 | 18 | 13,058,318 | A | 0.5357 | 0.354 | G | 2.418 × 10⁻⁵ | 2.106 (1.482–2.992) | ns | ns | 0.02432 |
| SNP | TF | Motif | TF Binding Site | p |
|---|---|---|---|---|
| rs3087873 | SMAD | AP1_disc10 | Enhance | 0.00212 |
| rs3087873 | ESRRA | AP1_disc10 | Enhance | 0.00212 |
| rs3087873 | MYC | AP1_disc10 | Enhance | 0.00212 |
| rs2286239 | RAD21 | RAD21_disc5 | Enhance | 0.0034 |
| rs33749 | ETS | RAD21_disc5 | Enhance | 0.00348 |
| rs622861 | REST | RUNX2_1 | Enhance | 0.00414 |
| rs2209956 | AP1 | HLTF_1 | Enhance | 0.00858 |
| rs11807205 | SOX10 | LEF1_1 | Enhance | 0.01723 |
| rs11807205 | TFAP2A | LEF1_1 | Enhance | 0.01723 |
| rs11807205 | GATA3 | LEF1_1 | Enhance | 0.01723 |
| rs11807205 | E2F1 | LEF1_1 | Enhance | 0.01723 |
| rs11807205 | SETDB1 | LEF1_1 | Enhance | 0.01723 |
| rs12495243 | EN1 | EN1_2 | Enhance | 0.01832 |
| rs2042367 | LEF1 | GATA_1 | Enhance | 0.02353 |
| rs33749 | ZNF143 | CHD2_disc3 | Enhance | 0.02499 |
| rs4535042 | TFAP2A | TFAP2A_1 | Enhance | 0.03305 |
| rs4535042 | TFAP2A | TFAP2A_4 | Enhance | 0.03305 |
| rs12495243 | VDR | VDR_1 | Disrupt | 0.03416 |
| rs3087873 | PITX2 | REST_disc8 | Enhance | 0.03947 |
| rs3087873 | ELF1 | REST_disc8 | Enhance | 0.03947 |
| rs3087873 | GATA2 | REST_disc8 | Enhance | 0.03947 |
| rs913178 | VDR | EP300_disc9 | Disrupt | 0.0429 |
| rs913178 | AP1 | EP300_disc9 | Disrupt | 0.0429 |
| rs913178 | BCL | EP300_disc9 | Disrupt | 0.0429 |
| Allele | IgAN (%) | Control (%) | p’ (chi-sq) | p’ (Fisher’s Exact Test) | OR | 95% CI |
|---|---|---|---|---|---|---|
| A*02:01:01G | 30.00 | 27.13 | >0.05 | 1.151 | 0.777–1.682 | |
| A*24:02:01G | 16.43 | 10.98 | >0.05 | 1.594 | 0.961–2.543 | |
| A*01:01:01G | 9.29 | 12.14 | >0.05 | 0.741 | 0.381–1.327 | |
| A*03:01:01G | 8.57 | 13.95 | >0.05 | 0.578 | 0.289–1.055 | |
| A*31:01:02G | 5.71 | 2.00 | >0.05 | 2.967 | 1.210–6.327 | |
| B*35:01:01G | 9.29 | 6.35 | >0.05 | 1.508 | 0.770–2.725 | |
| B*27:05:02G | 7.14 | 3.87 | >0.05 | 1.912 | 0.877–3.734 | |
| B*56:01:01G | 5.71 | 1.38 | >0.05 | 4.331 | 1.739–9.437 | |
| B*51:01:01G | 5.71 | 5.19 | >0.05 | 1.107 | 0.461–2.291 | |
| B*07:02:01G | 5.71 | 11.79 | >0.05 | 0.454 | 0.190–0.929 | |
| C*04:01:01G | 16.43 | 12.41 | >0.05 | 1.387 | 0.837–2.210 | |
| C*01:02:01G | 11.43 | 4.52 | 0.029 | 2.727 | 1.477–4.738 | |
| C*02:02:02G | 10.00 | 6.06 | >0.05 | 1.723 | 0.901–3.0621 | |
| C*06:02:01G | 9.29 | 11.95 | >0.05 | 0.754 | 0.387–1.351 | |
| C*03:04:01G | 6.43 | 5.16 | >0.05 | 1.261 | 0.556–2.521 | |
| DRB1*01:01:01G | 40.00 | 10.25 | 0.034 | 2.189 | 1.373–3.389 | |
| DRB1*03:01:01G | 9.29 | 7.73 | >0.05 | 1.221 | 0.625–2.120 | |
| DRB1*13:01:01G | 8.57 | 6.92 | >0.05 | 1.260 | 0.626–2.319 | |
| DRB1*07:01:01G | 7.86 | 13.36 | >0.05 | 0.553 | 0.267–1.033 | |
| DRB1*11:04:01G | 6.43 | 4.87 | >0.05 | 1.343 | 0.591–2.686 | |
| DQA1*05:01:01G | 30.00 | 24.64 | >0.05 | 1.310 | 0.869–1.949 | |
| DQA1*01:01:01G | 28.57 | 16.51 | 0.0076 | 2.021 | 1.322–3.048 | |
| DQA1*03:01:01G | 17.86 | 11.40 | >0.05 | 1.689 | 1.012–2.733 | |
| DQA1*01:03:01G | 10.00 | 9.13 | >0.05 | 1.105 | 0.567–2.009 | |
| DQA1*02:01:01G | 7.86 | 13.41 | >0.05 | 0.551 | 0.262–1.048 | |
| DQB1*03:01:01G | 26.43 | 22.12 | >0.05 | 1.265 | 0.837–1.875 | |
| DQB1*05:01:01G | 24.29 | 13.12 | 0.01 | 2.124 | 1.383–3.195 | |
| DQB1*02:01:01G | 14.29 | 18.39 | >0.05 | 0.740 | 0.433–1.204 | |
| DQB1*06:03:01G | 8.57 | 7.17 | >0.05 | 1.214 | 0.603–2.233 | |
| DQB1*03:02:01G | 7.14 | 7.22 | >0.05 | 0.988 | 0.458–1.906 | |
| DPB1*04:01:01G | 32.14 | 44.19 | >0.05 | 0.598 | 0.408–0.868 | |
| DPB1*04:02:01G | 22.14 | 13.44 | >0.05 | 1.831 | 1.174–2.786 | |
| DPB1*02:01:02G | 15.71 | 14.66 | >0.05 | 1.086 | 0.649–1.740 | |
| DPB1*03:01:01G | 10.00 | 9.84 | >0.05 | 1.018 | 0.535–1.795 | |
| DPB1*06:01:01G | 3.57 | 1.43 | >0.05 | 2.546 | 0.782–6.470 |
| Locus | No. of Genotypes | Observed Heterozygosity | Expected Heterozygosity | p-Value |
|---|---|---|---|---|
| HLA-A | 70 | 0.88571 | 0.86228 | 0.41045 |
| HLA-B | 70 | 0.92857 | 0.96310 | 0.18927 |
| HLA-C | 70 | 0.90000 | 0.92405 | 0.00358 |
| HLA-DRB1 | 70 | 0.84286 | 0.92652 | 0.00125 |
| HLA-DQA1 | 70 | 0.67143 | 0.78335 | 0.05311 |
| HLA-DQB1 | 70 | 0.72857 | 0.83659 | 0.09385 |
| HLA-DPB1 | 70 | 0.78571 | 0.81408 | 0.18547 |
References
- Wyatt, R.J.; Julian, B.A. IgA Nephropathy. N. Engl. J. Med. 2013, 368, 2402–2414. [Google Scholar] [CrossRef]
- Lai, K.N.; Tang, S.C.W.; Schena, F.P.; Novak, J.; Tomino, Y.; Fogo, A.B.; Glassock, R.J. IgA Nephropathy. Nat. Rev. Dis. Primers 2016, 2, 16001. [Google Scholar] [CrossRef]
- Schena, F.P.; Nistor, I. Epidemiology of IgA Nephropathy: A Global Perspective. Semin. Nephrol. 2018, 38, 435–442. [Google Scholar] [CrossRef]
- Rodrigues, J.C.; Haas, M.; Reich, H.N. IgA Nephropathy. CJASN 2017, 12, 677–686. [Google Scholar] [CrossRef]
- Fabiano, R.C.G.; Pinheiro, S.V.B.; Simões E Silva, A.C. Immunoglobulin A Nephropathy: A Pathophysiology View. Inflamm. Res. 2016, 65, 757–770. [Google Scholar] [CrossRef]
- Coppo, R.; Troyanov, S.; Camilla, R.; Hogg, R.J.; Cattran, D.C.; Terence Cook, H.; Feehally, J.; Roberts, I.S.D.; Amore, A.; Alpers, C.E.; et al. The Oxford IgA Nephropathy Clinicopathological Classification Is Valid for Children as Well as Adults. Kidney Int. 2010, 77, 921–927. [Google Scholar] [CrossRef]
- Coppo, R. Pediatric IgA Nephropathy in Europe. Kidney Dis. 2019, 5, 182–188. [Google Scholar] [CrossRef]
- Zhou, F.-d.; Zhao, M.-h.; Zou, W.-z.; Liu, G.; Wang, H. The Changing Spectrum of Primary Glomerular Diseases within 15 Years: A Survey of 3331 Patients in a Single Chinese Centre. Nephrol. Dial. Transplant. 2008, 24, 870–876. [Google Scholar] [CrossRef]
- Li, L.-S.; Liu, Z.-H. Epidemiologic Data of Renal Diseases from a Single Unit in China: Analysis Based on 13,519 Renal Biopsies. Kidney Int. 2004, 66, 920–923. [Google Scholar] [CrossRef] [PubMed]
- Pan, X.; Xu, J.; Ren, H.; Zhang, W.; Xu, Y.; Shen, P.; Li, X.; Wang, W.; Chen, X.; Wu, P.; et al. Changing Spectrum of Biopsy-Proven Primary Glomerular Diseases over the Past 15 Years: A Single-Center Study in China. In Contributions to Nephrology; Chen, N., Ed.; S. Karger AG: Basel, Switzerland, 2013; Volume 181, pp. 22–30. [Google Scholar]
- Barratt, J.; Feehally, J. IgA Nephropathy. J. Am. Soc. Nephrol. 2005, 16, 2088–2097. [Google Scholar] [CrossRef]
- Rollino, C.; Vischini, G.; Coppo, R. IgA Nephropathy and Infections. J. Nephrol. 2016, 29, 463–468. [Google Scholar] [CrossRef]
- Kuroyanagi, Y.; Takeda, A.; Kinashi, H.; Kuroyanagi, Y.; Murata, M.; Futamura, K.; Goto, N.; Watarai, Y.; Ishimoto, T.; Morozumi, K.; et al. Galactose-Deficient IgA1 Is Involved in IgA Deposition in Renal Grafts Biopsied One Hour after Kidney Transplantation. Intern. Med. 2023, 62, 1581–1589. [Google Scholar] [CrossRef]
- Neugut, Y.D.; Kiryluk, K. Genetic Determinants of IgA Nephropathy: Western Perspective. Semin. Nephrol. 2018, 38, 443–454. [Google Scholar] [CrossRef] [PubMed]
- Levy, M.; Berger, J. Worldwide Perspective of IgA Nephropathy. Am. J. Kidney Dis. 1988, 12, 340–347. [Google Scholar] [CrossRef]
- O’Shaughnessy, M.M.; Hogan, S.L.; Thompson, B.D.; Coppo, R.; Fogo, A.B.; Jennette, J.C. Glomerular Disease Frequencies by Race, Sex and Region: Results from the International Kidney Biopsy Survey. Nephrol. Dial. Transplant. 2018, 33, 661–669. [Google Scholar] [CrossRef]
- Kiryluk, K.; Li, Y.; Scolari, F.; Sanna-Cherchi, S.; Choi, M.; Verbitsky, M.; Fasel, D.; Lata, S.; Prakash, S.; Shapiro, S.; et al. Discovery of New Risk Loci for IgA Nephropathy Implicates Genes Involved in Immunity against Intestinal Pathogens. Nat. Genet. 2014, 46, 1187–1196. [Google Scholar] [CrossRef]
- Julian, B.A.; Quiggins, P.A.; Thompson, J.S.; Woodford, S.Y.; Gleason, K.; Wyatt, R.J. Familial IgA Nephropathy: Evidence of an Inherited Mechanism of Disease. N. Engl. J. Med. 1985, 312, 202–208. [Google Scholar] [CrossRef]
- Wyatt, R.J.; Rivas, M.L.; Julian, B.A.; Quiggins, P.A.; Woodford, S.Y.; McMorrow, R.G.; Baehler, R.W. Regionalization in Hereditary IgA Nephropathy. Am. J. Hum. Genet. 1987, 41, 36–50. [Google Scholar]
- Izzi, C.; Sanna-Cherchi, S.; Prati, E.; Belleri, R.; Remedio, A.; Tardanico, R.; Foramitti, M.; Guerini, S.; Viola, B.F.; Movilli, E.; et al. Familial Aggregation of Primary Glomerulonephritis in an Italian Population Isolate: Valtrompia Study. Kidney Int. 2006, 69, 1033–1040. [Google Scholar] [CrossRef]
- Scolari, F.; Amoroso, A.; Savoldi, S.; Mazzola, G.; Prati, E.; Valzorio, B.; Viola, B.F.; Nicola, B.; Movilli, E.; Sandrini, M.; et al. Familial Clustering of IgA Nephropathy: Further Evidence in an Italian Population. Am. J. Kidney Dis. 1999, 33, 857–865. [Google Scholar] [CrossRef] [PubMed]
- Schena, F.P.; Cerullo, G.; Rossini, M.; Lanzilotta, S.G.; D’Altri, C.; Manno, C. Increased Risk of End-Stage Renal Disease in Familial IgA Nephropathy. J. Am. Soc. Nephrol. 2002, 13, 453–460. [Google Scholar] [CrossRef] [PubMed]
- Gharavi, A.G.; Yan, Y.; Scolari, F.; Schena, F.P.; Frasca, G.M.; Ghiggeri, G.M.; Cooper, K.; Amoroso, A.; Viola, B.F.; Battini, G.; et al. IgA Nephropathy, the Most Common Cause of Glomerulonephritis, Is Linked to 6q22–23. Nat. Genet. 2000, 26, 354–357. [Google Scholar] [CrossRef]
- Bisceglia, L.; Cerullo, G.; Forabosco, P.; Torres, D.D.; Scolari, F.; Di Perna, M.; Foramitti, M.; Amoroso, A.; Bertok, S.; Floege, J.; et al. Genetic Heterogeneity in Italian Families with IgA Nephropathy: Suggestive Linkage for Two Novel IgA Nephropathy Loci. Am. J. Hum. Genet. 2006, 79, 1130–1134. [Google Scholar] [CrossRef]
- Yu, H.-H.; Chu, K.-H.; Yang, Y.-H.; Lee, J.-H.; Wang, L.-C.; Lin, Y.-T.; Chiang, B.-L. Genetics and Immunopathogenesis of IgA Nephropathy. Clin. Rev. Allergy Immunol. 2011, 41, 198–213. [Google Scholar] [CrossRef] [PubMed]
- Cao, H.-X.; Li, M.; Nie, J.; Wang, W.; Zhou, S.-F.; Yu, X.-Q. Human Leukocyte Antigen DRB1 Alleles Predict Risk and Disease Progression of Immunoglobulin A Nephropathy in Han Chinese. Am. J. Nephrol. 2008, 28, 684–691. [Google Scholar] [CrossRef] [PubMed]
- Fennessy, M.; Hitman, G.A.; Moore, R.H.; Metcalfe, K.; Medcraft, J.; Sinico, R.A.; Mustonen, J.T.; D’Amico, G. HLA-DQ Gene Polymorphism in Primary IgA Nephropathy in Three European Populations. Kidney Int. 1996, 49, 477–480. [Google Scholar] [CrossRef]
- Raguénès, O.; Mercier, B.; Clèdes, J.; Whebe, B.; Férec, C. HLA Class II Typing and Idiopathic IgA Nephropathy (IgAN): DQB1*0301, a Possible Marker of Unfavorable Outcome. Tissue Antigens 1995, 45, 246–249. [Google Scholar] [CrossRef]
- Xia, Y.F.; Huang, S.; Li, X.; Yang, N.; Huang, J.; Xue, C.; Zhang, M.; Leung, J.C.K.; Lam, M.F.; Li, J. A Family-Based Association Study of Megsin A23167G Polymorphism with Susceptibility and Progression of IgA Nephropathy in a Chinese Population. Clin. Nephrol. 2006, 65, 153–159. [Google Scholar] [CrossRef]
- Li, Y.-J.; Du, Y.; Li, C.-X.; Guo, H.; Leung, J.C.K.; Lam, M.F.; Yang, N.; Huang, F.; Chen, Y.; Fang, J.-Q.; et al. Family-Based Association Study Showing That Immunoglobulin A Nephropathy Is Associated with the Polymorphisms 2093C and 2180T in the 3′ Untranslated Region of the Megsin Gene. J. Am. Soc. Nephrol. 2004, 15, 1739–1743. [Google Scholar] [CrossRef]
- Wang, W.; Sun, Y.; Fu, Y.; Yu, X.; Li, M. Interaction of C1GALT1–IL5RA on the Susceptibility to IgA Nephropathy in Southern Han Chinese. J. Hum. Genet. 2013, 58, 40–46. [Google Scholar] [CrossRef]
- Wang, W.; Sun, Y.; Fu, Y.; Yu, X.; Li, M. The Effects of Both Single-Locus and Multi-Locus Interaction on the Clinical Manifestations of IgA Nephropathy in Southern Han Chinese. Nephrol. Dial. Transplant. 2014, 29, 550–555. [Google Scholar] [CrossRef][Green Version]
- Zhu, L.; Tang, W.; Li, G.; Lv, J.; Ding, J.; Yu, L.; Zhao, M.; Li, Y.; Zhang, X.; Shen, Y.; et al. Interaction between Variants of Two Glycosyltransferase Genes in IgA Nephropathy. Kidney Int. 2009, 76, 190–198. [Google Scholar] [CrossRef]
- Feehally, J.; Farrall, M.; Boland, A.; Gale, D.P.; Gut, I.; Heath, S.; Kumar, A.; Peden, J.F.; Maxwell, P.H.; Morris, D.L.; et al. HLA Has Strongest Association with IgA Nephropathy in Genome-Wide Analysis. J. Am. Soc. Nephrol. 2010, 21, 1791–1797. [Google Scholar] [CrossRef] [PubMed]
- Gharavi, A.G.; Kiryluk, K.; Choi, M.; Li, Y.; Hou, P.; Xie, J.; Sanna-Cherchi, S.; Men, C.J.; Julian, B.A.; Wyatt, R.J.; et al. Genome-Wide Association Study Identifies Susceptibility Loci for IgA Nephropathy. Nat. Genet. 2011, 43, 321–327. [Google Scholar] [CrossRef] [PubMed]
- Li, M.; Yu, X.-Q. Genetic Determinants of IgA Nephropathy: Eastern Perspective. Semin. Nephrol. 2018, 38, 455–460. [Google Scholar] [CrossRef]
- Li, M.; Foo, J.-N.; Wang, J.-Q.; Low, H.-Q.; Tang, X.-Q.; Toh, K.-Y.; Yin, P.-R.; Khor, C.-C.; Goh, Y.-F.; Irwan, I.D.; et al. Identification of New Susceptibility Loci for IgA Nephropathy in Han Chinese. Nat. Commun. 2015, 6, 7270. [Google Scholar] [CrossRef]
- Trimarchi, H.; Barratt, J.; Cattran, D.C.; Cook, H.T.; Coppo, R.; Haas, M.; Liu, Z.-H.; Roberts, I.S.D.; Yuzawa, Y.; Zhang, H.; et al. Oxford Classification of IgA Nephropathy 2016: An Update from the IgA Nephropathy Classification Working Group. Kidney Int. 2017, 91, 1014–1021. [Google Scholar] [CrossRef] [PubMed]
- Gazda, H.T.; Preti, M.; Sheen, M.R.; O’Donohue, M.-F.; Vlachos, A.; Davies, S.M.; Kattamis, A.; Doherty, L.; Landowski, M.; Buros, C.; et al. Frameshift Mutation in P53 Regulator RPL26 Is Associated with Multiple Physical Abnormalities and a Specific Pre-Ribosomal RNA Processing Defect in Diamond-Blackfan Anemia. Hum. Mutat. 2012, 33, 1037–1044. [Google Scholar] [CrossRef] [PubMed]
- Khamaganova, E.G.; Leonov, E.A.; Abdrakhimova, A.R.; Khizhinskiy, S.P.; Gaponova, T.V.; Savchenko, V.G. HLA Diversity in the Russian Population Assessed by next Generation Sequencing. Med. Immunol. 2021, 23, 509–522. [Google Scholar] [CrossRef]
- Dobronravov, V.A.; Muzhetskaya, T.O.; Lin, D.I.; Kochoyan, Z.S. Immunoglobulin A-Nephropathy in Russian Population: Clinical and Morphological Presentation and Long-Term Prognosis. Nefrologia 2019, 23, 45–60. [Google Scholar] [CrossRef]
- Representing the KNOW-CKD Study Group; Jeong, K.H.; Kim, J.S.; Lee, Y.H.; Kim, Y.G.; Moon, J.-Y.; Kim, S.K.; Kang, S.W.; Kim, T.H.; Lee, S.H.; et al. Genome-Wide Association Study Identifies New Susceptible Loci of IgA Nephropathy in Koreans. BMC Med. Genom. 2019, 12, 122. [Google Scholar] [CrossRef]
- Vo, M.-N.; Terrey, M.; Lee, J.W.; Roy, B.; Moresco, J.J.; Sun, L.; Fu, H.; Liu, Q.; Weber, T.G.; Yates, J.R.; et al. ANKRD16 Prevents Neuron Loss Caused by an Editing-Defective TRNA Synthetase. Nature 2018, 557, 510–515. [Google Scholar] [CrossRef] [PubMed]
- Zajicek, A.S.; Ruan, H.; Dai, H.; Skolfield, M.C.; Phillips, H.L.; Burnette, W.J.; Javidfar, B.; Sun, S.-C.; Akbarian, S.; Yao, W.-D. Cylindromatosis Drives Synapse Pruning and Weakening by Promoting Macroautophagy through Akt-MTOR Signaling. Mol. Psychiatry 2022, 27, 2414–2424. [Google Scholar] [CrossRef] [PubMed]
- Choe, W.; Chae, J.-D.; Yang, J.J.; Hwang, S.-H.; Choi, S.-E.; Oh, H.-B. Identification of 8-Digit HLA-A, -B, -C, and -DRB1 Allele and Haplotype Frequencies in Koreans Using the One Lambda AllType Next-Generation Sequencing Kit. Ann. Lab. Med. 2021, 41, 310–317. [Google Scholar] [CrossRef]
- Cai, M.; Huang, H.; Ran, D.; Zheng, X.; Wen, L.; Zhu, Z.; Liu, L.; Zhang, C.; Hong, X.; Hong, J.; et al. HLA-C*01:02 and HLA-A*02:07 Confer Risk Specific for Psoriatic Patients in Southern China. J. Invest Dermatol. 2019, 139, 2045–2048.e4. [Google Scholar] [CrossRef]
- Jung, E.S.; Cheon, J.H.; Lee, J.H.; Park, S.J.; Jang, H.W.; Chung, S.H.; Park, M.H.; Kim, T.-G.; Oh, H.-B.; Yang, S.-K.; et al. HLA-C*01 Is a Risk Factor for Crohn’s Disease . Inflamm. Bowel Dis. 2016, 22, 796–806. [Google Scholar] [CrossRef] [PubMed]
- Amoli, M.M.; Thomson, W.; Hajeer, A.H.; Calviño, M.C.; Garcia-Porrua, C.; Ollier, W.E.; Gonzalez-Gay, M.A. HLA-DRB1*01 Association with Henoch-Schönlein Purpura in Patients from Northwest Spain. J. Rheumatol. 2001, 28, 1266–1270. [Google Scholar]
- Koskela, M.; Nihtilä, J.; Ylinen, E.; Kolho, K.-L.; Nuutinen, M.; Ritari, J.; Jahnukainen, T. HLA-DQ and HLA-DRB1 Alleles Associated with Henoch-Schönlein Purpura Nephritis in Finnish Pediatric Population: A Genome-Wide Association Study. Pediatr. Nephrol. 2021, 36, 2311–2318. [Google Scholar] [CrossRef]
- Batista-Liz, J.C.; Calvo-Río, V.; Sebastián Mora-Gil, M.; Sevilla-Pérez, B.; Márquez, A.; Leonardo, M.T.; Peñalba, A.; Carmona, F.D.; Narvaez, J.; Martín-Penagos, L.; et al. Mucosal Immune Defence Gene Polymorphisms as Relevant Players in the Pathogenesis of IgA Vasculitis? Int. J. Mol. Sci. 2023, 24, 13063. [Google Scholar] [CrossRef]
- Barbitoff, Y.A.; Khmelkova, D.N.; Pomerantseva, E.A.; Slepchenkov, A.V.; Zubashenko, N.A.; Mironova, I.V.; Kaimonov, V.S.; Polev, D.E.; Tsay, V.V.; Glotov, A.S.; et al. Expanding the Russian Allele Frequency Reference via Cross-Laboratory Data Integration: Insights from 6,096 Exome Samples. medRxiv 2021, preprint. Available online: https://www.medrxiv.org/content/10.1101/2021.11.02.21265801v1 (accessed on 12 April 2023).
- Weaver, K.L.; Alves-Guerra, M.-C.; Jin, K.; Wang, Z.; Han, X.; Ranganathan, P.; Zhu, X.; DaSilva, T.; Liu, W.; Ratti, F.; et al. NACK Is an Integral Component of the Notch Transcriptional Activation Complex and Is Critical for Development and Tumorigenesis. Cancer Res. 2014, 74, 4741–4751. [Google Scholar] [CrossRef]
- Tanaka, H.; Katoh, H.; Negishi, M. Pragmin, a Novel Effector of Rnd2 GTPase, Stimulates RhoA Activity. J. Biol. Chem. 2006, 281, 10355–10364. [Google Scholar] [CrossRef] [PubMed]
- Kutsche, L.K.; Gysi, D.M.; Fallmann, J.; Lenk, K.; Petri, R.; Swiersy, A.; Klapper, S.D.; Pircs, K.; Khattak, S.; Stadler, P.F.; et al. Combined Experimental and System-Level Analyses Reveal the Complex Regulatory Network of MiR-124 during Human Neurogenesis. Cell Syst. 2018, 7, 438–452.e8. [Google Scholar] [CrossRef] [PubMed]
- Machiela, M.J.; Chanock, S.J. LDlink: A Web-Based Application for Exploring Population-Specific Haplotype Structure and Linking Correlated Alleles of Possible Functional Variants. Bioinformatics 2015, 31, 3555–3557. [Google Scholar] [CrossRef]
- Aguirre-Valencia, D.; Ríos-Serna, L.J.; Posso-Osorio, I.; Naranjo-Escobar, J.; López, D.; Bedoya-Joaqui, V.; Nieto-Aristizábal, I.; Castro, A.M.; Díaz-Ordoñez, L.; Navarro, E.P.; et al. Expression of BAFF, APRIL, and Cognate Receptor Genes in Lupus Nephritis and Potential Use as Urinary Biomarkers. J. Transl. Autoimmun. 2020, 3, 100027. [Google Scholar] [CrossRef] [PubMed]
- Ou, M.; Zheng, F.; Zhang, X.; Liu, S.; Tang, D.; Zhu, P.; Qiu, J.; Dai, Y. Integrated Analysis of B-cell and T-cell Receptors by High-throughput Sequencing Reveals Conserved Repertoires in IgA Nephropathy. Mol. Med. Rep. 2018, 17, 7027–7036. [Google Scholar] [CrossRef]
- Van Der Putten, C.; Remmerswaal, E.B.M.; Terpstra, M.L.; Van Der Bom, N.D.; Kers, J.; Ten Berge, I.J.M.; Geerlings, S.E.; Van Lier, R.A.W.; Bemelman, F.J.; Van Aalderen, M.C. CD8 and CD4 T Cell Populations in Human Kidneys. Cells 2021, 10, 288. [Google Scholar] [CrossRef]
- Dorotea, D.; Koya, D.; Ha, H. Recent Insights Into SREBP as a Direct Mediator of Kidney Fibrosis via Lipid-Independent Pathways. Front. Pharmacol. 2020, 11, 265. [Google Scholar] [CrossRef]
- Zhu, Y.; Yang, J.; Li, S.; Cole, S.A.; Haack, K.; Umans, J.G.; Franceschini, N.; Howard, B.V.; Lee, E.T.; Zhao, J. Genetic Variants in Nicotinic Acetylcholine Receptor Genes Jointly Contribute to Kidney Function in American Indians: The Strong Heart Family Study. J. Hypertens. 2014, 32, 1042–1049. [Google Scholar] [CrossRef]
- Kennedy, R.B.; Ovsyannikova, I.G.; Pankratz, V.S.; Haralambieva, I.H.; Vierkant, R.A.; Jacobson, R.M.; Poland, G.A. Genome-Wide Genetic Associations with IFNγ Response to Smallpox Vaccine. Hum. Genet. 2012, 131, 1433–1451. [Google Scholar] [CrossRef] [PubMed]
- Ochiai, K.; Mochida, Y.; Nagase, T.; Fukuhara, H.; Yamaguchi, Y.; Nagase, M. Upregulation of Piezo2 in the Mesangial, Renin, and Perivascular Mesenchymal Cells of the Kidney of Dahl Salt-Sensitive Hypertensive Rats and Its Reversal by Esaxerenone. Hypertens. Res. 2023, 46, 1234–1246. [Google Scholar] [CrossRef] [PubMed]
- Shi, D.; Zhong, Z.; Xu, R.; Li, B.; Li, J.; Habib, U.; Peng, Y.; Mao, H.; Li, Z.; Huang, F.; et al. Association of ITGAX and ITGAM Gene Polymorphisms with Susceptibility to IgA Nephropathy. J. Hum. Genet. 2019, 64, 927–935. [Google Scholar] [CrossRef]
- Zhou, X.-J.; Tsoi, L.C.; Hu, Y.; Patrick, M.T.; He, K.; Berthier, C.C.; Li, Y.; Wang, Y.-N.; Qi, Y.-Y.; Zhang, Y.-M.; et al. Exome Chip Analyses and Genetic Risk for IgA Nephropathy among Han Chinese. Clin. J. Am. Soc. Nephrol. 2021, 16, 213–224. [Google Scholar] [CrossRef]
- Sethi, S.; Haas, M.; Markowitz, G.S.; D’Agati, V.D.; Rennke, H.G.; Jennette, J.C.; Bajema, I.M.; Alpers, C.E.; Chang, A.; Cornell, L.D.; et al. Mayo Clinic/Renal Pathology Society Consensus Report on Pathologic Classification, Diagnosis, and Reporting of GN. J. Am. Soc. Nephrol. 2016, 27, 1278–1287. [Google Scholar] [CrossRef]
- Belova, V.; Pavlova, A.; Afasizhev, R.; Moskalenko, V.; Korzhanova, M.; Krivoy, A.; Cheranev, V.; Nikashin, B.; Bulusheva, I.; Rebrikov, D.; et al. System Analysis of the Sequencing Quality of Human Whole Exome Samples on BGI NGS Platform. Sci. Rep. 2022, 12, 609. [Google Scholar] [CrossRef]
- Andrews, S. FastQC: A Quality Control Tool for High Throughput Sequence Data; Babraham Institute: Cambridge, UK, 2017. [Google Scholar]
- Bushnell, B. BBMap: A Fast, Accurate, Splice-Aware Aligner. 2014. Available online: https://github.com/BioInfoTools/BBMap (accessed on 20 February 2023).
- Li, H.; Durbin, H. Fast and accurate short read alignment with Burrows–Wheeler transform. Bioinformatics 2009, 25, 1754–1760. [Google Scholar] [CrossRef] [PubMed]
- Li, H.; Handsaker, B.; Wysoker, A.; Fennell, T.; Ruan, J.; Homer, N.; Marth, G.; Abecasis, G.; Durbin, R.; 1000 Genome Project Data Processing Subgroup. The Sequence Alignment/Map Format and SAMtools. Bioinformatics 2009, 25, 2078–2079. [Google Scholar] [CrossRef]
- Broad Institute. Picard Toolkit. 2014. Available online: https://broadinstitute.github.io/picard/ (accessed on 27 February 2023).
- Li, H. A Statistical Framework for SNP Calling, Mutation Discovery, Association Mapping and Population Genetical Parameter Estimation from Sequencing Data. Bioinformatics 2011, 27, 2987–2993. [Google Scholar] [CrossRef]
- Tan, A.; Abecasis, G.R.; Kang, H.M. Unified Representation of Genetic Variants. Bioinformatics 2015, 31, 2202–2204. [Google Scholar] [CrossRef]
- Li, Q.; Wang, K. InterVar: Clinical Interpretation of Genetic Variants by the 2015 ACMG-AMP Guidelines. Am. J. Hum. Genet. 2017, 100, 267–280. [Google Scholar] [CrossRef]
- Quinlan, A.R. BEDTools: The Swiss-Army Tool for Genome Feature Analysis. Curr. Protoc. Bioinform. 2014, 47, 11.12.1–11.12.34. [Google Scholar] [CrossRef] [PubMed]
- Purcell, S.; Chang, C. PLINK 1.9. Available online: https://github.com/chrchang/plink-ng/tree/master/1.9 (accessed on 12 March 2023).
- Zhou, Y.; Zhou, B.; Pache, L.; Chang, M.; Khodabakhshi, A.H.; Tanaseichuk, O.; Benner, C.; Chanda, S.K. Metascape Provides a Biologist-Oriented Resource for the Analysis of Systems-Level Datasets. Nat. Commun. 2019, 10, 1523. [Google Scholar] [CrossRef] [PubMed]
- Qiu, C.; Huang, S.; Park, J.; Park, Y.; Ko, Y.-A.; Seasock, M.J.; Bryer, J.S.; Xu, X.-X.; Song, W.-C.; Palmer, M.; et al. Renal Compartment–Specific Genetic Variation Analyses Identify New Pathways in Chronic Kidney Disease. Nat. Med. 2018, 24, 1721–1731. [Google Scholar] [CrossRef] [PubMed]
- Gillies, C.E.; Putler, R.; Menon, R.; Otto, E.; Yasutake, K.; Nair, V.; Hoover, P.; Lieb, D.; Li, S.; Eddy, S.; et al. An EQTL Landscape of Kidney Tissue in Human Nephrotic Syndrome. Am. J. Hum. Genet. 2018, 103, 232–244. [Google Scholar] [CrossRef]
- Schmiedel, B.J.; Singh, D.; Madrigal, A.; Valdovino-Gonzalez, A.G.; White, B.M.; Zapardiel-Gonzalo, J.; Ha, B.; Altay, G.; Greenbaum, J.A.; McVicker, G.; et al. Impact of Genetic Polymorphisms on Human Immune Cell Gene Expression. Cell 2018, 175, 1701–1715.e16. [Google Scholar] [CrossRef]
- Zuo, C.; Shin, S.; Keleş, S. AtSNP: Transcription Factor Binding Affinity Testing for Regulatory SNP Detection. Bioinformatics 2015, 31, 3353–3355. [Google Scholar] [CrossRef]
- Kawaguchi, S.; Higasa, K.; Shimizu, M.; Yamada, R.; Matsuda, F. HLA-HD: An Accurate HLA Typing Algorithm for Next-generation Sequencing Data. Hum. Mutat. 2017, 38, 788–797. [Google Scholar] [CrossRef] [PubMed]
- Ka, S.; Lee, S.; Hong, J.; Cho, Y.; Sung, J.; Kim, H.-N.; Kim, H.-L.; Jung, J. HLAscan: Genotyping of the HLA Region Using next-Generation Sequencing Data. BMC Bioinform. 2017, 18, 258. [Google Scholar] [CrossRef]
- Lee, H.; Kingsford, C. Kourami: Graph-Guided Assembly for Novel Human Leukocyte Antigen Allele Discovery. Genome Biol. 2018, 19, 16. [Google Scholar] [CrossRef] [PubMed]
- Robinson, J.; Barker, D.J.; Georgiou, X.; Cooper, M.A.; Flicek, P.; Marsh, S.G.E. IPD-IMGT/HLA Database. Nucleic Acids Res. 2019, 48, D948–D955. [Google Scholar] [CrossRef]
- Thorvaldsdottir, H.; Robinson, J.T.; Mesirov, J.P. Integrative Genomics Viewer (IGV): High-Performance Genomics Data Visualization and Exploration. Brief. Bioinform. 2013, 14, 178–192. [Google Scholar] [CrossRef]
- Kim, H.-Y. Statistical Notes for Clinical Researchers: Chi-Squared Test and Fisher’s Exact Test. Restor. Dent. Endod. 2017, 42, 152. [Google Scholar] [CrossRef] [PubMed]
- Excoffier, L.; Lischer, H.E.L. Arlequin Suite Ver 3.5: A New Series of Programs to Perform Population Genetics Analyses under Linux and Windows. Mol. Ecol. Resour. 2010, 10, 564–567. [Google Scholar] [CrossRef]


| GENE | CHR | POSITION | MARKER | BONF | A1 | F_A | F_U | A2 | CHISQ | p | OR (95% CI) | SE |
|---|---|---|---|---|---|---|---|---|---|---|---|---|
| Additive | ||||||||||||
| PRAG1 | 8 | 8,176,387 | rs143409664 | 1.808 × 10⁻¹⁵ | CGGGGCG | 0.4571 | 0.07692 | C | 179.8 | 5.464 × 10–41 | 10.11 (6.834–14.94) | 0.1996 |
| ZNF787 | 19 | 56,599,437 | rs5828672 | 2.926 × 10⁻¹⁴ | C | 0.4929 | 0.07849 | CTCG | 205.8 | 1.13 × 10–46 | 11.41 (7.731–16.84) | 0.1986 |
| TRBV5-4 | 7 | 142,168,890 | rs767448033 | 3.146 × 10⁻¹² | T | 0.3571 | 0.07849 | C | 103.3 | 2.906 × 10⁻²⁴ | 6.522 (4.365–9.745) | 0.2048 |
| TENM3 | 4 | 183,370,244 | rs35591339 | 5.646 × 10⁻¹² | A | 0.5071 | 0.08399 | AGCG | 205.3 | 1.485 × 10–46 | 11.22 (7.629–16.51) | 0.1969 |
| PIM1 | 6 | 37,138,023 | rs1300416314 | 2.207 × 10⁻¹¹ | G | 0.4286 | 0.1148 | GGCA | 99.66 | 1.81 × 10⁻²³ | 5.784 (3.969–8.429) | 0.1921 |
| CYTH2 | 19 | 48,985,178 | rs34527214 | 7.812 × 10⁻¹⁰ | TA | 0.5357 | 0.1546 | T | 117.9 | 1.814 × 10⁻²⁷ | 6.308 (4.378–9.089) | 0.1863 |
| MISP3 | 19 | 14,184,713 | rs35666756 | 8.00 × 10⁻⁹ | CG | 0.3429 | 0.09105 | C | 78.01 | 1.028 × 10⁻¹⁸ | 5.208 (3.499–7.753) | 0.2029 |
| EOMES | 3 | 27,763,427 | rs368178421 | 3.243 × 10⁻⁸ | GCGGCGC | 0.3623 | 0.1009 | G | 76.89 | 1.805 × 10⁻¹⁸ | 5.06 (3.418–7.491) | 0.2001 |
| FBXO27 | 19 | 39,505,111 | rs4803184 | 3.255 × 10⁻⁸ | G | 0.4786 | 0.1389 | A | 101.9 | 5.818 × 10⁻²⁴ | 5.688 (3.938–8.216) | 0.1876 |
| SH3PXD2A | 10 | 105,428,453 | rs10533306 | 3.656 × 10⁻⁸ | C | 0.4714 | 0.1852 | CAG | 61.51 | 4.41 × 10⁻¹⁵ | 3.923 (2.735–5.627) | 0.184 |
| Dominant | ||||||||||||
| PRAG1 | 8 | 8,176,387 | rs143409664 | 1.654 × 10⁻¹⁵ | CGGGGCG | 0.4571 | 0.07692 | C | 179.8 | 5.464 × 10–41 | 10.11 (6.834–14.94) | 0.1996 |
| TRBV5-4 | 7 | 142,168,890 | rs767448033 | 3.146 × 10⁻¹² | T | 0.3571 | 0.07849 | C | 103.3 | 2.906 × 10⁻²⁴ | 6.522 (4.365–9.745) | 0.2048 |
| ZNF787 | 19 | 56,599,437 | rs5828672 | 3.25 × 10⁻¹¹ | C | 0.4929 | 0.07849 | CTCG | 205.8 | 1.13 × 10–46 | 11.41 (7.731–16.84) | 0.1986 |
| PIM1 | 6 | 37,138,023 | rs1300416314 | 1.187 × 10⁻¹⁰ | G | 0.4286 | 0.1148 | GGCA | 99.66 | 1.81 × 10⁻²³ | 5.784 (3.969–8.429) | 0.1921 |
| MISP3 | 19 | 14,184,713 | rs35666756 | 3.523 × 10⁻⁹ | CG | 0.3429 | 0.09105 | C | 78.01 | 1.028 × 10⁻¹⁸ | 5.208 (3.499–7.753) | 0.2029 |
| EOMES | 3 | 27,763,427 | rs368178421 | 3.964 × 10⁻⁹ | GCGGCGC | 0.3623 | 0.1009 | G | 76.89 | 1.805 × 10⁻¹⁸ | 5.06 (3.418–7.491) | 0.2001 |
| SREBF1 | 17 | 17,740,164 | rs60282872 | 2.629 × 10⁻⁸ | G | 0.2643 | 0.08477 | GC | 44.17 | 3.013 × 10⁻¹¹ | 3.878 (2.537–5.928) | 0.2165 |
| PRTN3 | 19 | 843,692 | rs2301879 | 3.49 × 10⁻⁸ | G | 0.2929 | 0.08948 | A | 53.45 | 2.646 × 10⁻¹³ | 4.214 (2.792–6.361) | 0.2101 |
| AMACR | 5 | 34,008,206 | rs3217251 | 6.688 × 10⁻⁸ | C | 0.2857 | 0.08085 | CCGGCGCCACGCCCCCAGCCG | 58.24 | 2.322 × 10⁻¹⁴ | 4.548 (2.993–6.91) | 0.2135 |
| CHRNA3 | 15 | 78,913,067 | rs751352647 | 1.363 × 10⁻⁷ | A | 0.4214 | 0.1546 | ACAG | 60.56 | 7.149 × 10⁻¹⁵ | 3.982 (2.755–5.755) | 0.1879 |
| Recessive | ||||||||||||
| UBR3 | 2 | 170,871,976 | rs13028230 | 1.545 × 10⁻⁹ | A | 0.5429 | 0.2951 | G | 35.59 | 2.431 × 10⁻⁹ | 2.836 (1.991–4.039) | 0.1804 |
| PKD1L1 | 7 | 47,835,116 | rs2348459 | 2.031 × 10⁻⁹ | T | 0.5571 | 0.2363 | C | 66.2 | 4.077 × 10⁻¹⁶ | 4.067 (2.844–5.815) | 0.1825 |
| DNAH11 | 7 | 21,639,818 | rs6461586 | 2.649 × 10⁻⁹ | T | 0.3643 | 0.1586 | C | 36.34 | 1.657 × 10⁻⁹ | 3.041 (2.089–4.427) | 0.1916 |
| CIAO2A | 15 | 64,381,148 | rs16947748 | 2.861 × 10⁻⁹ | G | 0.5786 | 0.2841 | A | 50.83 | 1.01 × 10⁻¹² | 3.459 (2.421–4.942) | 0.1821 |
| TRMT9B | 8 | 12,870,438 | rs2466264 | 6.754 × 10⁻⁹ | C | 0.6714 | 0.3265 | G | 65.07 | 7.224 × 10⁻¹⁶ | 4.215 (2.907–6.112) | 0.1896 |
| MDN1 | 6 | 90,400,292 | rs954638 | 9.888 × 10⁻⁹ | C | 0.4929 | 0.179 | T | 74.9 | 4.943 × 10⁻¹⁸ | 4.458 (3.108–6.397) | 0.1842 |
| PIEZO2 | 18 | 10,757,868 | rs7242408 | 1.003 × 10⁻⁸ | A | 0.5071 | 0.2276 | G | 51.83 | 6.039 × 10⁻¹³ | 3.491 (2.445–4.986) | 0.1818 |
| OR10G6 | 11 | 123,865,086 | rs7944434 | 1.053 × 10⁻⁸ | A | 0.4571 | 0.1743 | C | 62.56 | 2.583 × 10⁻¹⁵ | 3.991 (2.777–5.735) | 0.185 |
| PWP2 | 21 | 45,547,563 | rs2242954 | 1.658 × 10⁻⁸ | G | 0.4 | 0.1931 | C | 32.15 | 1.427 × 10⁻⁸ | 2.786 (1.933–4.016) | 0.1865 |
| BAIAP2 | 17 | 79,084,072 | rs4072588 | 2.268 × 10⁻⁸ | T | 0.5214 | 0.2339 | G | 53.88 | 2.132 × 10⁻¹³ | 3.568 (2.499–5.095) | 0.1817 |
Disclaimer/Publisher’s Note: The statements, opinions and data contained in all publications are solely those of the individual author(s) and contributor(s) and not of MDPI and/or the editor(s). MDPI and/or the editor(s) disclaim responsibility for any injury to people or property resulting from any ideas, methods, instructions or products referred to in the content. |
© 2023 by the authors. Licensee MDPI, Basel, Switzerland. This article is an open access article distributed under the terms and conditions of the Creative Commons Attribution (CC BY) license (https://creativecommons.org/licenses/by/4.0/).
Share and Cite
Buianova, A.A.; Proskura, M.V.; Cheranev, V.V.; Belova, V.A.; Shmitko, A.O.; Pavlova, A.S.; Vasiliadis, I.A.; Suchalko, O.N.; Rebrikov, D.V.; Petrosyan, E.K.; et al. Candidate Genes for IgA Nephropathy in Pediatric Patients: Exome-Wide Association Study. Int. J. Mol. Sci. 2023, 24, 15984. https://doi.org/10.3390/ijms242115984
Buianova AA, Proskura MV, Cheranev VV, Belova VA, Shmitko AO, Pavlova AS, Vasiliadis IA, Suchalko ON, Rebrikov DV, Petrosyan EK, et al. Candidate Genes for IgA Nephropathy in Pediatric Patients: Exome-Wide Association Study. International Journal of Molecular Sciences. 2023; 24(21):15984. https://doi.org/10.3390/ijms242115984
Chicago/Turabian StyleBuianova, Anastasiia A., Mariia V. Proskura, Valery V. Cheranev, Vera A. Belova, Anna O. Shmitko, Anna S. Pavlova, Iuliia A. Vasiliadis, Oleg N. Suchalko, Denis V. Rebrikov, Edita K. Petrosyan, and et al. 2023. "Candidate Genes for IgA Nephropathy in Pediatric Patients: Exome-Wide Association Study" International Journal of Molecular Sciences 24, no. 21: 15984. https://doi.org/10.3390/ijms242115984
APA StyleBuianova, A. A., Proskura, M. V., Cheranev, V. V., Belova, V. A., Shmitko, A. O., Pavlova, A. S., Vasiliadis, I. A., Suchalko, O. N., Rebrikov, D. V., Petrosyan, E. K., & Korostin, D. O. (2023). Candidate Genes for IgA Nephropathy in Pediatric Patients: Exome-Wide Association Study. International Journal of Molecular Sciences, 24(21), 15984. https://doi.org/10.3390/ijms242115984