
Exploring the Binding Effects of Natural Products and Antihypertensive Drugs on SARS-CoV-2: An In Silico Investigation of Main Protease and Spike Protein

 , ,
, ,  and
and 
Abstract
: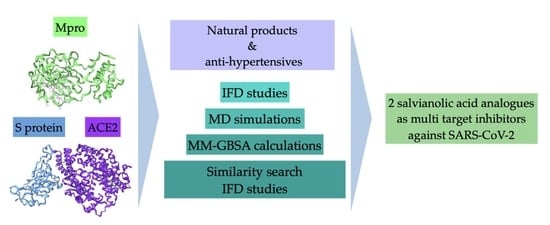
1. Introduction
2. Results
2.1. Molecular Docking Results
2.2. Molecular Dynamics Analysis
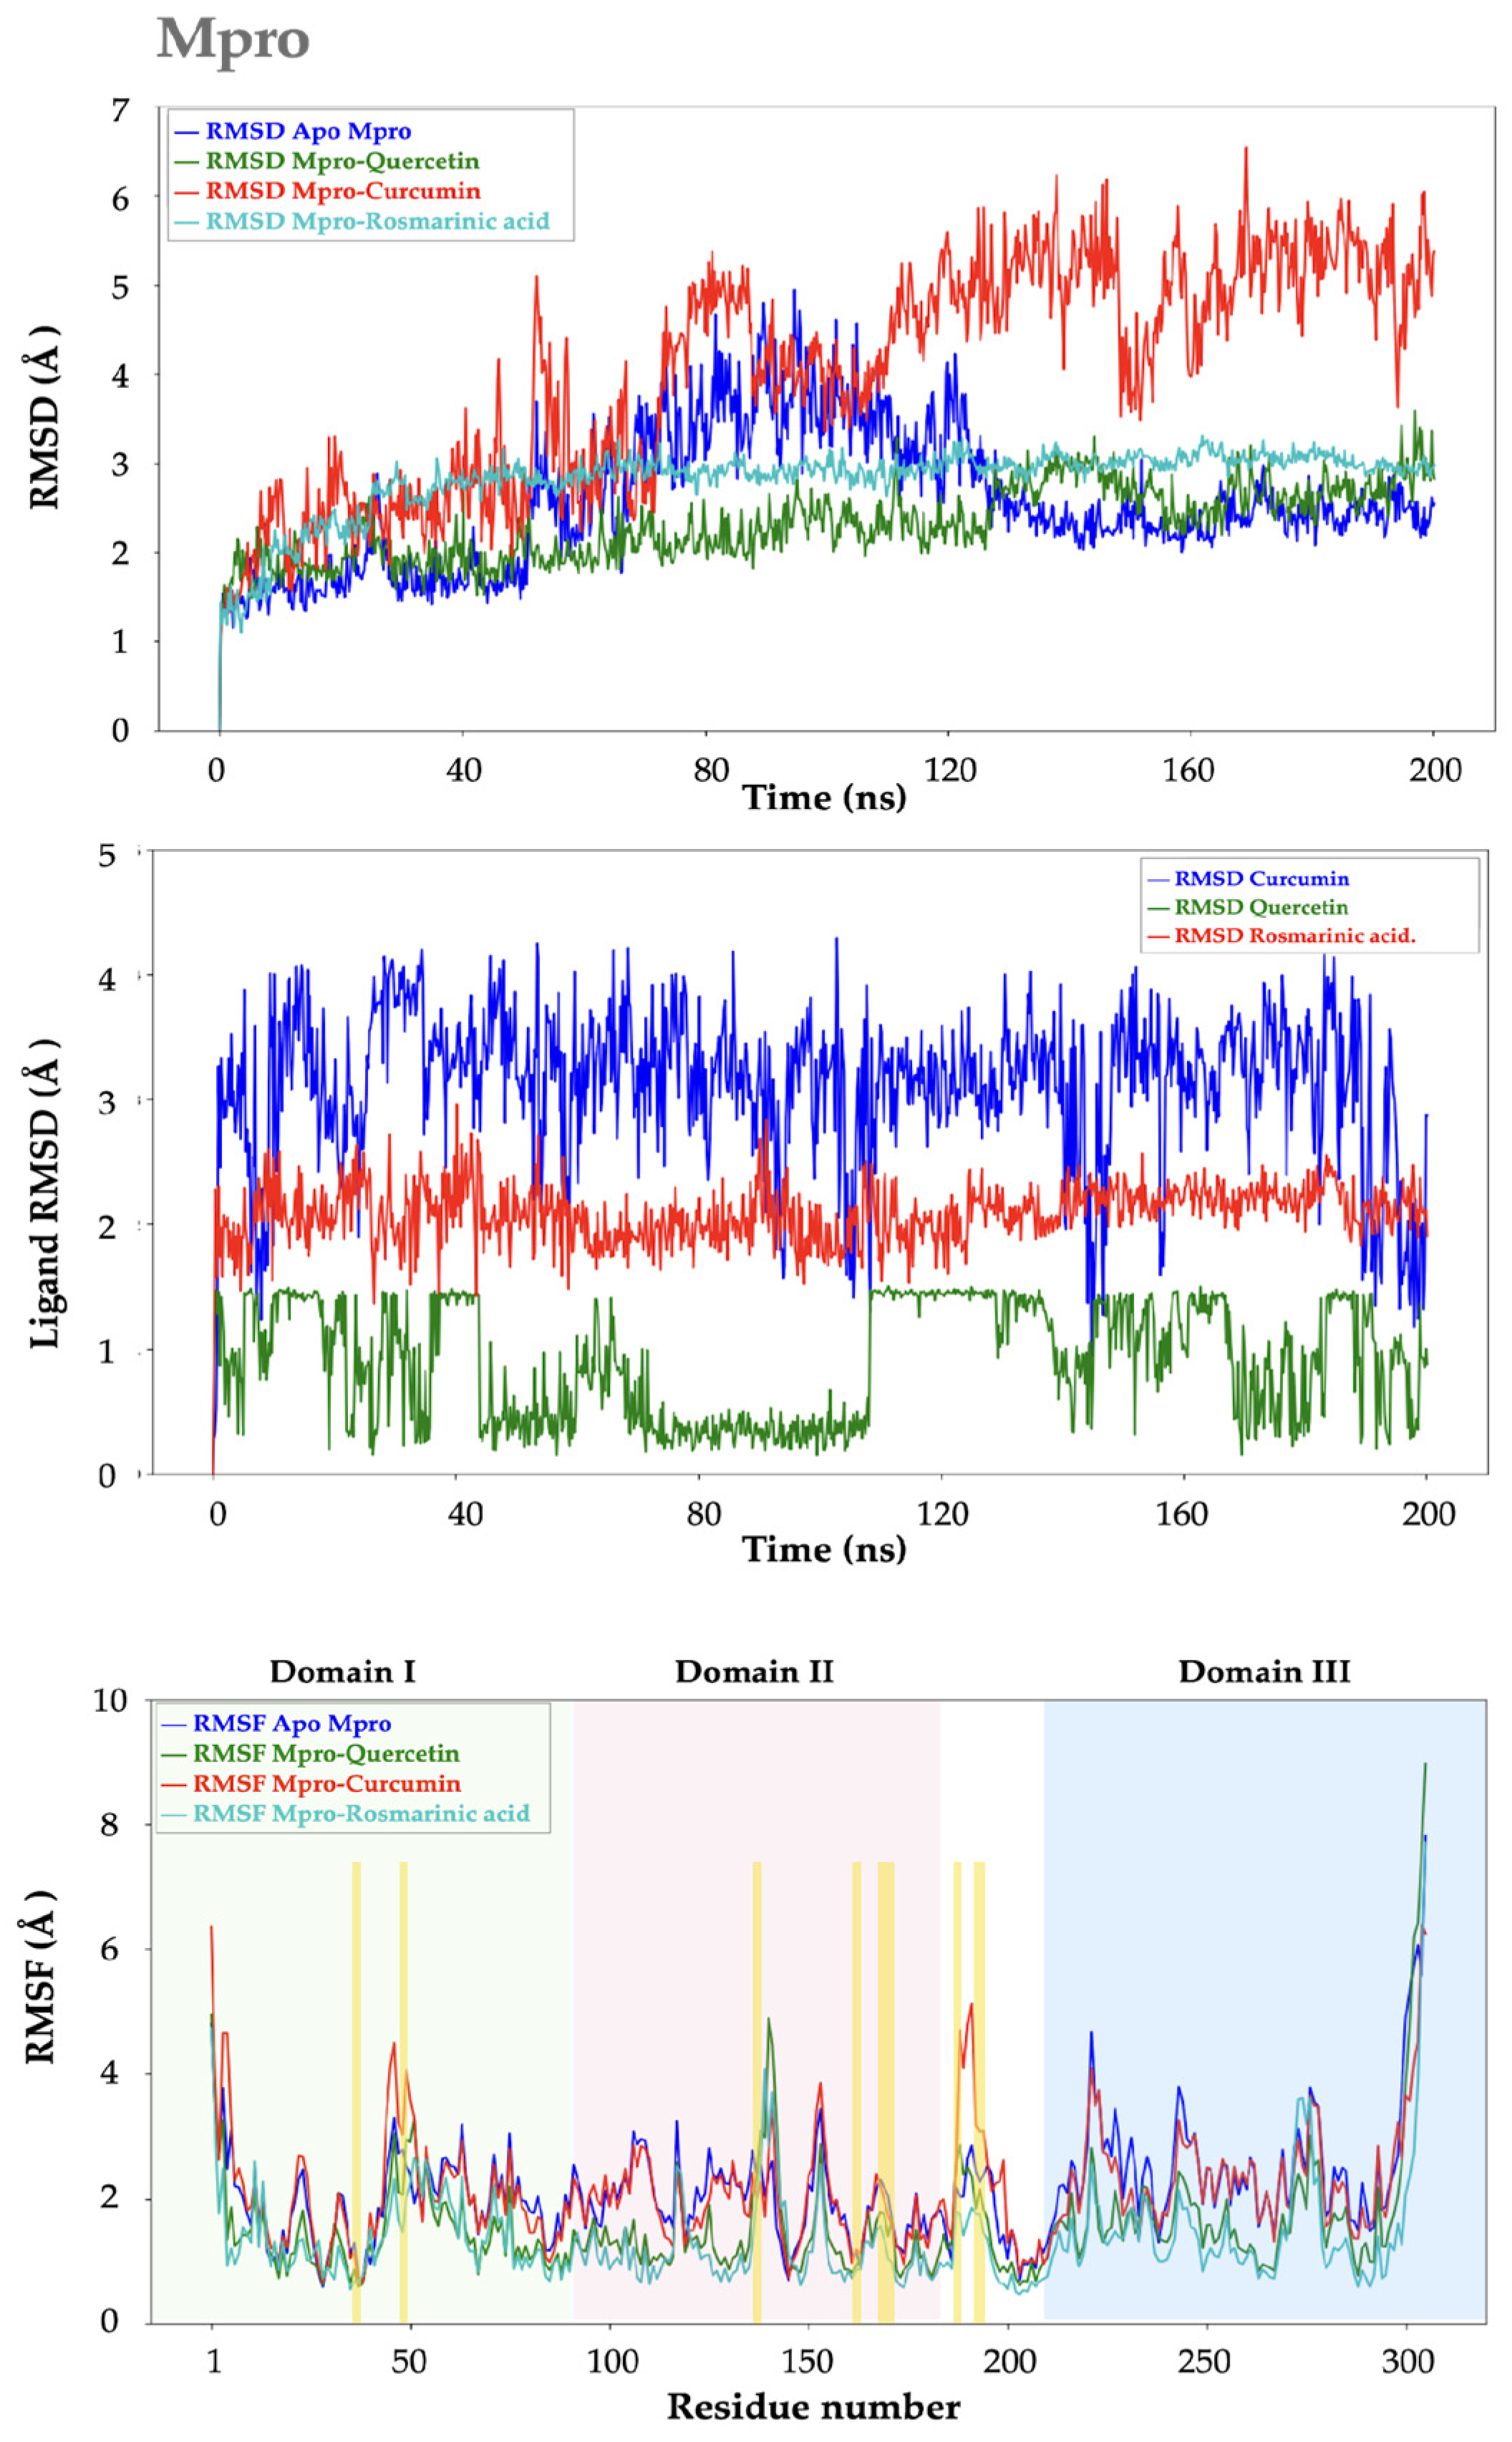
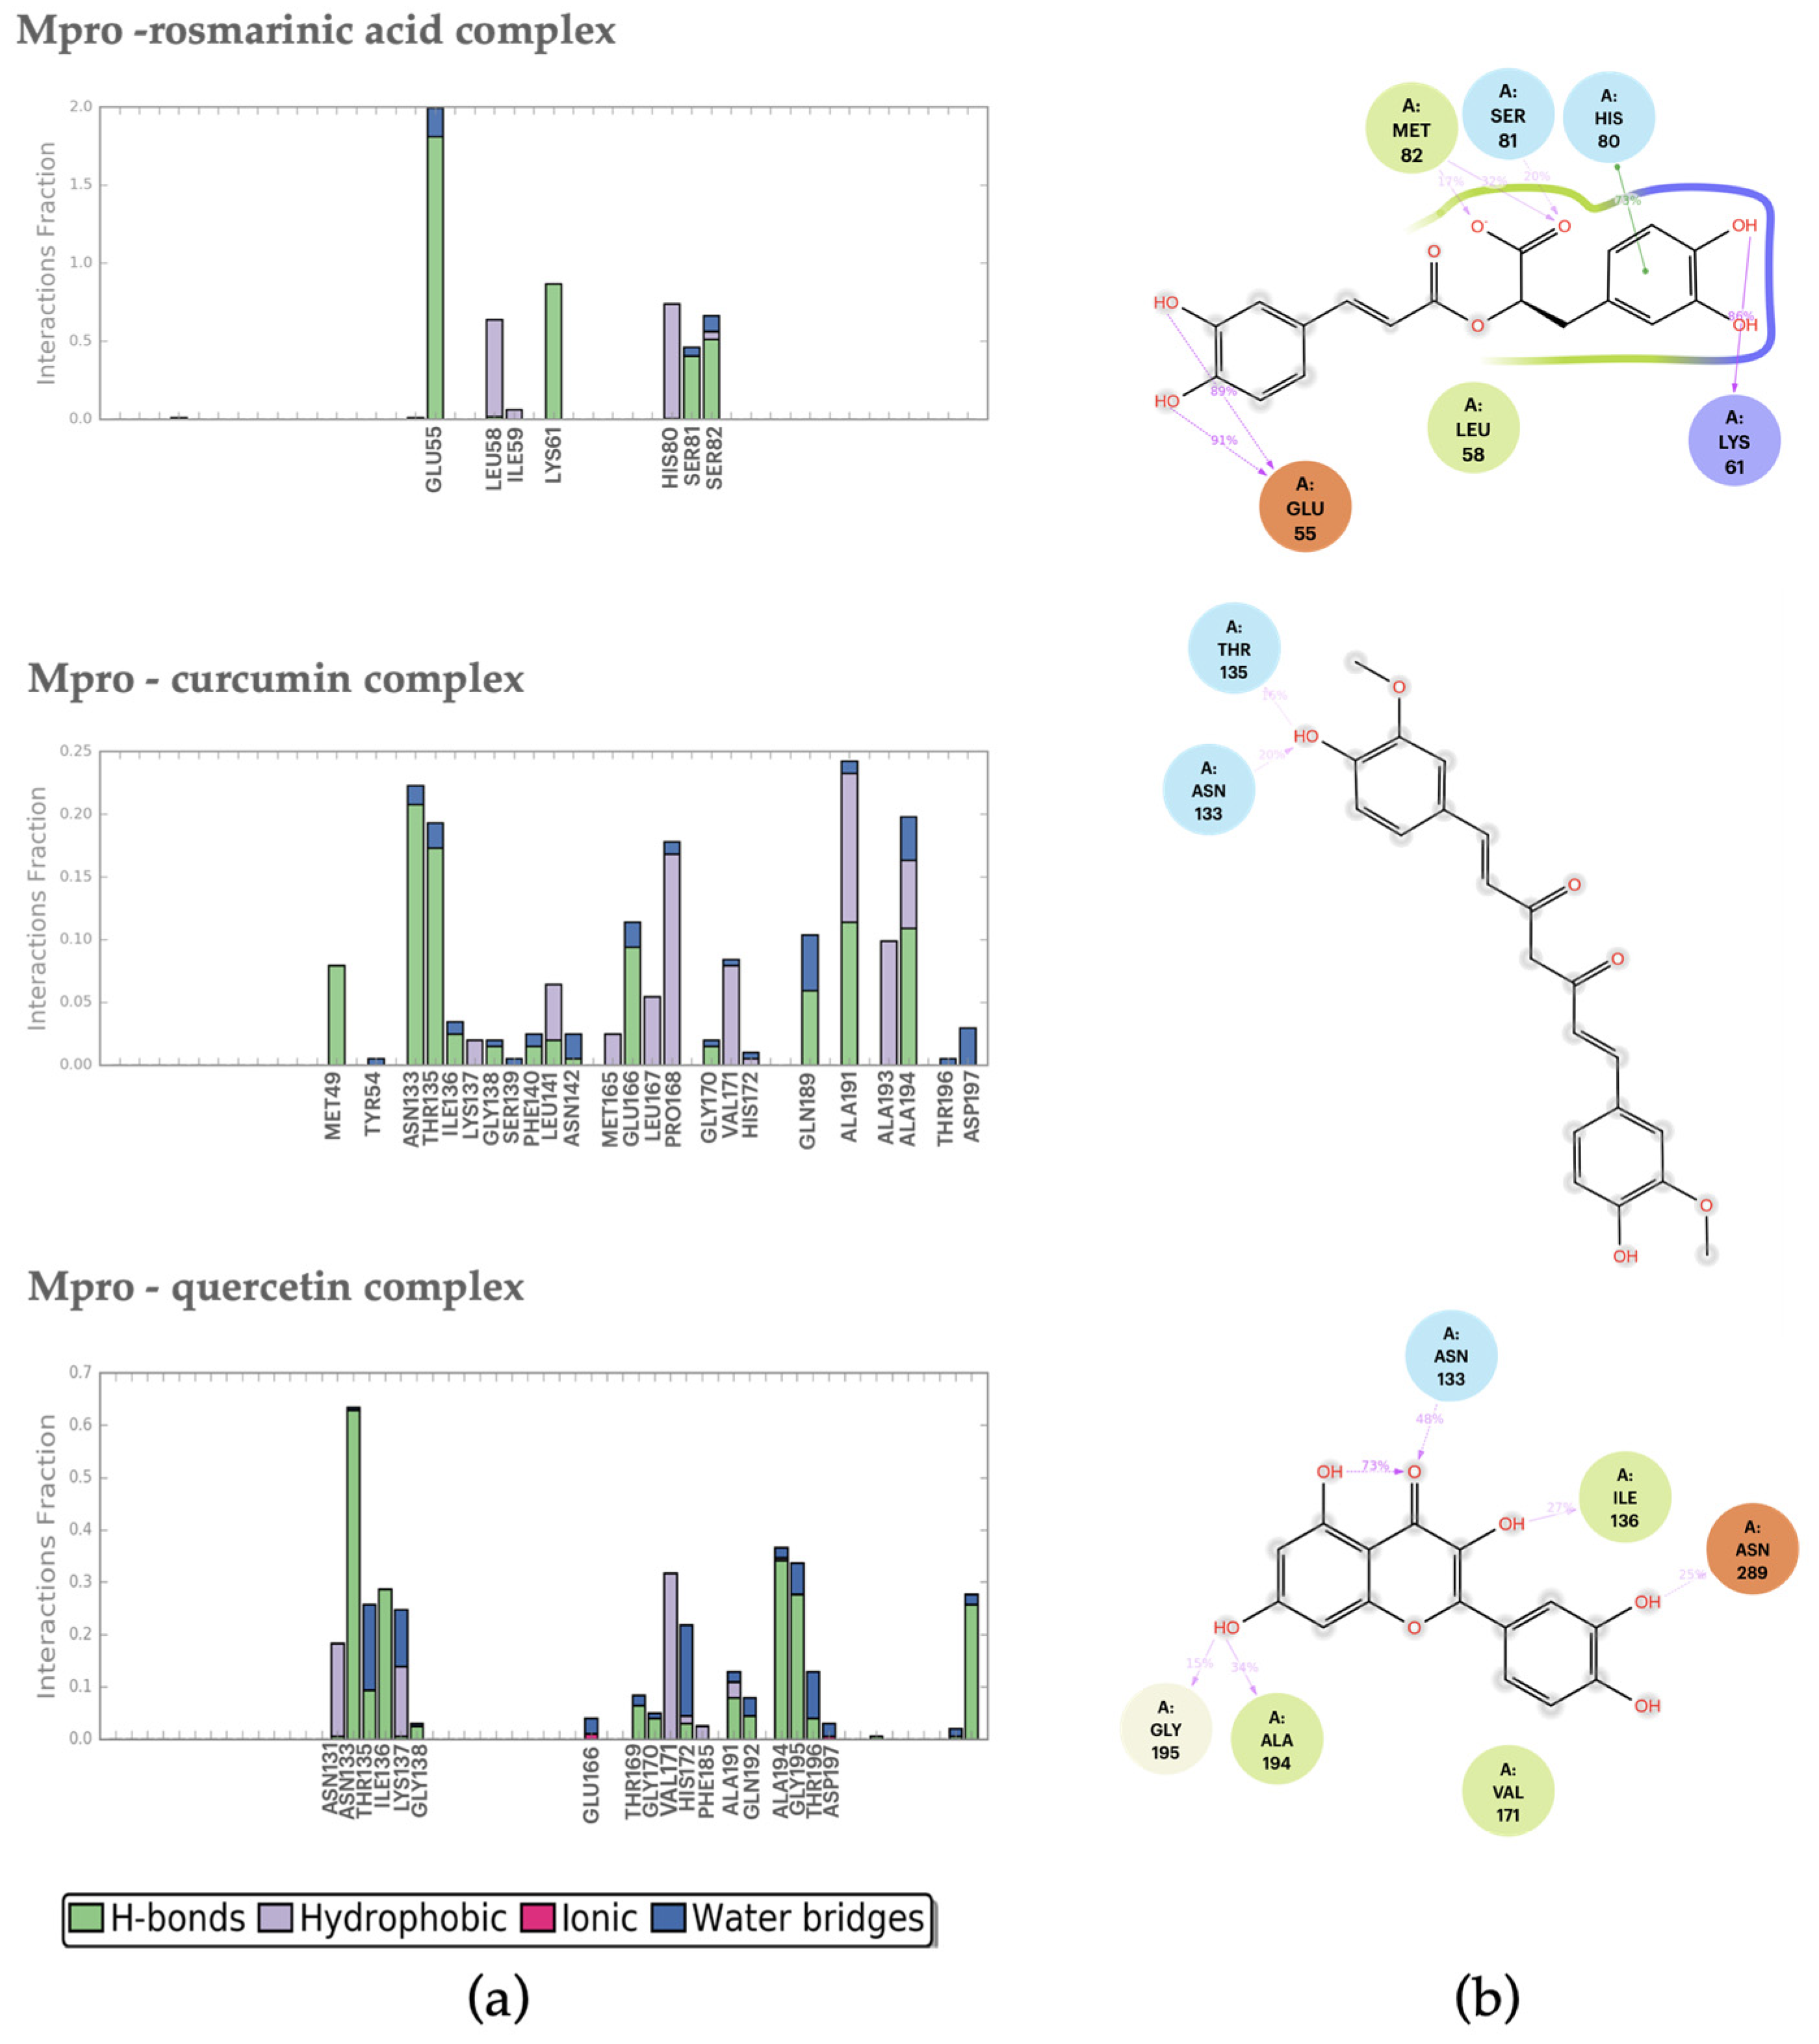
2.2.1. Mpro–Ligand Complexes
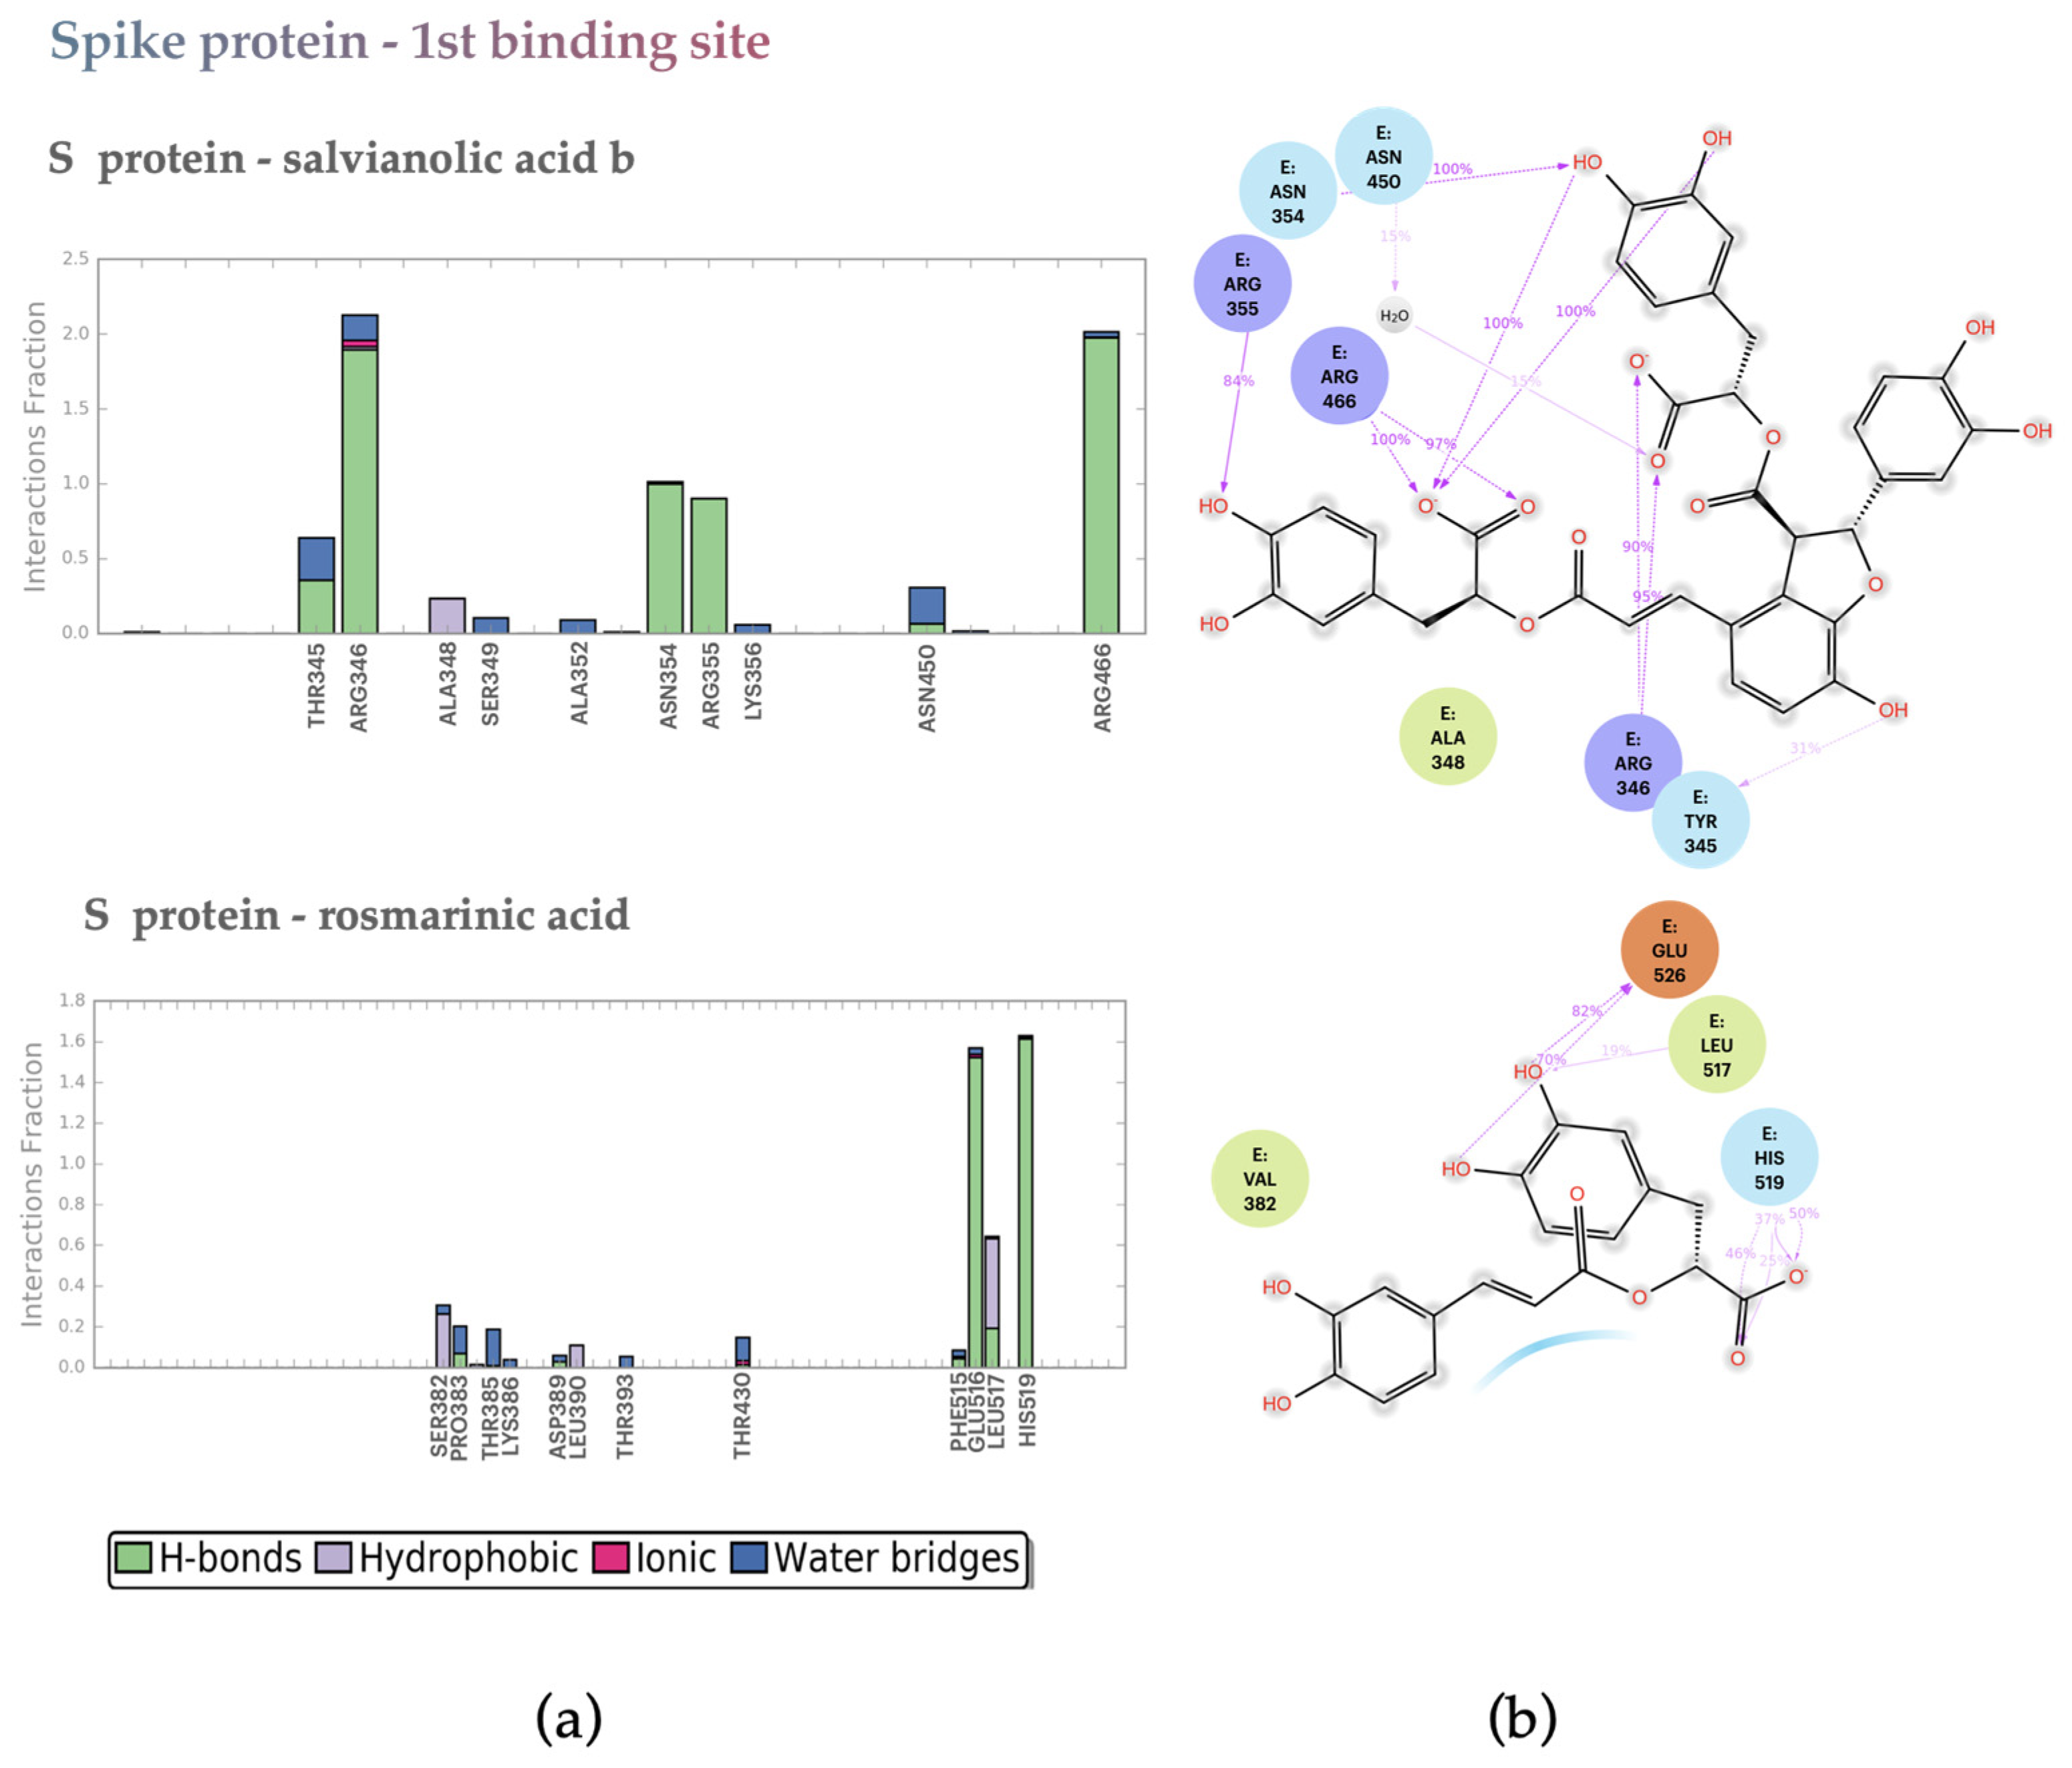
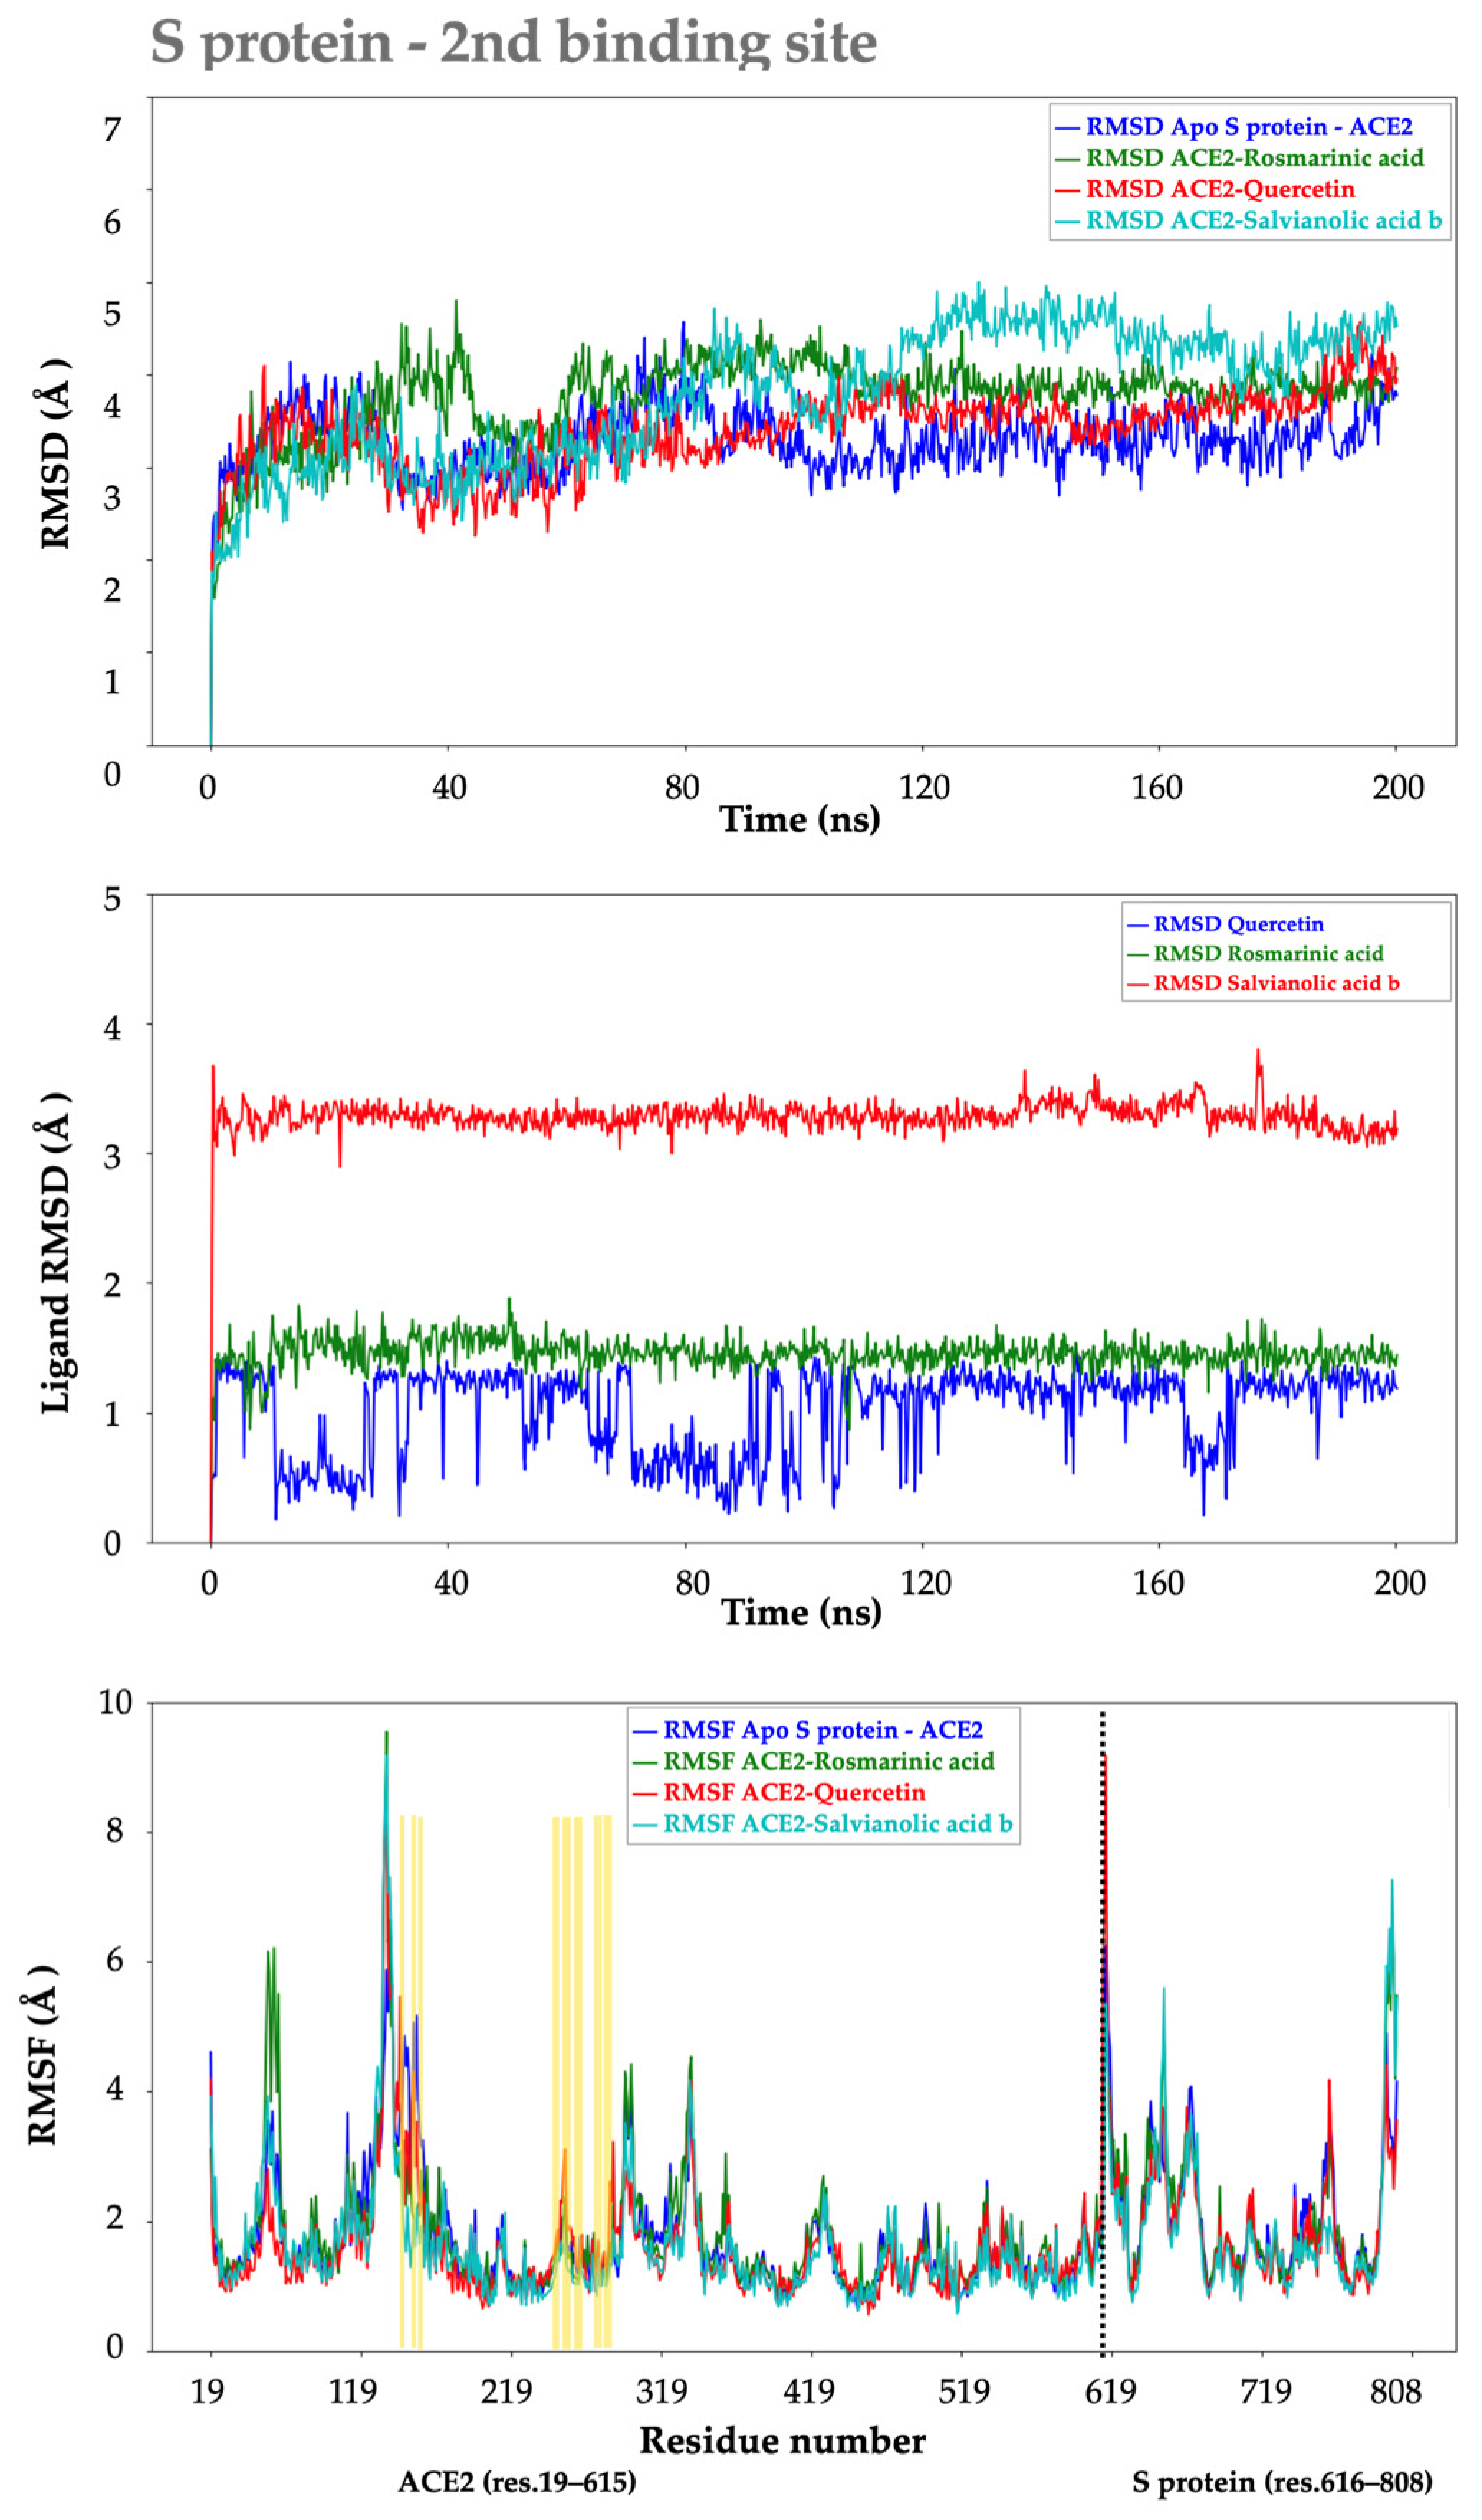
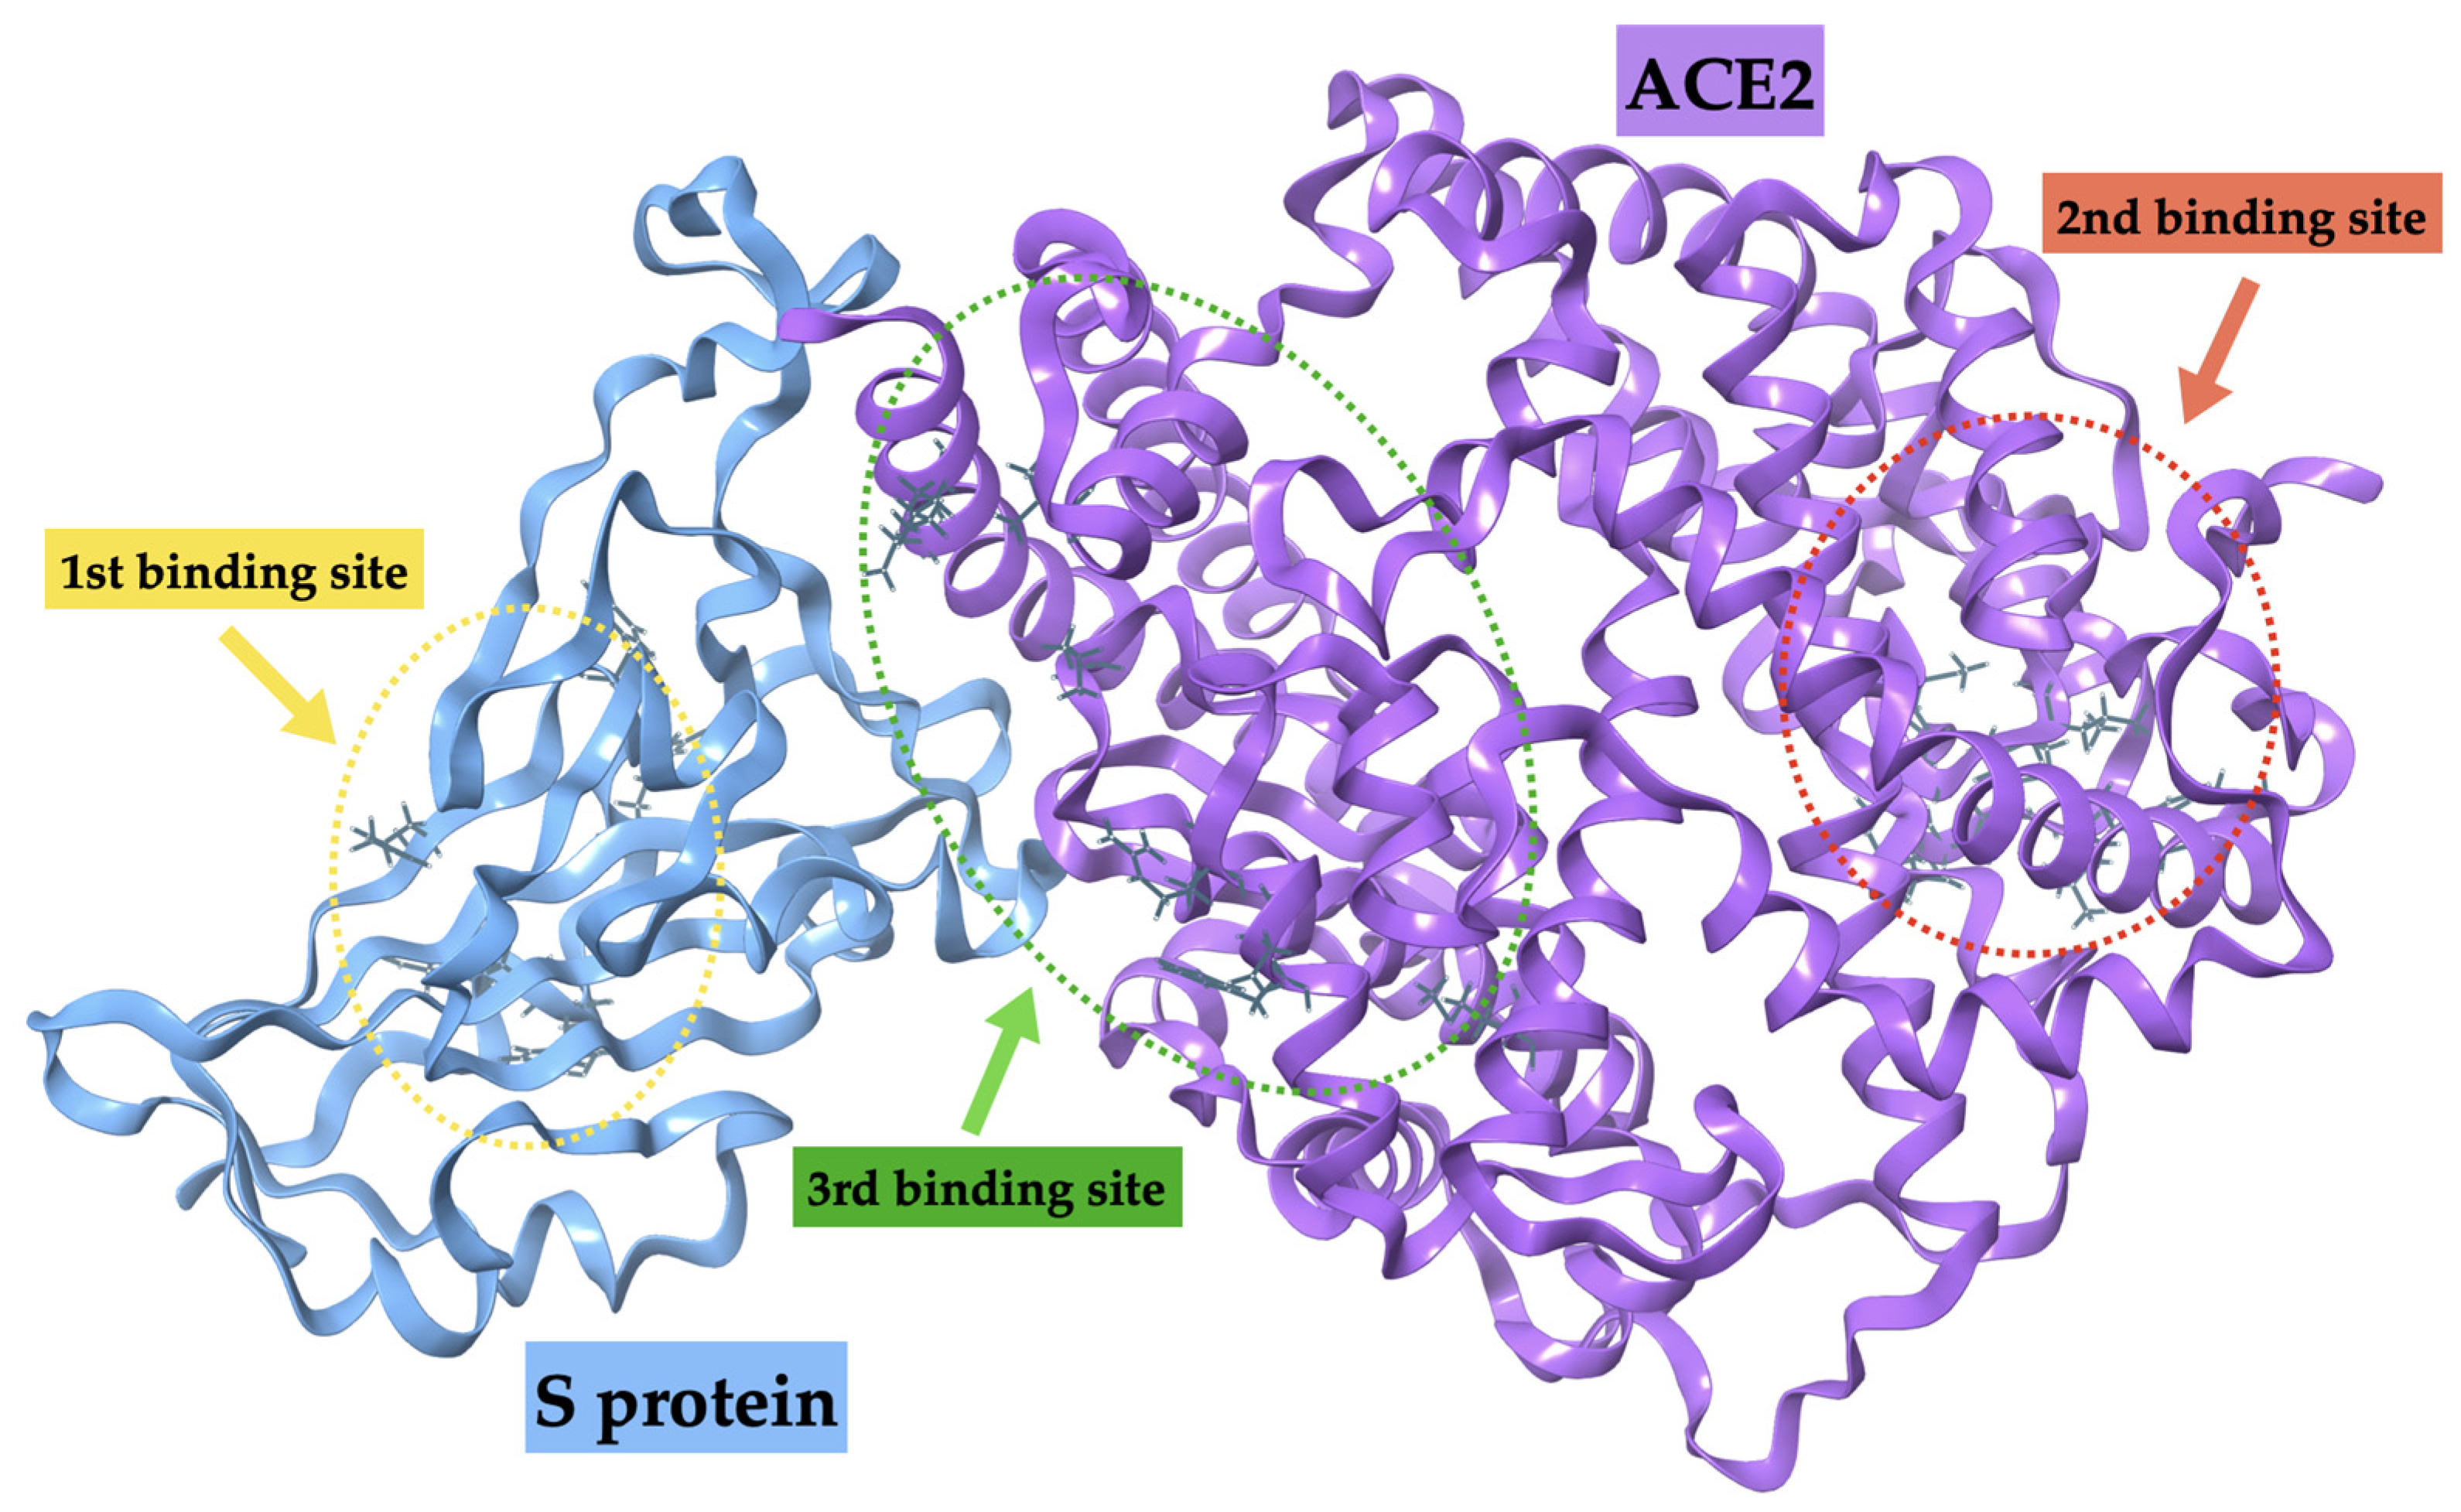
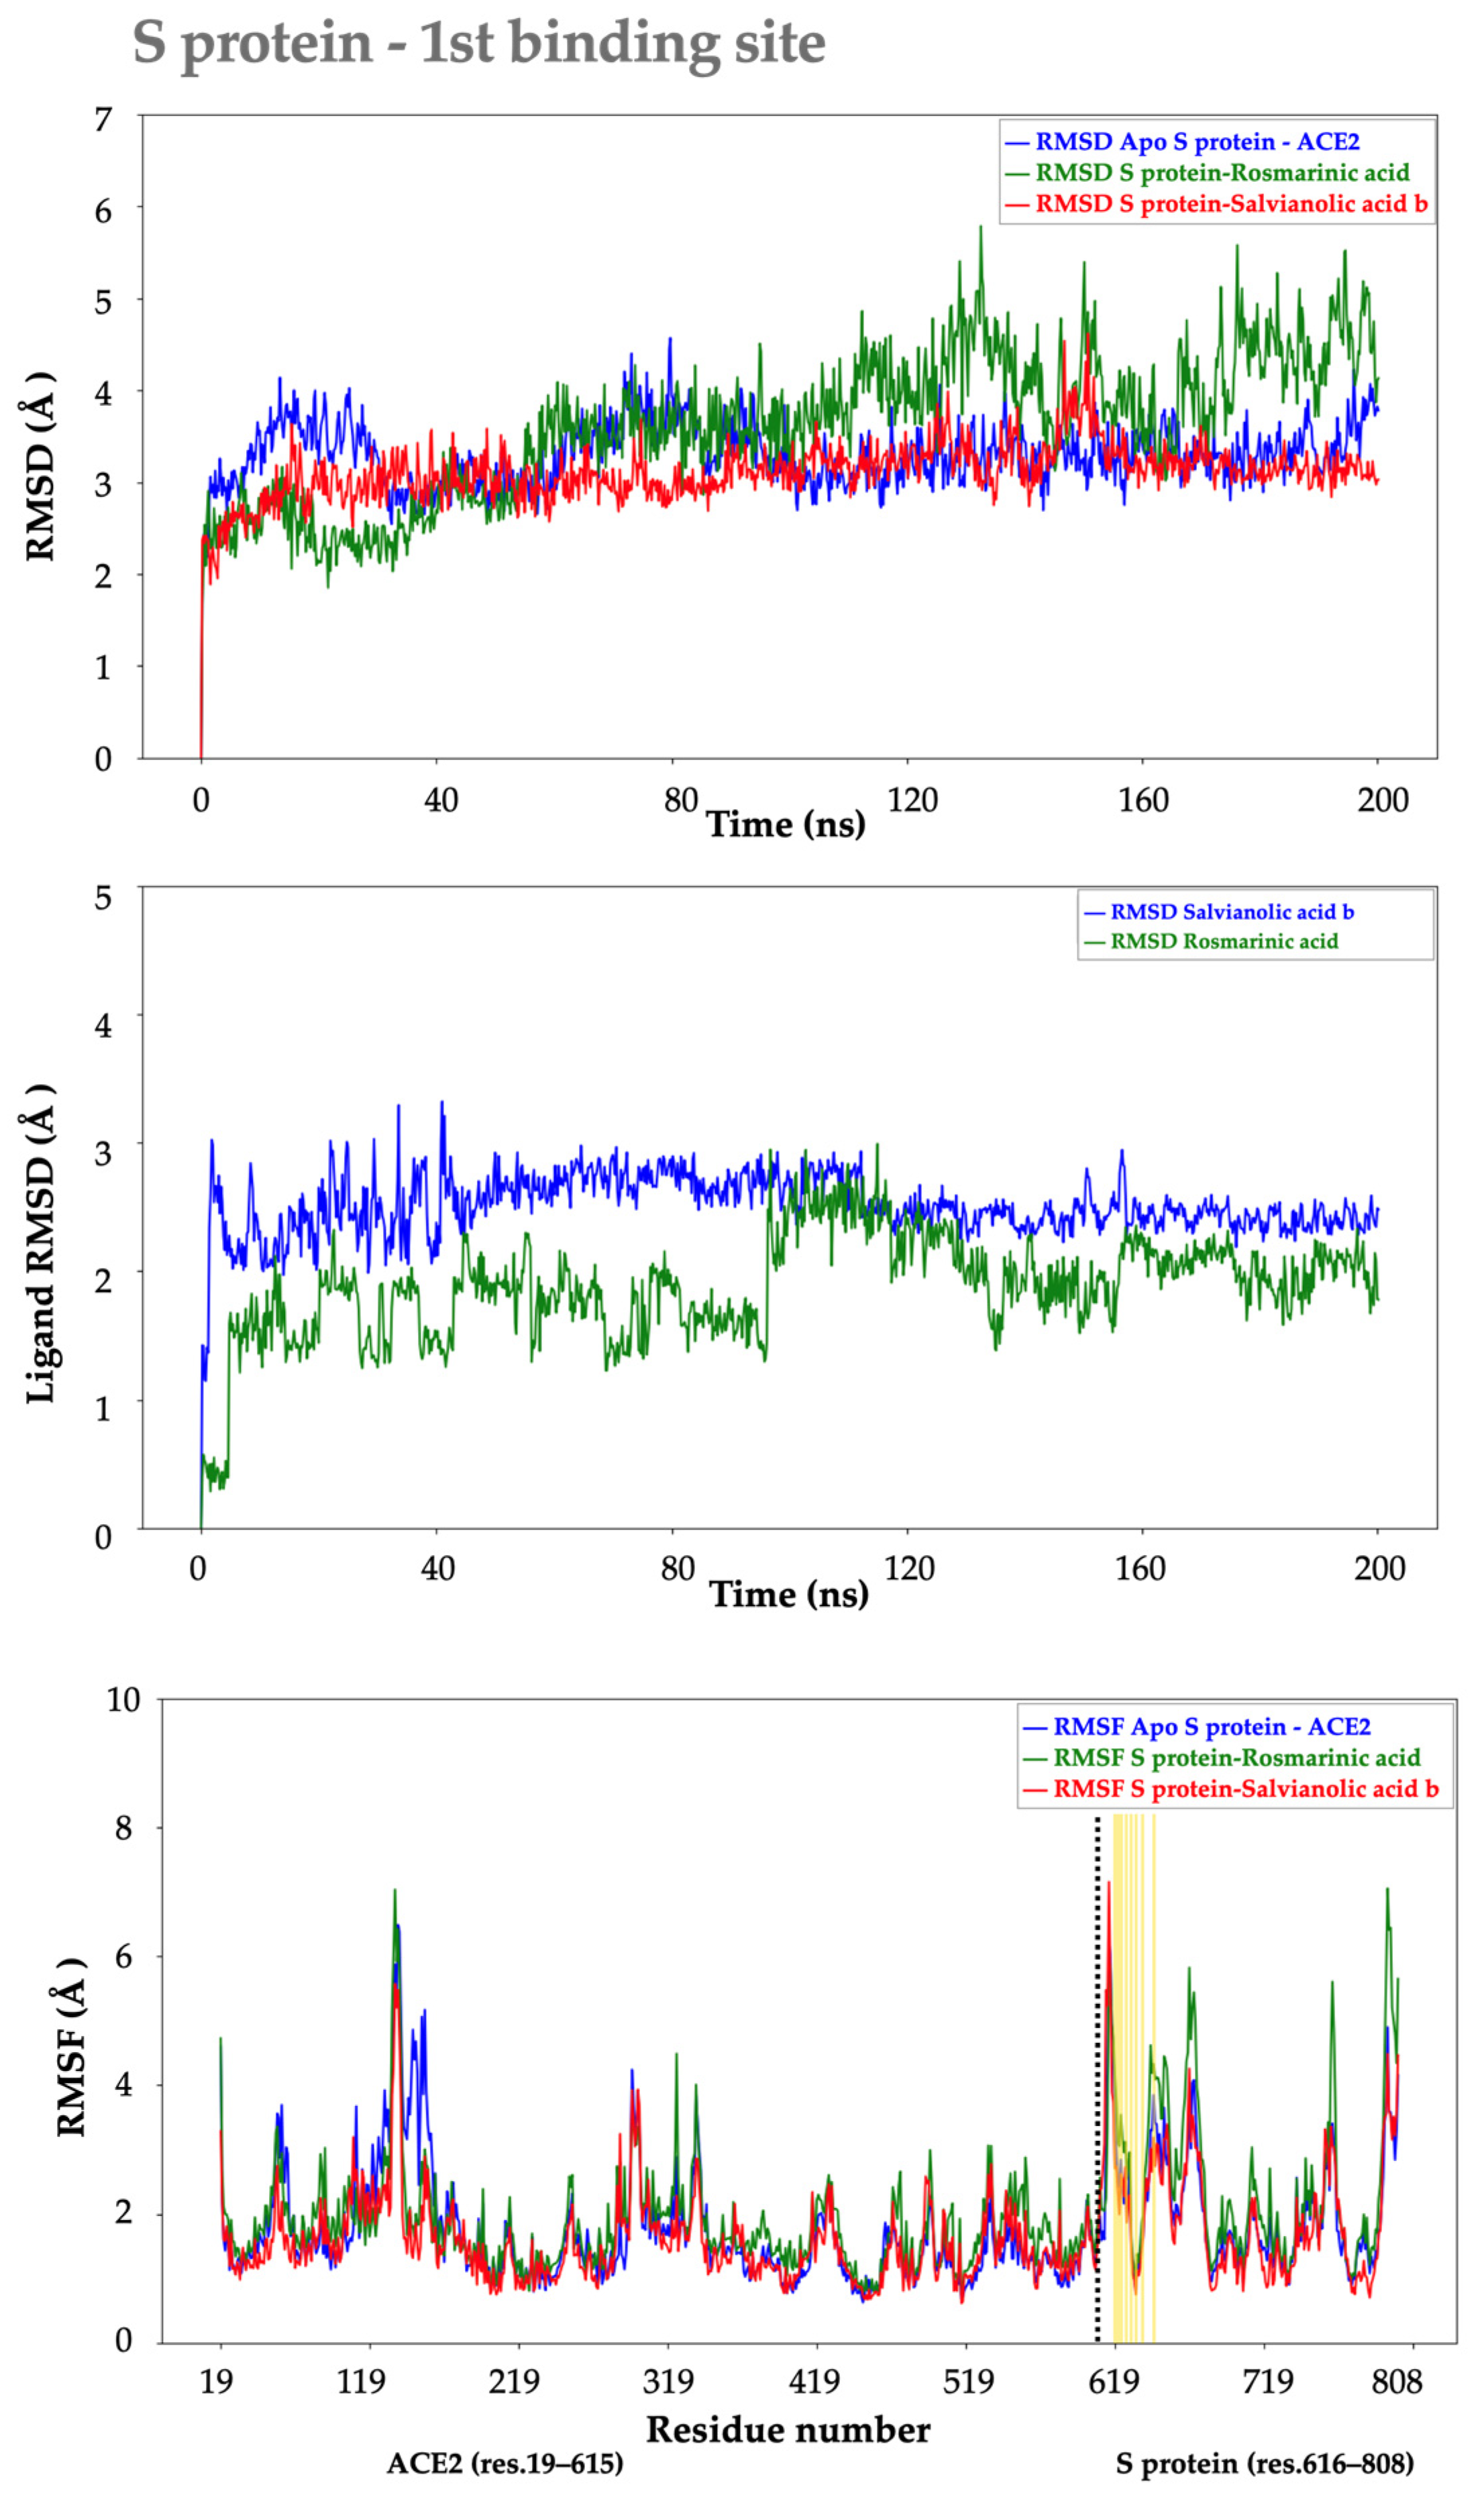
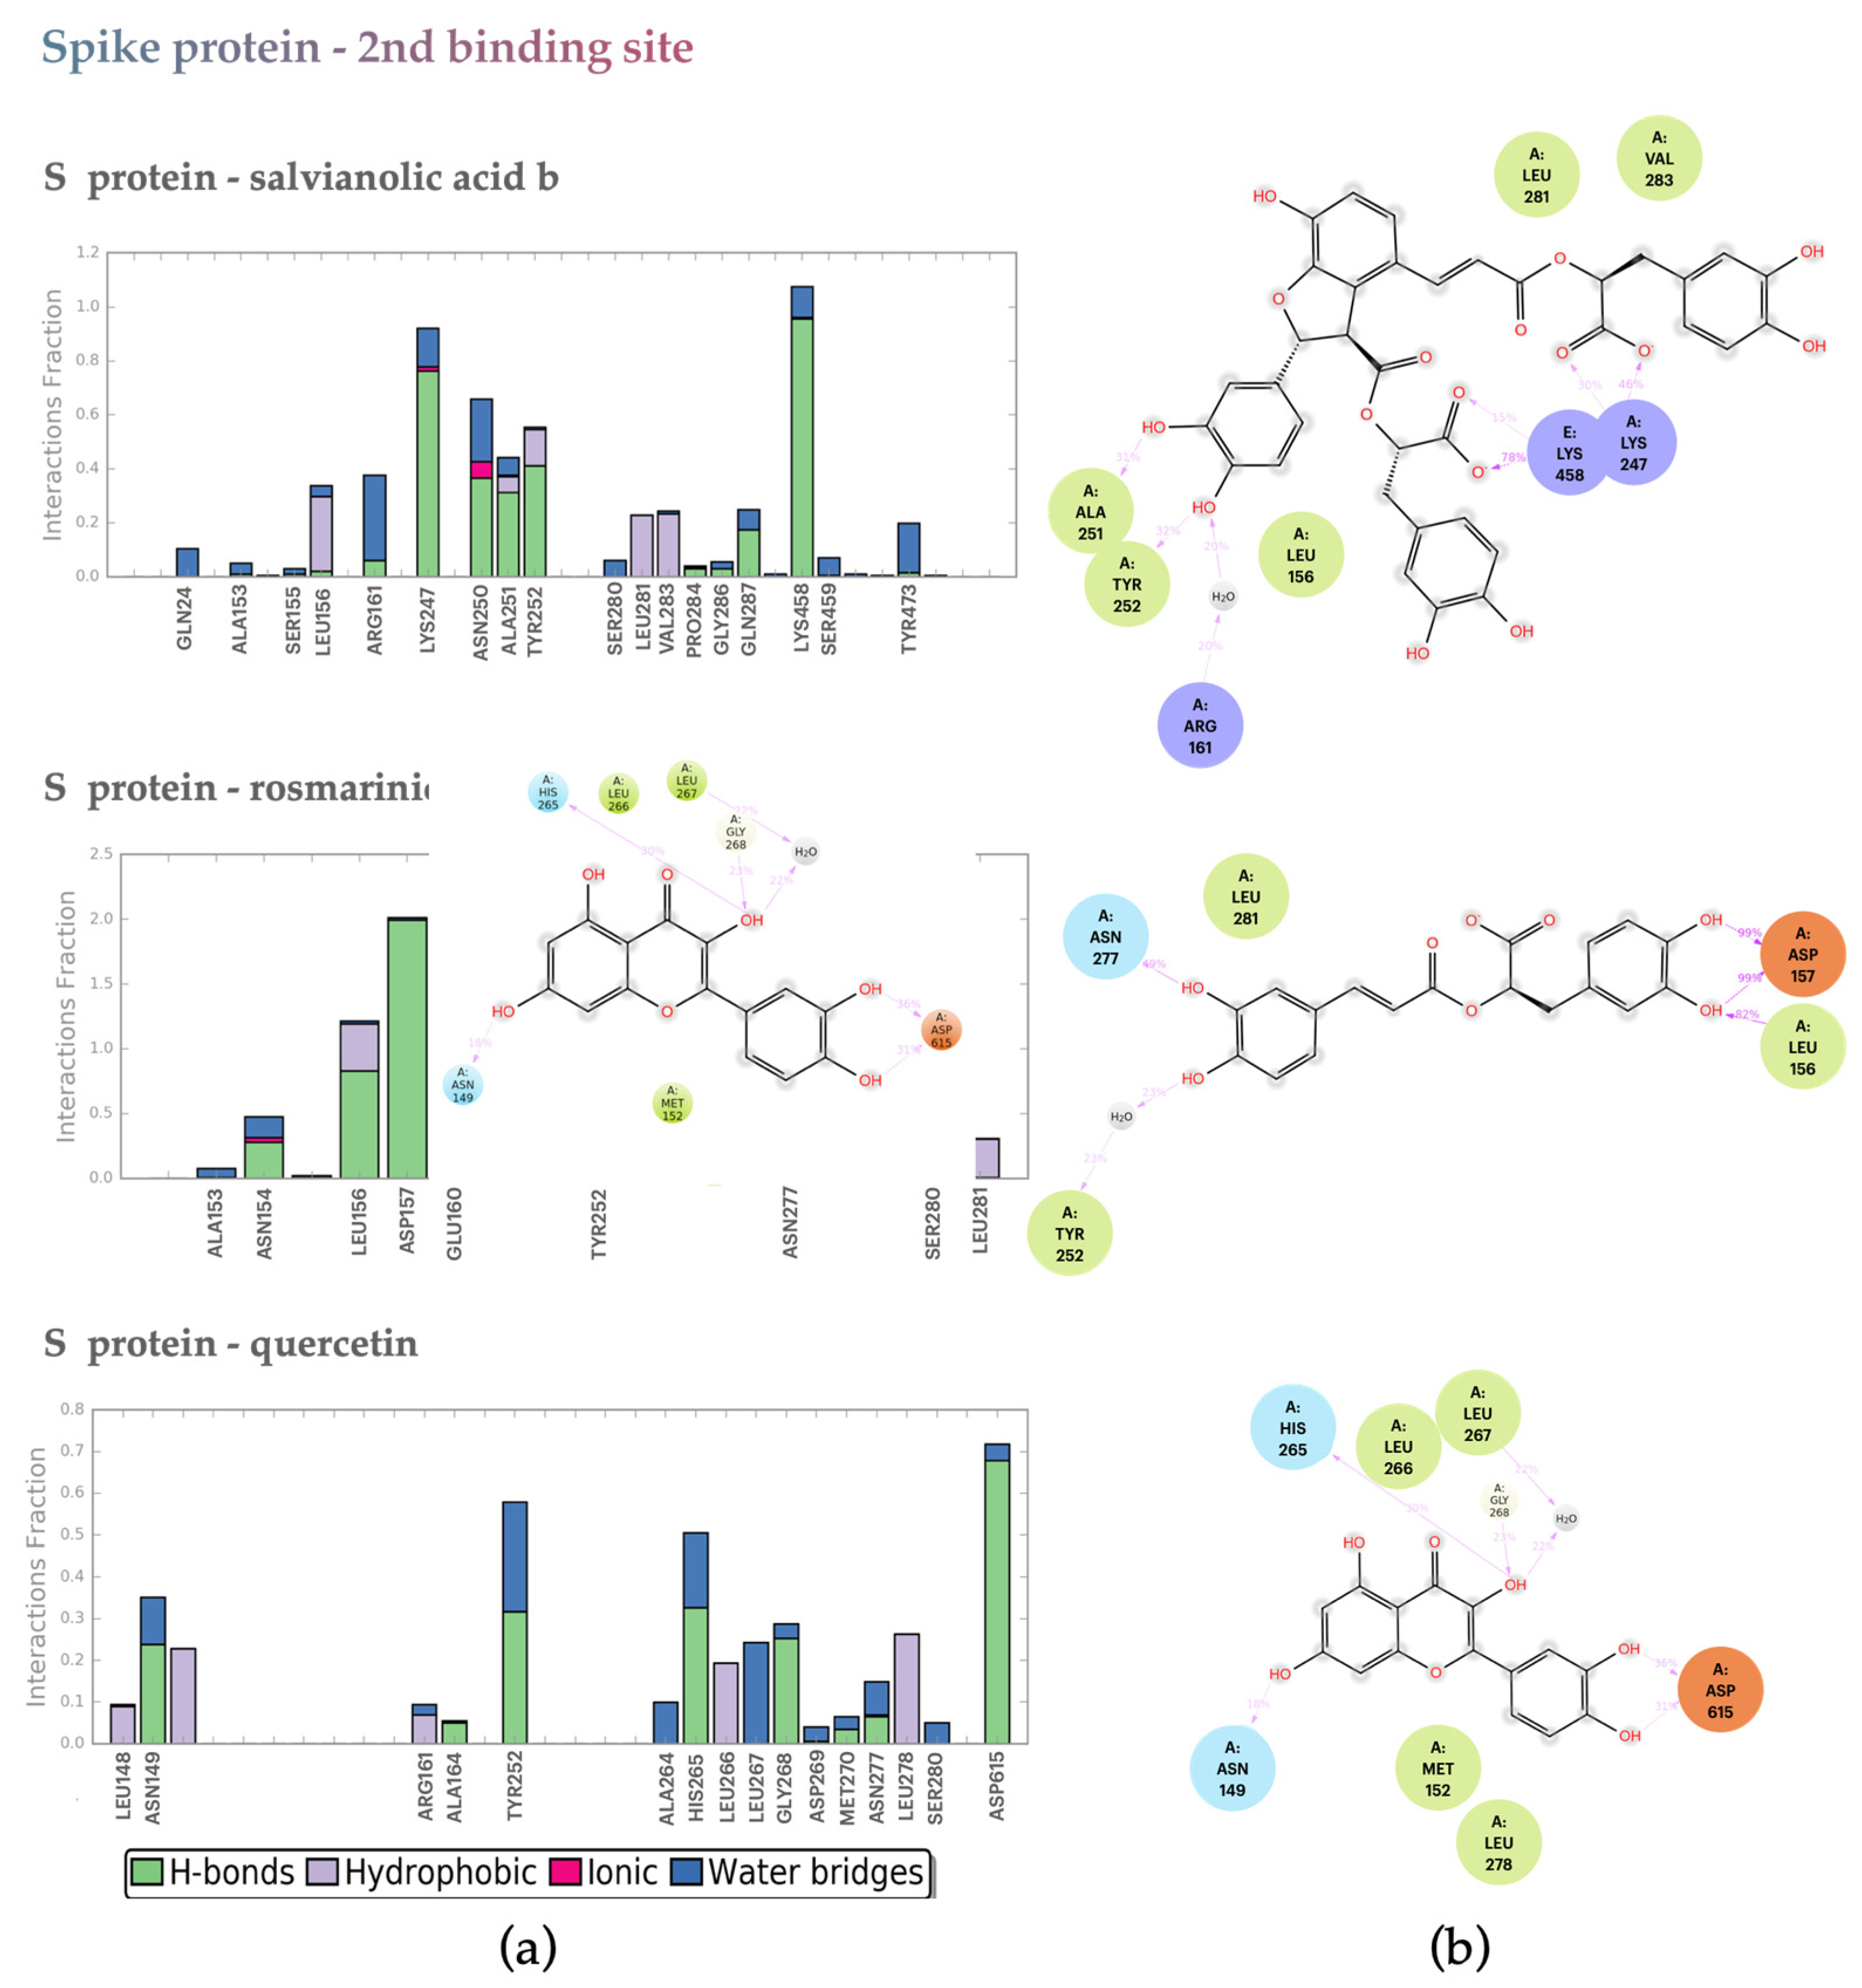
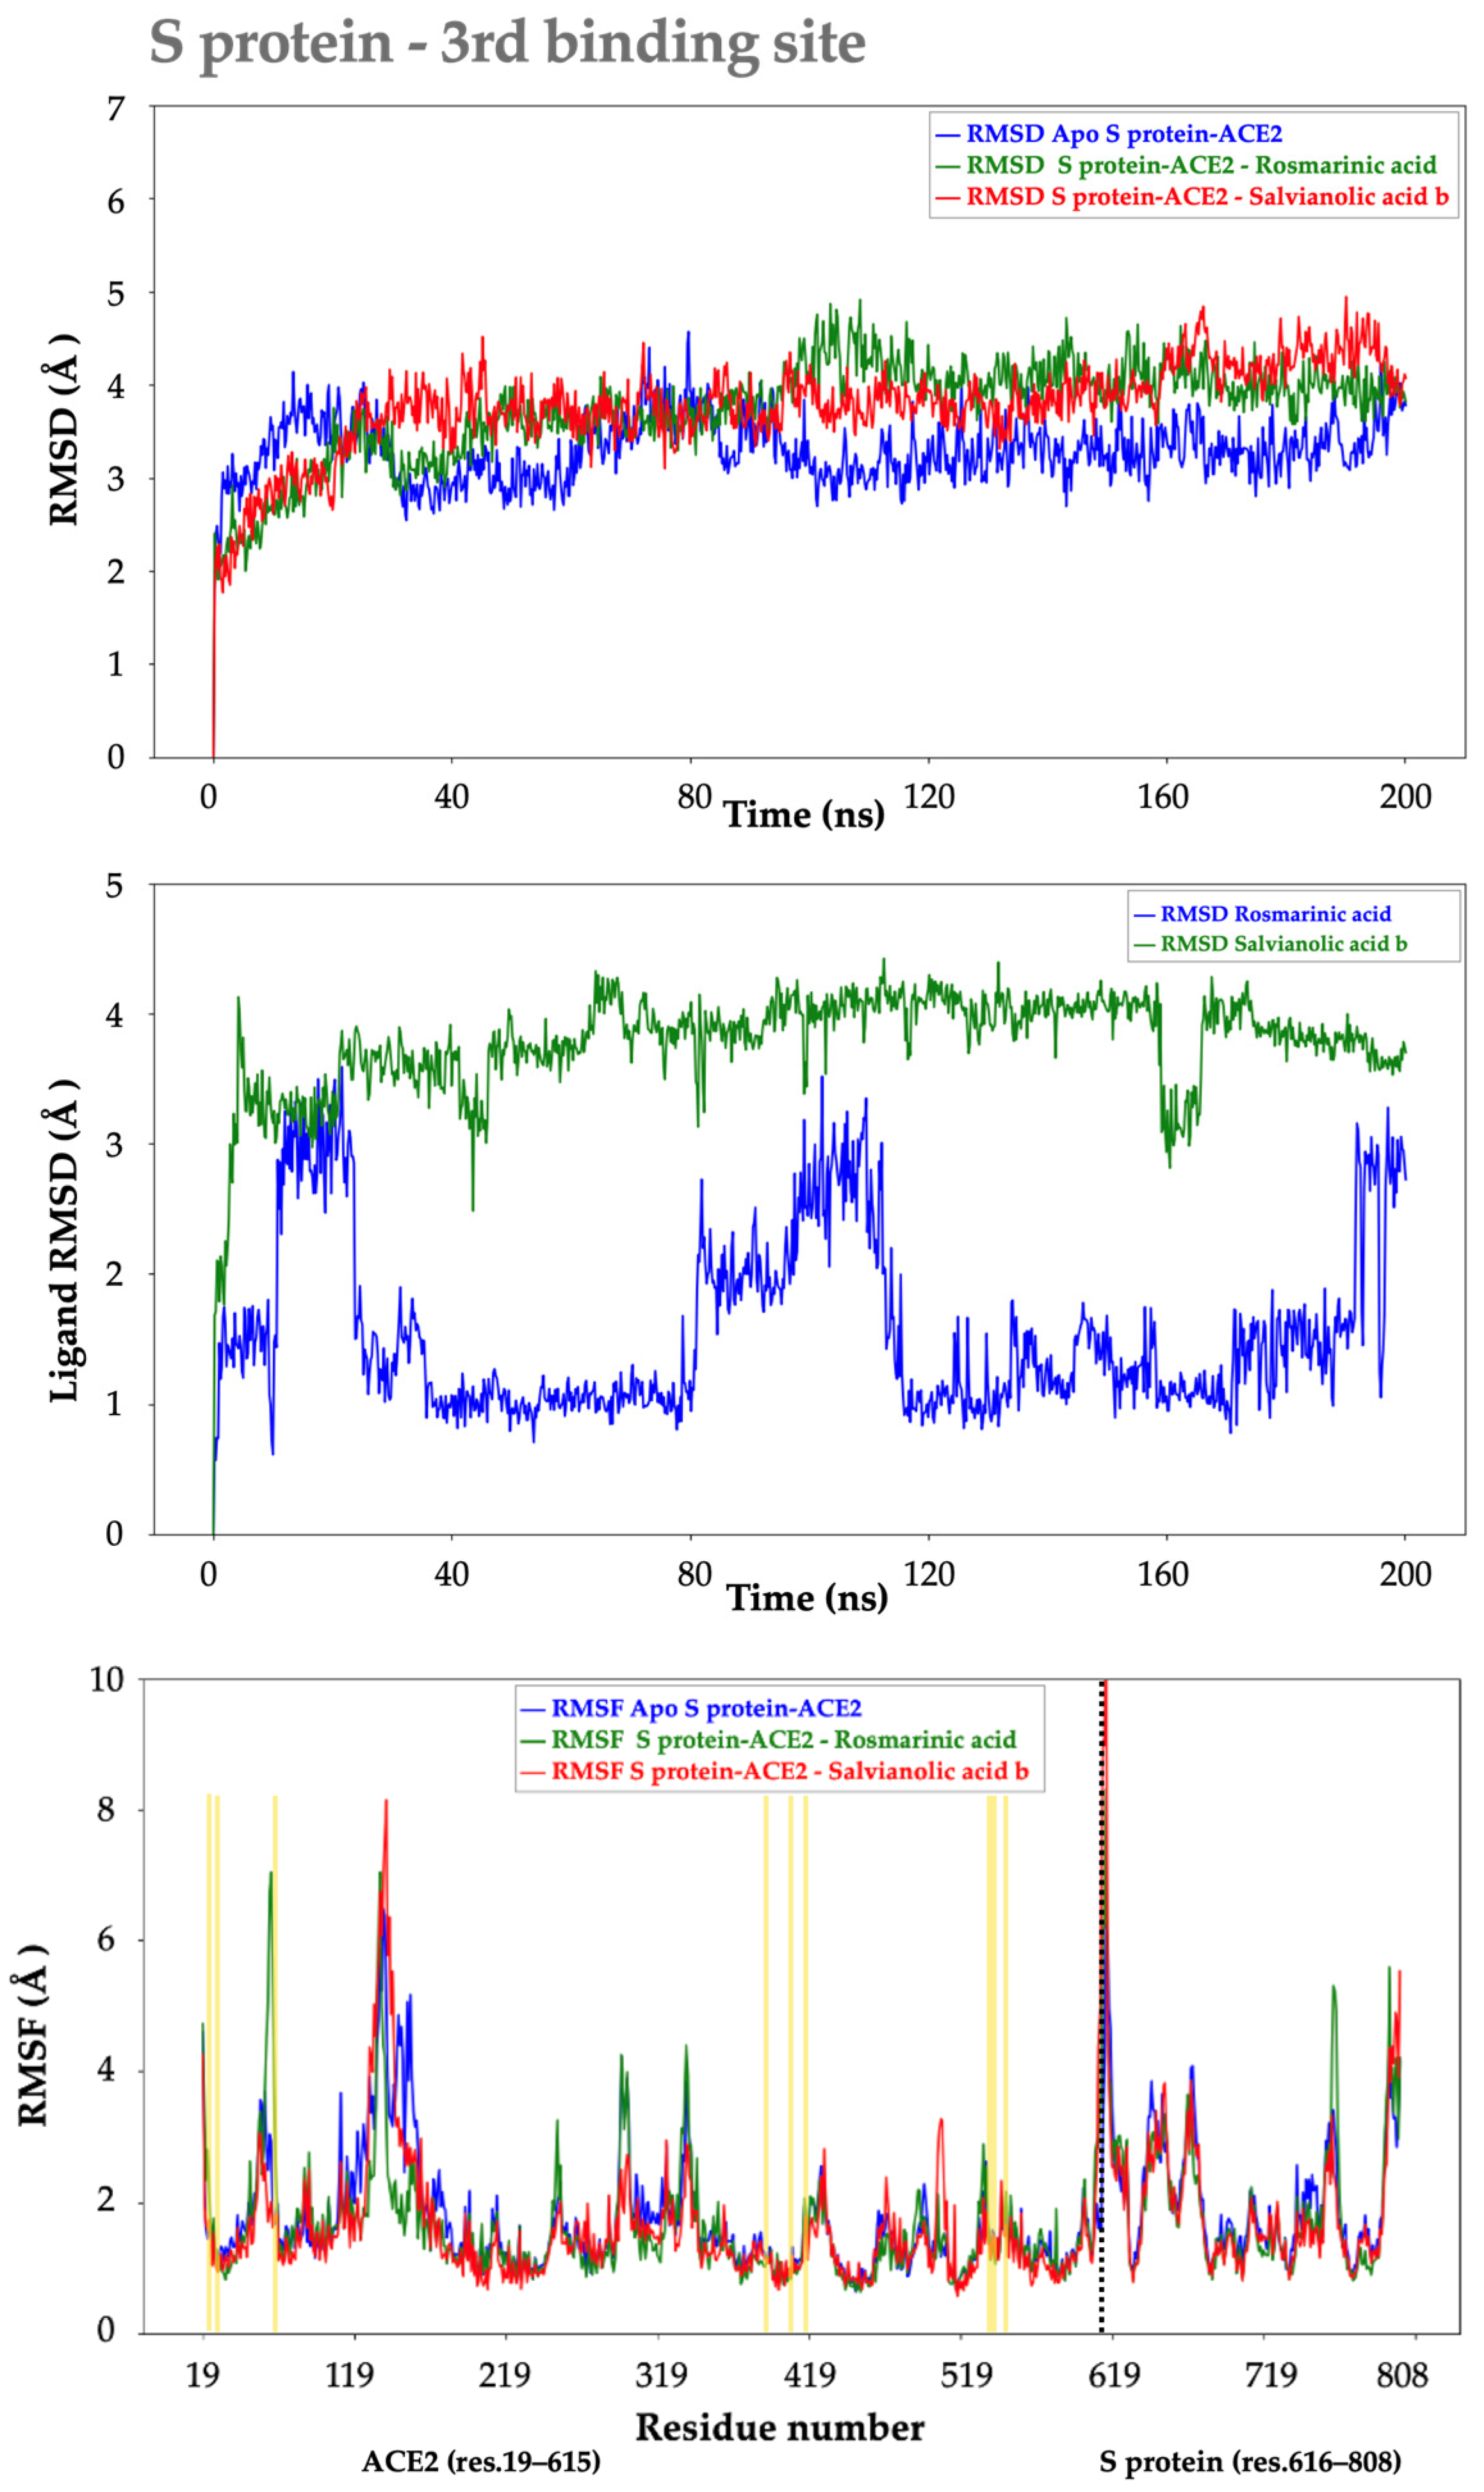
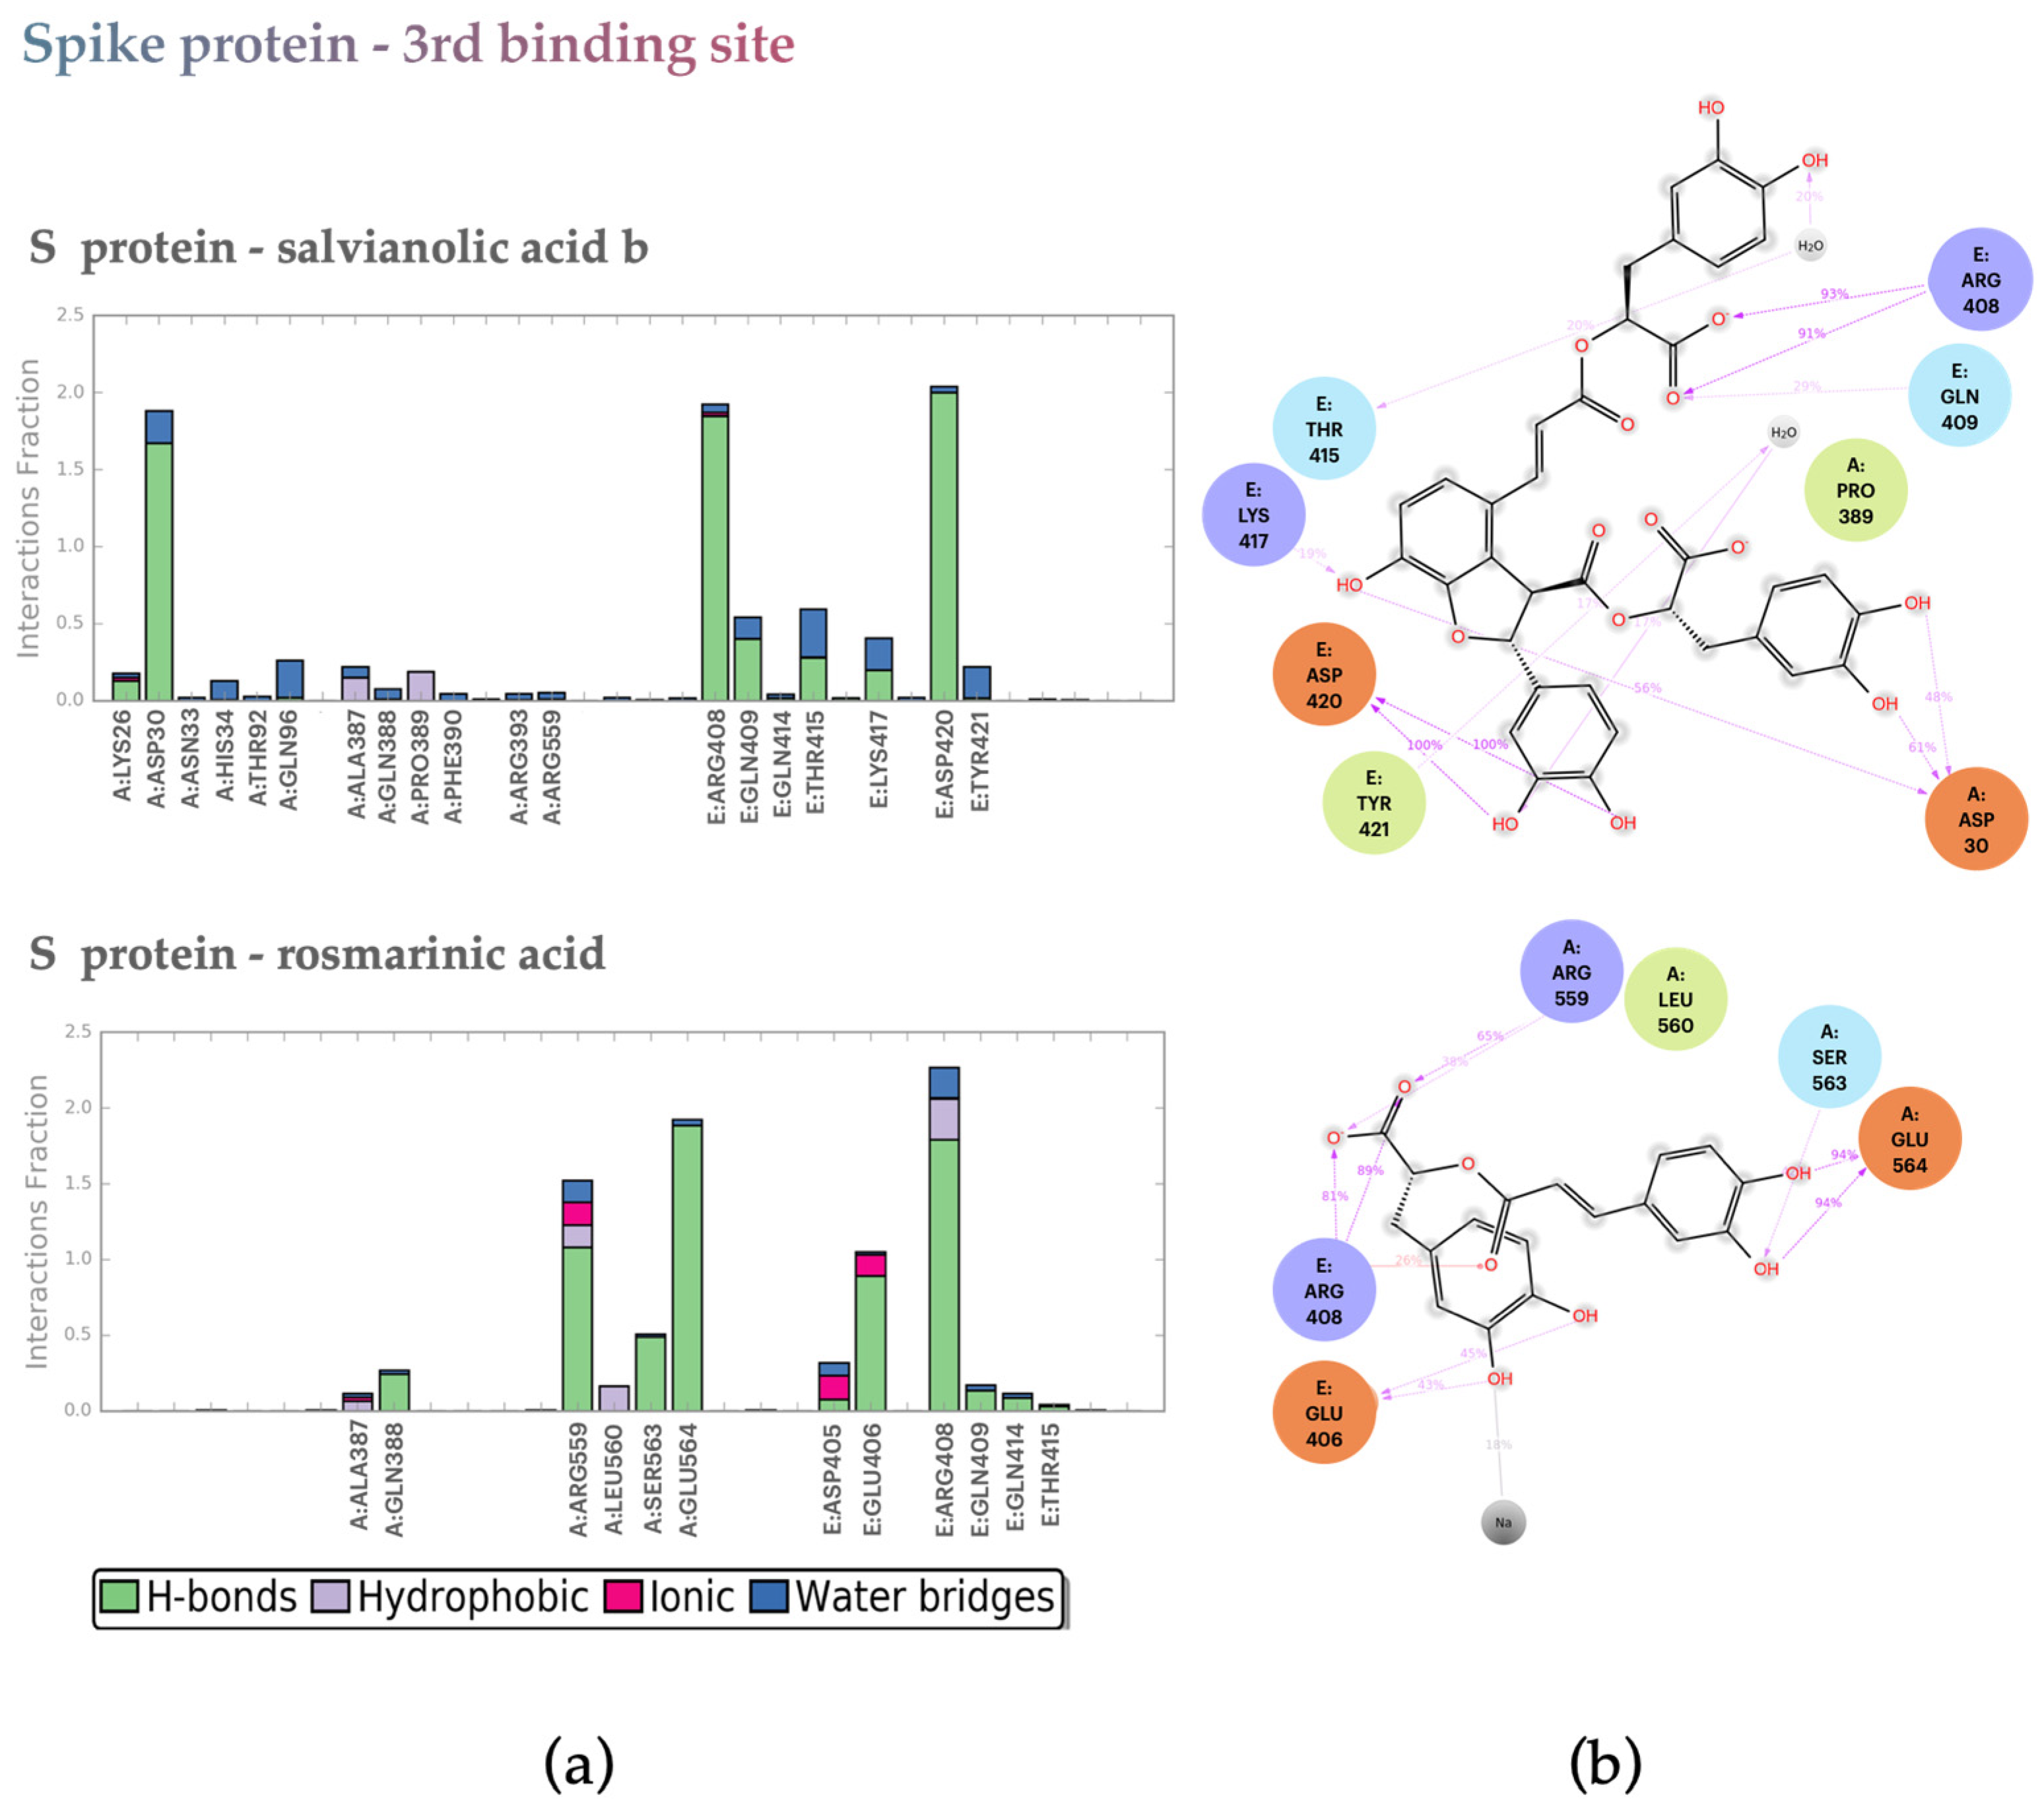
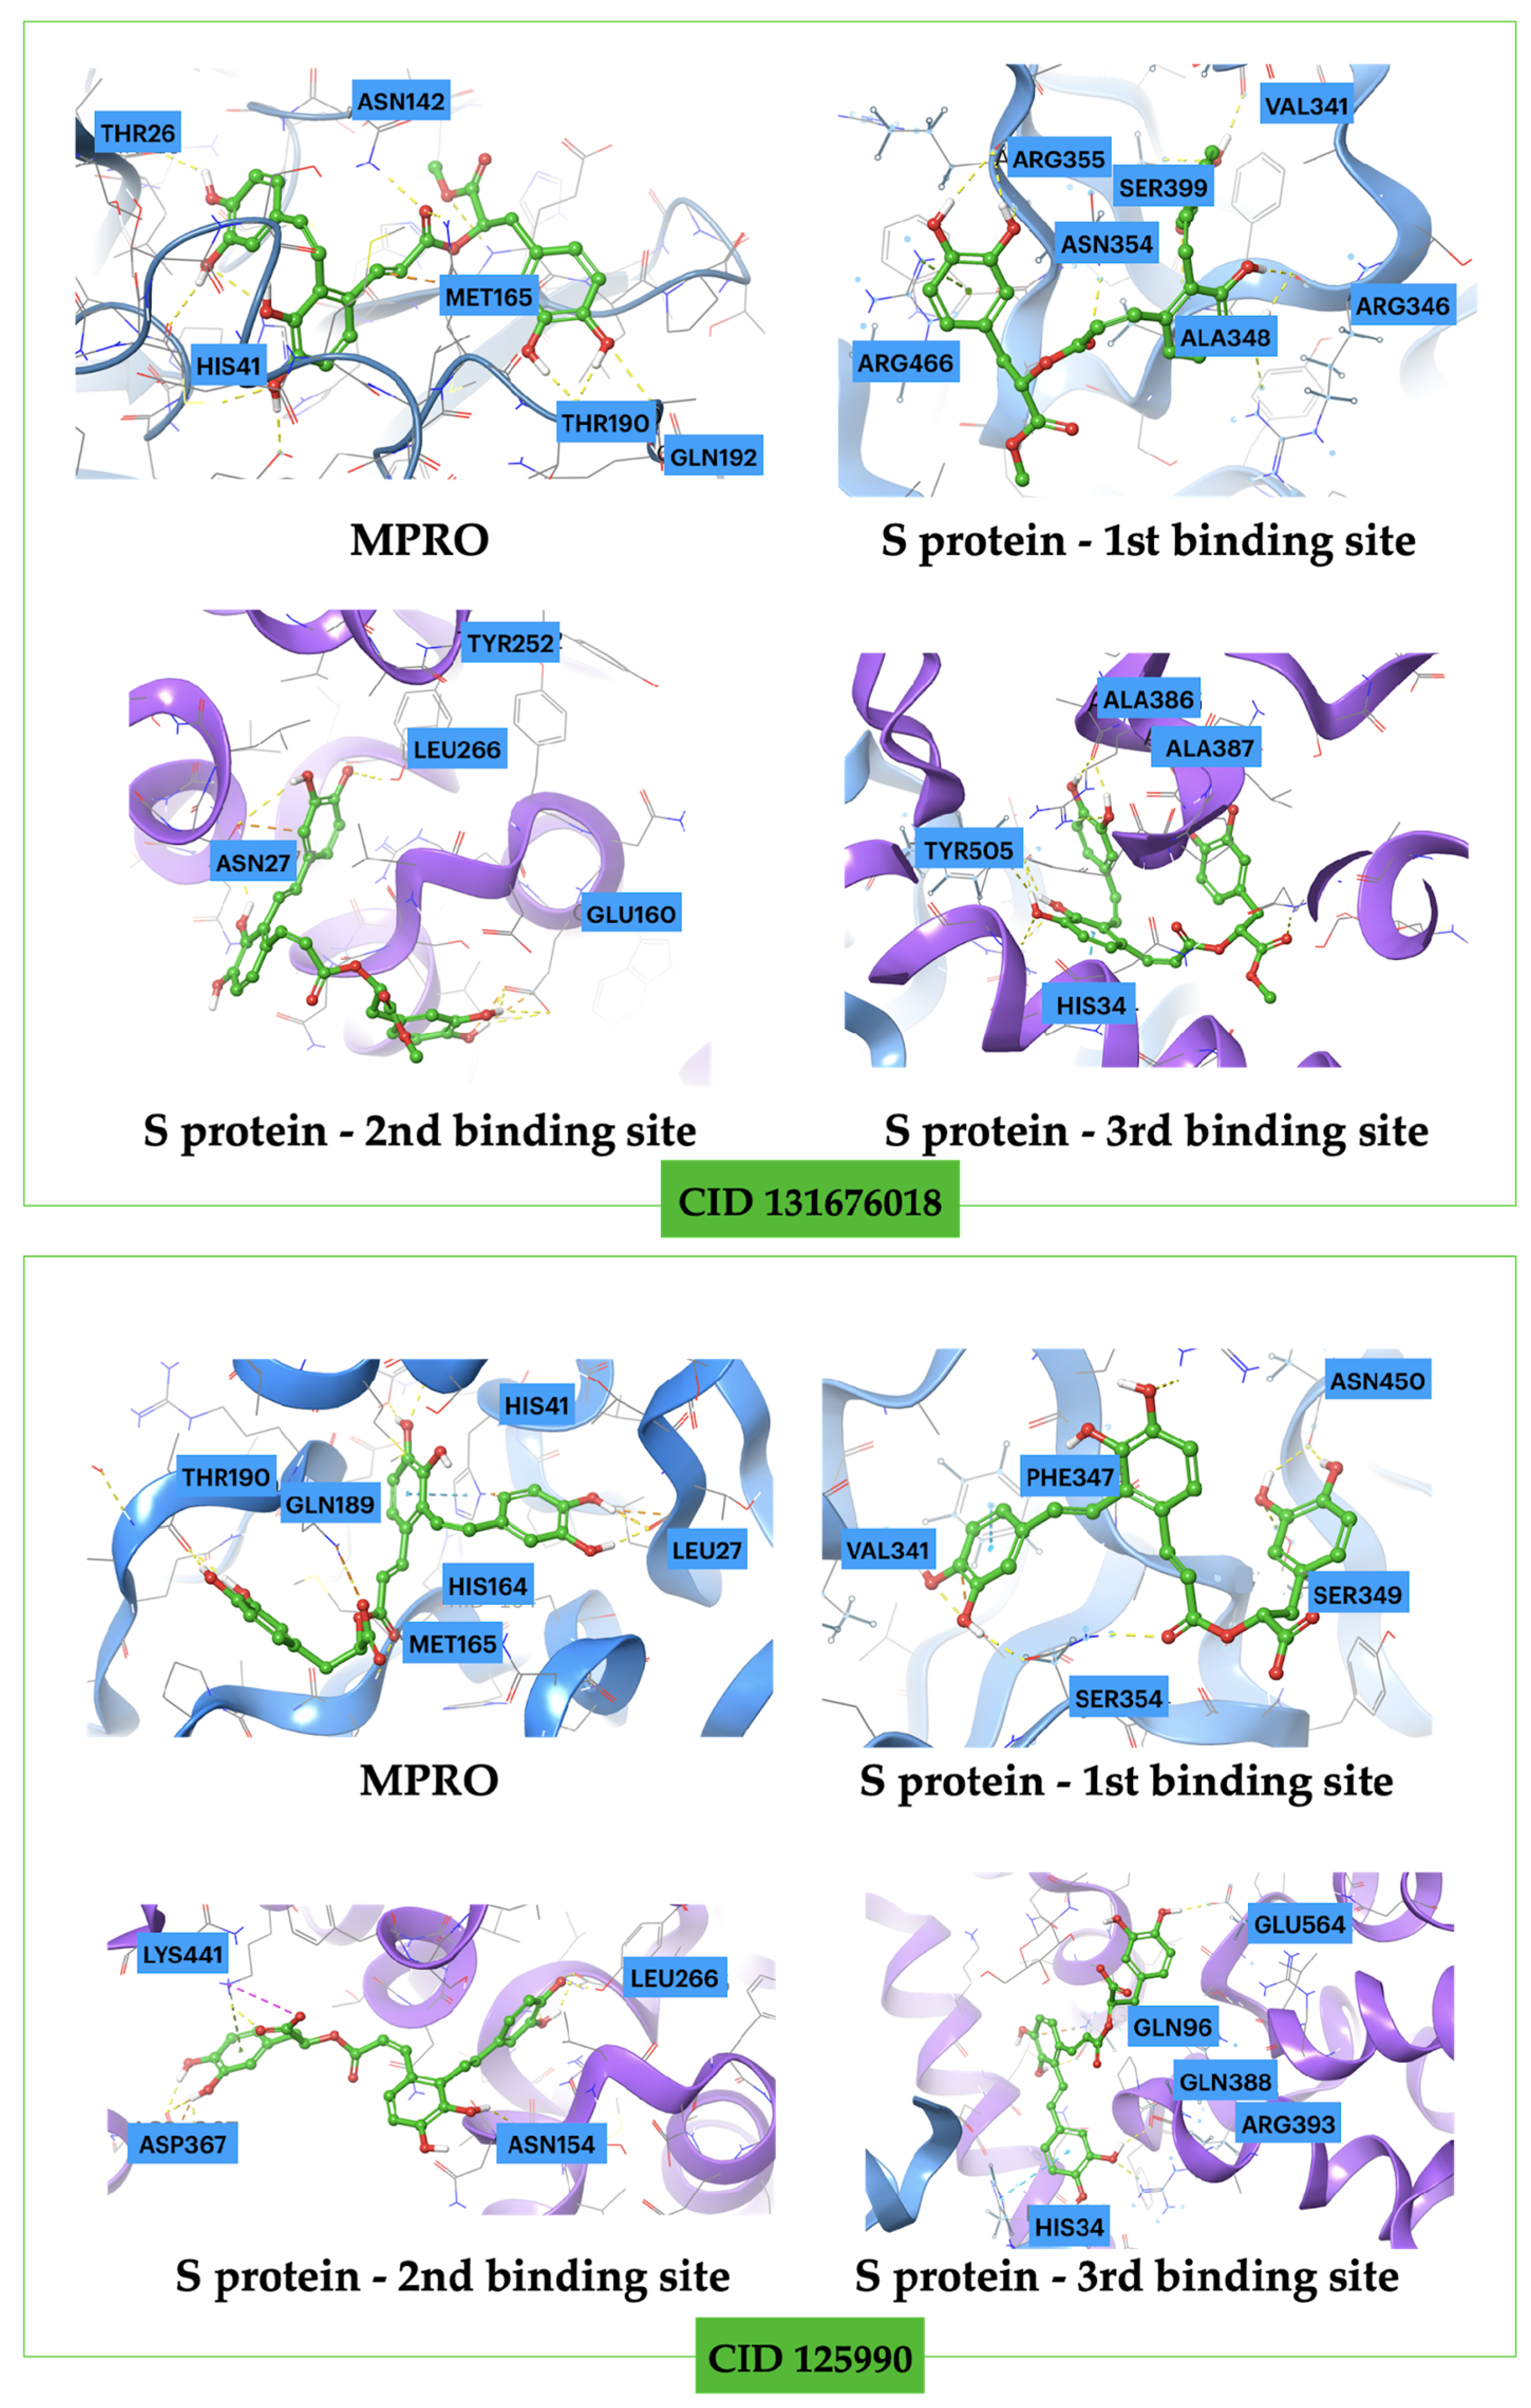
2.2.2. S protein–Ligand Complexes
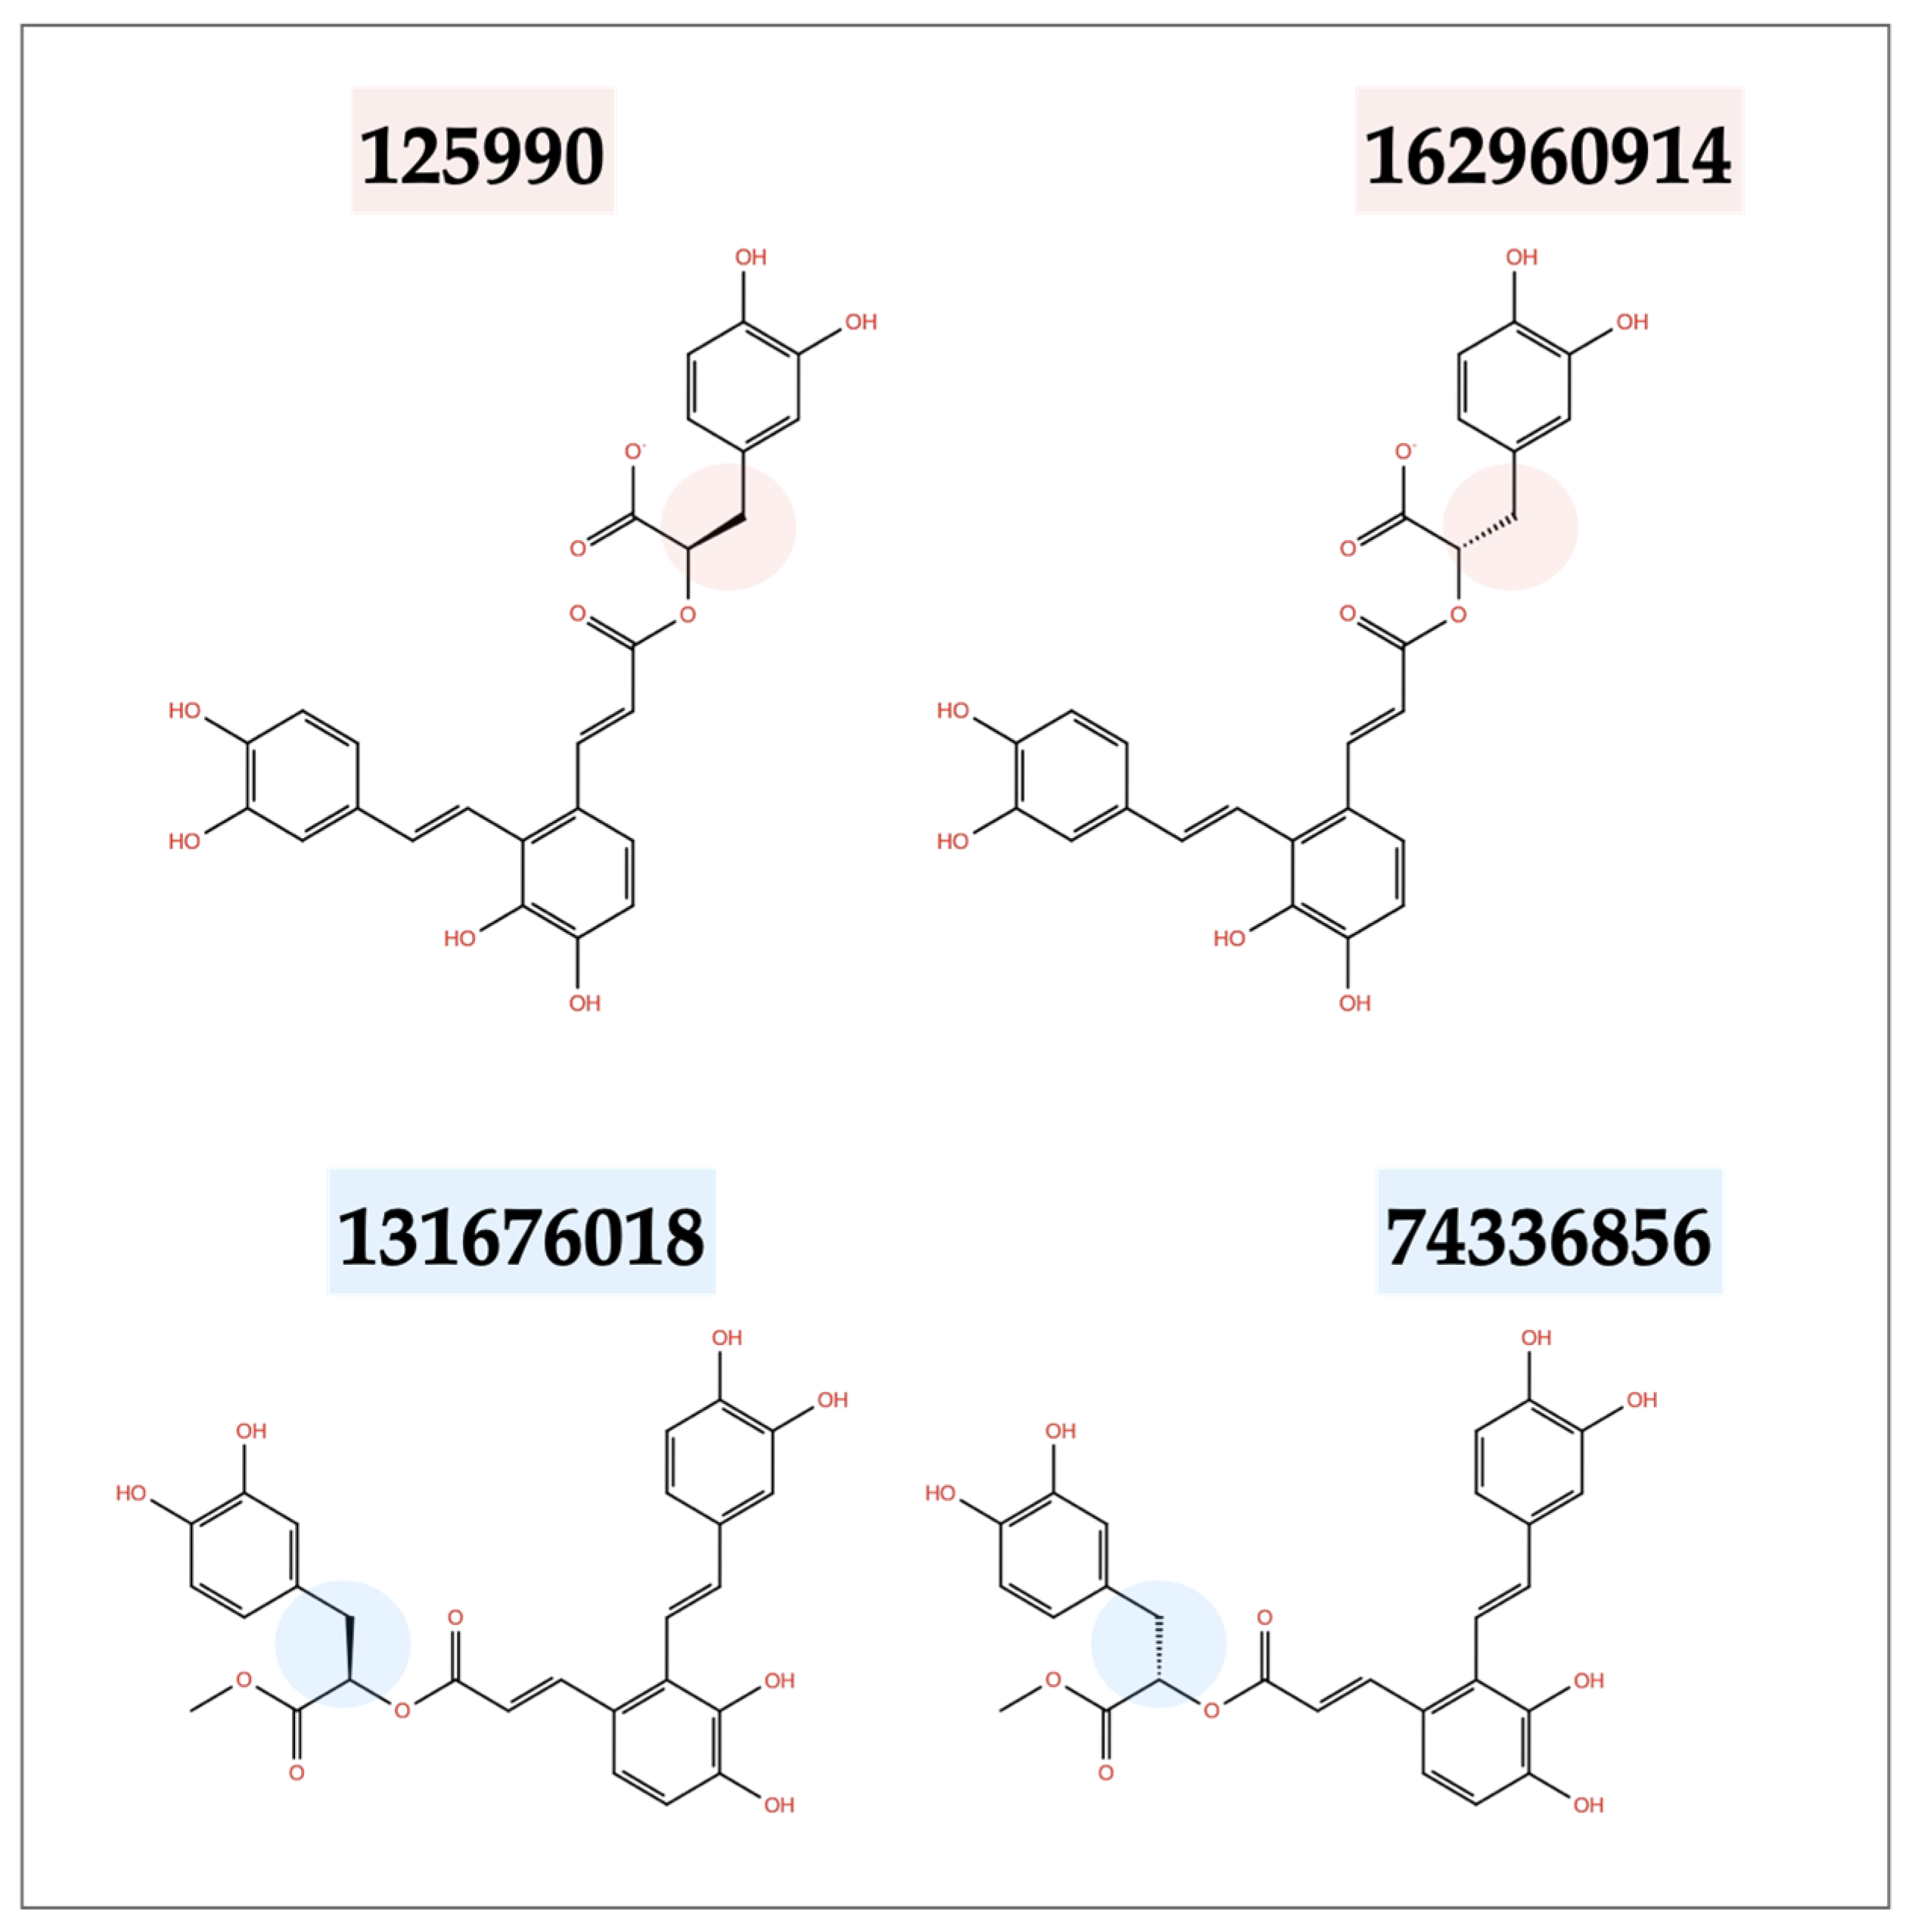
2.3. Similarity Test Results
3. Discussion
4. Materials and Methods
4.1. Protein Structure Preparation
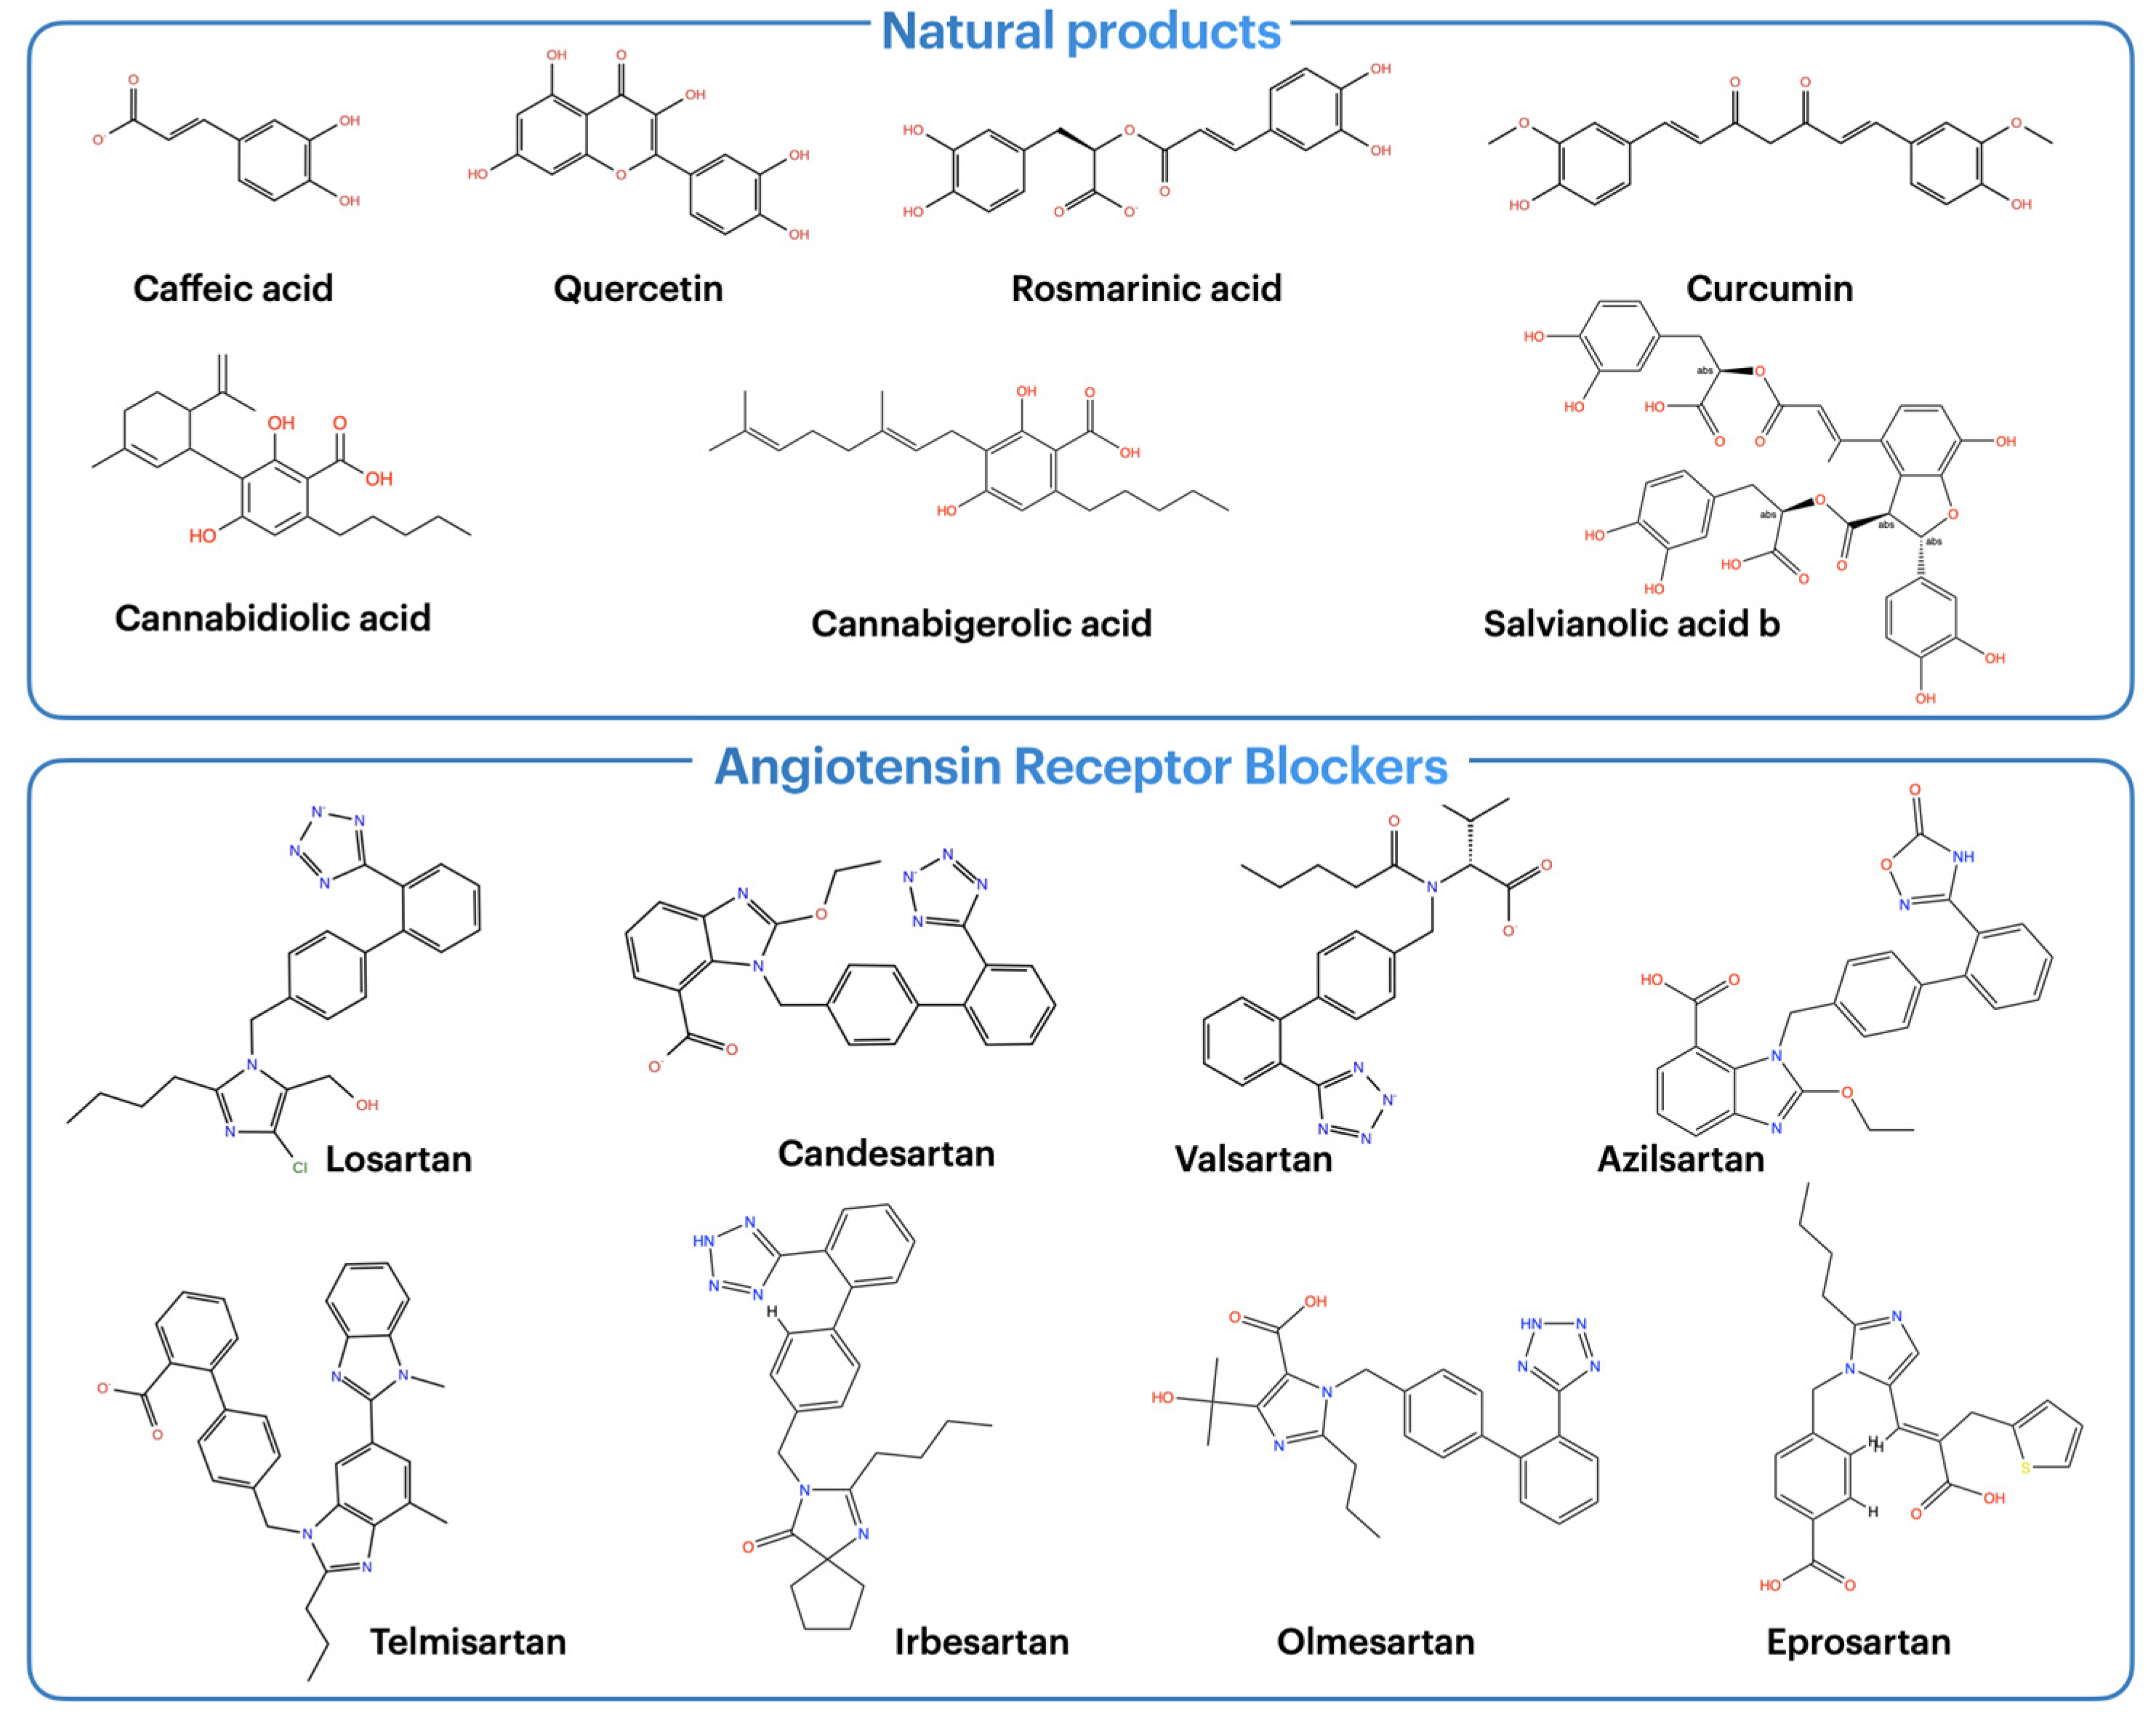
4.2. Ligand Structure Preparation
4.3. Molecular Docking Studies
4.4. Molecular Dynamics Simulations
4.5. MM-GBSA Calculations
4.6. Similarity Search
5. Conclusions
Supplementary Materials
Author Contributions
Funding
Conflicts of Interest
References
- Zhu, N.; Zhang, D.; Wang, W.; Li, X.; Yang, B.; Song, J.; Zhao, X.; Huang, B.; Shi, W.; Lu, R.; et al. A Novel Coronavirus from Patients with Pneumonia in China, 2019. N. Engl. J. Med. 2020, 382, 727–733. [Google Scholar] [CrossRef] [PubMed]
- Lu, H.; Stratton, C.W.; Tang, Y.W. Outbreak of pneumonia of unknown etiology in Wuhan, China: The mystery and the miracle. J. Med. Virol. 2020, 92, 401–402. [Google Scholar] [CrossRef] [PubMed]
- Qian, Z.; Ou, X.; Góes, L.G.B.; Osborne, C.; Castano, A.; Holmes, K.V.; Dominguez, S.R. Identification of the Receptor-Binding Domain of the Spike Glycoprotein of Human Betacoronavirus HKU1. J. Virol. 2015, 89, 8816–8827. [Google Scholar] [CrossRef]
- Ou, X.; Liu, Y.; Lei, X.; Li, P.; Mi, D.; Ren, L.; Guo, L.; Guo, R.; Chen, T.; Hu, J.; et al. Characterization of spike glycoprotein of SARS-CoV-2 on virus entry and its immune cross-reactivity with SARS-CoV. Nat. Commun. 2020, 11, 1620. [Google Scholar] [CrossRef] [PubMed]
- Dhar, Y.V.; Prasad, P.; Tiwari, N.; Pankaj, V.; Bano, N.; Bag, S.K.; Asif, M.H. An In-Silico Study to Identify Hidden Features of Spike Protein and Main Protease of SARS-CoV-2. Preprints 2020, 2020060191. [Google Scholar]
- Zhang, L.; Lin, D.; Sun, X.; Curth, U.; Drosten, C.; Sauerhering, L.; Becker, S.; Rox, K.; Hilgenfeld, R. Crystal structure of SARS-CoV-2 main protease provides a basis for design of improved α-ketoamide inhibitors. Science 2020, 368, 409–412. [Google Scholar] [CrossRef]
- Rashid, F.; Xie, Z.; Suleman, M.; Shah, A.; Khan, S.; Luo, S. Roles and functions of SARS-CoV-2 proteins in host immune evasion. Front. Immunol. 2022, 13, 940756. [Google Scholar] [CrossRef]
- Adem, S.; Eyupoglu, V.; Sarfraz, I.; Rasul, A.; Ali, M. Identification of Potent COVID-19 Main Protease (Mpro) Inhibitors from Natural Polyphenols: An in Silico Strategy Unveils a Hope against CORONA. Preprints 2020. [Google Scholar] [CrossRef]
- Khan, A.; Heng, W.; Wang, Y.; Qiu, J.; Wei, X.; Peng, S.; Saleem, S.; Khan, M.; Ali, S.S.; Wei, D.Q. In silico and in vitro evaluation of kaempferol as a potential inhibitor of the SARS-CoV-2 main protease (3CLpro). Phyther. Res. 2021, 35, 2841–2845. [Google Scholar] [CrossRef]
- Hoffmann, M.; Kleine-Weber, H.; Schroeder, S.; Krüger, N.; Herrler, T.; Erichsen, S.; Schiergens, T.S.; Herrler, G.; Wu, N.H.; Nitsche, A.; et al. SARS-CoV-2 Cell Entry Depends on ACE2 and TMPRSS2 and Is Blocked by a Clinically Proven Protease Inhibitor. Cell 2020, 181, 271–280.e8. [Google Scholar] [CrossRef]
- Huang, Y.; Yang, C.; Xu, X.; Xu, W.; Liu, S. Structural and functional properties of SARS-CoV-2 spike protein: Potential antivirus drug development for COVID-19. Acta Pharmacol. Sin. 2020, 41, 1141–1149. [Google Scholar] [CrossRef] [PubMed]
- Jin, Z.; Du, X.; Xu, Y.; Deng, Y.; Liu, M.; Zhao, Y.; Zhang, B.; Li, X.; Zhang, L.; Peng, C.; et al. Structure of Mpro from SARS-CoV-2 and discovery of its inhibitors. Nature 2020, 582, 289–293. [Google Scholar] [CrossRef] [PubMed]
- Dai, W.; Zhang, B.; Jiang, X.M.; Su, H.; Li, J.; Zhao, Y.; Xie, X.; Jin, Z.; Peng, J.; Liu, F.; et al. Structure-based design of antiviral drug candidates targeting the SARS-CoV-2 main protease. Science 2020, 368, 1331–1335. [Google Scholar] [CrossRef] [PubMed]
- Jain, R.; Mujwar, S. Repurposing metocurine as main protease inhibitor to develop novel antiviral therapy for COVID-19. Struct. Chem. 2020, 31, 2487–2499. [Google Scholar] [CrossRef] [PubMed]
- Roy, R.; Sk, M.F.; Tanwar, O.; Kar, P. Computational studies indicated the effectiveness of human metabolites against SARS-CoV-2 main protease. Mol. Divers. 2022, 27, 1587–1602. [Google Scholar] [CrossRef]
- Ali, A.; Vijayan, R. Dynamics of the ACE2–SARS-CoV-2/SARS-CoV spike protein interface reveal unique mechanisms. Sci. Rep. 2020, 10, 14214. [Google Scholar] [CrossRef]
- Rungruangmaitree, R.; Phoochaijaroen, S.; Chimprasit, A.; Saparpakorn, P.; Pootanakit, K.; Tanramluk, D. Structural analysis of the coronavirus main protease for the design of pan-variant inhibitors. Sci. Rep. 2023, 13, 7055. [Google Scholar] [CrossRef]
- Bojadzic, D.; Alcazar, O.; Chen, J.; Chuang, S.T.; Condor Capcha, J.M.; Shehadeh, L.A.; Buchwald, P. Small-Molecule Inhibitors of the Coronavirus Spike: ACE2 Protein-Protein Interaction as Blockers of Viral Attachment and Entry for SARS-CoV-2. ACS Infect. Dis. 2021, 7, 1519–1534. [Google Scholar] [CrossRef]
- Li, C.; Zhou, H.; Guo, L.; Xie, D.; He, H.; Zhang, H.; Liu, Y.; Peng, L.; Zheng, L.; Lu, W.; et al. Potential inhibitors for blocking the interaction of the coronavirus SARS-CoV-2 spike protein and its host cell receptor ACE2. J. Transl. Med. 2022, 20, 314. [Google Scholar] [CrossRef]
- Han, Y.; Král, P. Computational Design of ACE2-Based Peptide Inhibitors of SARS-CoV-2. ACS Nano 2020, 14, 5143–5147. [Google Scholar] [CrossRef]
- Durdagi, S.; Avsar, T.; Orhan, M.D.; Serhatli, M.; Balcioglu, B.K.; Ozturk, H.U.; Kayabolen, A.; Cetin, Y.; Aydinlik, S.; Bagci-Onder, T.; et al. The neutralization effect of montelukaston SARS-CoV-2 is shown by multiscale in silico simulations and combined in vitro studies. Mol. Ther. 2021, 30, 963–974. [Google Scholar] [CrossRef] [PubMed]
- Shahhamzehei, N.; Abdelfatah, S.; Efferth, T. In Silico and In Vitro Identification of Pan-Coronaviral Main Protease Inhibitors from a Large Natural Product Library. Pharmaceuticals 2022, 15, 308. [Google Scholar] [CrossRef] [PubMed]
- Bahun, M.; Jukić, M.; Oblak, D.; Kranjc, L.; Bajc, G.; Butala, M.; Bozovičar, K.; Bratkovič, T.; Podlipnik, C.; Poklar Ulrih, N. Inhibition of the SARS-CoV-2 3CLpro main protease by plant polyphenols. Food Chemistry 2022, 373, 131594. [Google Scholar] [CrossRef] [PubMed]
- Bhati, S.; Kaushik, V.; Singh, J. Rational design of flavonoid based potential inhibitors targeting SARS-CoV 3CL protease for the treatment of COVID-19. J. Mol. Struct. 2021, 1237, 130380. [Google Scholar] [CrossRef] [PubMed]
- Russo, G.L.; Tedesco, I.; Spagnuolo, C.; Russo, M. Antioxidant polyphenols in cancer treatment: Friend, foe or foil? Semin. Cancer Biol. 2017, 46, 1–13. [Google Scholar] [CrossRef] [PubMed]
- Spagnuolo, C.; Moccia, S.; Russo, G.L. Anti-inflammatory effects of flavonoids in neurodegenerative disorders. Eur. J. Med. Chem. 2018, 153, 105–115. [Google Scholar] [CrossRef]
- Cherrak, S.A.; Merzouk, H.; Mokhtari-Soulimane, N. Potential bioactive glycosylated flavonoids as SARS-CoV-2 main protease inhibitors: A molecular docking and simulation studies. PLoS ONE 2020, 15, e0240653. [Google Scholar] [CrossRef]
- Merarchi, M.; Dudha, N.; Das, B.C.; Garg, M. Natural products and phytochemicals as potential anti-SARS-CoV-2 drugs. Phytother. Res. 2021, 35, 5384–5396. [Google Scholar] [CrossRef]
- Chakravarti, R.; Singh, R.; Ghosh, A.; Dey, D.; Sharma, P.; Velayutham, R.; Roy, S.; Ghosh, D. A review on potential of natural products in the management of COVID-19. RSC Adv. 2021, 27, 16711–16735. [Google Scholar] [CrossRef]
- Amin, M.; Tabari, K.; Iranpanah, A.; Bahramsoltani, R.; Rahimi, R. Flavonoids as Promising Antiviral Agents against SARS-CoV-2 Infection: A Mechanistic Review. Molecules 2021, 26, 3900. [Google Scholar] [CrossRef]
- Alzaabi, M.M.; Hamdy, R.; Ashmawy, N.S.; Hamoda, A.M.; Alkhayat, F.; Khademi, N.N.; Al Joud, S.M.A.; El-Keblawy, A.A.; Soliman, S.S. Flavonoids are promising safe therapy against COVID-19. Phytochem. Rev. 2022, 21, 291–312. [Google Scholar] [CrossRef] [PubMed]
- Xu, J.; Gao, L.; Liang, H.; Chen, S. In silico screening of potential anti–COVID-19 bioactive natural constituents from food sources by molecular docking. Nutrition 2021, 82, 111049. [Google Scholar] [CrossRef] [PubMed]
- Samy, C.R.A.; Karunanithi, K.; Sheshadhri, J.; Rengarajan, M.; Srinivasan, P.; Cherian, P. (R)-(+)-Rosmarinic Acid as an Inhibitor of Herpes and Dengue Virus Replication: An In Silico Assessment. Rev. Bras. Farmacogn. 2023, 33, 543–550. [Google Scholar] [CrossRef] [PubMed]
- Elebeedy, D.; Elkhatib, W.F.; Kandeil, A.; Ghanem, A.; Kutkat, O.; Alnajjar, R.; Saleh, M.A.; Abd El Maksoud, A.I.; Badawy, I.; Al-Karmalawy, A.A. Anti-SARS-CoV-2 activities of tanshinone IIA, carnosic acid, rosmarinic acid, salvianolic acid, baicalein, and glycyrrhetinic acid between computational andin vitroinsights. RSC Adv. 2021, 11, 29267–29286. [Google Scholar] [CrossRef] [PubMed]
- Adem, Ş.; Eyupoglu, V.; Sarfraz, I.; Rasul, A.; Zahoor, A.F.; Ali, M.; Abdalla, M.; Ibrahim, I.M.; Elfiky, A.A. Caffeic acid derivatives (CAFDs) as inhibitors of SARS-CoV-2: CAFDs-based functional foods as a potential alternative approach to combat COVID-19. Phytomedicine 2021, 85, 153310. [Google Scholar] [CrossRef]
- Yang, C.; Pan, X.; Xu, X.; Cheng, C.; Huang, Y.; Li, L.; Jiang, S.; Xu, W.; Xiao, G.; Liu, S. Salvianolic acid C potently inhibits SARS-CoV-2 infection by blocking the formation of six-helix bundle core of spike protein. Signal Transduct. Target. Ther. 2020, 5, 2–4. [Google Scholar] [CrossRef]
- Hu, S.; Wang, J.; Zhang, Y.; Bai, H.; Wang, C.; Wang, N.; He, L. Three salvianolic acids inhibit 2019-nCoV spike pseudovirus viropexis by binding to both its RBD and receptor ACE2. J. Med. Virol. 2021, 93, 3143–3151. [Google Scholar] [CrossRef]
- Schwantes, C.R.; Pande, V.S.; Bowers, K.J.; Chow, E.; Xu, H.; Dror, R.O.; Eastwood, M.P.; Gregersen, B.A.; Klepeis, J.L.; Kolossvary, I.; et al. Will Cannabis or Cannabinoids Protect You from SARS-CoV-2 Infection or Treat COVID-19? J. Chem. Theory Comput. 2022, 85, 101554. [Google Scholar] [CrossRef]
- van Breemen, R.B.; Muchiri, R.N.; Bates, T.A.; Weinstein, J.B.; Leier, H.C.; Farley, S.; Tafesse, F.G. Cannabinoids Block Cellular Entry of SARS-CoV-2 and the Emerging Variants. J. Nat. Prod. 2022, 85, 176–184. [Google Scholar] [CrossRef]
- Armstrong, K.A.; Soltoff, A.; Rieu-Werden, M.; Metlay, J.; Haas, J. Use of angiotensin converting enzyme inhibitors and angiotensin receptor blockers associated with lower risk of COVID-19 in household contacts. PLoS ONE 2021, 16, e0247548. [Google Scholar] [CrossRef]
- Sriram, K.; Insel, P.A. A hypothesis for pathobiology and treatment of COVID-19: The centrality of ACE1/ACE2 imbalance. Br. J. Pharmacol. 2020, 177, 4825–4844. [Google Scholar] [CrossRef] [PubMed]
- Jeon, S.; Ko, M.; Lee, J.; Choi, I.; Byun, S.Y.; Park, S.; Shum, D.; Kim, S. Identification of antiviral drug candidates against SARS-CoV-2 from FDA-approved drugs. Antimicrob. Agents Chemother. 2020, 64, e00819-20. [Google Scholar] [CrossRef] [PubMed]
- Forrester, S.J.; Booz, G.W.; Sigmund, C.D.; Coffman, T.M.; Kawai, T.; Rizzo, V.; Scalia, R.; Eguchi, S. Angiotensin II signal transduction: An update on mechanisms of physiology and pathophysiology. Physiol. Rev. 2018, 98, 1627–1738. [Google Scholar] [CrossRef] [PubMed]
- Mavromoustakos, T.; Agelis, G.; Durdagi, S. AT1 antagonists: A patent review (2008–2012). Expert Opin. Ther. Pat. 2013, 23, 1483–1494. [Google Scholar] [CrossRef]
- Onweni, C.L.; Zhang, Y.S.; Caulfield, T.; Hopkins, C.E.; Fairweather, D.L.; Freeman, W.D. ACEI/ARB therapy in COVID-19: The double-edged sword of ACE2 and SARS-CoV-2 viral docking. Crit. Care 2020, 475, 2020. [Google Scholar] [CrossRef]
- Duarte, M.; Pelorosso, F.; Nicolosi, L.N.; Victoria Salgado, M.; Vetulli, H.; Aquieri, A.; Azzato, F.; Castro, M.; Coyle, J.; Davolos, I.; et al. Telmisartan for treatment of COVID-19 patients: An open multicenter randomized clinical trial. EClinicalMedicine 2021, 37, 100962. [Google Scholar] [CrossRef]
- Schrödinger Suite. Protein Preparation Wizard; Epik Version 2.3; Impact Version 5.8; Prime Version 3.1; Schrödinger, LLC.: New York, NY, USA, 2012. [Google Scholar]
- Lan, J.; Ge, J.; Yu, J.; Shan, S.; Zhou, H.; Fan, S.; Zhang, Q.; Shi, X.; Wang, Q.; Zhang, L.; et al. Structure of the SARS-CoV-2 spike receptor-binding domain bound to the ACE2 receptor. Nature 2020, 581, 215–220. [Google Scholar] [CrossRef]
- Prime, version 4.0; Schrödinger, LLC.: New York, NY, USA, 2015.
- Kaminski, G.A.; Friesner, R.A.; Tirado-Rives, J.; Jorgensen, W.L. Evaluation and Reparametrization of the OPLS-AA Force Field for Proteins via Comparison with Accurate Quantum Chemical Calculations on Peptides. J. Phys. Chem. 2001, 105, 6474–6487. [Google Scholar] [CrossRef]
- LigPrep, version 3.4; Schrödinger, LLC.: New York, NY, USA, 2017.
- Glide, version 5.8; Schrödinger, LLC.: New York, NY, USA, 2012.
- Induced Fit Docking, Schrödinger Software Release 2017-1, Schrodinger Press: New York, NY, USA, 2017.
- Behloul, N.; Baha, S.; Guo, Y.; Yang, Z.; Shi, R.; Meng, J. In silico identification of strong binders of the SARS-CoV-2 receptor-binding domain. Eur. J. Pharmacol. 2021, 890, 173701. [Google Scholar] [CrossRef]
- Jorgensen, W.L.; Maxwell, D.S.; Tirado-Rives, J. Development and testing of the OPLS all-atom force field on conformational energetics and properties of organic liquids. J. Am. Chem. Soc. 1996, 118, 11225–11236. [Google Scholar] [CrossRef]
- Jorgensen, W.L.; Chandrasekhar, J.; Madura, J.D.; Impey, R.W.; Klein, M.L. Comparison of simple potential functions for simulating liquid water. J. Chem. Phys. 1983, 79, 926–935. [Google Scholar] [CrossRef]
- Schrödinger Release 2017-1: Desmond Molecular Dynamics System, Maestro-Desmond Interoperability Tools; D.E. Shaw Research: New York, NY, USA, 2017.
- Shinoda, W.; Mikami, M. Rigid-body dynamics in the isothermal-isobaric ensemble: A test on the accuracy and computational efficiency. J. Comput. Chem. 2003, 24, 920–930. [Google Scholar] [CrossRef] [PubMed]
- Lyne, P.D.; Lamb, M.L.; Saeh, J.C. Accurate prediction of the relative potencies of members of a series of kinase inhibitors using molecular docking and MM-GBSA scoring. J. Med. Chem. 2006, 49, 4805–4808. [Google Scholar] [CrossRef] [PubMed]
- Li, J.; Abel, R.; Zhu, K.; Cao, Y.; Zhao, S.; Friesner, R.A. The VSGB 2.0 model: A next generation energy model for high resolution protein structure modeling. Proteins Struct. Funct. Bioinform. 2011, 79, 2794–2812. [Google Scholar] [CrossRef] [PubMed]
- Clark Still, W.; Tempczyk, A.; Hawley, R.C.; Hendrickson, T. Semianalytical Treatment of Solvation for Molecular Mechanics and Dynamics. J. Am. Chem. Soc. 1990, 112, 6127–6129. [Google Scholar] [CrossRef]
- Qiu, D.; Shenkin, P.S.; Hollinger, F.P.; Still, W.C. The GB/SA continuum model for solvation. A fast analytical method for the calculation of approximate Born radii. J. Phys. Chem. A 1997, 101, 3005–3014. [Google Scholar] [CrossRef]
- Varsou, D.-D.; Nikolakopoulos, S.; Tsoumanis, A.; Melagraki, G.; Afantitis, A. Enalos Suite: New Cheminformatics Platform for Drug Discovery and Computational Toxicology. In Methods in Molecular Biology; Springer: Berlin/Heidelberg, Germany, 2018; Volume 1800, ISBN 9781493978991. [Google Scholar]
- Afantitis, A.; Tsoumanis, A.; Melagraki, G. Enalos suite of tools: Enhance cheminformatics and nanoinformat-ics through knime. Curr. Med. Chem. 2020, 27, 6523–6535. [Google Scholar] [CrossRef]


| Ligand | ΔG (kcal mol−1) | |||
|---|---|---|---|---|
| Mpro | S Protein 1st Binding Site | S Protein 2nd Binding Site | S Protein 3rd Binding Site | |
| Curcumin | −47.5 ± 4.0 | – | – | – |
| Quercetin | −33.8 ± 5.2 | – | −41.0 ± 6.1 | – |
| Rosmarinic acid | −45.2 ± 3.6 | −41.2 ± 4.4 | −41.0 ± 3.8 | −40.4 ± 9.1 |
| Salvianolic acid b | – | −56.5 ± 4.9 | −42.6 ± 5.8 | −35.3 ± 5.1 |
| Ligand CID | Mpro | Binding S Protein 1st Binding Site | Affinity (kcal mol−1) S Protein 2nd Binding Site | S Protein 3rd Binding Site |
|---|---|---|---|---|
| 131676018 | −16.5 | −13.7 | −8.2 | −8.9 |
| 74336856 | −13.7 | −10.5 | −9.6 | −10.9 |
| 162960914 | −15.4 | −10.6 | −9.0 | −9.7 |
| 125990 | −15.1 | −12.8 | −9.0 | −10.7 |
Disclaimer/Publisher’s Note: The statements, opinions and data contained in all publications are solely those of the individual author(s) and contributor(s) and not of MDPI and/or the editor(s). MDPI and/or the editor(s) disclaim responsibility for any injury to people or property resulting from any ideas, methods, instructions or products referred to in the content. |
© 2023 by the authors. Licensee MDPI, Basel, Switzerland. This article is an open access article distributed under the terms and conditions of the Creative Commons Attribution (CC BY) license (https://creativecommons.org/licenses/by/4.0/).
Share and Cite
Moschovou, K.; Antoniou, M.; Chontzopoulou, E.; Papavasileiou, K.D.; Melagraki, G.; Afantitis, A.; Mavromoustakos, T. Exploring the Binding Effects of Natural Products and Antihypertensive Drugs on SARS-CoV-2: An In Silico Investigation of Main Protease and Spike Protein. Int. J. Mol. Sci. 2023, 24, 15894. https://doi.org/10.3390/ijms242115894
Moschovou K, Antoniou M, Chontzopoulou E, Papavasileiou KD, Melagraki G, Afantitis A, Mavromoustakos T. Exploring the Binding Effects of Natural Products and Antihypertensive Drugs on SARS-CoV-2: An In Silico Investigation of Main Protease and Spike Protein. International Journal of Molecular Sciences. 2023; 24(21):15894. https://doi.org/10.3390/ijms242115894
Chicago/Turabian StyleMoschovou, Kalliopi, Maria Antoniou, Eleni Chontzopoulou, Konstantinos D. Papavasileiou, Georgia Melagraki, Antreas Afantitis, and Thomas Mavromoustakos. 2023. "Exploring the Binding Effects of Natural Products and Antihypertensive Drugs on SARS-CoV-2: An In Silico Investigation of Main Protease and Spike Protein" International Journal of Molecular Sciences 24, no. 21: 15894. https://doi.org/10.3390/ijms242115894
APA StyleMoschovou, K., Antoniou, M., Chontzopoulou, E., Papavasileiou, K. D., Melagraki, G., Afantitis, A., & Mavromoustakos, T. (2023). Exploring the Binding Effects of Natural Products and Antihypertensive Drugs on SARS-CoV-2: An In Silico Investigation of Main Protease and Spike Protein. International Journal of Molecular Sciences, 24(21), 15894. https://doi.org/10.3390/ijms242115894