Article

Integrated Transcriptomic and Metabolomic Analysis Reveal the Underlying Mechanism of Anthocyanin Biosynthesis in Toona sinensis Leaves

1
State Key Laboratory of Tree Genetics and Breeding, Chinese Academy of Forestry, Beijing 100091, China
2
Key Laboratory of Tree Breeding of Zhejiang Province, Research Institute of Subtropical Forestry, Chinese Academy of Forestry, Hangzhou 311400, China
*
Author to whom correspondence should be addressed.
Int. J. Mol. Sci. 2023, 24(20), 15459; https://doi.org/10.3390/ijms242015459
Submission received: 14 September 2023 / Revised: 11 October 2023 / Accepted: 15 October 2023 / Published: 23 October 2023
(This article belongs to the Special Issue Research on Plant Genomics and Breeding 2.0)

Abstract

:
Toona sinensis, commonly known as Chinese Toon, is a plant species that possesses noteworthy value as a tree and vegetable. Its tender young buds exhibit a diverse range of colors, primarily determined by the presence and composition of anthocyanins and flavonoids. However, the underlying mechanisms of anthocyanin biosynthesis in Toona sinensis have been rarely reported. To explore the related genes and metabolites associated with composition of leaf color, we conducted an analysis of the transcriptome and metabolome of five distinct Toona clones. The results showed that differentially expressed genes and metabolites involved in anthocyanin biosynthesis pathway were mainly enriched. A conjoint analysis of transcripts and metabolites was carried out in JFC (red) and LFC (green), resulting in the identification of 510 genes and 23 anthocyanin-related metabolites with a positive correlation coefficient greater than 0.8. Among these genes and metabolites, 23 transcription factors and phytohormone-related genes showed strong coefficients with 13 anthocyanin derivates, which mainly belonged to the stable types of delphinidin, cyanidin, peonidin. The core derivative was found to be Cyanidin-3-O-arabinoside, which was present in JFC at 520.93 times the abundance compared to LFC. Additionally, the regulatory network and relative expression levels of genes revealed that the structural genes DFR, ANS, and UFGT1 might be directly or indirectly regulated by the transcription factors SOC1 (MADS-box), CPC (MYB), and bHLH162 (bHLH) to control the accumulation of anthocyanin. The expression of these genes was significantly higher in red clones compared to green clones. Furthermore, RNA-seq results accurately reflected the true expression levels of genes. Overall, this study provides a foundation for future research aimed at manipulating anthocyanin biosynthesis to improve plant coloration or to derive human health benefits.

1. Introduction

As the national economy grows rapidly, and living standards continue to improve, consumers today demand more than just food and clothing. They desire a healthy diet that also helps prevent diseases. Food that is high in nutrition and has antioxidant properties is particularly appealing [1]. Chinese Toon (Toona sinensis), a tree with both medicinal and edible uses, contains rich chemical substances with functions such as antifungal, antiglycation, or anti-tumor activities. Flavonoid compounds, especially anthocyanin, have been identified as the major bioactive constituents in Toona [2,3,4] which are considered to be of the most beneficial plant-derived antioxidants and have led to increased efforts to analyze the genetic controls of the mechanism of flavonoids synthesis [5,6].
Anthocyanins belong to the flavonoid class of phenolic compounds. Anthocyanins are water-soluble pigments present in plants that contribute to the colors of leaves, flowers, and fruit, which are also crucial for plant growth and beneficial for human health due to their ability to scavenge active oxygens [7]. More than 600 distinct anthocyanin types have been identified so far through previous research [8]. The most prevalent anthocyanin pigments, which generate purple, blue, and red colors, are cyanidin (Cy), delphinidin (Dp), pelargonidin (Pg), peonidin (Pn), petunidin (Pt), and malvidin (Mv) [9]. Anthocyanin biosynthesis and regulation is a complex process influenced by various internal and external factors [10,11].
The anthocyanin biosynthesis pathway is a well-characterized process in plants such as Arabidopsis thaliana, apple, pear and tomato [12,13,14,15,16,17,18]. The pathway is initiated by the phenylpropanoid and flavonoid pathways, which are controlled by both structural and regulatory genes. The expression of functional structural genes was related with the accumulation of anthocyanin [19]. Overexpression of enzymes such as dihydroflavonol-4-reductase (DRF), anthocyanidin synthase (ANS) and UDP-glucoside: flavonoid glucosyltransferase (UFGT) can increase color accumulation in fruits. Meanwhile, The MBW complex, which is formed by MYB-bHLH-WD40 transcription factors, regulates anthocyanin biosynthesis by promoting or inhibiting the expression of structural genes [18,20,21,22,23,24,25]. The MYB transcription factor TRANSPARENT TESTA 2 (TT2) in Arabidopsis thaliana interacts with TT8 (bHLH42) and TTG1 (WD40) to regulated the expression of late biosynthetic genes, resulting in pigmentation of the seed coat [26]. In addition, the transcription factor, such as WRKY, NAC, bZIP, and MADS, have also been proven to play a role in regulating anthocyanin biosynthesis. LONG HYPOCOTYL 5 (HY5), a bZIP transcription factor, directly participates in photosensitive morphology, UV-B resistance, and anthocyanin biosynthesis [27,28]. Studies have revealed its interaction with B-Box proteins (BBX) to control anthocyanin biosynthesis [29,30]. In addition, plant hormones also interact with transcription factors to influence the regulation of anthocyanin accumulation [31,32]. Jasmonate ZIM-domain (JAZ) proteins interact with essential components of WD-repeat/bHLH/MYB transcriptional complexes, namely bHLH (Transparent Testa8, Glabra3 [GL3], and Enhancer of Glabra3 [EGL3]) and R2R3 MYB transcription factors (MYB75 and Glabra1), to repress JA (Jasmonic acid)-regulated anthocyanin accumulation and trichome initiation [33]. Identification of structural enzymes and regulatory factors is crucial for progress in understanding the underlying mechanism of anthocyanin biosynthesis regulation.
The investigation of anthocyanin-regulating genes and associated flavonoid metabolites is critical to elucidate the mechanism that governs the biological synthesis of anthocyanins. To study gene expression and metabolic changes in different cultivars, researchers mainly rely on transcriptomic and metabolic profiling, which complement each other [34,35]. In this study, we conducted a dual-level exploration of genes and metabolites that control the pigmentation of Toona sinensis leaves using transcriptome and metabolomics approaches. Specifically, we analyzed the transcriptome and metabolome data of five Toona sinensis clones exhibiting a range of leaf colors, including red, light red, pink, dark, and green, to clarify regulatory networks for biosynthesis-related genes and key metabolomes. Overall, our findings unveil the regulatory mechanisms driving the coloration of Toona sinensis leaves.

2. Results

2.1. Morphological Observation and Anthocyanin Content of Leaves in Toona sinensis

Five clones of Toona sinensis with distinct leaf colors were selected to analyze the regulatory mechanism of anthocyanin biosynthesis. Among the clones, JFC Toona is characterized by brilliant-red leaves and is commonly cultivated in Zhejiang province. The leaf color of other clones was pink buds (FHXN), light-red with a little green buds (BSH), dark-purple buds (HBG), and green buds (LFC) (Figure 1A). Then, the total anthocyanin was extracted and the resulting color were displayed in Figure 1B, which reflect the anthocyanin content of different clones. Total anthocyanin present in the leaves were quantified, with JFC Toona sinensis found to have the highest concentration of anthocyanin, followed by BSH, FHXN and HBG, and LFC (Figure 1C). Obviously, LFC exhibited green leaves due to a lack of anthocyanin accumulation.

2.2. Metabolome Analysis of Anthocyanin in Five Toona Clones

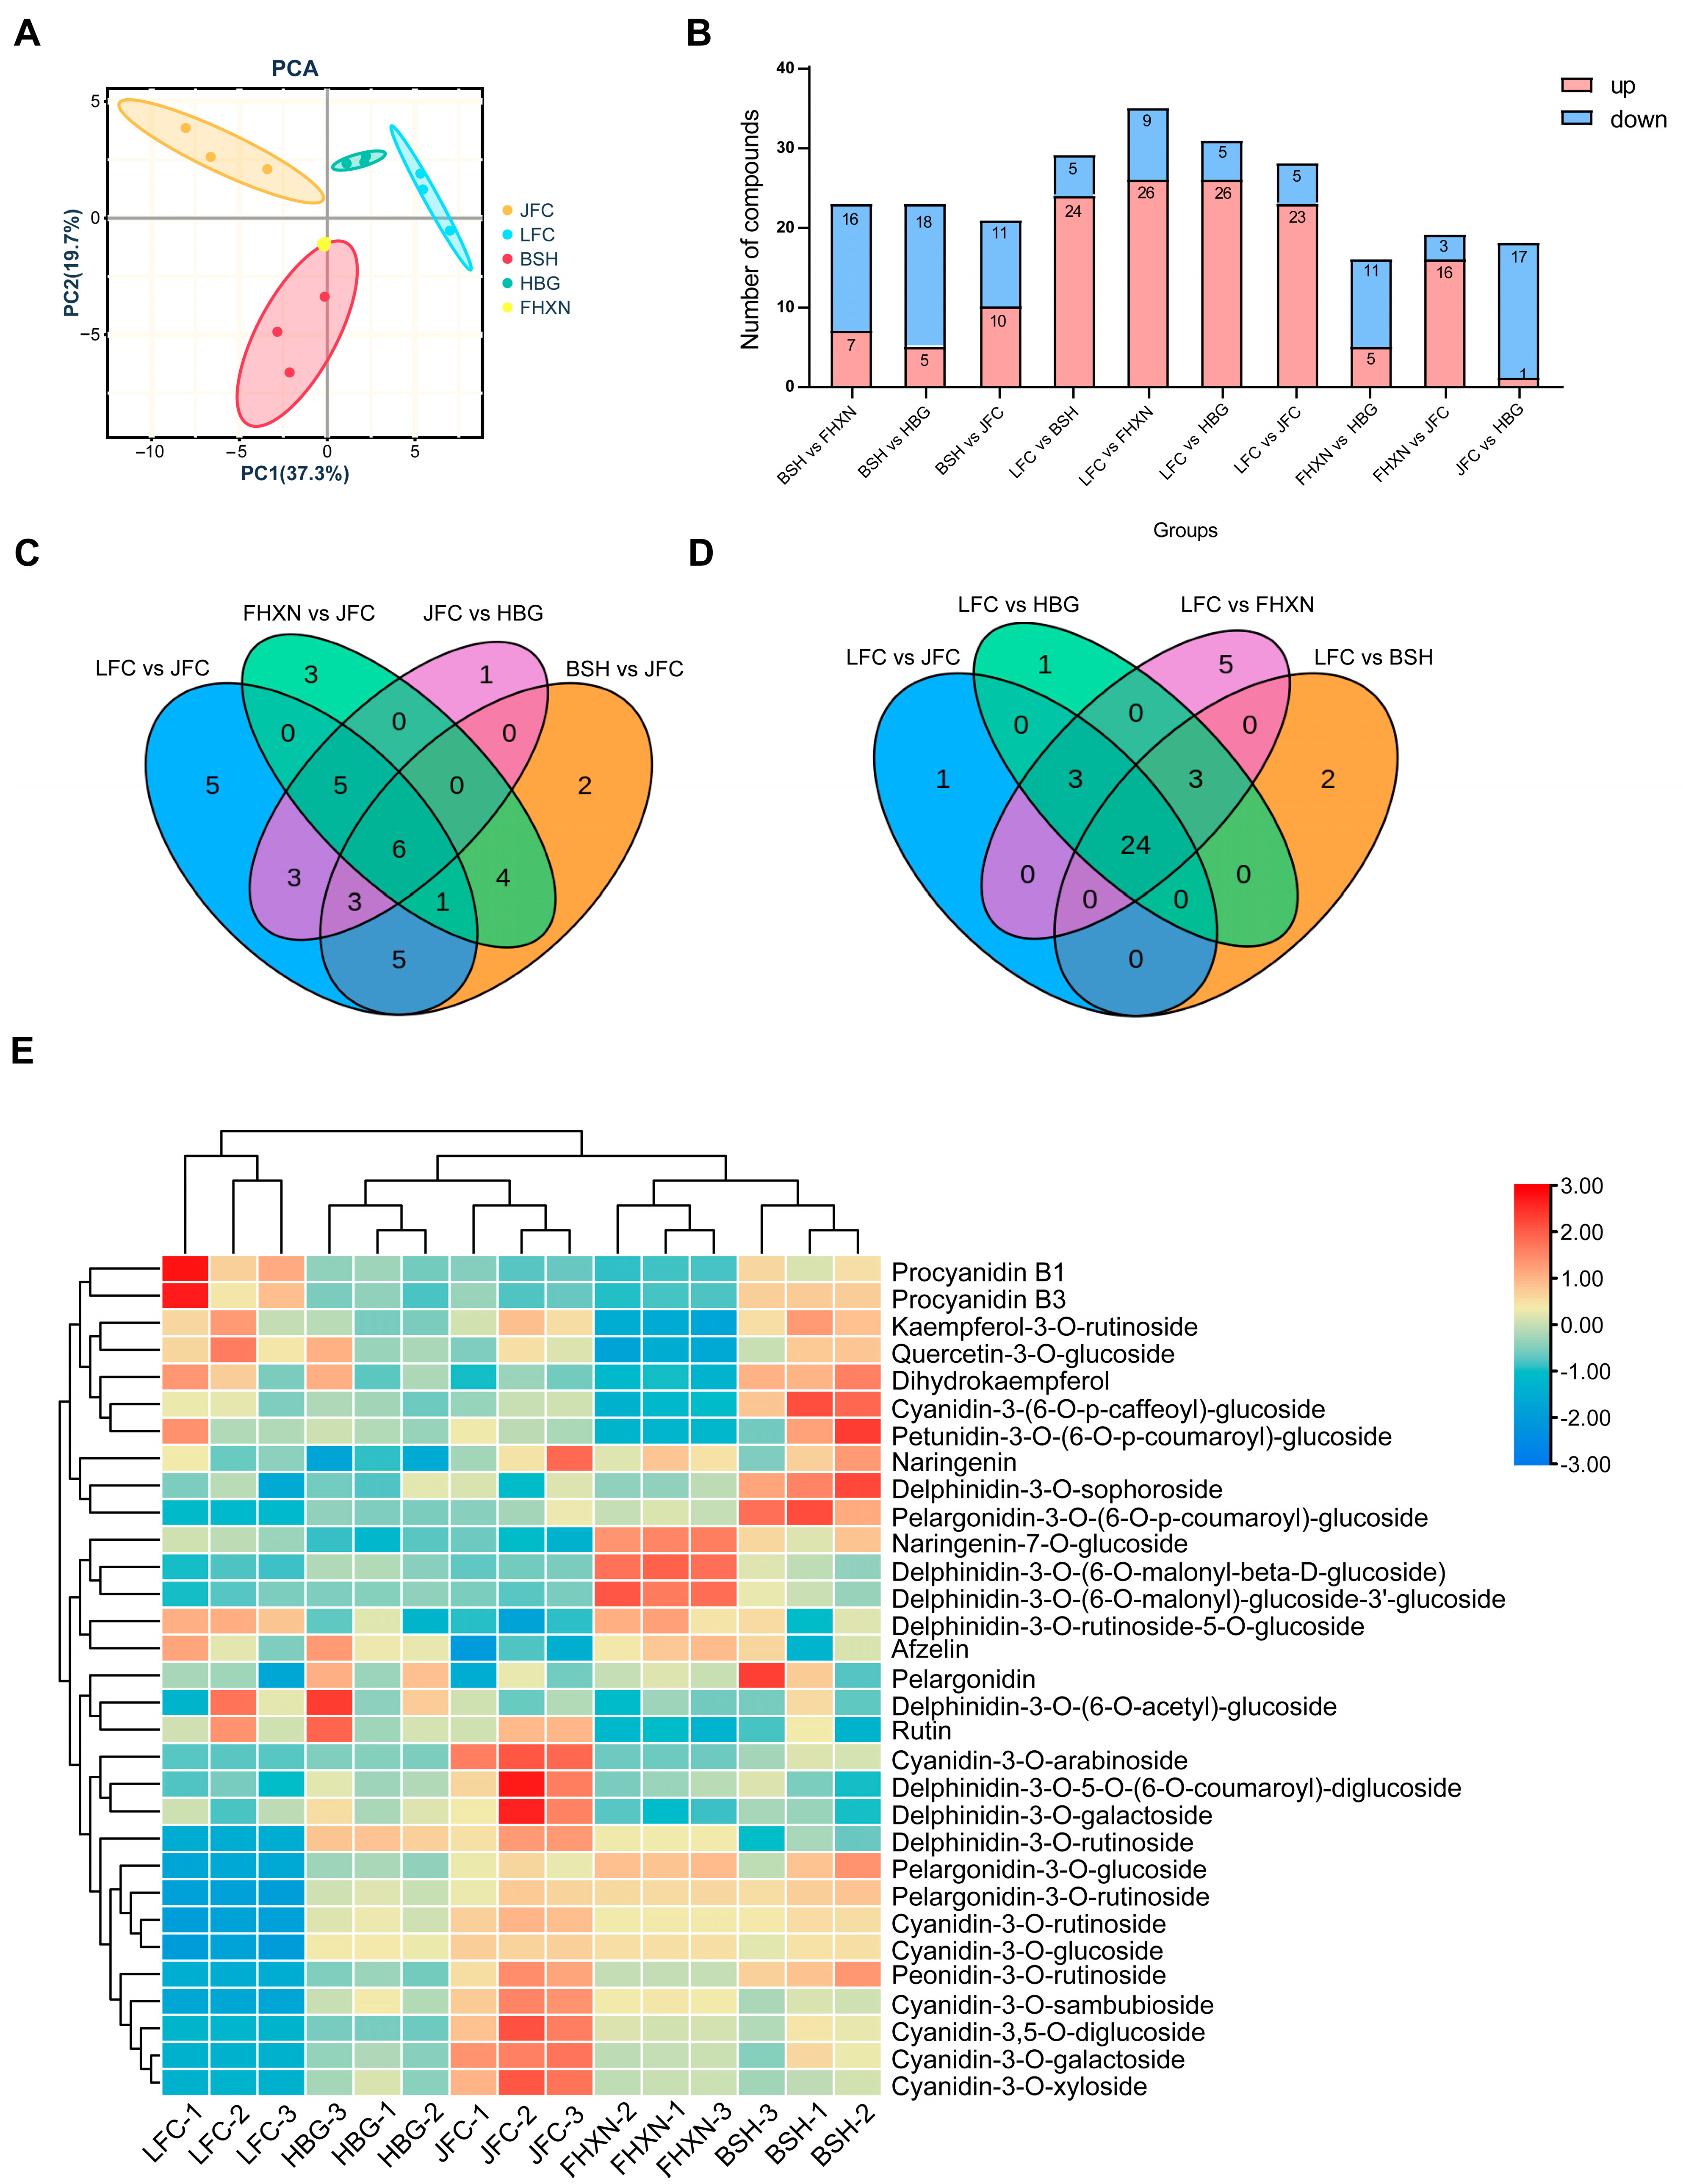
To compare the flavonoids and anthocyanin compound composition among five Toona clones, three biological replicates of each clone were sampled to detect anthocyanin-related metabolites employing the UPLC-MS/MS platform. The resulting metabolite composition data sets underwent PCA analysis (Figure 2A). The PCA plot for the anthocyanin-related metabolites showed a clear separation between the red, pink, light red, green, dark-purple samples. A total of 43, 40, 44, 40, and 32 anthocyanin-related metabolites were identified in leaves of JFC, BSH, FHXN, HBG, and LFC, respectively (Table S1). A total of 31 anthocyanins were identified in all of the samples. Then, the |log2(fold-change)| ≥ 1 and p value < 0.05 was used to determine significantly metabolites between groups (Figure 2B). In group LFC vs. JFC, 23 upregulated metabolites and 8 downregulated metabolites were found to be significantly different (Figure 2B). In LFC vs. BSH, there were 24 upregulated metabolites and 6 downregulated metabolites (Figure 2B). In BSH vs. JFC, there were 10 upregulated metabolites and 11 downregulated metabolites (Figure 2B). Counting the differential metabolites compared with both LFC and JFC for each individual plant, a Venn diagram was used to show that there were 6 differential metabolites in the comparison group compared with JFC and 24 common differential metabolites compared with LFC (Figure 2C,D). Thirty-one common detected metabolites were used to draw clustering heatmap by TBtools (https://bio.tools/tbtools, accessed on 13 September 2023). The contents of cyanidin and delphinidin could be mainly responsible for the leaves color of Toona sinensis (Figure 2E).
Metabolomic analyses revealed significantly higher levels of several anthocyanin pigments, namely Naringenin, Delphinidin-3-O-rutinoside, Delphinidin-3-O-5-O-(6-O-coumaroyl)-diglucoside, Cyanidin-3-O-arabinoside, Cyanidin-3-O-glucoside, Cyanidin-3-O-rutinoside, Cyanidin-3-O-galactoside, Cyanadin-3-O-xyloside, Cyanidin-3-O-sambubioside, Cyanidin-3,5-O-diglucoside, Peonidin-3-O-rutinoside, in the JFC variety compared to other varieties. Interesting, among these anthocyanins, the content of Cyanidin-3-O-arabinoside was found to be 520.93-fold higher in JFC than in LFC.

2.3. Transcriptome Analysis of Five Toona sinensis Clones

Fifteen cDNA libraries (each clone with three biological replicates) were sequenced using the Illumina HiSeq platform. After removing low-quality reads, each sample yielded between 42.16 M to 52.03 M clean reads (Supplementary Figure S1). The Q30 base exceeded 92.56% and the guanine–cytosine (GC) content of each sample was greater than 42.27%, indicating acceptable sequencing quality. After filtration, the clean data reached 6.32–7.80 Gb for each sample. The genome of Toona sinensis var. Heiyouchun was utilized, which marked a significant was the first chromosome-level genome assembled of Toona, as our reference genome [36]. Furthermore, comparison of all clean reads with this reference genome and subsequently performed gene annotations, the results revealed a high rate of similarity, ranging from 92.26% to 94.03%. These results validate the reliability of our data. Novel genes were defined as unigenes found in the sequencing results but not included in the reference genome (or reference gene set) after reconstructing the transcripts using StringTie v1.3.4d software. Comparison identified 9127 novel genes. The PCA results of transcriptome showed significant differences among five clones (Figure 3A).
To investigate the function of unigenes in Toona, we conducted a comparative analysis with various databases including KEGG, NR, Swiss-Prot, GO, KOG, and Trembl using BLAST (Diamond version 2.0.9) software. To obtain annotation information on unigenes, amino acid sequences were derived from the unigene sequences and compared against the Pfam database using HMMER V3.2 (http://hmmer.org/, accessed on 10 June 2022) software. Interestingly, when compared to data in the NR database, it was observed that gene sequences from Toona sinensis exhibited a greater degree in similarity to Citrus clementina (30.91%), followed by Citrus sinensis (30.47%) as depicted in Supplementary Figure S1B. The function terms of unigenes were annotated in the KOG and GO database, and the function groups were showed in Supplementary Figure S1C,D.
Based on the reference transcriptome, 40,421 genes were assembled from clean reads, which included 31,647 genes annotation in reference genome and 9127 novel transcripts. In addition, 23,909, 16,532, 25,617, 15,566, 32,348, and 25,575 unigenes were annotated by KEGG, NR, SWISSPORT, THEM, GO, and KOG database. There were 14,153 unigenes annotated by all of the databases. A comparison with six public databases (KEGG, NR, SwissProt, Tremble, GO and KOG) annotated a total of 13,295 differentially expressed genes (DEGs) and predicated their potential functions. The DEGs were counted with an absolute |log2fold-change| ≥ 1 and a false discovery rate (FDR) ≤ 0.05 in each compared groups. According to five clones of Toona leaves, 10 pairs of comparisons were performed and the number of up-regulated and down-regulated differential genes was counted in all groups (Figure 3B). Across all compared groups, a total of 310 DEGs were co-detected (Figure 3C). The KEGG-based enrichment analysis revealed that all DEGs compared to LFC were enriched into 140 KEGG pathways. These pathways included flavonoid biosynthesis, phenylpropanoid biosynthesis, and anthocyanin biosynthesis, all of which were significantly enriched (Figure 3D). These terms have previously been associated with anthocyanin production.

2.4. Analysis of Anthocyanidin Biosynthetic Pathway Genes and Anthocyanin Derivates in JFC, BSH, and LFC

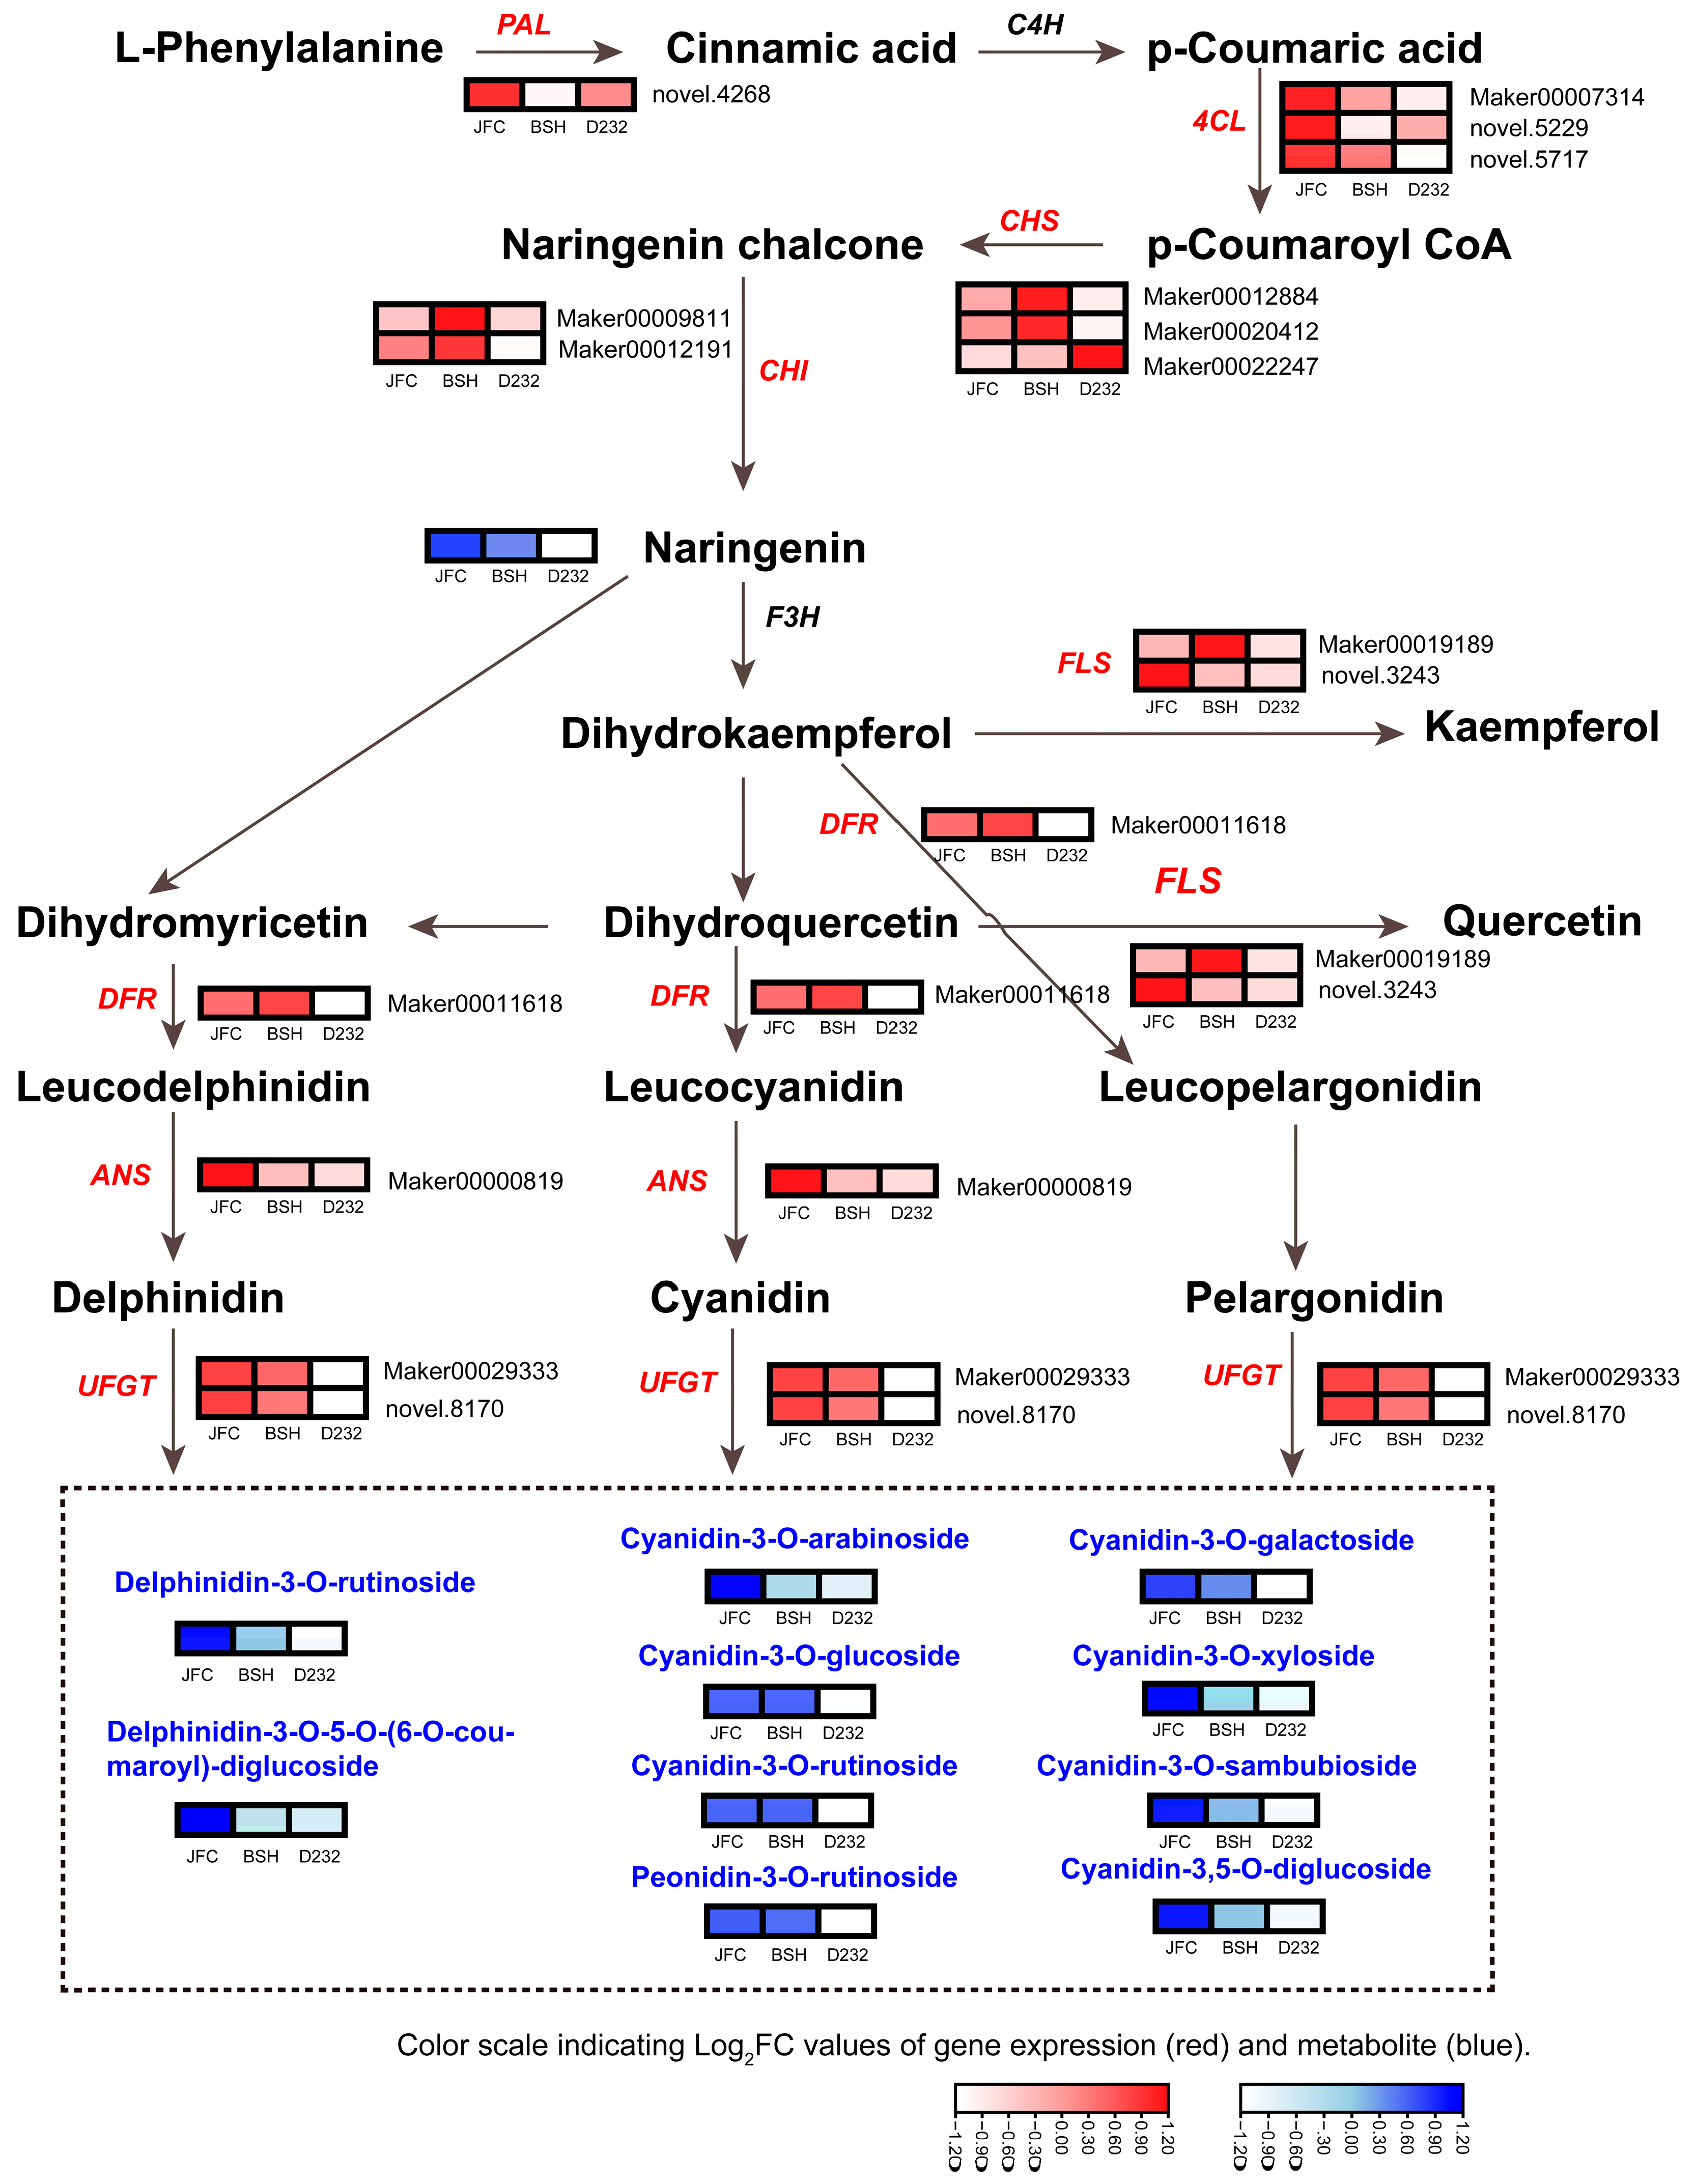
According to transcriptome and metabolites studies, anthocyanin biosynthesis may be responsible for the distinct red leaf colorations of Toona. Therefore, it is necessary to investigate the mechanisms that underlie this process. Genes encoding anthocyanin biosynthetic enzymes were found to be associated with different compositions of the compounds in the anthocyanin biosynthesis pathways. We constructed a pathway diagram displaying the expression heat map of structural genes and compounds for red, light-red, and green leaves (Figure 4). The PAL gene catalyzed the conversion of L-Phenylalanine to cinnamic acid and was highly expressed in JFC. Among the 4CL genes, two exhibited a gradual decrease in expression from red to green leaves across JFC, BSH, and LFC. CHS, the first key enzyme in the flavonoid pathway, played a pivotal role in catalyzing the synthesis of chalcone. Three CHS genes were differentially expressed in these clones. Two of these genes were significantly up-regulated in BSH and JFC, compared with LFC, whereas one was more highly expressed in LFC than in BSH and JFC. Two CHI genes responsible for converting naringenin chalcone to naringenin exhibited higher expression levels in BSH and lower expression in LFC. The accumulation of anthocyanin was positively correlated with the expression level of these genes. The study found that there was a gradual decrease in the content of naringenin metabolite in JFC, BSH, and LFC. Moreover, the study found that the FLS, DFR, and ANS genes play a crucial role in transforming naringenin into delphinidin, cyanidin, and pelargonidin, respectively, with their expression levels being up-regulated in JFC and down-regulated in LFC (Figure 4). UFGT is a critical enzyme involved in the biosynthesis of stable anthocyanins from unstable anthocyanin glycosides. The study identified two UFGT genes whose expression levels were significantly higher in JFC than in BSH, with the lowest levels observed in LFC, resulting in the highest accumulation of different anthocyanin compounds in JFC compared to LFC. These results revealed that the expression of genes in anthocyanin biosynthesis was consistent with accumulation of anthocyanins.

2.5. Correlation Analysis of Differentially Expressed Transcripts and Anthocyanin Compounds to Identify Key TFs and Plant Hormones Genes

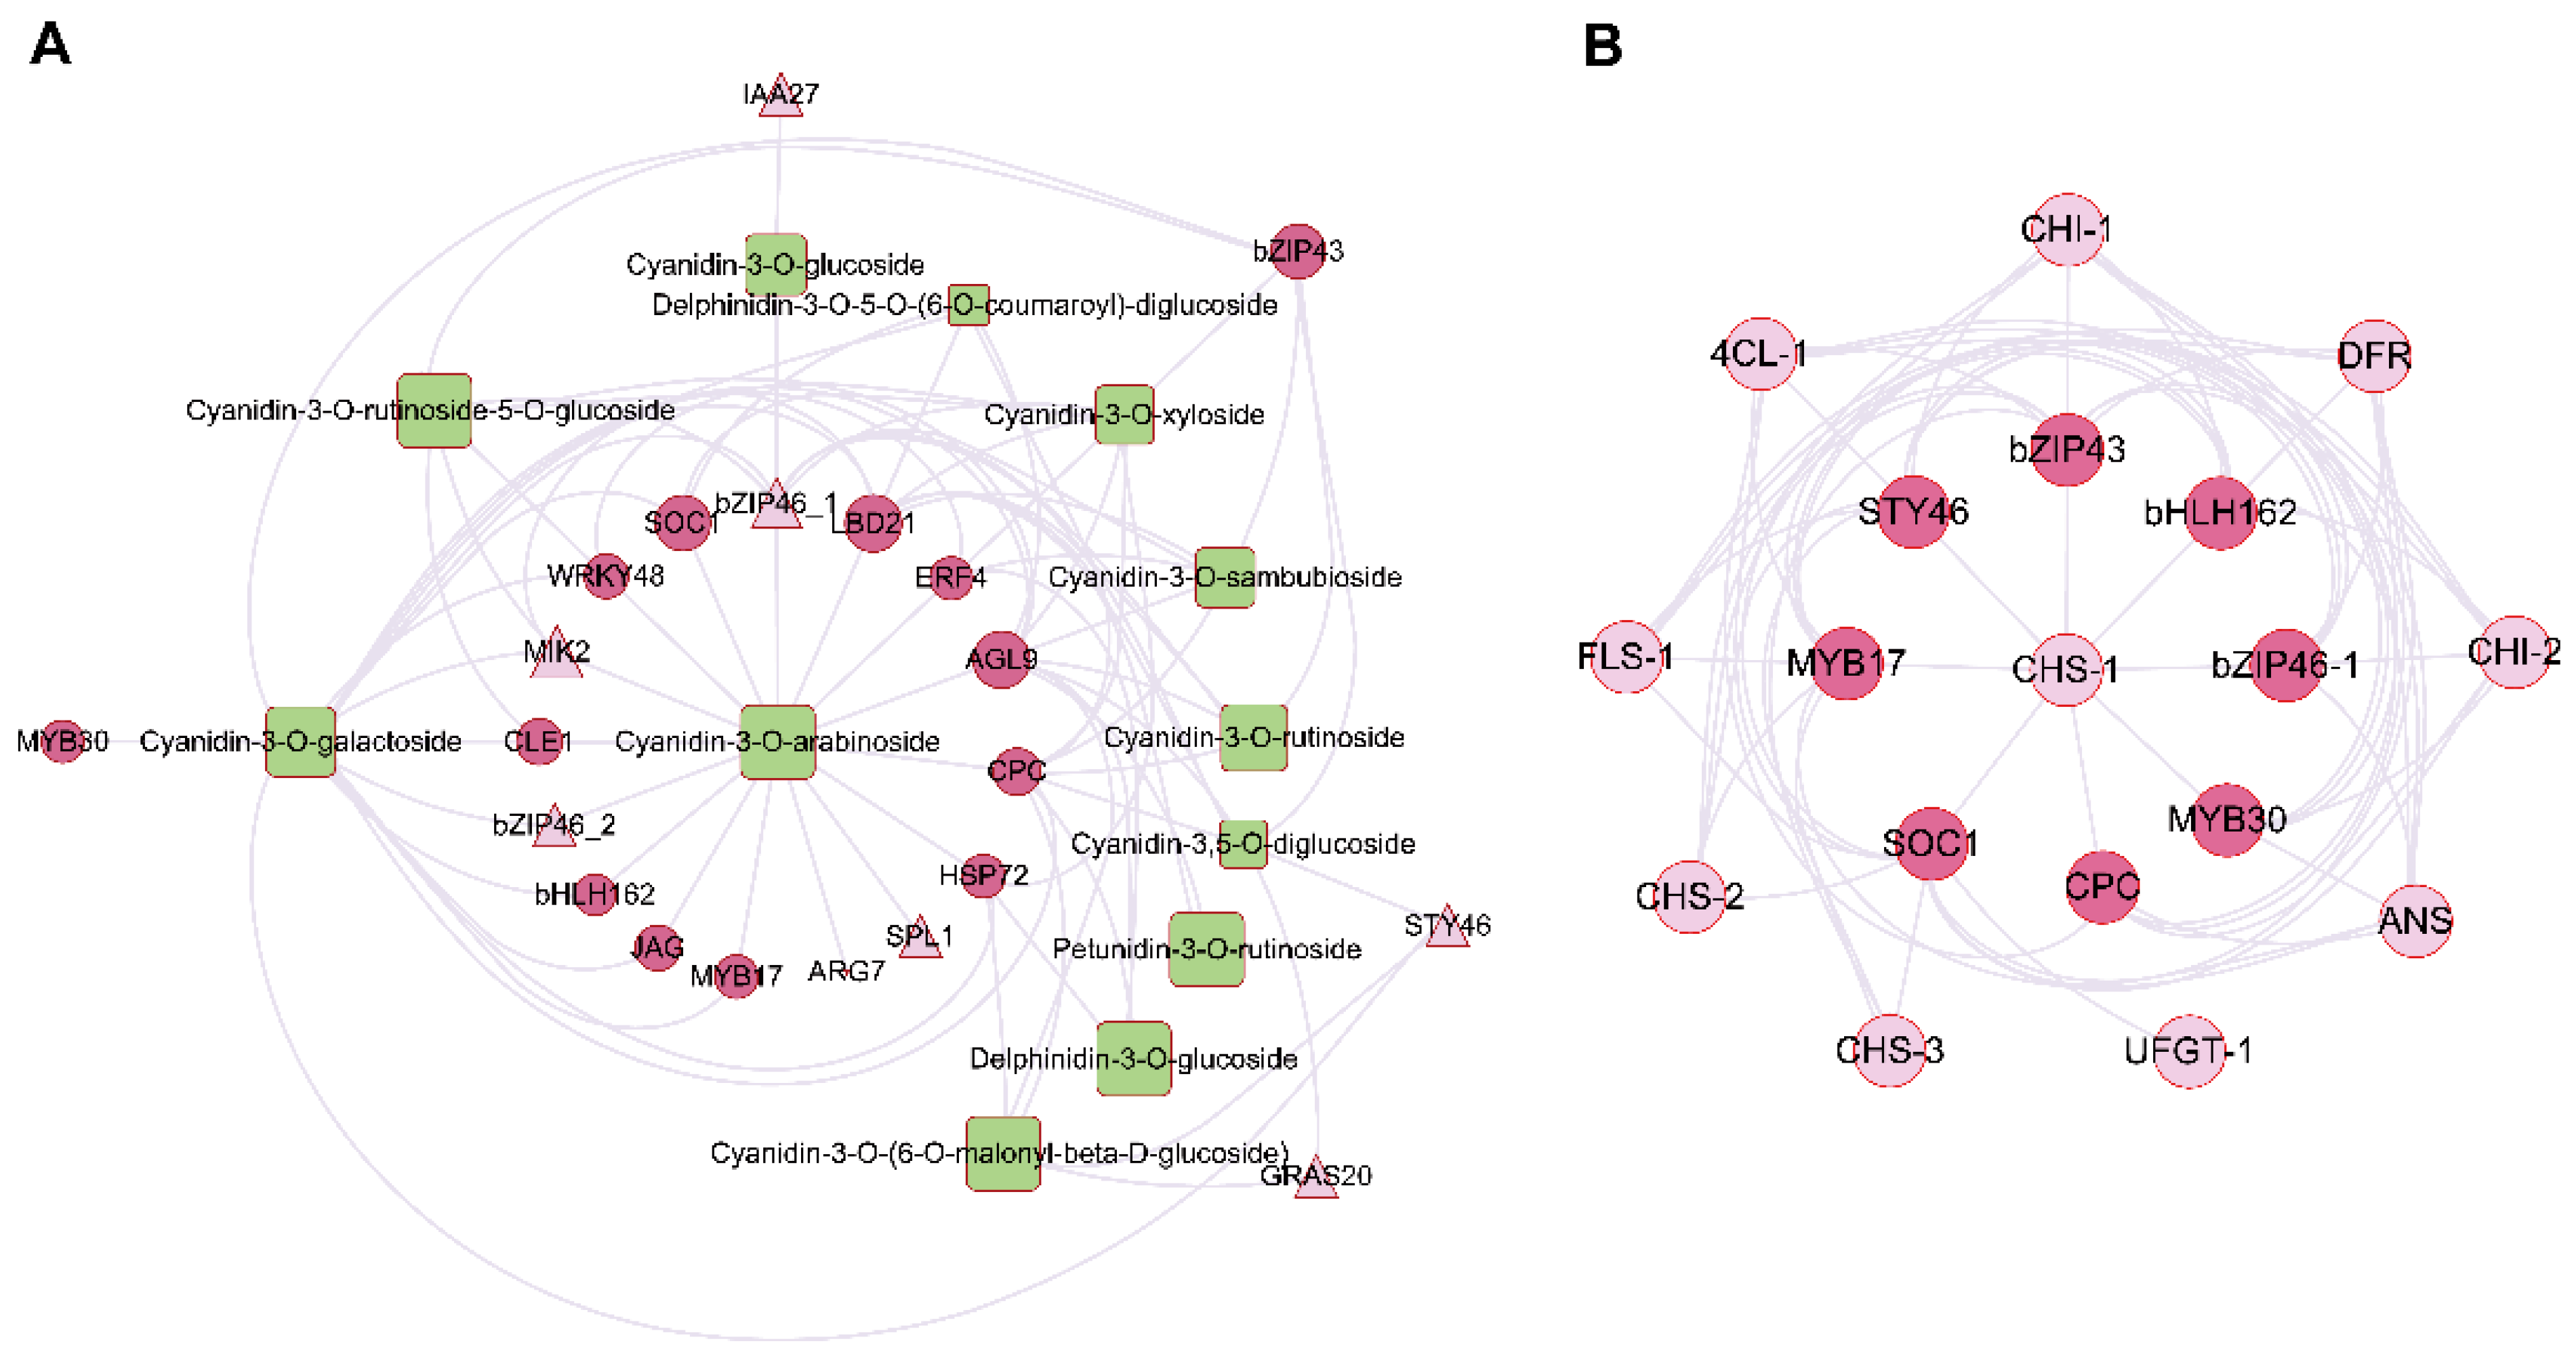
To achieve the regulatory network between regulatory genes, including transcription factors and plant hormone-related genes, and anthocyanin metabolites, an association analysis was conducted between transcripts and metabolome (Supplementary Figure S2). The major transcription factors and plant hormone-related genes were then identified using differentially expressed genes and metabolites that showed significant differences between JFC (red) and LFC (green). A conjoint analysis was conducted to establish relationships between 510 genes and 23 metabolites with a positive correlation coefficient greater than 0.8 within JFC and LFC. Among these genes and metabolites, 23 TFs and phytohormone-related genes were identified and showed strong correlations with 13 anthocyanin derivates (Table 1). Using Cytoscape 3.10.0, a regulatory network was constructed between these 23 genes and 13 anthocyanin derivatives (Figure 5A). The top 3 TFs associated with the biosynthesis of anthocyanins belonged to AGL9 (MADS-box), SOC1 (MADS-box), MYB (CPC) (Table 1). Furthermore, among the top five compounds, Cyanidin-3-O-arabinoside and Cyanidin-3-O-galactoside emerged as the most significantly different anthocyanin derivatives in Toona sinensis (Table 1). Consequently, a regulatory network was constructed between these top transcription factors and structural regulatory genes involved in anthocyanin biosynthesis (Figure 5B). These findings suggest that MADS-box, MYB, and bHLH transcription factors may regulate DFR, ANS, UFGT, and other structural genes involved in the biosynthesis of anthocyanin in Toona sinensis by either affecting or participating in the regulation of structural gene.

2.6. Expression Profiles of TFs and Plant Hormone Genes Related to Anthocyanin Biosynthesis

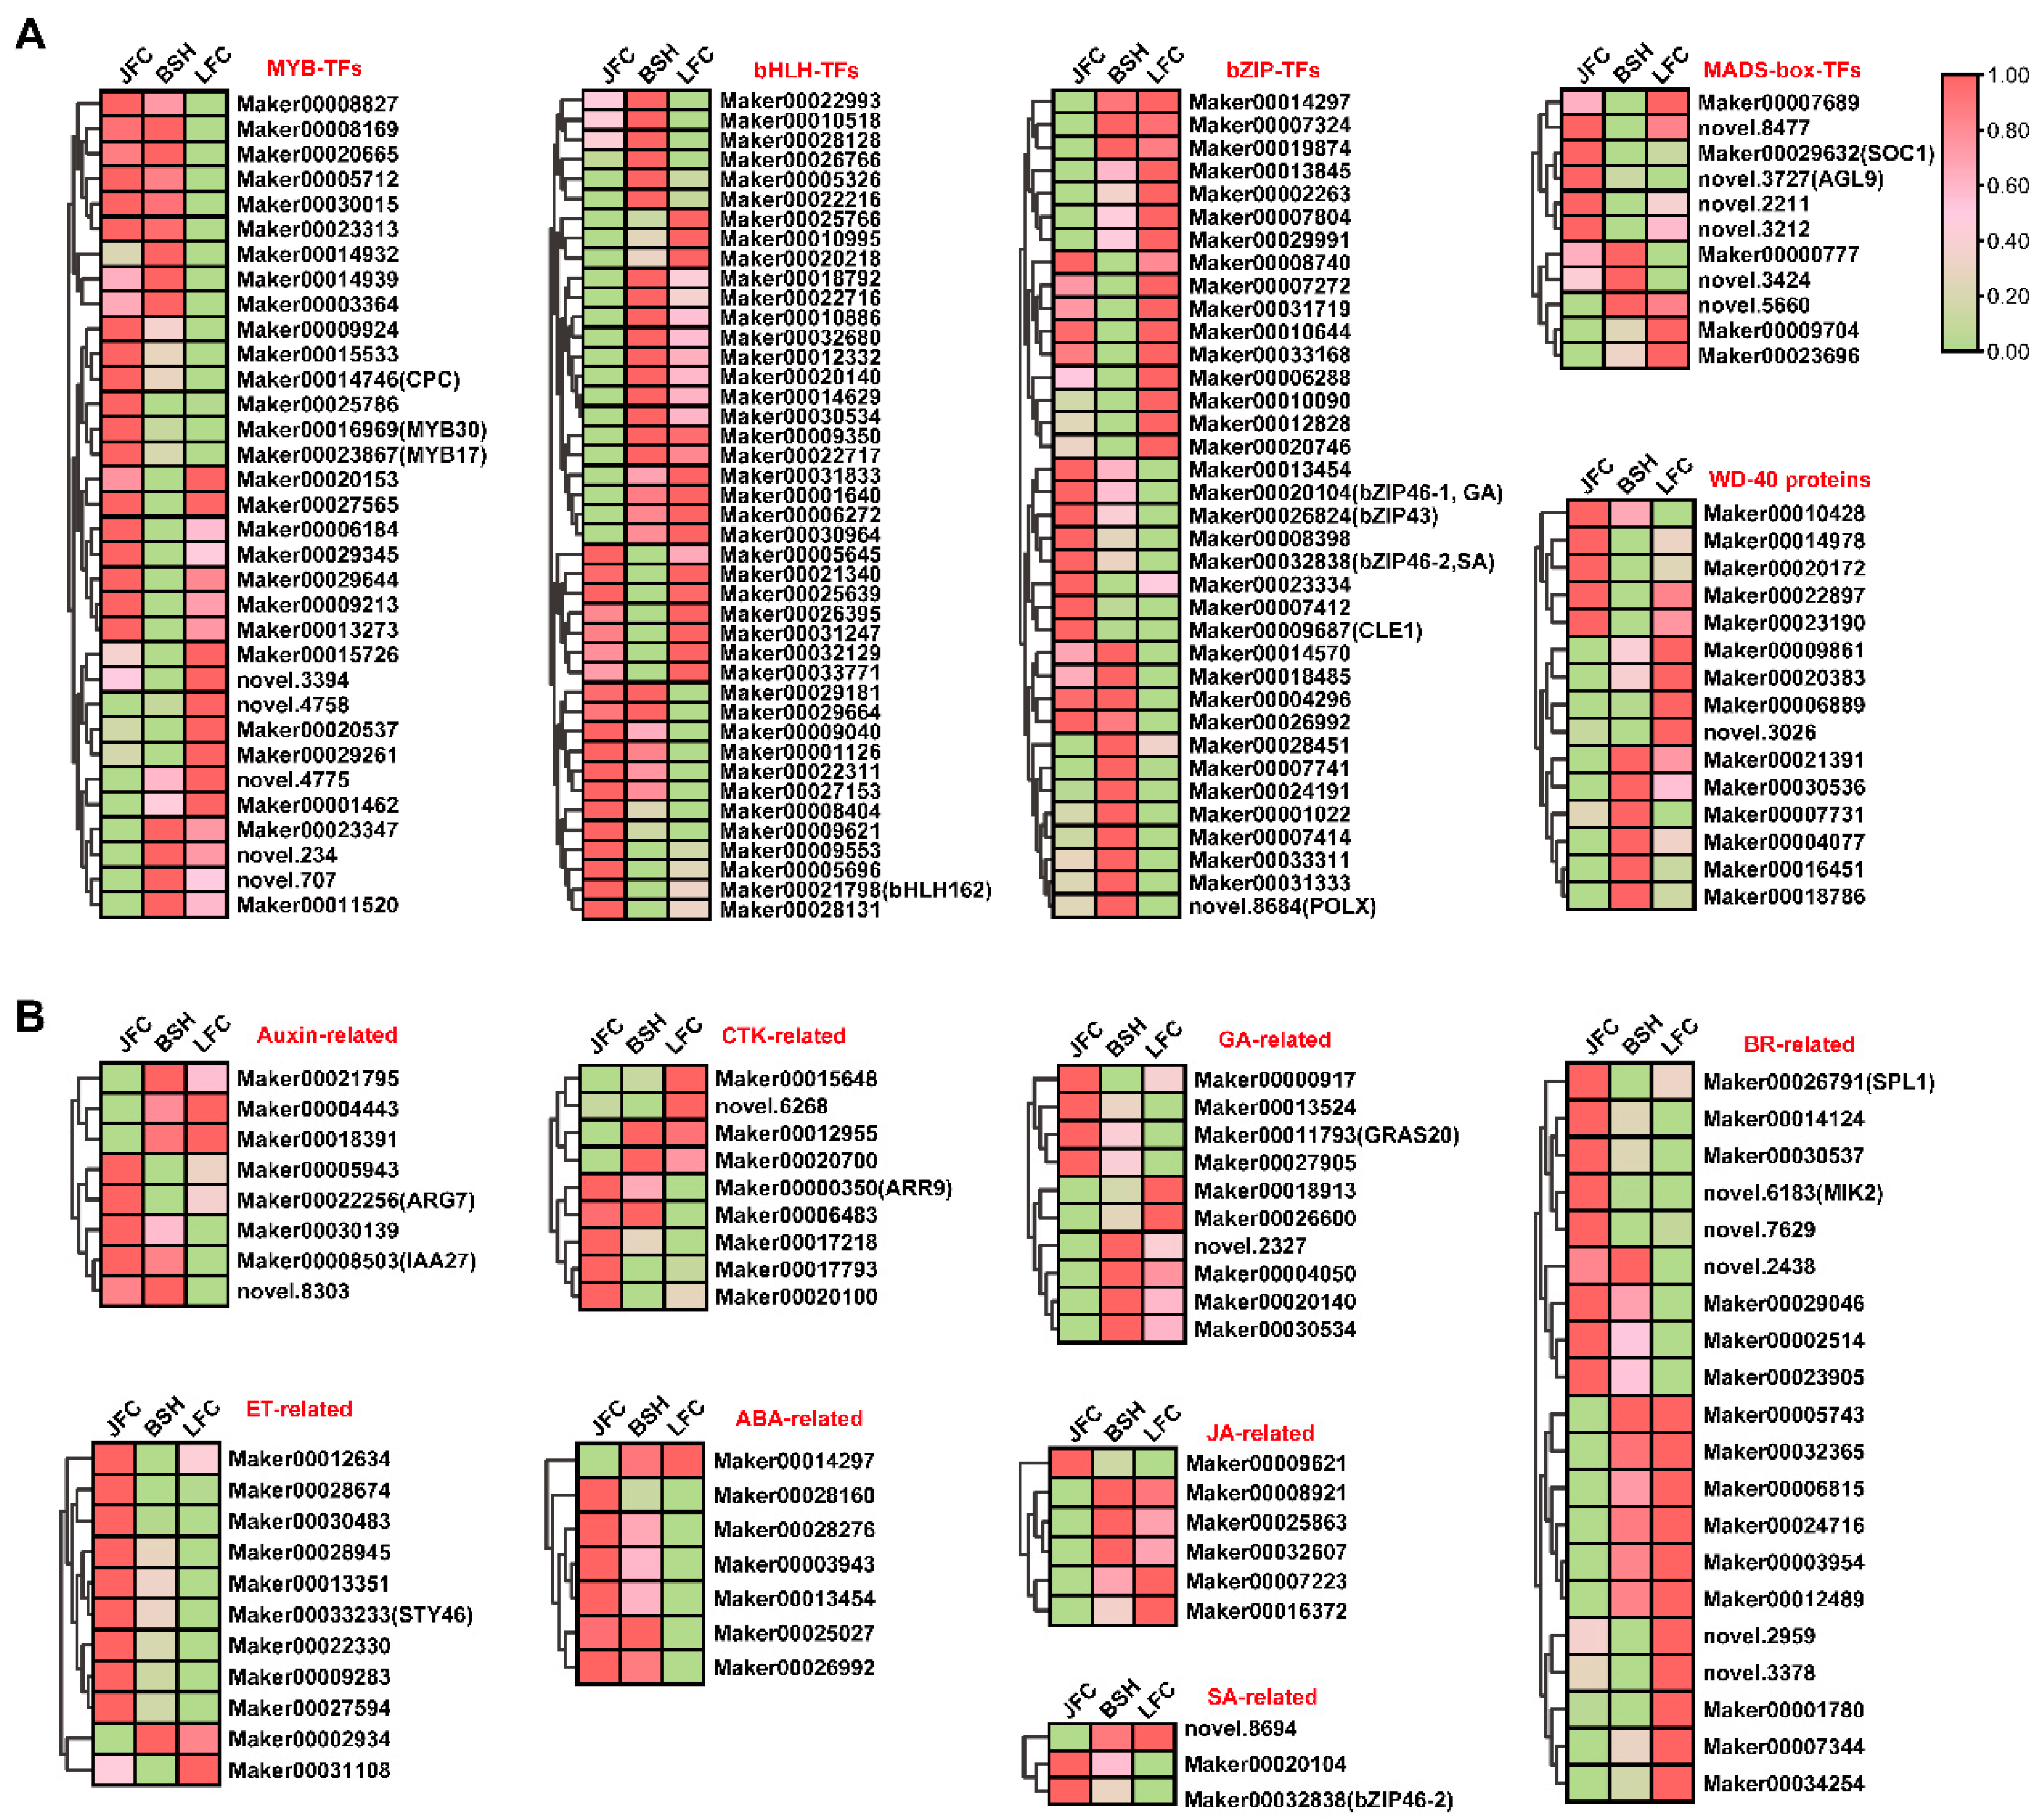
Previous studies have demonstrated that the biosynthesis of anthocyanins requires the involvement of transcription factors, such as MADS-box, MYB, bHLH, and bZIP. In this study, we identified a total of 11 MADS-box genes, 33 MYBs, 42 bHLHs, 36 bZIPs, and 15 WD40 genes in Toona. The RNA expression levels in JFC, BSH, and LFC was compared, which revealed that 12 bHLH, 10 bZIP, 12 MYB, 2 MADS-box, and 1 WD40 were significantly highly expressed in JFC, lowest in LFC (Figure 6A). Furthermore, the heatmap showed that all highly correlated TFs with anthocyanin derivates belonged to these groups.
Studies suggest that plant hormones have a crucial function in regulating anthocyanin concentrations in leaves and fruits via direct or indirect regulation of transcription factors responsible for anthocyanin biosynthesis. The hormones capable of activating or inhibiting the structural genes involved in the biosynthesis pathway include auxin, gibberellins, cytokinin, brassinosteroids, jasmonic acid, salicylic acid, and abscisic acid. Furthermore, we identified several differentially expressed genes that participate in plant hormone signal transduction, including 8 Auxin-related genes, 9 CTK-related genes, 10 GA-related genes, 23 BR-related genes, 7 ABA-related genes, 11 ethlye-responsive genes, 6 JA-related genes, and 3SA-related genes. Among these genes, the following exhibited a positive correlation coefficient greater than 0.8 with anthocyanin compounds: 2 Auxin-related genes (Maker00008503 and Maker00022256), 1 CTK-related gene (Maker00000350), 1 GA-related gene (Maker000117930), 2 BR-related genes (Maker00026791 and novel.6183), 1 Ethylene-responsive genes (Marker00033233), and 2 SA-related genes (Maker00020104 and Maker00032838) (Figure 6B). This indicates that these genes may positively regulate anthocyanin biosynthesis either directly or indirectly.

2.7. Expression Analysis of Genes through qRT-PCR

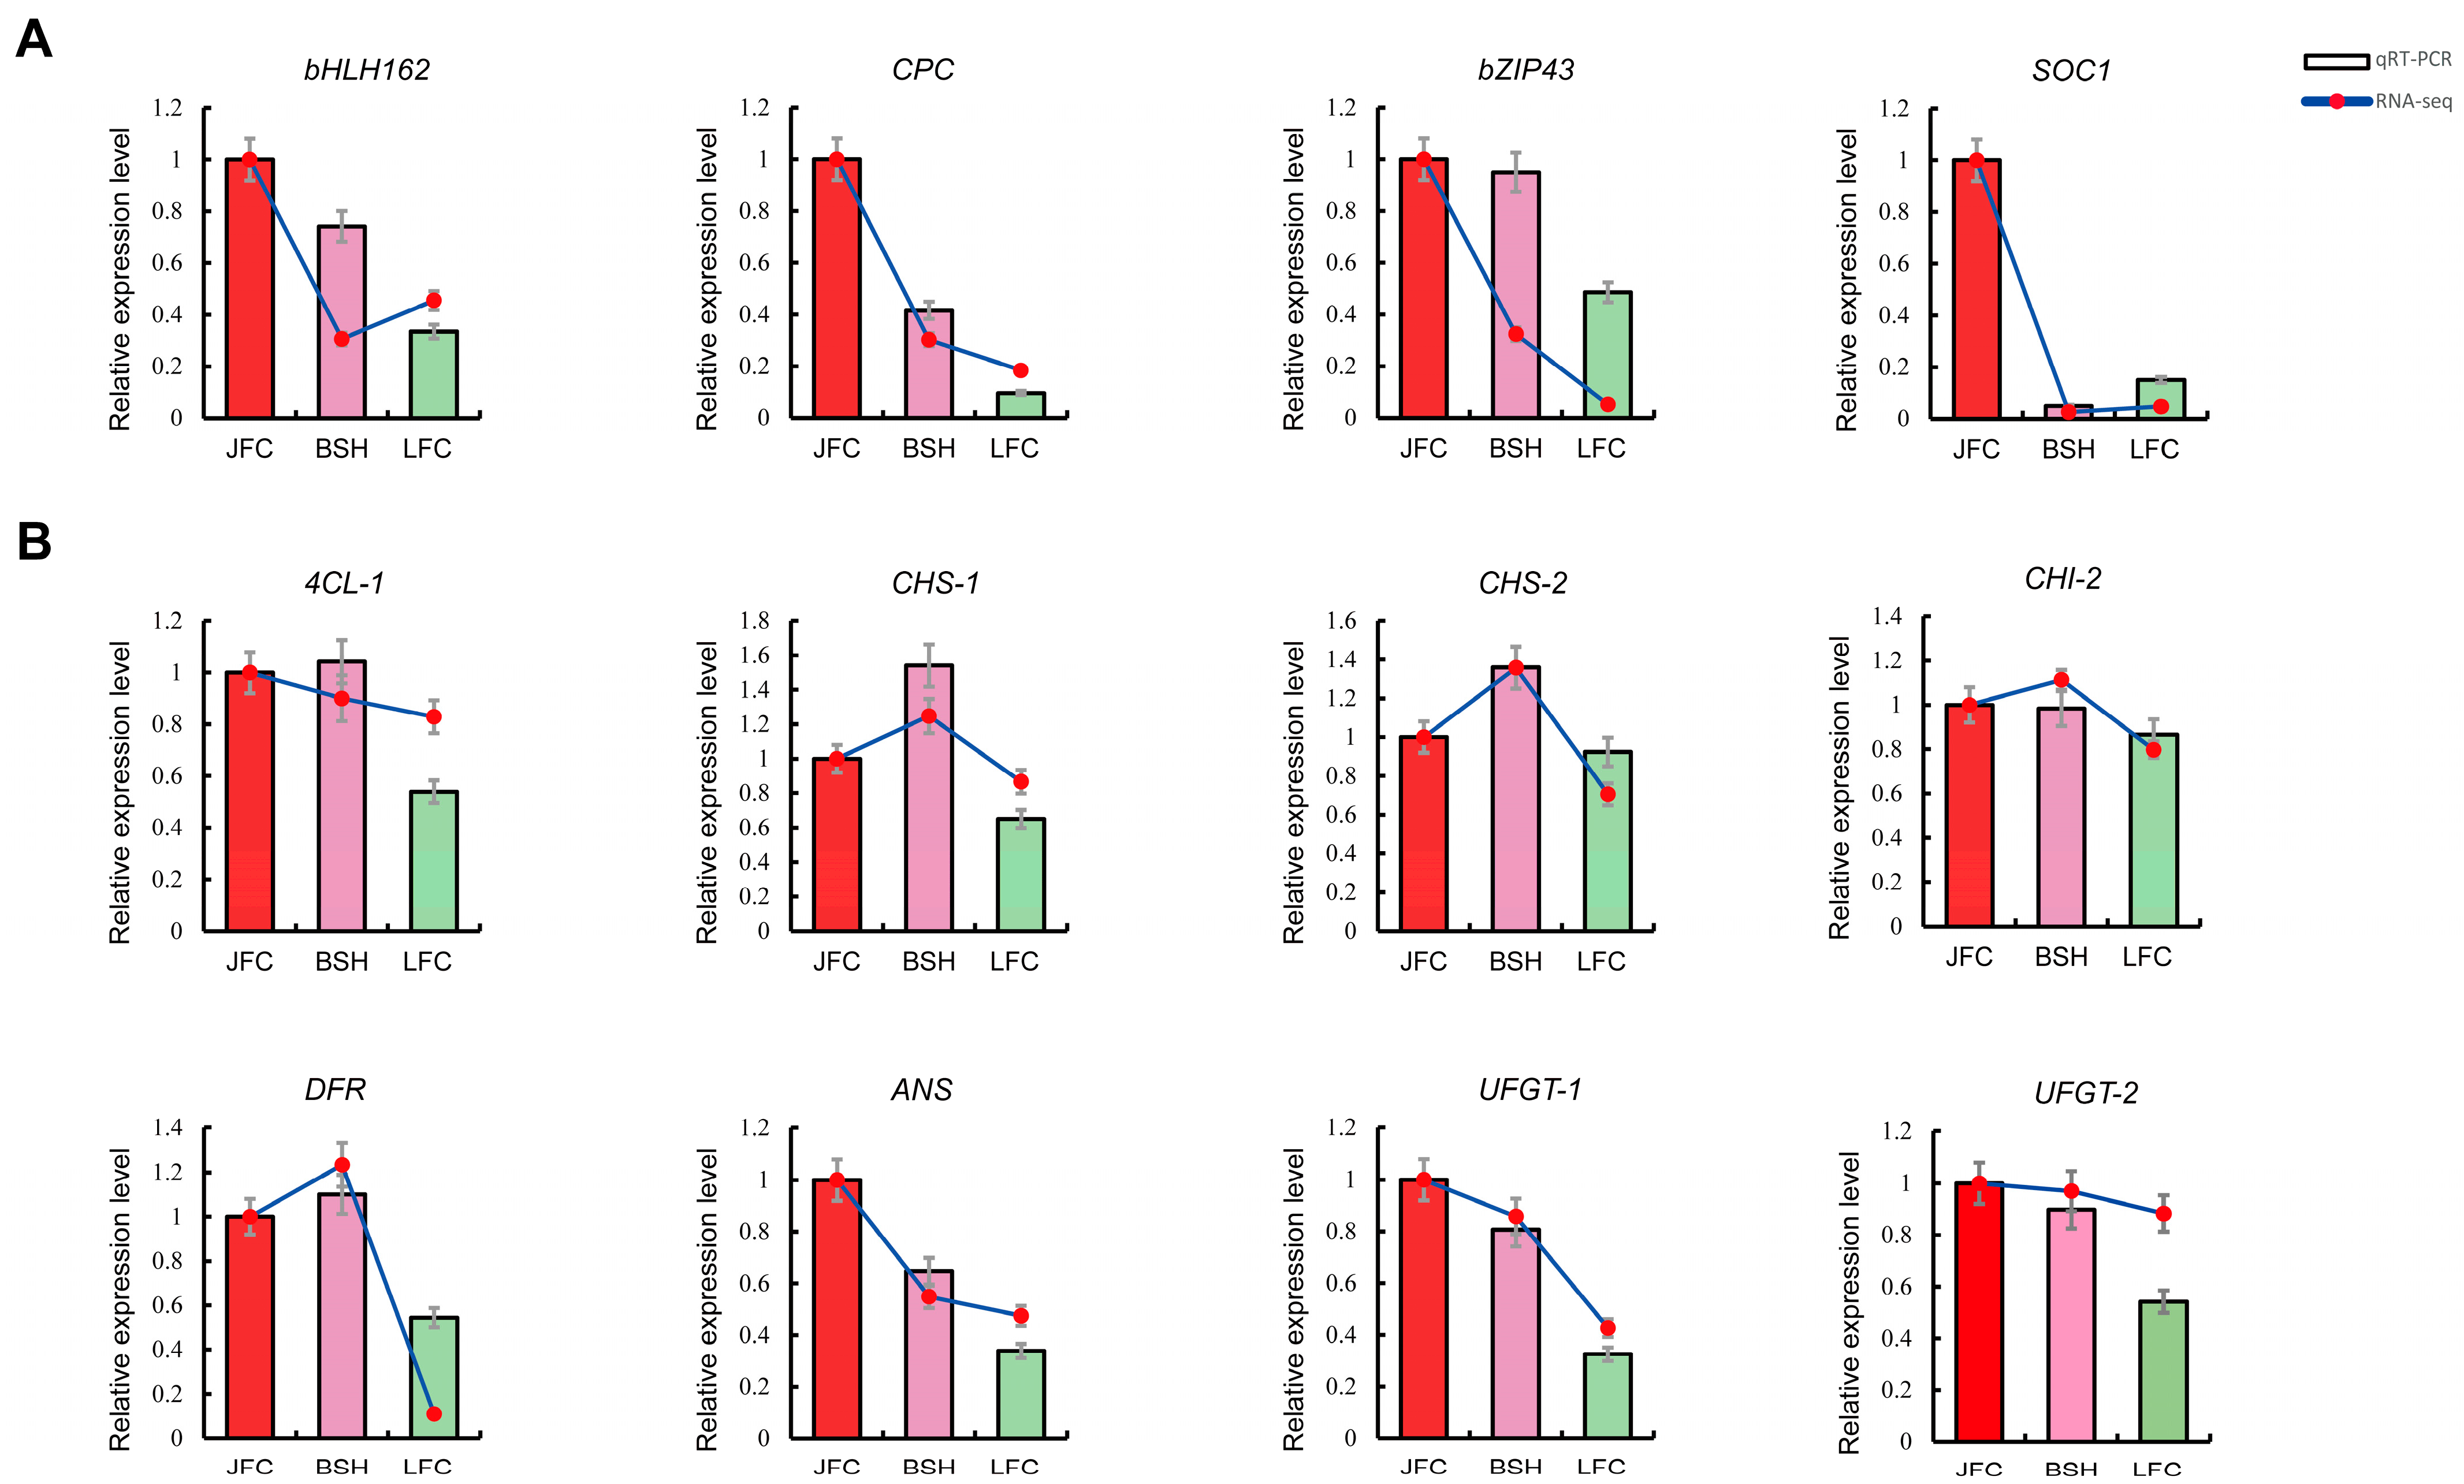
To validate the RNA-seq results, we utilized qRT-PCR to evaluate the expression of 8 structural genes and 4 TFs involved in the anthocyanin biosynthesis pathway. Our observations revealed that bHLH162, CPC, and SOC1 TFs were significantly upregulated in JFC and exhibited the lowest expression levels in LFC (Figure 7A). Additionally, there was a strong correlation between the RNA-seq and the characteristic leaf color of these samples. The qRT-PCR outcomes of structural genes were also significantly correlated with RNA-seq (Figure 7B). Moreover, our data suggested that the expression levels of bHLH162 (Maker00021798, 2.99 times higher in JFC than in LFC), CPC (Maker00014746, 10.48 times), and SOC1 (Maker00029632, 6.67 times) were synchronized with DFR (Marker00011618, 1.84 times), ANS (Marker00000819, 2.95 times), and UFGT-1 (Marker00029333, 3.07 times), indicating that they may be involved in regulating anthocyanin production. These findings demonstrated that transcription data accurately reflect gene expression in the anthocyanin biosynthesis of Toona sinesis.

3. Discussion

Anthocyanins present in Toona sinensis leaves possess various health benefits, including antioxidant and anti-inflammatory properties, and potential cancer-preventing properties. Understanding the regulatory mechanisms involved in anthocyanin biosynthesis in Toona sinensis leaves has significant implications for human health and agriculture. In this study, we utilized metabolomic and transcriptomic approaches to elucidate the molecular mechanisms and regulatory network involved in anthocyanin biosynthesis in Toona. A total of 32–44 metabolites related to anthocyanins were identified in five different clones of Toona leaves using UPLC-MS/MS. We found that JFC had the highest total anthocyanin content, with Delphinidin, Cyanidin, Peonidin being the most abundant pigments in JFC. Specifically, Cyanidin-3-O-arabinoside was found to be 520.93 times more prevalent in JFC than in LFC, indicating that cyanidin compounds are the dominant anthocyanin in JFC. These findings are consistent with those of previous studies on strawberry petals, which have shown that cyanidins are the primary anthocyanin compound present [37].
Transcriptome sequencing of Toona leaves with different colors can provide valuable insights into the regulating genes involved in anthocyanin biosynthesis. The KEGG pathway enrichment analysis of differentially expressed genes (DEGs) in colored leaves of different clones compared to green leaves revealed significant enrichment of genes involved in flavonoid biosynthesis, phenylpropanoid biosynthesis, and the anthocyanin biosynthesis pathway. This finding supports previous studies demonstrating the involvement of multiple enzymes encoded by early biosynthesis genes and anthocyanin biosynthesis genes in anthocyanin biosynthesis. The study indicates that the biosynthesis of naringenin is a crucial step in the flavonoids metabolic pathway and plays a decisive role in the synthesis of anthocyanin compounds. The PAL, C4H, 4CL, CHS, and CHI are key genes in the flavonoids metabolic pathway and play a decisive role in determining naringenin production. The study found that JFC had a higher naringenin content than BSH and LFC, but only two 4CL genes (Maker00007314, novel.5717) were expressed at high levels in JFC and low levels in LFC. The expression of 4CL genes was highly positively correlated with naringenin content, indicating that the number and function of genes in the naringenin pathway may affect naringenin content. During the biosynthesis of anthocyanins, DFR catalyzes the reduction reaction of flavonoid-3′,5′-hydroxylase to form anthocyanins, which was confirmed as a key step for regulating anthocyanin types. ANS converts anthocyanin precursors to anthocyanin glycosides. UFGT can catalyze the conversion of unstable anthocyanidins into stable anthocyanins. The absence of these genes directly affects anthocyanins biosynthesis, leading to pigment loss [38,39]. Down-regulation of the apple DFR gene can inhibit both cyanidin and procyanidin accumulation. In Vitis vinifera, the silencing of the DFR gene leads to the absence of anthocyanins [40]. In Duchesnea indica, a plant belonging to the Rosaceae family, decreased expression of the ANS gene results in white-colored fruits [41]. Conversely, overexpressing the SmANS gene in Salvia miltiorrhiza can increase anthocyanin content but decrease the biosynthesis of salvianolic acid [42]. In our study, we found significantly increased expression of the DFR gene (Marker00011618), ANS gene (Marker00000819), UFGT (Marker 00029333 and novel.8170) in JFC and BSH compared to LFC, which may explain the red color leaves in JFC and the green color leaves in LFC. Difference in gene sequence and promoter regions of these structural genes may be the primary factors contributing to difference in gene function and expression, ultimately impacting anthocyanin biosynthesis in different clones.
The MBW protein complex was proven to activate the expression of structural genes involved in anthocyanin production. In addition to the MBW complex, other TFs such as bZIP [32,43], NAC [44], WRKY [45,46], MADS-box [47,48], and zinc finger [49,50] proteins have also shown to regulate anthocyanin biosynthesis in plants. In Toona, we found that MADS-box, MYB, and C2H2 possessed top five TFs related to anthocyanin derivates according to the joint analysis between transcriptome and metabolome. The gene-gene regulatory network also showed that the SOC1, CPC, and bHLH162 were the major TFs regulating the anthocyanin biosynthesis structural genes. SOC1 encodes a MADS box transcription factor and is involved in the regulation of flowering in response to temperature or light in various plants species, such as Arabidopsis [51], Oryza sativa L. [52], Gossypium hissytum [53]. In Toona sinensis, the young leaf color is highly sensitive to temperature, indicating a critical role of SOC1 in temperature or light-induced anthocyanin biosynthesis. These transcription factors might regulate anthocyanin biosynthesis process by directly active or repress gene expression by binding to the promoter regions, or indirectly though protein-protein interactions in model plants and other fruits.
Plant hormones can affect anthocyanin biosynthesis through various mechanisms. Previous studies have reported that overexpression of MdIAA26 in apple calli and Arabidopsis promotes the accumulation of anthocyanin, while auxin inhibit it by degrading the MdIAA26 protein [54]. Exogenous ethylene treatment increased anthocyanin accumulation in grape skins and induced the expression of structural genes (VvPAL, Vv4CH, VvCHS, VvCHI, VvF3H, and VvUFGT) and regulatory genes (VvMYBA1, VvMYBA2, and VvMYBA3) related to anthocyanin biosynthesis [55]. Our study identified nine hormone-related genes with a high correlation to regulate anthocyanins biosynthesis, which are highly expressed in JFC and play a significant role in the controlling leaf color variation in Toona. Leaf color is an important trait that is susceptible to both endogenous and exogenous influences. Variations in hormone signal transduction gene expression reflect the essential mechanisms by which plant hormones affect the anthocyanin biosynthesis pathway. These findings enhance our understanding of how anthocyanin biosynthesis works in Toona and how it can be controlled, with implications for breeding new Toona cultivars. Identifying and understanding the beneficial metabolic constituents and regulatory networks of Toona can facilitate the development and utilization of anthocyanin-enriched varieties.

4. Materials and Methods

4.1. Plant Materials

The study selected five Chinese toon clones, JinFuChun (JFC), BaShanHong (BSH), LvFuChun (LFC), FenHongXinNiang (FHXN), and HeBeiGu (HBG), which cultivated in Research Institution of Subtropical Forestry, Chinese Academy of Forestry. The colors of these varieties are: brilliant-red buds (JFC), pink buds (FHXN), light-red with a little green buds (BSH), dark-purple buds (HBG), and green buds (LFC). Fresh buds from five different clones were collected, with three replicates taken for each clone, each replicate sourced from different trees. Buds measuring 10–15 cm in length and weighing approximately 5–10 g were collected for each sample and subsequently underwent freeze-drying for RNA-seq and metabolites measures.

4.2. Sample Preparation and Extraction

The sample underwent freeze-drying, followed by grinding into a powder (30 Hz, 1.5 min), and subsequently, it was stored at −80 °C until required. Subsequently, 50 mg of the powder was precisely weighed and subjected to extraction using 0.5 mL of methanol/water/hydrochloric acid (500:500:1, v/v/v). The resulting extract was vigorously vortexed for 5 min, followed by ultrasonication for another 5 min, and then centrifuged at 12,000× g at 4 °C for 3 min. The residue underwent a repeat extraction using the same procedure and conditions. The supernatants obtained were collected and filtered through a 0.22 μm membrane filter (Anpel) prior to LC-MS/MS analysis.

4.3. UPLC Conditions

The sample extracts underwent analysis utilizing a UPLC-ESI-MS/MS system, comprising the UPLC (ExionLC™ AD, available at https://sciex.com.cn/, accessed on 17 June 2022) and the MS (Applied Biosystems 6500 Triple Quadrupole (Waltham, MA, USA), also accessible at https://sciex.com.cn/, accessed on 17 June 2022). The analytical parameters were configured as follows: UPLC:Column: Waters ACQUITY BEH C18 (1.7 µm, 2.1 mm × 100 mm); Solvent System: Water (0.1% formic acid) and Methanol (0.1% formic acid); Gradient Program: 95:5 v/v at 0 min, 50:50 v/v at 6 min, 5:95 v/v at 12 min (maintained for 2 min), 95:5 v/v at 14 min (maintained for 2 min); Flow Rate: 0.35 mL/min; Temperature: 40 °C; Injection Volume: 2 μL.

4.4. ESI-MS/MS Conditions

Linear ion trap (LIT) and triple quadrupole (QQQ) scans were obtained using a triple quadrupole-linear ion trap mass spectrometer, the AB Scoex Qtrap® 6500+ LC-MS/MS System (Sciex, Framingham, MA, USA), equipped with an ESI Turbo Ion-Spray interface. The instrument operated in positive ion mode and was controlled by Analyst 1.6.3 software (Sciex). The ESI source operated with the following parameters: Ion Source: ESI+, Source Temperature: 550 °C, Ion Spray Voltage (IS): 5500 V, Curtain Gas (CUR): Set at 35 psi. Anthocyanins were subjected to analysis using scheduled multiple reaction monitoring (MRM). Data acquisition was conducted through Analyst 1.6.3 software (Sciex). Quantification of all metabolites was performed using Multiquant 3.0.3 software (Sciex). Further optimization of declustering potentials (DP) and collision energies (CE) for individual MRM transitions was carried out. A specific set of MRM transitions was monitored for each period, corresponding to the elution of metabolites during that timeframe.

4.5. Identification of Differentially Accumulated Metabolites

Significantly regulated metabolites between groups using the identification criterion of the absolute |log2(fold-change)| ≥ 1 and p value < 0.05, based on the Student’s t-test. Identified metabolites using the Kyoto Encyclopedia of Gene and Genomes (KEGG) compound database available at http://www.kegg.jp/kegg/compound/, accessed on 20 June 2022. Next, we mapped the annotated metabolites to KEGG Pathway database found at http://www.kegg.jp/kegg/pathway.html, accessed on 20 June 2022. The pathways that significantly regulated metabolites mapped to were integrated into MSEA (metabolite sets enrichment analysis) and evaluated for significance by checking the hypergeometric test’s p-values.

4.6. RNA Sequencing

Total RNA was extracted from frozen leaves utilizing the RNAprep Pure Plant Kit (Tiangen Biotech, Beijing, China). The Agilent 2100 Bioanalyzer (Agilent Technologies, Santa Clara, CA, USA) was used to evalute the quality of the gathered RNAs by examining their integrity. Subsequently, Poly (A) mRNA was enriched from total RNA using Oligo (dT) magnetic beads. To facilitate sequencing, Poly (A) mRNA was fragmented by an RNA fragmentation kit (Ambion, Austin, TX, USA). First-strand cDNA was produced via transcriptase reaction with random hexamer primers. Next, DNA polymerase I and RNase H enzymes were employed to create the second-strand cDNA (Invitrogen, Carlsbad, CA, USA). Following this, DNA fragments of suitable lengths were obtained, end-repaired, poly(A)-tailed, and connected with sequencing adaptors. Eventually, these fragments underwent Illumina HiSeq™ 2500 platform sequencing.

4.7. Transcript Profiles and Annotation

High-quality reads were obtained by processing the raw reads in fastq format using Perl scripts developed in-house. Clean reads were obtained from the raw data by eliminating adaptor sequences, low-quality reads, and reads containing polyN. All downstream analyses were based on clean, highquality data. Gene function was annotated employing several databases: KEGG pathway database, the NCBI non-redundant (Nr) database, the Swiss-Prot protein database, the euKaryotic Clusters of Orthologous Groups (KOG) database, the Gene Ontology (GO) database, and the Pfam database. We analyzed the differentially expressed genes of both groups by utilizing the DESeq R package (version 1.10.1). The DESeq R package utilizes a statistical model based on the negative binomial distribution to identify differentially expressed genes. We corrected the outcomes of all statistical tests by employing the false discovery rate of Benjamini and Hochberg to account for multiple testing. According to DESeq, genes were considered substantially differentially expressed if their adjusted p-value was less than 0.05. We used the top GO R package v.1, which is based on the Kolmogorov-Smirnov test, to carry out GO enrichment analysis of the differentially expressed genes. We performed pathway analysis utilizing the KEGG database (http://www.genome.jp/kegg/, accessed on 10 June 2022) to investigate relevant pathways of substantially differentially expressed genes [56,57,58].

4.8. Correlation Analysis of Transcriptome and Metabolome

To integrate transcriptome and metabolome datasets, Pearson correlation coefficients were utilized. Gene-metabolite coefficients were obtained by calculating the average expression levels of transcripts and metabolite contents. The fold changes for both transcriptome and metabolome data in each group were also computed. A correlation was considered significant if the Pearson correlation coefficients exceed 0.8 and p-values were less than 0.05 (Table 1). Significant positive correlations between transcription factors (TFs) and anthocyanin derivatives in groups JFC and LFC were detected and visually presented utilizing Cytoscape 3.10.0.

4.9. Verification of RNA-Seq Data by qRT-PCR

Total RNA was extracted from Toona sinesis leaves and reverse-transcribed using the Quantscript Reverse Transcriptase Kit. Each clone had three biological replicates, and each sample had three technical replicates. The obtained cDNA served as a template for determining gene expression levels, employing specific primers for genes linked to anthocyanin biosynthesis as well as ACTIN gene (used as an internal control). The primers used in the qRT-PCR analysis were shown in Table 2. The melt curve of ACTIN in the qPCR products was presented in Supplementary Figure S3. The reaction system contained 5 μL 2 × Q3 SYBR qPCR Master Mix-Universal (TOLOBIO), 1 μL cDNA template, 0.5 μL of each forward and reverse primer, and 3 μL of RNase-free water. qRT-PCR was performed using Applied Biosystems 7500 Fast Real-Time PCR System.

5. Conclusions

In this study, an integrative analysis of the transcriptome and metabolome of five distinct Toona sinensis clones were performed to explore the related genes and metabolites associated with the anthocyanin biosynthesis. Furthermore, our analyses found that the red leaves ‘JFC’ contained the highest content of stable cyanidin, delphinidin, and peonidin, especially Cyanidin-3-O-arabinoside. The integrated analysis also identified the major transcription factor SOC1, CPC, and bHLH162. Moreover, the regulatory network construction of TFs, metabolic, structural genes reveals the underlying mechanisms of the anthocyanin biosynthesis pathway in Toona sinensis. Overall, this study provides a foundation for future research aimed at manipulating anthocyanin biosynthesis to improve plant coloration or to derive human health benefits.

Supplementary Materials

The supporting information can be downloaded at: https://www.mdpi.com/article/10.3390/ijms242015459/s1.

Author Contributions

Conceptualization, J.L.; Data curation, J.X. and Y.F.; Formal analysis, J.X., Y.F., X.H., H.P., J.D., Y.W. and R.Z.; Funding acquisition, J.L.; Investigation, J.X., X.H., H.P., J.D., Y.W. and R.Z.; Methodology, J.X.; Project administration, J.L.; Writing—original draft, J.X.; Writing—review & editing, J.X. All authors have read and agreed to the published version of the manuscript.

Funding

This research was supported by the National Nonprofit Institute Research Grant of Chinese Academy of Forestry (CAFYBB2020SZ004) to J.L. and the Zhejiang Science and Technology Major Program on Agricultural New Variety Breeding” (2021C02070-4) to J.L.

Data Availability Statement

The raw sequence data reported in this paper have been deposited in the Genome Sequence Archive (Genomics, Proteomics & Bioinformatics 2021) in National Genomics Data Center (Nucleic Acids Res 2022), China National Center for Bioinformation/Beijing Institute of Genomics, Chinese Academy of Sciences (GSA: CRA011954) that are publicly accessible at https://ngdc.cncb.ac.cn/gsa, accessed on 26 July 2023.

Conflicts of Interest

The authors declare no conflict of interest.

References

  1. Parada, J.; Aguilera, J.M. Food microstructure affects the bioavailability of several nutrients. J. Food Sci. 2007, 72, R21–R32. [Google Scholar] [CrossRef] [PubMed]
  2. Shen, Y.; Xu, M.; Deng, P.; Gu, Q.; Yin, H.; Xia, G.; Jia, X.; Yang, H.; Tam, J. Establishment of a rapid method to quantify eight flavonol glycosides for quality assessment of red toon using UPLC. Acta Chromatogr. 2018, 30, 31–37. [Google Scholar] [CrossRef]
  3. Sun, X.; Zhang, L.; Cao, Y.; Gu, Q.; Yang, H.; Tam, J.P. Quantitative Analysis and Comparison of Four Major Flavonol Glycosides in the Leaves of Toona sinensis (A. Juss.) Roemer (Chinese Toon) from Various Origins by High-Performance Liquid Chromatography-Diode Array Detector and Hierarchical Clustering Analysis. Pharmacogn. Mag. 2016, 12 (Suppl. S2), S270–S276. [Google Scholar] [PubMed]
  4. Wang, K.J.; Yang, C.R.; Zhang, Y.J. Phenolic antioxidants from Chinese toon (fresh young leaves and shoots of Toona sinensis). Food Chem. 2007, 101, 365–371. [Google Scholar] [CrossRef]
  5. Falcone Ferreyra, M.L.; Rius, S.P.; Casati, P. Flavonoids: Biosynthesis, biological functions, and biotechnological applications. Front. Plant Sci. 2012, 3, 222. [Google Scholar] [CrossRef]
  6. Winkel-Shirley, B. Flavonoid Biosynthesis. A Colorful Model for Genetics, Biochemistry, Cell Biology, and Biotechnology. Plant Physiol. 2001, 126, 485–493. [Google Scholar] [CrossRef]
  7. He, J.; Giusti, M.M. Anthocyanins: Natural colorants with health-promoting properties. Annu. Rev. Food Sci. Technol. 2010, 1, 163–187. [Google Scholar] [CrossRef]
  8. Yousuf, B.; Gul, K.; Wani, A.A.; Singh, P. Health Benefits of Anthocyanins and Their Encapsulation for Potential Use in Food Systems: A Review. Crit. Rev. Food Sci. Nutr. 2016, 56, 2223–2230. [Google Scholar] [CrossRef]
  9. Jaakola, L. New insights into the regulation of anthocyanin biosynthesis in fruits. Trends Plant Sci. 2013, 18, 477–483. [Google Scholar] [CrossRef]
  10. Grotewold, E. The genetics and biochemistry of floral pigments. Annu. Rev. Plant Biol. 2006, 57, 761–780. [Google Scholar] [CrossRef]
  11. Jaakola, L.; Hohtola, A. Effect of latitude on flavonoid biosynthesis in plants. Plant Cell Environ. 2010, 33, 1239–1247. [Google Scholar] [CrossRef] [PubMed]
  12. Feng, F.; Li, M.; Ma, F.; Cheng, L. Phenylpropanoid metabolites and expression of key genes involved in anthocyanin biosynthesis in the shaded peel of apple fruit in response to sun exposure. Plant Physiol. Bioch. 2013, 69, 54–61. [Google Scholar] [CrossRef] [PubMed]
  13. Gonzalez, A.; Zhao, M.; Leavitt, J.M.; Lloyd, A.M. Regulation of the anthocyanin biosynthetic pathway by the TTG1/bHLH/Myb transcriptional complex in Arabidopsis seedlings. Plant J. 2008, 53, 814–827. [Google Scholar] [CrossRef] [PubMed]
  14. Liu, H.; Liu, Z.; Wu, Y.; Zheng, L.; Zhang, G. Regulatory Mechanisms of Anthocyanin Biosynthesis in Apple and Pear. Int. J. Mol. Sci. 2021, 22, 8441. [Google Scholar] [CrossRef]
  15. Mattoo, A.K.; Dwivedi, S.L.; Dutt, S.; Singh, B.; Garg, M.; Ortiz, R. Anthocyanin-Rich Vegetables for Human Consumption-Focus on Potato, Sweetpotato and Tomato. Int. J. Mol. Sci. 2022, 23, 2634. [Google Scholar] [CrossRef]
  16. Sun, C.; Deng, L.; Du, M.; Zhao, J.; Chen, Q.; Huang, T.; Jiang, H.; Li, C.B.; Li, C. A Transcriptional Network Promotes Anthocyanin Biosynthesis in Tomato Flesh. Mol. Plant. 2020, 13, 42–58. [Google Scholar] [CrossRef]
  17. Wang, Y.; Wang, Y.; Song, Z.; Zhang, H. Repression of MYBL2 by Both microRNA858a and HY5 Leads to the Activation of Anthocyanin Biosynthetic Pathway in Arabidopsis. Mol. Plant. 2016, 9, 1395–1405. [Google Scholar] [CrossRef]
  18. Xu, W.; Grain, D.; Bobet, S.; Le Gourrierec, J.; Thévenin, J.; Kelemen, Z.; Lepiniec, L.; Dubos, C. Complexity and robustness of the flavonoid transcriptional regulatory network revealed by comprehensive analyses of MYB-bHLH-WDR complexes and their targets in Arabidopsis seed. New Phytol. 2014, 202, 132–144. [Google Scholar] [CrossRef]
  19. Li, L.; Ban, Z.J.; Li, X.H.; Wu, M.Y.; Wang, A.L.; Jiang, Y.Q.; Jiang, Y.H. Differential Expression of Anthocyanin Biosynthetic Genes and Transcription Factor PcMYB10 in Pears (Pyrus communis L.). PLoS ONE 2012, 7, e46070. [Google Scholar] [CrossRef]
  20. An, X.H.; Tian, Y.; Chen, K.Q.; Wang, X.F.; Hao, Y.J. The apple WD40 protein MdTTG1 interacts with bHLH but not MYB proteins to regulate anthocyanin accumulation. J. Plant Physiol. 2012, 169, 710–717. [Google Scholar] [CrossRef]
  21. Chen, L.; Hu, B.; Qin, Y.; Hu, G.; Zhao, J. Advance of the negative regulation of anthocyanin biosynthesis by MYB transcription factors. Plant Physiol. Bioch. 2019, 136, 178–187. [Google Scholar] [CrossRef] [PubMed]
  22. Das, P.K.; Shin, D.H.; Choi, S.-B.; Park, Y.-I. Sugar-hormone cross-talk in anthocyanin biosynthesis. Mol. Cells 2012, 34, 501–507. [Google Scholar] [CrossRef] [PubMed]
  23. Dubos, C.; Stracke, R.; Grotewold, E.; Weisshaar, B.; Martin, C.; Lepiniec, L. MYB transcription factors in Arabidopsis. Trends Plant Sci. 2010, 15, 573–581. [Google Scholar] [CrossRef]
  24. Lei, Z.; Zhou, C.; Ji, X.; Wei, G.; Huang, Y.; Yu, W.; Luo, Y.; Qiu, Y. Transcriptome Analysis Reveals genes involved in flavonoid biosynthesis and accumulation in Dendrobium catenatum from different locations. Sci. Rep. 2018, 8, 6373. [Google Scholar] [CrossRef]
  25. Li, H.; Yang, Z.; Zeng, Q.; Wang, S.; Luo, Y.; Huang, Y.; Xin, Y.; He, N. Abnormal expression of bHLH3 disrupts a flavonoid homeostasis network, causing differences in pigment composition among mulberry fruits. Hortic. Res. 2020, 7, 83. [Google Scholar] [CrossRef] [PubMed]
  26. Baudry, A.; Heim, M.A.; Dubreucq, B.; Caboche, M.; Weisshaar, B.; Lepiniec, L. TT2, TT8, and TTG1 synergistically specify the expression of BANYULS and proanthocyanidin biosynthesis in Arabidopsis thaliana. Plant J. 2004, 39, 366–380. [Google Scholar] [CrossRef]
  27. Lau, O.S.; Deng, X.W. The photomorphogenic repressors COP1 and DET1: 20 years later. Trends Plant Sci. 2012, 17, 584–593. [Google Scholar] [CrossRef]
  28. Stracke, R.; Favory, J.J.; Gruber, H.; Bartelniewoehner, L.; Bartels, S.; Binkert, M.; Funk, M.; Weisshaar, B.; Ulm, R. The Arabidopsis bZIP transcription factor HY5 regulates expression of the PFG1/MYB12 gene in response to light and ultraviolet-B radiation. Plant Cell Environ. 2010, 33, 88–103. [Google Scholar]
  29. Lee, J.; He, K.; Stolc, V.; Lee, H.; Figueroa, P.; Gao, Y.; Tongprasit, W.; Zhao, H.; Lee, I.; Deng, X.W. Analysis of transcription factor HY5 genomic binding sites revealed its hierarchical role in light regulation of development. Plant Cell 2007, 19, 731–749. [Google Scholar] [CrossRef]
  30. Zhao, Y.; Min, T.; Chen, M.; Wang, H.; Zhu, C.; Jin, R.; Allan, A.C.; Lin-Wang, K.; Xu, C. The Photomorphogenic Transcription Factor PpHY5 Regulates Anthocyanin Accumulation in Response to UVA and UVB Irradiation. Front. Plant Sci. 2020, 11, 603178. [Google Scholar] [CrossRef]
  31. Gao, H.-N.; Jiang, H.; Cui, J.-Y.; You, C.-X.; Li, Y.-Y. Review: The effects of hormones and environmental factors on anthocyanin biosynthesis in apple. Plant Sci. 2021, 312, 111024. [Google Scholar] [CrossRef] [PubMed]
  32. An, J.-P.; Yao, J.-F.; Xu, R.-R.; You, C.-X.; Wang, X.-F.; Hao, Y.-J. Apple bZIP transcription factor MdbZIP44 regulates abscisic acid-promoted anthocyanin accumulation. Plant Cell Environ. 2018, 41, 2678–2692. [Google Scholar] [CrossRef] [PubMed]
  33. Qi, T.; Song, S.; Ren, Q.; Wu, D.; Huang, H.; Chen, Y.; Fan, M.; Peng, W.; Ren, C.; Xie, D. The Jasmonate-ZIM-domain proteins interact with the WD-Repeat/bHLH/MYB complexes to regulate Jasmonate-mediated anthocyanin accumulation and trichome initiation in Arabidopsis thaliana. Plant Cell 2011, 23, 1795–1814. [Google Scholar] [CrossRef] [PubMed]
  34. Jiang, T.; Zhang, M.; Wen, C.; Xie, X.; Tian, W.; Wen, S.; Lu, R.; Liu, L. Integrated metabolomic and transcriptomic analysis of the anthocyanin regulatory networks in Salvia miltiorrhiza Bge. flowers. BMC Plant Biol. 2020, 20, 349. [Google Scholar] [CrossRef]
  35. Xie, Z.; Wang, J.; Wang, W.; Wang, Y.; Xu, J.; Li, Z.; Zhao, X.; Fu, B. Integrated Analysis of the Transcriptome and Metabolome Revealed the Molecular Mechanisms Underlying the Enhanced Salt Tolerance of Rice Due to the Application of Exogenous Melatonin. Front. Plant Sci. 2020, 11, 618680. [Google Scholar] [CrossRef] [PubMed]
  36. Ji, Y.T.; Xiu, Z.; Chen, C.H.; Wang, Y.; Yang, J.X.; Sui, J.J.; Jiang, S.J.; Wang, P.; Yue, S.Y.; Zhang, Q.Q.; et al. Long read sequencing of Toona sinensis (A. Juss) Roem: A chromosome-level reference genome for the family Meliaceae. Mol. Ecol. Resour. 2021, 21, 1243–1255. [Google Scholar] [CrossRef]
  37. Xue, L.; Wang, J.; Zhao, J.; Zheng, Y.; Wang, H.F.; Wu, X.; Xian, C.; Lei, J.J.; Zhong, C.F.; Zhang, Y.T. Study on cyanidin metabolism in petals of pink-flowered strawberry based on transcriptome sequencing and metabolite analysis. BMC Plant Biol. 2019, 19, 423. [Google Scholar] [CrossRef]
  38. Bogs, J.; Jaffé, F.W.; Takos, A.M.; Walker, A.R.; Robinson, S.P. The grapevine transcription factor VvMYBPA1 regulates proanthocyanidin synthesis during fruit development. Plant Physiol. 2007, 143, 1347–1361. [Google Scholar] [CrossRef]
  39. Clark, S.T.; Verwoerd, W.S. A systems approach to identifying correlated gene targets for the loss of colour pigmentation in plants. BMC Bioinform. 2011, 12, 343. [Google Scholar] [CrossRef]
  40. Terrier, N.; Torregrosa, L.; Ageorges, A.; Vialet, S.; Verries, C.; Cheynier, V.; Romieu, C. Ectopic expression of VvMybPA2 promotes proanthocyanidin biosynthesis in grapevine and suggests additional targets in the pathway. Plant Physiol. 2009, 149, 1028–1041. [Google Scholar] [CrossRef]
  41. Debes, M.A.; Arias, M.E.; Grellet-Bournonville, C.F.; Wulff, A.F.; Martínez-Zamora, M.G.; Castagnaro, A.P.; Díaz-Ricci, J.C. White-fruited Duchesnea indica (Rosaceae) is impaired in ANS gene expression. Am. J. Bot. 2011, 98, 2077–2083. [Google Scholar] [CrossRef] [PubMed]
  42. Li, H.; Liu, J.; Pei, T.; Bai, Z.; Han, R.; Liang, Z. Overexpression of SmANS Enhances Anthocyanin Accumulation and Alters Phenolic Acids Content in Salvia miltiorrhiza and Salvia miltiorrhiza Bge f. alba Plantlets. Int. J. Mol. Sci. 2019, 20, 2225. [Google Scholar] [CrossRef]
  43. Liu, H.; Su, J.; Zhu, Y.; Yao, G.; Allan, A.C.; Ampomah-Dwamena, C.; Shu, Q.; Lin-Wang, K.; Zhang, S.; Wu, J. The involvement of PybZIPa in light-induced anthocyanin accumulation via the activation of PyUFGT through binding to tandem G-boxes in its promoter. Hortic. Res. 2019, 6, 134. [Google Scholar] [CrossRef] [PubMed]
  44. Sun, Q.; Jiang, S.; Zhang, T.; Xu, H.; Fang, H.; Zhang, J.; Su, M.; Wang, Y.; Zhang, Z.; Wang, N.; et al. Apple NAC transcription factor MdNAC52 regulates biosynthesis of anthocyanin and proanthocyanidin through MdMYB9 and MdMYB11. Plant Sci. 2019, 289, 110286. [Google Scholar] [CrossRef] [PubMed]
  45. Alabd, A.; Ahmad, M.; Zhang, X.; Gao, Y.; Peng, L.; Zhang, L.; Ni, J.; Bai, S.; Teng, Y. Light-responsive transcription factor PpWRKY44 induces anthocyanin accumulation by regulating PpMYB10 expression in pear. Hortic. Res. 2022, 9, uhac199. [Google Scholar] [CrossRef] [PubMed]
  46. Zhang, H.; Zhang, Z.; Zhao, Y.; Guo, D.; Zhao, X.; Gao, W.; Zhang, J.; Song, B.; Cahill, D. StWRKY13 promotes anthocyanin biosynthesis in potato (Solanum tuberosum) tubers. Funct. Plant Biol. 2021, 49, 102–114. [Google Scholar] [CrossRef]
  47. Qi, F.; Liu, Y.; Luo, Y.; Cui, Y.; Lu, C.; Li, H.; Huang, H.; Dai, S. Functional analysis of the ScAG and ScAGL11 MADS-box transcription factors for anthocyanin biosynthesis and bicolour pattern formation in Senecio cruentus ray florets. Hortic. Res. 2022, 9, uhac071. [Google Scholar] [CrossRef]
  48. Qi, X.; Liu, C.; Song, L.; Li, M. PaMADS7, a MADS-box transcription factor, regulates sweet cherry fruit ripening and softening. Plant Sci. 2020, 301, 110634. [Google Scholar] [CrossRef]
  49. Shi, H.; Liu, G.; Wei, Y.; Chan, Z. The zinc-finger transcription factor ZAT6 is essential for hydrogen peroxide induction of anthocyanin synthesis in Arabidopsis. Plant Mol. Biol. 2018, 97, 165–176. [Google Scholar] [CrossRef]
  50. Wang, D.R.; Yang, K.; Wang, X.; Lin, X.L.; Rui, L.; Liu, H.F.; Liu, D.D.; You, C.X. Overexpression of MdZAT5, an C2H2-Type Zinc Finger Protein, Regulates Anthocyanin Accumulation and Salt Stress Response in Apple Calli and Arabidopsis. Int. J. Mol. Sci. 2022, 23, 1897. [Google Scholar] [CrossRef]
  51. Kimura, Y.; Aoki, S.; Ando, E.; Kitatsuji, A.; Watanabe, A.; Ohnishi, M.; Takahashi, K.; Inoue, S.I.; Nakamichi, N.; Tamada, Y.; et al. A flowering integrator, SOC1, affects stomatal opening in Arabidopsis thaliana. Plant Cell Physiol. 2015, 56, 640–649. [Google Scholar] [CrossRef] [PubMed]
  52. Ryu, C.H.; Lee, S.; Cho, L.H.; Kim, S.L.; Lee, Y.S.; Choi, S.C.; Jeong, H.J.; Yi, J.; Park, S.J.; Han, C.D.; et al. OsMADS50 and OsMADS56 function antagonistically in regulating long day (LD)-dependent flowering in rice. Plant Cell Environ. 2009, 32, 1412–1427. [Google Scholar] [CrossRef]
  53. Ma, L.; Yan, Y. GhSOC1s Evolve to Respond Differently to the Environmental Cues and Promote Flowering in Partially Independent Ways. Front. Plant Sci. 2022, 13, 882946. [Google Scholar] [CrossRef]
  54. Wang, C.K.; Han, P.L.; Zhao, Y.W.; Ji, X.L.; Yu, J.Q.; You, C.X.; Hu, D.G.; Hao, Y.J. Auxin regulates anthocyanin biosynthesis through the auxin repressor protein MdIAA26. Biochem. Biophys. Res. Commun. 2020, 533, 717–722. [Google Scholar] [CrossRef]
  55. Wang, P.; Ge, M.; Yu, A.; Song, W.; Fang, J.; Leng, X. Effects of ethylene on berry ripening and anthocyanin accumulation of “Fujiminori” grape in protected cultivation. J. Sci. Food Agric. 2022, 102, 1124–1136. [Google Scholar] [CrossRef]
  56. Kanehisa, M. Toward understanding the origin and evolution of cellular organisms. Protein Sci. 2019, 28, 1947–1951. [Google Scholar] [CrossRef]
  57. Kanehisa, M.; Goto, S. KEGG: Kyoto encyclopedia of genes and genomes. Nucleic Acids Res. 2000, 28, 27–30. [Google Scholar] [CrossRef] [PubMed]
  58. Kanehisa, M.; Furumichi, M.; Sato, Y.; Kawashima, M.; Ishiguro-Watanabe, M. KEGG for taxonomy-based analysis of pathways and genomes. Nucleic Acids Res. 2023, 51, D587–D592. [Google Scholar] [CrossRef] [PubMed]
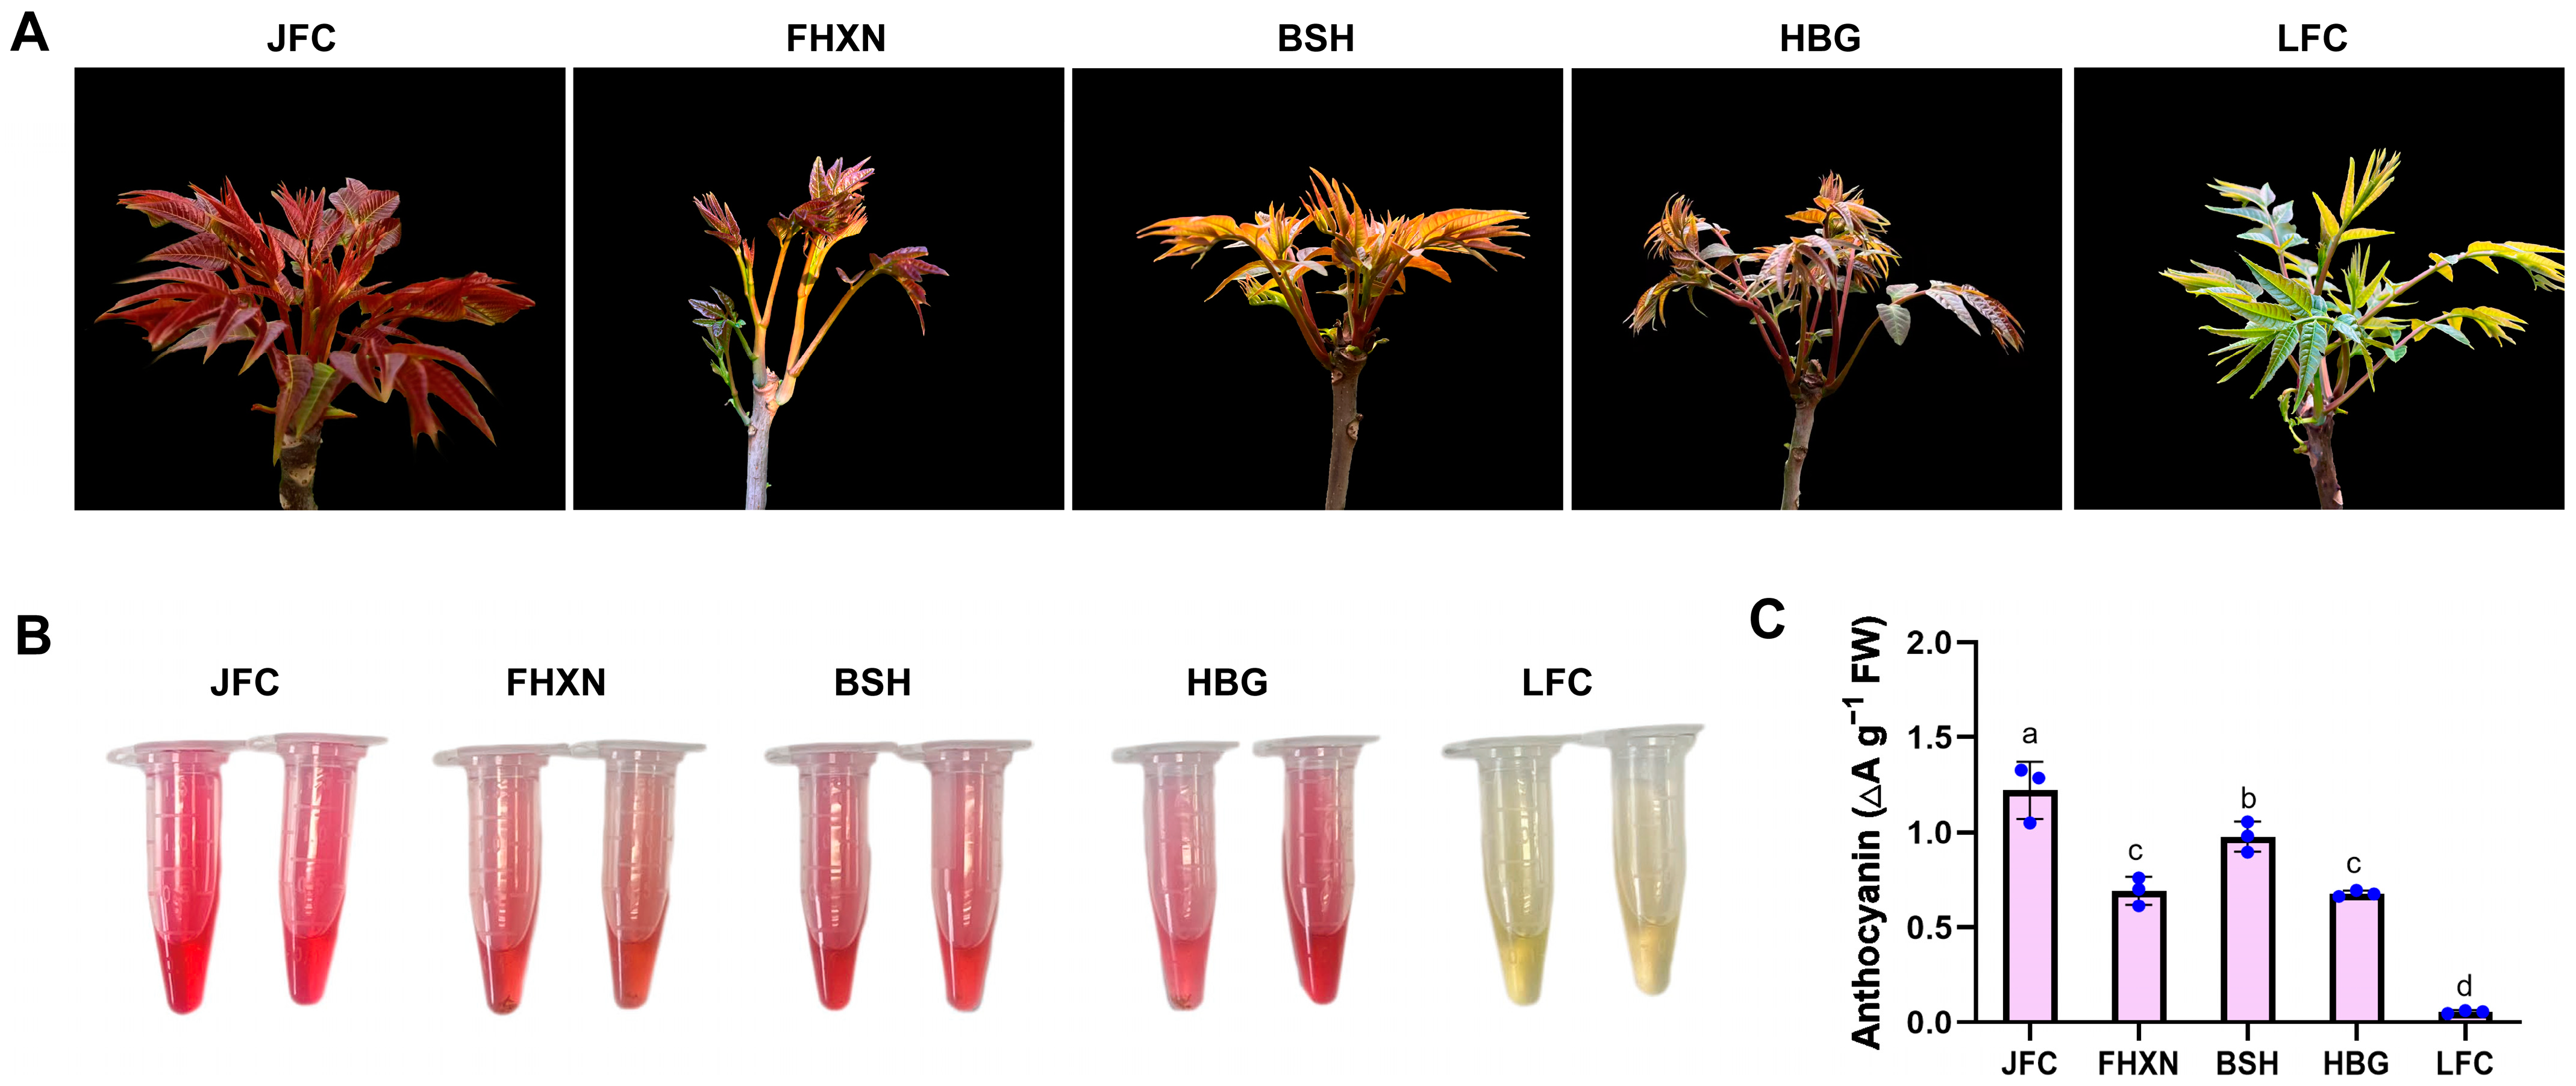
Figure 1. Morphological observation and anthocyanin content of leaves from different Toona clones (JFC, FHXN, BSH, HBG, and LYC). (A) The morphological characteristics of leaves from the five Toona clones. (B) The color of anthocyanin present in the leaves of these clones. (C) The quantification of anthocyanin content in each of the Toona clones. Data are shown as mean ± standard deviation, n = 3. Bars with different letters are significantly different at p  <  0.05.
Ijms 24 15459 g001
Figure 2. Targeted metabolome profiles of the anthocyanin biosynthesis pathway. (A) A PCA score plot demonstrates variations among different colored Toona clones. (B) The number of up- and down-regulated metabolites varies across different comparison groups. (C,D) Venn diagram illustrate the number of differential metabolites when compared with JFC and LFC. (E) Heatmaps reveals the differential metabolites present in diverse Toona clones. Three independent replicates of each clone are displayed in the heatmap.
Ijms 24 15459 g002
Figure 3. Transcriptome analysis of leaves among Toona clones. (A) A PCA score plot of the RNA-seq results of various colored Toona. (B) The number of up- and down-regulated genes differs across different comparison groups. (C) A shared number of DEGs across varying comparison groups. (D) A KEGG pathway enrichment bubble plot for DEGs between different comparison groups.
Ijms 24 15459 g003
Figure 4. Biosynthetic pathway of anthocyanins. The construction of this pathway is based on the KEGG pathway and pertinent literature references. The red box indicated the expression of genes, and the blue box indicated the content of compounds in this pathway.
Ijms 24 15459 g004
Figure 5. Regulatory network related to the anthocyanin biosynthesis pathway. (A) Connection network between regulatory genes and metabolites involved in anthocyanin biosynthesis. Purple circles represent transcription factors, light-purple triangle represent plant hormones related genes, green round rectangle represent the metabolites. The size of the cells represented the log2FC (gene or compounds). (B) Regulatory network between transcription factors and structural genes responsible for anthocyanin biosynthesis. Purple circles represent transcription factors, light-purple circles represent structural genes involved in the biosynthesis of anthocyanin pathway.
Ijms 24 15459 g005
Figure 6. Analysis of potential transcriptional regulators linked to anthocyanins in JFC, BSH, and LFC. (A) The heatmap representation of RNA expression levels for various transcription factors that participated in anthocyanins production. These TFs included MYB, bHLH, bZIP, MADS-box, and WD-40 repeats. (B) The RNA expression level of genes responsible for plant hormones involved in anthocyanins accumulation. These genes comprise auxin, cytokinin (CTK), gibberellin (GA), brassinolide (BR), ethylene (ET), abscisic acid (ABA), jasmonic acid (JA), and salicylic acid (SA).
Ijms 24 15459 g006
Figure 7. Quantitative real-time RT-PCR (qRT-PCR) and RNA-seq analysis of genes involved in anthocyanin biosynthesis pathway and putative transcription regulators. (A) Relative expression level of transcription factors. (B) Relative expression level of structural genes. Data are shown as mean ± standard deviation of three biological replicates.
Ijms 24 15459 g007
Table 1. Correlation analysis of transcription factors and plant hormone-related genes with anthocyanin-related metabolites.
Gene IDLog2FC_gene
(JFC: LFC)
Gene NameAGIGene AnnotationCompoundsLog2FC_meta
(JFC: LFC)
Coefficientp Value
Maker000128861.5011ERF4At5g44210AP2 domainCyanidin-3-O-galactoside7.95680.84796.52 × 10−5
Cyanidin-3-O-sambubioside5.42170.80490.0002953
Cyanidin-3-O-arabinoside9.0250.80340.000309044
Cyanidin-3-O-xyloside5.26480.83270.000116859
Delphinidin-3-O-glucoside9.0250.81970.00018361
Maker000096872.2469CLE1At2g22850bZIP transcription factorCyanidin-3-O-rutinoside-5-O-glucoside9.0250.80660.000279669
Cyanidin-3-O-galactoside7.95680.88191.37 × 10−5
Cyanidin-3-O-arabinoside9.0250.86962.54 × 10−5
Maker000201042.8632bZIP46_1At1g68640bZIP transcription factorCyanidin-3-O-rutinoside-5-O-glucoside9.0250.80420.000301857
Cyanidin-3-O-rutinoside7.27740.84188.30 × 10−5
Cyanidin-3-O-galactoside7.95680.86922.59 × 10−5
Cyanidin-3-O-sambubioside5.42170.81690.000201339
Cyanidin-3-O-glucoside5.79510.80470.000296932
Cyanidin-3-O-arabinoside9.0250.82560.000149917
Cyanidin-3,5-O-diglucoside2.67360.84626.98 × 10−5
Cyanidin-3-O-xyloside5.26480.85484.91 × 10−5
Maker000268244.2921bZIP43At2g22850bZIP transcription factorCyanidin-3-O-rutinoside-5-O-glucoside9.0250.8447.62 × 10−5
Cyanidin-3-O-rutinoside7.27740.82010.00018127
Cyanidin-3-O-galactoside7.95680.85754.39 × 10−5
Cyanidin-3-O-sambubioside5.42170.82210.000169159
Cyanidin-3,5-O-diglucoside2.67360.83550.000105219
Cyanidin-3-O-xyloside5.26480.86073.81 × 10−5
Maker000328381.3156bZIP46_2At1g68640bZIP transcription factorCyanidin-3-O-galactoside7.95680.83680.00010049
Cyanidin-3-O-arabinoside9.0250.82840.000136002
novel.86842.8522POLXAt3g45520bZIP transcription factorPelargonidin-3-O-(6-O-p-coumaroyl)-glucoside4.13360.81590.000208096
Maker000147462.4849CPCAt2g46410Myb-like DNA-binding domainCyanidin-3-O-(6-O-malonyl-beta-D-glucoside)9.0250.8010.000332643
Cyanidin-3-O-rutinoside7.27740.81510.000213466
Cyanidin-3-O-galactoside7.95680.89158.09 × 10−6
Cyanidin-3-O-sambubioside5.42170.8110.000243476
Cyanidin-3-O-arabinoside9.0250.91491.78 × 10−6
Cyanidin-3,5-O-diglucoside2.67360.83580.000104028
Cyanidin-3-O-xyloside5.26480.87781.69 × 10−5
Delphinidin-3-O-glucoside9.0250.81140.000240963
Delphinidin-3-O-5-O-(6-O-coumaroyl)-diglucoside1.08380.82490.000153878
Maker000169691.3602MYB30At4g09460Myb-like DNA-binding domainCyanidin-3-O-galactoside7.95680.81890.000188654
Maker000238671.6363MYB17At3g61250Myb-like DNA-binding domainCyanidin-3-O-galactoside7.95680.84936.17 × 10−5
Cyanidin-3-O-arabinoside9.0250.81590.000207999
Maker000296324.4878SOC1At2g45660MADS-box transcription factorCyanidin-3-O-galactoside7.95680.90124.53 × 10−6
Cyanidin-3-O-arabinoside9.0250.95254.40 × 10−8
Cyanidin-3-O-xyloside5.26480.80640.000281454
Delphinidin-3-O-5-O-(6-O-coumaroyl)-diglucoside1.08380.81660.000203571
novel.37274.9012AGL9At1g24260MADS-box transcription factorCyanidin-3-O-rutinoside-5-O-glucoside9.0250.87122.35 × 10−5
Cyanidin-3-O-(6-O-malonyl-beta-D-glucoside)9.0250.80.000341781
Cyanidin-3-O-rutinoside7.27740.81650.000204
Cyanidin-3-O-galactoside7.95680.96525.96 × 10−9
Cyanidin-3-O-sambubioside5.42170.80780.000269708
Cyanidin-3-O-arabinoside9.0250.97341.07 × 10−9
Cyanidin-3,5-O-diglucoside2.67360.84168.35 × 10−5
Cyanidin-3-O-xyloside5.26480.89685.93 × 10−6
Delphinidin-3-O-glucoside9.0250.85524.83 × 10−5
Delphinidin-3-O-5-O-(6-O-coumaroyl)-diglucoside1.08380.87352.10 × 10−5
Petunidin-3-O-rutinoside9.0250.80180.000324031
Maker000065361.8404WRKY48At5g49520WRKY DNA-binding protein 48Cyanidin-3-O-rutinoside-5-O-glucoside9.0250.8320.000119819
Cyanidin-3-O-galactoside7.95680.86443.22 × 10−5
Cyanidin-3-O-arabinoside9.0250.84357.77 × 10−5
Cyanidin-3-O-xyloside5.26480.80930.000257445
novel.61833.5074MIK2At4g08850Leucine-rich repeat receptor-like protein kinaseCyanidin-3-O-rutinoside-5-O-glucoside9.0250.83040.000126884
Cyanidin-3-O-galactoside7.95680.91361.95 × 10−6
Cyanidin-3-O-arabinoside9.0250.92191.03 × 10−6
Delphinidin-3-O-5-O-(6-O-coumaroyl)-diglucoside1.08380.83380.000112199
Maker000217981.1527bHLH162At4g20970Helix-loop-helix DNA-binding domainCyanidin-3-O-galactoside7.95680.86842.68 × 10−5
Cyanidin-3-O-arabinoside9.0250.87821.66 × 10−5
Maker000032422.1058JAGAt1g13400C2H2 and C2HC zinc fingers superfamily proteinCyanidin-3-O-galactoside7.95680.86682.90 × 10−5
Cyanidin-3-O-arabinoside9.0250.86573.04 × 10−5
Maker000117931.1426GRAS20At3g54220GRAS domain familyCyanidin-3-O-(6-O-malonyl-beta-D-glucoside)9.0250.83270.000116807
Cyanidin-3,5-O-diglucoside2.67360.80720.000275174
novel.41881.6057HSP72At1g56410heat shock protein 70 family proteinCyanidin-3-O-(6-O-malonyl-beta-D-glucoside)9.0250.83020.000127565
Cyanidin-3-O-galactoside7.95680.91671.55 × 10−6
Cyanidin-3-O-arabinoside9.0250.91441.84 × 10−6
Cyanidin-3-O-xyloside5.26480.8070.00027619
Delphinidin-3-O-glucoside9.0250.81470.000216435
novel.42204.8378LBD21At3g11090Lateral organ boundaries domainCyanidin-3-O-rutinoside-5-O-glucoside9.0250.89098.38 × 10−6
Cyanidin-3-O-rutinoside7.27740.87342.11 × 10−5
Cyanidin-3-O-galactoside7.95680.85844.21 × 10−5
Cyanidin-3-O-sambubioside5.42170.83070.00012547
Cyanidin-3-O-arabinoside9.0250.88849.68 × 10−6
Cyanidin-3,5-O-diglucoside2.67360.87971.54 × 10−5
Cyanidin-3-O-xyloside5.26480.89994.89 × 10−6
Delphinidin-3-O-5-O-(6-O-coumaroyl)-diglucoside1.08380.91092.36 × 10−6
Petunidin-3-O-rutinoside9.0250.89118.31 × 10−6
Maker000332331.0573STY46At4g35780Protein tyrosine kinaseCyanidin-3-O-(6-O-malonyl-beta-D-glucoside)9.0250.82350.000161377
Cyanidin-3-O-galactoside7.95680.80260.00031603
Cyanidin-3,5-O-diglucoside2.67360.80170.000324943
Maker000003501.9217ARR9At3g57040Response regulator receiver domainCyanidin-3-O-rutinoside-5-O-glucoside9.0250.89526.53 × 10−6
Cyanidin-3-O-rutinoside7.27740.80320.000310451
Cyanidin-3-O-galactoside7.95680.8428.23 × 10−5
Cyanidin-3-O-arabinoside9.0250.86632.95 × 10−5
Cyanidin-3,5-O-diglucoside2.67360.8330.000115529
Maker000267911.2059SPL1At3g57920SBP domainCyanidin-3-O-arabinoside9.0250.82220.000168825
Maker000085031.3275IAA27At4g29080AUX/IAA familyCyanidin-3-O-glucoside5.79510.83370.000112681
Maker000222561.0026ARG7At1g75590Auxin responsive proteinCyanidin-3-O-arabinoside9.0250.83889.31 × 10−5
Table 2. The primer sequences used in this study.
Primer NamePrimer Sequence F (5′-3′)Primer Sequence R (5′-3′)
RT-bHLH162 (Maker00021798)CAGGTTAATGGGAATCGAAAAGCCAACCCAGTTACCAAAACAAT
RT-CPC (Maker00014746)AAACTCGTTGGAGACAGGTGGCAAACCCTTCTCCATGTTT
RT-bZIP43 (Maker00026824)TCGGAGACTATGATCGGAAATCACTTGAAACGACAGGTTTTGGT
RT-SOC1 (Maker00029632)CAATTGAAGCACGAAATAGCAATGTACCGTTTAGAGGGAAGGAA
RT-4CL-1 (Maker00007314)AGGTTTGAGGCTTCGCAGTAGTCCCCAGTGACAACAATCC
RT-CHS-1 (Maker00012884)TGCAATTCTTGACCAAGTCGGATGAACAAAACGCATGCAC
RT-CHS-2 (Maker00020412)TGGTGCAATTGATGGACACTTGCTTCGACCAAGCTTTTCT
RT-CHI-2 (Maker00012191)GGGTGTTGGAAGAAAATCCAGGTCGACTCCATCACCCTTA
RT-DFR (Maker00011618)CCATTCCTGGCTTCAAGTGTAAGCAATTGACCCCATTCTG
RT-ANS (Maker00000819)GCTTTCAGGCAACTGGTCATTGCTCGGGAATATTTCTGCT
RT-UFGT-1 (Maker00029333)GTGGTCGAGACTGGGAGAAGAGGACCTGCAGTCCAAAGTG
RT-UFGT-2 (novel.8170)GTGACAAAACCCTGGAAGGACAATTTTGGGAAAGCTGCAT
RT-ActinTGATTGGGATGGAAGCAGCAGAACATGGTTGAACCGCCAC
Disclaimer/Publisher’s Note: The statements, opinions and data contained in all publications are solely those of the individual author(s) and contributor(s) and not of MDPI and/or the editor(s). MDPI and/or the editor(s) disclaim responsibility for any injury to people or property resulting from any ideas, methods, instructions or products referred to in the content.