Article

Histone Methyltransferases G9a/Ehmt2 and GLP/Ehmt1 Are Associated with Cell Viability and Poorer Prognosis in Neuroblastoma and Ewing Sarcoma

by
Barbara Kunzler Souza
1,2,3,*,
Natalia Hogetop Freire
1,2,4,
Thiago Santos Monteiro
3,
Alice Laschuk Herlinger
1,2,
Mariane Jaeger
1,2,4,
Matheus G. S. Dalmolin
2,4,
Caroline Brunetto de Farias
1,2,4,
Lauro Gregianin
1,2,4,5,6,
André T. Brunetto
1,2,4,
Algemir L. Brunetto
1,2,4,
Carol J. Thiele
7 and
Rafael Roesler
1,2,8,*
1
Cancer and Neurobiology Laboratory, Experimental Research Center, Clinical Hospital (CPE-HCPA), Federal University of Rio Grande do Sul, Porto Alegre 90035-003, Brazil
2
National Science and Technology Institute for Children’s Cancer Biology and Pediatric Oncology—INCT BioOncoPed, Porto Alegre 90035-003, Brazil
3
Epigenica Biosciences, Canoas 92035-000, Brazil
4
Children’s Cancer Institute, Porto Alegre 90620-110, Brazil
5
Department of Pediatrics, School of Medicine, Federal University of Rio Grande do Sul, Porto Alegre 90035-003, Brazil
6
Pediatric Oncology Service, Clinical Hospital, Federal University of Rio Grande do Sul, Porto Alegre 90035-003, Brazil
7
Pediatric Oncology Branch, Center for Cancer Research, National Cancer Institute, National Institutes of Health, Bethesda, MD 20892, USA
8
Department of Pharmacology, Institute for Basic Health Sciences, Federal University of Rio Grande do Sul, Porto Alegre 90035-003, Brazil
*
Authors to whom correspondence should be addressed.
Int. J. Mol. Sci. 2023, 24(20), 15242; https://doi.org/10.3390/ijms242015242
Submission received: 1 September 2023 / Revised: 7 October 2023 / Accepted: 10 October 2023 / Published: 17 October 2023
(This article belongs to the Special Issue Targeting Epigenetic Network in Cancer)

Abstract

:
Changes in epigenetic programming have been proposed as being key events in the initiation and progression of childhood cancers. HMT euchromatic histone lysine methyltransferase 2 (G9a, EHMT2), which is encoded by the G9a (Ehmt2) gene, as well as its related protein GLP, which is encoded by the GLP/Ehmt1 gene, participate in epigenetic regulation by contributing to a transcriptionally repressed chromatin state. G9a/GLP activation has been reported in several cancer types. Herein, we evaluated the role of G9a in two solid pediatric tumors: neuroblastoma (NB) and Ewing sarcoma (ES). Our results show that G9a/Ehmt2 and GLP/Ehmt1 expression is higher in tumors with poorer prognosis, including St4 International Neuroblastoma Staging System (INSS) stage, MYCN amplified NB, and metastatic ES. Importantly, higher G9a and GLP levels were associated with shorter patient overall survival (OS) in both NB and ES. Moreover, pharmacological inhibition of G9a/GLP reduced cell viability in NB and ES cells. These findings suggest that G9a and GLP are associated with more aggressive NB and ES tumors and should be further investigated as being epigenetic targets in pediatric solid cancers.

1. Introduction

Histone methylation is a mechanism for generating epigenetic marks that either activate or repress transcription depending on the target gene. Histone methyltransferases (HMTs) mediate the addition of up to three methyl groups to a histone lysine residue and up to two groups to a histone arginine residue [1,2]. The HMT euchromatic histone lysine methyltransferase 2 (G9a, EHMT2), which is encoded by the G9a (Ehmt2) gene, and its related protein (GLP, EHMT1), which is encoded by the GLP (Ehmt1) gene, mediate mono- and dimethylation (H3K9me1 and H3K9me2) of H3 lysine 9 (H3K9), resulting in a condensed and transcriptionally repressed chromatin structure [3,4,5,6,7]. The abnormal activation of this process, in conjunction with G9a overexpression, has been observed in several adult solid cancer types [8,9,10]. G9a forms homomeric and heteromeric complexes with the G9a-related methyltransferase, G9a-like protein (EHMT1 or GLP), which is encoded by the Ehmt1 gene, to catalyze both H3K9me1 and H3K9me2 [11,12,13].
Neuroblastoma (NB), which likely arises from developing neural crest cells, is the most common extra-cranial pediatric solid tumor in children. High-risk disease with poor prognosis is associated with MYCN amplification or unbalanced 11q. Currently, only about half of high-risk patients achieve long-term remission with multimodal therapy [14,15]. Ewing sarcoma (ES) is an aggressive pediatric tumor that occurs either in the bone or soft tissues. Moreover, ES likely originates from neural crest or mesenchymal stem cells and is the prototypical cancer type defined by a single specific genetic alteration, namely a chromosomal translocation wherein fusions occur between the EWS RNA Binding Protein 1 (EWSR1) gene and one of the ETS family genes (FLI-1), resulting in an aberrant transcription factor that reprograms gene expression. Current survival rates are around 70–80% for patients with standard-risk disease and ~30% for patients with metastatic disease. Survivors often experience important long-lasting adverse effects resulting from treatment, in addition to long-term consequences of the disease, such as limb amputations [16,17,18].
Changes in epigenetic programming during embryonic development are likely key events in the origin of childhood cancers, including NB and ES, and epigenetic-modulating compounds have been investigated as therapeutic agents for these diseases [19,20,21,22,23]. We have previously reported that higher G9a/Ehmt2 transcription may predict poor prognosis with shorter overall survival (OS) in patients with the Sonic Hedgehog (SHH) molecular subgroup of medulloblastoma, which is the main type of pediatric malignant brain tumor, and that inhibiting G9a activity can impair medulloblastoma cell viability [24]. Here, we investigate G9a and GLP as possible biomarkers of prognosis and therapeutic targets in NB and ES.

2. Results

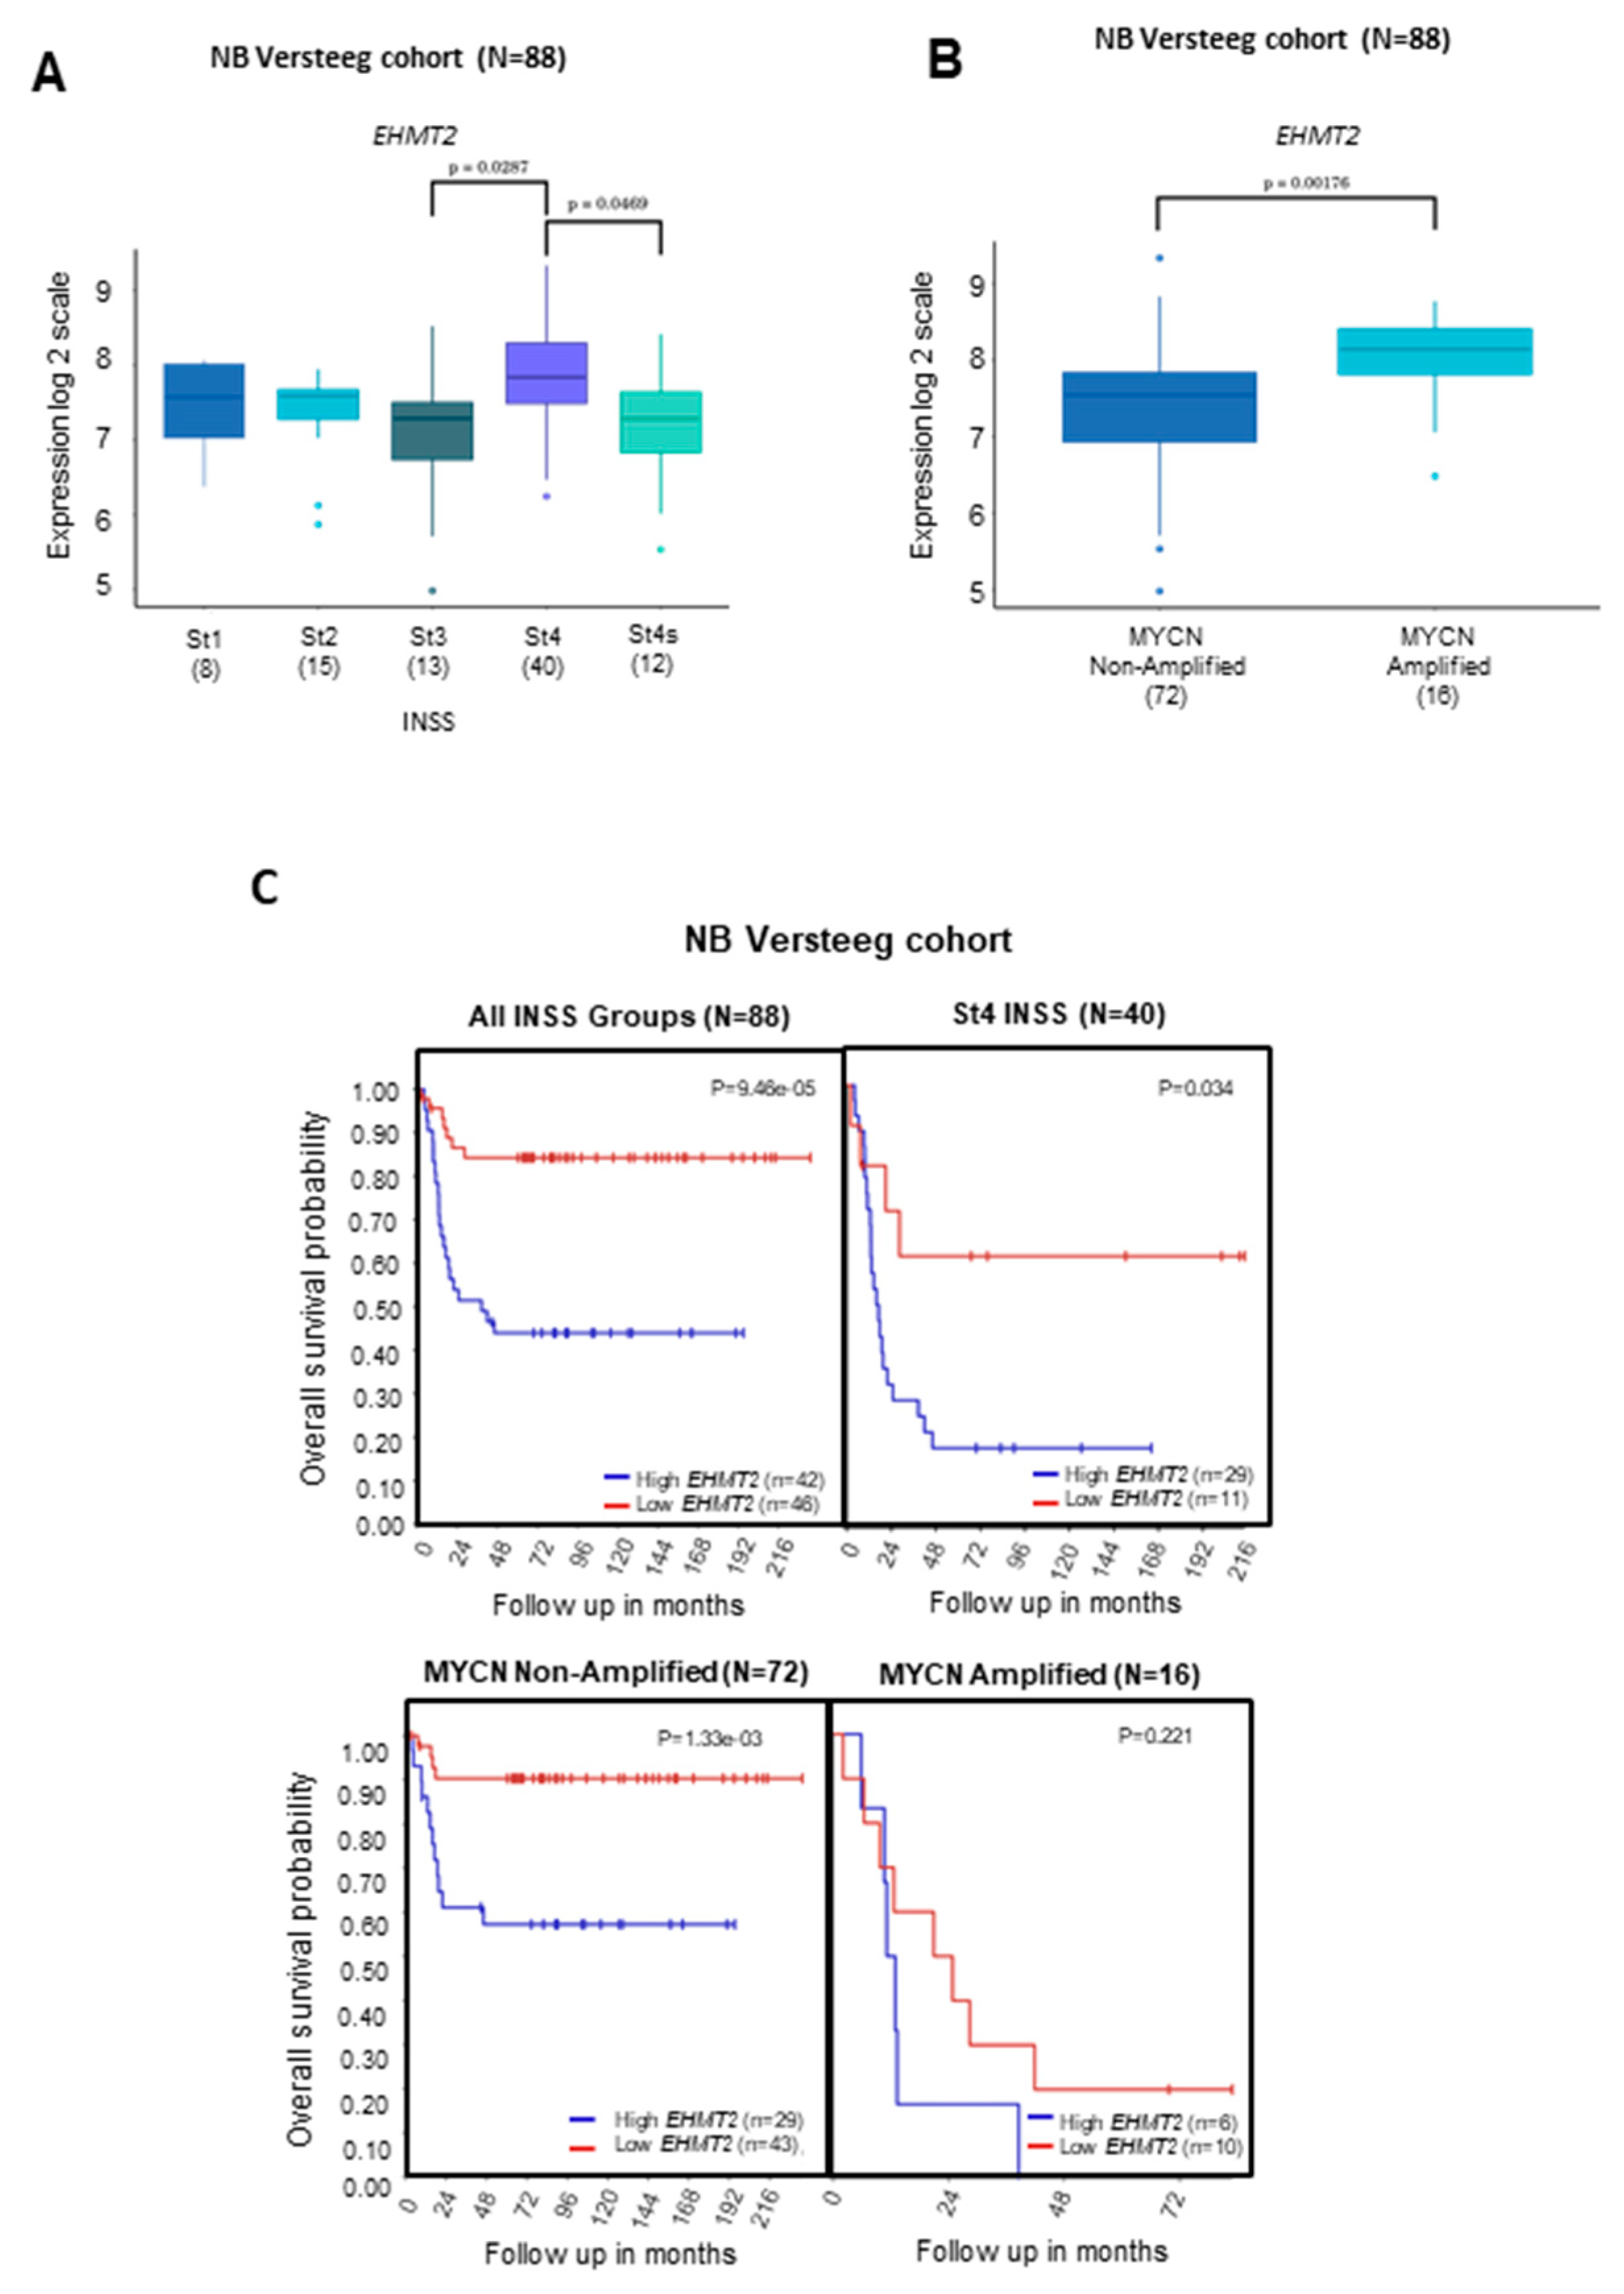
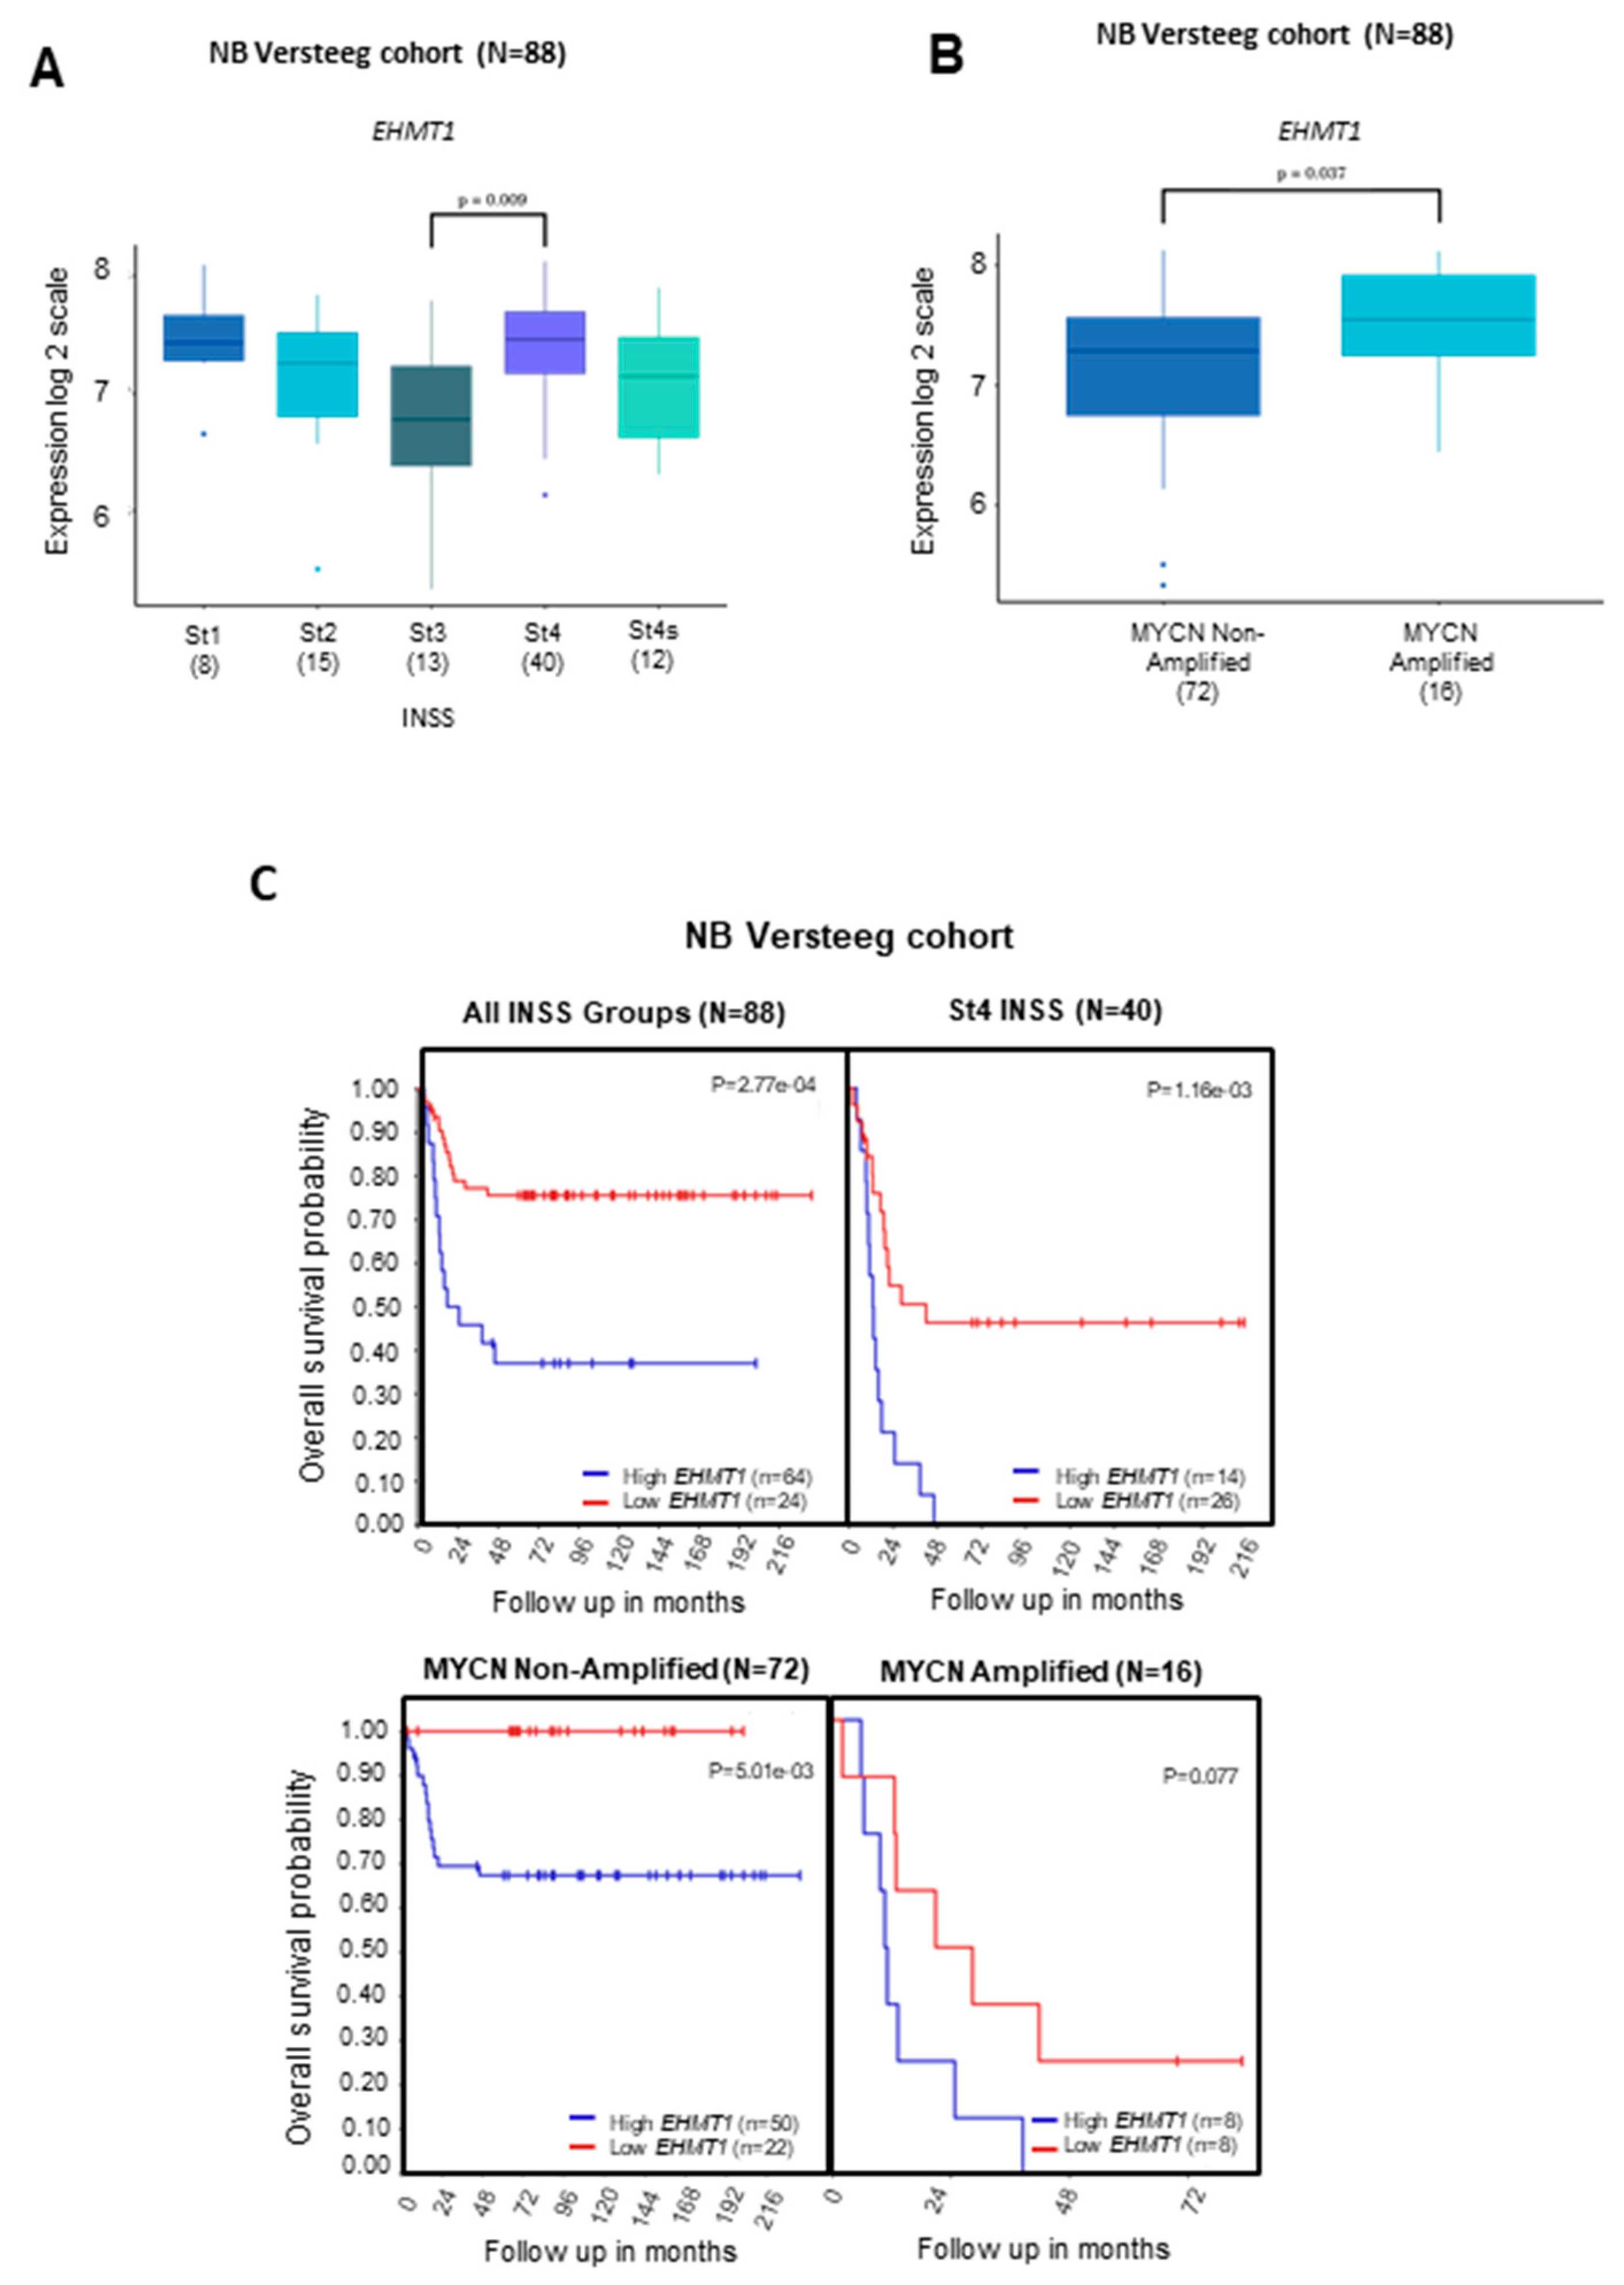
2.1. Transcriptional Levels of G9a/Ehmt2 and GLP/Ehmt1 on Survival Rates in Patients with NB

Transcriptional analyses indicated that G9a/Ehmt2 gene levels were higher in tumors belonging to the St4 International Neuroblastoma Staging System (INSS) stage compared to patients with St3 and St4s tumors, which can exhibit a better prognosis (Figure 1A). In addition, the G9a/Ehmt2 transcriptional level was significantly higher in patients carrying MYCN-amplified tumors (Figure 1B). Patients with higher G9a/Ehmt2 gene levels in NB tumors exhibited a significant reduction in OS (Figure 1C, upper panel). Moreover, NB patients with single copy MYCN and higher G9a transcriptional levels presented with a significant reduction in OS (Figure 1C). For GLP/Ehmt1, we found a significantly higher gene level in tumors belonging to the St4 INSS stage compared to patients with St3 (Figure 2A), as well as patients with MYCN-amplified tumors (Figure 2B). In addition, NB patients with higher GLP/Ehmt1 gene levels in NB tumors with St4 INSS stage exhibited a significant reduction in OS (Figure 2C, upper panel). Also, patients carrying non-amplified MYCN tumors with higher GLP/Ehmt1 gene levels exhibited a significant reduction in OS (Figure 2C, lower panel).

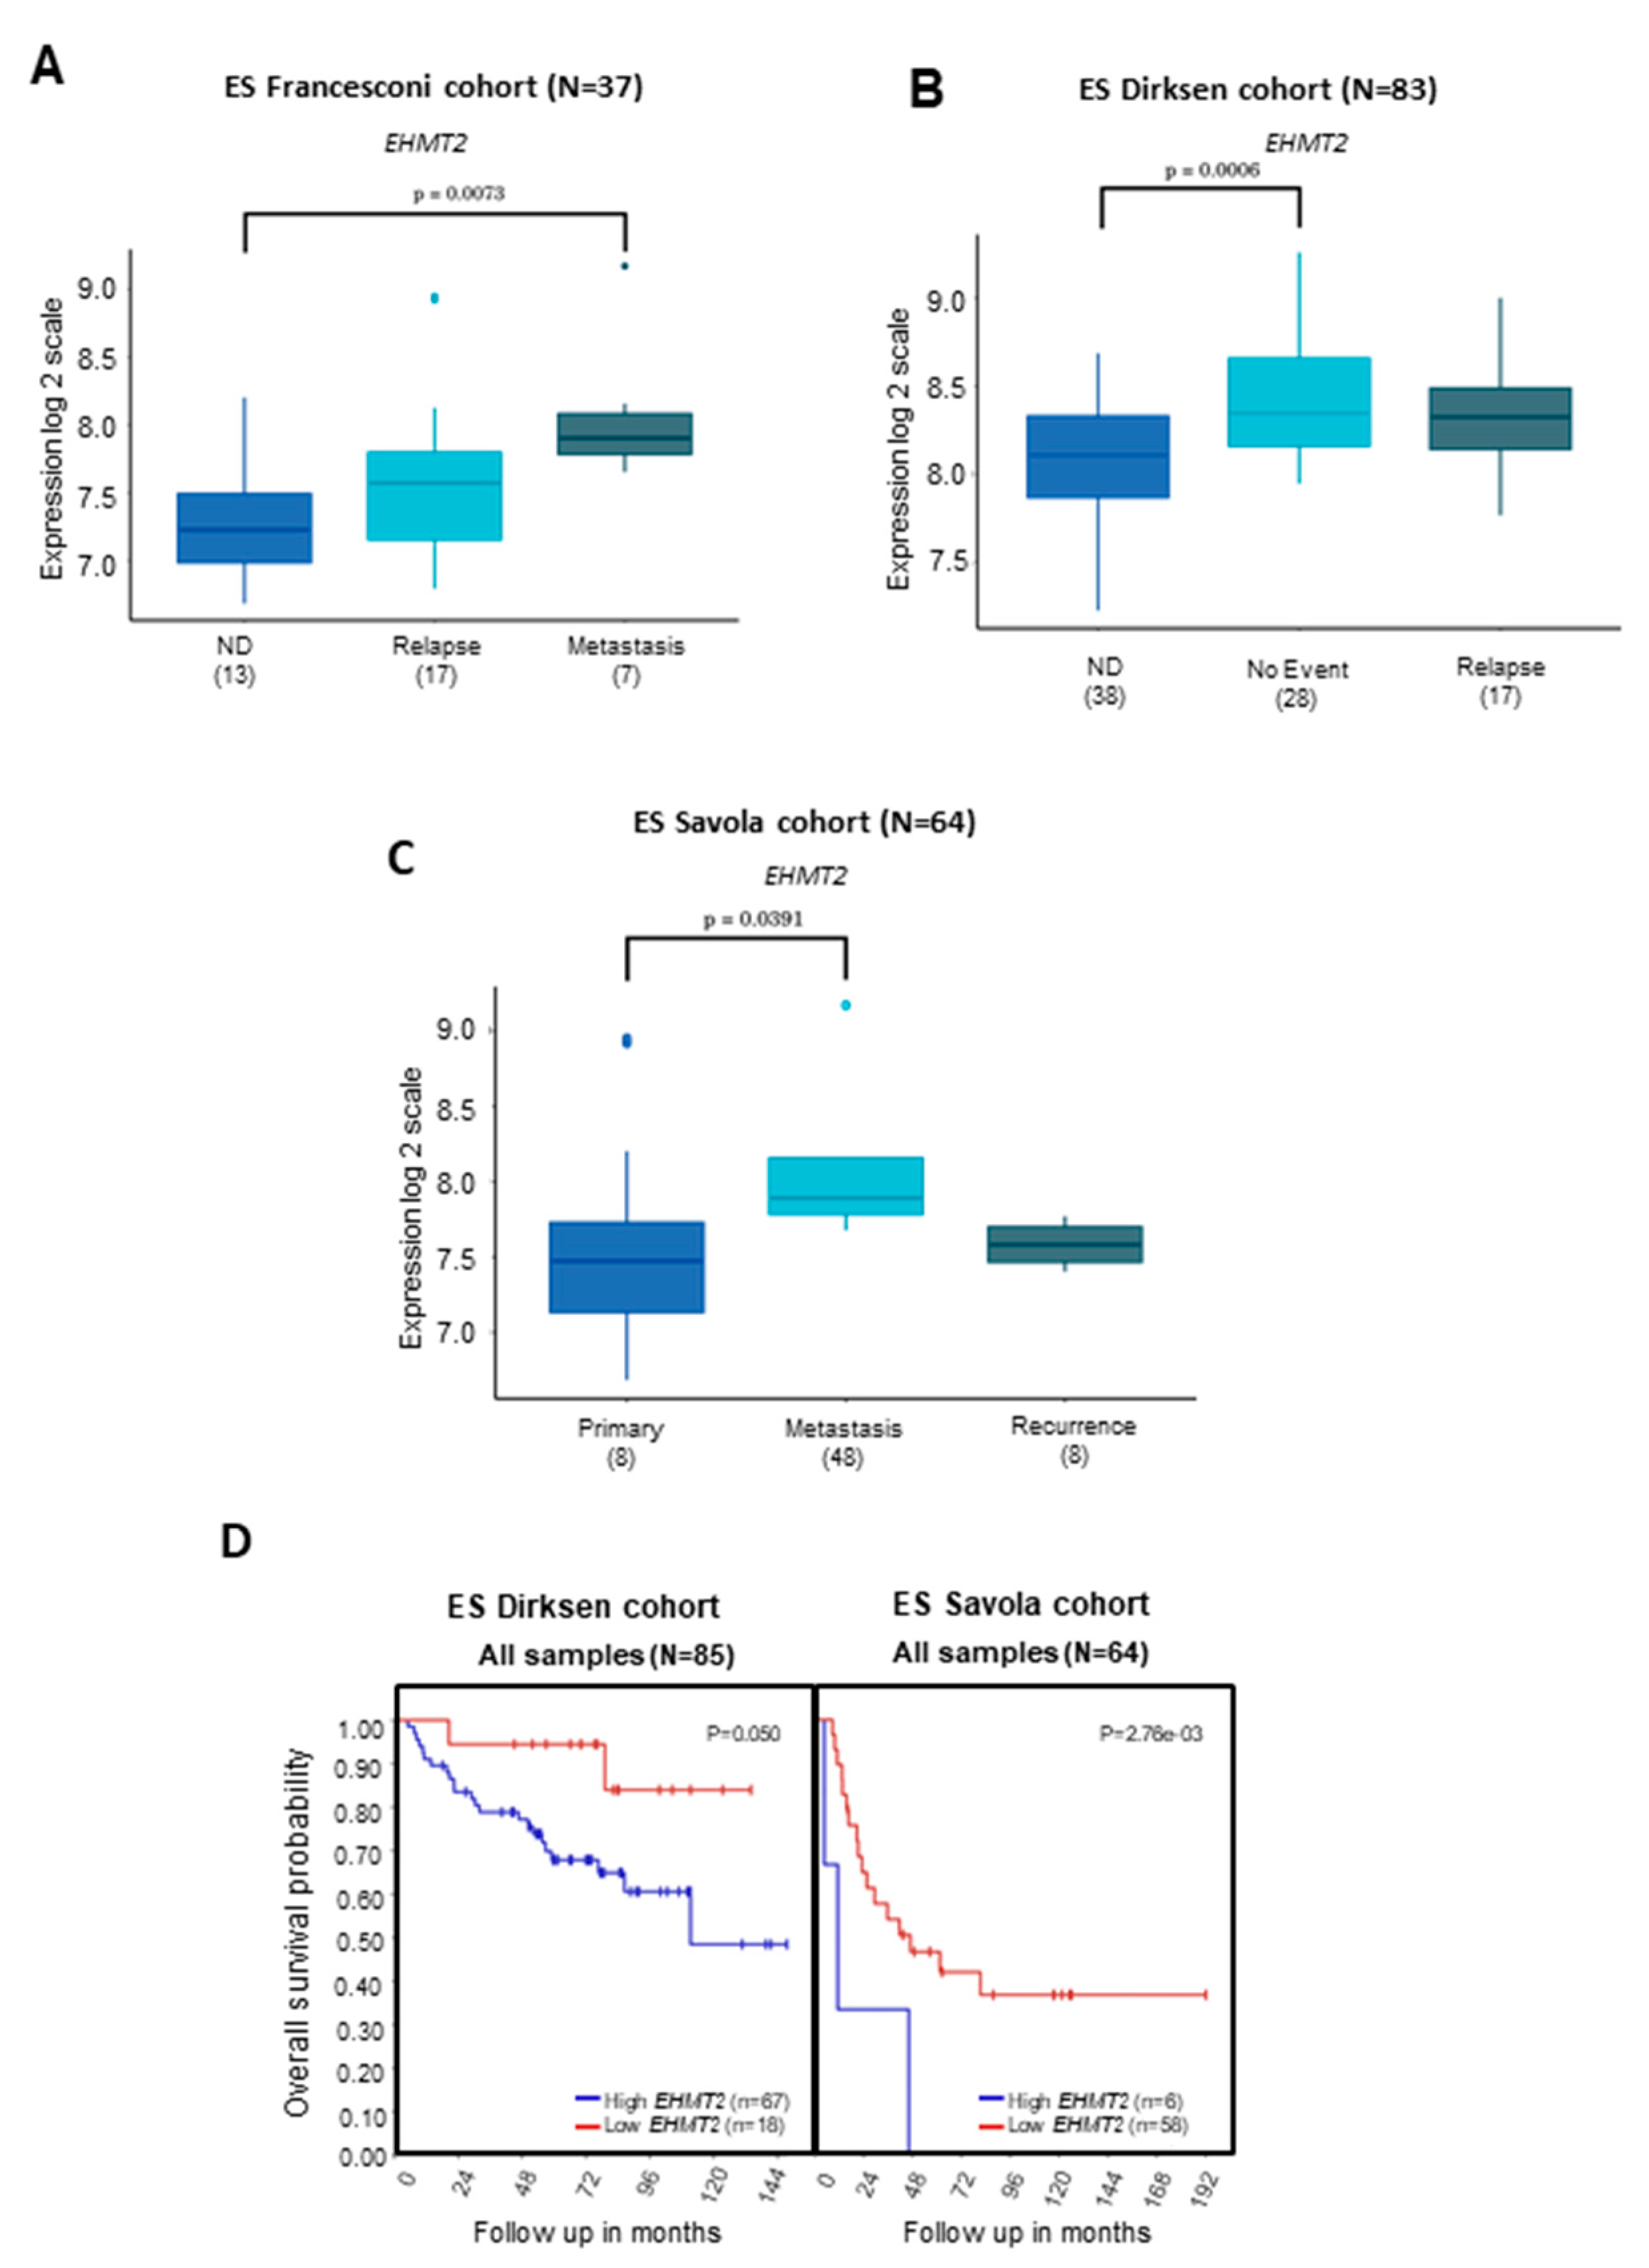
2.2. Transcriptional Levels of G9a/Ehmt2 and GLP/Ehmt1 on Survival Rates in Patients with ES

G9a/Ehmt2 levels were higher in metastatic disease compared to patients with primary or relapsed disease (Figure 3A–C). Patients bearing ES tumors with higher G9a/Ehmt2 levels showed a significant reduction in OS compared to patients with lower G9a/Ehmt2 expression (Figure 3D). For GLP/Ehmt1, the gene level was higher in metastatic disease compared with patients with no evidence of disease (Figure 4A,B) In addition, patients bearing ES tumors with higher GLP/Ehmt1 levels showed a significant reduction in OS compared with patients with lower GLP/Ehmt1 levels (Figure 4C).

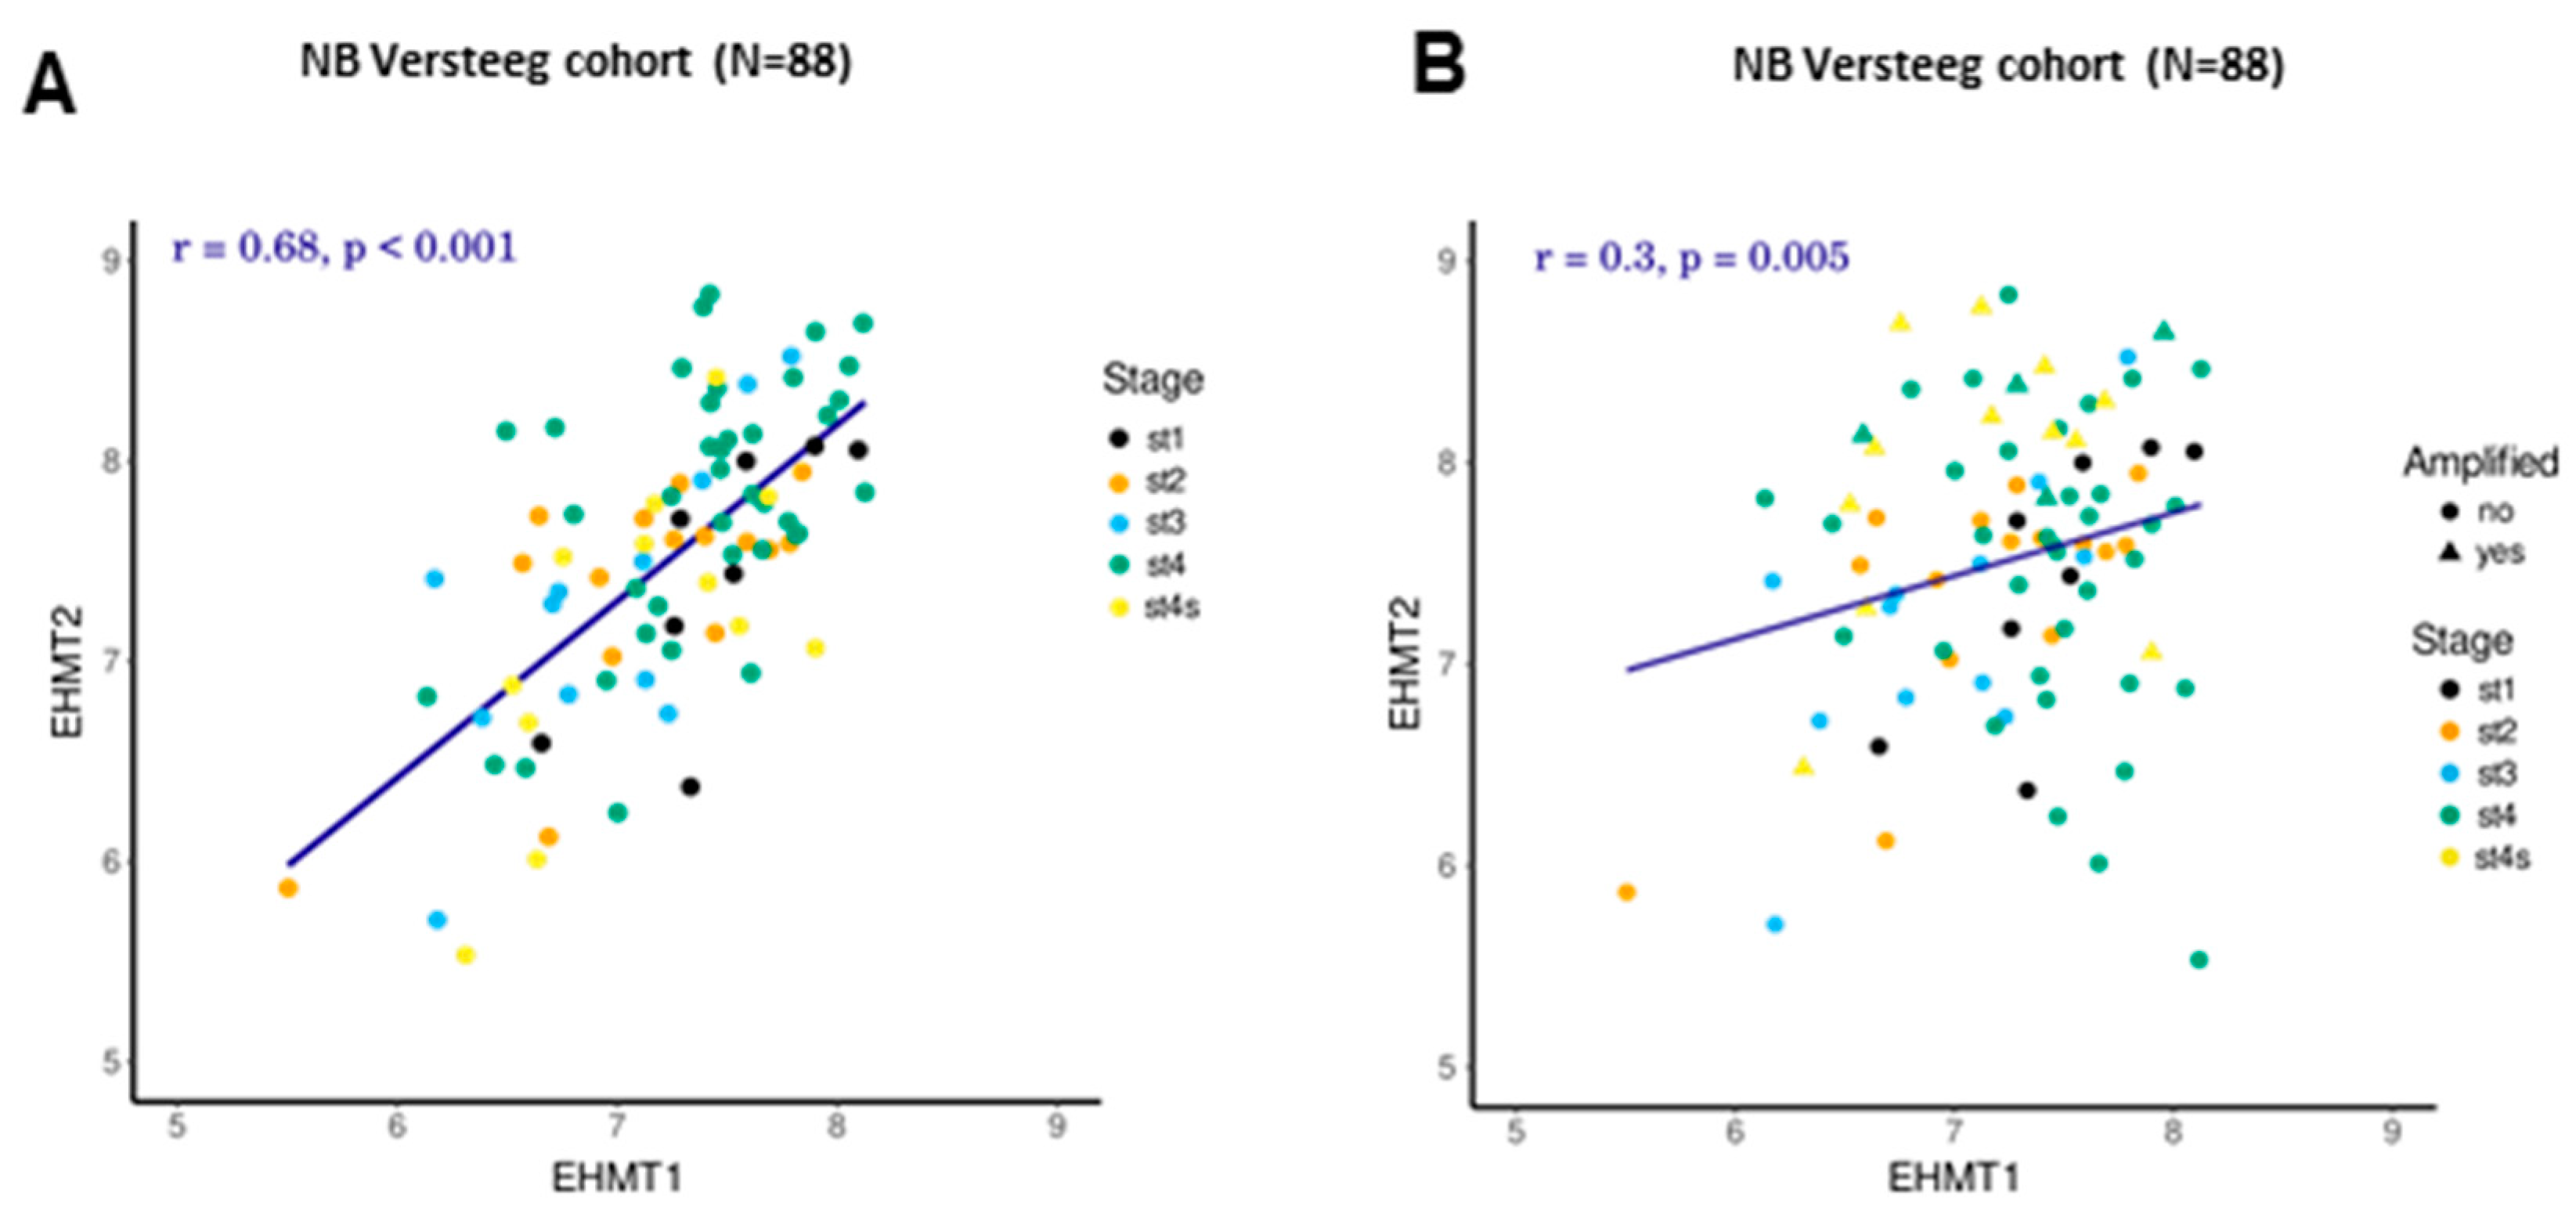
2.3. Correlation between Transcriptional Levels of G9a/Ehmt2 and GLP/Ehmt1 in Patients with NB

To assess whether there is an association between transcriptional levels of G9a/Ehmt2 and GLP/Ehmt1 in NB, we calculated a Pearson’s product–moment correlation. There was a significant correlation between G9a/Ehmt2 and GLP/Ehmt1 levels in NB tumors of different stages (r = 0.68, p < 0.001; Figure 5A) and also when tumors were stratified by MYCN status (r = 0.3, p = 0.005; Figure 5B). There was no significant correlation between G9a/Ehmt2 and GLP/Ehmt1 expression in ES tumors.

2.4. G9a/GLP Inhibition Reduces NB and ES Cell Viability

In order to verify whether the inhibition of G9a and GLP affects cell growth, we evaluated NB and ES cell viability after treatment with the G9a/GLP inhibitor UNC0642 for 24, 48, 72, or 96 h. The results showed that UNC0642 consistently and dose-dependently reduced cell viability in both SH-SY5Y (MYCN single copy) and SK-N-Be(2) (MYCN-amplified) NB cells, as well as SK-ES1 and RD-ES ES cells (Figure 6A–D). At 48, 72, and 96 h after G9a inhibition, we observed a lower EC50 dose in SK-N-Be(2) compared to SH-SY5Y NB cells, as well as lower EC50 values in RD-ES cells compared to SK-ES1 EB ES cells, indicating differential sensitivities (Figure 6E, Table 1). In addition, G9a/GLP inhibition induced a change in morphology in cell lines accompanied by the appearance of smaller NB neurosphere-like cells in SH-SY5Y cultures, as well as the appearance of short neurite-like extensions in ES cells (Figure 6F).

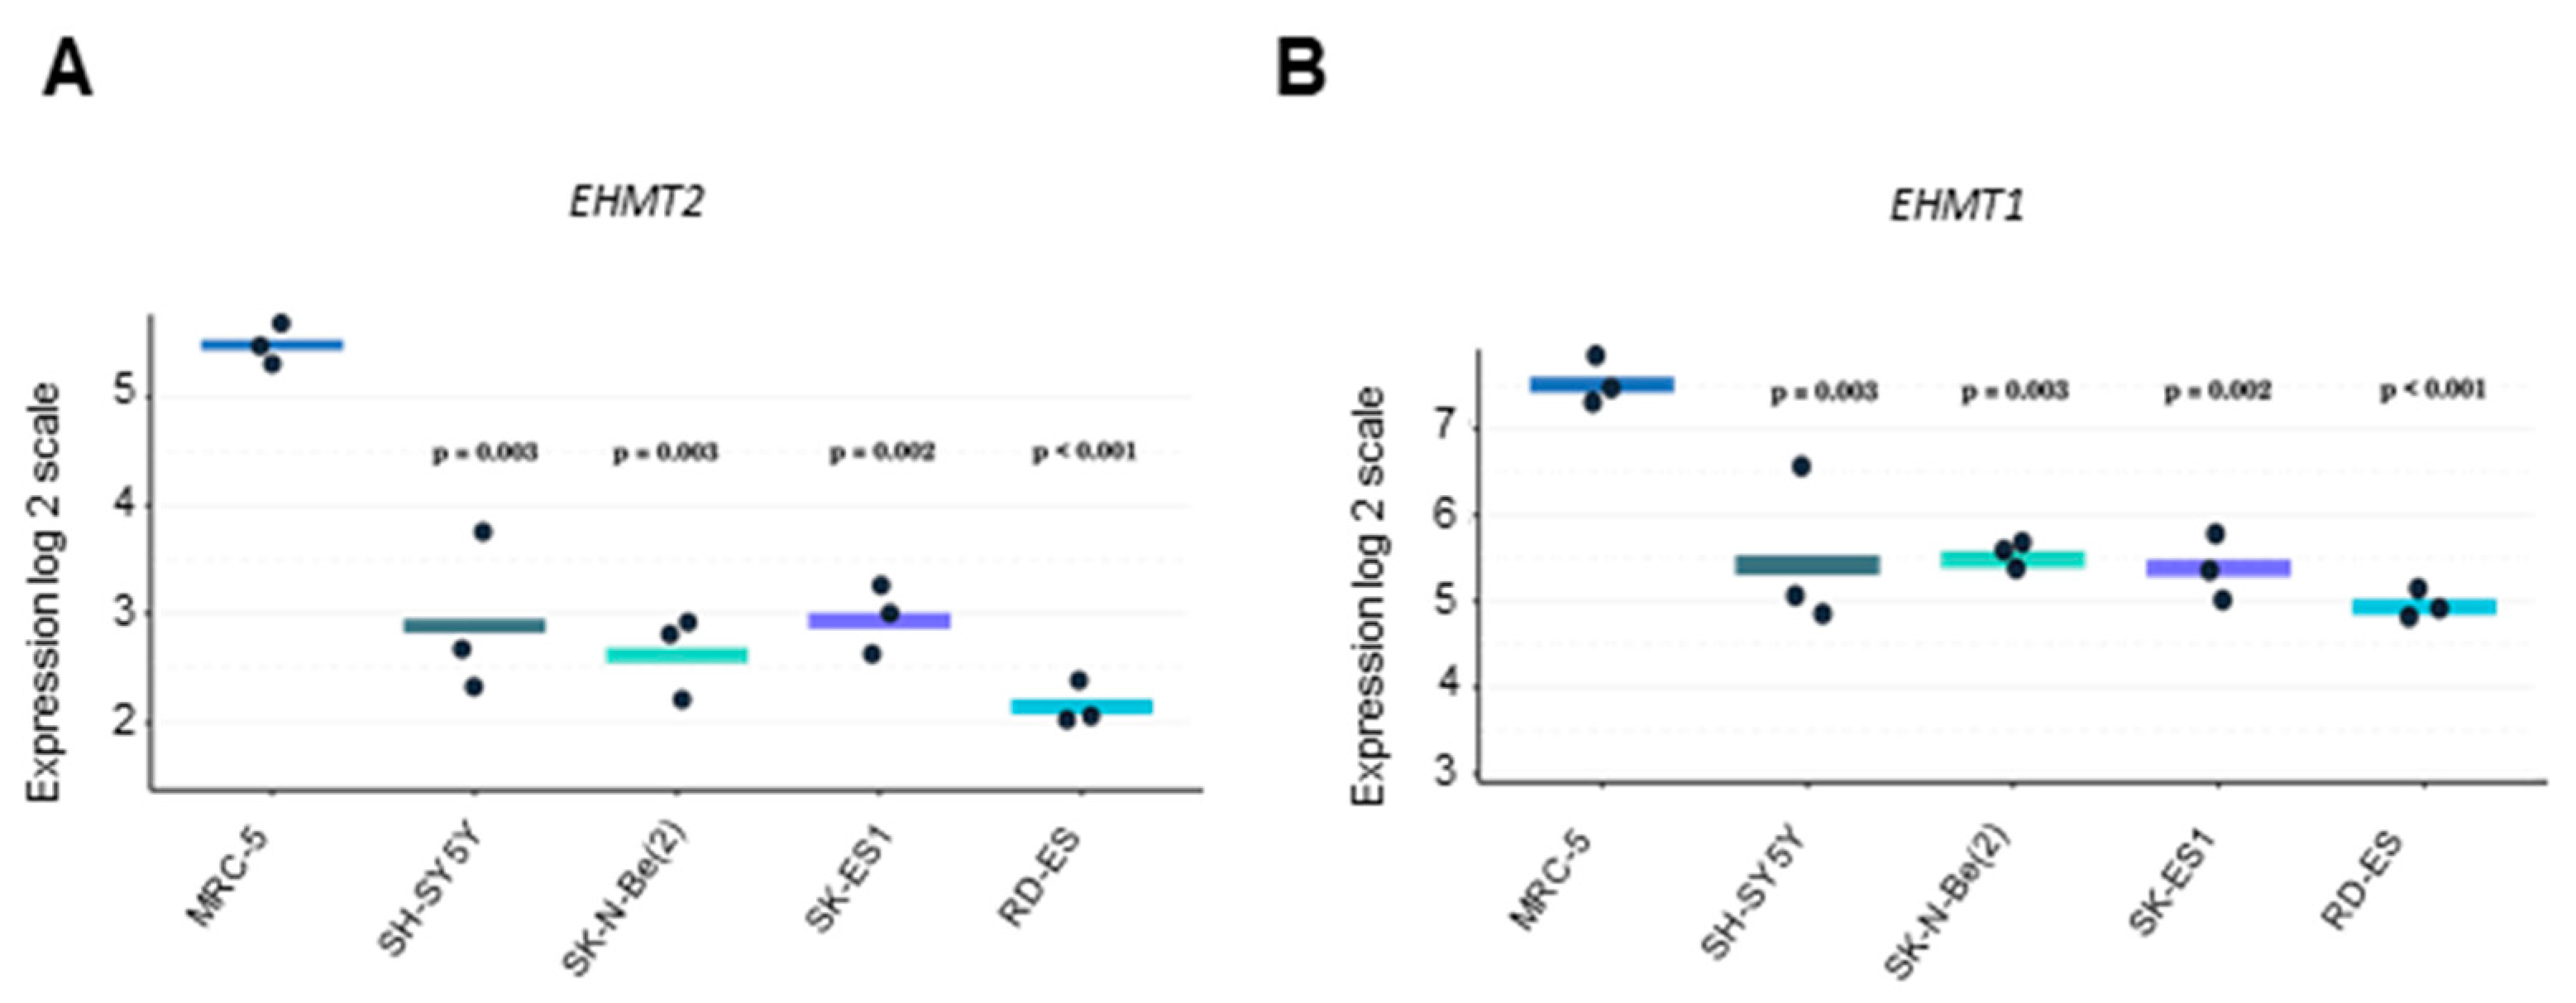
2.5. Expression of G9a/Ehmt2 and GLP/Ehmt1 mRNA Levels in NB, ES, and Non-Tumoral Human Cells

To identify transcriptional levels of G9a/Ehmt2 and GLP/Ehmt1 in NB and ES cells, we analyzed SH-SY5Y, SK-N-Be(2), SK-ES1, and RD-ES cells via qRT-PCR, in addition to analyzing human MRC-5 fibroblasts as a non-tumoral cell type. This analysis showed lower GLP/Ehmt1 and G9a/Ehmt2 levels in all tumor cell lines (SH-SY5Y, SK-N-Be(2), SK-ES1, and RD-ES) compared with MRC-5 human fibroblasts (Figure 7).

3. Discussion

This study demonstrated that G9a/Ehmt2 and GLP/Ehmt1 expression levels were higher in NB tumors of the St4 INSS stage and MYCN-amplified tumors, which are characteristic of a poorer prognosis. In ES, higher G9a/Ehmt2 was found in metastatic disease compared to non-metastatic disease. In addition, both in NB and ES, higher G9a/Ehmt2 and GLP/Ehmt1 levels were significantly associated with shorter patient OS. Also, we found that patients with high GLP/Ehmt1 levels carrying tumors with a non-amplified MYCN showed a significant reduction in OS survival compared with lower gene levels. Furthermore, there was a significant correlation between G9a/Ehmt2 and GLP/Ehmt1 transcript levels in NB.
It is well known that amplification of the MYCN gene is a biomarker for NB and it is highly associated with highly aggressive tumors and advanced stages of the disease. However, approximately 60% of high-risk NB tumors are non-MYCN-amplified [29,30,31]; therefore, these findings may explain this pattern of OS survival in patients with non-amplified tumors, which is consistent with our in silico analysis. Together, these findings indicate that high G9a/Ehmt2 may be a marker of more severe disease. Finally, our cell culture experiments provide early-stage evidence suggesting that inhibiting G9a can lead to antitumor effects in both NB and ES. Consistent with previous findings [32], MYCN-amplified cells were more sensitive to G9a inhibition compared to a non-MYCN-amplified cell line. However, our results on G9a inhibition are limited to in vitro effects in cell lines and do not confirm the specific nature of the mechanism of action or the broader epigenetic and cellular effects; thus, further experiments are necessary to confirm and elaborate on this finding. We confirmed G9a/Ehmt2 mRNA expression in all of the cell lines that were used in the study. Surprisingly, we observed a higher expression in the non-tumor cell model (MRC-5). This fibroblast line, which we used as a model of a non-tumoral embryonic cell, may not be an appropriate control for NB and ES non-tumoral cells of origin. MRC-5 fibroblasts are human fetal cells derived from embryonic lung tissue. The crucial role of G9a in fibroblast activation during lung metastasis [33,34], as well as the possibility of G9a upregulation during embryonic development [35,36], may possibly explain the high level of G9a mRNA that we observed in MRC-5 cells. An additional limitation is that we did not measure G9a protein levels to verify if they correlate with transcription activity.
Our results on G9a/Ehmt2 expression and G9a inhibition largely replicate the results of previous studies [32,37]. Recently, García-Dominguez et al. found that G9a/Ehmt2 expression correlates with poor prognosis assessed with OS and disease-free survival, as well as with metastasis occurrence, in patients with ES. A worsened prognosis is also associated with moderate-to-strong G9a protein content assessed via immunohistochemical analysis of tumors from a single institutional cohort of ES patients. Moreover, BIX01294 impairs proliferation and migration and stimulates autophagy in ES cells, and systemic treatment with BIX01294 reduced tumor growth and metastasis in a mouse model of ES [37]. Enrichment analysis identified G9a/Ehmt2 as one of the identified main driver genes associated with chemotherapy resistance in ES [38]. The G9a protein content is higher in NB cell lines with MYCN amplification and in poorly differentiated or undifferentiated NB tumors, and G9a expression correlates with the expression of EZH2, which is a known oncoprotein in NB. In addition, G9a inhibition mediated by siRNA or small molecule inhibitors reduces cell growth in NB cell lines and selectively triggers apoptosis in MYCN-amplified NB cells. The effects of G9a inhibition may be associated with the reactivation of tumor suppressor genes [32]. Another study found that the specific G9a inhibitor BIX01294 impairs NB cell growth and proliferation, as well as NB tumorigenicity, in NOD/SCID mice. The antitumor effects were accompanied by features of autophagy, such as the appearance of membranous vacuoles and microtubule-associated protein light chain 3 (LC3B). Importantly, similar results were obtained in G9a-knockdown cells [39]. In addition to reducing NB cell proliferation and MYCN expression, BIX01294 inhibits cell mobility and invasion, induces apoptosis by stimulating caspase 8/caspase 3 activity, and modulates DNA methylation levels [40].
Some features of G9a may make it a particularly promising anticancer epigenetic target for NB and ES. For example, G9a overexpression in cancer may preferentially hinder the expression of tumor suppressors [41,42]; thus, G9a inhibition could be a strategy to restore tumor suppressor genes. Moreover, ES cells may be more sensitive to G9a inhibition compared to other tumor cells [37]. UNC0642 acts as a competitive substrate inhibitor, with improved pharmacokinetic properties being observed compared to those of first-generation G9a inhibitors, which make it suitable for in vivo testing [32,43]. Consistent with previous findings [32], a MYCN-amplified cell line had higher sensitivity to UNC0642 compared to a non-MYCN-amplified cell line. Therefore, the available evidence supports the further development of G9a and GLP inhibitors as candidate therapeutics for NB and ES.

4. Materials and Methods

4.1. Gene Expression

We conducted an analysis of G9a/Ehmt2 and GLP/Ehmt1 transcription using a previously described NB transcriptome data set consisting of 88 NB tumor samples from patients (Versteeg cohort). Original microarray data for these samples are available at the Gene Expression Omnibus (GEO) under accession number GSE16476 [25]. NB samples were profiled using the Affymetrix Human Genome U133 Plus 2.0 Array. NB tumors are classified by the INSS into 4 categories or stages (St1 to St4), which correspond to very low risk, low risk, intermediate risk, or high risk, respectively.
For ES, we analyzed three datasets, which included 37, 83, and 64 tumors obtained from patients [26,27,28]. Data for the ES samples from the Scotlandi et al. data set [26] were profiled using the Affymetrix Human Genome U133 Plus 2.0 Array. Original microarray data for these samples are available at the GEO under accession number GSE112102. For ES tumors from the Savola et al. data set [27], data were profiled using the Affymetrix Human Genome U133 Plus 2.0 Array, and original microarray data for these samples are available at the GEO under accession number GSE17679. Finally, we analyzed data from ES tumors from the Selvanathan et al. data set [28], which were profiled using the Affymetrix Human Exon 1.0 ST Array; original microarray data for these samples are available at the GEO under accession number GSE63157.

4.2. Cell Culture

Human NB cell lines SK-N-Be(2) (CRL-2271™) and SH-SY5Y (CRL-2266™), as well as human ES cell lines SK-ES1 (HTB-86™) and RD-ES (HTB-166™), were obtained from the American Type Culture Collection (ATCC, Rockville, MD, USA) and tested to confirm line identity and to rule out contamination. Cells were cultured in Eagle’s Minimum Essential Medium, F12 Medium, and RPMI-1640 Medium (Gibco, Grand Island, NE, USA) supplemented with 10% (v/v) fetal bovine serum (FBS, Gibco) and 1% (v/v) penicillin/streptomycin (Gibco). The culture medium was changed every 2–3 days. Cells were incubated in a humidified atmosphere of 5% CO2 at 37 °C. Human MRC-5 fibroblasts (ATCC CCL-171) were cultured in Dulbecco’s Modified Eagle Medium (Sigma-Aldrich, Saint Louis, MO, USA) supplemented with 10% (v/v) FBS (Gibco) and 1% penicillin/streptomycin (Gibco).

4.3. Cell Viability and Drug Treatment

Cells were seeded at 4000 to 5000 cells/well in 96-well plates, and, 24 h later, the cells were then treated with 9 different concentrations (ranging from 0.1–30 μM) of the G9a/GLP inhibitor UNC0642 [43] (Tocris, Bristol, UK) for 24, 48, 72, or 96 h. Dimethyl sulfoxide (DMSO, 100%) was used as a vehicle to dissolve UNC0642 and in the controls. To assess viability, the cell suspension was mixed with 0.4% trypan blue 1:1 and immediately counted in a hemocytometer.

4.4. Quantitative Reverse Transcription Polymerase Chain Reaction (qRT-PCR)

Total RNA was extracted using the ReliaPrepTM RNA Cell Miniprep System (Promega, Madison, WI, USA) according to the manufacturer’s instructions and quantified in a NanoDrop (Thermo Fisher Scientific, Waltham, MA, USA). The cDNA was obtained using GoScript Reverse System (Promega, Madison, WI, USA) from 200 ng RNA, according to the manufacturer’s instructions. PowerUp SYBR Green Master Mix (Thermo Fisher Scientific) was used to quantify the mRNA expression levels of target genes in a QuantStudio 3 Real-time PCR System (Thermo Fisher Scientific), using gene-specific primers for Ehmt1, G9a/Ehmt2, and ACTB, which was used as an internal control (Table 2). Samples were analyzed in triplicate (n = 3).

4.5. Statistics

Gene expression levels across all of the samples were normalized using the RMA method within the R2: Genomics Analysis and Visualization Platform (http://r2.amc.nl) and presented in box plot format as log2-transformed signal intensity. Comparisons between the groups within each dataset were compared by using a Kruskal–Wallis test for significance and Tukey’s test for post hoc analysis via R and inscape software programs (version 4.1.2); p values of less than 0.05 were considered to indicate statistically significant differences. OS was measured from the time of initial diagnosis to the date of death or the date of last follow up using combined OS and gene expression data from all of the selected data sets. Survival distribution was estimated according to the Kaplan–Meier method using a median cut-off and log-rank statistics. For the association analysis, we performed the correlation calculated with Pearson’s product–moment correlation. Statistical significance was assessed with a paired t-test; p < 0.05 was considered to be statistically significant.
In cellular experiments, all of the assays were performed in triplicate and repeated in three independent sets. For calculation of EC50, data were fitted in a concentration–response curve (GraphPad Prism) by using the following equation: y = min + (maxmin)/(1 + 10^((LogEC50 − x)*Hillslope + Log ((maxmin)/(50 − min) − 1))). Data for qRT-PCR were analyzed using GraphPad Prism with one-way analysis of variance (ANOVA) followed by Tukey’s post hoc tests.

5. Conclusions

Our findings support a role for G9a and GLP in promoting NB and ES progression, suggesting that they are indicative of a worse disease prognosis. Also, our results, together with the results of previous studies, are consistent with the viewpoint that the pharmacological inhibition of G9a/GLP may be a novel promising adjunctive therapeutical strategy based on epigenetic regulation for the treatment of these pediatric solid tumors.

Author Contributions

B.K.S. designed the study. B.K.S., T.S.M. and M.G.S.D. performed in silico gene expression analyses, statistical analysis, and figure generation. B.K.S. and N.H.F. performed cellular experiments and data analysis. A.L.H. performed qRT-PCT experiments and data analysis. M.J. and C.B.d.F. assisted in the experiments. B.K.S., N.H.F., T.S.M., A.L.H., M.J., M.G.S.D., C.B.d.F., L.G., A.T.B., A.L.B., C.J.T. and R.R. analyzed and interpreted data. B.K.S., N.H.F., T.S.M., A.L.H., M.J., M.G.S.D., C.B.d.F., L.G., A.T.B., C.J.T. and R.R. contributed to the writing and revision of this article. All authors have read and agreed to the published version of the manuscript.

Funding

This research was supported by the National Council for Scientific and Technological Development (CNPq, MCTI, Brazil) grants 407765/2017-4, 305647/2019-9, 405608/2021-7, 406484/2022-8-INCT BioOncoPed (R.R.), and 101566/2022-0 (A.L.H.); the Rio Grande do Sul State Research Foundation (FAPERGS, RS, Brazil) grant 17/2551-0001 071-0 (R.R.); the Children’s Cancer Institute; the Coordination for the Improvement of Higher Education Personnel (CAPES, MEC, Brazil); the Clinical Hospital institutional research fund (FIPE-HCPA); and the Center for Cancer Research, Intramural Research Program at the National Cancer Institute, National Institutes of Health (C.J.T.).

Institutional Review Board Statement

Not applicable.

Informed Consent Statement

Not applicable.

Data Availability Statement

The data presented in this study are available upon request.

Conflicts of Interest

The authors declare no conflict of interest.

References

  1. Lehnertz, B.; Ueda, Y.; Derijck, A.A.; Braunschweig, U.; Perez-Burgos, L.; Kubicek, S.; Chen, T.; Li, E.; Jenuwein, T.; Peters, A.H. Suv39h-mediated histone H3 lysine 9 methylation directs DNA methylation to major satellite repeats at pericentric heterochromatin. Curr. Biol. 2003, 13, 1192–1200. [Google Scholar] [CrossRef] [PubMed]
  2. Morera, L.; Lübbert, M.; Jung, M. Targeting histone methyltransferases and demethylases in clinical trials for cancer therapy. Clin. Epigenet. 2016, 8, 57. [Google Scholar] [CrossRef] [PubMed]
  3. Milner, C.M.; Campbell, R.D. The G9a gene in the human major histocompatibility complex encodes a novel protein containing ankyrin-like repeats. Biochem. J. 1993, 290 Pt 3, 811–818. [Google Scholar] [CrossRef] [PubMed]
  4. Brown, S.E.; Campbell, R.D.; Sanderson, C.M. Novel NG36/G9a gene products encoded within the human and mouse MHC class III regions. Mamm. Genome 2001, 12, 916–924. [Google Scholar] [CrossRef] [PubMed]
  5. Chen, X.; Skutt-Kakaria, K.; Davison, J.; Ou, Y.L.; Choi, E.; Malik, P.; Loeb, K.; Wood, B.; Georges, G.; Torok-Storb, B.; et al. G9a/GLP-dependent histone H3K9me2 patterning during human hematopoietic stem cell lineage commitment. Genes Dev. 2012, 26, 2499–2511. [Google Scholar] [CrossRef]
  6. Fong, K.W.; Zhao, J.C.; Lu, X.; Kim, J.; Piunti, A.; Shilatifard, A.; Yu, J. PALI1 promotes tumor growth through competitive recruitment of PRC2 to G9A-target chromatin for dual epigenetic silencing. Mol. Cell 2022, 82, 4611–4626.e7. [Google Scholar] [CrossRef]
  7. Vinson, D.A.; Stephens, K.E.; O’Meally, R.N.; Bhat, S.; Dancy, B.C.R.; Cole, R.N.; Yegnasubramanian, S.; Taverna, S.D. De novo methylation of histone H3K23 by the methyltransferases EHMT1/GLP and EHMT2/G9a. Epigenet. Chromatin 2022, 15, 36. [Google Scholar] [CrossRef]
  8. Chen, M.W.; Hua, K.T.; Kao, H.J.; Chi, C.C.; Wei, L.H.; Johansson, G.; Shiah, S.G.; Chen, P.S.; Jeng, Y.M.; Cheng, T.Y.; et al. H3K9 histone methyltransferase G9a promotes lung cancer invasion and metastasis by silencing the cell adhesion molecule Ep-CAM. Cancer Res. 2010, 70, 7830–7840. [Google Scholar] [CrossRef]
  9. Casciello, F.; Windloch, K.; Gannon, F.; Lee, J.S. Functional role of G9a histone methyltransferase in cancer. Front. Immunol. 2015, 6, 487. [Google Scholar] [CrossRef]
  10. Souza, B.K.; Freire, N.H.; Jaeger, M.; de Farias, C.B.; Brunetto, A.L.; Brunetto, A.T.; Roesler, R. EHMT2/G9a as an epigenetic target in pediatric and adult brain tumors. Int. J. Mol. Sci. 2021, 22, 11292. [Google Scholar] [CrossRef]
  11. Tachibana, M.; Ueda, J.; Fukuda, M.; Takeda, N.; Ohta, T.; Iwanari, H.; Sakihama, T.; Kodama, T.; Hamakubo, T.; Shinkai, Y. Histone methyltransferases G9a and GLP form heteromeric complexes and are both crucial for methylation of euchromatin at H3-K9. Genes Dev. 2005, 19, 815–826. [Google Scholar] [CrossRef] [PubMed]
  12. Zhang, T.; Termanis, A.; Özkan, B.; Bao, X.X.; Culley, J.; de Lima Alves, F.; Rappsilber, J.; Ramsahoye, B.; Stancheva, I. G9a/GLP complex maintains imprinted DNA methylation in embryonic stem cells. Cell Rep. 2016, 15, 77–85. [Google Scholar] [CrossRef] [PubMed]
  13. Sanchez, N.A.; Kallweit, L.M.; Trnka, M.J.; Clemmer, C.L.; Al-Sady, B. Heterodimerization of H3K9 histone methyltransferases G9a and GLP activates methyl reading and writing capabilities. J. Biol. Chem. 2021, 297, 101276. [Google Scholar] [CrossRef] [PubMed]
  14. Pinto, N.R.; Applebaum, M.A.; Volchenboum, S.L.; Matthay, K.K.; London, W.B.; Ambros, P.F.; Nakagawara, A.; Berthold, F.; Schleiermacher, G.; Park, J.R.; et al. Advances in risk classification and treatment strategies for neuroblastoma. J. Clin. Oncol. 2015, 33, 3008–3017. [Google Scholar] [CrossRef]
  15. Yu, A.L.; Gilman, A.L.; Ozkaynak, M.F.; Naranjo, A.; Diccianni, M.B.; Gan, J.; Hank, J.A.; Batova, A.; London, W.B.; Tenney, S.C.; et al. Long-term follow-up of a phase III study of ch14.18 (dinutuximab) + cytokine immunotherapy in children with high-risk neuroblastoma: COG Study ANBL0032. Clin. Cancer Res. 2021, 27, 2179–2189. [Google Scholar] [CrossRef] [PubMed]
  16. Grünewald, T.G.P.; Cidre-Aranaz, F.; Surdez, D.; Tomazou, E.M.; de Álava, E.; Kovar, H.; Sorensen, P.H.; Delattre, O.; Dirksen, U. Ewing sarcoma. Nat. Ver. Dis. Primers 2018, 4, 5. [Google Scholar] [CrossRef]
  17. Eaton, B.R.; Claude, L.; Indelicato, D.J.; Vatner, R.; Yeh, B.; Schwarz, R.; Laack, N. Ewing sarcoma. Pediatr. Blood Cancer 2021, 68 (Suppl. S2), e28355. [Google Scholar] [CrossRef]
  18. Riggi, N.; Suvà, M.L.; Stamenkovic, I. Ewing’s sarcoma. N. Engl. J. Med. 2021, 384, 154–164. [Google Scholar] [CrossRef]
  19. Lawlor, E.R.; Thiele, C.J. Epigenetic changes in pediatric solid tumors: Promising new targets. Clin. Cancer Res. 2012, 18, 2768–2779. [Google Scholar] [CrossRef]
  20. Riggi, N.; Knoechel, B.; Gillespie, S.M.; Rheinbay, E.; Boulay, G.; Suvà, M.L.; Rossetti, N.E.; Boonseng, W.E.; Oksuz, O.; Cook, E.B.; et al. EWS-FLI1 utilizes divergent chromatin remodeling mechanisms to directly activate or repress enhancer elements in Ewing sarcoma. Cancer Cell 2014, 26, 668–681. [Google Scholar] [CrossRef]
  21. Almeida, V.R.; Vieira, I.A.; Buendia, M.; Brunetto, A.T.; Gregianin, L.J.; Brunetto, A.L.; Klamt, F.; de Farias, C.B.; Abujamra, A.L.; Lopez, P.L.D.C.; et al. Combined treatments with a retinoid receptor agonist and epigenetic modulators in human neuroblastoma cells. Mol. Neurobiol. 2017, 54, 7610–7619. [Google Scholar] [CrossRef] [PubMed]
  22. Veschi, V.; Liu, Z.; Voss, T.C.; Ozbun, L.; Gryder, B.; Yan, C.; Hu, Y.; Ma, A.; Jin, J.; Mazur, S.J.; et al. Epigenetic siRNA and chemical screens identify SETD8 inhibition as a therapeutic strategy for p53 activation in high-risk neuroblastoma. Cancer Cell 2017, 31, 50–63. [Google Scholar] [CrossRef] [PubMed]
  23. Souza, B.K.; da Costa Lopez, P.L.; Menegotto, P.R.; Vieira, I.A.; Kersting, N.; Abujamra, A.L.; Brunetto, A.T.; Brunetto, A.L.; Gregianin, L.; de Farias, C.B.; et al. Targeting histone deacetylase activity to arrest cell growth and promote neural differentiation in Ewing sarcoma. Mol. Neurobiol. 2018, 55, 7242–7258. [Google Scholar] [CrossRef] [PubMed]
  24. Souza, B.K.; Freire, N.H.; Jaeger, M.; de Farias, C.B.; Brunetto, A.L.; Brunetto, A.T.; Roesler, R. G9a/EHMT2 is a potential prognostic biomarker and molecular target in SHH medulloblastoma. Neuromol. Med. 2022, 24, 392–398. [Google Scholar] [CrossRef] [PubMed]
  25. Molenaar, J.J.; Domingo-Fernández, R.; Ebus, M.E.; Lindner, S.; Koster, J.; Drabek, K.; Mestdagh, P.; van Sluis, P.; Valentijn, L.J.; van Nes, J.; et al. LIN28B induces neuroblastoma and enhances MYCN levels via let-7 suppression. Nat. Genet. 2012, 44, 1199–1206. [Google Scholar] [CrossRef] [PubMed]
  26. Scotlandi, K.; Remondini, D.; Castellani, G.; Manara, M.C.; Nardi, F.; Cantiani, L.; Francesconi, M.; Mercuri, M.; Caccuri, A.M.; Serra, M.; et al. Overcoming resistance to conventional drugs in Ewing sarcoma and identification of molecular predictors of outcome. J. Clin. Oncol. 2009, 27, 2209–2216. [Google Scholar] [CrossRef]
  27. Savola, S.; Klami, A.; Myllykangas, S.; Manara, C.; Scotlandi, K.; Picci, P.; Knuutila, S.; Vakkila, J. High expression of complement component 5 (C5) at tumor site associates with superior survival in Ewing’s sarcoma family of tumour patients. ISRN Oncol. 2011, 2011, 168712. [Google Scholar] [CrossRef]
  28. Selvanathan, S.P.; Graham, G.T.; Erkizan, H.V.; Dirksen, U.; Natarajan, T.G.; Dakic, A.; Yu, S.; Liu, X.; Paulsen, M.T.; Ljungman, M.E.; et al. Oncogenic fusion protein EWS-FLI1 is a network hub that regulates alternative splicing. Proc. Natl. Acad. Sci. USA 2015, 112, E1307–E1316. [Google Scholar] [CrossRef]
  29. Brodeur, G.M.; Seeger, R.C.; Schwab, M.; Varmus, H.E.; Bishop, J.M. Amplification of N-myc in untreated human neuroblastomas correlates with advanced disease stage. Science 1984, 224, 1121–1124. [Google Scholar] [CrossRef]
  30. Peifer, M.; Hertwig, F.; Roels, F.; Dreidax, D.; Gartlgruber, M.; Menon, R.; Krämer, A.; Roncaioli, J.L.; Sand, F.; Heuckmann, J.M.; et al. Telomerase activation by genomic rearrangements in high-risk neuroblastoma. Nature 2015, 526, 700–704. [Google Scholar] [CrossRef]
  31. Pugh, T.J.; Morozova, O.; Attiyeh, E.F.; Asgharzadeh, S.; Wei, J.S.; Auclair, D.; Carter, S.L.; Cibulskis, K.; Hanna, M.; Kiezun, A.; et al. The genetic landscape of high-risk neuroblastoma. Nat. Genet. 2013, 45, 279–284. [Google Scholar] [CrossRef] [PubMed]
  32. Bellamy, J.; Szemes, M.; Melegh, Z.; Dallosso, A.; Kollareddy, M.; Catchpoole, D.; Malik, K. Increased efficacy of histone methyltransferase G9a inhibitors against MYCN-amplified neuroblastoma. Front. Oncol. 2020, 10, 818. [Google Scholar] [CrossRef]
  33. Coward, W.R.; Brand, O.J.; Pasini, A.; Jenkins, G.; Knox, A.J.; Pang, L. Interplay between EZH2 and G9a regulates CXCL10 gene repression in idiopathic pulmonary fibrosis. Am. J. Respir. Cell Mol. Biol. 2018, 58, 449–460. [Google Scholar] [CrossRef]
  34. Ligresti, G.; Caporarello, N.; Meridew, J.A.; Jones, D.L.; Tan, Q.; Choi, K.M.; Haak, A.J.; Aravamudhan, A.; Roden, A.C.; Prakash, Y.S.; et al. CBX5/G9a/H3K9me-mediated gene repression is essential to fibroblast activation during lung fibrosis. JCI Insight 2019, 5, e127111. [Google Scholar] [CrossRef]
  35. Minakawa, T.; Kanki, Y.; Nakamura, K.; Yamashita, J.K. Protein kinase A accelerates the rate of early stage differentiation of pluripotent stem cells. Biochem. Biophys. Res. Commun. 2020, 524, 57–63. [Google Scholar] [CrossRef] [PubMed]
  36. Zylicz, J.J.; Borensztein, M.; Wong, F.C.; Huang, Y.; Lee, C.; Dietmann, S.; Surani, M.A. G9a regulates temporal preimplantation developmental program and lineage segregation in blastocyst. eLife 2018, 7, e33361. [Google Scholar] [CrossRef] [PubMed]
  37. García-Domínguez, D.J.; Hajji, N.; López-Alemany, R.; Sánchez-Molina, S.; Figuerola-Bou, E.; Morón Civanto, F.J.; Rello-Varona, S.; Andrés-León, E.; Benito, A.; Keun, H.C.; et al. Selective histone methyltransferase G9a inhibition reduces metastatic development of Ewing sarcoma through the epigenetic regulation of NEU1. Oncogene 2022, 41, 2638–2650. [Google Scholar] [CrossRef] [PubMed]
  38. Liao, H.; Xie, X.; Xu, Y.; Huang, G. Identification of driver genes associated with chemotherapy resistance of Ewing’s sarcoma. Onco Targets Ther. 2018, 11, 6947–6956. [Google Scholar] [CrossRef]
  39. Ke, X.X.; Zhang, D.; Zhu, S.; Xia, Q.; Xiang, Z.; Cui, H. Inhibition of H3K9 methyltransferase G9a repressed cell proliferation and induced autophagy in neuroblastoma cells. PLoS ONE 2014, 9, e106962. [Google Scholar] [CrossRef]
  40. Lu, Z.; Tian, Y.; Salwen, H.R.; Chlenski, A.; Godley, L.A.; Raj, J.U.; Yang, Q. Histone-lysine methyltransferase EHMT2 is involved in proliferation, apoptosis, cell invasion, and DNA methylation of human neuroblastoma cells. Anticancer Drugs 2013, 24, 484–493. [Google Scholar] [CrossRef]
  41. Bachman, K.E.; Park, B.H.; Rhee, I.; Rajagopalan, H.; Herman, J.G.; Baylin, S.B.; Kinzler, K.W.; Vogelstein, B. Histone modifications and silencing prior to DNA methylation of a tumor suppressor gene. Cancer Cell 2003, 3, 89–95. [Google Scholar] [CrossRef] [PubMed]
  42. Wozniak, R.J.; Klimecki, W.T.; Lau, S.S.; Feinstein, Y.; Futscher, B.W. 5-Aza-2’-deoxycytidine-mediated reductions in G9A histone methyltransferase and histone H3 K9 di-methylation levels are linked to tumor suppressor gene reactivation. Oncogene 2007, 26, 77–90. [Google Scholar] [CrossRef] [PubMed]
  43. Liu, F.; Barsyte-Lovejoy, D.; Li, F.; Xiong, Y.; Korboukh, V.; Huang, X.P.; Allali-Hassani, A.; Janzen, W.P.; Roth, B.L.; Frye, S.V.; et al. Discovery of an in vivo chemical probe of the lysine methyltransferases G9a and GLP. J. Med. Chem. 2013, 56, 8931–8942. [Google Scholar] [CrossRef] [PubMed]
Figure 1. Transcript levels of G9a (Ehmt2) and OS of patients with NB tumors of different INSS stage and MYCN status. G9a/Ehmt2 transcriptional levels were examined in transcriptome datasets comprising a total of 88 NB samples from patients [25] stratified by (A) INSS stage (St1, St2, St3, and St4) or (B) MYCN status (MYCN, MYCN single copy; MYCNA, MYCN-amplified). Samples were profiled on Affymetrix Human Genome U133 Plus 2.0 Array and normalized using the RMA method). Gene expression across all samples was normalized within the R2: Genomics Analysis and Visualization Platform (http://r2.amc.nl). All INSS groups and MYCN status (amplified, MYCNA; non-amplified, MYCN) in each dataset were compared by using a Kruskal–Wallis test for significance and Tukey’s tests for post hoc analysis using GraphPad Prism https://www.graphpad.com/featuresp < 0.001 was considered to indicate statistically significant differences. (C) OS of NB patients carrying tumors with high and low levels of G9a/Ehmt2 in all INSS stage groups and St4 INSS stage (upper panel); OS of NB patients carrying tumors with MYCN-non-amplified and MYCN-amplified (lower panel). OS was measured from the time of initial diagnosis to the date of death or the date of last follow-up using combined OS and gene expression data from all of the selected data sets. Survival distribution was estimated according to the Kaplan–Meier method using a median cut-off and log-rank statistics; p < 0.05 was considered statistically significant.
Ijms 24 15242 g001
Figure 2. Transcript levels of GLP (Ehmt1) and OS in patients with NB tumors of different INSS stage and MYCN status. GLP/Ehmt1 transcriptional levels were examined in transcriptome datasets comprising a total of 88 NB samples from patients [25] stratified by (A) INSS stage (St1, St2, St3, and St4) or (B) MYCN status (MYCN, MYCN single copy; MYCNA, MYCN-amplified). Samples were profiled on Affymetrix Human Genome U133 Plus 2.0 Array and normalized using the RMA method. Gene expression across all samples was normalized within the R2: Genomics Analysis and Visualization Platform (http://r2.amc.nl). All INSS groups and MYCN status (amplified, MYCNA; non-amplified, MYCN) in each dataset were compared by using a Kruskal–Wallis test for significance and Tukey’s tests for post hoc analysis using GraphPad Prism; p < 0.001 was considered to indicate statistically significant differences. (C) OS of NB patients carrying tumors with high and low levels of GLP/Ehmt1 in all INSS stage groups and St4 INSS stage (upper panel); OS of NB patients carrying tumors with MYCN non-amplified and MYCN amplified (lower panel). OS was measured from the time of initial diagnosis to the date of death or the date of last follow up by using combined OS and gene expression data from all of the selected data sets. Survival distribution was estimated according to the Kaplan–Meier method by using a median cut-off and log-rank statistics; p < 0.05 was considered statistically significant.
Ijms 24 15242 g002
Figure 3. Transcript levels of G9a (Ehmt2) and OS in patients with ES tumors of different disease status. (A) G9a/Ehmt2 transcriptional levels were examined in transcriptome datasets comprising a total of 37 ES tumor samples [26], and data were profiled according to the Affymetrix GeneChip Expression Analysis Technical Manual using HG-U133 Plus 2.0 Array. Analysis in (B) 83 [27] and (C) 64 ES samples [28] from patients from different cohorts. Gene expression of the markers across all samples was normalized within the R2: Genomics Analysis and Visualization Platform (http://r2.amc.nl); p < 0.001 was considered to indicate statistically significant differences. ND—no evidence of disease. (D) OS of ES patients carrying tumors with high and low levels of G9a/Ehmt2. OS was measured from the time of initial diagnosis to the date of death or the date of last follow-up using combined OS and gene expression data from all of the selected data sets. Survival distribution was estimated according to the Kaplan–Meier method using a median cut-off and log-rank statistics; p < 0.05 was considered statistically significant.
Ijms 24 15242 g003
Figure 4. Transcript levels of GLP (Ehmt1) and OS in patients with ES tumors of different disease status. (A) GLP/Ehmt1 transcriptional levels were examined in transcriptome datasets comprising a total of 37 ES tumor samples [26] and (B) 64 ES tumor samples from the Savola cohort [25]. Data were profiled according to the Affymetrix GeneChip Expression Analysis Technical Manual by using HG-U133 Plus 2.0 Array. Gene expression of the markers across all samples was normalized within the R2: Genomics Analysis and Visualization Platform (http://r2.amc.nl); p < 0.001 was considered to indicate statistically significant differences. ND—no evidence of disease. (C) OS of 64 ES patients from the Savola cohort [25] carrying tumors with high and low levels of GLP (Ehmt1). OS was measured from the time of initial diagnosis to the date of death or date of last follow-up using combined OS and gene expression data from all of the selected data sets. Survival distribution was estimated according to the Kaplan–Meier method using a median cut-off and log-rank statistics; p < 0.05 was considered statistically significant.
Ijms 24 15242 g004
Figure 5. Correlation between G9a/Ehmt2 and GLP/Ehmt1 in NB tumors of different (A) INSS stages and (B) MYCN status. The straight line indicates the least squared error regression line. A correlation was calculated with Pearson’s product–moment correlation. Statistical significance was assessed with a paired t-test. Different colors indicate cancer stages. For the MYCN plot, a triangle shape indicates MYCN-amplified, and a circle shape indicates non-MYCN-amplified; r and p values are indicated.
Ijms 24 15242 g005
Figure 6. The G9a/GLP inhibitor UNC0642 reduces the viability of human NB and ES cells. Viability of (A) SH-SY5Y, (B) SK-N-Be(2), (C) SK-ES1, and (D) RD-ES human cells treated with 9 different concentrations (ranging from 0.1 to 30 μM) of UNC0642 for 24, 48, 72, or 96 h. Cell viability was assessed by using the Trypan blue exclusion method in a Neubauer chamber. All assays were performed in triplicate and repeated in three independent sets. For EC50 calculation, data were fitted in a dose response curve (GraphPad Prism) using the equation: y = min + (max − min)/(1 + 10^((LogEC50 − x)*Hillslope + Log ((maxmin)/(50 − min) − 1))). (E) Heatmap showing EC50 (μM). The color key represents the average EC50 (μM) values: purple indicates low EC50, whereas yellow indicates high EC50. The EC50 doses ranged from 2.3 to 11.8 μM. The average EC50 was calculated based on the cell count of 3 biological replicates across NB and ES cell lines at 24, 48, 72, or 96 h using GraphPad Prism. (F) A representative image showing the effect of UNC0642 on cell viability reduction and altered cell morphology after treatment with 3.8 μM for NB SH-SY5Y and SK-N-Be(2) cells and ES RD-ES cells; and 7.5 μM for SK-ES1 cells at 96 h. Scale bars, 200 μm.
Ijms 24 15242 g006
Figure 7. Expression of G9a/Ehmt2 and GLP/Ehmt1 in NB and ES cells, as well as human fibroblasts. (A) G9a/Ehmt2 and (B) GLP/Ehmt1 mRNA was assessed via qRT-PCR in the fibroblast line MRC-5, NB cell lines SH-SY5Y and SK-N-Be(2), and ES cell lines SK-ES1 and RD-ES. The mean Ct value for each gene was calculated relative to ACTB from experiments performed in triplicate. One-way ANOVA followed by Tukey’s post hoc tests was used; p values compared to control cells are indicated in the figure.
Ijms 24 15242 g007
Table 1. EC50 values (μM) of NB and ES cells treated with the G9a/GLP inhibitor UNC0642.
Time (h)SH-SY5YSK-N-Be(2)SK-ES 1ED-ES
244.5 ± 0.084.5 ± 0.091.9 ± 0.072.6 ± 0.09
486.0 ± 0.074.2 ± 0.074.6 ± 0.062.3 ± 0.06
725.3 ± 0.062.4 ± 0.077.5 ± 0.072.0 ± 0.10
963.3 ± 0.082.0 ± 0.107.4 ± 0.082.6 ± 0.07
Values are means ± SEM of n = 3.
Table 2. Primers used for qRT-PCR measurement of gene expression.
GenePrimers
Ehmt1primer sense 5′-GCT GCT GGG AGA AGA GAC AC-3′
primer anti-sense 5′-AGC ATT TGC ATG ACT GCT GG-3′
G9a/Ehmt2primer sense 5′-GAG GTC TAC TGC ATA GAT GCC-3′
primer anti-sense 5′-CAG ACG GTC CTG CTC CAG GGC-3′
ACTBprimer sense 5′-AAC TGG AAC GGT GAA GGT G-3′
primer anti-sense 5′-AGA GAA GTG GGG TGG CTT TT-3′
Disclaimer/Publisher’s Note: The statements, opinions and data contained in all publications are solely those of the individual author(s) and contributor(s) and not of MDPI and/or the editor(s). MDPI and/or the editor(s) disclaim responsibility for any injury to people or property resulting from any ideas, methods, instructions or products referred to in the content.

