

Morpho-Functional Characterisation of the Rat Ventral Caudal Nerve in a Model of Axonal Peripheral Neuropathy

 , ,
, ,  , ,
, ,  and
and 
Abstract
1. Introduction
2. Results
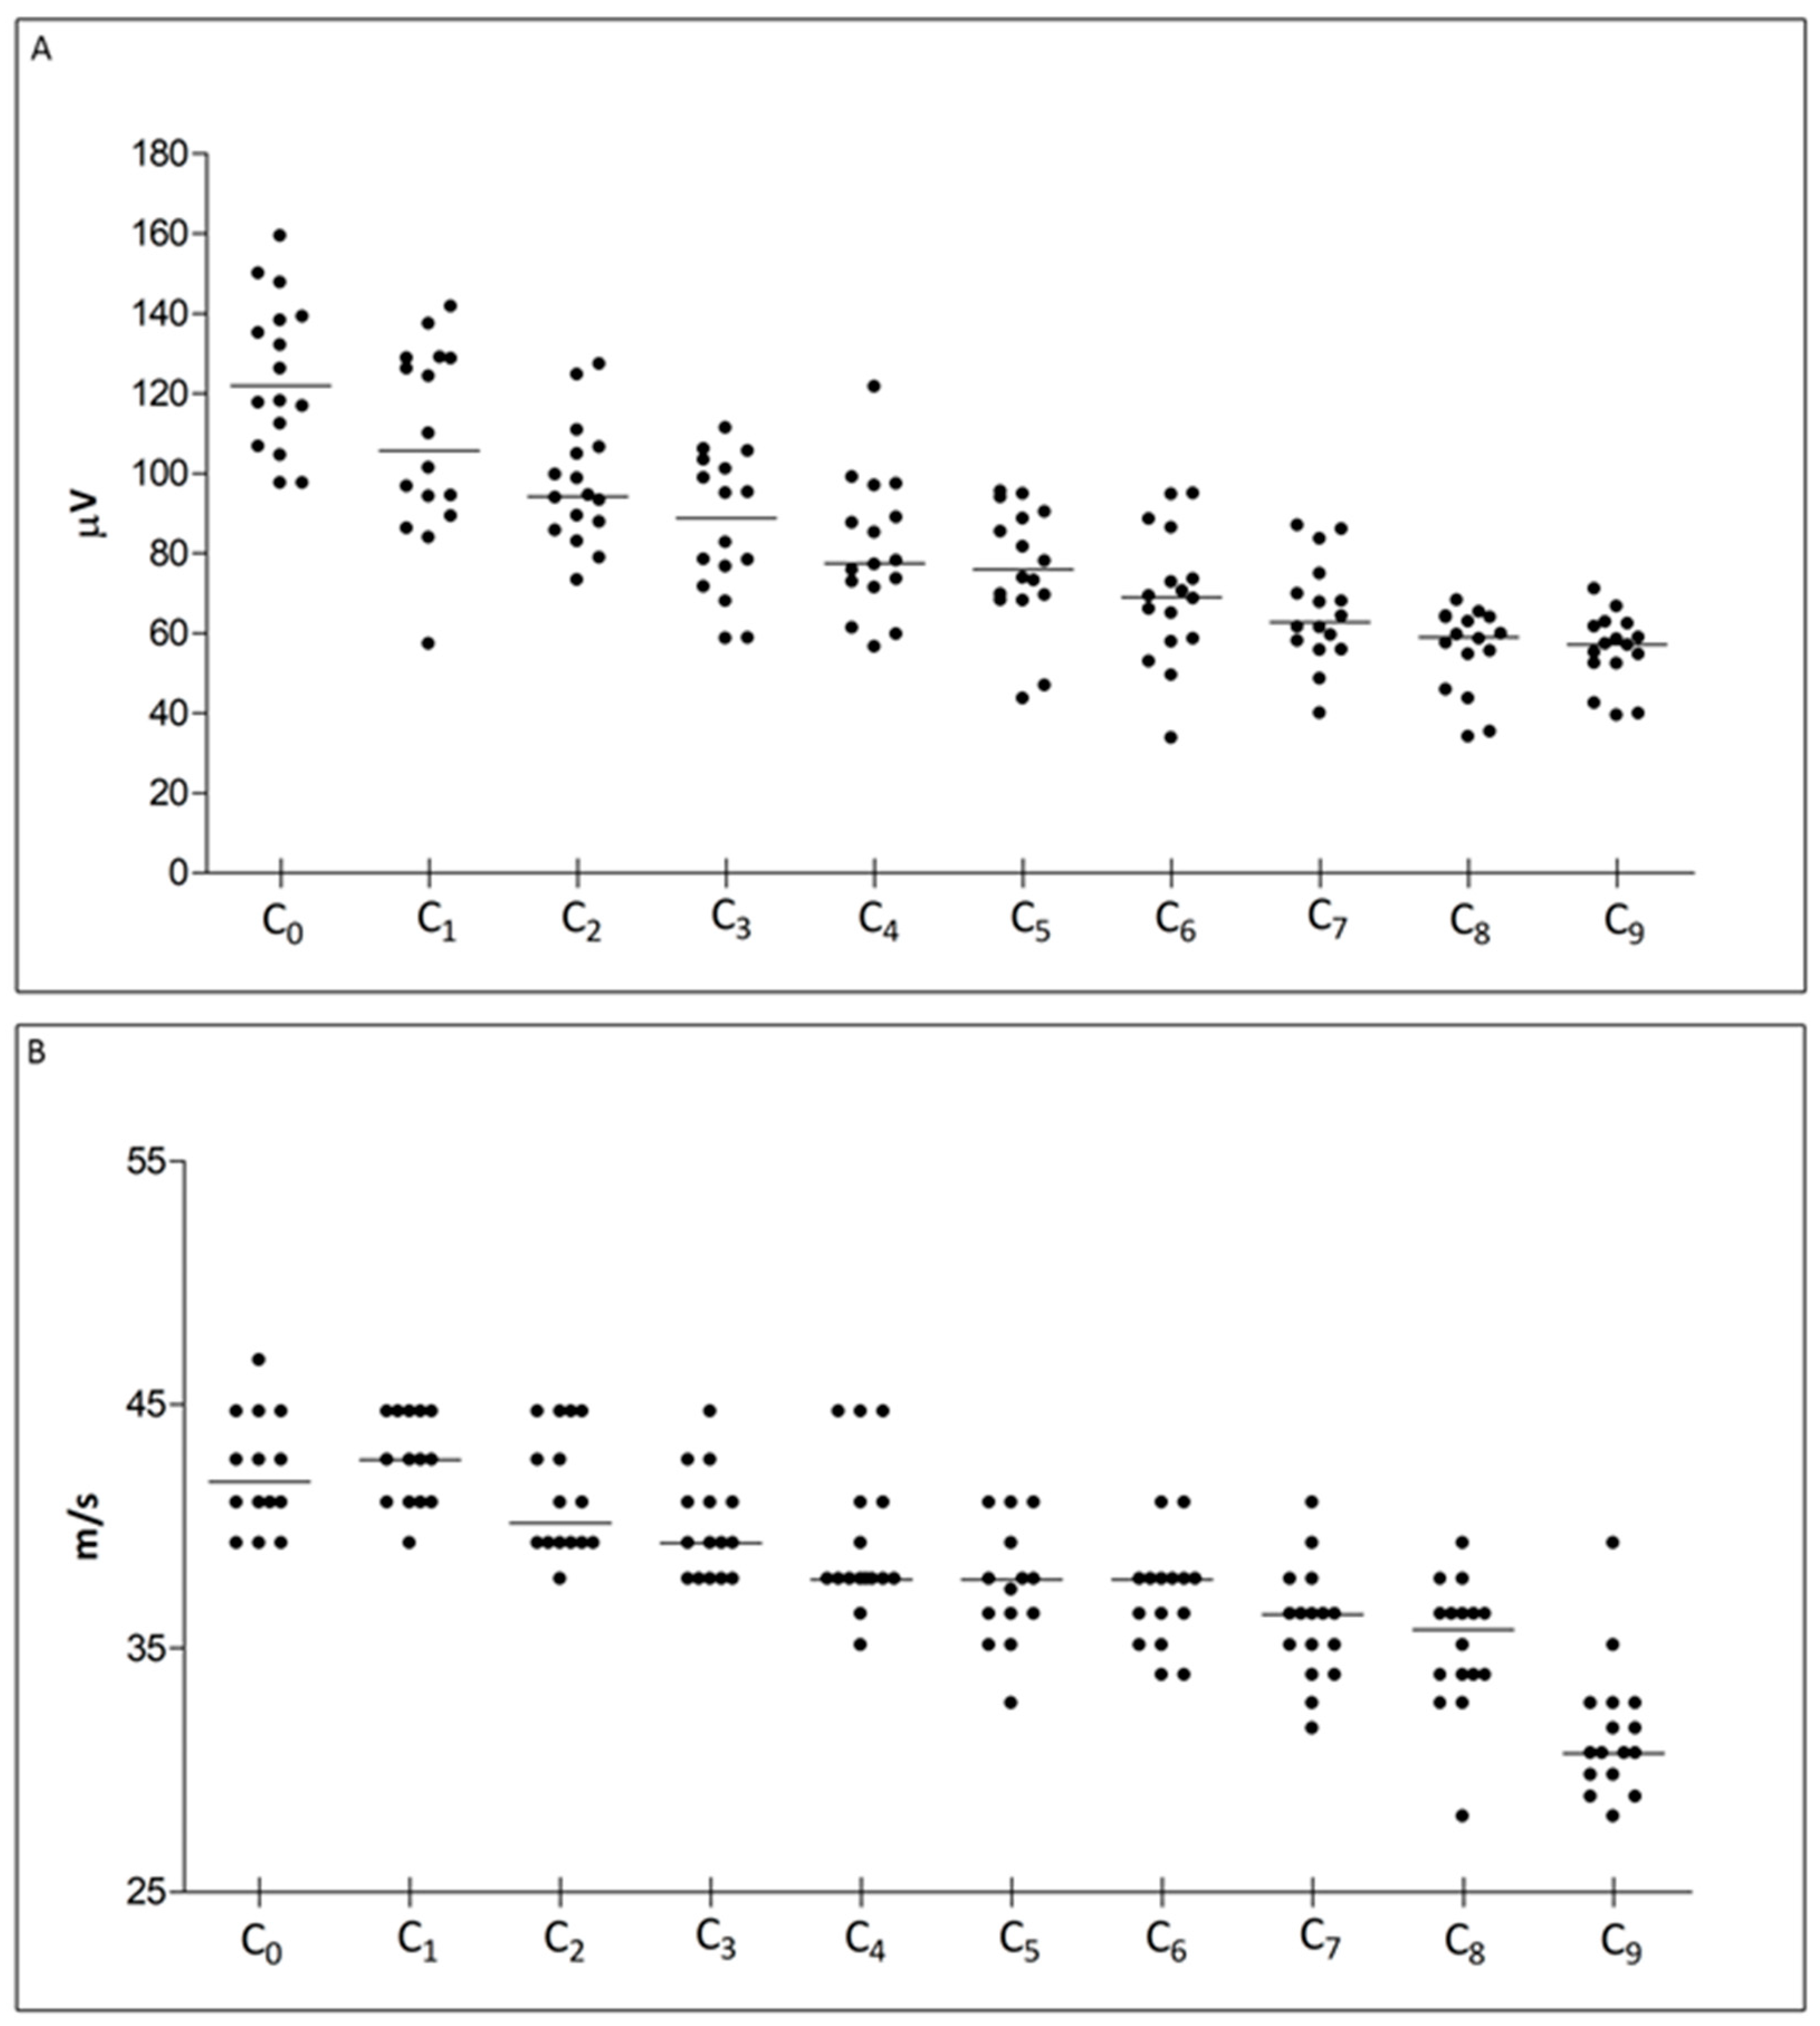
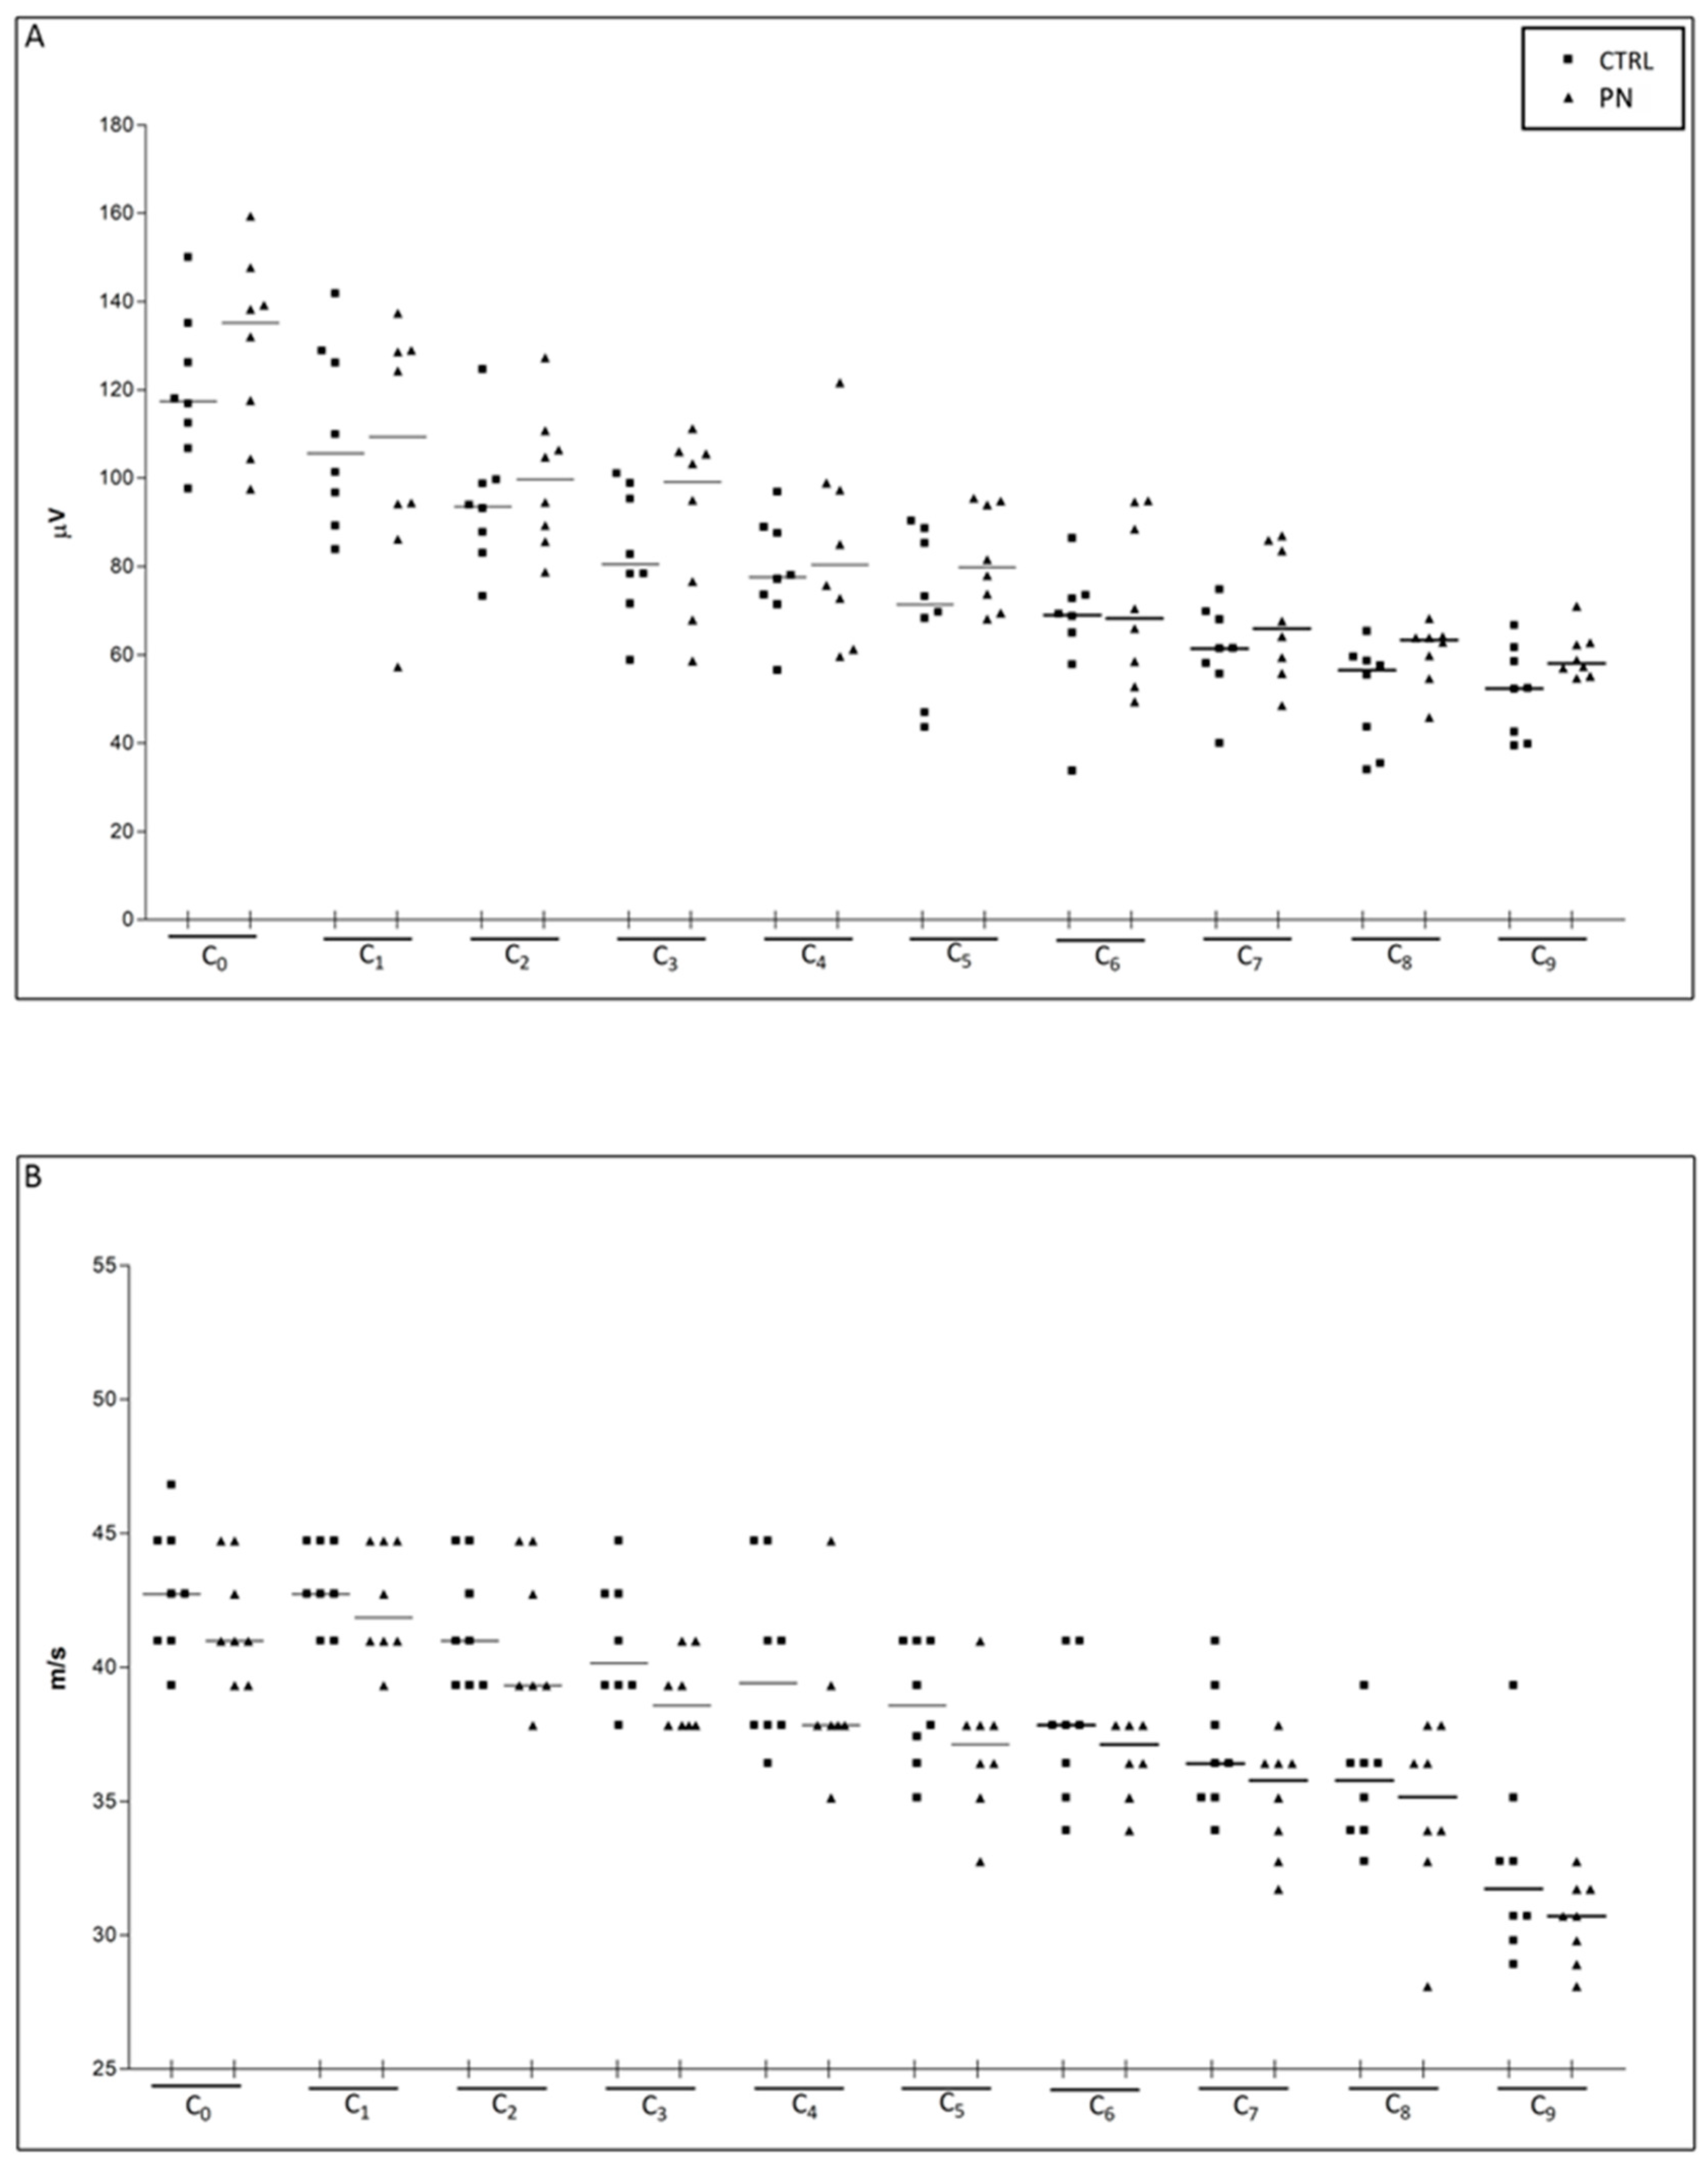
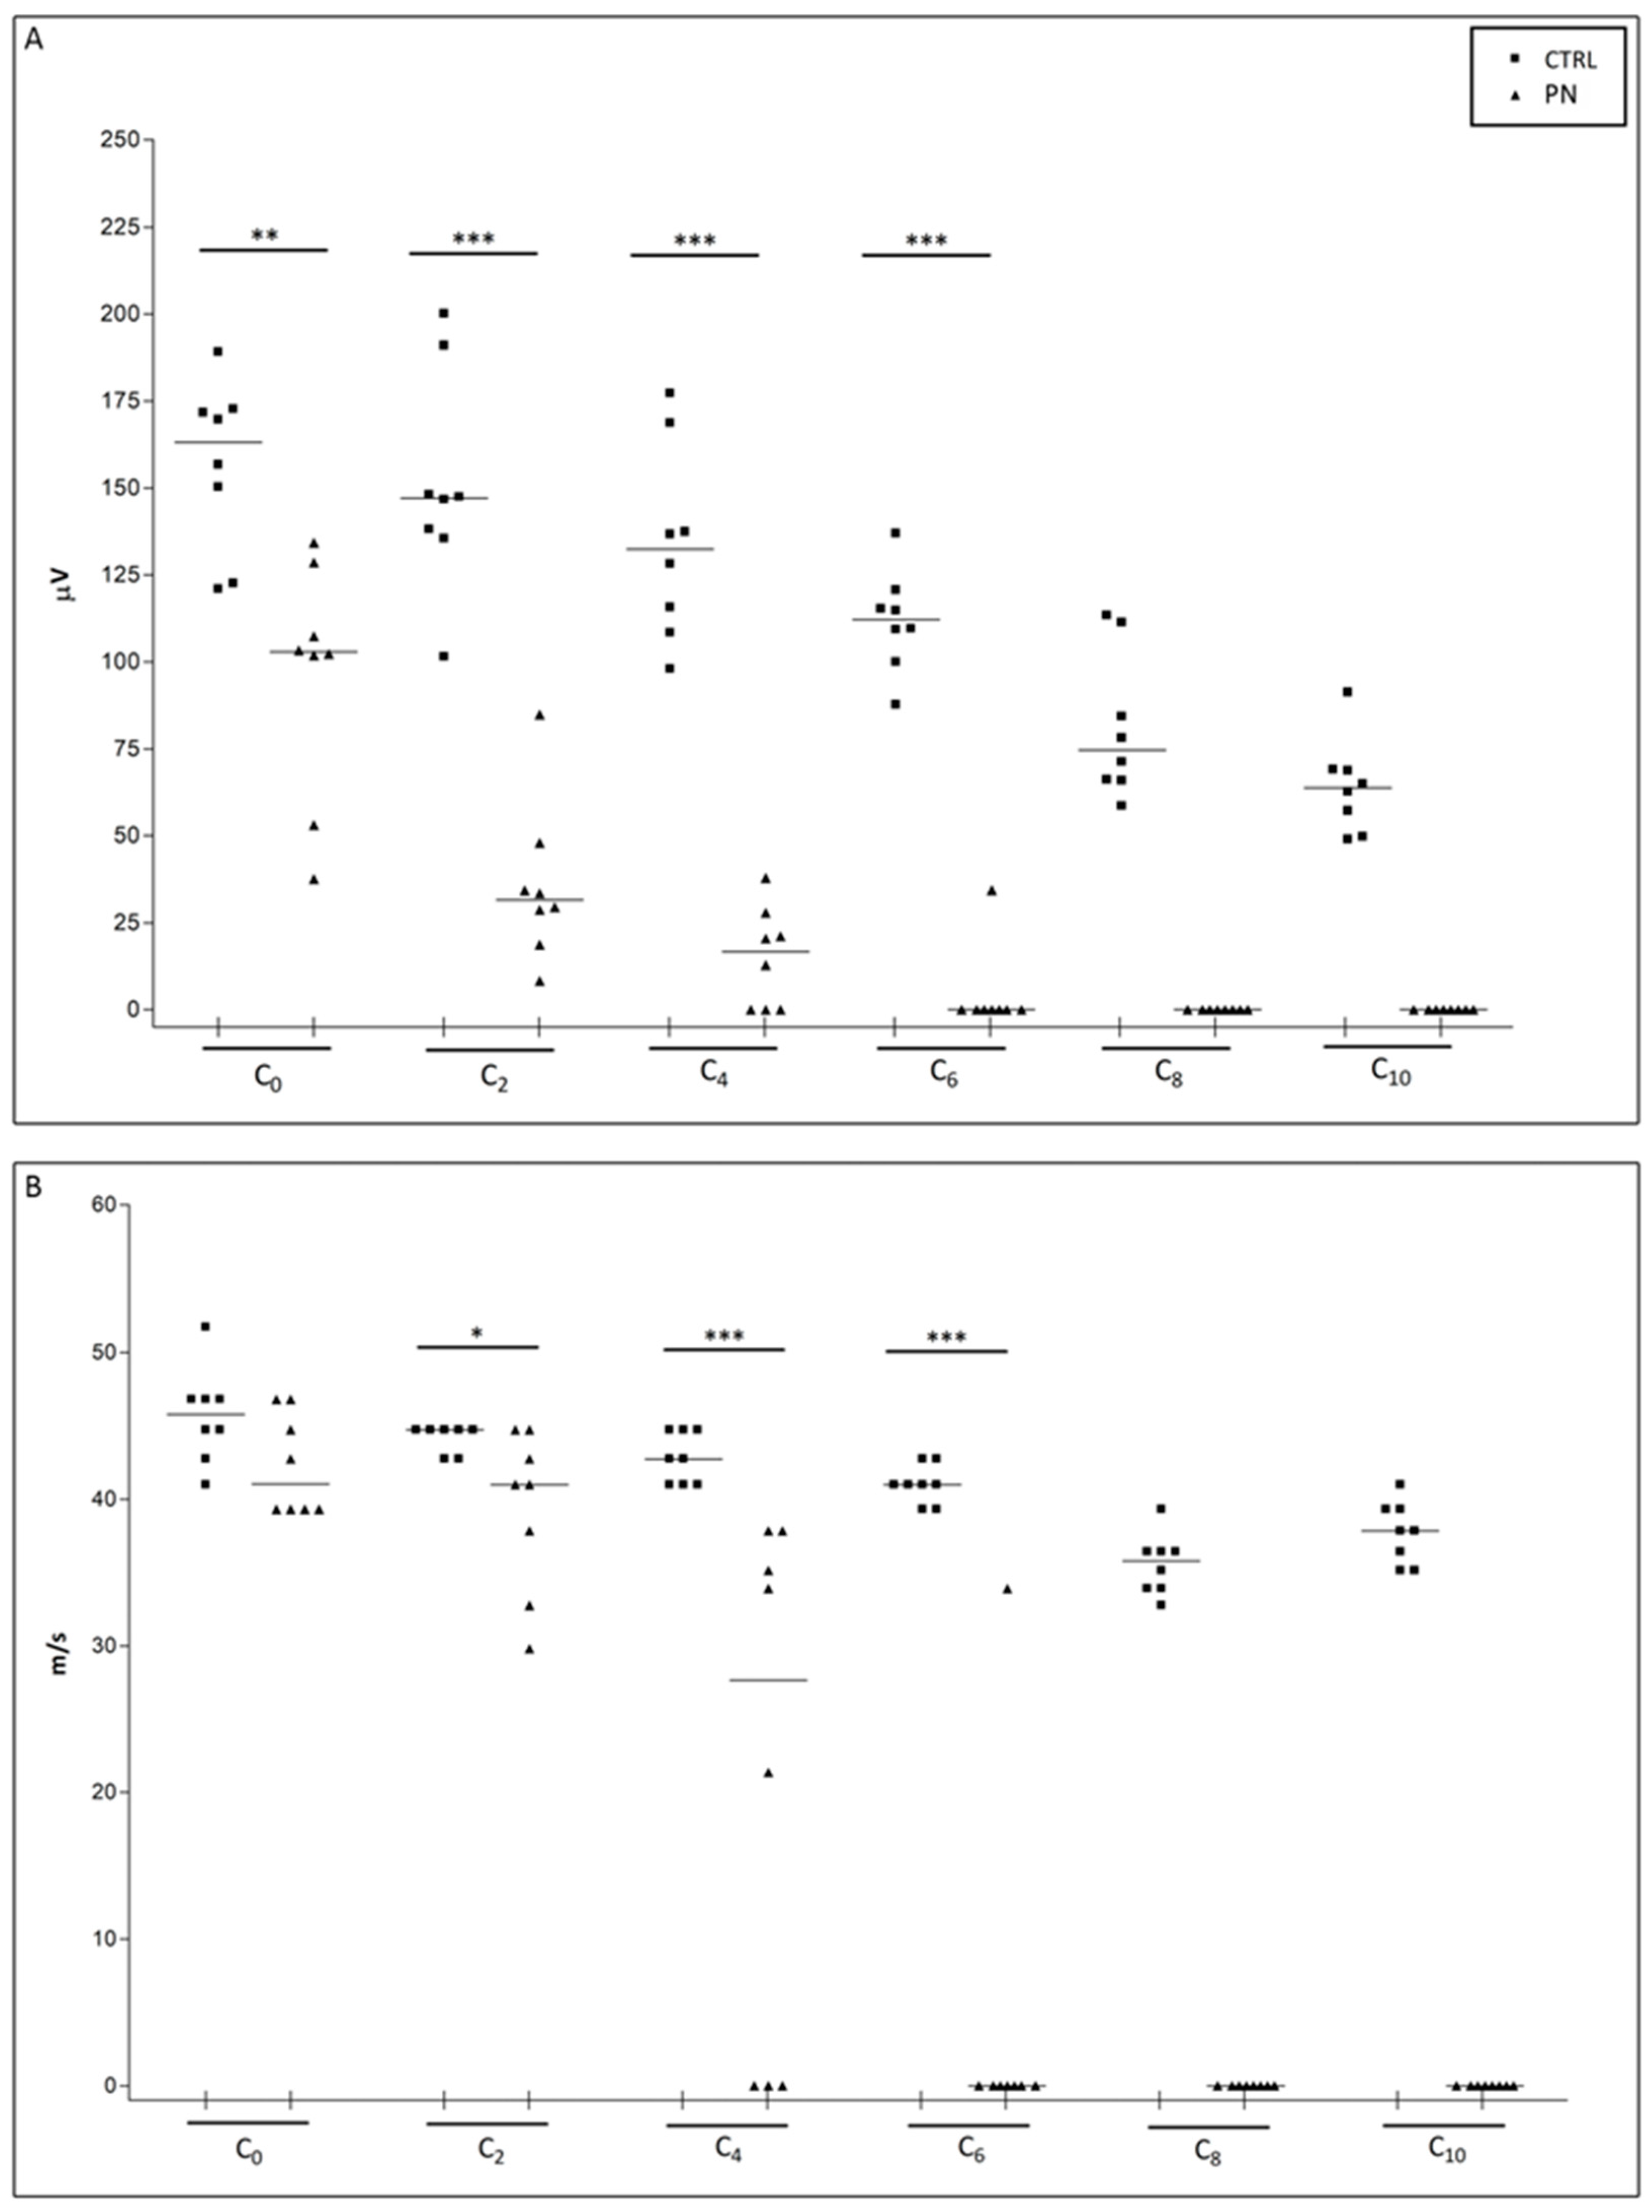
2.1. NCS
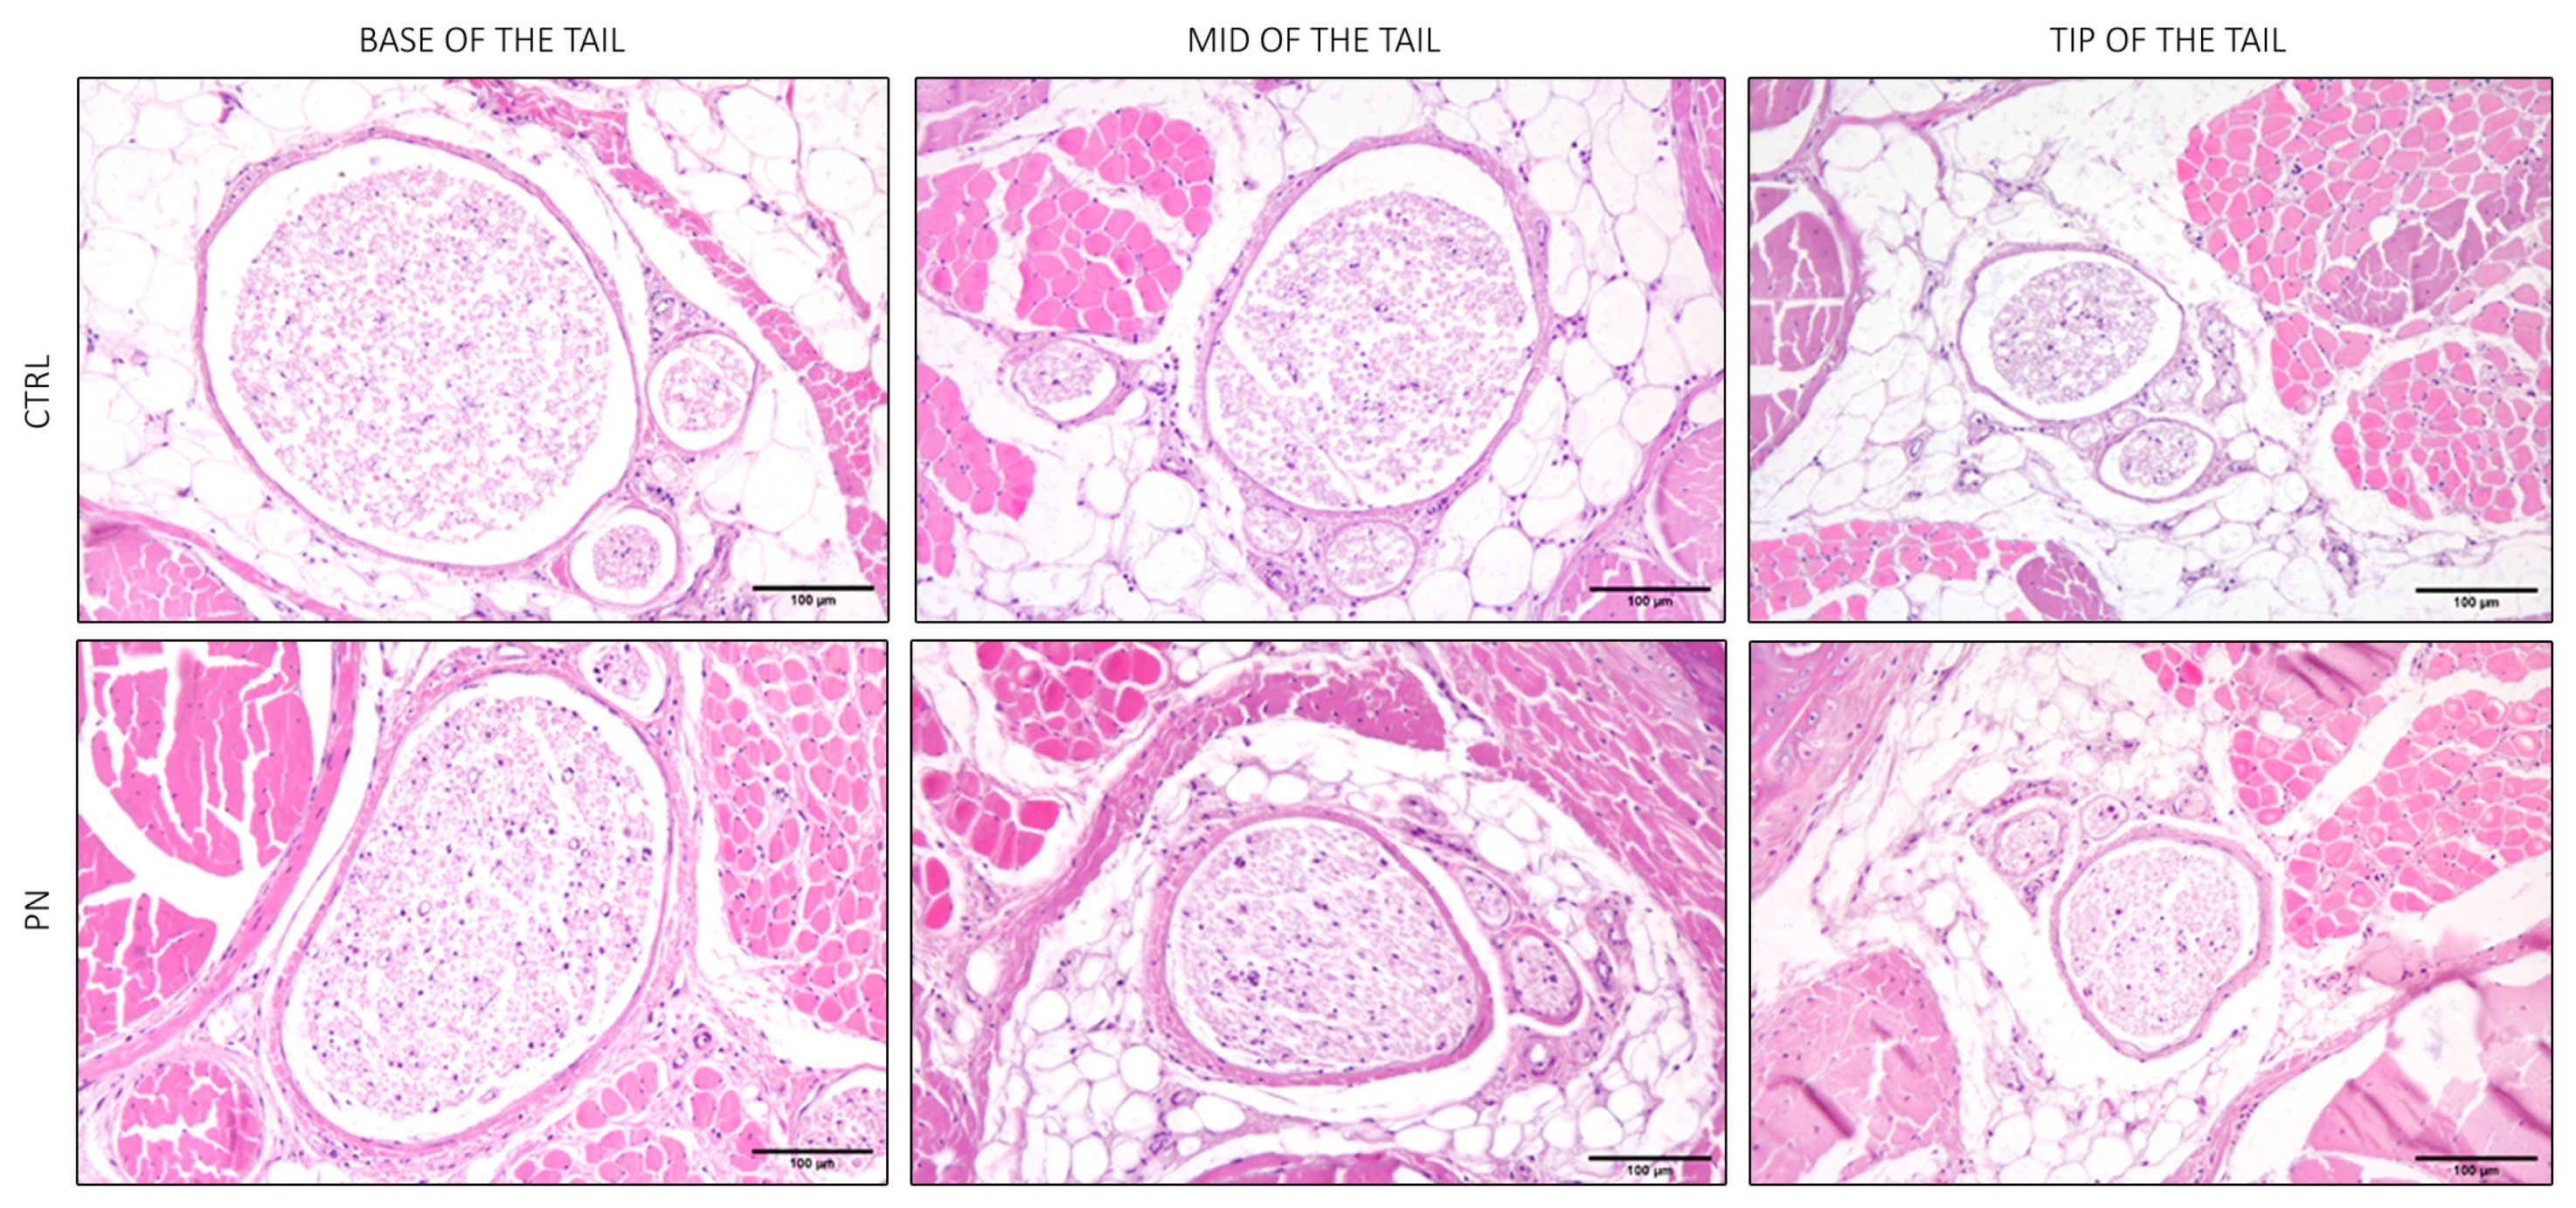
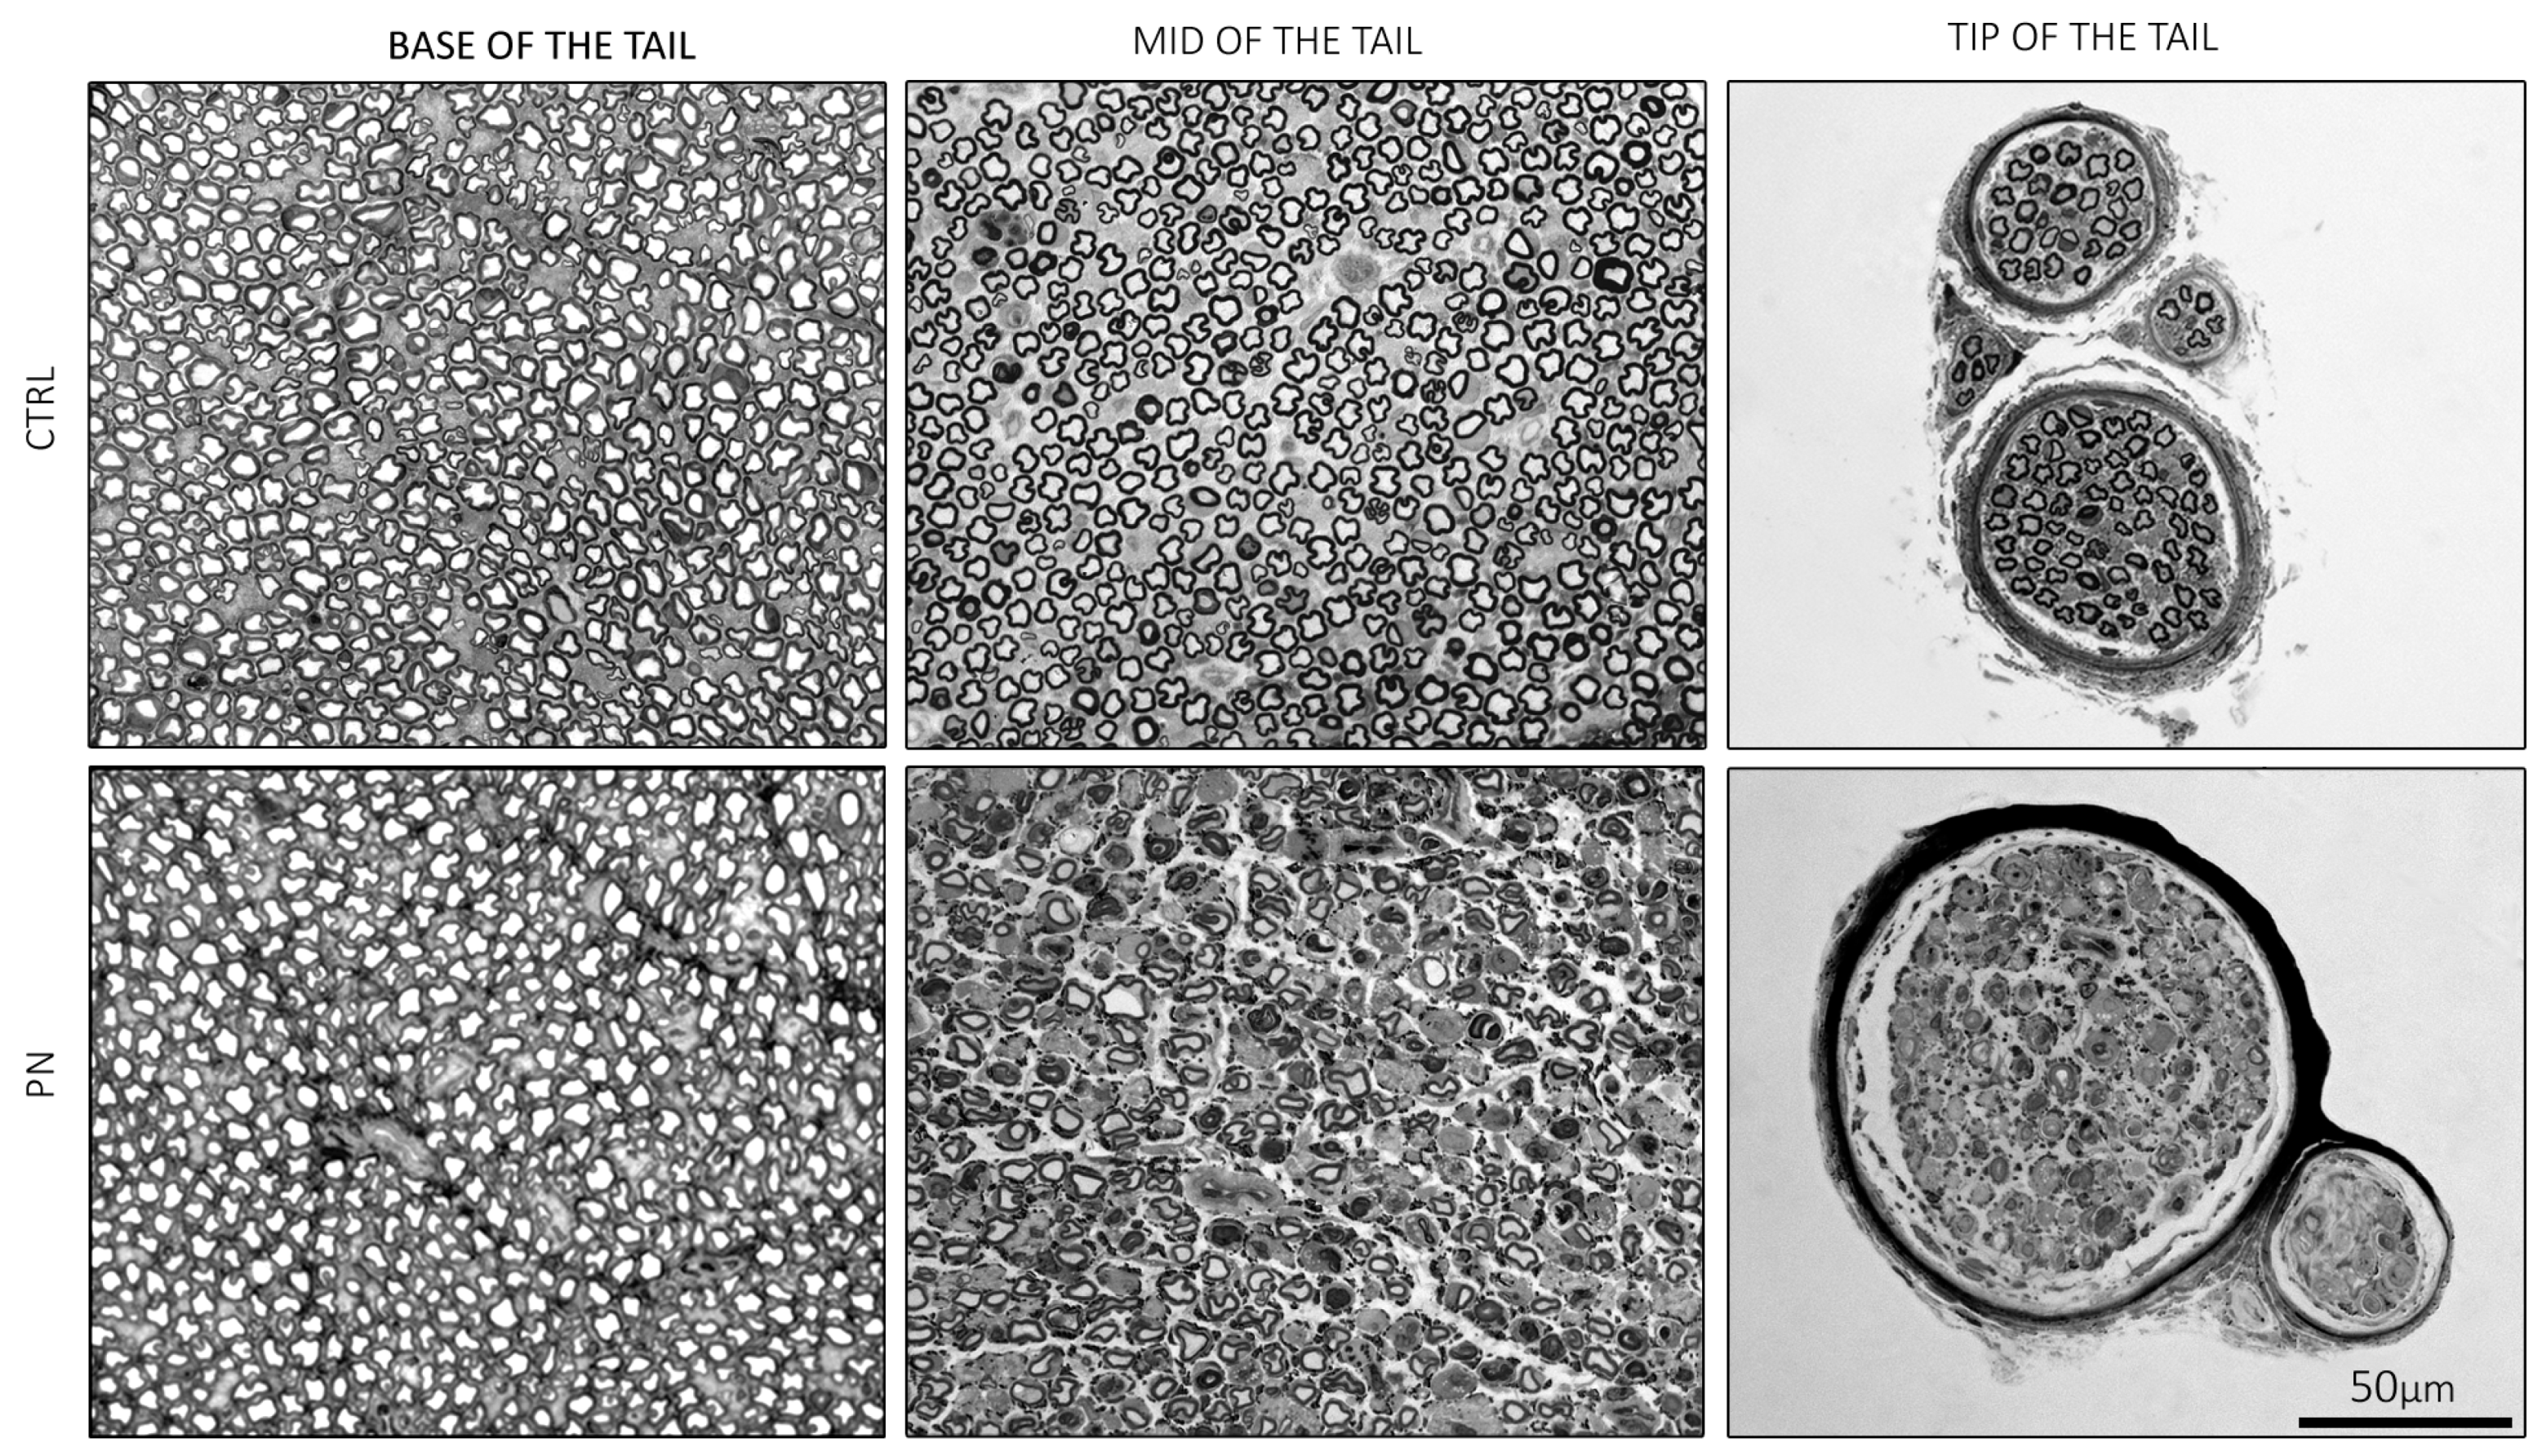
2.2. Light Microscopy of the Whole Tails
2.3. Light Microscopy of the Isolated Ventral Caudal Nerve
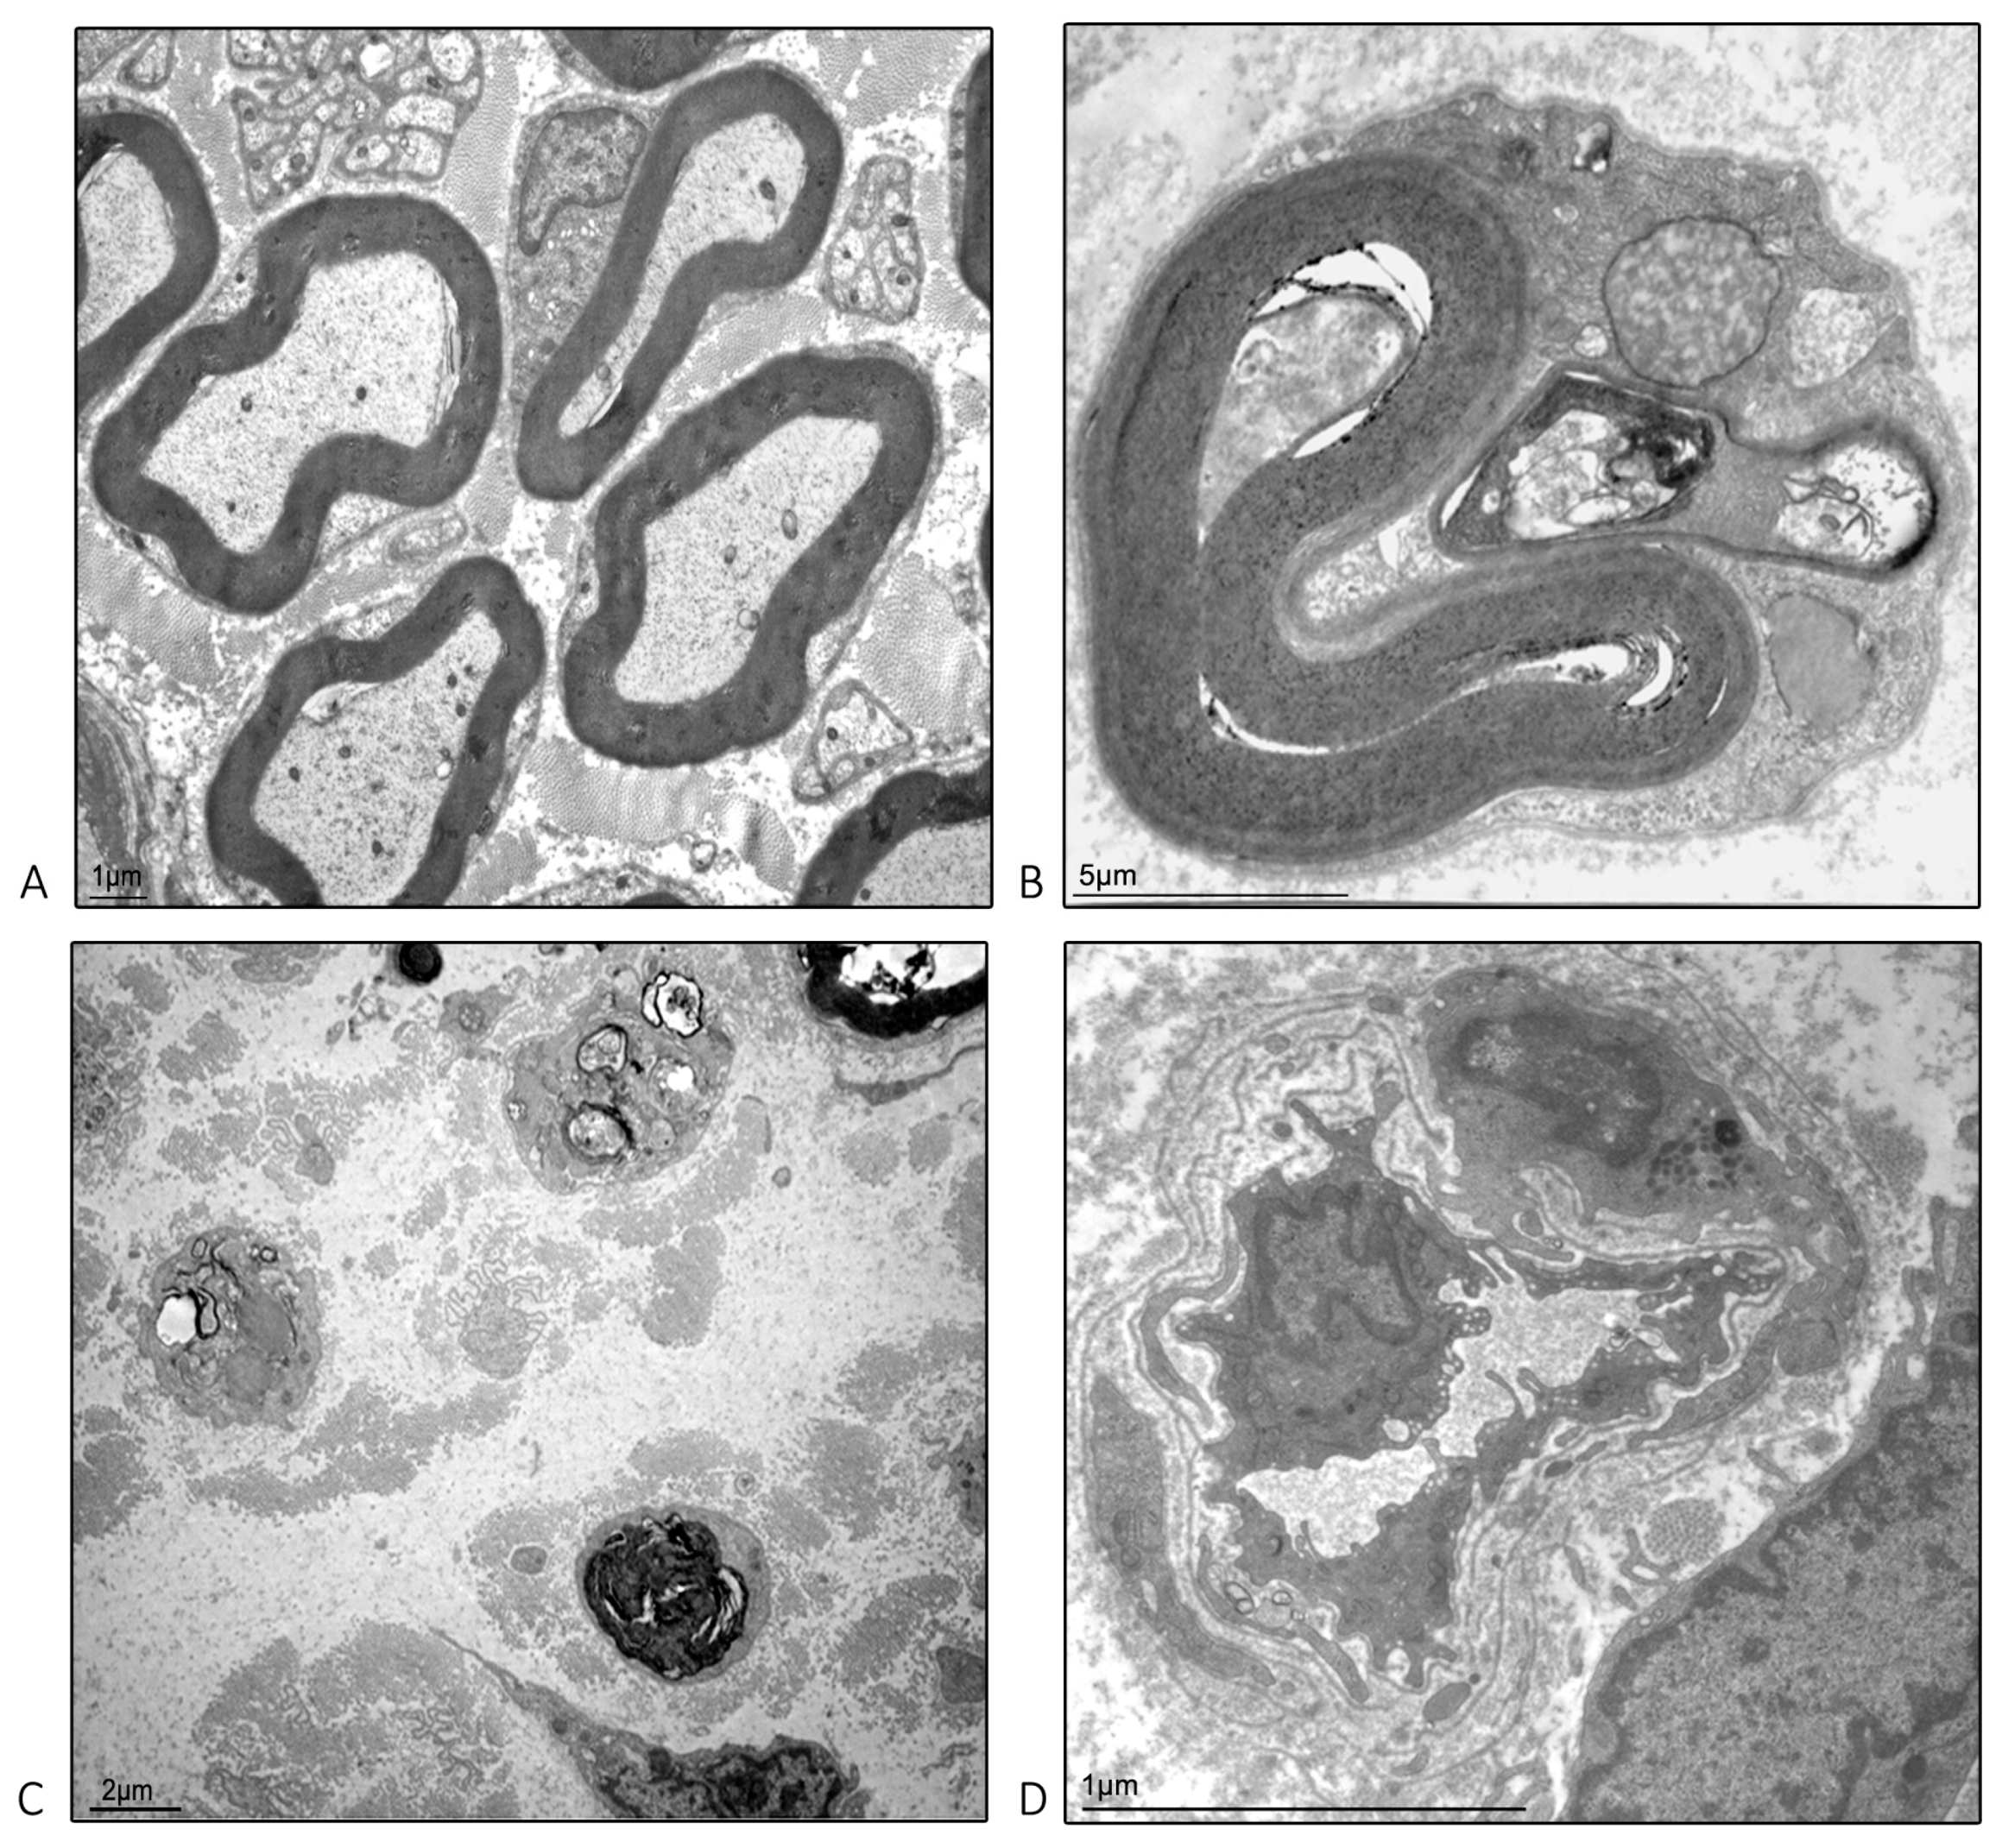
2.4. Ultrastructural Examination Microscopy of the Isolated Caudal Nerve
3. Discussion
4. Materials and Methods
4.1. Animals and Housing
4.2. Drugs
4.3. Study Design
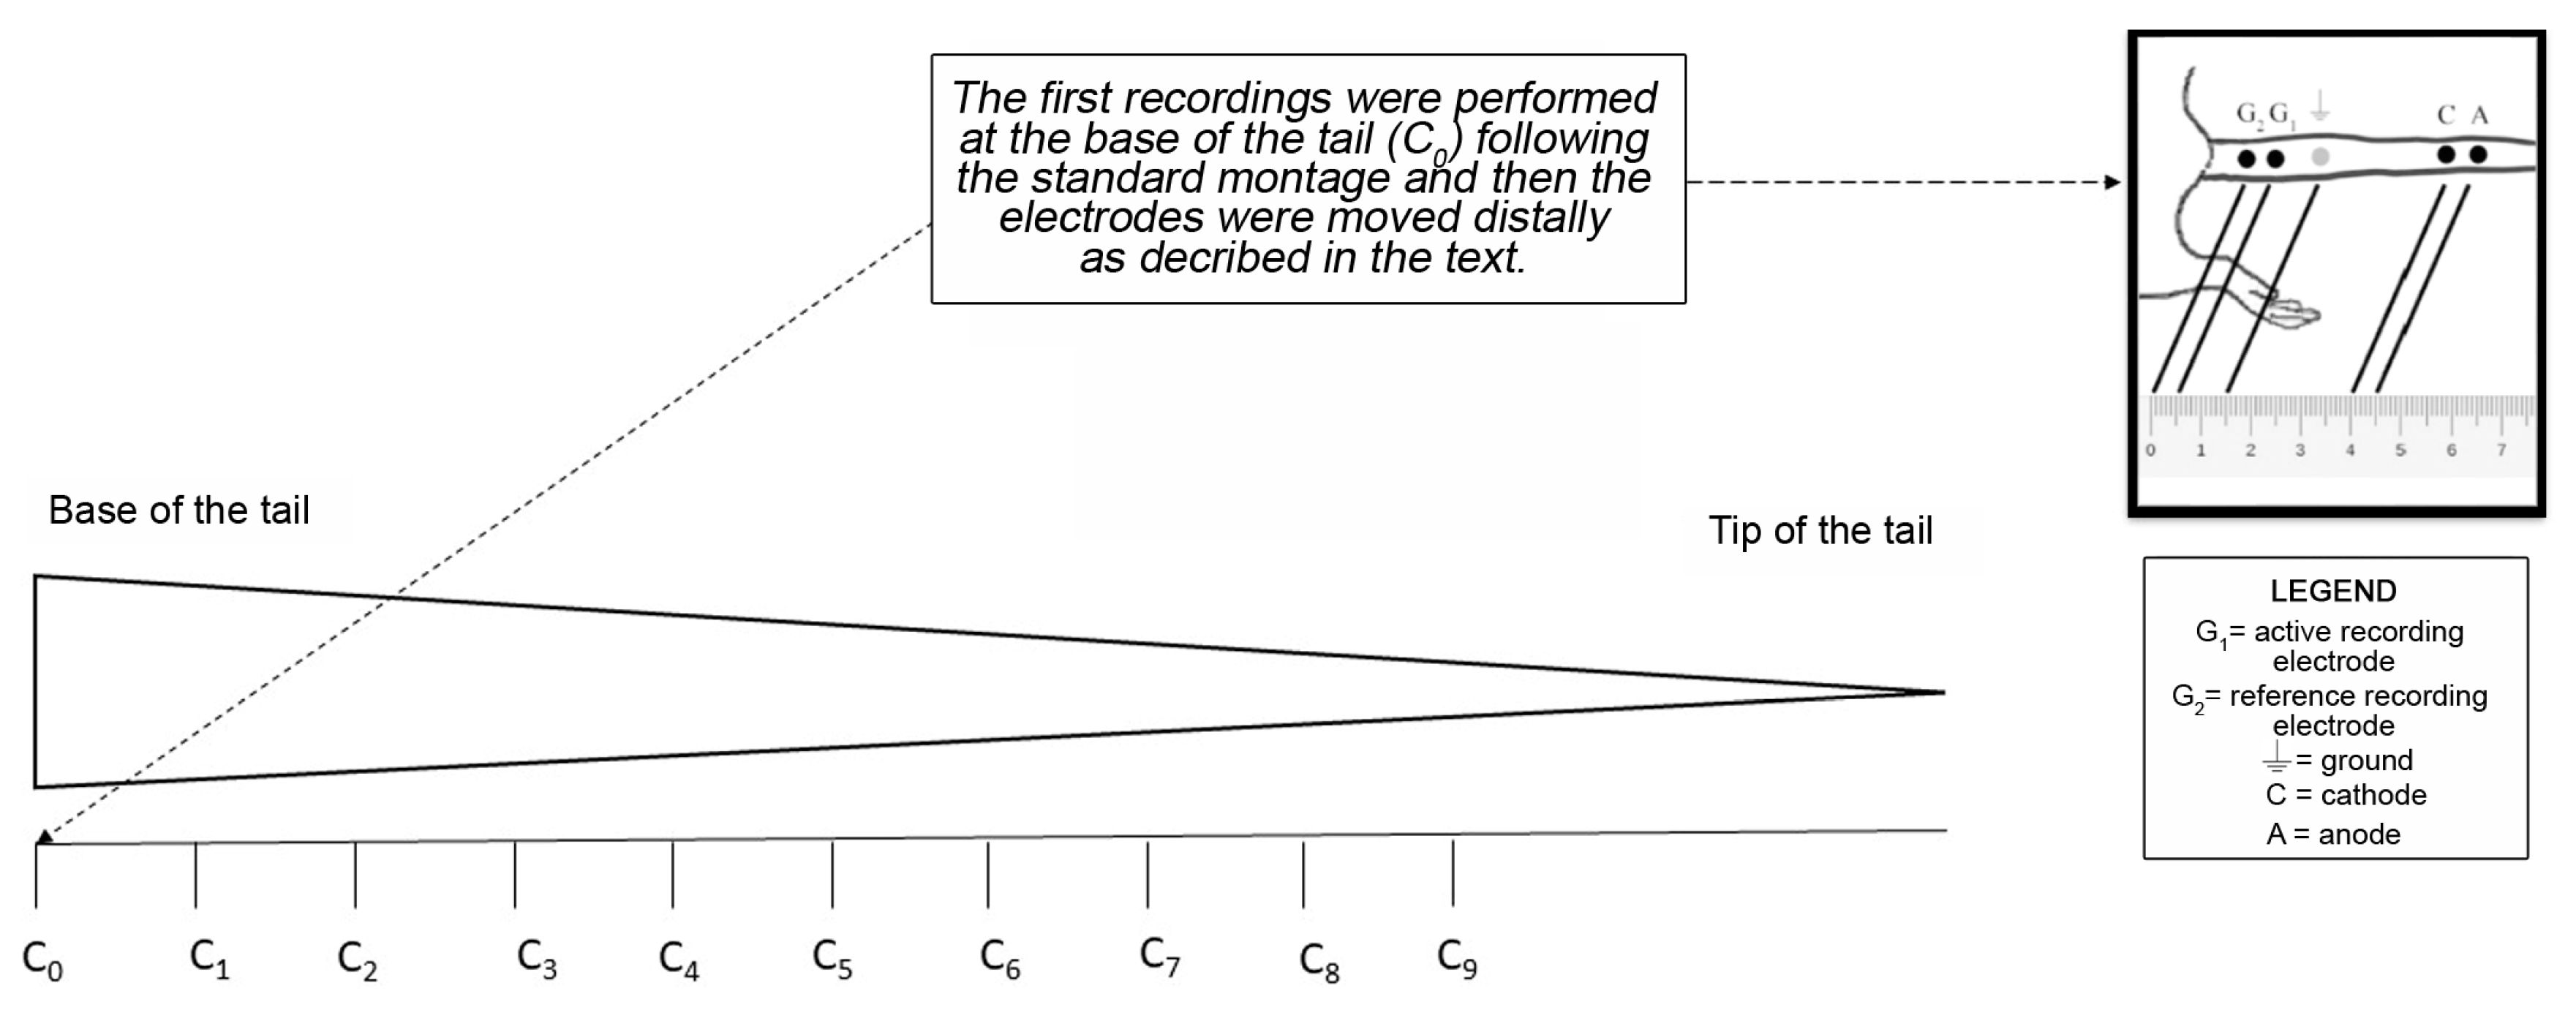
4.4. Nerve Conduction Studies (NCS) of the Caudal Nerve for the Whole Length of the Tail
4.5. Sample Harvesting and Processing for Light and Electron Microscopy
4.6. Light Microscopy Observations—Whole Tails
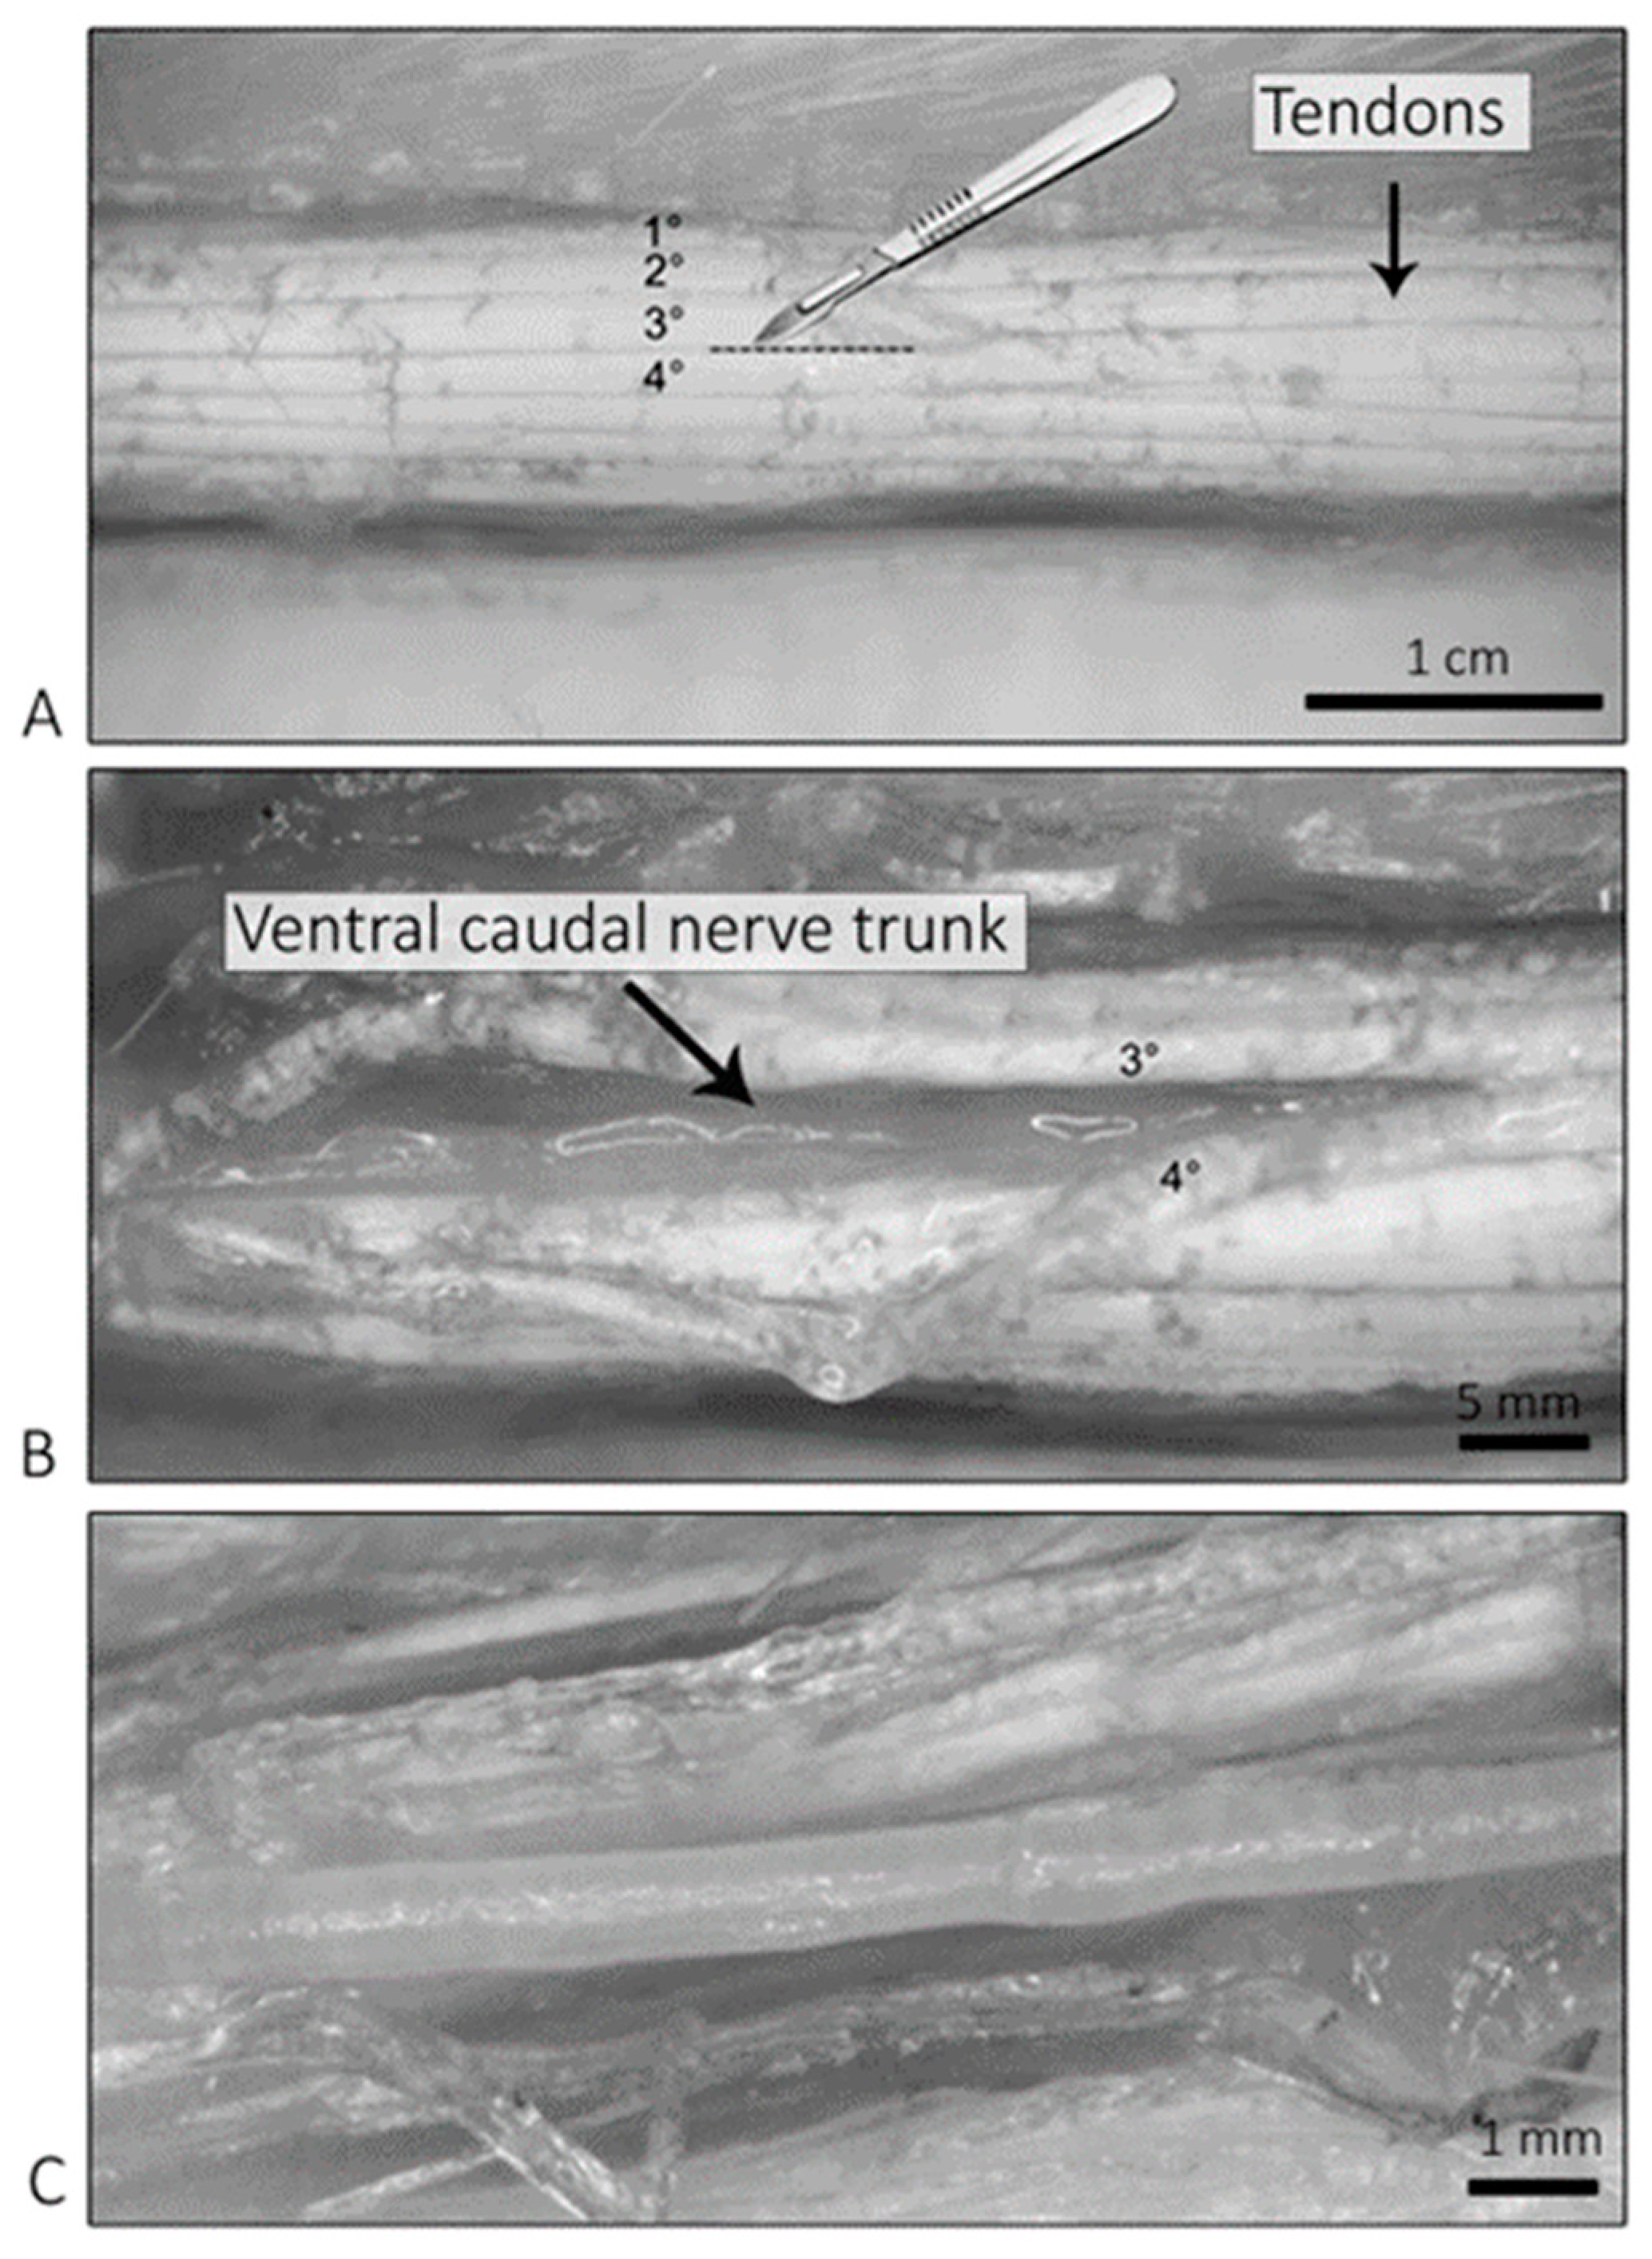
4.7. Light Microscopy Observations—Isolated Caudal Nerves
4.8. Electron Microscopy Observations—Isolated Caudal Nerve
4.9. Statistical Analysis
5. Conclusions
Author Contributions
Funding
Institutional Review Board Statement
Informed Consent Statement
Data Availability Statement
Conflicts of Interest
References
- Mold, J.W.; Vesely, S.K.; Keyl, B.A.; Schenk, J.B.; Roberts, M. The prevalence, predictors, and consequences of peripheral sensory neuropathy in older patients. J. Am. Board. Fam. Pract. 2004, 17, 309–318. [Google Scholar] [CrossRef] [PubMed]
- Barrell, K.; Smith, A.G. Peripheral Neuropathy. Med. Clin. N. Am. 2019, 103, 383–397. [Google Scholar] [CrossRef] [PubMed]
- Scuteri, A.; Cavaletti, G. How can neuroplasticity be utilized to improve neuropathy symptoms? Expert Rev. Neurother. 2016, 16, 1235–1236. [Google Scholar] [CrossRef] [PubMed]
- Schaumburg, H.H.; Zotova, E.; Raine, C.S.; Tar, M.; Arezzo, J. The rat caudal nerves: A model for experimental neuropathies. J. Peripher. Nerv. Syst. 2010, 15, 128–139. [Google Scholar] [CrossRef] [PubMed]
- Swain, S.M.; Arezzo, J.C. Neuropathy associated with microtubule inhibitors: Diagnosis, incidence, and management. Clin. Adv. Hematol. Oncol. 2008, 6, 455–467. [Google Scholar]
- Bruna, J.; Alberti, P.; Calls-Cobos, A.; Caillaud, M.; Damaj, M.I.; Navarro, X. Methods for in vivo studies in rodents of chemotherapy induced peripheral neuropathy. Exp. Neurol. 2020, 325, 113154. [Google Scholar] [CrossRef]
- Alberti, P.; Lehmann, H.C. Chemotherapy induced peripheral neurotoxicity: Six essential articles for effective future research. Exp. Neurol. 2021, 337, 113555. [Google Scholar] [CrossRef]
- Alberti, P. Role of neurophysiology in Chemotherapy-Induced Peripheral Neuropathy (CIPN). Clin. Neurophysiol. 2020, 131, 1964–1965. [Google Scholar] [CrossRef]
- Alberti, P. Chemotherapy-induced peripheral neurotoxicity-outcome measures: The issue. Expert Opin. Drug Metab. Toxicol. 2016, 13, 241–243. [Google Scholar] [CrossRef]
- Monza, L.; Fumagalli, G.; Chiorazzi, A.; Alberti, P. Translating morphology from bench side to bed side via neurophysiology: 8-min protocol for peripheral neuropathy research. J. Neurosci. Methods 2021, 363, 109323. [Google Scholar] [CrossRef]
- Meregalli, C.; Monza, L.; Chiorazzi, A.; Scali, C.; Guarnieri, C.; Fumagalli, G.; Alberti, P.; Pozzi, E.; Canta, A.; Ballarini, E.; et al. Human Intravenous Immunoglobulin Alleviates Neuropathic Symptoms in a Rat Model of Paclitaxel-Induced Peripheral Neurotoxicity. Int. J. Mol. Sci. 2021, 22, 1058. [Google Scholar] [CrossRef] [PubMed]
- Canta, A.; Meregalli, C.; Chiorazzi, A.; Carozzi, V.A.; Crippa, L.; Marmiroli, P.; Cavaletti, G. The ventral caudal nerve: A physiologic-morphometric study in three different rat strains. J. Peripher. Nerv. Syst. 2010, 15, 140–146. [Google Scholar] [CrossRef] [PubMed]
- Thompson, J. Parallel spindle systems in the small muscles of the rat tail. J. Physiol. 1970, 211, 781–799. [Google Scholar] [CrossRef] [PubMed]
- Petajan, J.H. Changes in rat ventral caudal nerve conduction velocity during cold exposure. Am. J. Physiol. 1968, 214, 130–132. [Google Scholar] [CrossRef] [PubMed]
- Carvalho, C.C.; Maia, J.N.; Lins, O.G.; Moraes, S.R. Sensory nerve conduction in the caudal nerves of rats with diabetes. Acta Cir. Bras. 2011, 26, 121–124. [Google Scholar] [CrossRef]
- David, C.; Preston, B.E.S. Electromyography and Neuromuscular Disorders: Clinical-Electrophysiologic Correlations, 3rd ed.; Saunders: Philadelphia, PA, USA, 2012. [Google Scholar]
- Tamburin, S.; Park, S.B.; Alberti, P.; Demichelis, C.; Schenone, A.; Argyriou, A.A. Taxane and epothilone-induced peripheral neurotoxicity: From pathogenesis to treatment. J. Peripher. Nerv. Syst. 2019, 24 (Suppl. S2), S40–S51. [Google Scholar] [CrossRef]
- Velasco, R.; Bruna, J. Taxane-Induced Peripheral Neurotoxicity. Toxics 2015, 3, 152–169. [Google Scholar] [CrossRef]
- Cavaletti, G.; Alberti, P.; Marmiroli, P. Chemotherapy-induced peripheral neurotoxicity in cancer survivors: An underdiagnosed clinical entity? Am. Soc. Clin. Oncol. Educ. Book 2015, 35, e553–e560. [Google Scholar] [CrossRef]
- Meregalli, C.; Fumagalli, G.; Alberti, P.; Canta, A.; Carozzi, V.A.; Chiorazzi, A.; Monza, L.; Pozzi, E.; Sandelius, Å.; Blennow, K.; et al. Neurofilament light chain as disease biomarker in a rodent model of chemotherapy induced peripheral neuropathy. Exp. Neurol. 2018, 307, 129–132. [Google Scholar] [CrossRef]
- Meregalli, C.; Fumagalli, G.; Alberti, P.; Canta, A.; Chiorazzi, A.; Monza, L.; Pozzi, E.; Carozzi, V.A.; Blennow, K.; Zetterberg, H.; et al. Neurofilament light chain: A specific serum biomarker of axonal damage severity in rat models of Chemotherapy-Induced Peripheral Neurotoxicity. Arch. Toxicol. 2020, 94, 2517–2522. [Google Scholar] [CrossRef]
- Alberti, P.; Canta, A.; Chiorazzi, A.; Fumagalli, G.; Meregalli, C.; Monza, L.; Pozzi, E.; Ballarini, E.; Rodriguez-Menendez, V.; Oggioni, N.; et al. Topiramate prevents oxaliplatin-related axonal hyperexcitability and oxaliplatin induced peripheral neurotoxicity. Neuropharmacology 2020, 164, 107905. [Google Scholar] [CrossRef] [PubMed]


| Caudal Nerve SNAP Amplitude | ||||||||||
| Recording Site | C0 | C1 | C2 | C3 | C4 | C5 | C6 | C7 | C8 | C9 |
| Median (Q1, Q3) | 122.0 (109.6, 138.7) | 105.6 (91.67, 128.7) | 94.21 (86.71, 105.6) | 88.83 (74.04, 102.1) | 77.56 (72.07, 92.84) | 75.85 (68.86, 89.44) | 68.94 (58.13, 79.88) | 62.79 (56.90, 72.25) | 59.02 (50.23, 63.86) | 57.14 (52.31, 61.97) |
| Caudal Nerve Sensory Conduction Velocity | ||||||||||
| Recording Site | C0 | C1 | C2 | C3 | C4 | C5 | C6 | C7 | C8 | C9 |
| Median (Q1, Q3) | 41.86 (40.98, 44.71) | 42.74 (40.98, 44.71) | 40.15 (39.32, 43.72) | 39.32 (37.83, 40.98) | 37.83 (37.83, 40.98) | 37.83 (36.41, 40.15) | 37.83 (35.77, 37.83) | 36.41 (34.51, 37.12) | 35.77 (33.90, 36.41) | 30.71 (29.79, 32.75) |
Disclaimer/Publisher’s Note: The statements, opinions and data contained in all publications are solely those of the individual author(s) and contributor(s) and not of MDPI and/or the editor(s). MDPI and/or the editor(s) disclaim responsibility for any injury to people or property resulting from any ideas, methods, instructions or products referred to in the content. |
© 2023 by the authors. Licensee MDPI, Basel, Switzerland. This article is an open access article distributed under the terms and conditions of the Creative Commons Attribution (CC BY) license (https://creativecommons.org/licenses/by/4.0/).
Share and Cite
Pozzi, E.; Monza, L.; Ballarini, E.; Bossi, M.; Rodriguez-Menendez, V.; Canta, A.; Chiorazzi, A.; Carozzi, V.A.; Crippa, L.; Marmiroli, P.; et al. Morpho-Functional Characterisation of the Rat Ventral Caudal Nerve in a Model of Axonal Peripheral Neuropathy. Int. J. Mol. Sci. 2023, 24, 1687. https://doi.org/10.3390/ijms24021687
Pozzi E, Monza L, Ballarini E, Bossi M, Rodriguez-Menendez V, Canta A, Chiorazzi A, Carozzi VA, Crippa L, Marmiroli P, et al. Morpho-Functional Characterisation of the Rat Ventral Caudal Nerve in a Model of Axonal Peripheral Neuropathy. International Journal of Molecular Sciences. 2023; 24(2):1687. https://doi.org/10.3390/ijms24021687
Chicago/Turabian StylePozzi, Eleonora, Laura Monza, Elisa Ballarini, Mario Bossi, Virginia Rodriguez-Menendez, Annalisa Canta, Alessia Chiorazzi, Valentina Alda Carozzi, Luca Crippa, Paola Marmiroli, and et al. 2023. "Morpho-Functional Characterisation of the Rat Ventral Caudal Nerve in a Model of Axonal Peripheral Neuropathy" International Journal of Molecular Sciences 24, no. 2: 1687. https://doi.org/10.3390/ijms24021687
APA StylePozzi, E., Monza, L., Ballarini, E., Bossi, M., Rodriguez-Menendez, V., Canta, A., Chiorazzi, A., Carozzi, V. A., Crippa, L., Marmiroli, P., Cavaletti, G., & Alberti, P. (2023). Morpho-Functional Characterisation of the Rat Ventral Caudal Nerve in a Model of Axonal Peripheral Neuropathy. International Journal of Molecular Sciences, 24(2), 1687. https://doi.org/10.3390/ijms24021687