Article

Diclofenac Disrupts the Circadian Clock and through Complex Cross-Talks Aggravates Immune-Mediated Liver Injury—A Repeated Dose Study in Minipigs for 28 Days

1
Centre for Pharmacology and Toxicology, Hannover Medical School, Carl-Neuberg-Str. 1, 30625 Hannover, Germany
2
Department of Predictive Toxicology, Korea Institute of Toxicology, Daejeon 34114, Republic of Korea
*
Author to whom correspondence should be addressed.
Int. J. Mol. Sci. 2023, 24(2), 1445; https://doi.org/10.3390/ijms24021445
Submission received: 22 November 2022 / Revised: 28 December 2022 / Accepted: 30 December 2022 / Published: 11 January 2023
(This article belongs to the Special Issue Molecular Toxicology of Drug Induced Liver Injury)

Abstract

:
Diclofenac effectively reduces pain and inflammation; however, its use is associated with hepato- and nephrotoxicity. To delineate mechanisms of injury, we investigated a clinically relevant (3 mg/kg) and high-dose (15 mg/kg) in minipigs for 4 weeks. Initially, serum biochemistries and blood-smears indicated an inflammatory response but returned to normal after 4 weeks of treatment. Notwithstanding, histopathology revealed drug-induced hepatitis, marked glycogen depletion, necrosis and steatosis. Strikingly, the genomic study revealed diclofenac to desynchronize the liver clock with manifest inductions of its components CLOCK, NPAS2 and BMAL1. The > 4-fold induced CRY1 expression underscored an activated core-loop, and the dose dependent > 60% reduction in PER2mRNA repressed the negative feedback loop; however, it exacerbated hepatotoxicity. Bioinformatics enabled the construction of gene-regulatory networks, and we linked the disruption of the liver-clock to impaired glycogenesis, lipid metabolism and the control of immune responses, as shown by the 3-, 6- and 8-fold induced expression of pro-inflammatory CXCL2, lysozyme and ß-defensin. Additionally, diclofenac treatment caused adrenocortical hypertrophy and thymic atrophy, and we evidenced induced glucocorticoid receptor (GR) activity by immunohistochemistry. Given that REV-ERB connects the circadian clock with hepatic GR, its > 80% repression alleviated immune responses as manifested by repressed expressions of CXCL9(90%), CCL8(60%) and RSAD2(70%). Together, we propose a circuitry, whereby diclofenac desynchronizes the liver clock in the control of the hepatic metabolism and immune response.

1. Introduction

Diclofenac is a nonsteroidal anti-inflammatory drug (NSAID) and commonly used to treat pain and inflammation in conditions of osteoarthritis and musculoskeletal disorders [1,2]. Its anti-inflammatory, analgesic and anti-pyretic effects are caused by inhibition of cyclooxygenase 1 and 2. This impairs the arachidonic acid metabolism and the production of prostaglandins. Diclofenac inhibits the production of leukotrienes and suppresses thromboxane-prostanoid receptor signaling. Additionally, its analgesic activities are attributed to modulation of the nitric oxide–cGMP nociceptive pathway, inhibition of NMDA-receptor-mediated hyperalgesia and the blocking of substance P [3,4,5].
Despite its proven benefits, diclofenac medication is associated with adverse drug reactions (ADRs), especially cardiovascular, gastrointestinal, hepatic and in the kidneys [5,6,7,8]. Commonly reported ADRs are serum aminotransferase elevations among arthritis patients [9,10,11], and a population-based study from Iceland defined diclofenac as the second most common drug-induced liver injury (DILI) causing agent among outdoor patients [12]. Consequently, the European Medical Agency restricted the use of diclofenac, particularly in patients with heart or circulatory disorders.
The mechanism by which diclofenac induces liver injury is only partly understood. Mitochondrial toxicity and the production of reactive metabolites, e.g., benzoquinone-imine intermediates, are thought to cause hepatotoxicity while diclofenac acyl glucuronides damage bile duct epithelium. In fact, diclofenac’s metabolism is complex; it involves hydroxylated and conjugated metabolites [13]. Given its extensive metabolism, diclofenac causes oxidative stress that may result in critically depleted intracellular glutathione stores [14,15] to induce cytotoxicity and mitochondrial permeability transitions [3,6,16]. In addition to direct effects, reactive metabolites produce protein adducts which function as neo-antigens and are sensed by antigen-presenting cells to trigger B and T cell responses [17]. Moreover, allelic variants of the genes coding for CYP2C8, UGT2B7 and ABCC2 sensitize individuals to diclofenac hepatotoxicity [18].
Recently, we reported diclofenac’s potential to cause immune-mediated and allergic hepatitis in mice [19] and dogs [20]. We observed pro-inflammatory cytokine and chemokine release by injured cells and the migration and infiltration of immune cells to sites of injury. Specifically, increased expression of tumor necrosis factor (TNF)-α, interferon (IFN)γ, interleukins (IL-1, IL-6, IL-7, IL-17, IL-18) and chemokine ligands (CXCL1, CXCL2, CXCL8, CXCL12, CXCL13, CXCR4, CXCR7 and CCL2) aggravated liver toxicity [21]. Additionally, liver hypersensitivity reactions involved oxidative stress, macrophage polarization, mastocytosis and complement-activation-related pseudoallergy (CARPA), as well as an erroneous programming of the innate and adaptive immune system [20]. Additionally, NSAIDs have the potential to cause drug-induced steatosis to result in the altered expression of genes coding for lipogenesis, lipid transport, lipid droplet growth, ER stress and fatty acid oxidation [20].
Our immunogenomic and molecular pathology studies in mice and dogs informed on important species differences in immune-mediated hepatitis. Given the growing role of minipigs in translational immune safety studies [22,23,24], we investigated diclofenac’s potential to cause organ toxicity at clinically relevant and above doses after repeated daily dosing for 28 days. We performed whole genome scans of minipig liver and kidney to delineate reasons for organ pathologies, and gene expression profiling studies alerted us to immune, stress and inflammatory responses, while serum biochemistries and molecular pathology studies pointed to a novel mechanism whereby diclofenac modulates the circadian rhythm and immunity of the hepatic and neuroendocrine system. Indeed, in a recent review, Mukherji et al. highlighted the importance of the circadian clock in liver function and fatty liver disease [25], and our findings imply a complex interplay between diclofenac, the liver clock and the hypothalamic–pituitary–adrenal axis with stress-induced adrenocorticopic hormone (ACTH) release augmenting adrenal glucocorticoid synthesis to modulate the immune response.

2. Results

2.1. Treatment Related Clinical Signs

Depicted in supplementary Figure S1 are body weight (panel A) and food consumption (panel B) over 28 days, and we recorded individual organ weights at the end of the study (panel C and D). We observed significant reductions in body weight gain for one animal for the low- and high-dose treatments, and these animals showed decreased food consumption (supplementary Figure S1, panel B). Based on adjusted organ-to-body weight ratios (panels D2 and E2), we observed statistically significant increases in adrenal and prostate weights at the high-dose regimen. Conversely, the low-dose treatment caused a reduction in thymus, but a significant increase in kidney weight. Notably, the increase in adrenal and prostate organ weights was clearly dose related, and reached statistical significance at the high-dose regimen. However, for thymus and kidney, a clear dose-related change was not observed, and, because of significant inter-individual variabilities, the organ weight changes became significant only at the lower dose.

2.2. Serum Biochemistry

Supplementary Figure S2 summarizes serum biochemistry findings. Diclofenac-related abnormalities included a significant but mild increase in AST activities at day 6 of treatment and reductions in albumin (hypoalbuminemia), total protein (hypoproteinemia), BUN (day 6 of treatment; strict dose dependent), ALT, bilirubin, glucose and serum creatinine at day 14 of treatment. Experimental and clinical evidence was suggestive of diclofenac to increase insulin release from beta cells by inhibiting ATP-sensitive K-channels, and this provides a rationale for the observed hypoglycemia [26,27].

2.3. Hematology

We performed blood smears on days 6, 8, 14 and 28 of diclofenac treatment (supplementary Figure S3) and observed a dose- and time-dependent increase in WBC and neutrophil count from day 8 onwards. Similarly, diclofenac treatment caused a dose-dependent increase in monocyte and lymphocyte counts on days 8 and 14, respectively.

2.4. Serum Electrolyte Analysis
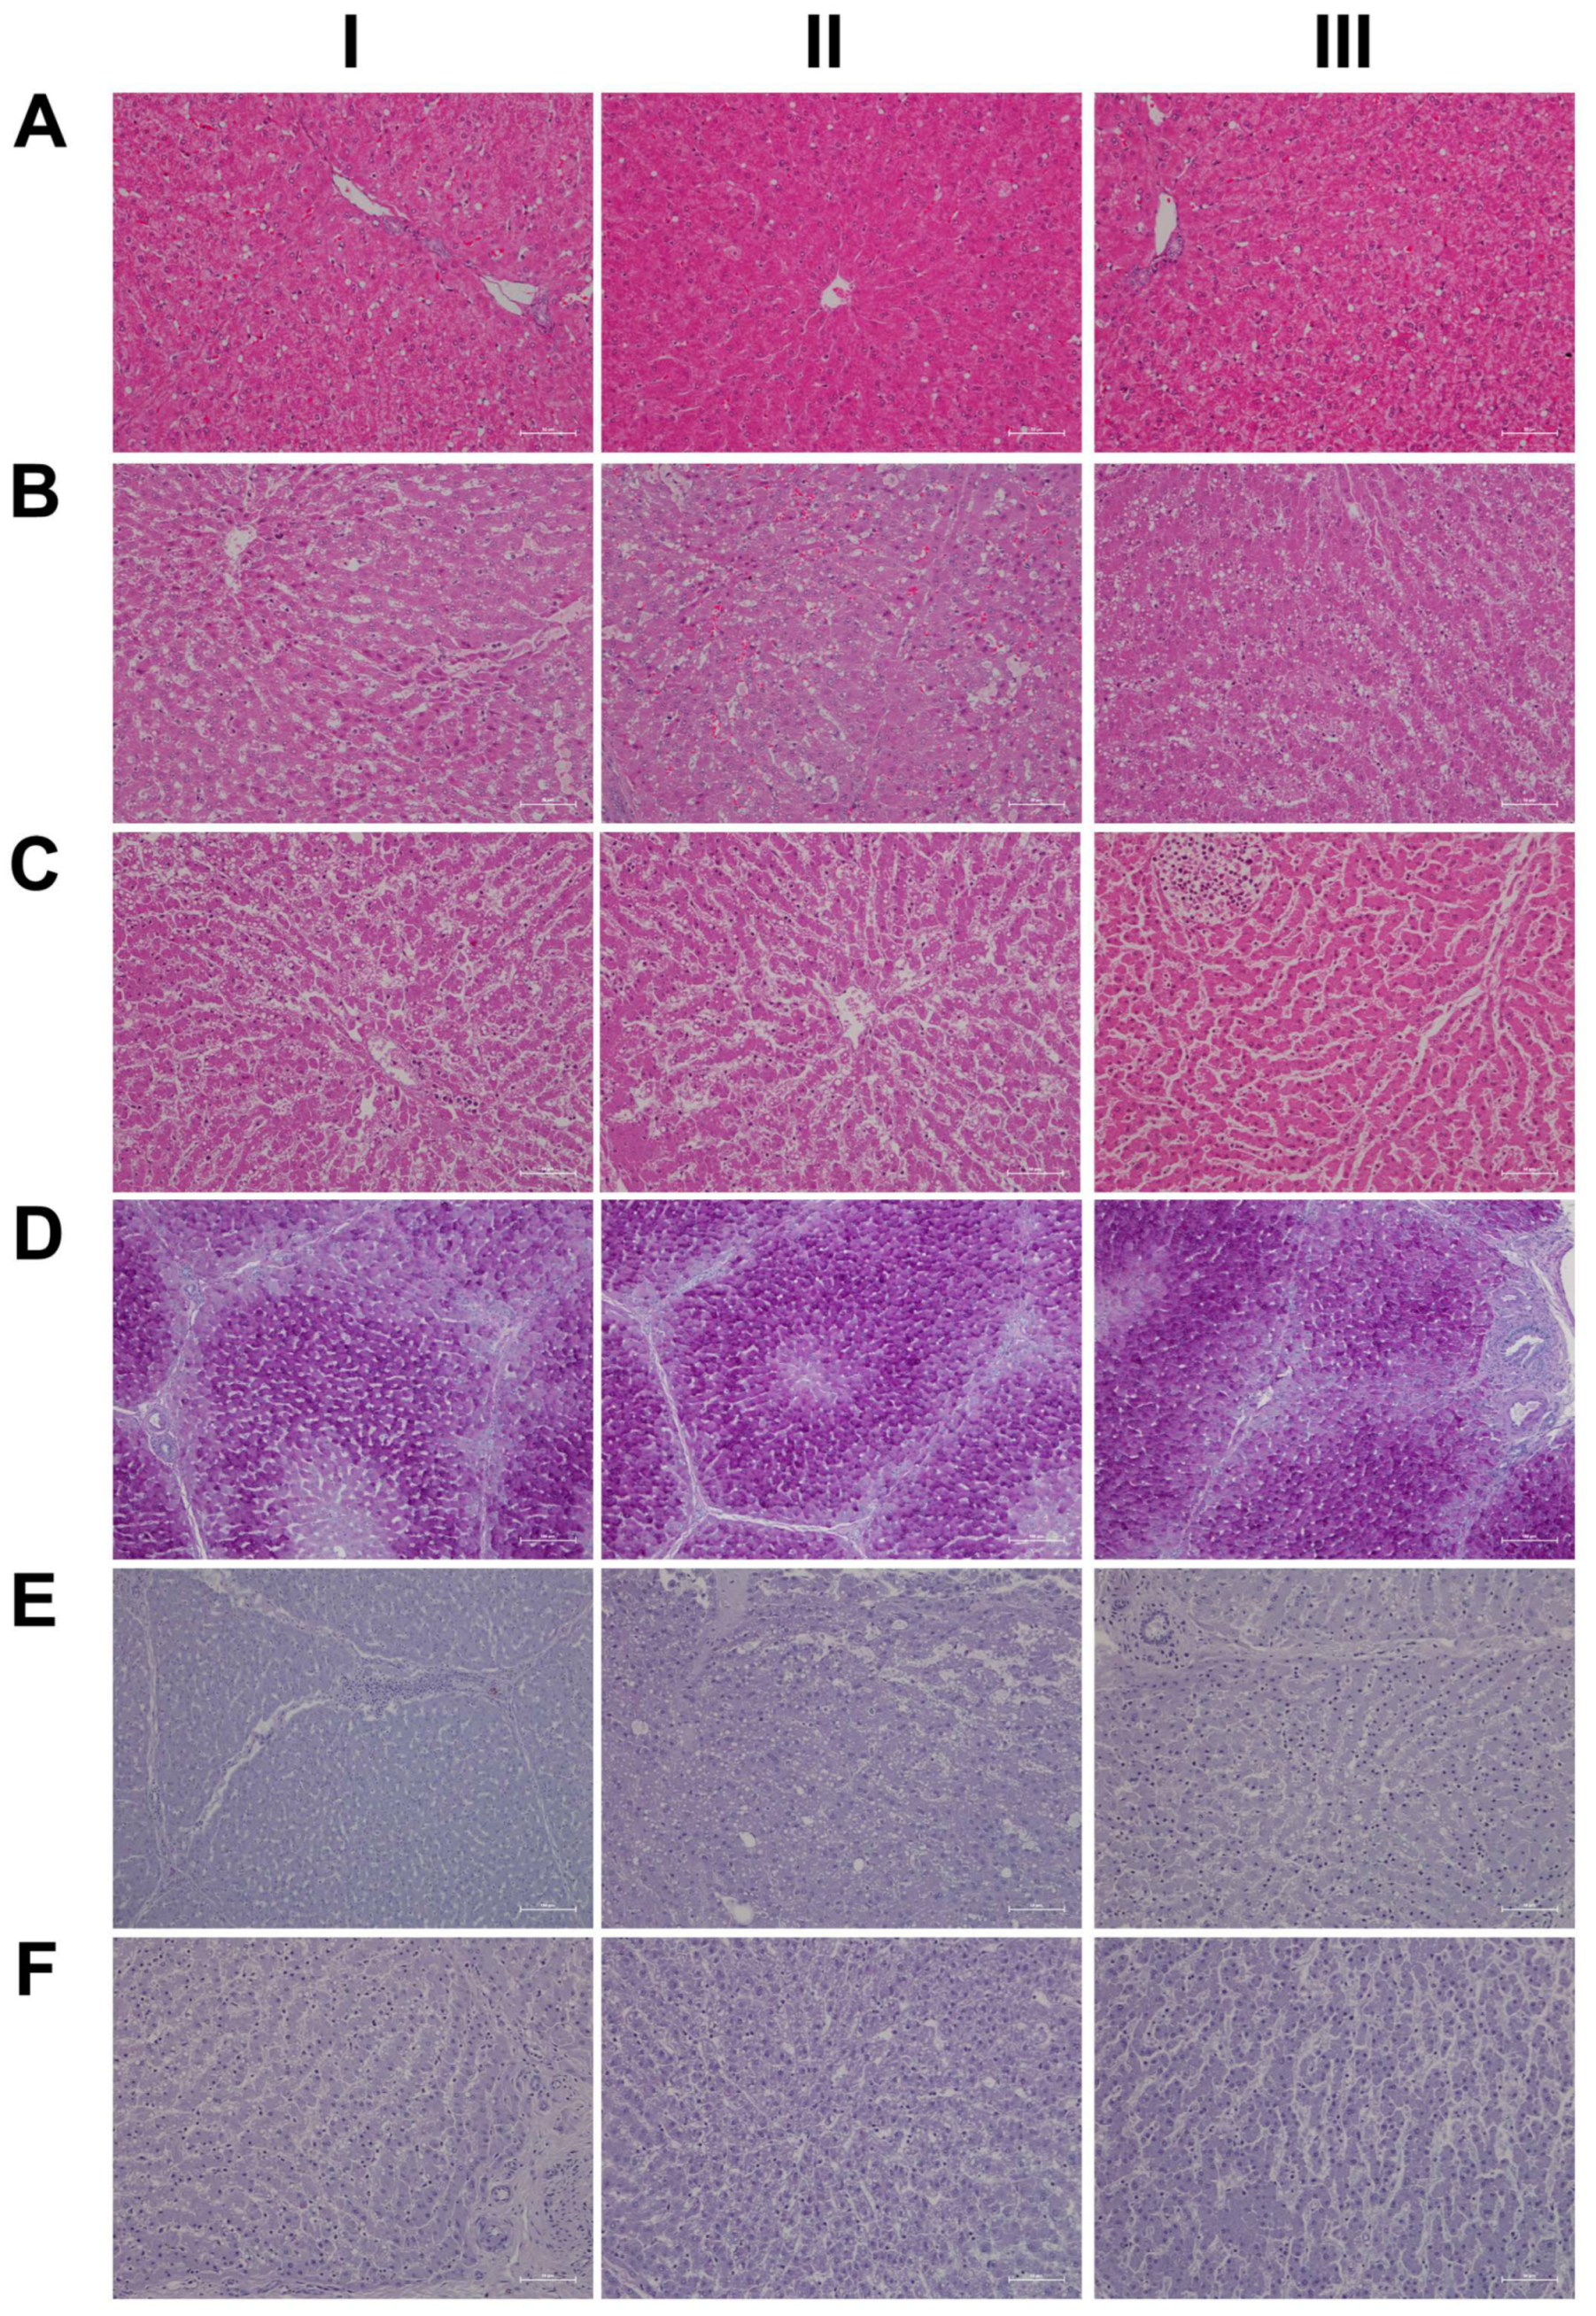
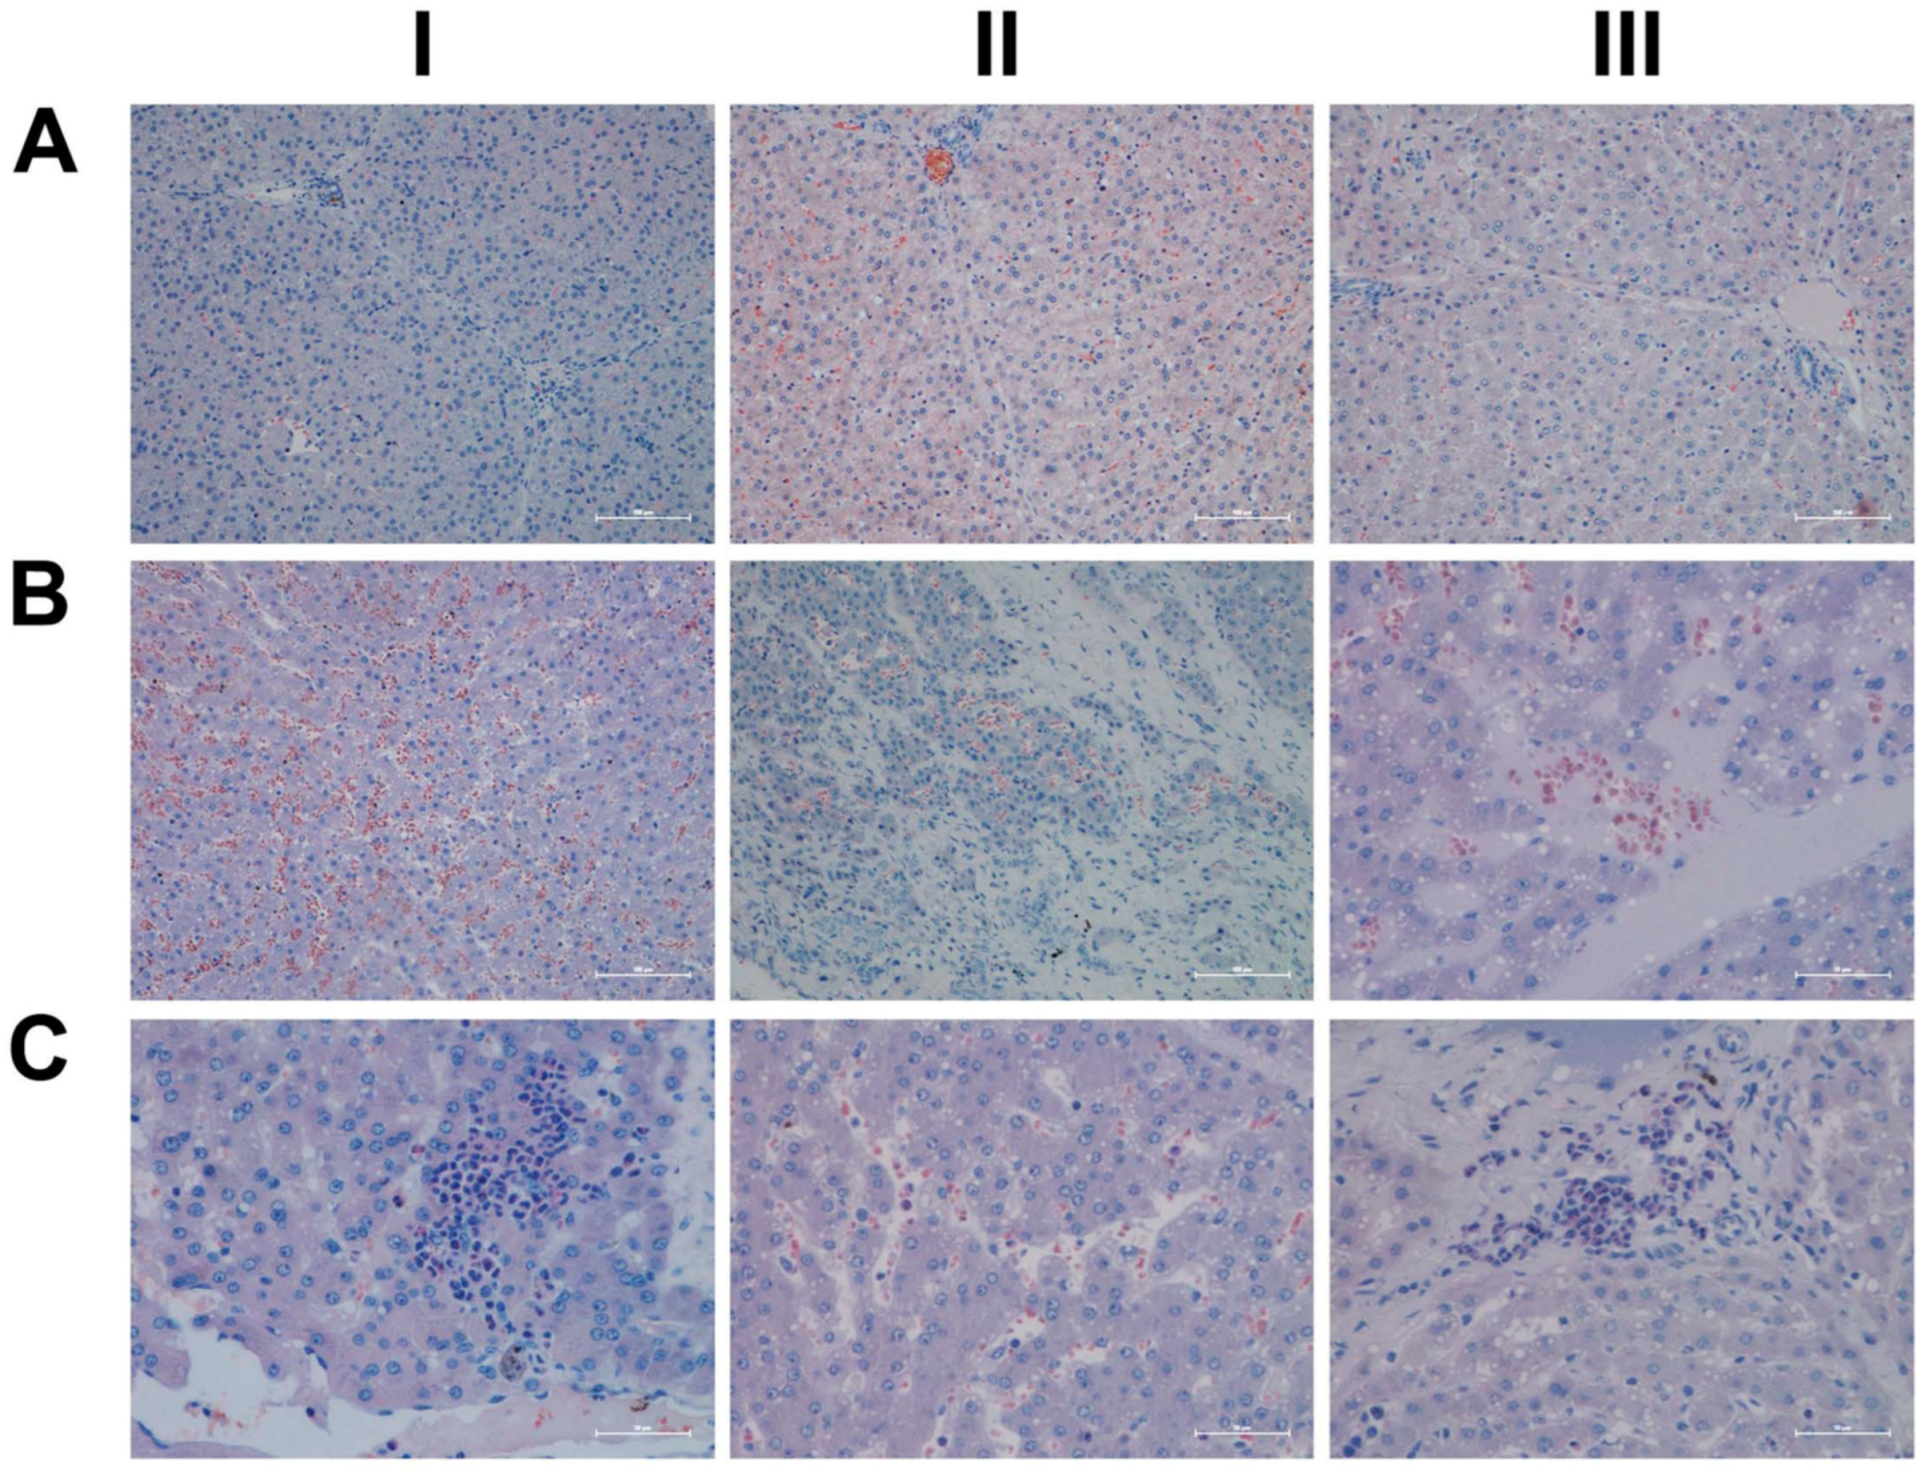
Supplementary Figure S4 depicts significant reductions in serum Ca2+, Cl, Na and potassium after low-dose diclofenac treatment for 14 and 28 days. The electrolyte imbalances signify kidney injury following drug treatment, whereas the observed hypokalemia likely stems from an adrenal gland disorder, as detailed below.

2.5. Histopathology

We performed a range of histological stains to examine liver morphology in response to diclofenac treatment. In addition, we investigated the regulation of components of the liver clock and markers of inflammation by immunohistochemistry.
Shown in Figure 1 panels A–C are hematoxylin and eosin-stained liver sections of the control, low- and high-dose treated animals, and panels AI–III are liver sections of three individual control animals. The hepatocytes are normal-sized and arranged in a trabecular-like pattern, and the nuclei are regular with small nucleoli. Intermingled are a few binucleated hepatocytes (AIII), and the sinusoids are narrow. The hepatocytes are rich in glycogen, as denoted by the softly granular appearance of the cytoplasm (see also below, PAS stain), and resident macrophages are in a quiescent state. The biliary epithelium is intact with no sign of morphological abnormalities. Panel B depicts liver sections of three low-dose treated animals. The hepatocytes are shrunken, highly vacuolated (BI–III), irregularly shaped, and the cytoplasm of hepatocytes is slightly basophilic; notwithstanding, there are patches of smaller-sized eosinophilic finely granulated hepatocytes with still dense, often doubled nucleated hepatocytes, which indicates fresh regenerates. The basophilic hepatocytes show the stigmas of recurrent regeneration due to an obviously high cellular turnover. We observed disseminated apoptotic cells with remnants of pyknotic nuclei. Notwithstanding, hydropic and lytic cell changes dominate, especially in zones of injury with increased numbers of vacuolated cells. Additional morphological changes include dilated sinusoids; its mottled appearance signifies differences between hepatic lobules in the inflammatory response to diclofenac treatment. The parenchymal injuries occupy zones 2 and 3 (BI–III); however, zone 1 is characterized by hypertrophy of the trabeculae. Shown in panel CI–III are liver sections of three high-dose treated animals. Note the dose-related vacuolar degeneration of the shrunken hepatocytes. Their shrinkage indicates a marked preexisting hydropic swelling associated with lytic cell changes and dispersed cell detritus in the widened sinusoids. The resident macrophages are activated, and leucocytes are marginating in the sinus (CII). Focal inflammatory infiltrates are present, either florid around a central vein (CI) or declining with granulomatous reaction (CIII). At high-dose, diclofenac treatment caused portal inflammation. Shown in panel CII is a partially destructed portal field with inflammatory infiltrates that extend to the rim of the portal field and the liver parenchyma (interface). The morphological appearance mimics features of an autoimmune-like hepatitis and, overall, we observe a dose-related increase in drug-induced inflammation and liver cell degeneration. Figure 1D–F depicts the PAS stain. The liver sections of control animals are rich in glycogen, as evidenced by the dark magenta staining of hepatocytes (panel D). Clearly visible is the demarcation of liver lobules and the pronounced periportal zonation of glycogen storage. Conversely, there is less glycogen storage in zone 3 hepatocytes and around the central vein (DI–III). Diclofenac treatment caused severe glycogen depletion (panels E and F) at low- and high-doses, and is therefore dose independent. This hallmarks a metabolic disorder and may be linked to increased insulin release induced by diclofenac treatment. In fact, NSAIDs have been reported to increase insulin release from ß-cells through the modulation of K-channels [26,27]. Shown in panel E1 are portal field inflammatory infiltrates arodizing the limiting plate (combined with some brown pigment). Once again, hepatocytes are shrunken, vacuolated and the sinusoids are dilated.
Given the importance of the reticular fibers in wound healing, we assessed the collagen fibers in liver sections of the control and diclofenac-treated animals (Figure 2A–C); shown in panel AI–III are three individual control animals. The silver stain highlights the reticular fibers of the interlobular connective tissue and the fibers around blood vessels. Following low-dose diclofenac treatment for 28 days, the fibers surrounding hepatocytes were stained more intensely (BI), and the reticulin stain hallmarks subacute hepatic necrosis with enhanced deposition of collagen fibers following cell death of hepatocytes (BI–III).
We regard the enhanced deposition of reticular fibers as defective wound healing, and, especially in areas of severe necrosis, the reticulin framework appeared bulky and convoluted (BIII). At high-doses, a similar picture emerges, and although a dose-related increase in the silver stain of collagen fibers is visible, the convolutes often have a preferred association with portal fields (BII upper right corner, CI–II). Moreover, we employed the EvG stain to assess connective tissue and its associated extracellular matrix (ECM) proteins (elastin, collagen, etc.) in response to diclofenac treatment (panel D–F). As shown for three individual control animals, elastin is a minor component of connective tissue in the liver (DI–III), and only fibers surrounding blood vessels and within portal triads stain-positive. Unlike the controls, diclofenac treatment at low- and high-doses caused an increased deposition of collagenous matrix (red fibers) in the liver parenchyma. Intermingled are micronodular hepatocellular regenerates (EI–II; FI–II), and this hallmarks a healing response to recurrent inflammatory infiltrations, mainly in the vicinity of portal fields, and are the second feature in addition to the zonal injuries of diclofenac-induced hepatitis. Focally, a broad fibrosis extends to the central vein and includes the initial deposition of elastin fibers (black fibers; EIII). Although collagen fibers can be degraded and the associated fibrotic scar might resolve over time, the combined irregular nodular regenerates indicate not only a preceding necrosis of liver cells, but also damage of the stromal framework. Therefore, a permanent disorder of the microcirculation could be a sequel. An addition of elastic fibers carries the risk of permanent scarring as elastin is highly resistant to digestion by proteases. The accumulation of elastic fibers in diclofenac-treated animals is not dose related. Together, we consider an enhanced ECM deposition as defective wound repair and early signs of fibrosis.
For its central role in nitrogen metabolism and ammonia detoxification, we assessed the expression of carbamoyl phosphate synthetase 1 (CPS1) by immunohistochemistry. Importantly, CPS1 ko mice die from hyperammonemia within 24 h after birth [28], and this enzyme catalyzes the conversion of ammonia to carbamoyl phosphate, i.e., the initial step in the urea cycle. Drug-induced urea cycle dysfunction leads to liver injury and mitochondrial toxicity, and the morphological changes in the liver of patients diagnosed with urea cycle disorders were recently summarized [29]. We employed the HepPar1 monoclonal antibody to assess the expression of CPS1 [30]. Shown in Figure 3 are liver sections of control and diclofenac-treated animals. Panel AI–III depicts three individual control animals, and we observed abundant staining of CPS1 with some hepatocytes displaying marked cytosolic expression of the enzyme. Conversely, diclofenac treatment at low- and high-doses significantly repressed CPS1, while inflamed hepatocytes (BII lower right quadrant) and severely injured hepatocytes (BIII, portal triad lower left quadrant) failed to express the protein. Similarly, the high-dose regimen (CI–III) markedly repressed CPS1 expression.
Diclofenac treatment caused hepatic steatosis, and the link between aberrant lipid metabolism and hepatic inflammation has been the subject of several reviews and original works [31,32,33,34]. Indeed, a recent study highlighted the role of the macrophage-derived endogenous lipid mediator PCTR1 (protectin conjugates in tissue regeneration 1) in alleviating hepatic inflammation by augmenting fatty acid desaturation (FADS1 and FADS2) and polyunsaturated fatty acid (PUFA) elongation via the enzyme very long-chain fatty acid elongase 2 (ELOVL2) [35]. We found ELOVL2 transcript expression 4-fold induced, and therefore, we investigated its protein expression in the control and diclofenac-treated animals. Depicted in Figure 3 panels DI–III are liver sections of three individual control animals, and most hepatocytes showed a faint cytosolic expression of the enzyme. However, the Kupffer cells abundantly expressed ELOVL2. Following diclofenac treatment, we observed a dose-related increase in ELOVL2 expression. At the lower dose (EI–III), animals presented a mosaic pattern of ELOVL2 expression among regenerating hepatocytes, while at the higher dose (FI–III), the expression of the enzyme was markedly increased. Additionally, shown in panel EI are ELOVL2 positive round cell infiltrates and activated macrophages.
A further point of considerable importance is diclofenac’s extensive metabolism in the liver and the production of reactive metabolites [36]. Superoxide dismutase plays a key role in the detoxification of reactive oxygen species by catalyzing the hydrogen peroxide reaction. We assessed the regulation of cytosolic SOD1 and the mitochondrial SOD2 in the control and diclofenac-treated animals (Figure 4A–F). Among controls, cytosolic SOD1 expression is marked in hepatocytes (panel AI–III). Shown in AI is a portal triad in which the biliary epithelium stained positive as well. Conversely, diclofenac low- and high-dose (B–C) treatments caused significant reductions in SOD1, with severely harmed hepatocytes failing to express the protein. For instance, BI depicts a high power field magnification of a portal triad with adjacent micronodular regenerates, indicating insufficient remodeling after focal destructive inflammatory infiltrations. Panel BII is a further example of a mosaic-like pattern of immature and mature cells of zone 1 hepatocytes, and high-dose animals present distorted trabeculae and variable cell size, thus reflecting recurrent regeneration throughout the entire liver lobule. Note the marked SOD1 expression in histiocytes/macrophages, but its minimal expression in the surrounding hepatocytes. At the higher dose and within the entire liver lobule, there are patches of hepatocytes failing to express the protein (CI–III). We also investigated the expression of mitochondrial SOD2; panels D–F are representative images of liver sections from control and diclofenac-treated animals (Figure 4). Unlike controls (DI–III) and as seen with low (EI–III) and high-dose (FI–III) treatments, injured and highly vacuolated hepatocytes express little to moderate SOD2 protein. Interestingly, SOD2 associates with the lipid droplet monolayer of steatotic hepatocytes (FII), and the antibody visualizes the fusion of smaller lipid droplets to larger ones (FII). There are some disseminated (FI, left side, FII, upper center) or cohesive immature regenerates (EIII, right side), which do not express the SOD2 protein.
Furthermore, there is evidence for the HIF1α transcription factor to attenuate oxidative stress and its associated liver injury through the up-regulation of oxidative defense genes [37]. Shown in Figure 5 are liver sections of three individual control animals (AI–III) and the expression of HIF1α is minimal. In strong contrast, diclofenac treatment caused moderate to marked HIF1α expression at low (BI–III) and high-doses (CI–III), and HIF1α positive hepatocytes seem to regenerate and are less injured. There is also significant sinusoidal and endothelial staining of HIF1α and the protein “dresses” the lipid droplet monolayer (panel CI). In addition, there is mitochondrial HIF1α expression, as indicated by its seed-like appearance in the cytosol of hepatocytes (panels CII–III).
In an earlier investigation, we highlighted the critical role of myeloperoxidase (MPO) in the metabolism of diclofenac to reactive metabolites, especially in the production of benzoquinone imine intermediates [20]. In fact, Kupffer cells and also neutrophils are rich in MPO, and this enzyme catalyzes the diclofenac-reactive metabolism to result in oxidative damage of the liver parenchyma. Shown in Figure 5 panels DI–III are liver sections of three individual control animals and most of the Kupffer cells are MPO negative. There are only two slightly MPO-positive macrophages in the upper half of panel DIII, and none of the controls contain neutrophilic infiltrates. In strong contrast, diclofenac treatment caused marked induction of MPO at the low- (EI–III) and high-dose (FI–III) regimens and a remarkable recruitment of numerous neutrophils and some monocytes to zones of injury. We noticed MPO-negative lymphocytes marginating in the dilated sinuses (EII). Therefore, diclofenac treatment elicits an inflammatory response within the lobules (FII) which is dominated by neutrophils, varying numbers of macrophages (EIII, FI–III) and MPO-negative lymphocytes (EIII, FIII) at the lobular periphery.
Depicted in panel EI is an example of an early histiocytic granuloma at the parenchymal edge of a portal field, which we consider to be at the resorption stage of an otherwise florid foci.
EIII exemplifies portal inflammation composed of a mixture of neutrophils and macrophages. Moreover, panel EII is suggestive of the transendothelial trafficking of neutrophils within dilated sinusoidal vasculature [38]. These findings imply diclofenac treatment to cause sterile inflammation with damaged hepatocytes sending alarm signals (DAMPs) to promote neutrophil recruitment and their activation. A similar picture emerges at the higher treatment dose and, once again, the results of three individual animals are given. Note the neutrophil swarm migrating into a necrotic zone at the edge of a focal necrosis (F1), as well as the portal inflammation depicted in FIII with intact bile ducts. Panel FII exemplifies lobular inflammation and sinusoidal trafficking of neutrophils.
We also assessed neutrophils by the chloroacetate esterase stain (CAE, Figure 6); shown in panel AI–III are liver sections of three individual control animals. We did not observe neutrophilic infiltrates in the liver sections of control animals. However, diclofenac treatment at low- and high-doses caused marked infiltration by neutrophils. Depicted in panel BI–III are liver sections of three low-dose-treated animals. Note the intense staining of monocytes/macrophages in BI, the extended necrosis in BII with its monocytic infiltrates and the diffusely red stained macrophages in a necrotic lesion (BIII). Furthermore, panel CI exemplifies a swarm of mainly banded neutrophils in an inflamed liver lobule of a high-dose-treated animal (CI), the mixture of segmented neutrophils and macrophages in the widened sinusoids (CII) and the portal inflammatory infiltrates consisting of banded and segmented neutrophils and macrophages of a high-dose-treated animal (CIII).

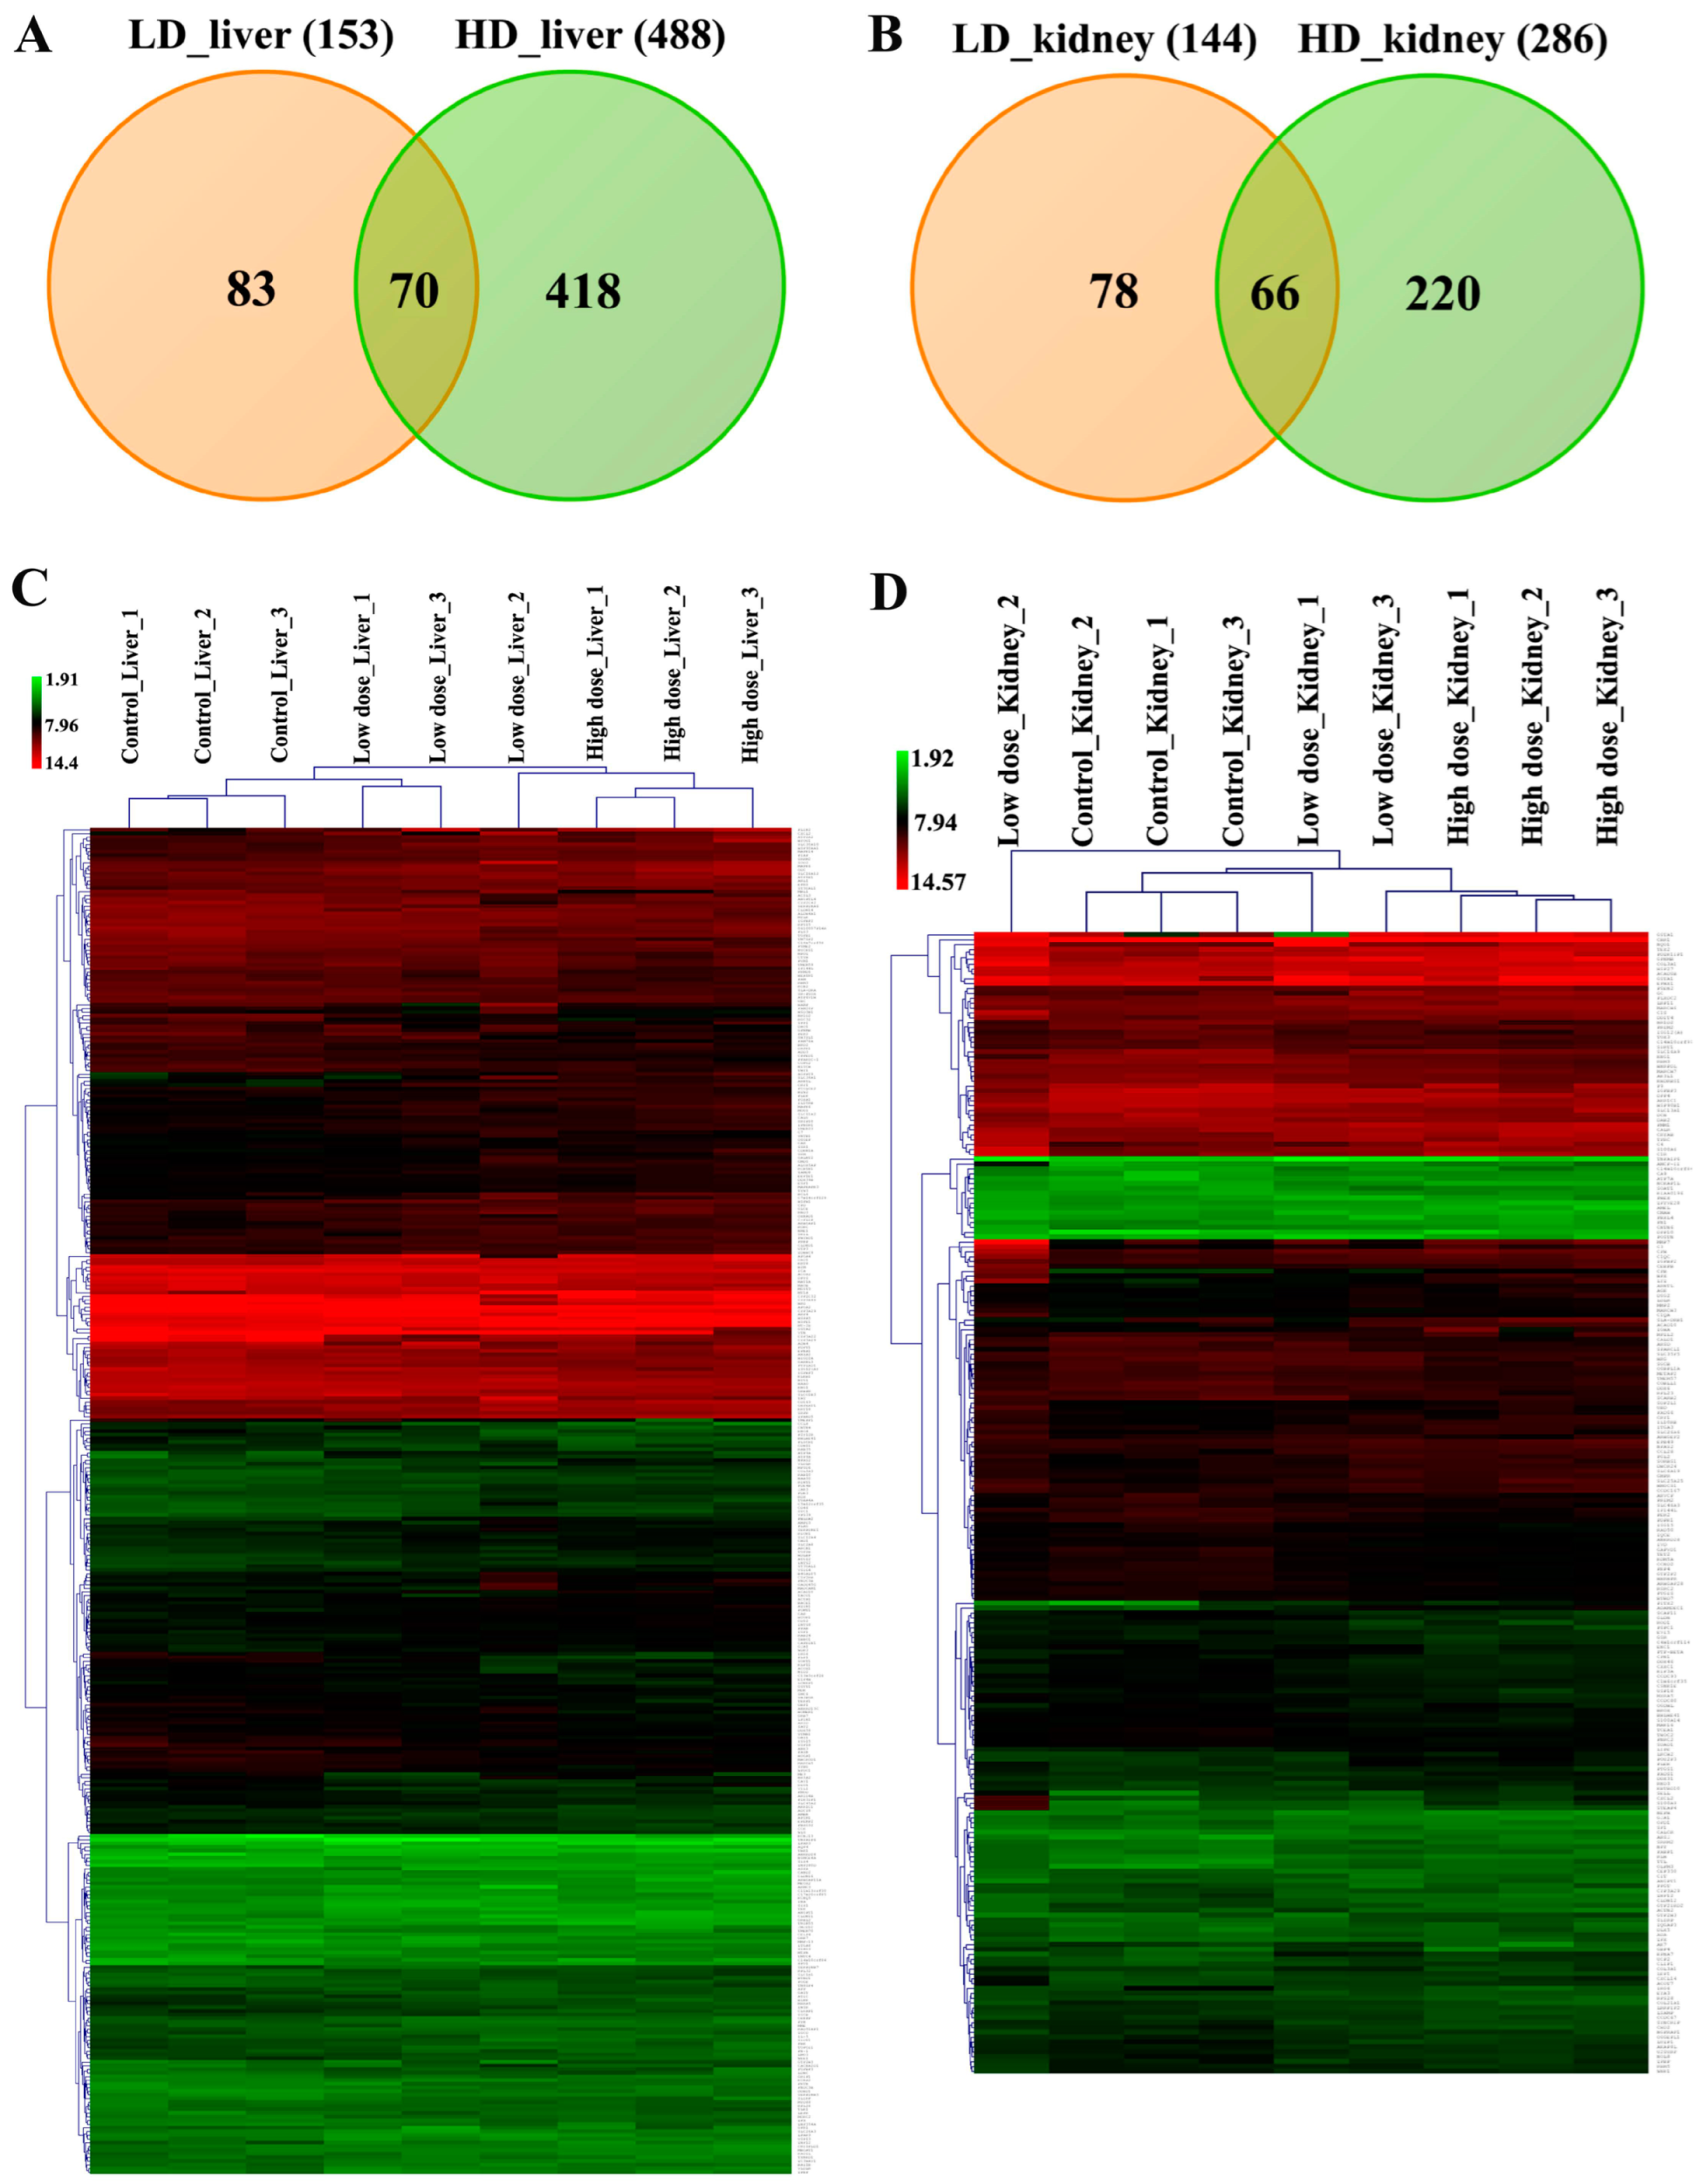
2.6. Genomic Responses in Liver and Kidney to Diclofenac Treatment

Hepatic gene expression profiling of the low- and high-dose treatments defined 153 (71 up- and 82 down-) and 488 (234 up- and 254 down-) genes as significantly changed, of which 70 were commonly regulated (Figure 7A and Table 1).
Similarly, 144 (59 up- and 85 down-) and 286 (125 up- and 161 down-) DEGs are regulated in the kidney in response to low- and high-dose diclofenac treatment and 66 DEGs are in common between the two regimens (Figure 7B and Table 2).
We constructed heatmaps by applying the average linkage hierarchical clustering algorithm with Euclidian distance, and we showed the different treatment groups to be clearly segregated. The dendogram display clusters of genes regulated in common to imply dose-related genomic responses in the liver and kidney (Figure 7C,D). Table 1 and Table 2 provide information for organ-specific DEGs, and the data were categorized based on enriched biological processes.

2.7. Drug Metabolism and Transporters

We evaluated the expression of cytochrome P450 (CYP) monooxygenases and transporters. Specifically, the isoforms CYP3A22, CYP3A29, CYP3A39 and CYP3A46 were up to six-fold repressed, whereas CYP7A1, i.e., the key enzyme for bile acid synthesis, was reduced to 25% of the controls. Furthermore, we noted nearly three-fold changes in the coding of phase II drug metabolism genes, and this included glutathione and glucuronyl transferases (GSTA2, GSTT1, MGST3 and UGT1A6). Similarly, we determined a four-fold induction of GSTA1 and three-fold repressed GSTM3 expression in the kidneys of high-dose treated animals. Moreover, several transporters and key mitochondrial solute carriers were regulated in the liver and kidney (supplementary Table S1), and examples include the > 2-fold induced expression of SLC38A1, i.e., a glutamine transporter that is of critical importance in the detoxification of ammonia and SLC30A10, which selectively transports manganese. Conversely, SLC4A4 was about 60% repressed in the kidney; this transporter plays an essential role in bicarbonate homeostasis and intracellular pH regulation.

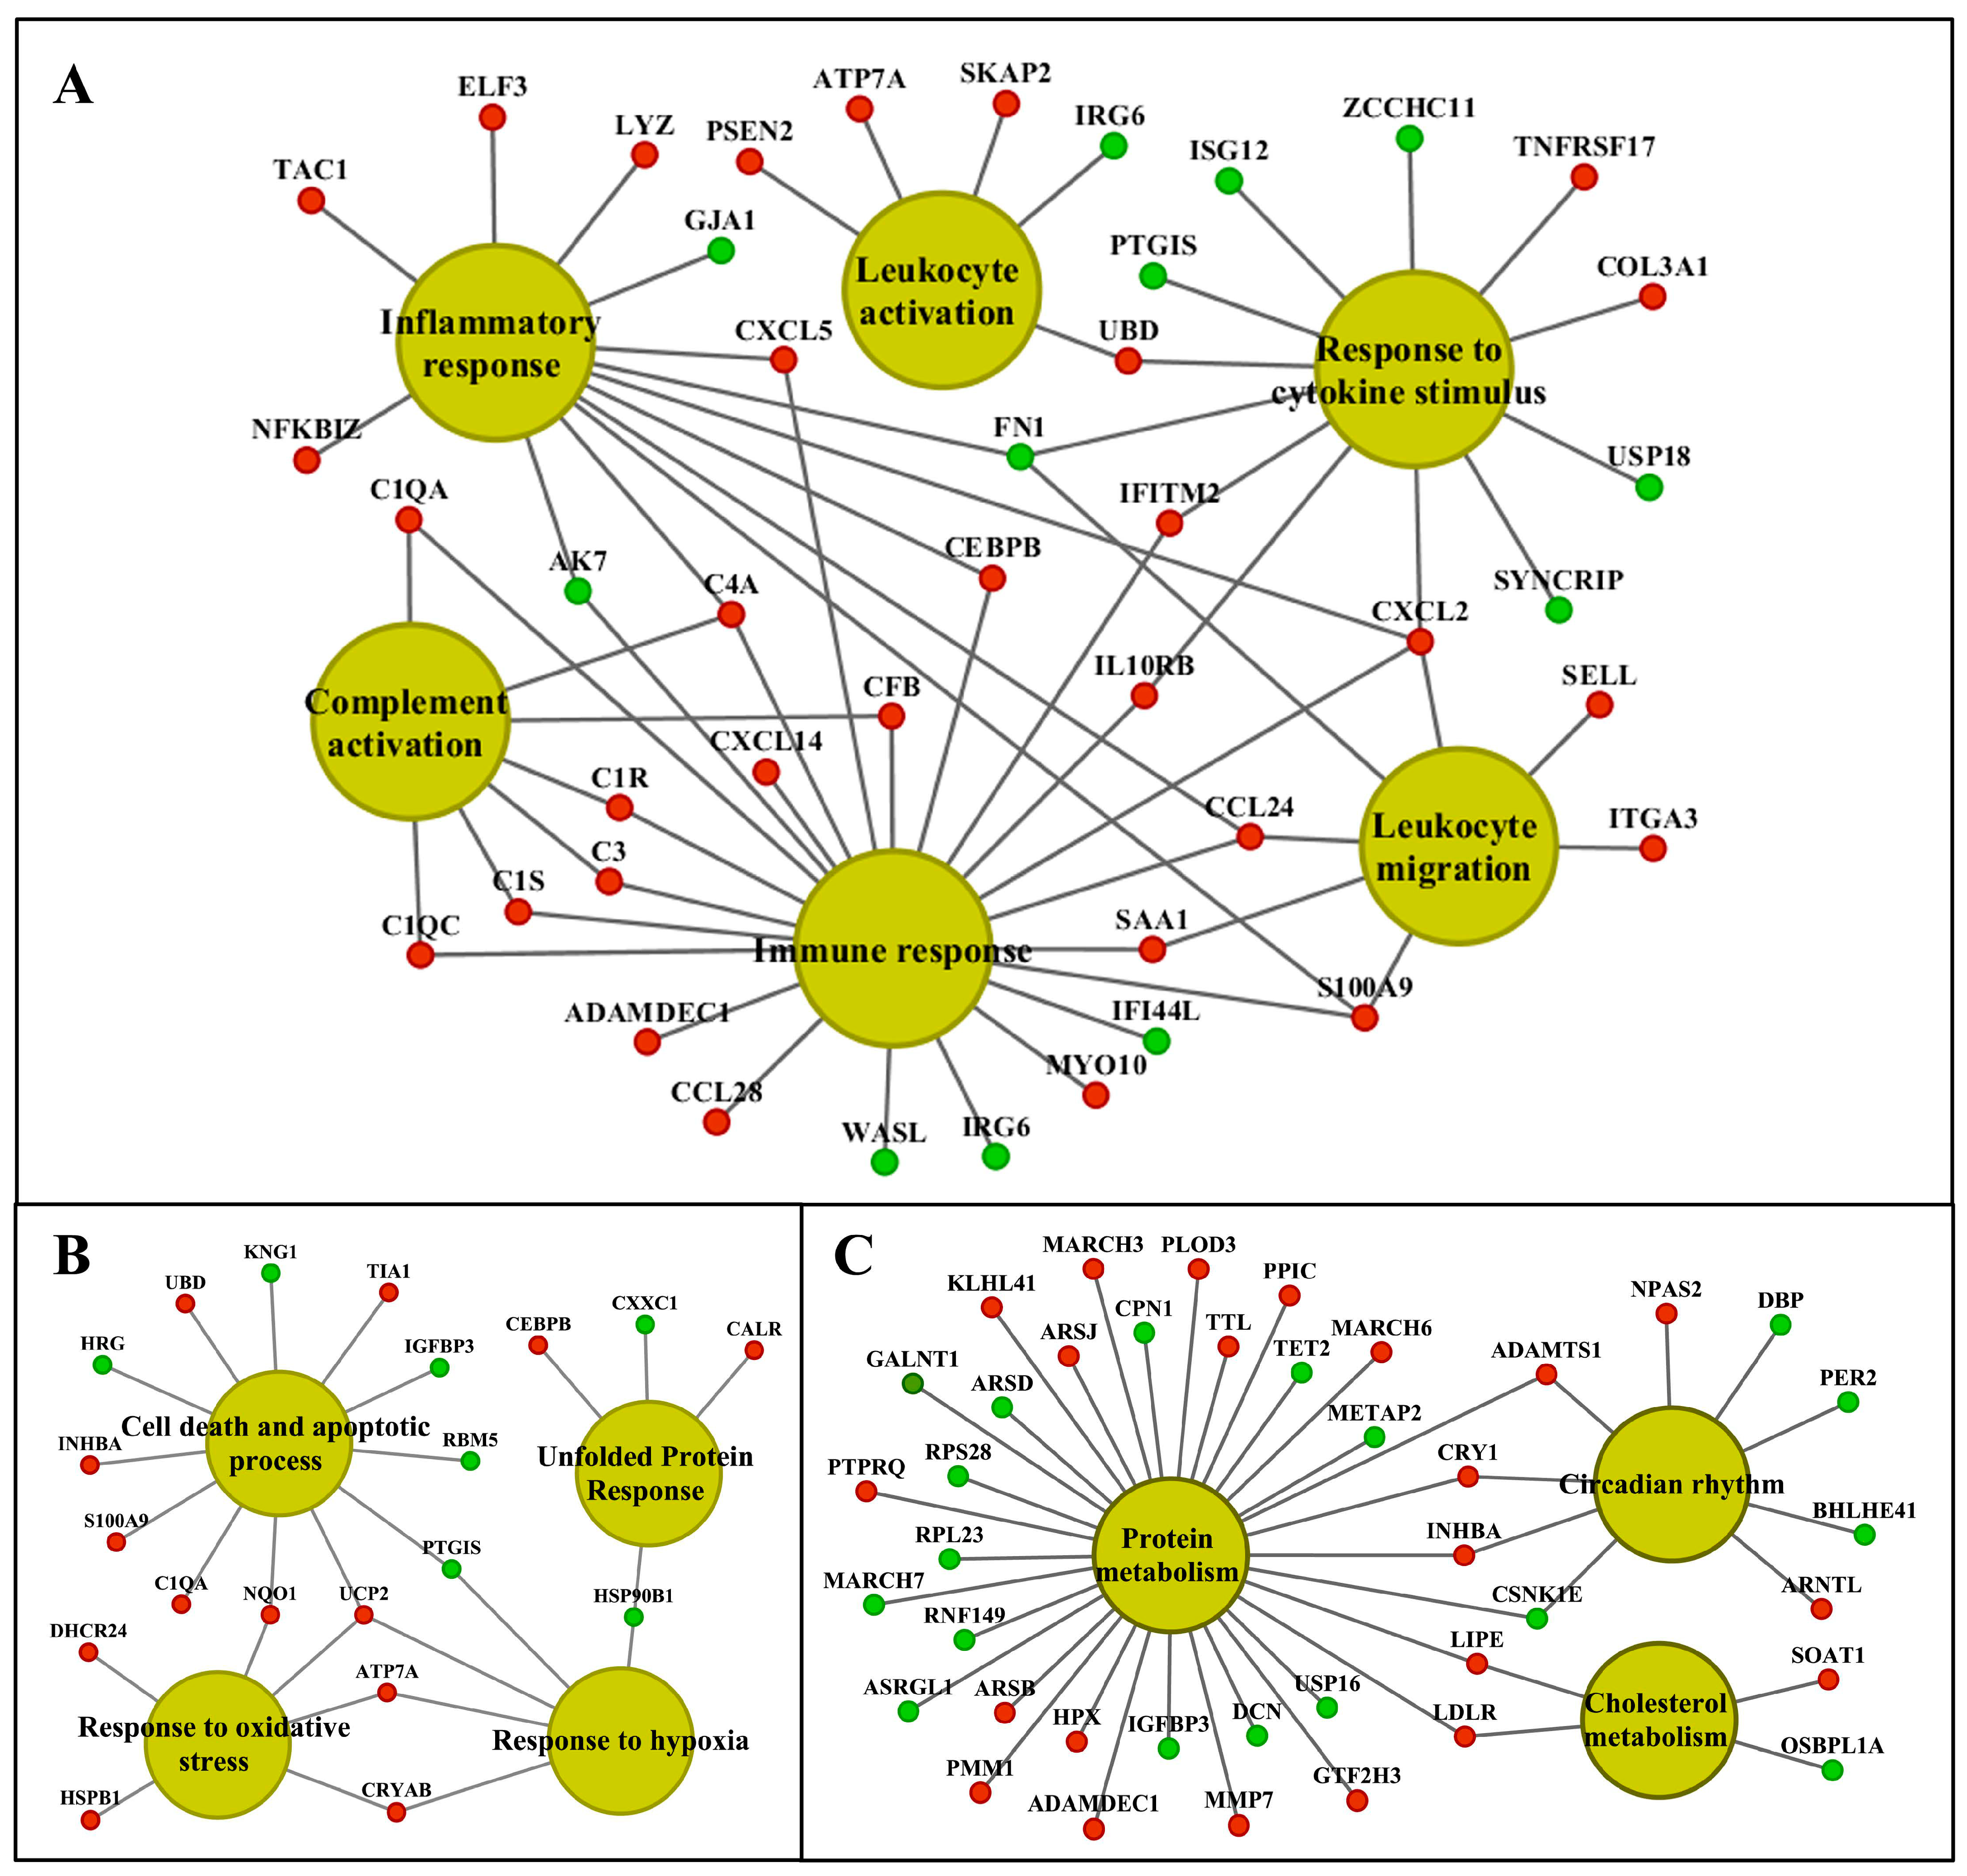
2.8. Functional Enrichment Analysis

We mapped about 93% of the genes to the human genome and considered orthologues for functional enrichment analysis. We categorized DEGs based on precompiled information available through the Gene Ontology Consortium, KEGG and BioCarta repositories, and by considering the statistical significance of enriched terms. The results imply the circadian clock, immune, inflammatory and stress responses, cell death and lipid metabolic process as being significantly changed in liver and kidney (Table 3 and Table 4). Supplementary Figures S5–S8 summarize the enriched ontology terms by considering biological processes, cellular components and molecular functions of DEGs in the liver and kidney.
Strikingly, diclofenac perturbed the core circadian clock and its associated nuclear receptor signaling pathways, i.e., ARNTL/BMAL1, NPAS2, CRY1, PER2, NR1D2/REV-ERB beta, DBP, DEC2 and RORC in the liver and kidney (Table 5). Importantly, emerging evidence suggests the suprachiasmatic nucleus harbors the master clock, and its primary task is to align metabolic functions in relation to the circadian rhythm. Diclofenac treatment caused stress that resulted in ACTH secretion and, via the hypothalamus-pituitary-adrenal (HPA) neuroendocrine axis, stimulated adrenal glucocorticoid synthesis. Testimony to increased ACTH secretion is the significant adrenal hypertrophy and thymic atrophy caused by excessive glucocorticoids in the systemic circulation (supplementary Figure S1). Furthermore, IHC confirmed increased hepatic glucocorticoid receptor (GR) activity, while the genomic data suggested GR-dependent gene regulation (Table 5). Therefore, we obtained evidence for diclofenac to disrupt the circadian rhythm with glucocorticoids affecting the liver clock to influence hepatic metabolism, immune and inflammatory responses.
The genomic study also revealed repressed DNA damage and cell cycle arrest genes to support cell cycle progression. Prominent examples are cyclin G2 (CCNG2) and CDK inhibitor 1B (p27, KIP1), which typically augment cell cycle arrest. Similarly, the repression of the centromere protein F (CENPF), the telomeric repeat-binding factor (TERF1) and DNA topoisomerase 2 highlight treatment-related changes in the control of chromosome segregation, telomerase activity and the unwinding of double stranded DNA (supplementary Table S2). Additionally, the repression of the G2 checkpoint kinase WEE1 results in premature cell division and the production of smaller cells, whereas repression of the cell cycle regulator RGC32 dampens the immune response [39].
Conversely, diclofenac treatment induced hepatic cyclin-dependent kinase (CDK) inhibitor p21 (CDKN1A) and cyclin B1 kinase inhibitor GADD45G by two-fold to endorse cell cycle arrest. Drug treatment also caused an up to three-fold induced expression of pro-apoptotic signals in the kidney, i.e., CCAAT/enhancer-binding protein beta (C/EBPβ), acute phase protein S100A9 and L-selectin (SELE). In support of cellular defense, the histidine-rich glycoprotein (HRG) and the small heat shock protein family members CRYAB and HSP27 were induced by two-fold in the liver. Moreover, quinone 1 oxidoreductase (NQO1), i.e., an antioxidant defense enzyme, was three-fold induced in the kidney (supplementary Table S2).
Furthermore, the rate-limiting enzyme in bile acid synthesis, i.e., CYP7A1, and the liver receptor homologue 1 (NR5A2) were repressed by four- and two-fold. We observed a similar two-fold repressed expression for acyl-CoA oxidase (ACOX) which degrades C27-bile acid intermediates in peroxisomes, as well as the bile salt transporters ABCA8 and SLCO1B3 with critical roles in bile acid and bilirubin transport. Additionally, members of the gluconeogenesis pathway, e.g., glucose-6-phosphatase (G6PC), phosphoglycerate dehydrogenase (PHGDH), tyrosine aminotransferase (TAT) and PPARGC1A were repressed in expression by two-fold.
Besides, histopathology revealed diclofenac treatment to induce hepatic steatosis, and the genomic study informed the significant regulation of genes coding for lipogenesis, lipid transport, lipid droplet growth, ER stress and fatty acid oxidation (Table 6).
Thus, diclofenac treatment caused major changes in lipid homeostasis, and this included the lipid-droplet-associated PLIN2, ELOVL2, VLDLR and the ER-localized calreticulin (CALR), the calcium transporter ATP2A2, AGPAT9 and the cytoskeletal intermediate filament protein keratin 8 (KRT8) were induced up to five-fold. Conversely, the fatty acid synthase (FASN), mevalonate kinase (MVK) and the cholesterol transporter caveolin-1 (CAV1) were repressed by three-fold.
Among immune responses, the alternate pathway was regulated up to three-fold, as shown by the induced C7 and C9 expression changes in the liver. Moreover, the classical pathways, i.e., C1QA, C1QC, C1R, C1S, C3, C4A, CFB and CFH, were up-regulated by three-fold in the kidney after high-dose diclofenac treatment.
Pathway mapping revealed altered MAPK, interferon-γ and PPAR signaling in the liver. Additionally, members of the PI3K-AKT signaling pathway were regulated by two-fold in the liver and kidney (Table 3 and Table 4 and supplementary Table S2).
We visualized the enriched GO terms with the ClueGO and the GeneXplain software (Figure 8 and Figure 9); the mapping of GO terms for the low-dose treatment group is given in supplementary Figure S9. Specifically, the ClueGO software grouped 125 hepatic DEGs into three distinct pathways, i.e., inflammation, circadian rhythm and metabolism, and we obtained similar results with the GeneXplain software. Here, we grouped 142 DEGs into these pathways. For the kidney, the ClueGO software assigned eighty-nine DEGs to seven major pathways, once again highlighting inflammation, response to cytokine signaling, complement cascades, wound healing and extracellular matrix, circadian rhythm, lipid and glucose metabolism, response to hypoxia, TGFß signaling and regulation of apoptotic processes. GO enrichment with the GeneXplain software produced almost identical results, and 119 DEGs were grouped into the respective pathways. Collectively, the consensus between the two different software demonstrates robustness of the findings, even though the number of DEGs mapped to GO terms differed between them.

2.9. Commonly Regulated Genes in Liver and Kidney

Diclofenac treatment caused organ-specific and tissue-independent genomic responses, with 43 genes being regulated in common (Table 7); the top-ranking biological pathways were immune and inflammatory responses and the circadian clock. Among commonly regulated genes in the liver and kidney are the pro-inflammatory CXCL2, LYZ and S100A9, which were up to seven-fold induced in both organs.

2.10. Molecular Networks in Liver and Kidney

We searched the STRING database version 10.5 for protein-protein interaction (PPI), and 60% (92 out of 153 genes) and 67% (325 out of 488 genes) of DEGs engaged in 217 and 885 interactions in the liver network after low- and high-dose treatments (supplementary Figure S10A,B). In the case of the kidney, 53% (76 out of 144 genes) and 63% (180 out of 286 genes) of DEGs function in 105 and 412 PPI, respectively (supplementary Figure S11A,B).

2.11. Master Regulators and Their Associated Networks

Shown in Table 8 are master regulators and their regulation in the liver and kidney in response to diclofenac treatment. Except for cryptochrome 1 (CRY1) and the lipopolysaccharide-induced TNF factor (LITAF), the majority of master regulators were significantly repressed in expression. Furthermore, we identified CRY1 as a master regulator in low- and high-dose diclofenac treatments. Likewise, kidney genomic responses revealed matrix metallopeptidase 7 (MMP7), complement component 1 (C1QA) and nuclear factor of kappa light polypeptide gene enhancer in B cells inhibitor, zeta (NFKBIZ) as significantly induced, while another four master regulators were repressed in expression.
The computational analysis defined the circadian clock gene CRY1, hypoxia inducible factor 1, alpha subunit (HIF1A) and nuclear receptor subfamily 3, group C, member 1 (NR3C1) as master regulators in the liver and their associated networks involved 27, 39 and 42 DEGs after low-dose diclofenac treatment. Similarly, high-dose diclofenac networks involved 66, 111, 111 and 77 DEGs with CRY1, insulin-like growth factor binding protein 2 (IGFBP2), LITAF and angiopoietin-like 4 (ANGPTL4) as master regulators.
Additionally, dipeptidyl-peptidase 4 (DPP4), which inactivates glucose-like peptidase 1 and therefore insulin secretion, angiopoietin 1 (ANGPT1) and sirtuin 1 (SIRT1); i.e., NAD-dependent deacetylase are key regulators in the kidney after low-dose diclofenac treatment and encompassed 40, 25 and 38 DEGs in their networks, respectively. The high-dose diclofenac treatment revealed MMP-7, C1QA, NFKBIZ and insulin-like growth factor binding protein 3 (IGFBP3) in the kidney as master regulators, and the associated networks consisted of 52, 49, 56 and 56 of DEGs, respectively.
Subsequently we constructed an integrated master regulator network and the fused liver networks comprised 29% (44 out of 153 genes) and 24% (119 out of 488) of DEGs after low- and high-dose diclofenac treatments (Figure 10 and supplementary Figure S12A).
Similarly, 28% (41 out of 144) and 20% (58 out of 286) of DEGs were regulated in the kidney in response to low- and high-dose treatments (Figure 11 and supplementary Figure S12B). Intriguingly, we confirmed the previously reported diclofenac liver master regulators for mice and dogs, i.e., CD44, LEPR and THBS1, in the fused networks in minipigs, and the high-dose kidney network also contained CD44, S100A8 and selectin E.

2.12. Enriched Transcription Factor Binding Sites for the Liver Clock

Figure 12 depicts the liver clock and its target genes. The core and auxiliary loops of the circadian clock consist of several transcription factors, which interact with E-box and RORE binding sites in the promoters of DEGs. Initially, we considered the number of TFBS in promoters of regulated genes for the core circadian transcription factors, i.e., BMAL1, CLOCK, NPAS2, REV-ERBA, REV-ERBß and RORC, in addition to transcription factors which participate in liver clock oscillation, i.e., GR, DBP, FXR, HNF4A, HNF6, PPARA and DEC2. For instance, the transcription factor DEC2 acts as a transcriptional repressor of orexin, i.e., a neuropeptide of the circadian clock, and, although nearly three-fold repressed, did not influence the expression of orexin. This neuropeptide connects the hypothalamus with the liver via hypocretin signals to influence liver metabolism [40], and an immunoprecipitation study revealed DEC2 to interact with E12 and MyoD1 on the prepro-orexin gene promoter [41].
Together, we observed significant differences in transcriptional responses to BMAL1, CLOCK, REV-ERBA and DEC2 targeted promoters (supplementary Figure S13 panel C) with expression of genes coding for glucose, lipid and bile acid metabolism being influenced by the number of TFBS, i.e., a reduced number of TFBS was significantly linked to repressed expression of target genes. However, with HNF6, an increased number of binding sites was associated with repressed DEGs. Supplementary Figure S14 displays the average number of TFBS obtained for the different PWMs. The computational analysis suggested the number of TFBS to influence the transcriptional responses to BMAL1, CLOCK, REV-ERBA, DEC2 and HNF6 (supplementary Figure S13). We found 77% of DEGs to contain enriched TFBS for components of the liver clock, i.e., BMAL1, CLOCK, NPAS2 and GR, in response to diclofenac treatment.

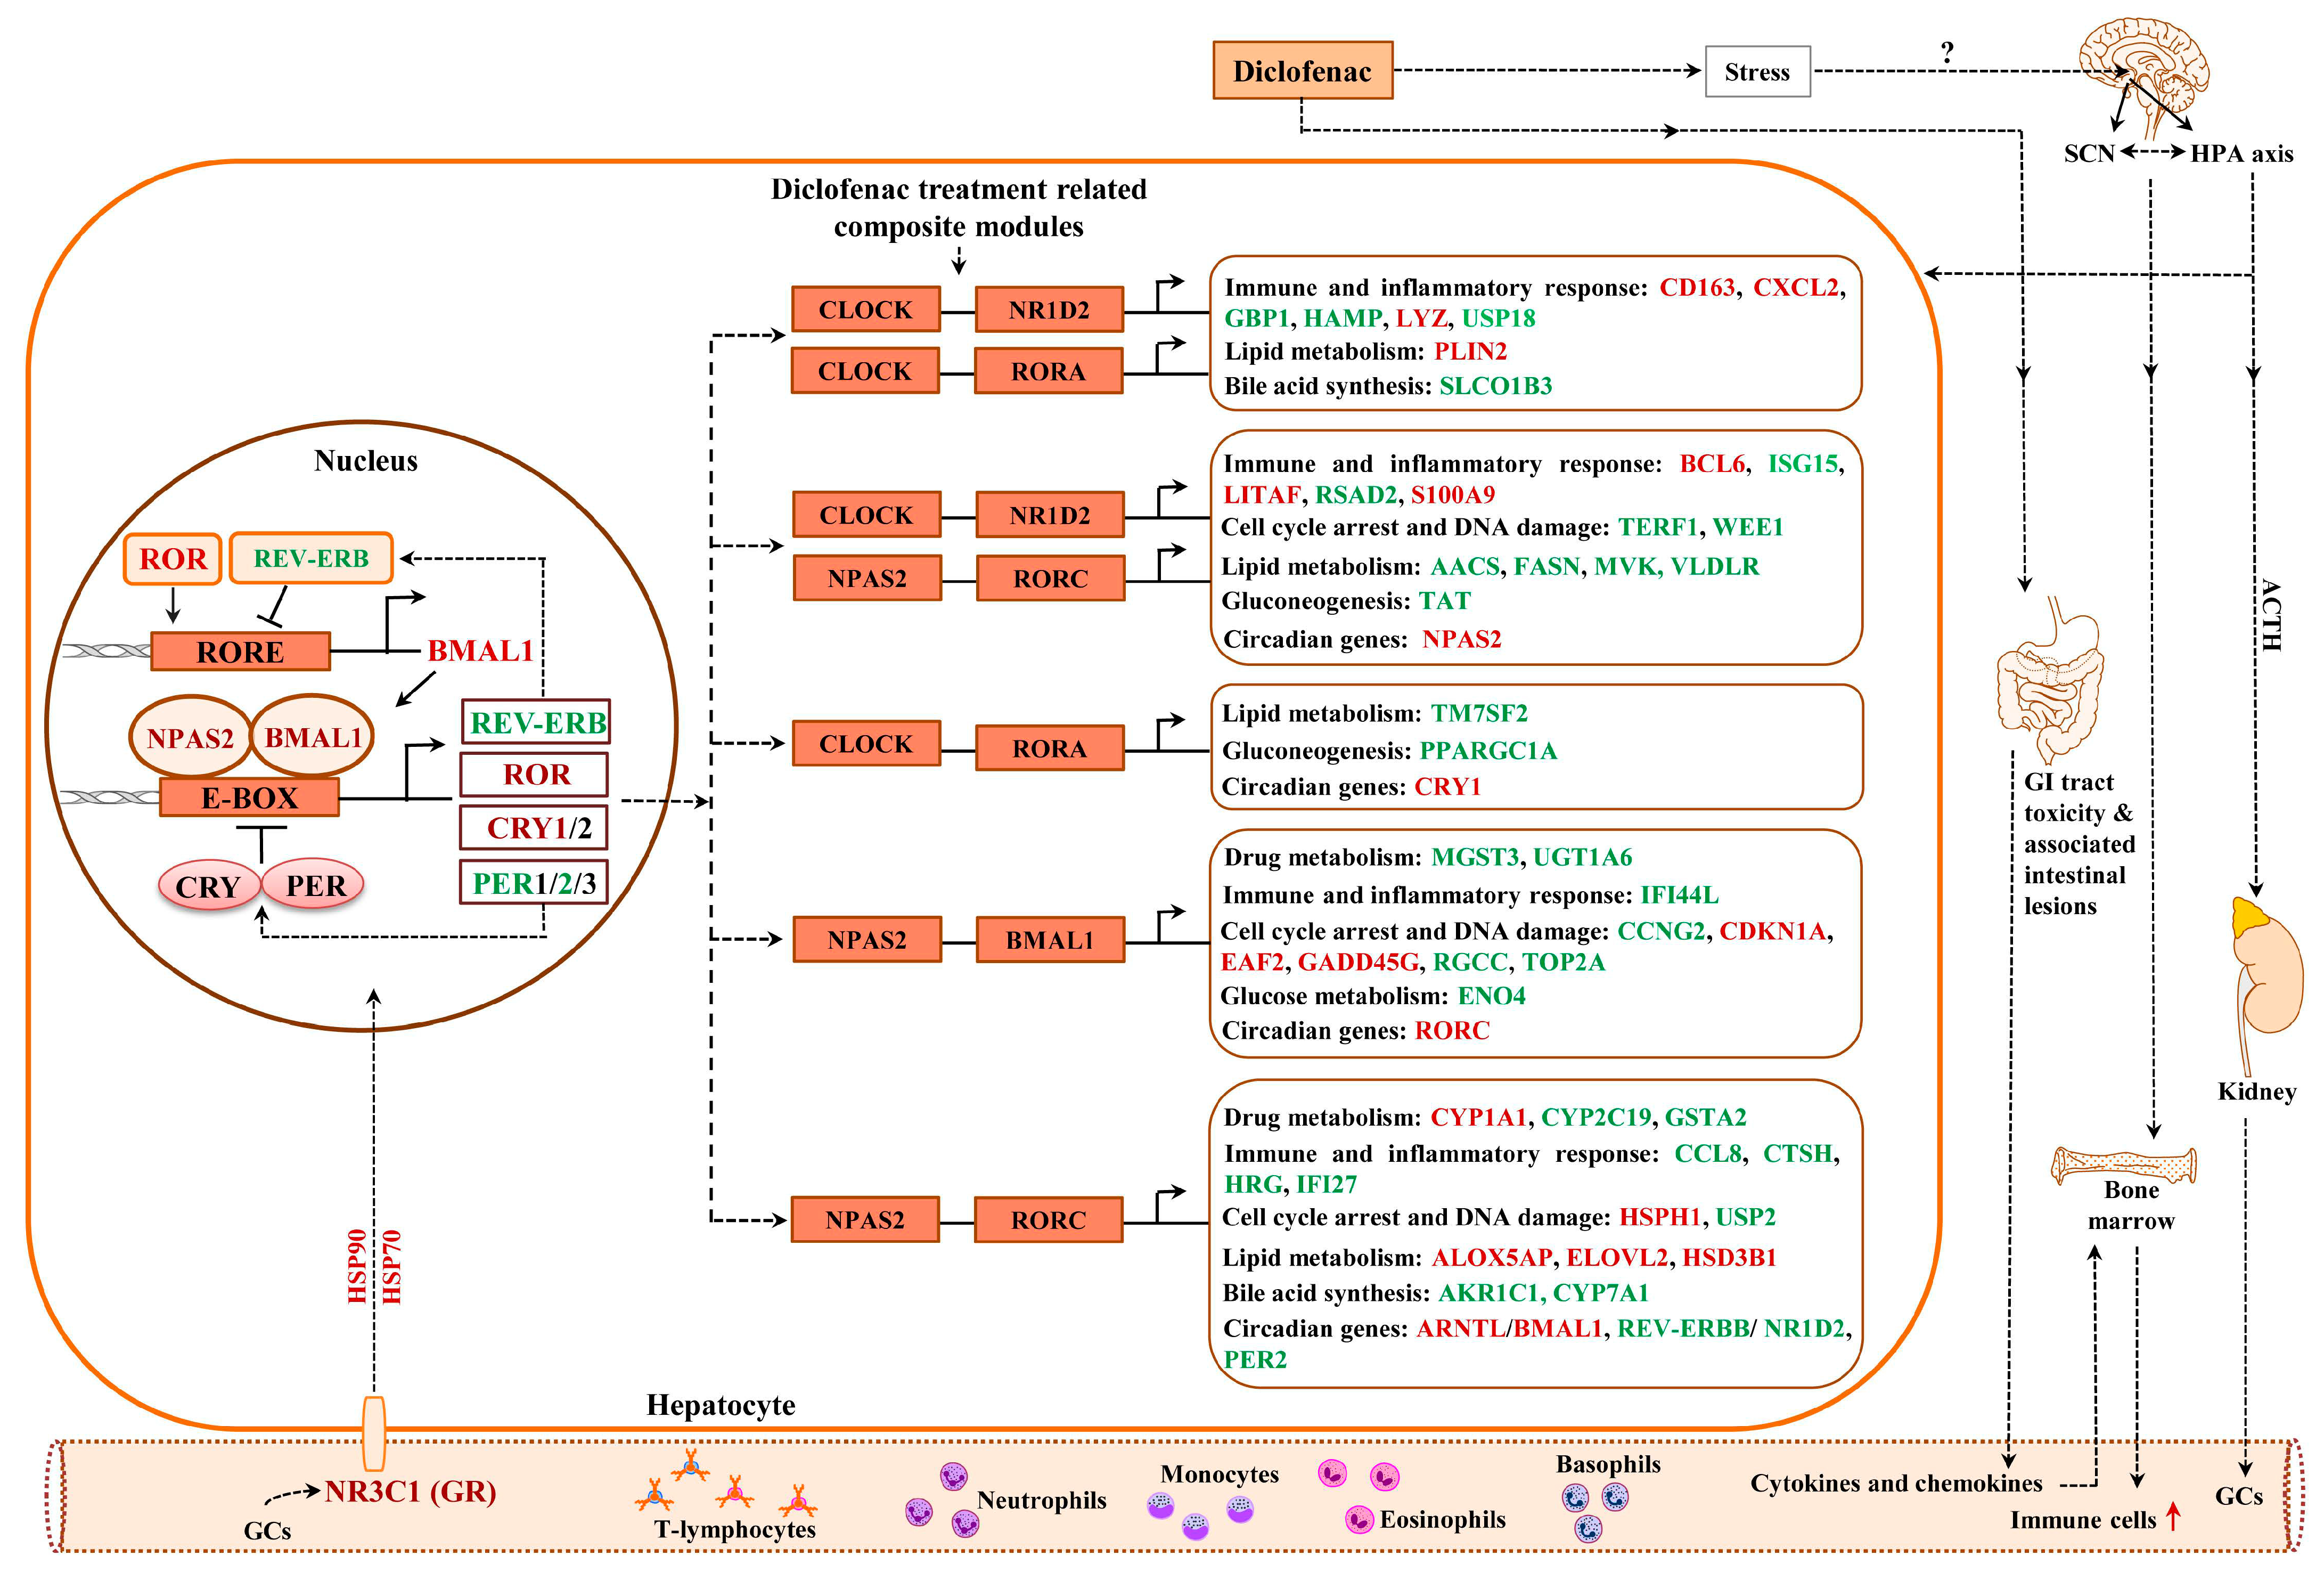
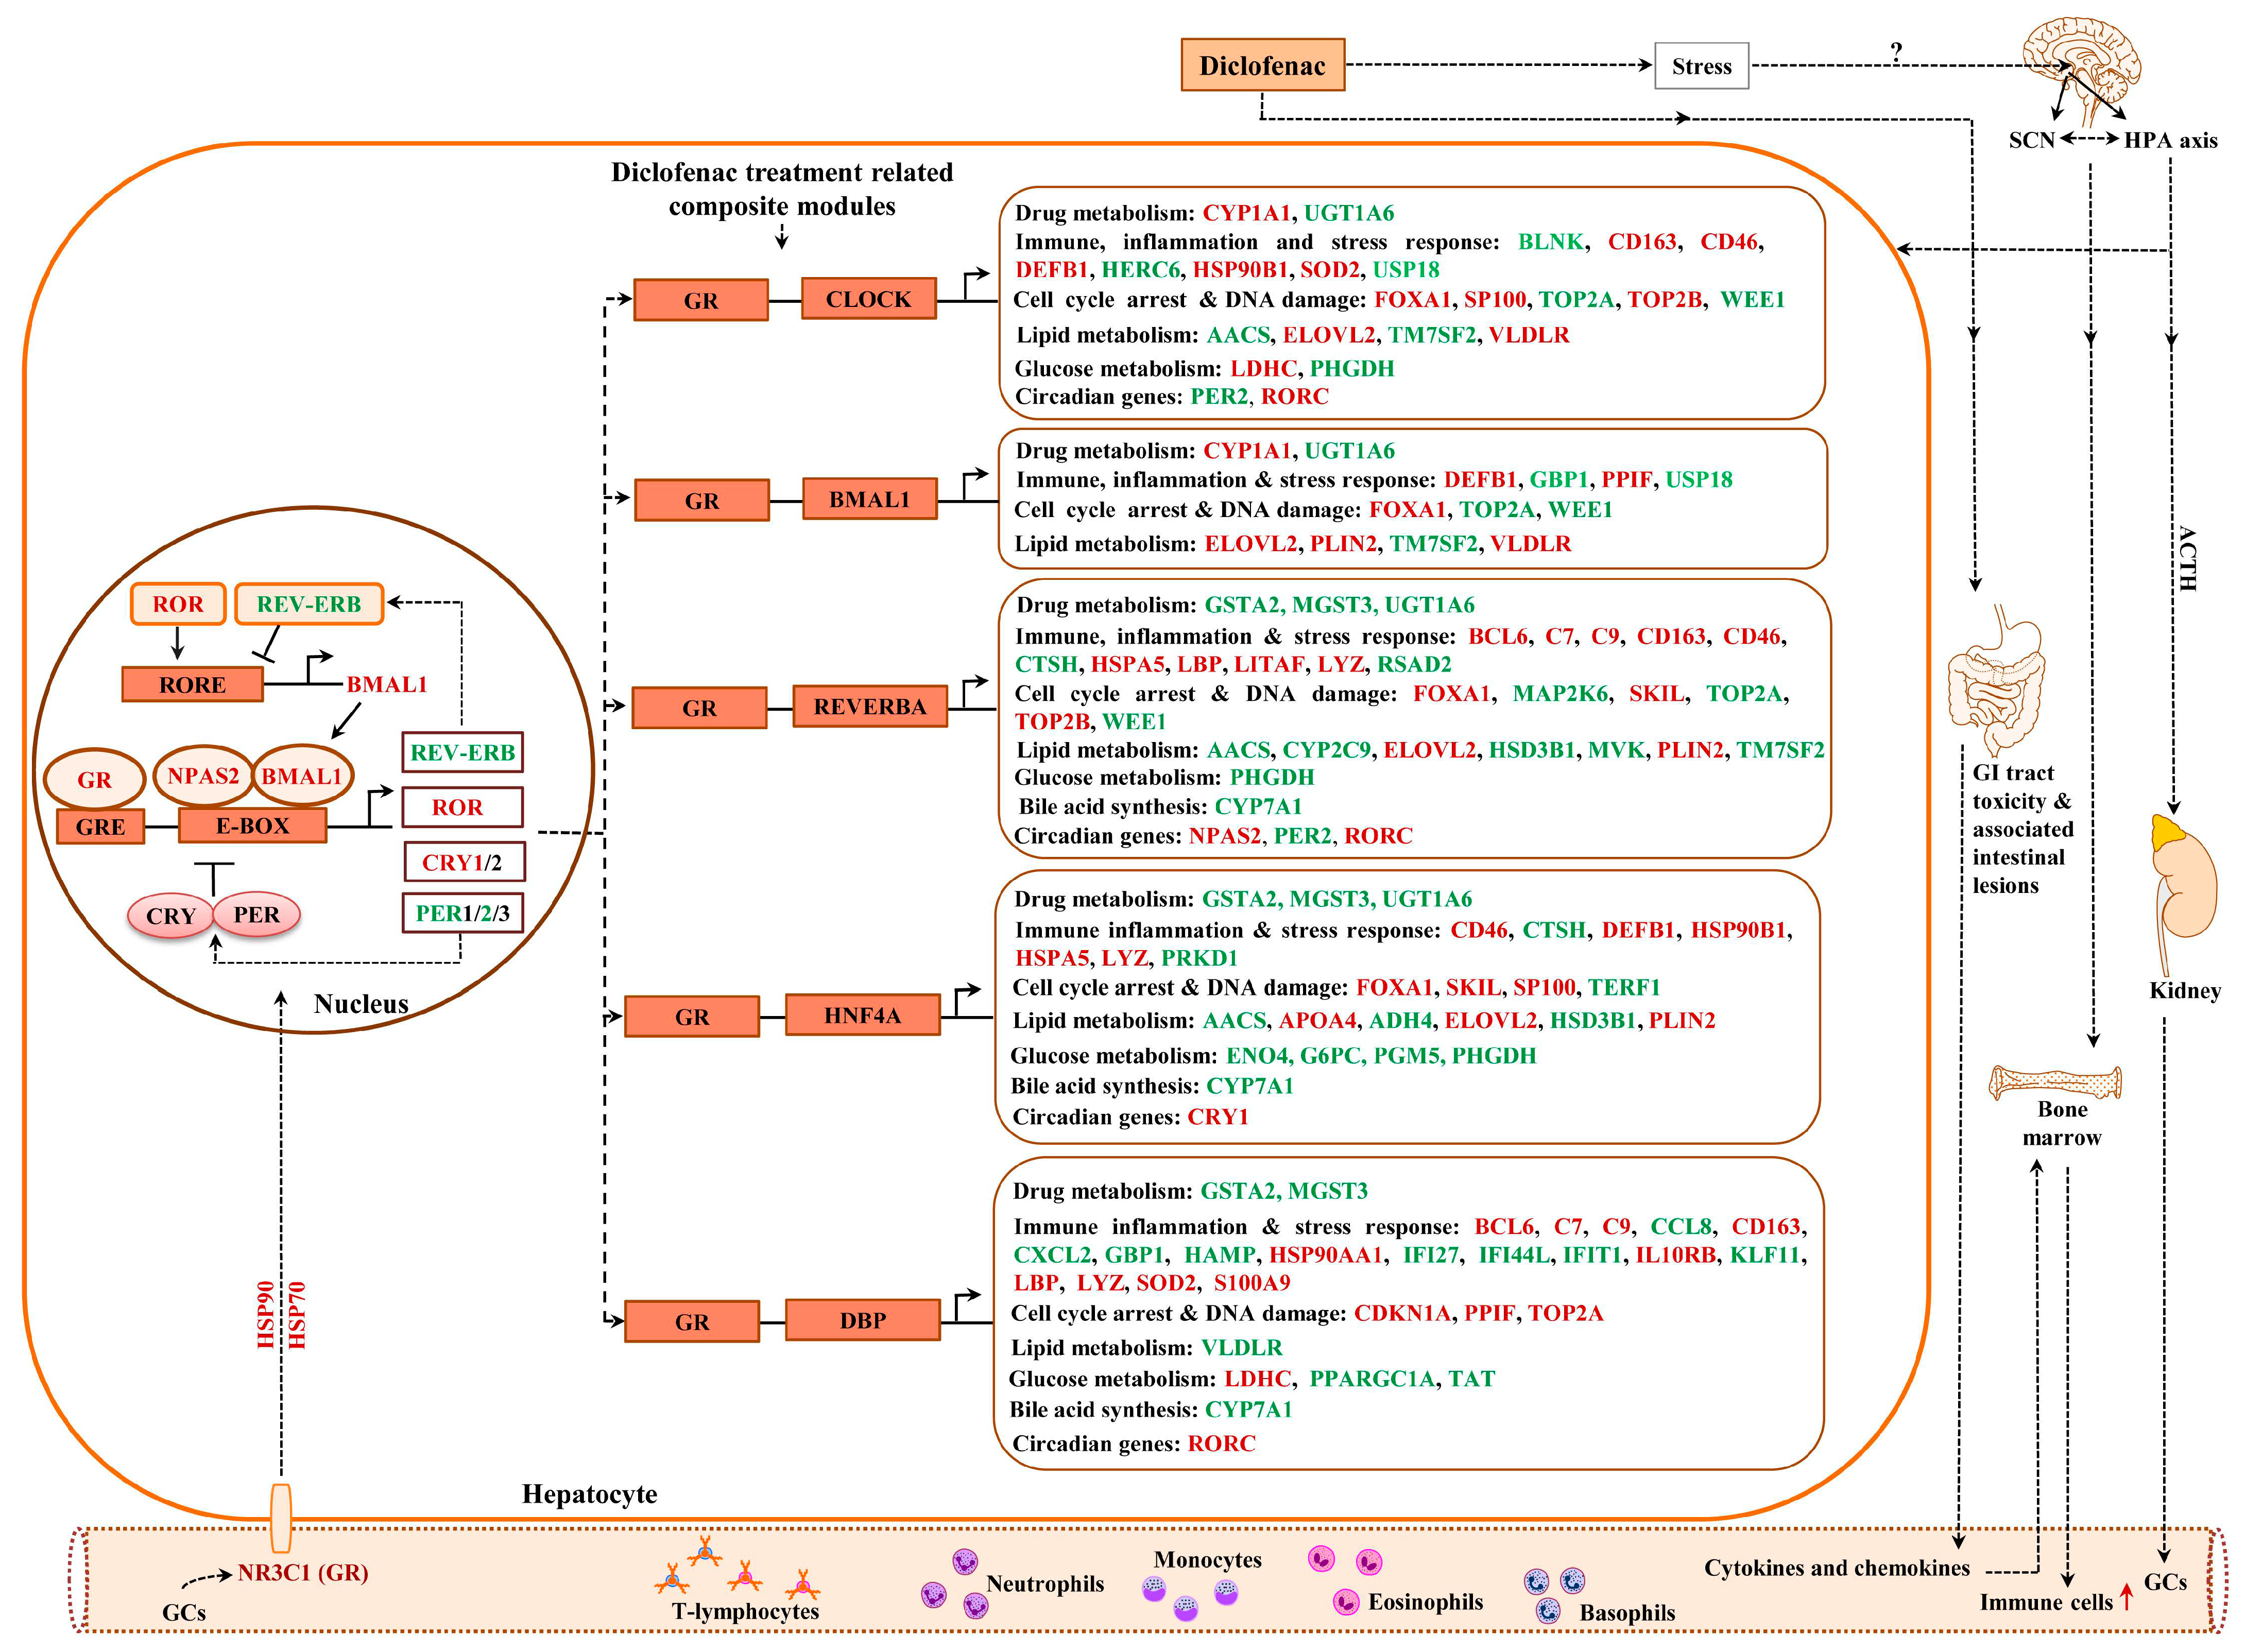
2.13. Composite Modules of the Circadian Clock and Glucocorticoid Receptor

Given the significant enrichment of TFBS for liver clock components in DEGs (supplementary Table S3) and to increase the specificity of our findings, we considered the co-occupancy of several enriched TFBS at gene-specific promoters. We examined liver-clock-associated transcription factors and considered the number of TFBS acting on E-box motives as heterodimeric complexes.
Shown in Figure 12 and Figure 13 are composite modules of enriched liver clock and glucocorticoid-receptor-regulated genes in response to diclofenac treatment. The composite modules were constructed based on the significant enrichment of CLOCK-NR1D2, NPAS2-BMAL1, CLOCK-RORA and NPAS2-RORC heterodimeric complexes acting on gene-specific promoters of immune, stress, inflammation, hypoxia, acute-phase response, oxidation-reduction and cell-death-coding genes (Figure 12). Strikingly, 82% of DEGs were enriched for the liver clock heterodimeric complexes, notably CLOCK-NRD1D2, CLOCK-RORA, NPAS2-RORC and NPAS2-BMAL1.
We used the same strategy to investigate liver clock and glucocorticoid receptor interactions (Figure 13) and, for 64 % of DEGs, the composite modules consisting of the liver clock and the glucocorticoid receptor were significantly enriched, notably GR-BMAL1, GR-CLOCK and GR-ReverbA (see Z-score, supplementary Table S4).

2.14. GR Signaling

We have already emphasized the importance of the glucocorticoid receptor signaling pathway and the circadian clock (see above) in genomic responses to diclofenac treatment. Now, we consider glucocorticoid receptor activities independent of the liver clock. Oakley and Cidlowski [42] proposed a model of direct, tethering or composite GR activity that results in activated or repressed transcriptional responses. We applied the proposed rules and, in the case of the direct model, juxtaposed GR binding sites in addition to the coactivators or corepressors that are required (Figure 14).
Based on such rules, all 214 up-regulated DEGs fulfilled such criteria, while, for 231 repressed DEGs, a total of 175 or 76% agreed with the set rule (supplementary Table S5). Similarly, the tethering model of up-regulated DEGs relies on juxtaposing STAT3 binding sites to interact with the GR receptor. Here, we compared a set of 600 randomly chosen non-regulated genes with diclofenac-regulated genes and found 171 or 80% of up-regulated DEGs to fulfill this criterion. Conversely, for repressed DEGs, the tethering model requires interaction of the GR with NFKB binding sites; however, only four DEGs fulfilled such criteria. Finally, we evaluated the composite model that is composed of GR and STAT5 recognition sites. Once again, 207 out of 214 up-regulated DEGs or 97% fulfilled this requirement. In the case of transcriptional repression, the composite model foresees the interaction of GR with AP binding sites, but only 35 genes qualified (supplementary Table S5). We compared the findings of the different models, and, for up-regulated genes, the different models produced almost identical results; i.e., 172 genes or 81% of GR-targeted genes were in common. However, for down-regulated genes, there were no significant differences between the DEGs qualifying for the GR tethering model, and only three DEGs overlapped in the GR direct and GR composite models (supplementary Figure S15).

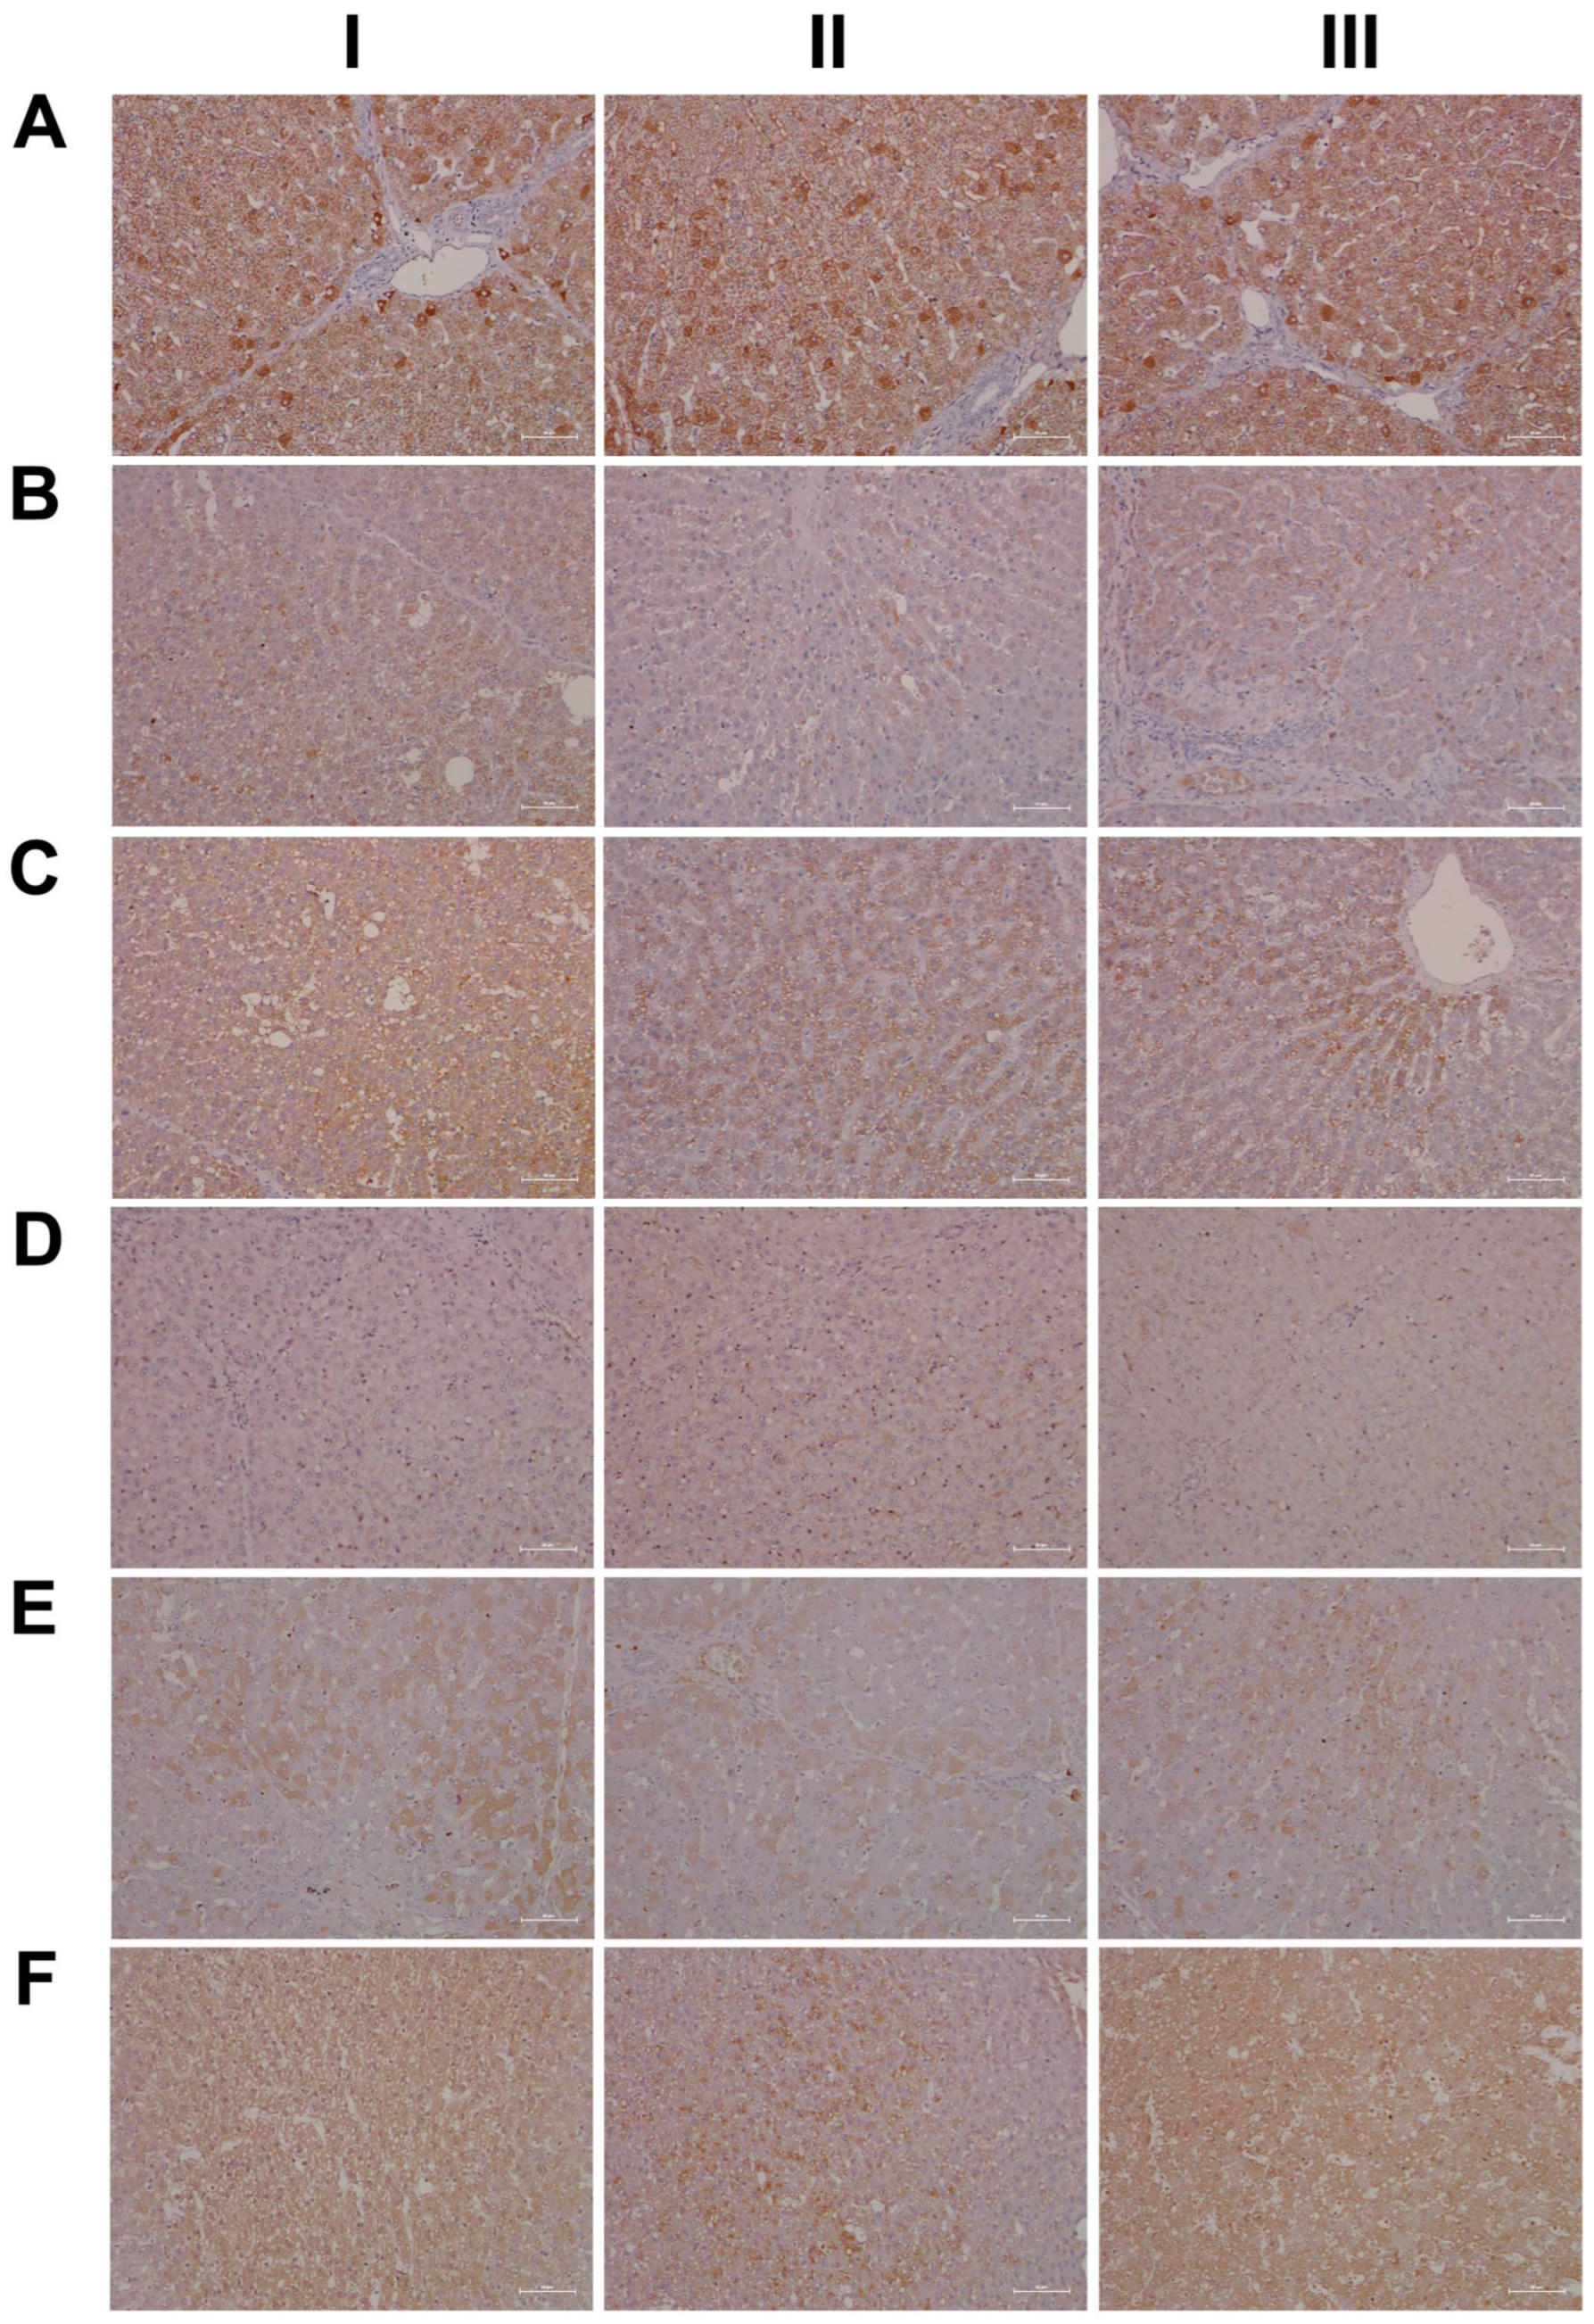
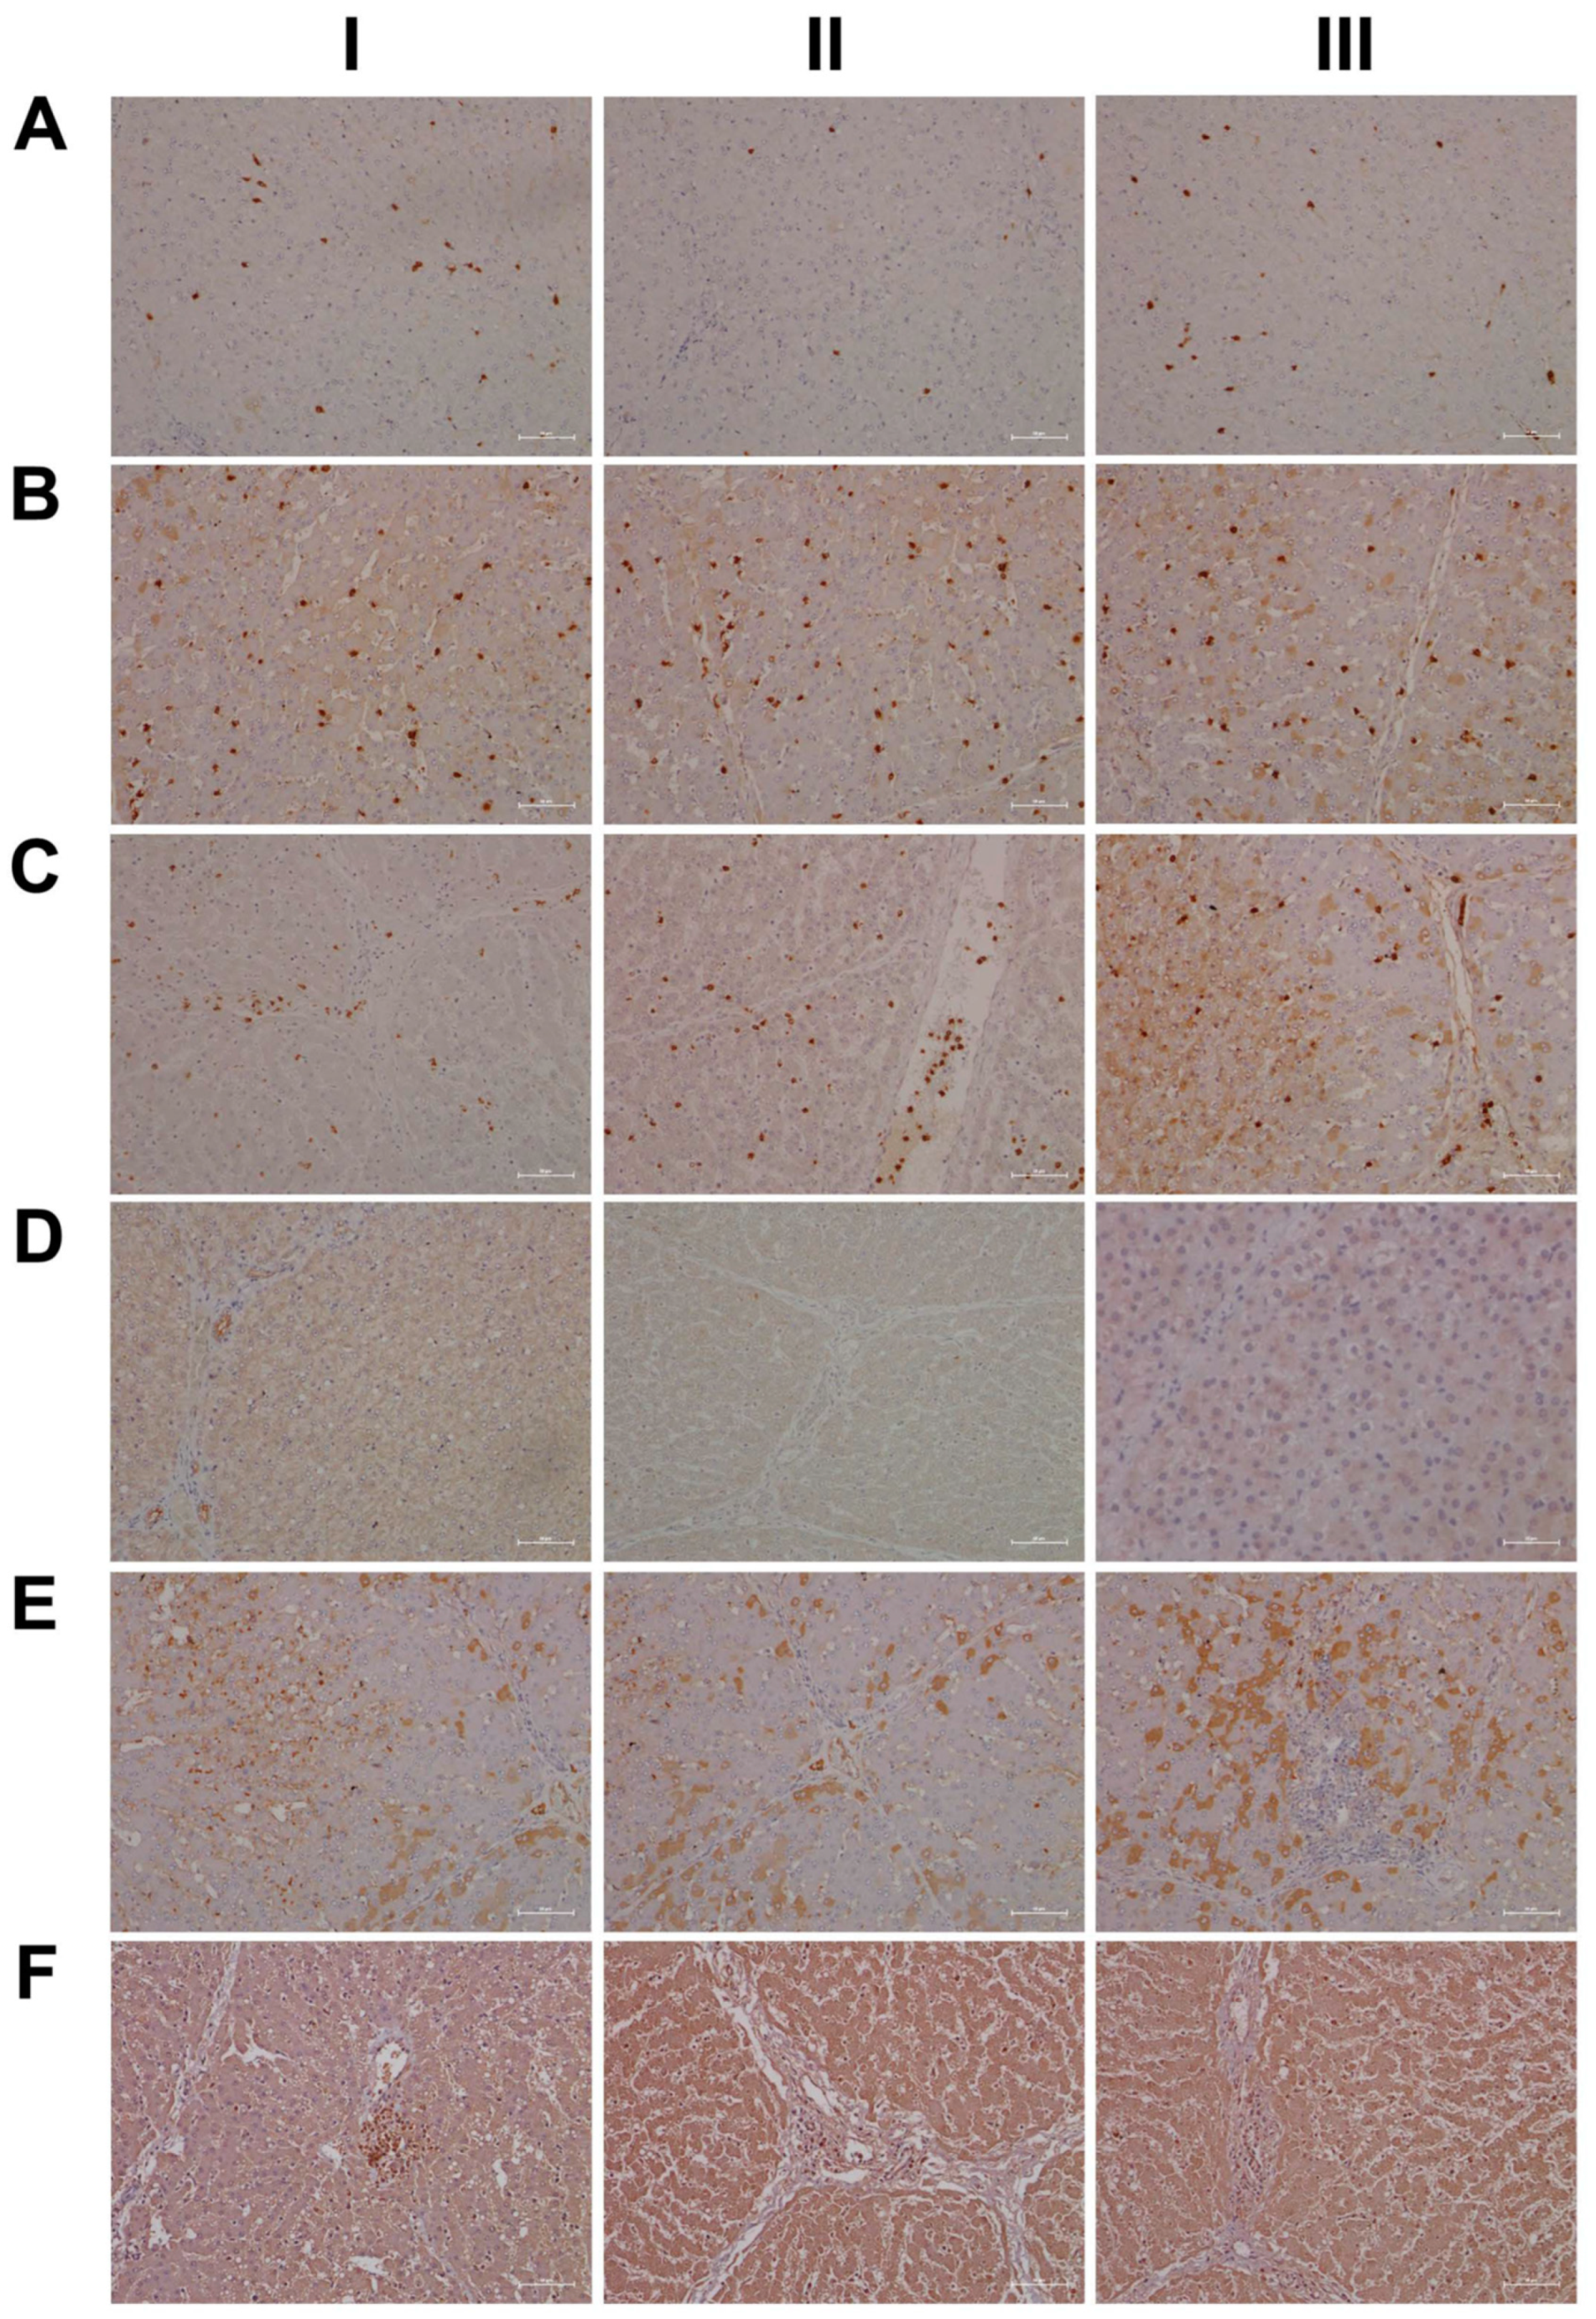
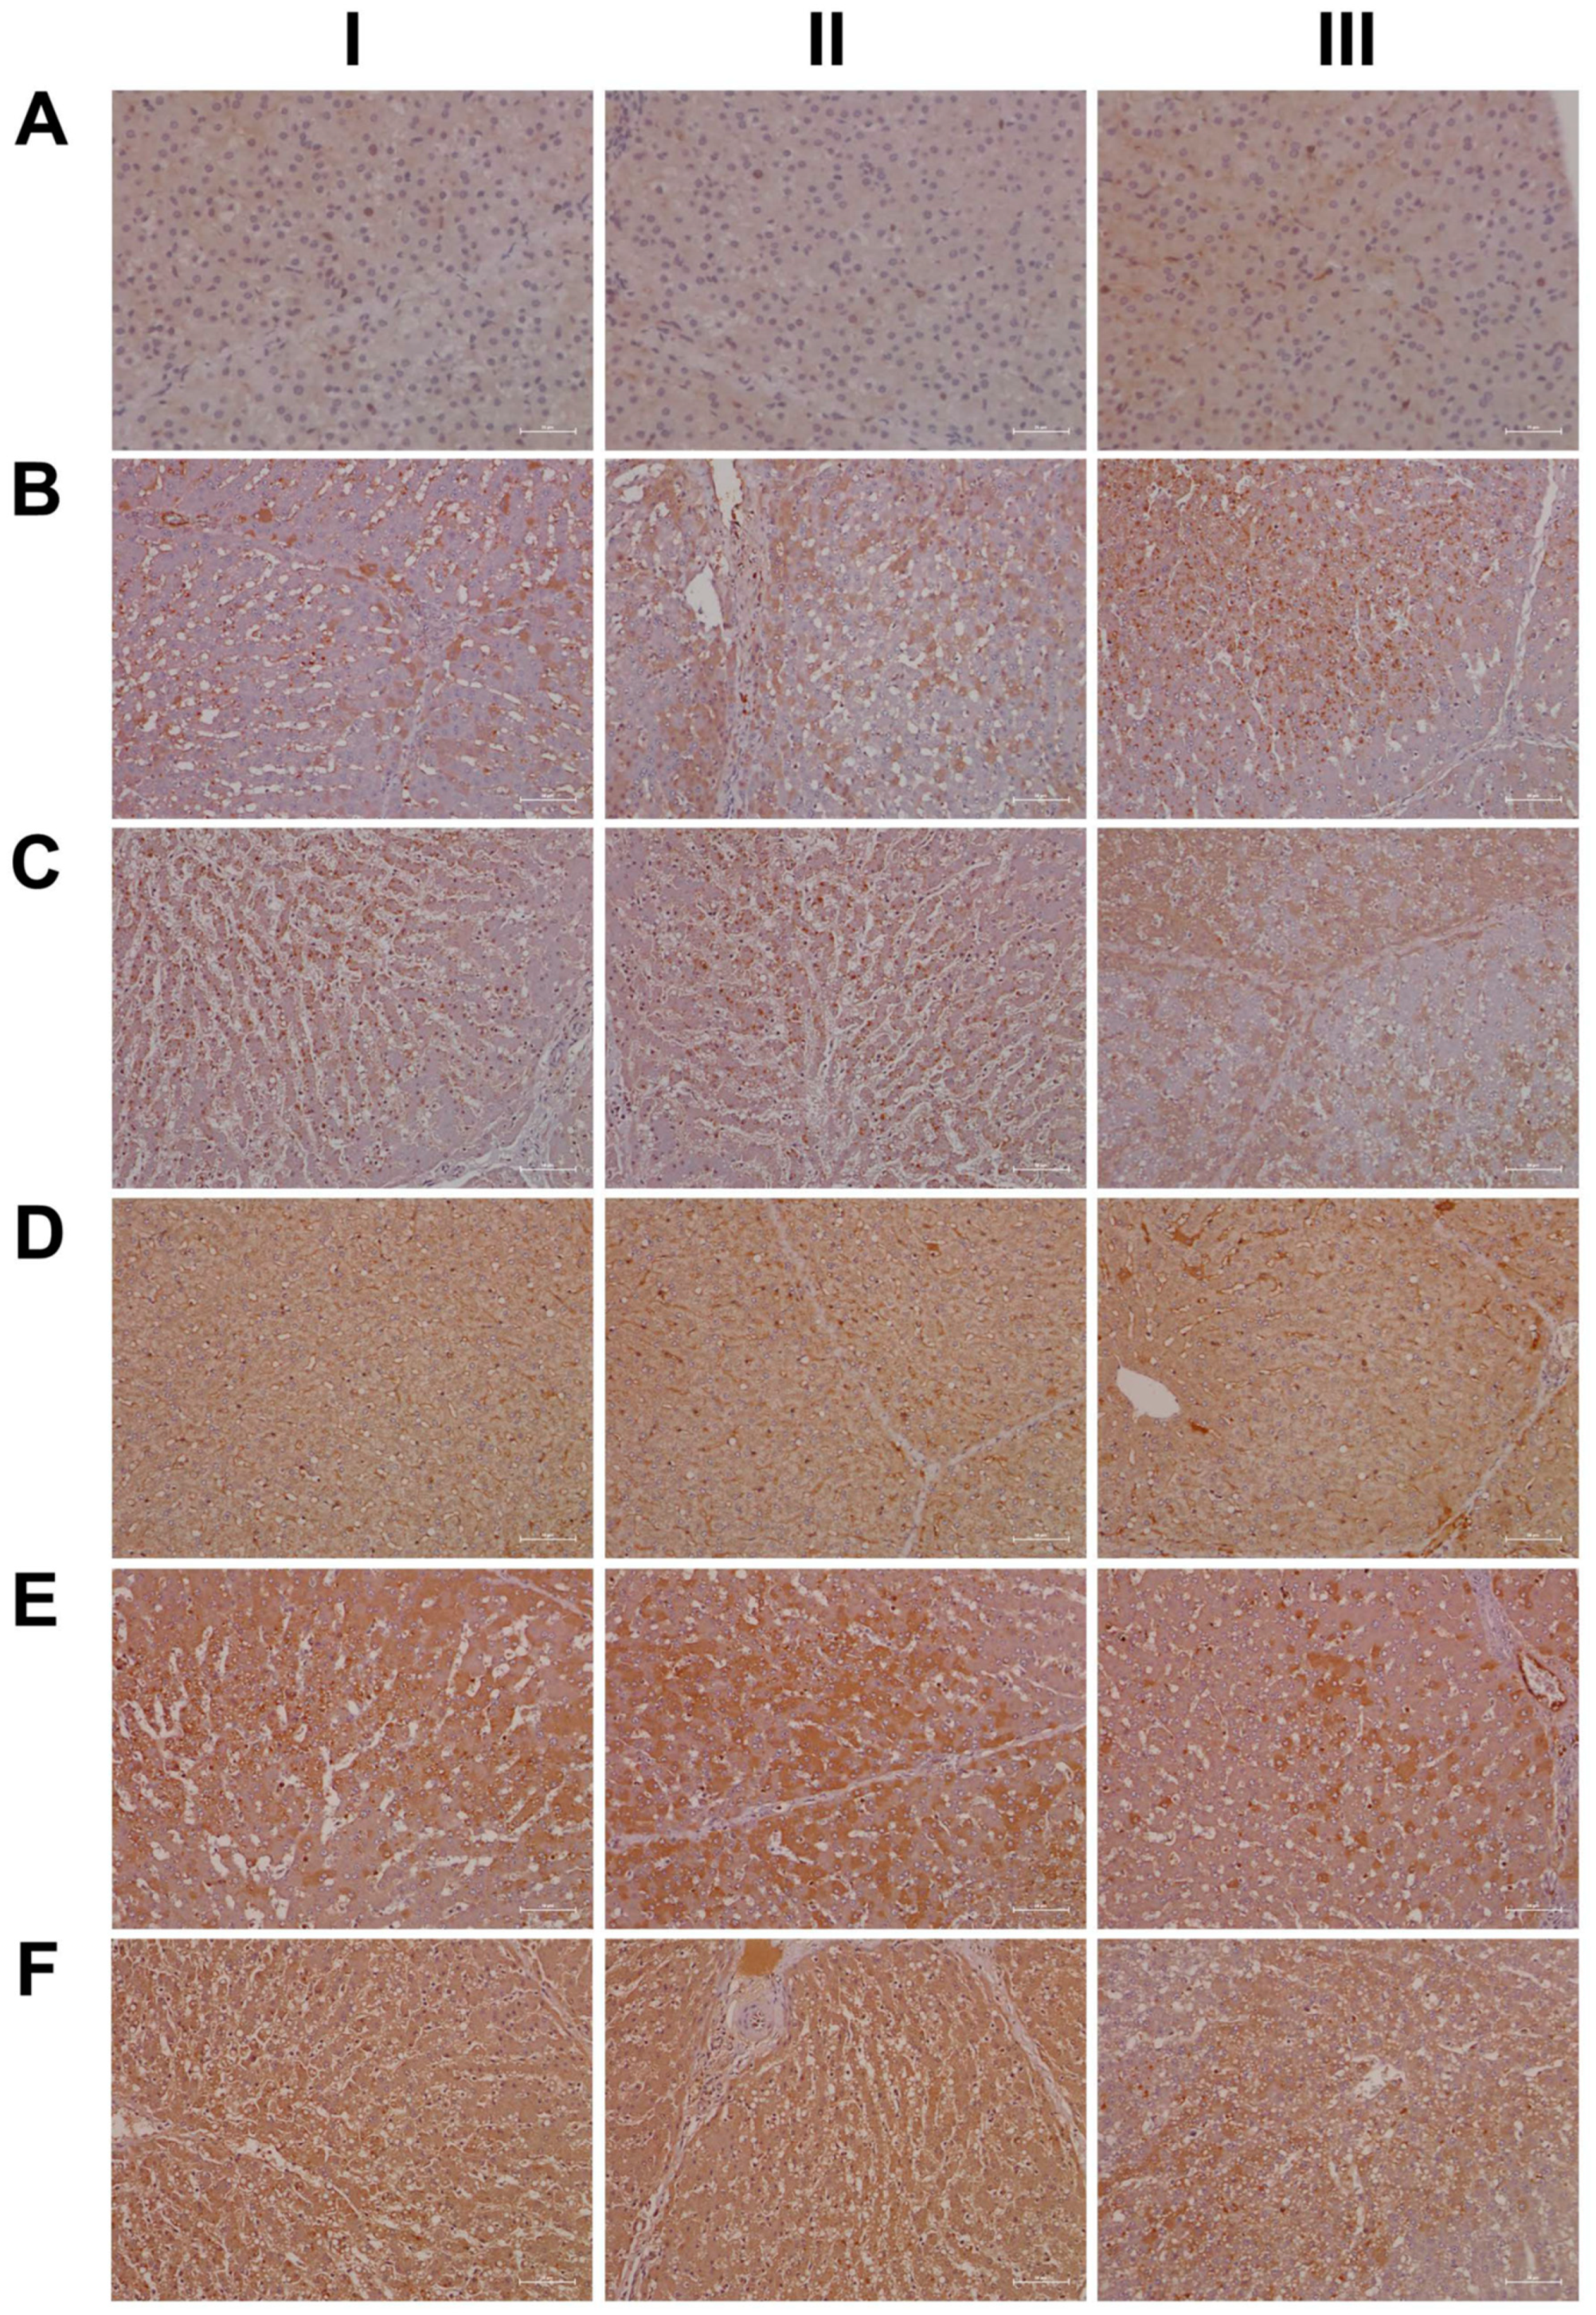
2.15. Immunohistochemistry Confirms Regulation of Liver Clock Components

A complex relationship exists between the circadian clock and inflammation [43,44,45], and, in the present study, nearly 80% of DEGs contained enriched TFBS for components of the liver clock, i.e., BMAL1, CLOCK, NPAS2 and GR. Indeed, PER1/2 and CRY1/2 are clock target genes and, through a negative feedback loop, both proteins repress their own expression by blocking the activity of the BMAL-CLOCK heterodimeric TF complex on E-box motives of targeted promoters [46].
Shown in Figure 15 (panel AI–III) are representative images of liver sections from three individual control animals, and disseminated throughout the liver lobule are Per2-positive macrophages. Diclofenac low-dose treatment caused a marked increase in activated Per2-positive macrophages and some hepatocytes, as well as sinusoidal endothelium, stained positive as well (panel BI–III). We did not observe dose-related changes in Per2 expression (panel CI–III); notwithstanding hepatocytes of an inflamed liver lobule expressed Per2 abundantly (CIII). It is of considerable importance that, with high-dose-treated animals, Per2 transcription was nearly three-fold repressed, and this suggests an activated negative feedback loop. Furthermore, Per1 attenuated excessive immune responses in an LPS model of liver injury by dampening Kupffer cell recruitment, whereas Per1 deletion caused a remarkable increase in pro-inflammatory macrophages [47].
Then, we considered cryptochrome 1 expression in the control and diclofenac-treated animals (panels D-F) and, in except of one control animal (DI) where the bile duct epithelium appeared slightly positive, none of the controls expressed the protein (DI–III). In strong contrast, we observed a clear dose-related increase in the hepatic expression of CRY1 (E-F). Shown in panel EI is the liver section of a low-dose-treated animal with marked CRY1-positive macrophage infiltrates within an inflamed hepatic lobule. Conversely, EIII illustrates marked portal histiocytic infiltrates of monocytes and macrophages; however, none express CRY1, while panel F1 documents CRY-positive histiocytic infiltrates forming a granuloma adjacent to the central vein of an inflamed liver lobule. Note an earlier study demonstrated the importance of CRY1 in the regulation of pro-inflammatory cytokines, and Cry-deficient macrophages are hypersensitive to immune responses [48]. We found CRY1mRNA > four-fold up-regulated in diclofenac-treated minipigs, and immunohistochemistry evidenced its induced expression, particularly in zones of inflammation. Importantly, CRY1 reduces TNFα- and NFkB-mediated inflammatory responses [49], and the genomic study provided evidence for the repressed expression of interferon gamma response genes and their associated signaling pathway (supplementary Table S2).
Another core protein of the circadian machinery is CLOCK, and this basic helix-loop-helix PAS domain transcription factor functions together with ARNTL (BMAL1) in the control of circadian-regulated genes, such as CRY1, PER1/2/3, REV-Erb, ROR, etc. Interestingly, CLOCK null mice display a normal phenotype, presumably due to the fact that CLOCK can be substituted by the PAS domain protein NPAS2 [50]. Indeed, we found NPAS2 nearly three-fold induced upon diclofenac treatment. Additionally, CLOCK stimulated Histone 3 and 4 acetylation, thereby enabling gene transcription and, through physical interactions with the glucocorticoid receptor (GR), reduced its transcriptional responses, while its interaction with the Rel protein p65 augmented expression of pro-inflammatory molecules [44]. CLOCK is a positive regulator of NFκB-mediated transcription [51], and, given that CLOCK and BMAL1 function together, the dysfunction of these proteins resulted in distinct physiological phenotypes [50]. This included an impaired detoxification of drugs [52]. In fact, the assembly of different bHLH-PAS heterodimeric complexes leads to subtle differences in their interaction with DNA to initiate distinct transcriptional programs in the control of circadian rhythm, immune-, hypoxia- and drug responses [53].
As shown in Figure 16A, and except for panel AIII where a few hepatocytes and very rarely macrophages stained positive, none of the controls expressed the CLOCK protein. In strong contrast, CLOCK expression was markedly increased following low- (panel B) and high-dose diclofenac treatments. We did not observe dose-related changes in the hepatic expression of CLOCK; however, we obtained clear evidence for its abundant cytosolic expression. Furthermore, we rarely observed nuclear CLOCK staining (BI–III). Depicted in BIII is an inflamed hepatic lobule with marked CLOCK-positive macrophage and monocytic infiltrates. Similarly, at the high diclofenac dose, most macrophages stained positive for CLOCK (CI–II), and apparently its expression did not follow the zonation of hepatocytes (CIII).
As previously mentioned, the aryl hydrocarbon receptor (AhR) senses exposure to foreign chemicals, including drugs, and forms functional complexes with the bHLH PAS domain protein ARNT to control the expression of genes coding for xenobiotic metabolism, such as CYP1A1 and CYP1B1. Although diclofenac treatment did not induce gene transcription of AhR and/or ARNT itself, we observed a marked induction of CYP1A1. Shown in Figure 16, panel DI–III, are liver sections of three individual control animals. Note the slight to moderate cytosolic staining of hepatocytes, even though individual hepatocytes displayed marked expression of this protein (DIII). The sinusoids were demarcated by the positive CYP1A1 staining, and we infer sinusoidal endothelium to be positive as well. Very rarely, resident Kupffer cells expressed CYP1A1. Shown in panel E and F are low- and high-dose diclofenac-treated animals, and depicted in panel EII–III is a mosaic-like expression pattern of hepatocytes with obvious expression of the CYP1A1 protein. We observed marked CYP1A1 endothelial expression in a portal triad (EIII). Within inflamed lobules, hepatocytes expressed less CYP1A1 (EI&EIII). Remarkably, the number of CYP1A1-positive macrophages increased, and there is evidence for CYP1A1 to enhance the inflammatory response of macrophages [54]. We did not observe dose-related changes in CYP1A1 expression, and, once again, hepatocytes of inflamed lobules expressed less CYP1A1 (FI–III). Notwithstanding, the number of CYP1A1-positive macrophages significantly increased (FIII).
We have already addressed the delicate interplay of glucocorticoids and the circadian clock [55], and cortisol is a key player in the anti-inflammatory response. Nonetheless, cortisol also functions as a stress hormone, and chronic exposure to cortisol facilitates the production of inflammatory cytokines [56]. In fact, the liver is a major site for cholesterol biosynthesis, and cholesterol is the major building block for steroid hormones. Although cortisol is mainly produced in the zona fasciculata of the adrenal cortex, the majority of circulating cortisol stems from cholesterol bound to liver-secreted high-density lipoproteins (HDL) which is delivered to the adrenal gland. In the circulation, cortisol is primarily (80%) transported by the corticosteroid binding globulin (CBG), and this protein is mainly synthesized in the liver. However, only free cortisol binds to the glucocorticoid receptor (GR), which typically accounts for 5% of cortisol in the circulation. Free cortisol diffuses across the cell membrane and binds to the GR, whose expression has been reported for basically all cells [57]. Cortisol release from CBG requires the activity of the neutrophil enolase, which cleaves the so-called reactive center loop of CBG and thereby releases cortisol [57]. Importantly, diclofenac treatment caused a marked increase in neutrophil count from day 8 onwards (see above), and histopathology confirmed neutrophilic infiltrates into regions of harmed hepatocytes (Figure 6). Upon ligand (cortisol) activation, the cytosolic GR receptor complex translocates to the nucleus [42,58]. GR is bound to a multiprotein complex, and research has demonstrated GR to continuously shuttle between the nucleus and the cytoplasm in the presence and absence of its ligand [58,59].
Shown in Figure 17 (AI–III) are liver sections from three individual control animals. We observed slight to moderate cytosolic and nuclear staining of CBG. Based on these findings, it is tempting to speculate that CBG functions in the nuclear trafficking of proteins other than cortisol [57]. Low-dose diclofenac treatment (BI–II) caused marked increases in CBG with a dust-like appearance in the sinusoids of treated animals. Additionally, BIII exemplifies the mosaic-like CBG expression pattern with harmed hepatocytes less capable of its synthesis. At the high diclofenac dose (CI–III), CBG expression is significantly reduced, and this will increase the pool size of unbound/free and, therefore, biologically active cortisol. Only free cortisol binds to the glucocorticoid receptor (GR) and augments its activity. We observed marked GR expression in diclofenac-treated animals, as described below. Nonetheless, the high-dose regimen caused severely harmed hepatocytes, some of which failed to synthesize CBG (CI–II). Moreover, we observed CBG-positive macrophages (CIII), and this suggests CBG directly interacts with the GR of sinusoidal macrophages as to dampen their pro-inflammatory activity.
Based on the CBG findings, we were interested in investigating the regulation of the glucocorticoid receptor; depicted in DI–III are the liver sections of three individual control animals. For the controls, we noted a faint cytosolic and, in part, sinusoidal expression of GR. Strikingly, diclofenac treatment caused marked increases in cytosolic GR expression, which was independent of the dose (panels E–F). However, we did not observe nuclear GR staining as exemplified in an HPV of a low-dose-treated animal (EIII).
Finally, due to its important role in stress signaling, we investigated the hepatic expression of CRF1, which is the receptor of the corticotropin-releasing factor (CRF). Importantly, CRF affects cortisol synthesis via the hypothalamo-hypophyseal portal system, where it stimulates the release of adrenocorticotropic hormone (ACTH). Subsequently, ACTH stimulates cortical cells of the adrenal gland to produce cortisol [60]. Notwithstanding, the CRF neuropeptide also plays an important role in liver pathology [61]. Shown in Figure 18 are liver sections of three control animals (AI–III), and we observed faint sinusoidal and, very rarely, CRF-positive macrophages. Recent evidence has suggested CRF1 activation of macrophages to promote their M1 polarization [62], and we observed marked increases in CRF-positive macrophages in low- (BI) and high-dose (CI, CIII)-treated animals. Furthermore, we found vascular endothelial cells to stain positive following diclofenac treatment (BI, CII) and obtained evidence for a dose unrelated cytosolic expression among liver cells of inflamed liver lobules (BII–III, CII). However, not all cells expressed the CRF receptor, and we speculate regenerating hepatocytes to express CRF1 more abundantly to support anti-inflammatory and anti-apoptotic reactions.

2.16. Regulatory Gene Networks

To gain insight into gene regulatory networks that are independent of the liver clock and glucocorticoid receptor, we searched for enriched transcription-factor-binding sites in promoters of DEGs (supplementary Table S3). This revealed 198 and 145 TFBS in promoter sequences of liver- and kidney-regulated genes. Importantly, the myocyte enhancer factor-2 (MEF2) and the AT-rich interactive domain 5A (ARID5A) were significantly enriched binding sites in promoters of low-dose diclofenac-regulated genes (supplementary Figure S16A), whereas glucocorticoid response elements (GRE) and Krüppel-like family transcription factor (KLF6) were significantly enriched in promoters of DEGs after high-dose treatments (supplementary Figure S16B). For the kidney, the composite module of the low-dose treatment group consisted of proto-oncogene 1, transcription factor (ETS1) and zinc finger protein 217 (ZNF217) (supplementary Figure S17A), whereas for the high-dose treatment the composite module consisted of an amino acid response element, ATF4 binding site (AARE), GATA binding factors (GATA) and SMAD family transcription factors (supplementary Figure S17B). Altogether, 195 DEGs or 34% are candidates for these independent regulatory gene networks.

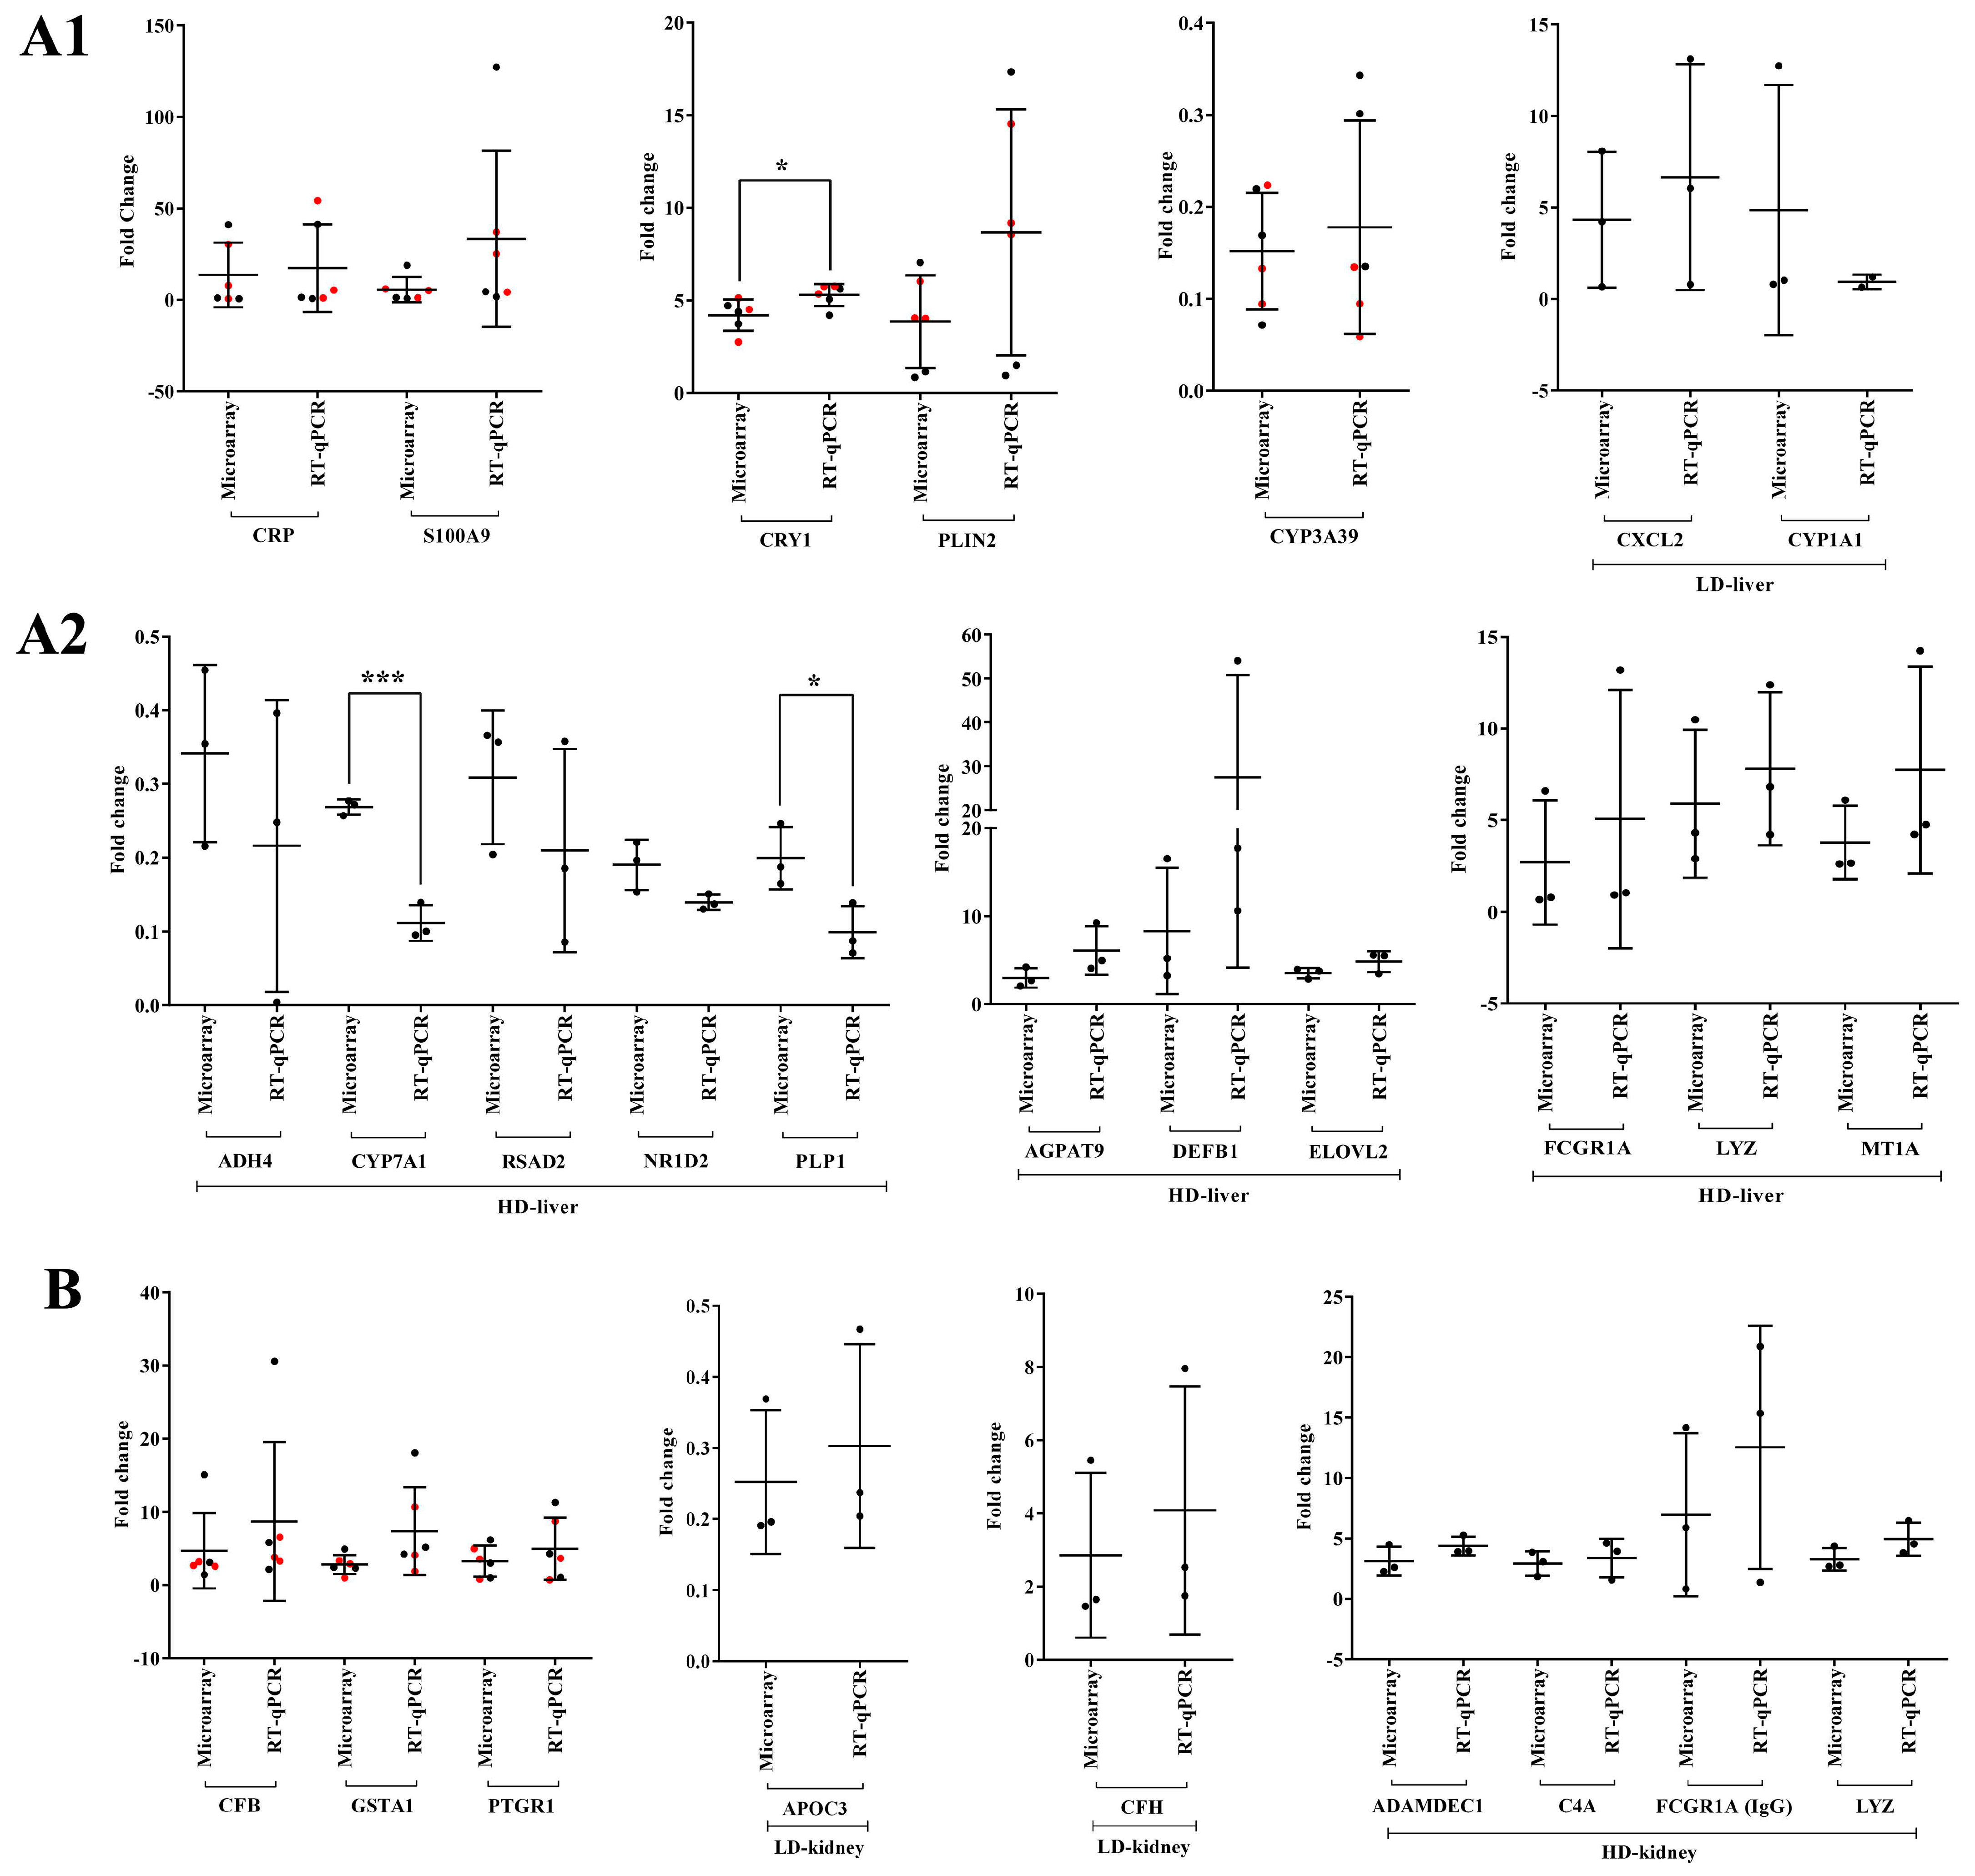
2.17. Validation of Transcriptional Responses by RT-qPCR

We performed RT-qPCR assays to confirm the microarray data by an independent method and selected qPCR primers, which are identical to the probe sequences immobilized on the microarray. As shown in Figure 19 and Figure 20 we obtained similar results for the two platforms. Notwithstanding, the qPCR assays revealed the hepatic master regulators HIF1A (p < 0.05) and LITAF to be consistently higher in expression in low- and high-dose-treated animals (Figure 19A). In the kidney, the qPCR assays defined MMP7 transcripts as more abundantly expressed when compared to the microarray data (Figure 19B). Additionally, we evaluated highly regulated genes in the liver and kidney (Figure 20). Here, qPCR assays tended to suggest more abundant expressions of AGPAT9, DEFB1, FCGR1A, MT1A, PLIN2 and S100A9; however, and with the exception of CRY1 (p < 0.05), the data were statistically insignificant, mostly due to one outlier. In the cases of ADH4, CYP1A1, CYP7A1 (p < 0.001), NR1D2, PLP1 (p < 0.05) and RSAD2, the qPCR assay implied lesser expression (Figure 20A). Finally, we noticed a statistically insignificant increased expression of GSTA1 with kidney RNA extracts (Figure 20B).

3. Discussion

Diclofenac is commonly prescribed for the treatment of rheumatoid arthritis; however, its use is associated with a range of ADRs [6]. Its ability to induce idiosyncratic liver injury has been assessed for causality by RUCAM, and it ranks among the top five DILI-causing drugs [63]. The precise mechanisms underlying diclofenac’s potential to cause liver and kidney injury remain uncertain and multifactorial. Clinical and experimental evidence supports the notion of an immune/inflammatory-mediated mechanism of injury, which is surprising given its mode of action as a non-steroidal anti-inflammatory drug [3,8,19,20,21,64].
Here, we report a novel molecular circuitry whereby diclofenac desynchronizes the liver clock in its control of cellular metabolism and immune response and ultimately leads to liver injury.

3.1. Diclofenac Reactive Metabolites

There is strong evidence for CYP monooxygenases and myeloperoxidases in neutrophils and Kupffer cells to catalyze the production of diclofenac-reactive metabolites. Therefore, different routes in the production of reactive metabolites exist. We observed significant repression (up to six-fold) of CYP3A22, CYP3A29, CYP3A39 and CYP3A46; however, induced neutrophil count (supplementary Figure S3D) and activated Kupffer cells (Figure 1, Figure 5 and Figure 6) highlighted the importance of myeloperoxidases (MPO) in the metabolism of diclofenac. Although the identified CYP monooxygenases are orthologues of human CYP3A4 [65,66,67], there are also differences in the regulation of porcine and human CYP3A4, as recently reported for CYP3A22 [68]. The reduced expression of porcine CYP monooxygenases is likely caused by hepatic inflammation in response to diclofenac treatment [69,70] and, given the highly significant increase in activated neutrophils (see above and Figure 6), we propose reactive metabolism to be primarily catalyzed by myeloperoxidase of neutrophils. Indeed, histopathology confirmed activated neutrophils and Kupffer cells in regions of harmed parenchyma, as shown by the MPO and CAE stains (Figure 5 and Figure 6), and we consider diclofenac-reactive metabolites as one of the causative events for liver injury [71].
Additionally, CYP7A1, i.e., the rate-limiting enzyme of bile acid synthesis, and the bile salt transporters ABCA8 and SLCO1B3 were up to four-fold repressed; their reduced expression correlated with elevated levels of hepatic triglycerides [72,73,74]. Importantly, the solute carrier SLCO1B3 transports glycoursodeoxycholate, and this bile acid is used as a therapeutic agent to treat cholestatic liver disease [75]. Moreover, glycoursodeoxycholate infusions prevented cholestatic liver disease induced by taurocholate in rats [76].
Probably, hepatic inflammation will also repress expression of phase II drug metabolizing enzymes, i.e., GSTA2, GSTT1, MGST3 and UGT1A6. However, induced expression of renal GSTA1 (>3 fold) and GSTP1 signifies the induction of defense programs against toxic electrophiles and oxidative stress, and their elevated activities have been reported to be a marker for renal proximal tubular necrosis [77]. Collectively, the results suggest reactive metabolites of diclofenac to play a critical role in hepato- and renal toxicity.

3.2. Diclofenac-Induced Expression of Marker Genes of Inflammation

Hepatic expression of ß-defensin (DEFB1), the chemokines CXCL2, CXCL13 and lysozyme (LYZ) were eight-, three-, two- and six-fold induced, whereas CCL8 and CXCL16 was repressed by three- and two-fold, respectively, after diclofenac treatment. Importantly, ß-defensins play a major role in preventing neutrophil apoptosis and function as pro-inflammatory mediators of the immune response [78]. The strong induction of DEFB1 and of lysozyme is part of a complex inflammasome [79] to hepatic injury and sterile inflammation. Moreover, a recent study reported DEFB1 to be induced during cholestasis, with bilirubin and bile acids modulating its expression [80]. In the present study, DEFB1 was > eight-fold induced; however, serum markers of cholestasis were either insignificantly increased or even repressed, and the observed inhibition of CYP7A has major implications on bile acid synthesis and bile pool size. Lastly, histopathology evidenced portal inflammatory infiltrates and extravasation of neutrophils to contribute to lobular inflammation [81].
For its decisive role in attracting polymorphonuclear leukocytes (PMLs) to sites of injury, the four-fold induced expression of macrophage inflammatory protein-2 (MIP-2)/CXCL2 is of significance [19,82,83]. Activated PMLs release diverse cytotoxic factors to trigger oxidative stress and cellular damage [84,85,86], and in the present study, blood smears and histopathology showed neutrophils to be the prominent cell type in diclofenac-induced liver injury (see above).
There have been case reports of diclofenac-induced immune hemolysis [87] and delayed hypersensitivity reactions [88]. One study investigated antibody responses to diclofenac and some of its metabolites in a cohort of 59 patients who experienced hypersensitivity reactions [89]. There was little evidence for an IgE-mediated response. Therefore, the authors excluded an involvement of prominent metabolites in diclofenac hypersensitivity reactions.
The role of chemokines in liver disease was the subject of a seminal review [90], and in the present study, CXCL13 was minimally (1.5-fold, p < 0.05) induced to possibly stimulate the homing and motility of B cells to sites of injury [91,92]. Moreover, we observed significant expression of the chemokine CXCL16 to about 60% of the controls, and this chemokine plays a role in the recruitment of natural killer (NK) T cells and is crucial in the initiation and progression of hepatic inflammation and fibrosis [93]. We consider its repression an adaptive response to lessen the damage induced by hepatic inflammation. Indeed, it has been shown that CXCL16 deficiency attenuates acetaminophen-induced hepatotoxicity by decreasing hepatic oxidative stress and inflammation in mice [94].
Furthermore, we report CCL8/monocyte chemotactic protein (MCP-2) as repressed to 40% of the controls; this chemokine is capable of binding to CCR2, a receptor that functions in the trafficking of immune cells to sites of inflammation [95]. There are additional reports implicating MCP-2 in liver inflammation [96,97,98]. We therefore consider its down-regulation as an adaptive response to alleviate the harmful effects of inflammation. Interestingly, CCL8 is a biomarker candidate for the diagnosis of graft-versus-host disease [99].
Moreover, the interleukin receptor beta subunit IL10RB was two-fold up-regulated in the liver and kidney, though the alpha subunit was unchanged. Both subunits form a heterotetrameric receptor complex and, upon activation by its ligand IL10, inhibit pro-inflammatory responses [100]. However, IL10 was unchanged, as were most IL10-responsive genes; nonetheless, we observed a minor but statistically significant up-regulation of IL1B, JAK3, MYD88, NFKB1A and NFKB1B (~ 1.5-fold, p < 0.05). Together, this led to the notion that the IL10/IL10R signaling pathway was basically inactive.
Additionally, CXCL5 was two-fold up-regulated in the kidney, and this chemokine stimulates Th17-cell-mediated neutrophil migration to injured renal cells [101], whereas the nearly two-fold induced expression of CXCL14 regulates the chemotaxis of natural killer (NK) cells to sites of inflammation [102,103]. Similarly, CCL24/eotaxin-2 was mildly up-regulated to support the trafficking of eosinophils to sites of injury [104,105]. Conversely, the two-fold induced expression of intracellular cytokine receptor TNFRSF17/ B-cell maturation antigen (BMCA) might be regarded as an adaptive response to alleviate excessive neutrophil activity [106]. Furthermore, the two-fold repressed expression of TNFAIP6/TNF-stimulated gene 6 (TSG-6) suggests the inhibition of the negative feedback control in the inflammatory response [107].
The activation of complement factors emphasizes hypersensitivity reactions in response to diclofenac treatment. Specifically, we observed activation of components of the classical pathway, with about a two-fold induced expression of C1QA, C1QC, C1S, C1R and of co-factors of the alternative complement pathway, notably CFB and CFI, that were nearly three-fold up-regulated in the kidney after diclofenac treatment. Testimony to an activated classical and alternative pathway is the two-fold induced expression of C3 convertase, a key molecule that cleaves the C3 molecule [108]. The increased expression of anaphylatoxins activates the terminal complement components (C6, C7, C8 and C9) and forms a membrane attack complex (MAC) to cause cell lysis and tubulointerstitial injury in renal cells [109,110]. Notably, the terminal complement components C7 and C9 were two-fold induced in the liver after low-dose diclofenac treatment, and the activation of the classical and alternative complement systems evidences hypersensitivity reactions in response to diclofenac treatment.

3.3. Diclofenac Regulates Components of the Circadian Clock

The present study provided strong evidence for diclofenac to induce alterations in core molecular clock components to directly influence the expression of genes coding for immune, inflammation and metabolic processes [46,111,112,113]. The core clock apparatus consisting of ARNTL/BMAL1, DEC2, NPAS2, NR1D2/ REV-ERB beta, RORC, CRY1, PER2 and DBP were regulated in the liver and kidney (supplementary Table S2). Therefore, diclofenac treatment desynchronized the circadian clock. Specifically, the activator proteins BMAL1 and NPAS2 form a heterodimer to elicit transcriptional responses at Ebox response elements of targeted promoters. A transcriptional feedback loop exists, whereby PER and CRY block its own heterodimerization upon critical expression levels. Furthermore, the nuclear receptors ROR and REV-ERBα/β control BMAL1 expression [46,114,115]. Diclofenac treatment caused a > four-fold induced CRY1 expression to underscore an activated core loop; however, PER2mRNA was dose-dependently repressed by > 60% to suppress the circadian negative feedback loop. Independent research has reported diurnal variation in Per2 expression with low Per2 expression protecting mice from liver injury in response to high-dose acetaminophen treatment [116]; however, low Per2 exacerbated cholestatic liver damage as well as fibrosis [117]. Conversely, Chen et al. reported the hepatoprotective role of Per2 in mice when treated with CCl4 [118]. Apparently, PER2 suppresses the mitochondrial uncoupling protein UCP2; however, in the present study, UCP2 was unchanged.
Meanwhile, the significant five-fold repression of nuclear receptor NR1D2/Rev-Erbß has major implications for metabolic homeostasis; its depletion represses expression of genes coding for metabolic enzymes and causes marked hepatic steatosis in mice [119]. Moreover, the accessory loop of the master clock regulates BMAL1 expression; its transcriptional up-regulation is dependent on RAR-related orphan receptor activity, whereas binding of NR1D2/Rev-Erbß to the BMAL1 promoter inhibits its transcription. Hepatic BMAL1 and RORC were 3- and 2-fold induced, and the > 80% repressed Rev-Erbß provided strong evidence for the accessory loop to be active. Independent of its role within the molecular clock, RORC plays a key role in lipid/glucose homeostasis, insulin resistance and inflammation [120].
Moreover, a recent study demonstrates BMAL1 to regulate circadian expression of drug-metabolizing enzymes in mice [121]. Essentially, BMAL1 binds to the Hnf4α promoter to stimulate its transcription, whereas the regulation of the CYP monooxygenase 3a11 by Bmal1 is Dbp- and Hnf4α dependent. Bmal1 deficiency sensitizes mice to drug toxicities [121]. Although diclofenac treatment of minipigs did not influence HNF4α expression itself, it repressed DBP gene expression dose-dependently by 60%. The role of DBP in the circadian clock has been the subject of independent research [122,123,124,125], and its down-regulation represses the expression of drug-metabolizing enzymes as observed in the present study [126].
The importance of the circadian rhythm in the pathogenesis and treatment of fatty liver disease and alcohol-induced liver injury has been the subject of recent reviews [127,128]. Furthermore, the inhibition of Period1 represses CYP2E1-reactive metabolite production in mice following CCL4 treatment [129]. Thus, members of the liver clock may be explored as therapeutic targets to prevent reactive metabolite-induced liver injury.
Collectively, these results suggest that diclofenac desynchronizes the molecular clock in the liver and kidney with major implications for drug detoxification.

3.4. Diclofenac Induces Cell Cycle Arrest and Apoptosis

The response gene to complement 32 (RGC-32) is a cell cycle regulator, and we found its expression two-fold repressed in the liver. Its down-regulation influences cell proliferation and apoptosis [130,131] and impairs macrophage activity [132]; however, it protects the liver from hepatic steatosis by decreasing the expression of lipogenic genes [133]. RGC32 is also a negative regulator of T-lymphocytes; its complete ablation causes CD4+ and CD8+ T cell proliferation [134]. Collectively, we consider its repression as part of a complex network to influence immune responses, monocyte-macrophage differentiation and hepatic metabolism. Furthermore, diclofenac treatment repressed caveolin 1 (CAV1) expression by 50%, and this scaffolding protein is a major regulator of cell signaling, inflammation and liver function [135,136]. Dysfunctional CAV1 leads to hepatic steatosis [137] and an altered mitochondrial metabolism and is associated with cholesterol-mediated mitochondrial dysfunction. CAV1 stimulates apoptosis by increasing cholesterol accumulation in mitochondrial membranes, thereby decreasing the efficiency of the respiratory chain and the intrinsic antioxidant defense [138]. Moreover, the nearly three-fold induced expression of cyclin-dependent kinase (CDK) inhibitor p21 facilitates p53-mediated cell cycle arrest and cell death in response to oxidative stress [139,140]. Furthermore, the nearly 70% repression of cyclin-dependent kinase inhibitor p27 (CDKN1B1) stimulates CDK2 activity in the absence of growth factors and disables the protection of cells from apoptosis [141]. Additionally, the expression of alcohol dehydrogenase 4 (ADH4) was significantly reduced to 30% of controls, and an induced expression of ADH4 has been implicated in ROS-mediated DNA damage in both alcoholic and non-alcoholic steatohepatitis [142,143], while its deficiency impairs the metabolism of retinol to retinoic acid. Likewise, the transcription factor CCAAT/enhancer-binding protein beta (C/EBPβ) was significantly up-regulated in the kidney and has been shown to be associated with ER-stress-mediated cell death via an unfolded protein response [144]. Furthermore, diclofenac caused a three-fold induced expression of S100A8/A9 in the kidney, and this acute phase reactant induces apoptosis and tubular injury in vivo by accumulating macrophages and/or activated neutrophils at sites of inflammation [145,146]. Diclofenac treatment also caused a two-fold induced expression of L-selectin (SELL), and this cell adhesion molecule regulates the trafficking of leukocytes on endothelial cells [147].
In addition, diclofenac treatment stimulated defense response genes in the liver and kidney. Specifically, the 60% repression of the liver-derived plasma protein, histidine-rich glycoprotein (HRG) dampens macrophage activation and inflammation by blocking the differentiation of inflammatory M1 macrophages [148]. Conversely, the two-fold induced expression of the small heat shock protein (sHSP) family member, i.e., αB-crystallin (CRYAB), HSP27 and the three-fold induced expression of NAD(P)H: quinone oxidoreductase 1 (NQO1) in the kidney might be regarded as a cytoprotective response against oxidative stress and other apoptotic stimuli [149,150].

3.5. Diclofenac-Induced Hepatic Steatosis

Consistent with our previous studies in mice and dogs, we observed significant up-regulation of ELOVL fatty acid elongase 2 (ELOVL2), perilipin 2 (PLIN2) and very low-density lipoprotein receptor (VLDLR) in the liver of diclofenac-treated minipigs (Table 6). The up-regulation of these genes is associated with hepatic steatosis through increased intracellular triacylglycerides synthesis and lipid droplet accumulation [151,152,153,154]. Similarly, we found the peroxisome proliferator-activated receptor gamma coactivator 1-alpha (PPARGC1/ PGC-1α), i.e., a transcriptional co-activator of PPARG repressed by 50% in the liver. Earlier studies have shown that gene silencing of PGC-1α reduced hepatic steatosis but augmented IL10 expression. Although IL10 itself was unchanged, diclofenac treatment caused a nearly three-fold induction of the interleukin-10 receptor subunit beta. Conversely, one study reported PGC-1α protein levels to be repressed in fatty livers of mice to dampen mitochondrial biogenesis, and PGC-1 ko mice were reported to develop multi-system energy metabolic derangements, muscle dysfunction and hepatic steatosis [155,156]. Together, PGC-1α is a key component of the liver clock in the control of energy metabolism and reinforces the notion that diclofenac desynchronizes the circadian clock and associated metabolic pathways [157]. This transcriptional coactivator also influences the expression of DBP and CCL8, which were significantly repressed by >60%. In this regard, the >50% repressed acetoacetyl-coenzyme A synthetase (AACS) in the liver of diclofenac-treated animals is of considerable importance. This cytosolic enzyme utilizes the ketone acetoacetate that originates from mitochondrial metabolism, e.g., ß-oxidation of fatty acids to produce acetoacetyl-CoA and is a substrate for the rate-limiting enzyme in cholesterol biosynthesis, i.e., HMG-CoA synthease 1 [158]. While HMG-CoA synthase and HMG-CoA reductase were insignificantly induced (up to 2.5-fold), the gene coding for mevalonate kinase was repressed to 40% of the controls (p<0.01). The gene expression changes agreed with the lower serum cholesterol levels determined for diclofenac-treated animals; however, the results did not reach statistical significance. Furthermore, ketone bodies are a source of energy, and the treatment-related statically significant hypoglycemia may be part of this process, i.e., a treatment-related metabolic switch towards lipogenesis. Collectively, a disturbed liver clock will have major implications for glucose homeostasis.

3.6. Transcription Factor—And Master Regulatory Gene Networks

The organ-specific genomic responses enabled us to perform computational analysis on gene-specific promoters. This revealed MEF2 and ARID5A as significantly over-represented in promoters of liver-regulated genes, even though their transcription factors were unchanged after low-dose diclofenac treatment. Notably, 67% of DEGs had enriched TFBS for these two TFs, and the codes for immune, inflammation, stress and circadian clock genes, of which CRY1, malic enzyme 3 and DPP4 are prominent examples.
We performed a computational genomic foot print analysis, and this revealed KLF- and GRE-enriched binding sites in promoters of regulated genes. Diclofenac treatment repressed KLF11 expression by 50% and knock down of KLF11 in mice increased hepatic triglyceride levels. Consistent with these findings, we observed treatment-related hepatic steatosis (supplementary Figure S1C) and this TF regulates hepatic lipid metabolism [159]. Another study linked KLF11 to hepatic glucose metabolism and regulation of PGC-1α [160]. As discussed above, we observed repressed PGC-1α expression and blood glucose levels were consistently lower in high-dose diclofenac-treated animals. Together, the data strongly suggest a regulatory circuitry of hepatic lipid and glucose metabolism that involves KLF11.
Additionally, the gene coding for the glucocorticoid receptor NR3C1 was marginally but significantly induced after low-dose diclofenac treatment. However, immunohistochemistry evidenced significantly induced hepatic NR3C1 activity (Figure 17E,F). As shown in Table 5, 64 DEGs are target genes of NR3C1, and 59 are regulated after high-dose diclofenac treatment. Furthermore, diclofenac treatment caused adrenocortical hypertrophy and increased glucocorticoid production. The thymic atrophy results from cytolysis and is typical for experimental animals at elevated glucocorticoid/cortisol blood levels [161]. We regard repression of the cortisol-binding protein by 40% as adaptive responses to elevated glucocorticoid levels in the systemic circulation. Together, the liver clock and NR3C1 drive master regulators and liver metabolic function. Given that REV-ERB connects the circadian clock with hepatic GR action, its >80% repression alleviates stress responses, as shown by the highly significant repression of the chemoattractants CXCL9 (90%), CCL8 (60%) and RSAD2 (70%).
For the liver, the gene regulatory network analysis revealed the following key regulators, i.e., CRY1, HIF1A, NR3C1, IGFBP2, LITAF and ANGPTL4 after low- and high-dose diclofenac treatment. Importantly, CRY1 is a key transcriptional repressor of the NPAS2-BMAL1 components of the circadian clock and was significantly up-regulated (four-fold) in response to diclofenac treatment. Overexpression of CRY1 attenuates hepatic gluconeogenesis by inhibiting the glucagon and glucocorticoid receptor signaling and decreases blood glucose levels by increasing insulin sensitivity [162,163]. Consistent with this notion, we showed diclofenac-treated minipigs to steadily present lower blood glucose levels (supplementary Figure S2). Furthermore, HIF1A is a key transcription factor in regulating cellular responses to hypoxia and the activation of innate and adaptive immune responses during tissue inflammation [164,165]. In the present study, HIF1A was significantly repressed at the transcript level (Table 8), but not at the protein level (Figure 5). Seemingly, HIF1A ko mice are protected from lipid accumulation and inflammation in response to LPS- and alcohol-induced liver damage [166,167].
We have already highlighted the importance of the glucocorticoid receptor (NR3C1) in immune and inflammatory responses and genes regulated by NR3C1, as well as the pro-inflammatory transcription factors, i.e., NFkB and STAT (see supplementary Table S4 and [168,169,170]. These cis-regulatory factors were significantly enriched in DEGs after repeated diclofenac treatment, and the results confirm our earlier findings with mice and dogs. Therefore, our study highlights the high conservation of regulatory gene networks across different species [19,20]. Moreover, we observed the up-regulation of the LPS-induced pro-inflammatory cytokine and fibrogenic activator LITAF in the liver. The protein is highly expressed in monocytes/macrophages, but also in tissue, such as liver, and binds to the CTCCC responsive element within the TNF-α promoter [171,172]. Lipopolysacharide-induced TNF factor (LITAF) connects inflammation to fatty liver disease, and its expression correlates with histological grades of fibrosis [172].
Additionally, diclofenac treatment caused repressed hepatic expression of insulin-like growth factor (IGF) modulator protein IGFBP2 and the PPARγ target gene ANGPTL4. The repression of these genes and their association with hepatic glucose homeostasis, insulin sensitivity and increased serum triglycerides and hepatic steatosis have been the subjects of independent reports [173,174,175,176,177]. Although PPARγ itself was unchanged the peroxisome proliferator-activated receptor-γ coactivator, PGC-1α was significantly repressed, and this protein interacts with many transcription factors and is a key regulator of energy metabolism [178].

4. Materials and Methods

4.1. Animals

We performed the animal study (dosing of animals, clinical chemistry) at PWG Genetics Pte Ltd. in Singapore and the genomic study at the Korea Institute of Toxicology (KIT) in Daejeon, Republic of Korea. All other work (histopathology, clinical and genomic data analysis and bioinformatics, immunohistochemistry, data interpretation, etc.) was performed at Hannover Medical School, Germany. The CRO in Singapore was accredited by the “Association for Assessment and Accreditation of Laboratory Animal Care”, and the research was performed according to Good Laboratory Practice principles. The study complied with the principles of the OECD guideline for a repeated dose toxicity study in non-rodent species. Ethical approval was obtained according to Singapore and Korean law. In addition, approval to conduct animal studies was obtained from the Institutional Animal Care and Use Committee (IACUC) of the Korea Institute of Toxicology (KIT) in Daejeon, Republic of Korea.
A total of nine specific pathogen free (SPF) male miniature pigs (Sus scrofa) were acclimatized to the animal husbandry prior to drug treatment and were kept in a controlled environment, i.e., temperature (20–30 °C), a humidity of 50–80%, an air circulation of 15 times/hour and a 12-h light/dark cycle at 150–300 lux. We housed the animals in groups of three per pen, and the minipigs received certified food pellets of 300 g/day (T.S Corporation, Incheon, Korea). Water was given ad libitum.

4.2. Drug Treatment

Prior to dosing, animals did not have access to food. However, one hour after dosing the animals received 300 g of food pellets, which remained in the feeding trough until the end of the day.
We purchased sodium salt of diclofenac from Sigma-Aldrich, Korea (CAS No: 15307-79-6) and loaded the drug into hard gelatin capsules, size #12 (Torpac Inc., Fairfield, NJ, USA). Controls (N = 3) received one empty capsule per day (= vehicle control), and treatment animals (N = 3/dose) were dosed with either 3 mg/kg (low-dose) or 15 mg/kg diclofenac (high-dose) for 28 days.
The doses of 3 and 15 mg/kg/day diclofenac were selected based on the results obtained in the 2-week dose-range-finding (DRF) study. A dose of 28 mg/kg/day diclofenac was established as the maximum tolerated dose (MTD), and the low-dose of 3 mg/kg was identical to the high-dose in the dog study [20]. Importantly, the maximum clinical dose (MCD) was 40 mg/kg (2400 mg diclofenac/60 kg body weight); therefore, both doses were clinically relevant.
We recorded body weight and food consumption during the entire study period, and we euthanized the animals by exsanguination under deep barbiturate anesthesia (Thiopental sodium).

4.3. Clinical Pathology

The animals were fasted overnight prior to blood collection, and samples were collected via jugular vein puncture at pre-treatment day 1 (prior to start of dosing) and days 8, 14 and 28 for an evaluation of hematology and serum biochemistry readouts. For hematology, the blood samples were collected in EDTA-2K-containing tubes, and the parameters white blood cells (WBC), red blood cells (RBC), hemoglobin (HGB), hematocrit (HCT), mean corpuscular volume (MCV), mean corpuscular hemoglobin (MCH), mean corpuscular hemoglobin concentration (MCHC), platelet (PLT), reticulocyte (RET) and differential leukocyte count were measured on an ADVIA 2120 hematology system (Siemens, Germany). In addition, we obtained blood serum samples using standard operating procedures and determined aspartate aminotransferase (AST), alanine aminotransferase (ALT), alkaline phosphatase (ALP), gamma glutamyl transferase (GGT), total bilirubin (TBIL), glucose (GLU), albumin (ALB), total protein (TP), triglycerides (TG) and cholesterol (CHOL) blood urea nitrogen (BUN) and creatinine (CREA) on a 200FR NEO system (Toshiba Co., Tokyo, Japan). Furthermore, we analyzed the serum electrolytes (Na, K, Ca and Cl) on a 200FR NEO (Toshiba Co.).

4.4. RNA Extraction

The liver and kidneys from control and diclofenac-treated animals were surgically removed, and tissue samples were snap-frozen in liquid nitrogen. Prior to RNA extraction, we homogenized the tissues in a TissueLyser (Qiagen, Hilden, Germany) according to the manufacturer’s recommendations. Briefly, we placed the tissues in 2 mL tubes, which contained stainless steel beads and a lysis buffer, and operated the system at 20–30 Hz for 2 min. Subsequently, we isolated total RNA with the RNase mini kit (Qiagen) according to the manufacturer’s recommendations and as previously reported [19,20]. We measured the concentration of total RNA in a NanoDrop spectrophotometer (NanoDrop Technologies, Wilmington, DE, USA) and determined RNA integrity with the 2100 Bioanalyzer (Agilent Technologies, Santa Clara, CA, USA).

4.5. Microarray Experiments and Data Analysis

We performed whole genome expression profiling with the Affymetrix porcine GeneChip microarray system according to the manufacturer’s protocols (Affymetrix, Santa Clara, CA, USA). All steps of the cDNA synthesis, the biotin labeling, fragmentation of cRNA, hybridization, staining, washing and scanning on a GeneChip Scanner 3000, were carried out as previously reported [19,20,179].
We performed data normalization with the MAS5 algorithm by comparing the gene expression data from low-(3 mg/kg/day) and high-(15 mg/kg/day) dose-treated animals against controls. Subsequently, we defined differentially expressed genes (DEGs) in normalized datasets by performing hypergeometric tests with the cut-off criteria fold change > 1.5 and p-value < 0.05. In order to control the false discovery rate (FDR) at α 0.05, we only considered p-values corrected by the Benjamini–Hochberg procedure. We grouped genes satisfying these conditions as up- and down-regulated and constructed heat maps to identify commonly regulated DEGs by applying the average-linkage hierarchical clustering algorithm with Euclidean distance (Multi Experimental Viewer, http://www.tm4.org/mev.html, accessed on 4 January 2023).

4.6. RT-qPCR Validation of Microarray Data

We validated the differentially expressed genes by quantitative real-time RT-PCR. We purchased the primers from GenoTech (Daejeon, Korea). Total RNA (2 µg) was reverse-transcribed with SuperScript II (Invitrogen, Carlsbad, CA, USA) using an oligo-dT primer as suggested by the manufacturer. cDNA samples were stored at −20 °C until use. We performed RT-qPCR in a 20 µL reaction volume containing 0.5 µL (10pM) forward and reverse primers, 10 µL of SYBR Green master mix (Applied Biosystems, Waltham, MA, USA), 2 µL of cDNA and 7 µL of nuclease-free water. We amplified the cDNA on a StepOne and StepOnePlus Real-Time PCR System (Applied Biosystems) following the manufacturer’s protocols. We used the 18S ribosomal RNA primers as an internal control, and the primer sequences of all the genes investigated are listed in supplementary Table S6.

4.7. Histopathology

We applied standard operating procedures to evaluate the liver morphology of control and diclofenac-treated minipigs. The stains included Hematoxylin and Eosin (H&E), Periodic acid-Schiff reaction (PAS), PAS diastase digestion, Elastica van Gieson and silver stain.

4.8. Immunohistochemistry

Livers from control and diclofenac-treated animals were fixed in 4% buffered paraformaldehyde and embedded in a paraffin block using the standard protocols of the laboratory. Then, 1–2 μm thick sections were deparaffinized and rehydrated through a descending alcohol series followed by a 4 min washing step in distilled H2O. Subsequently, we performed antigen retrieval in citrate buffer (pH 6) or Tris-EDTA buffer (pH 9.0) in a water bath at 98 °C for 30 min. We used the ZytoChem-Plus HRP Polymer-Kit of Zytomed Systems (Berlin, Germany) for immunohistochemistry, and the slides were rinsed with distilled H2O. After a 5-min incubation step in tris-buffered saline (washing buffer), endogenous peroxidase activity was blocked with 3% peroxidase blocking reagent (Merck, Darmstadt, Germany) for 5 min followed by a second washing step. Thereafter, we applied protein-block serum free reagent for 5 min (ZytoChem-Plus HRP Polymer-Kit, reagent 1) and incubated the sections with primary antibodies for 60 min. We purchased the antibodies from diverse vendors and diluted them with washing buffer, as given in Table 9:
We incubated the bound primary or bridging antibody with labeled polymer HRP anti-rabbit or anti-mouse secondary antibody (ZytoChem-Plus HRP Polymer-Kit, reagent 2) for 20 min and added reagent 3 of the ZytoChem-Plus HRP Polymer-Kit to finally place the slides in a moist chamber at room temperature, allowing an incubation time of 30 min. After completion of the HRP reaction, we counterstained the sections with Hematoxylin for 5 min, washed the slides under running warm tap water for 10 min and dehydrated the sections in a cabinet at 60 °C for 20 min. The sections were coverslipped and examined under a light microscope (Nikon Ni-E microscope, Japan), and we captured images using Nikon NIS basic research microscopic imaging software version 4.3.

4.9. Bioinformatics

4.9.1. Identification of Orthologous Genes

Although several studies have reported the decoding of pig genomes, its annotation is not complete. Therefore, we utilized the g:Orth tool of the g:profiler (http://biit.cs.ut.ee/gprofiler/gorth.cgi, accessed on 4 January 2023); this tool retrieves orthologous genes from diverse organisms (human, mouse, rat) based on their sequence similarity [180].

4.9.2. Enriched Biological Processes and Gene Ontology Mapping

To discern the functions of DEGs, we queried the GeneXplain platform version 6.0 (Wolfenbüttel, Germany) and considered biological processes, cellular components, molecular functions, metabolic pathways and transcription factor binding sites in promoters of regulated genes. We only considered enriched ontology terms with a p-value < 0.05 and a FDR corrected significance level of α = 0.05. Enriched gene ontology terms/pathways and their networks were visualized with ClueGO version 2.2.3; this tool was available as a Cytoscape plug-in. ClueGO retrieves information from precompiled data annotated within GO, KEGG and BioCarta databases, and the significance of an enrichment score is calculated based on the hypergeometric distribution of DEGs [181].

4.9.3. Gene/Protein Interaction Network Construction

We constructed interaction networks using STRING software version 10.5 (http://string-db.org, accessed on 4 January 2023). This web-based tool informs on the interaction of genes/proteins by inferring associations based on publicly available and experimentally validated datasets, including high-throughput experimental data, the mining of data from diverse databases, published literature findings and predictions based on genomic context analysis. Meanwhile, a confidence score for each predicted association and constructed network is calculated [182].

4.9.4. Identification of Upstream Master Regulatory Molecules

We identified master regulatory molecules and constructed associated gene networks with the tool GeneWays available within the GeneXplain platform. GeneWays is an open access platform used to automatically extract, analyze, visualize and integrate molecular pathway data from published peer-reviewed articles [183]. We set a default cut-off score of 0.2, FDR at 0.05 and a Z-score of 1.0 with a maximum radius of four steps upstream of input data sets for defining statistically significant master regulators.

4.9.5. Promoter Sequence Analysis

We queried the Genomatix software suite (Munich, Germany) and the GeneXplain platform for transcription factor binding sites (TFBS) at gene-specific promoters. Specifically, we performed in-silico genomic foot printing of >2000 transcription factors. We focused on DEGs coding for immune and stress response, inflammation, hypoxia, cytokine stimulus, acute-phase, cell death and oxidation reduction processes. We extracted the promoter sequences of DEGs with the Gene2Promoter tool of the Genomatix software, as well as preset functions termed “analyze the regulatory regions” of the GeneXplain platform. We defined the transcriptional start site (TSS) by the TFIIB recognition element, the TATA-box at the 5′-end, an initiator region around the TSS and a downstream promoter element (DPE) at the 3′-end. Subsequently, we interrogated the cis-regulatory binding sites of genomic sequences with a length of −1000 to +100 base pairs relative to TSS by utilizing the MatInspector tool (Genomatix software suite) or the preset function “analyze the regulatory regions” of the GeneXplain platform. We retrieved TFBS from the TRANSFAC 2020.1 library; this repository consists of 7626 predefined positional weight matrices (PWM). In addition, we queried circadian transcriptional regulators and glucocorticoid receptors based on their cognate recognition elements (E-box motives and glucocorticoid receptor binding sites). The overrepresentation of transcription factor binding sites was computed by comparing individual TFBS in promoters of DEG (= Yes-set) with non-regulated genes (= No-set). Enriched TFBS at gene-specific promoter regions were defined based on statistical significance (p < 0.05) and the Z-score.

4.9.6. Composite Modules

We used the FrameWorker tool that is available within the Genomatix suite and the F-MATCH algorithm of the GeneXplain platform to infer composite modules. These are defined by the co-occupancy of regulatory TFBS in distinct promoter sequences. Typically, promoter activation involves more than one protein, and composite modules represent the next level of functional characterization. The following parameters of the FrameWorker tool were applied: The quorum constraint, i.e., the minimum number of sequences within the common framework is 80%, the minimum number of TFBSs in a framework is ≥ 2, the variation of distance range is 25 bp, the minimum distance is 5bp and the maximum distance between TFBS is 300 bp. In the case of the F-MATCH algorithm, we applied default functions. In addition, we interrogated DEGs for the co-occupancy of circadian clock transcriptional regulators and glucocorticoid receptor binding sites. As described above, the approach represents a variant of the F-MATCH algorithm for TFBS pairs and quantifies overrepresentation of promoter sequences in the foreground set using the Fisher test [184,185,186]. We applied the default filtering criteria of the GeneXplain platform and determined statistically significant composite modules.

5. Conclusions

Our study led us to propose a regulatory loop whereby diclofenac passes the blood-brain barrier to elicit stress responses via the SCN and the hypothalamus- pituitary adrenal gland axis. This results in enhanced adrenocorticotropic hormone (ACTH) secretion, adrenal ACTH dependent glucocorticoid synthesis and elevated glucocorticoids in the systemic circulation. Adrenal hypertrophy signifies persistent HPA axis signaling, and increased glucocorticoids in the circulation result in thymus atrophy. Genomic and immunohistochemistry studies provided strong evidence for diclofenac to desynchronize the liver clock and, together with induced glucocorticoid receptor activity, evokes transcriptional responses in liver metabolism. Notwithstanding, the neutrophil-dependent oxidation of diclofenac to reactive metabolites will also contribute to liver injury and inflammation.

Study Limitations

We wish to highlight the following limitations to our study. First, given diclofenac’s ability to cause inflammation, we performed the study in males only. Specifically, female pigs are overrepresented for inflammatory cell infiltrates, as stated by the FDA’s Advisory Committee “Cellular, Tissue, and Gene Therapies” on pigs for toxicology studies [187,188]. Second, although extensive immunogenomic and histopathology investigations provided clear evidence for the treatment effects to be persistent, a time resolved assessment of the diclofenac treatment effects on the circadian rhythm would require many more animals. For animal welfare reasons, this was not permissive. Third, despite similarities in the anatomy and physiology of the liver and kidney of porcine and human origin, there are also important differences, especially in the immune system, which require consideration. Therefore, this preclinical model may not be entirely reflective of human diclofenac DILI and acute kidney injury cases. Moreover, because of the lack of suitable tissue biopsies, a direct comparison to human diclofenac DILI and kidney injury cases could not be performed.

Supplementary Materials

The following supporting information can be downloaded at: https://www.mdpi.com/article/10.3390/ijms24021445/s1.

Author Contributions

S.S. analyzed the genomic data and computed bioinformatics, J.-H.O. and S.Y. performed the genomic study, J.B. performed the histopathology and immunohistochemistry and wrote the manuscript. All authors have read and agreed to the published version of the manuscript.

Funding

The financial support from The Virtual Liver Network (Grant 031 6154) of the German Federal Ministry of Education and Research (BMBF) and the Prospective European Drug-Induced Liver Injury Network (COST CA17112) to J.B. is gratefully acknowledged. The cooperation between the Division of Toxicology, Korea Institute of Toxicology (KIT) and the Institute for Pharmaco- and Toxicogenomics of Hannover Medical School (MHH) is supported by a mobility program of the BMBF (Grant 01DR14013 to J.B.) and by an international collaboration fund of KIT. Furthermore, the work was supported by a grant (NRF-2016M3A9C4953144, NRF-2014M3A7B6020163) from the Ministry of Science, ICT and Future Planning and a general research grant from the Korea Institute of Toxicology to J.H.O. and S.Y. The funders had no role in study design, data collection and analysis, decision to publish, or preparation of the manuscript.

Institutional Review Board Statement

The animal study protocol was approved by the Institutional Animal Care and Use Committee (IACUC) of the Korea Institute of Toxicology.

Informed Consent Statement

Not applicable.

Data Availability Statement

The data presented in this study are available within the article or its supplementary material.

Acknowledgments

J.B. thanks Reinhard Spanel for the fruitful discussions on the histopathology findings. The technical assistance of Gabi Onken in performing immunohistopathology is gratefully acknowledged. The authors are grateful to Frauke Schoppmeier for her support in the preparation of the manuscript and the histopathology Figures.

Conflicts of Interest

The authors declare no conflict of interest.

Abbreviations

AACSacetoacetyl-coenzyme A synthetase
ACTHadrenocorticopic hormone
ADH4alcohol dehydrogenase 4
ADRadverse drug reaction
AhRaryl hydrocarbon receptor
ALBalbumin
ALPalkaline phosphatase
ALTalanine aminotransferase
ANGPTL4angiopoietin-like 4
ARID5AAT rich interactive domain 5A
ASTaspartate aminotransferase
BMCAB-cell maturation antigen
BUNblood urea nitrogen
C/EBPβCCAAT/enhancer-binding protein beta
CAEchloroacetate esterase
CARPAcomplement activation related pseudoallergy
CAV1caveolin-1
CBGcorticosteroid binding globulin
CCLC-C motif chemokine ligand
CDKcyclin-dependent kinase
CBGcorticosteroid binding globulin
cGMPcyclic guanosine monophosphate
CHOLcholesterol
C/EBPBCCAAT/enhancer-binding protein-homologous protein beta
CPScarbamoyl phosphate synthetase
CREAcreatinine
CRFcorticotropin-releasing factor
CRY1cryptochrome 1
CXCLC-X-C motif chemokine ligand
CYPcytochrome P450
CPS1carbamoyl-phosphate synthetase 1
DEFB1ß-defensin
DEGsdifferentially expressed genes
DILIdrug induced liver injury
DPP4dipeptidyl-peptidase 4
ECMextracellular matrix
EDTA-2Kdipotassium ethylenediaminetetraacetic acid (anticoagulant)
ELOVL2ELOVL fatty acid elongase 2
ER stressendoplasmic reticulum stress
EvGElastika van Gieson (stain)
FDR false discovery rate
GGTgamma glutamyl transferase
GLUglucose
GOgene ontology
GRglucocorticoid receptor
GREglucocorticoid response elements
H&EHematoxylin and Eosin
HCThematocrit
HepPar1Hepatocyte Paraffin 1 a hepatocyte specific antigen antibody
HGBhemoglobin
HIF1Ahypoxia inducible factor 1 alpha subunit
HPAaxis- hypothalamus-pituitary-adrenal neuroendocrine axis
HRGhistidine rich glycoprotein
IFNinterferon
IGFinsulin-like growth factor
IGFBPinsulin-like growth factor binding protein
KLFkrüppel-like family transcription factor
LITAFlipopolysaccharide-induced tumor necrosis factor-alpha factor
LPSlipopolysaccharide
MACmembrane attack complex
MCHmean corpuscular hemoglobin
MCHCmean corpuscular hemoglobin concentration
MCPmonocyte chemotactic protein
MCVmean corpuscular volume
MEF2myocyte enhancer factor-2
MeVMulti Experimental Viewer
MIPmacrophage inflammatory protein
MMP7matrix metallopeptidase 7
MPOmyeloperoxidase
NFKBIZnuclear factor of kappa light polypeptide gene enhancer in B cells inhibitor zeta
NKnatural killer cells
NMDAN-methyl-D-aspartate
NSAIDnonsteroidal anti-inflammatory drug
PASPeriodic acid-Schiff reaction
PER2period circadian regulator 2
PLIN2perilipin 2
PLTplatelet
PMLpolymorphonuclear leukocytes
PPARperoxisome proliferator-activated receptor
PPIprotein-protein interaction
PWMpositional weight matrices
RBCred blood cells
RETreticulocyte
RGC-32response gene to complement 32
ROSreactive oxygen species
RT-PCRreverse transcriptase-polymerase chain reaction
SELLL-selectin
SIRT1sirtuin 1
SODsuperoxide dismutase 1
SPFspecific pathogen free
TBILtotal bilirubin
TFBStranscription factor binding site
TGtriglycerides
TNFtumor necrosis factor
TPtotal protein
TSStranscription start sites
VLDLRvery low-density lipoprotein receptor
WBCwhite blood cells

References

  1. Zuckner, J. International Experience with Diclofenac in Rheumatoid Arthritis. Am. J. Med. 1986, 80, 39–42. [Google Scholar] [CrossRef]
  2. van Laar, M.; Pergolizzi, J.V., Jr.; Mellinghoff, H.U.; Merchante, I.M.; Nalamachu, S.; O’Brien, J.; Perrot, S.; Raffa, R.B. Pain Treatment in Arthritis-Related Pain: Beyond NSAIDs. Open Rheumatol. J. 2012, 6, 320–330. [Google Scholar] [CrossRef] [PubMed] [Green Version]
  3. Hickey, E.J.; Raje, R.R.; Reid, V.E.; Gross, S.M.; Ray, S.D. Diclofenac Induced in Vivo Nephrotoxicity may Involve Oxidative Stress-Mediated Massive Genomic DNA Fragmentation and Apoptotic Cell Death. Free Radic. Biol. Med. 2001, 31, 139–152. [Google Scholar] [CrossRef]
  4. Roth, R.A.; Ganey, P.E. Intrinsic Versus Idiosyncratic Drug-Induced Hepatotoxicity—Two Villains Or One? J. Pharmacol. Exp. Ther. 2010, 332, 692–697. [Google Scholar] [CrossRef] [Green Version]
  5. Mendes, R.T.; Stanczyk, C.P.; Sordi, R.; Otuki, M.F.; dos Santos, F.A.; Fernandes, D. Selective Inhibition of Cyclooxygenase-2: Risks and Benefits. Rev. Bras. Reumatol. 2012, 52, 767–782. [Google Scholar]
  6. Boelsterli, U.A. Diclofenac-Induced Liver Injury: A Paradigm of Idiosyncratic Drug Toxicity. Toxicol. Appl. Pharmacol. 2003, 192, 307–322. [Google Scholar] [CrossRef] [PubMed]
  7. Ng, L.E.; Vincent, A.S.; Halliwell, B.; Wong, K.P. Action of Diclofenac on Kidney Mitochondria and Cells. Biochem. Biophys. Res. Commun. 2006, 348, 494–500. [Google Scholar] [CrossRef] [PubMed]
  8. van Swelm, R.P.; Laarakkers, C.M.; Pertijs, J.C.; Verweij, V.; Masereeuw, R.; Russel, F.G. Urinary Proteomic Profiling Reveals Diclofenac-Induced Renal Injury and Hepatic Regeneration in Mice. Toxicol. Appl. Pharmacol. 2013, 269, 141–149. [Google Scholar] [CrossRef]
  9. Banks, A.T.; Zimmerman, H.J.; Ishak, K.G.; Harter, J.G. Diclofenac-Associated Hepatotoxicity: Analysis of 180 Cases Reported to the Food and Drug Administration as Adverse Reactions. Hepatology 1995, 22, 820–827. [Google Scholar] [CrossRef]
  10. Laine, L.; Goldkind, L.; Curtis, S.P.; Connors, L.G.; Yanqiong, Z.; Cannon, C.P. How Common is Diclofenac-Associated Liver Injury? Analysis of 17,289 Arthritis Patients in a Long-Term Prospective Clinical Trial. Am. J. Gastroenterol. 2009, 104, 356. [Google Scholar] [CrossRef]
  11. LiverTox: Clinical and Research Information on Drug-Induced Liver Injury; National Institute of Diabetes and Digestive and Kidney Diseases: Bethesda, MD, USA, 2012.
  12. Bjornsson, E.S.; Bergmann, O.M.; Bjornsson, H.K.; Kvaran, R.B.; Olafsson, S. Incidence, Presentation, and Outcomes in Patients with Drug-Induced Liver Injury in the General Population of Iceland. Gastroenterology 2013, 144, 1419–1425; quiz e19–e20. [Google Scholar] [CrossRef] [PubMed]
  13. Wilson, C.E.; Dickie, A.P.; Schreiter, K.; Wehr, R.; Wilson, E.M.; Bial, J.; Scheer, N.; Wilson, I.D.; Riley, R.J. The Pharmacokinetics and Metabolism of Diclofenac in Chimeric Humanized and Murinized FRG Mice. Arch. Toxicol. 2018, 92, 1953–1967. [Google Scholar] [CrossRef] [PubMed]
  14. Bort, R.; Ponsoda, X.; Jover, R.; Gomez-Lechon, M.J.; Castell, J.V. Diclofenac Toxicity to Hepatocytes: A Role for Drug Metabolism in Cell Toxicity. J. Pharmacol. Exp. Ther. 1999, 288, 65–72. [Google Scholar] [PubMed]
  15. Owumi, S.E.; Dim, U.J. Biochemical Alterations in Diclofenac-Treated Rats: Effect of Selenium on Oxidative Stress, Inflammation, and Hematological Changes. Toxicol. Res. Appl. 2019, 3, 1–10. [Google Scholar] [CrossRef]
  16. Gomez-Lechon, M.J.; Ponsoda, X.; O’Connor, E.; Donato, T.; Castell, J.V.; Jover, R. Diclofenac Induces Apoptosis in Hepatocytes by Alteration of Mitochondrial Function and Generation of ROS. Biochem. Pharmacol. 2003, 66, 2155–2167. [Google Scholar] [CrossRef]
  17. Aithal, G.P. Hepatotoxicity Related to Antirheumatic Drugs. Nat. Rev. Rheumatol. 2011, 7, 139–150. [Google Scholar] [CrossRef] [PubMed]
  18. Daly, A.K.; Aithal, G.P.; Leathart, J.B.; Swainsbury, R.A.; Dang, T.S.; Day, C.P. Genetic Susceptibility to Diclofenac-Induced Hepatotoxicity: Contribution of UGT2B7, CYP2C8, and ABCC2 Genotypes. Gastroenterology 2007, 132, 272–281. [Google Scholar] [CrossRef]
  19. Lee, E.H.; Oh, J.H.; Selvaraj, S.; Park, S.M.; Choi, M.S.; Spanel, R.; Yoon, S.; Borlak, J. Immunogenomics Reveal Molecular Circuits of Diclofenac Induced Liver Injury in Mice. Oncotarget 2016, 7, 14983. [Google Scholar] [CrossRef] [Green Version]
  20. Selvaraj, S.; Oh, J.H.; Spanel, R.; Langer, F.; Han, H.Y.; Lee, E.H.; Yoon, S.; Borlak, J. The Pathogenesis of Diclofenac Induced Immunoallergic Hepatitis in a Canine Model of Liver Injury. Oncotarget 2017, 8, 107763–107824. [Google Scholar] [CrossRef] [Green Version]
  21. Yano, A.; Higuchi, S.; Tsuneyama, K.; Fukami, T.; Nakajima, M.; Yokoi, T. Involvement of Immune-Related Factors in Diclofenac-Induced Acute Liver Injury in Mice. Toxicology 2012, 293, 107–114. [Google Scholar] [CrossRef]
  22. Bode, G.; Clausing, P.; Gervais, F.; Loegsted, J.; Luft, J.; Nogues, V.; Sims, J.; Steering Group of the RETHINK Project. The Utility of the Minipig as an Animal Model in Regulatory Toxicology. J. Pharmacol. Toxicol. Methods 2010, 62, 196–220. [Google Scholar] [CrossRef]
  23. Rubic-Schneider, T.; Christen, B.; Brees, D.; Kammuller, M. Minipigs in Translational Immunosafety Sciences: A Perspective. Toxicol. Pathol. 2016, 44, 315–324. [Google Scholar] [CrossRef] [Green Version]
  24. Singh, V.K.; Thrall, K.D.; Hauer-Jensen, M. Minipigs as Models in Drug Discovery. Expert Opin. Drug Discov. 2016, 11, 1131–1134. [Google Scholar] [CrossRef] [PubMed] [Green Version]
  25. Mukherji, A.; Bailey, S.M.; Staels, B.; Baumert, T.F. The Circadian Clock and Liver Function in Health and Disease. J. Hepatol. 2019, 71, 200–211. [Google Scholar] [CrossRef] [PubMed] [Green Version]
  26. Li, J.; Zhang, N.; Ye, B.; Ju, W.; Orser, B.; Fox, J.E.; Wheeler, M.B.; Wang, Q.; Lu, W.Y. Non-Steroidal Anti-Inflammatory Drugs Increase Insulin Release from Beta Cells by Inhibiting ATP-Sensitive Potassium Channels. Br. J. Pharmacol. 2007, 151, 483–493. [Google Scholar] [CrossRef] [PubMed] [Green Version]
  27. Ortiz, M.I.; Torres-López, J.E.; Castañeda-Hernández, G.; Rosas, R.; Vidal-Cantú, G.C.; Granados-Soto, V. Pharmacological Evidence for the Activation of K(+) Channels by Diclofenac. Eur. J. Pharmacol. 2002, 438, 85–91. [Google Scholar] [CrossRef]
  28. Khoja, S.; Nitzahn, M.; Truong, B.; Lambert, J.; Willis, B.; Allegri, G.; Rufenacht, V.; Haberle, J.; Lipshutz, G.S. A Constitutive Knockout of Murine Carbamoyl Phosphate Synthetase 1 Results in Death with Marked Hyperglutaminemia and Hyperammonemia. J. Inherit. Metab. Dis. 2019, 42, 1044–1053. [Google Scholar] [CrossRef]
  29. Ranucci, G.; Rigoldi, M.; Cotugno, G.; Bernabei, S.M.; Liguori, A.; Gasperini, S.; Goffredo, B.M.; Martinelli, D.; Monti, L.; Francalanci, P.; et al. Chronic Liver Involvement in Urea Cycle Disorders. J. Inherit. Metab. Dis. 2019, 42, 1118–1127. [Google Scholar] [CrossRef]
  30. Butler, S.L.; Dong, H.; Cardona, D.; Jia, M.; Zheng, R.; Zhu, H.; Crawford, J.M.; Liu, C. The Antigen for Hep Par 1 Antibody is the Urea Cycle Enzyme Carbamoyl Phosphate Synthetase 1. Lab. Investig. 2008, 88, 78–88. [Google Scholar] [CrossRef] [Green Version]
  31. Sahini, N.; Borlak, J. Genomics of Human Fatty Liver Disease Reveal Mechanistically Linked Lipid Droplet-Associated Gene Regulations in Bland Steatosis and Nonalcoholic Steatohepatitis. Transl. Res. 2016, 177, 41–69. [Google Scholar] [CrossRef]
  32. Sahini, N.; Borlak, J. Recent Insights into the Molecular Pathophysiology of Lipid Droplet Formation in Hepatocytes. Prog. Lipid Res. 2014, 54, 86–112. [Google Scholar] [CrossRef]
  33. Bradbury, M.W. Lipid Metabolism and Liver Inflammation. I. Hepatic Fatty Acid Uptake: Possible Role in Steatosis. Am. J. Physiol. Gastrointest. Liver Physiol. 2006, 290, G194–G198. [Google Scholar] [CrossRef] [Green Version]
  34. Reddy, J.K.; Rao, M.S. Lipid Metabolism and Liver Inflammation. II. Fatty Liver Disease and Fatty Acid Oxidation. Am. J. Physiol. Gastrointest. Liver Physiol. 2006, 290, G852–G858. [Google Scholar] [CrossRef] [Green Version]
  35. Liu, Y.J.; Li, H.; Tian, Y.; Han, J.; Wang, X.Y.; Li, X.Y.; Tian, C.; Zhang, P.H.; Hao, Y.; Gao, F.; et al. PCTR1 Ameliorates Lipopolysaccharide-Induced Acute Inflammation and Multiple Organ Damage Via Regulation of Linoleic Acid Metabolism by Promoting FADS1/FASDS2/ELOV2 Expression and Reducing PLA2 Expression. Lab. Investig. 2020, 100, 904–915. [Google Scholar] [CrossRef] [PubMed]
  36. Kawase, A.; Hashimoto, R.; Shibata, M.; Shimada, H.; Iwaki, M. Involvement of Reactive Metabolites of Diclofenac in Cytotoxicity in Sandwich-Cultured Rat Hepatocytes. Int. J. Toxicol. 2017, 36, 260–267. [Google Scholar] [CrossRef] [PubMed]
  37. Li, H.S.; Zhou, Y.N.; Li, L.; Li, S.F.; Long, D.; Chen, X.L.; Zhang, J.B.; Feng, L.; Li, Y.P. HIF-1alpha Protects Against Oxidative Stress by Directly Targeting Mitochondria. Redox Biol. 2019, 25, 101109. [Google Scholar] [CrossRef] [PubMed]
  38. Maas, S.L.; Soehnlein, O.; Viola, J.R. Organ-Specific Mechanisms of Transendothelial Neutrophil Migration in the Lung, Liver, Kidney, and Aorta. Front. Immunol. 2018, 9, 2739. [Google Scholar] [CrossRef] [PubMed] [Green Version]
  39. Vlaicu, S.I.; Tatomir, A.; Anselmo, F.; Boodhoo, D.; Chira, R.; Rus, V.; Rus, H. RGC-32 and Diseases: The First 20 Years. Immunol. Res. 2019, 67, 267–279. [Google Scholar] [CrossRef] [PubMed]
  40. Borniger, J.C.; Walker Ii, W.H.; Surbhi; Emmer, K.M.; Zhang, N.; Zalenski, A.A.; Muscarella, S.L.; Fitzgerald, J.A.; Smith, A.N.; Braam, C.J.; et al. A Role for Hypocretin/Orexin in Metabolic and Sleep Abnormalities in a Mouse Model of Non-Metastatic Breast Cancer. Cell Metab. 2018, 28, 118–129.e5. [Google Scholar] [CrossRef] [Green Version]
  41. Hirano, A.; Hsu, P.K.; Zhang, L.; Xing, L.; McMahon, T.; Yamazaki, M.; Ptacek, L.J.; Fu, Y.H. DEC2 Modulates Orexin Expression and Regulates Sleep. Proc. Natl. Acad. Sci. USA 2018, 115, 3434–3439. [Google Scholar] [CrossRef] [Green Version]
  42. Oakley, R.H.; Cidlowski, J.A. The Biology of the Glucocorticoid Receptor: New Signaling Mechanisms in Health and Disease. J. Allergy Clin. Immunol. 2013, 132, 1033–1044. [Google Scholar] [CrossRef] [PubMed]
  43. Carter, S.J.; Durrington, H.J.; Gibbs, J.E.; Blaikley, J.; Loudon, A.S.; Ray, D.W.; Sabroe, I. A Matter of Time: Study of Circadian Clocks and their Role in Inflammation. J. Leukoc. Biol. 2016, 99, 549–560. [Google Scholar] [CrossRef] [PubMed] [Green Version]
  44. Hergenhan, S.; Holtkamp, S.; Scheiermann, C. Molecular Interactions between Components of the Circadian Clock and the Immune System. J. Mol. Biol. 2020, 432, 3700–3713. [Google Scholar] [CrossRef] [PubMed]
  45. Vieira, E.; Mirizio, G.G.; Barin, G.R.; de Andrade, R.V.; Nimer, N.F.S.; La Sala, L. Clock Genes, Inflammation and the Immune System-Implications for Diabetes, Obesity and Neurodegenerative Diseases. Int. J. Mol. Sci. 2020, 21, 9743. [Google Scholar] [CrossRef] [PubMed]
  46. Reinke, H.; Asher, G. Circadian Clock Control of Liver Metabolic Functions. Gastroenterology 2016, 150, 574–580. [Google Scholar] [CrossRef] [PubMed] [Green Version]
  47. Wang, T.; Wang, Z.; Yang, P.; Xia, L.; Zhou, M.; Wang, S.; Du, J.; Zhang, J. PER1 Prevents Excessive Innate Immune Response during Endotoxin-Induced Liver Injury through Regulation of Macrophage Recruitment in Mice. Cell Death Dis. 2016, 7, e2176. [Google Scholar] [CrossRef] [Green Version]
  48. Narasimamurthy, R.; Hatori, M.; Nayak, S.K.; Liu, F.; Panda, S.; Verma, I.M. Circadian Clock Protein Cryptochrome Regulates the Expression of Proinflammatory Cytokines. Proc. Natl. Acad. Sci. USA 2012, 109, 12662–12667. [Google Scholar] [CrossRef] [Green Version]
  49. Cermakian, N.; Westfall, S.; Kiessling, S. Circadian Clocks and Inflammation: Reciprocal Regulation and Shared Mediators. Arch. Immunol. Ther. Exp. 2014, 62, 303–318. [Google Scholar] [CrossRef] [Green Version]
  50. Dubrovsky, Y.V.; Samsa, W.E.; Kondratov, R.V. Deficiency of Circadian Protein CLOCK Reduces Lifespan and Increases Age-Related Cataract Development in Mice. Aging 2010, 2, 936–944. [Google Scholar] [CrossRef] [Green Version]
  51. Spengler, M.L.; Kuropatwinski, K.K.; Comas, M.; Gasparian, A.V.; Fedtsova, N.; Gleiberman, A.S.; Gitlin, I.I.; Artemicheva, N.M.; Deluca, K.A.; Gudkov, A.V.; et al. Core Circadian Protein CLOCK is a Positive Regulator of NF-kappaB- Mediated Transcription. Proc. Natl. Acad. Sci. USA 2012, 109, E2457–E2465. [Google Scholar] [CrossRef] [Green Version]
  52. DeBruyne, J.P.; Weaver, D.R.; Dallmann, R. The Hepatic Circadian Clock Modulates Xenobiotic Metabolism in Mice. J. Biol. Rhythms 2014, 29, 277–287. [Google Scholar] [CrossRef] [PubMed]
  53. Fribourgh, J.L.; Partch, C.L. Assembly and Function of bHLH-PAS Complexes. Proc. Natl. Acad. Sci. USA 2017, 114, 5330–5332. [Google Scholar] [CrossRef] [PubMed] [Green Version]
  54. Tian, L.X.; Tang, X.; Zhu, J.Y.; Luo, L.; Ma, X.Y.; Cheng, S.W.; Zhang, W.; Tang, W.Q.; Ma, W.; Yang, X.; et al. Correction to: Cytochrome P450 1A1 Enhances Inflammatory Responses and Impedes Phagocytosis of Bacteria in Macrophages during Sepsis. Cell Commun. Signal. 2020, 18, 74. [Google Scholar] [CrossRef] [PubMed]
  55. Dickmeis, T. Glucocorticoids and the Circadian Clock. J. Endocrinol. 2009, 200, 3–22. [Google Scholar] [CrossRef] [Green Version]
  56. Yeager, M.P.; Pioli, P.A.; Guyre, P.M. Cortisol Exerts Bi-Phasic Regulation of Inflammation in Humans. Dose Response 2011, 9, 332–347. [Google Scholar] [CrossRef]
  57. Meyer, E.J.; Nenke, M.A.; Rankin, W.; Lewis, J.G.; Torpy, D.J. Corticosteroid-Binding Globulin: A Review of Basic and Clinical Advances. Horm. Metab. Res. 2016, 48, 359–371. [Google Scholar] [CrossRef]
  58. Vandevyver, S.; Dejager, L.; Libert, C. On the Trail of the Glucocorticoid Receptor: Into the Nucleus and Back. Traffic 2012, 13, 364–374. [Google Scholar] [CrossRef]
  59. Timmermans, S.; Souffriau, J.; Libert, C. A General Introduction to Glucocorticoid Biology. Front. Immunol. 2019, 10, 1545. [Google Scholar] [CrossRef] [Green Version]
  60. Binder, E.B.; Nemeroff, C.B. The CRF System, Stress, Depression and Anxiety-Insights from Human Genetic Studies. Mol. Psychiatry 2010, 15, 574–588. [Google Scholar] [CrossRef] [PubMed] [Green Version]
  61. Paschos, K.A.; Chouridou, E.; Koureta, M.; Lambropoulou, M.; Kolios, G.; Chatzaki, E. The Corticotropin Releasing Factor System in the Liver: Expression, Actions and Possible Implications in Hepatic Physiology and Pathology. Hormones 2013, 12, 236–245. [Google Scholar] [CrossRef]
  62. Chen, H.; Shi, H.; Liu, Y.; Ren, X.; He, S.; Chang, X.; Yin, Y. Activation of Corticotropin-Releasing Factor Receptor 1 Aggravates Dextran Sodium Sulphate-Induced Colitis in Mice by Promoting M1 Macrophage Polarization. Mol. Med. Rep. 2018, 17, 234–242. [Google Scholar] [CrossRef] [PubMed]
  63. Teschke, R. Idiosyncratic DILI: Analysis of 46,266 Cases Assessed for Causality by RUCAM and Published from 2014 to Early 2019. Front. Pharmacol. 2019, 10, 730. [Google Scholar] [CrossRef] [PubMed] [Green Version]
  64. Deng, X.; Liguori, M.J.; Sparkenbaugh, E.M.; Waring, J.F.; Blomme, E.A.; Ganey, P.E.; Roth, R.A. Gene Expression Profiles in Livers from Diclofenac-Treated Rats Reveal Intestinal Bacteria-Dependent and -Independent Pathways Associated with Liver Injury. J. Pharmacol. Exp. Ther. 2008, 327, 634–644. [Google Scholar] [CrossRef]
  65. Soucek, P.; Zuber, R.; Anzenbacherova, E.; Anzenbacher, P.; Guengerich, F.P. Minipig Cytochrome P450 3A, 2A and 2C Enzymes have Similar Properties to Human Analogs. BMC Pharmacol. 2001, 1, 11. [Google Scholar] [CrossRef] [PubMed]
  66. Shang, H.; Yang, J.; Liu, Y.; Wei, H. Tissue Distribution of CYP3A29 mRNA Expression in Bama Miniature Pig by Quantitative Reverse Transcriptase-Polymerase Chain Reaction (RT-PCR). Xenobiotica 2009, 39, 423–429. [Google Scholar] [CrossRef]
  67. Puccinelli, E.; Gervasi, P.G.; Longo, V. Xenobiotic Metabolizing Cytochrome P450 in Pig, a Promising Animal Model. Curr. Drug Metab. 2011, 12, 507–525. [Google Scholar] [CrossRef]
  68. Liu, X.; Wen, J.; Chen, R.; Zhang, T.; Jiang, J.; Deng, Y. T-2 Toxin Induces the Expression of Porcine CYP3A22 Via the Upregulation of the Transcription Factor, NF-Y. Biochim. Biophys. Acta 2016, 1860, 2191–2201. [Google Scholar] [CrossRef]
  69. Jover, R.; Bort, R.; Gomez-Lechon, M.J.; Castell, J.V. Down-Regulation of Human CYP3A4 by the Inflammatory Signal Interleukin-6: Molecular Mechanism and Transcription Factors Involved. FASEB J. 2002, 16, 1799–1801. [Google Scholar] [CrossRef]
  70. Aitken, A.E.; Morgan, E.T. Gene-Specific Effects of Inflammatory Cytokines on Cytochrome P450 2C, 2B6 and 3A4 mRNA Levels in Human Hepatocytes. Drug Metab. Dispos. 2007, 35, 1687–1693. [Google Scholar] [CrossRef]
  71. Miyamoto, G.; Zahid, N.; Uetrecht, J.P. Oxidation of Diclofenac to Reactive Intermediates by Neutrophils, Myeloperoxidase, and Hypochlorous Acid. Chem. Res. Toxicol. 1997, 10, 414–419. [Google Scholar] [CrossRef]
  72. Chiang, J.Y. Bile Acids: Regulation of Synthesis. J. Lipid Res. 2009, 50, 1955–1966. [Google Scholar] [CrossRef]
  73. Li, T.; Owsley, E.; Matozel, M.; Hsu, P.; Novak, C.M.; Chiang, J.Y. Transgenic Expression of Cholesterol 7alpha-Hydroxylase in the Liver Prevents High-Fat Diet-Induced Obesity and Insulin Resistance in Mice. Hepatology 2010, 52, 678–690. [Google Scholar] [CrossRef] [Green Version]
  74. Sarkar, U.; Ravindra, K.C.; Large, E.; Young, C.L.; Rivera-Burgos, D.; Yu, J.; Cirit, M.; Hughes, D.J.; Wishnok, J.S.; Lauffenburger, D.A.; et al. Integrated Assessment of Diclofenac Biotransformation, Pharmacokinetics, and Omics-Based Toxicity in a Three-Dimensional Human Liver-Immunocompetent Coculture System. Drug Metab. Dispos. 2017, 45, 855–866. [Google Scholar] [CrossRef] [PubMed] [Green Version]
  75. Roma, M.G.; Toledo, F.D.; Boaglio, A.C.; Basiglio, C.L.; Crocenzi, F.A.; Sanchez Pozzi, E.J. Ursodeoxycholic Acid in Cholestasis: Linking Action Mechanisms to Therapeutic Applications. Clin. Sci. 2011, 121, 523–544. [Google Scholar] [CrossRef] [PubMed] [Green Version]
  76. Kanai, S.; Kitani, K. Glycoursodeoxycholate is as Effective as Tauroursodeoxycholate in Preventing the Taurocholate-Induced Cholestasis in the Rat. Res. Commun. Chem. Pathol. Pharmacol. 1983, 42, 423–430. [Google Scholar]
  77. Heemskerk, S.; Pickkers, P.; Bouw, M.P.; Draisma, A.; van der Hoeven, J.G.; Peters, W.H.; Smits, P.; Russel, F.G.; Masereeuw, R. Upregulation of Renal Inducible Nitric Oxide Synthase during Human Endotoxemia and Sepsis is Associated with Proximal Tubule Injury. Clin. J. Am. Soc. Nephrol. 2006, 1, 853–862. [Google Scholar] [CrossRef] [Green Version]
  78. Semple, F.; Dorin, J.R. Beta-Defensins: Multifunctional Modulators of Infection, Inflammation and More? J. Innate Immun. 2012, 4, 337–348. [Google Scholar] [CrossRef]
  79. Ragland, S.A.; Criss, A.K. From Bacterial Killing to Immune Modulation: Recent Insights into the Functions of Lysozyme. PLoS Pathog. 2017, 13, e1006512. [Google Scholar] [CrossRef] [PubMed] [Green Version]
  80. Klag, T.; Thomas, M.; Ehmann, D.; Courth, L.; Mailander-Sanchez, D.; Weiss, T.S.; Dayoub, R.; Abshagen, K.; Vollmar, B.; Thasler, W.E.; et al. Beta-Defensin 1 is Prominent in the Liver and Induced during Cholestasis by Bilirubin and Bile Acids Via Farnesoid X Receptor and Constitutive Androstane Receptor. Front. Immunol. 2018, 9, 1735. [Google Scholar] [CrossRef] [Green Version]
  81. Gujral, J.S.; Farhood, A.; Bajt, M.L.; Jaeschke, H. Neutrophils Aggravate Acute Liver Injury during Obstructive Cholestasis in Bile Duct-Ligated Mice. Hepatology 2003, 38, 355–363. [Google Scholar] [CrossRef] [Green Version]
  82. Bautista, A.P. Chronic Alcohol Intoxication Induces Hepatic Injury through Enhanced Macrophage Inflammatory Protein-2 Production and Intercellular Adhesion Molecule-1 Expression in the Liver. Hepatology 1997, 25, 335–342. [Google Scholar] [CrossRef] [PubMed]
  83. Deng, X.; Stachlewitz, R.F.; Liguori, M.J.; Blomme, E.A.; Waring, J.F.; Luyendyk, J.P.; Maddox, J.F.; Ganey, P.E.; Roth, R.A. Modest Inflammation Enhances Diclofenac Hepatotoxicity in Rats: Role of Neutrophils and Bacterial Translocation. J. Pharmacol. Exp. Ther. 2006, 319, 1191–1199. [Google Scholar] [CrossRef]
  84. Jaeschke, H.; Ho, Y.S.; Fisher, M.A.; Lawson, J.A.; Farhood, A. Glutathione Peroxidase-Deficient Mice are More Susceptible to Neutrophil-Mediated Hepatic Parenchymal Cell Injury during Endotoxemia: Importance of an Intracellular Oxidant Stress. Hepatology 1999, 29, 443–450. [Google Scholar] [CrossRef] [PubMed]
  85. Ramaiah, S.K.; Jaeschke, H. Role of Neutrophils in the Pathogenesis of Acute Inflammatory Liver Injury. Toxicol. Pathol. 2007, 35, 757–766. [Google Scholar] [CrossRef]
  86. Deng, X.; Luyendyk, J.P.; Ganey, P.E.; Roth, R.A. Inflammatory Stress and Idiosyncratic Hepatotoxicity: Hints from Animal Models. Pharmacol. Rev. 2009, 61, 262–282. [Google Scholar] [CrossRef] [PubMed] [Green Version]
  87. Salama, A.; Gottsche, B.; Mueller-Eckhardt, C. Autoantibodies and Drug- Or Metabolite-Dependent Antibodies in Patients with Diclofenac-Induced Immune Haemolysis. Br. J. Haematol. 1991, 77, 546–549. [Google Scholar] [CrossRef]
  88. Romano, A.; Quaratino, D.; Papa, G.; Di Fonso, M.; Artesani, M.C.; Venuti, A. Delayed Hypersensitivity to Diclofenac: A Report on Two Cases. Ann. Allergy Asthma Immunol. 1998, 81, 373–375. [Google Scholar] [CrossRef]
  89. Harrer, A.; Lang, R.; Grims, R.; Braitsch, M.; Hawranek, T.; Aberer, W.; Vogel, L.; Schmid, W.; Ferreira, F.; Himly, M. Diclofenac Hypersensitivity: Antibody Responses to the Parent Drug and Relevant Metabolites. PLoS ONE 2010, 5, e13707. [Google Scholar] [CrossRef]
  90. Marra, F.; Tacke, F. Roles for Chemokines in Liver Disease. Gastroenterology 2014, 147, 577–594.e1. [Google Scholar] [CrossRef]
  91. Publicover, J.; Gaggar, A.; Nishimura, S.; Van Horn, C.M.; Goodsell, A.; Muench, M.O.; Reinhardt, R.L.; van Rooijen, N.; Wakil, A.E.; Peters, M.; et al. Age-Dependent Hepatic Lymphoid Organization Directs Successful Immunity to Hepatitis B. J. Clin. Investig. 2013, 123, 3728–3739. [Google Scholar] [CrossRef] [Green Version]
  92. Li, C.; Kang, D.; Sun, X.; Liu, Y.; Wang, J.; Gao, P. The Effect of C-X-C Motif Chemokine 13 on Hepatocellular Carcinoma Associates with Wnt Signaling. Biomed. Res. Int. 2015, 2015, 345413. [Google Scholar] [CrossRef] [PubMed] [Green Version]
  93. Wehr, A.; Baeck, C.; Heymann, F.; Niemietz, P.M.; Hammerich, L.; Martin, C.; Zimmermann, H.W.; Pack, O.; Gassler, N.; Hittatiya, K.; et al. Chemokine Receptor CXCR6-Dependent Hepatic NK T Cell Accumulation Promotes Inflammation and Liver Fibrosis. J. Immunol. 2013, 190, 5226–5236. [Google Scholar] [CrossRef] [PubMed]
  94. Wang, H.; Shao, Y.; Zhang, S.; Xie, A.; Ye, Y.; Shi, L.; Jin, L.; Pan, X.; Lin, Z.; Li, X.; et al. CXCL16 Deficiency Attenuates Acetaminophen-Induced Hepatotoxicity through Decreasing Hepatic Oxidative Stress and Inflammation in Mice. Acta Biochim. Biophys. Sin. 2017, 49, 541–549. [Google Scholar] [CrossRef] [PubMed] [Green Version]
  95. Si, Y.; Tsou, C.L.; Croft, K.; Charo, I.F. CCR2 Mediates Hematopoietic Stem and Progenitor Cell Trafficking to Sites of Inflammation in Mice. J. Clin. Investig. 2010, 120, 1192–1203. [Google Scholar] [CrossRef]
  96. Hellier, S.; Frodsham, A.J.; Hennig, B.J.; Klenerman, P.; Knapp, S.; Ramaley, P.; Satsangi, J.; Wright, M.; Zhang, L.; Thomas, H.C.; et al. Association of Genetic Variants of the Chemokine Receptor CCR5 and its Ligands, RANTES and MCP-2, with Outcome of HCV Infection. Hepatology 2003, 38, 1468–1476. [Google Scholar] [CrossRef]
  97. Viola, A.; Luster, A.D. Chemokines and their Receptors: Drug Targets in Immunity and Inflammation. Annu. Rev. Pharmacol. Toxicol. 2008, 48, 171–197. [Google Scholar] [CrossRef]
  98. Wasmuth, H.E.; Tacke, F.; Trautwein, C. Chemokines in Liver Inflammation and Fibrosis. Semin. Liver Dis. 2010, 30, 215–225. [Google Scholar] [CrossRef]
  99. Hori, T.; Naishiro, Y.; Sohma, H.; Suzuki, N.; Hatakeyama, N.; Yamamoto, M.; Sonoda, T.; Mizue, Y.; Imai, K.; Tsutsumi, H.; et al. CCL8 is a Potential Molecular Candidate for the Diagnosis of Graft-Versus-Host Disease. Blood 2008, 111, 4403–4412. [Google Scholar] [CrossRef] [Green Version]
  100. Shouval, D.S.; Ouahed, J.; Biswas, A.; Goettel, J.A.; Horwitz, B.H.; Klein, C.; Muise, A.M.; Snapper, S.B. Interleukin 10 Receptor Signaling: Master Regulator of Intestinal Mucosal Homeostasis in Mice and Humans. Adv. Immunol. 2014, 122, 177–210. [Google Scholar]
  101. Disteldorf, E.M.; Krebs, C.F.; Paust, H.J.; Turner, J.E.; Nouailles, G.; Tittel, A.; Meyer-Schwesinger, C.; Stege, G.; Brix, S.; Velden, J.; et al. CXCL5 Drives Neutrophil Recruitment in TH17-Mediated GN. J. Am. Soc. Nephrol. 2015, 26, 55–66. [Google Scholar] [CrossRef] [Green Version]
  102. Starnes, T.; Rasila, K.K.; Robertson, M.J.; Brahmi, Z.; Dahl, R.; Christopherson, K.; Hromas, R. The Chemokine CXCL14 (BRAK) Stimulates Activated NK Cell Migration: Implications for the Downregulation of CXCL14 in Malignancy. Exp. Hematol. 2006, 34, 1101–1105. [Google Scholar] [CrossRef]
  103. Hara, T.; Tanegashima, K. Pleiotropic Functions of the CXC-Type Chemokine CXCL14 in Mammals. J. Biochem. 2012, 151, 469–476. [Google Scholar] [CrossRef]
  104. Wada, T.; Furuichi, K.; Sakai, N.; Shimizu, M.; Segawa, C.; Kobayashi, K.; Mukaida, N.; Kasahara, T.; Matsushima, K.; Yokoyama, H. Eotaxin Contributes to Renal Interstitial Eosinophilia. Nephrol. Dial. Transplant. 1999, 14, 76–80. [Google Scholar] [CrossRef]
  105. Badewa, A.P.; Hudson, C.E.; Heiman, A.S. Regulatory Effects of Eotaxin, Eotaxin-2, and Eotaxin-3 on Eosinophil Degranulation and Superoxide Anion Generation. Exp. Biol. Med. 2002, 227, 645–651. [Google Scholar] [CrossRef] [PubMed]
  106. Coquery, C.M.; Wade, N.S.; Loo, W.M.; Kinchen, J.M.; Cox, K.M.; Jiang, C.; Tung, K.S.; Erickson, L.D. Neutrophils Contribute to Excess Serum BAFF Levels and Promote CD4+ T Cell and B Cell Responses in Lupus-Prone Mice. PLoS ONE 2014, 9, e102284. [Google Scholar] [CrossRef] [PubMed]
  107. Wisniewski, H.G.; Vilcek, J. TSG-6: An IL-1/TNF-Inducible Protein with Anti-Inflammatory Activity. Cytokine Growth Factor Rev. 1997, 8, 143–156. [Google Scholar] [CrossRef]
  108. Thurman, J.M.; Holers, V.M. The Central Role of the Alternative Complement Pathway in Human Disease. J. Immunol. 2006, 176, 1305–1310. [Google Scholar] [CrossRef] [PubMed] [Green Version]
  109. Zhou, W.; Farrar, C.A.; Abe, K.; Pratt, J.R.; Marsh, J.E.; Wang, Y.; Stahl, G.L.; Sacks, S.H. Predominant Role for C5b-9 in Renal Ischemia/Reperfusion Injury. J. Clin. Investig. 2000, 105, 1363–1371. [Google Scholar] [CrossRef] [Green Version]
  110. Danobeitia, J.S.; Djamali, A.; Fernandez, L.A. The Role of Complement in the Pathogenesis of Renal Ischemia-Reperfusion Injury and Fibrosis. Fibrogenesis Tissue Repair 2014, 7, 16. [Google Scholar] [CrossRef] [Green Version]
  111. Keller, M.; Mazuch, J.; Abraham, U.; Eom, G.D.; Herzog, E.D.; Volk, H.D.; Kramer, A.; Maier, B. A Circadian Clock in Macrophages Controls Inflammatory Immune Responses. Proc. Natl. Acad. Sci. USA 2009, 106, 21407–21412. [Google Scholar] [CrossRef] [Green Version]
  112. Sukumaran, S.; Almon, R.R.; DuBois, D.C.; Jusko, W.J. Circadian Rhythms in Gene Expression: Relationship to Physiology, Disease, Drug Disposition and Drug Action. Adv. Drug Deliv. Rev. 2010, 62, 904–917. [Google Scholar] [CrossRef] [Green Version]
  113. Wang, L.; Liangpunsakul, S. Circadian Clock Control of Hepatic Lipid Metabolism: Role of Small Heterodimer Partner (Shp). J. Investig. Med. 2016, 64, 1158–1161. [Google Scholar] [CrossRef] [PubMed] [Green Version]
  114. Green, C.B.; Takahashi, J.S.; Bass, J. The Meter of Metabolism. Cell 2008, 134, 728–742. [Google Scholar] [CrossRef] [PubMed]
  115. Asher, G.; Schibler, U. Crosstalk between Components of Circadian and Metabolic Cycles in Mammals. Cell Metab. 2011, 13, 125–137. [Google Scholar] [CrossRef] [Green Version]
  116. Kakan, X.; Chen, P.; Zhang, J. Clock Gene mPer2 Functions in Diurnal Variation of Acetaminophen Induced Hepatotoxicity in Mice. Exp. Toxicol. Pathol. 2011, 63, 581–585. [Google Scholar] [CrossRef] [PubMed]
  117. Chen, P.; Kakan, X.; Wang, S.; Dong, W.; Jia, A.; Cai, C.; Zhang, J. Deletion of Clock Gene Per2 Exacerbates Cholestatic Liver Injury and Fibrosis in Mice. Exp. Toxicol. Pathol. 2013, 65, 427–432. [Google Scholar] [CrossRef]
  118. Chen, P.; Li, C.; Pang, W.; Zhao, Y.; Dong, W.; Wang, S.; Zhang, J. The Protective Role of Per2 Against Carbon Tetrachloride-Induced Hepatotoxicity. Am. J. Pathol. 2009, 174, 63–70. [Google Scholar] [CrossRef] [Green Version]
  119. Bugge, A.; Feng, D.; Everett, L.J.; Briggs, E.R.; Mullican, S.E.; Wang, F.; Jager, J.; Lazar, M.A. Rev-Erbalpha and Rev-Erbbeta Coordinately Protect the Circadian Clock and Normal Metabolic Function. Genes Dev. 2012, 26, 657–667. [Google Scholar] [CrossRef] [Green Version]
  120. Jetten, A.M.; Kang, H.S.; Takeda, Y. Retinoic Acid-Related Orphan Receptors Alpha and Gamma: Key Regulators of Lipid/Glucose Metabolism, Inflammation, and Insulin Sensitivity. Front. Endocrinol. 2013, 4, 1. [Google Scholar] [CrossRef] [Green Version]
  121. Lin, Y.; Wang, S.; Zhou, Z.; Guo, L.; Yu, F.; Wu, B. Bmal1 Regulates Circadian Expression of Cytochrome P450 3a11 and Drug Metabolism in Mice. Commun. Biol. 2019, 2, 1–11. [Google Scholar] [CrossRef] [Green Version]
  122. Ripperger, J.A.; Shearman, L.P.; Reppert, S.M.; Schibler, U. CLOCK, an Essential Pacemaker Component, Controls Expression of the Circadian Transcription Factor DBP. Genes Dev. 2000, 14, 679–689. [Google Scholar] [CrossRef] [PubMed]
  123. Yamaguchi, S.; Mitsui, S.; Yan, L.; Yagita, K.; Miyake, S.; Okamura, H. Role of DBP in the Circadian Oscillatory Mechanism. Mol. Cell. Biol. 2000, 20, 4773–4781. [Google Scholar] [CrossRef] [PubMed] [Green Version]
  124. Stratmann, M.; Stadler, F.; Tamanini, F.; van der Horst, G.T.; Ripperger, J.A. Flexible Phase Adjustment of Circadian Albumin D Site-Binding Protein (DBP) Gene Expression by CRYPTOCHROME1. Genes Dev. 2010, 24, 1317–1328. [Google Scholar] [CrossRef] [PubMed]
  125. Stratmann, M.; Suter, D.M.; Molina, N.; Naef, F.; Schibler, U. Circadian Dbp Transcription Relies on Highly Dynamic BMAL1-CLOCK Interaction with E Boxes and Requires the Proteasome. Mol. Cell 2012, 48, 277–287. [Google Scholar] [CrossRef] [PubMed] [Green Version]
  126. Gachon, F.; Olela, F.F.; Schaad, O.; Descombes, P.; Schibler, U. The Circadian PAR-Domain Basic Leucine Zipper Transcription Factors DBP, TEF, and HLF Modulate Basal and Inducible Xenobiotic Detoxification. Cell Metab. 2006, 4, 25–36. [Google Scholar] [CrossRef]
  127. Saran, A.R.; Dave, S.; Zarrinpar, A. Circadian Rhythms in the Pathogenesis and Treatment of Fatty Liver Disease. Gastroenterology 2020, 158, 1948–1966.e1. [Google Scholar] [CrossRef]
  128. Udoh, U.S.; Valcin, J.A.; Gamble, K.L.; Bailey, S.M. The Molecular Circadian Clock and Alcohol-Induced Liver Injury. Biomolecules 2015, 5, 2504–2537. [Google Scholar] [CrossRef] [Green Version]
  129. Ge, W.; Wang, T.; Zhao, Y.; Yang, Y.; Sun, Q.; Yang, X.; Gao, Y.; Xu, X.; Zhang, J. Period1 Mediates Rhythmic Metabolism of Toxins by Interacting with CYP2E1. Cell Death Dis. 2021, 12, 76. [Google Scholar] [CrossRef]
  130. Xu, R.; Shang, C.; Zhao, J.; Han, Y.; Liu, J.; Chen, K.; Shi, W. Knockdown of Response Gene to Complement 32 (RGC32) Induces Apoptosis and Inhibits Cell Growth, Migration, and Invasion in Human Lung Cancer Cells. Mol. Cell. Biochem. 2014, 394, 109–118. [Google Scholar] [CrossRef]
  131. Tegla, C.A.; Cudrici, C.D.; Nguyen, V.; Danoff, J.; Kruszewski, A.M.; Boodhoo, D.; Mekala, A.P.; Vlaicu, S.I.; Chen, C.; Rus, V.; et al. RGC-32 is a Novel Regulator of the T-Lymphocyte Cell Cycle. Exp. Mol. Pathol. 2015, 98, 328–337. [Google Scholar] [CrossRef] [Green Version]
  132. Tang, R.; Zhang, G.; Chen, S.Y. Response Gene to Complement 32 Protein Promotes Macrophage Phagocytosis Via Activation of Protein Kinase C Pathway. J. Biol. Chem. 2014, 289, 22715–22722. [Google Scholar] [CrossRef] [PubMed] [Green Version]
  133. Cui, X.B.; Luan, J.N.; Chen, S.Y. RGC-32 Deficiency Protects Against Hepatic Steatosis by Reducing Lipogenesis. J. Biol. Chem. 2015, 290, 20387–20395. [Google Scholar] [CrossRef] [Green Version]
  134. Cui, X.B.; Chen, S.Y. Response Gene to Complement 32 in Vascular Diseases. Front. Cardiovasc. Med. 2018, 5, 128. [Google Scholar] [CrossRef]
  135. de Almeida, C.J.G. Caveolin-1 and Caveolin-2 can be Antagonistic Partners in Inflammation and Beyond. Front. Immunol. 2017, 8, 1530. [Google Scholar] [CrossRef] [PubMed] [Green Version]
  136. Fernandez-Rojo, M.A.; Ramm, G.A. Caveolin-1 Function in Liver Physiology and Disease. Trends Mol. Med. 2016, 22, 889–904. [Google Scholar] [CrossRef]
  137. Li, M.; Chen, D.; Huang, H.; Wang, J.; Wan, X.; Xu, C.; Li, C.; Ma, H.; Yu, C.; Li, Y. Caveolin1 Protects Against Diet Induced Hepatic Lipid Accumulation in Mice. PLoS ONE 2017, 12, e0178748. [Google Scholar] [CrossRef] [PubMed] [Green Version]
  138. Bosch, M.; Mari, M.; Herms, A.; Fernandez, A.; Fajardo, A.; Kassan, A.; Giralt, A.; Colell, A.; Balgoma, D.; Barbero, E.; et al. Caveolin-1 Deficiency Causes Cholesterol-Dependent Mitochondrial Dysfunction and Apoptotic Susceptibility. Curr. Biol. 2011, 21, 681–686. [Google Scholar] [CrossRef] [Green Version]
  139. Yin, Y.; Solomon, G.; Deng, C.; Barrett, J.C. Differential Regulation of p21 by p53 and Rb in Cellular Response to Oxidative Stress. Mol. Carcinog. 1999, 24, 15–24. [Google Scholar] [CrossRef]
  140. Gartel, A.L.; Tyner, A.L. The Role of the Cyclin-Dependent Kinase Inhibitor p21 in Apoptosis. Mol. Cancer. Ther. 2002, 1, 639–649. [Google Scholar]
  141. Hiromura, K.; Pippin, J.W.; Fero, M.L.; Roberts, J.M.; Shankland, S.J. Modulation of Apoptosis by the Cyclin-Dependent Kinase Inhibitor p27(Kip1). J. Clin. Investig. 1999, 103, 597–604. [Google Scholar] [CrossRef] [Green Version]
  142. Baker, S.S.; Baker, R.D.; Liu, W.; Nowak, N.J.; Zhu, L. Role of Alcohol Metabolism in Non-Alcoholic Steatohepatitis. PLoS ONE 2010, 5, e9570. [Google Scholar] [CrossRef] [PubMed] [Green Version]
  143. Yang, S.L.; Xia, J.H.; Zhang, Y.Y.; Fan, J.G.; Wang, H.; Yuan, J.; Zhao, Z.Z.; Pan, Q.; Mu, Y.L.; Xin, L.L.; et al. Hyperinsulinemia Shifted Energy Supply from Glucose to Ketone Bodies in Early Nonalcoholic Steatohepatitis from High-Fat High-Sucrose Diet Induced Bama Minipigs. Sci. Rep. 2015, 5, 13980. [Google Scholar] [CrossRef] [Green Version]
  144. Hayakawa, K.; Nakajima, S.; Hiramatsu, N.; Okamura, M.; Huang, T.; Saito, Y.; Tagawa, Y.; Tamai, M.; Takahashi, S.; Yao, J.; et al. ER Stress Depresses NF-kappaB Activation in Mesangial Cells through Preferential Induction of C/EBP Beta. J. Am. Soc. Nephrol. 2010, 21, 73–81. [Google Scholar] [CrossRef] [Green Version]
  145. Ishihara, K.; Namura, T.; Murayama, H.; Arai, S.; Totani, M.; Ikemoto, M. Possibility of Formation of the S100A8/A9-Proinflammatory Cytokine Complexes in Vivo in Acute Inflammation and their Functional Roles. Rinsho Byori. Jpn. J. Clin. Pathol. 2009, 57, 324–331. [Google Scholar]
  146. Fujiu, K.; Manabe, I.; Nagai, R. Renal Collecting Duct Epithelial Cells Regulate Inflammation in Tubulointerstitial Damage in Mice. J. Clin. Investig. 2011, 121, 3425–3441. [Google Scholar] [CrossRef] [PubMed]
  147. Shikata, K.; Suzuki, Y.; Wada, J.; Hirata, K.; Matsuda, M.; Kawashima, H.; Suzuki, T.; Iizuka, M.; Makino, H.; Miyasaka, M. L-Selectin and its Ligands Mediate Infiltration of Mononuclear Cells into Kidney Interstitium After Ureteric Obstruction. J. Pathol. 1999, 188, 93–99. [Google Scholar] [CrossRef]
  148. Bartneck, M.; Fech, V.; Ehling, J.; Govaere, O.; Warzecha, K.T.; Hittatiya, K.; Vucur, M.; Gautheron, J.; Luedde, T.; Trautwein, C.; et al. Histidine-Rich Glycoprotein Promotes Macrophage Activation and Inflammation in Chronic Liver Disease. Hepatology 2016, 63, 1310–1324. [Google Scholar] [CrossRef] [Green Version]
  149. Arrigo, A.P.; Simon, S.; Gibert, B.; Kretz-Remy, C.; Nivon, M.; Czekalla, A.; Guillet, D.; Moulin, M.; Diaz-Latoud, C.; Vicart, P. Hsp27 (HspB1) and alphaB-Crystallin (HspB5) as Therapeutic Targets. FEBS Lett. 2007, 581, 3665–3674. [Google Scholar] [CrossRef]
  150. Gang, G.T.; Hwang, J.H.; Kim, Y.H.; Noh, J.R.; Kim, K.S.; Jeong, J.Y.; Choi, D.E.; Lee, K.W.; Jung, J.Y.; Shong, M.; et al. Protection of NAD(P)H:Quinone Oxidoreductase 1 Against Renal Ischemia/Reperfusion Injury in Mice. Free Radic. Biol. Med. 2014, 67, 139–149. [Google Scholar] [CrossRef]
  151. Kobayashi, T.; Zadravec, D.; Jacobsson, A. ELOVL2 Overexpression Enhances Triacylglycerol Synthesis in 3T3-L1 and F442A Cells. FEBS Lett. 2007, 581, 3157–3163. [Google Scholar] [CrossRef] [Green Version]
  152. Greenberg, A.S.; Coleman, R.A.; Kraemer, F.B.; McManaman, J.L.; Obin, M.S.; Puri, V.; Yan, Q.W.; Miyoshi, H.; Mashek, D.G. The Role of Lipid Droplets in Metabolic Disease in Rodents and Humans. J. Clin. Investig. 2011, 121, 2102–2110. [Google Scholar] [CrossRef] [Green Version]
  153. Jo, H.; Choe, S.S.; Shin, K.C.; Jang, H.; Lee, J.H.; Seong, J.K.; Back, S.H.; Kim, J.B. Endoplasmic Reticulum Stress Induces Hepatic Steatosis Via Increased Expression of the Hepatic very Low-Density Lipoprotein Receptor. Hepatology 2013, 57, 1366–1377. [Google Scholar] [CrossRef]
  154. Sahini, N.; Selvaraj, S.; Borlak, J. Whole Genome Transcript Profiling of Drug Induced Steatosis in Rats Reveals a Gene Signature Predictive of Outcome. PLoS ONE 2014, 9, e114085. [Google Scholar] [CrossRef] [Green Version]
  155. Leone, T.C.; Lehman, J.J.; Finck, B.N.; Schaeffer, P.J.; Wende, A.R.; Boudina, S.; Courtois, M.; Wozniak, D.F.; Sambandam, N.; Bernal-Mizrachi, C.; et al. PGC-1alpha Deficiency Causes Multi-System Energy Metabolic Derangements: Muscle Dysfunction, Abnormal Weight Control and Hepatic Steatosis. PLoS Biol. 2005, 3, e101. [Google Scholar] [CrossRef] [Green Version]
  156. Aharoni-Simon, M.; Hann-Obercyger, M.; Pen, S.; Madar, Z.; Tirosh, O. Fatty Liver is Associated with Impaired Activity of PPARgamma-Coactivator 1alpha (PGC1alpha) and Mitochondrial Biogenesis in Mice. Lab. Investig. 2011, 91, 1018–1028. [Google Scholar] [CrossRef]
  157. Liu, C.; Li, S.; Liu, T.; Borjigin, J.; Lin, J.D. Transcriptional Coactivator PGC-1alpha Integrates the Mammalian Clock and Energy Metabolism. Nature 2007, 447, 477–481. [Google Scholar] [CrossRef] [PubMed] [Green Version]
  158. Hasegawa, S.; Noda, K.; Maeda, A.; Matsuoka, M.; Yamasaki, M.; Fukui, T. Acetoacetyl-CoA Synthetase, a Ketone Body-Utilizing Enzyme, is Controlled by SREBP-2 and Affects Serum Cholesterol Levels. Mol. Genet. Metab. 2012, 107, 553–560. [Google Scholar] [CrossRef] [PubMed]
  159. Zhang, H.; Chen, Q.; Yang, M.; Zhu, B.; Cui, Y.; Xue, Y.; Gong, N.; Cui, A.; Wang, M.; Shen, L.; et al. Mouse KLF11 Regulates Hepatic Lipid Metabolism. J. Hepatol. 2013, 58, 763–770. [Google Scholar] [CrossRef]
  160. Zhang, H.; Chen, Q.; Jiao, T.; Cui, A.; Sun, X.; Fang, W.; Xie, L.; Liu, Y.; Fang, F.; Chang, Y. Involvement of KLF11 in Hepatic Glucose Metabolism in Mice Via Suppressing of PEPCK-C Expression. PLoS ONE 2014, 9, e89552. [Google Scholar] [CrossRef]
  161. Harvey, P.W.; Sutcliffe, C. Adrenocortical Hypertrophy: Establishing Cause and Toxicological Significance. J. Appl. Toxicol. 2010, 30, 617–626. [Google Scholar] [CrossRef] [PubMed]
  162. Zhang, E.E.; Liu, Y.; Dentin, R.; Pongsawakul, P.Y.; Liu, A.C.; Hirota, T.; Nusinow, D.A.; Sun, X.; Landais, S.; Kodama, Y.; et al. Cryptochrome Mediates Circadian Regulation of cAMP Signaling and Hepatic Gluconeogenesis. Nat. Med. 2010, 16, 1152–1156. [Google Scholar] [CrossRef]
  163. Lamia, K.A.; Papp, S.J.; Yu, R.T.; Barish, G.D.; Uhlenhaut, N.H.; Jonker, J.W.; Downes, M.; Evans, R.M. Cryptochromes Mediate Rhythmic Repression of the Glucocorticoid Receptor. Nature 2011, 480, 552–556. [Google Scholar] [CrossRef] [Green Version]
  164. Harris, A.J.; Thompson, A.R.; Whyte, M.K.; Walmsley, S.R. HIF-Mediated Innate Immune Responses: Cell Signaling and Therapeutic Implications. Hypoxia 2014, 2, 47–58. [Google Scholar]
  165. Palazon, A.; Goldrath, A.W.; Nizet, V.; Johnson, R.S. HIF Transcription Factors, Inflammation, and Immunity. Immunity 2014, 41, 518–528. [Google Scholar] [CrossRef] [Green Version]
  166. Nath, B.; Levin, I.; Csak, T.; Petrasek, J.; Mueller, C.; Kodys, K.; Catalano, D.; Mandrekar, P.; Szabo, G. Hepatocyte-Specific Hypoxia-Inducible Factor-1alpha is a Determinant of Lipid Accumulation and Liver Injury in Alcohol-Induced Steatosis in Mice. Hepatology 2011, 53, 1526–1537. [Google Scholar] [CrossRef] [Green Version]
  167. Nath, B.; Szabo, G. Hypoxia and Hypoxia Inducible Factors: Diverse Roles in Liver Diseases. Hepatology 2012, 55, 622–633. [Google Scholar] [CrossRef]
  168. Beck, I.M.; Vanden Berghe, W.; Vermeulen, L.; Yamamoto, K.R.; Haegeman, G.; De Bosscher, K. Crosstalk in Inflammation: The Interplay of Glucocorticoid Receptor-Based Mechanisms and Kinases and Phosphatases. Endocr. Rev. 2009, 30, 830–882. [Google Scholar] [CrossRef] [Green Version]
  169. Baschant, U.; Tuckermann, J. The Role of the Glucocorticoid Receptor in Inflammation and Immunity. J. Steroid Biochem. Mol. Biol. 2010, 120, 69–75. [Google Scholar] [CrossRef]
  170. Yang, N.; Ray, D.W.; Matthews, L.C. Current Concepts in Glucocorticoid Resistance. Steroids 2012, 77, 1041–1049. [Google Scholar] [CrossRef]
  171. Tang, X.; Metzger, D.; Leeman, S.; Amar, S. LPS-Induced TNF-Alpha Factor (LITAF)-Deficient Mice Express Reduced LPS-Induced Cytokine: Evidence for LITAF-Dependent LPS Signaling Pathways. Proc. Natl. Acad. Sci. USA 2006, 103, 13777–13782. [Google Scholar] [CrossRef] [Green Version]
  172. Ceccarelli, S.; Panera, N.; Mina, M.; Gnani, D.; De Stefanis, C.; Crudele, A.; Rychlicki, C.; Petrini, S.; Bruscalupi, G.; Agostinelli, L.; et al. LPS-Induced TNF-Alpha Factor Mediates Pro-Inflammatory and Pro-Fibrogenic Pattern in Non-Alcoholic Fatty Liver Disease. Oncotarget 2015, 6, 41434–41452. [Google Scholar] [CrossRef] [Green Version]
  173. Xu, A.; Lam, M.C.; Chan, K.W.; Wang, Y.; Zhang, J.; Hoo, R.L.; Xu, J.Y.; Chen, B.; Chow, W.S.; Tso, A.W.; et al. Angiopoietin-Like Protein 4 Decreases Blood Glucose and Improves Glucose Tolerance but Induces Hyperlipidemia and Hepatic Steatosis in Mice. Proc. Natl. Acad. Sci. USA 2005, 102, 6086–6091. [Google Scholar] [CrossRef] [Green Version]
  174. Wheatcroft, S.B.; Kearney, M.T. IGF-Dependent and IGF-Independent Actions of IGF-Binding Protein-1 and -2: Implications for Metabolic Homeostasis. Trends Endocrinol. Metab. 2009, 20, 153–162. [Google Scholar] [CrossRef]
  175. Carter, S.; Li, Z.; Lemieux, I.; Almeras, N.; Tremblay, A.; Bergeron, J.; Poirier, P.; Deshaies, Y.; Despres, J.P.; Picard, F. Circulating IGFBP-2 Levels are Incrementally Linked to Correlates of the Metabolic Syndrome and Independently Associated with VLDL Triglycerides. Atherosclerosis 2014, 237, 645–651. [Google Scholar] [CrossRef] [Green Version]
  176. Kammel, A.; Saussenthaler, S.; Jahnert, M.; Jonas, W.; Stirm, L.; Hoeflich, A.; Staiger, H.; Fritsche, A.; Haring, H.U.; Joost, H.G.; et al. Early Hypermethylation of Hepatic Igfbp2 Results in its Reduced Expression Preceding Fatty Liver in Mice. Hum. Mol. Genet. 2016, 25, 2588–2599. [Google Scholar]
  177. Wang, Y.; Liu, L.M.; Wei, L.; Ye, W.W.; Meng, X.Y.; Chen, F.; Xiao, Q.; Chen, J.Y.; Zhou, Y. Angiopoietin-Like Protein 4 Improves Glucose Tolerance and Insulin Resistance but Induces Liver Steatosis in High-Fat-Diet Mice. Mol. Med. Rep. 2016, 14, 3293–3300. [Google Scholar] [CrossRef] [PubMed] [Green Version]
  178. Liang, H.; Ward, W.F. PGC-1alpha: A Key Regulator of Energy Metabolism. Adv. Physiol. Educ. 2006, 30, 145–151. [Google Scholar] [CrossRef] [PubMed]
  179. Londhe, K.B.; Borlak, J. A Cross-Platform Comparison of Genome-Wide Expression Changes of Laser Microdissected Lung Tissue of C-Raf Transgenic Mice using 3’IVT and Exon Array. PLoS ONE 2012, 7, e40778. [Google Scholar] [CrossRef]
  180. Reimand, J.; Arak, T.; Vilo, J. G:Profiler--a Web Server for Functional Interpretation of Gene Lists (2011 Update). Nucleic Acids Res. 2011, 39, W307–W315. [Google Scholar] [CrossRef] [PubMed] [Green Version]
  181. Bindea, G.; Mlecnik, B.; Hackl, H.; Charoentong, P.; Tosolini, M.; Kirilovsky, A.; Fridman, W.H.; Pages, F.; Trajanoski, Z.; Galon, J. ClueGO: A Cytoscape Plug-in to Decipher Functionally Grouped Gene Ontology and Pathway Annotation Networks. Bioinformatics 2009, 25, 1091–1093. [Google Scholar] [CrossRef] [Green Version]
  182. Szklarczyk, D.; Franceschini, A.; Wyder, S.; Forslund, K.; Heller, D.; Huerta-Cepas, J.; Simonovic, M.; Roth, A.; Santos, A.; Tsafou, K.P.; et al. STRING v10: Protein-Protein Interaction Networks, Integrated Over the Tree of Life. Nucleic Acids Res. 2015, 43, D447–D452. [Google Scholar] [CrossRef] [PubMed]
  183. Rzhetsky, A.; Iossifov, I.; Koike, T.; Krauthammer, M.; Kra, P.; Morris, M.; Yu, H.; Duboue, P.A.; Weng, W.; Wilbur, W.J.; et al. GeneWays: A System for Extracting, Analyzing, Visualizing, and Integrating Molecular Pathway Data. J. Biomed. Inform. 2004, 37, 43–53. [Google Scholar] [CrossRef] [PubMed] [Green Version]
  184. Kel, A.; Reymann, S.; Matys, V.; Nettesheim, P.; Wingender, E.; Borlak, J. A Novel Computational Approach for the Prediction of Networked Transcription Factors of Aryl Hydrocarbon-Receptor-Regulated Genes. Mol. Pharmacol. 2004, 66, 1557–1572. [Google Scholar] [CrossRef] [PubMed] [Green Version]
  185. Kel, A.; Konovalova, T.; Waleev, T.; Cheremushkin, E.; Kel-Margoulis, O.; Wingender, E. Composite Module Analyst: A Fitness-Based Tool for Identification of Transcription Factor Binding Site Combinations. Bioinformatics 2006, 22, 1190–1197. [Google Scholar] [CrossRef] [Green Version]
  186. Stegmaier, P.; Voss, N.; Meier, T.; Kel, A.; Wingender, E.; Borlak, J. Advanced Computational Biology Methods Identify Molecular Switches for Malignancy in an EGF Mouse Model of Liver Cancer. PLoS ONE 2011, 6, e17738. [Google Scholar] [CrossRef] [Green Version]
  187. Helke, K. Pigs in Toxicology: Differences in Metabolism and Background Findings may be Breed Dependent. In Proceedings of the FDA Cellular, Tissue, and Gene Therapies Advisory Committee, 2022 Meeting Presentation, Online, 29–30 June 2022; pp. 1–95. [Google Scholar]
  188. Helke, K.L.; Nelson, K.N.; Sargeant, A.M.; Jacob, B.; McKeag, S.; Haruna, J.; Vemireddi, V.; Greeley, M.; Brocksmith, D.; Navratil, N.; et al. Pigs in Toxicology: Breed Differences in Metabolism and Background Findings. Toxicol Pathol. 2016, 44, 575–590. [Google Scholar] [CrossRef]
Figure 1. Liver HE and PAS staining of control and diclofenac-treated animals after daily dosing for 28 days. Panel AI–III: HE staining of three individual control animals with normal morphology of the liver. Panel BI–III: HE staining of three low-dose-treated animals highlighting degenerative cell changes and vacuolation of hepatocytes due to drug-induced steatosis. Note the eosinophilic hepatocytes and the sinusoidal dilatation (BI), the hydropic swelling of hepatocytes within an inflamed liver lobule (BII–III) and the hepatocyte regenerative activity (BI–III). Panel CI–III: HE staining of three high-dose-treated animals. The spectrum of morphological changes included a range of degenerative cell changes including shrunken hepatocytes, vacuolation (CI–II) and inflammatory cell infiltrates (CI). Depicted in the upper left quadrant of panel CIII is a fresh granuloma. A full description of the morphological changes is given in the main text. Panel DI–III: PAS staining of three individual control animals with abundant hepatic glycogen expression. Perivenous hepatocytes store less glycogen, which implies zonation of glycogen storage within the liver lobule. Panel EI–III: PAS staining of three low-dose-treated animals. Diclofenac treatment caused almost complete glycogen depletion. Additional findings included portal inflammation (EI), hepatic vacuolation (EII) and marked Kupffer cell infiltration (EIII). Panel FI–III: PAS staining of three high-dose-treated animals. Diclofenac treatment caused almost complete glycogen depletion. Other findings include portal inflammation with a partially destructed portal field (FI, lower right quadrant) and sinusoidal dilatation (FII–III).
Ijms 24 01445 g001
Figure 2. Silver and Elastica van Giesen stain of control and diclofenac-treated animals after daily dosing for 28 days. Panel AI–III: Silver staining of three individual control animals with normal morphology of the liver and no sign of enhanced extracellular matrix deposition. Panel BI–III: Silver staining of three low-dose-treated animals. Diclofenac treatment caused enhanced deposition of collagen and reticulin fibers around damaged liver lobules. Panel CI–III: Silver staining of three high-dose-treated animals. Diclofenac treatment caused defective wound repair with enhanced deposition of collagen and reticulin fibers around damaged liver lobules. Panel DI–III: EvG staining of three individual control animals with normal morphology of the liver and no sign of enhanced elastic and collagen fiber formation. Note the red staining of the collagen fibers of connective tissue around the blood vessel in a portal triad is normal (DI, III). Panel EI–III: EvG staining of three low-dose-treated animals. Diclofenac treatment caused enhanced collagen fiber deposition within harmed hepatocytes (EI) and at the rim of a liver lobule (EII). Once again, evidence for defective wound repair has been obtained, and the enhanced deposition of collagen fibers replaces damaged zone 3 hepatocytes around a central vein (EIII). Panel FI–III: EvG staining of three high-dose-treated animals. Diclofenac treatment caused enhanced collagen fiber deposition.
Ijms 24 01445 g002
Figure 3. Immunohistochemistry of carbamoyl-phosphate synthetase 1 (CPS1) and ELOVL fatty acid elongase 2 (ELOVL2) in liver sections of control and diclofenac-treated animals after daily dosing for 28 days. CPS is a key enzyme in the urea cycle and catalyzes the rate-limiting step in the detoxification of ammonia and ELOVL2 functions in lipid metabolism and PUFA elongation, thereby reducing the production of inflammatory lipids. Panel AI–III: CPS1 staining of three individual control animals. All hepatocytes express CPS1; however, some express the protein more abundantly. Panel BI–III: CPS1 staining of three low-dose-treated animals. Diclofenac treatment caused marked reduction in CPS1 expression. Panel CI–III: CPS1 staining of three high-dose-treated animals. Diclofenac treatment caused marked reduction in CPS1 expression. Panel DI–III: Minimal ELOVL2 cytosolic staining of three individual control animals. Panel EI–III: ELOVL2 staining of three low-dose-treated animals. Diclofenac treatment caused induction of ELOVL2 with a mosaic-like expression pattern among regenerating hepatocytes. Panel FI–III: ELOVL2 staining of three high-dose-treated animals. Diclofenac treatment caused marked expression of the protein.
Ijms 24 01445 g003
Figure 4. Immunohistochemistry of superoxide dismutase SOD1 and SOD2 in liver sections of control and diclofenac-treated animals after daily dosing for 28 days. Superoxide dismutase 1 and 2 are of critical importance in alleviating oxidative stress and reactive oxygen species. Panel AI–III: SOD1 staining of three individual control animals. Hepatocytes abundantly express this cytosolic localized enzyme. Panel BI–III: SOD1 staining of three low-dose-treated animals. Diclofenac treatment caused marked reduction in SOD1 expression. Shown in BI is a portal field with SOD1-positive Kupffer cell infiltrates. Panel CI–III: SOD1 staining of three high-dose-treated animals. Severely harmed hepatocytes fail to express SOD1. Panel DI–III: SOD2 staining of three individual control animals. Hepatocytes abundantly express this mitochondrial localized enzyme. Panel EI–III: SOD2 staining of three low-dose-treated animals. Diclofenac treatment caused marked reduction in SOD2 expression. Panel FI–III: SOD2 staining of three high-dose-treated animals. Diclofenac treatment caused marked reduction in SOD2 expression, and severely harmed hepatocytes do not express the protein.
Ijms 24 01445 g004
Figure 5. Immunohistochemistry of hypoxia inducible factor 1α (HIF1α) and myeloperoxidase (MPO) in liver sections of control and diclofenac-treated animals after daily dosing for 28 days. HIF1α is a transcription factor and of critical importance in regulating cell metabolism in conditions of hypoxia/ischemia, and MPO is an enzyme that catalyzes the production of diclofenac reactive metabolites which damage liver parenchyma. Panel AI–III: Liver sections of three individual control animals with no HIF1α expression. Panel BI–III: HIF1α staining of three low-dose-treated animals. Diclofenac treatment caused induced HIF1α expression, especially in activated/inflammatory macrophages (BI–II) and harmed hepatocytes (BIII). Panel CI–III: HIF1α staining of three high-dose-treated animals. Note the induced HIF1α expression in sinusoidal endothelium of an inflamed liver lobule (CI). The protein also “dresses” the monolayer of vacuoles/lipid droplets. HIF1α expression is variable with hypoxia damaged/pre-apoptotic hepatocytes expressing the protein abundantly (CII-CIII). Panel DI–III: None of the resident macrophages express MPO in the liver sections of three individual control animals. Panel EI–III: Depicted are the liver sections of three low-dose-treated animals. Panel EI shows a swarm of MPO-positive neutrophilic granulocytes; E2 exemplifies mixed inflammatory infiltrates of activated macrophages and neutrophils which abundantly express MPO, and EIII highlights infiltrating granulocytes and Kupffer cells in an inflamed portal field (EIII). Panel FI–III: Liver sections of three high-dose-treated animals. Depicted is the swarm-like migration of MPO-positive Kupffer cells at the rim of a necrosis (FI). Note the MPO-positive mixed intralobular (FII) and portal inflammatory infiltrates (FIII).
Ijms 24 01445 g005
Figure 6. Chloroacetate esterase (CAE) staining for neutrophils in liver sections of control and diclofenac-treated animals after daily dosing for 28 days. Panel AI–III: Liver sections of three individual control animals. There are no observable neutrophilic infiltrates. However, diclofenac treatment at the low- and high-doses caused marked infiltration by neutrophils. Panel BI–III: Liver sections of three low-dose-treated animals with intense staining of monocytes/macrophages in BI. Note the extended necrosis in BII with its monocytic infiltrates, and the diffusely red stained macrophages in a necrotic lesion (BIII). Panel CI–III: Liver sections of three high-dose-treated animals. Shown in panel CI is a swarm of mainly banded neutrophils in an inflamed liver lobule and a mixture of segmented neutrophils and macrophages in the widened sinusoids (CII). Depicted in panel CIII are portal inflammatory infiltrates consisting of banded and segmented neutrophils and macrophages.
Ijms 24 01445 g006
Figure 7. Differentially expressed genes after low- and high-dose diclofenac treatment. Panel A: Venn diagram of liver DEGs after low- (3 mg/kg/day) and high-dose (15 mg/kg/day) treatment. A total of 70 genes are regulated in common. Panel B: Venn diagram of kidney DEGs and a total of 144 and 286 genes were significantly regulated in low- and high-dose treatments, respectively, of which 66 were commonly regulated. Panel C: Shown is the average linkage hierarchical gene clustering of hepatic DEGs with Euclidean distance as default. The signal intensity values of regulated DEGs are depicted in the heat map. The low- and high-dose treatment groups are clearly separated from the controls. Panel D: Shown is the average linkage hierarchical gene clustering of kidney-related DEGs with Euclidean distance as default. The signal intensity values of regulated DEGs are depicted in the heatmap. The low- and high-dose treatment groups are clearly segregated from the controls.
Ijms 24 01445 g007
Figure 8. Gene ontology and pathway mapping network of liver-regulated genes in response to high-dose diclofenac treatment. The enriched biological processes and pathways of high-dose-treated animals were computed with the ClueGO and the GeneXplain software and visualized using the Cytoscape software version 3.9. Panel A: Stress and cell-death-associated gene network. Panel B: A network of genes enriched in circadian rhythm and metabolic processes. The red and green color nodes define induced and repressed transcript expression, respectively.
Ijms 24 01445 g008
Figure 9. Gene ontology and pathway mapping network of kidney-regulated genes in response to high-dose diclofenac treatment. The visualization of kidney-enriched pathway terms and biological processes of high-dose-treated animals were computed with the ClueGO and the GeneXplain software. Panel A: A network of genes involved in immune and inflammatory responses. Panel B: Cellular stress and apoptosis-regulated genes and their network. Panel C: Genes associated with circadian rhythm and metabolic processes. The red and green color nodes illustrate up- and down-regulated genes, respectively.
Ijms 24 01445 g009
Figure 10. Master regulatory gene networks in the liver of high-dose diclofenac-treated animals. Based on interaction information available in the GeneWays database, master regulatory gene networks were constructed and fused using the GeneXplain platform. The red, violet, green, white and yellow nodes represent genes coding for master regulators, up-, down-regulated DEGs, connecting genes and enriched transcription factors, respectively. Panel A: Master regulatory network of immune and inflammatory response genes. Panel B: Master regulatory network of cellular stress and apoptosis-regulated genes. Panel C: Master regulatory network of genes involved in metabolic processes.
Ijms 24 01445 g010
Figure 11. Master regulatory gene networks in the kidney of high-dose diclofenac-treated animals. Based on interaction information available in the GeneWays database, the master regulatory gene networks were constructed and fused using the GeneXplain platform. The red, violet, green, white and yellow nodes represent genes coding for master regulators, up-, down-regulated DEGs, connecting genes and enriched transcription factors, respectively. Panel A: Master regulatory network of immune and inflammatory response genes. Panel B: Master regulatory network of cellular stress and apoptosis-regulated genes. Panel C: Master regulatory network of genes involved in metabolic processes.
Ijms 24 01445 g011
Figure 12. Liver clock regulatory gene network in response to diclofenac treatment. Drug treatment resulted in perturbed liver clock activity. Shown are composite modules of circadian transcriptional regulators at promoters of hepatic DEGs coding for immune response, inflammation, metabolism, cell cycle arrest and DNA damage. Genes marked as red are significantly up-regulated; those given in green are repressed in expression. SCN = suprachiasmatic nucleus, ACTH = adrenocorticotropic hormone, GC = glucocorticoids, HPA axis = hypothalamic pituitary adrenal axis.
Ijms 24 01445 g012
Figure 13. Liver clock and glucocorticoid receptor co-regulated genes in response to diclofenac treatment. Shown are composite modules of circadian transcriptional regulators and the glucocorticoid receptor at the gene-specific promoters of hepatic DEGs coding for immune response, inflammation, metabolism, cell cycle arrest and DNA damage. Genes marked as red are significantly up-regulated; those given in green are repressed in expression.
Ijms 24 01445 g013
Figure 14. Glucocorticoid receptor targeted genes in response to diclofenac treatment. The glucocorticoid receptor can influence gene expression either through direct or indirect mechanisms. The direct, tethering and/or composite model of GR activity as originally proposed by Oakley and Cidlowski (50) was employed; 1a = direct activation, 1b = direct repression, 2a = tethering model, 3a = indirect or transactivation composite model, 3b = indirect or transrepression composite model.
Ijms 24 01445 g014
Figure 15. Immunohistochemistry of the liver clock components Per2 and CRY1 in liver sections of control and diclofenac-treated animals after daily dosing for 28 days. A complex relationship exists between the circadian clock and inflammation. Panel AI–III: Liver sections of three individual control animals: Disseminated throughout the liver lobule are Per2-positive macrophages. Panel BI–III: Diclofenac low-dose treatment caused a marked increase in activated Per2-positive macrophages. Some hepatocytes and sinusoidal endothelium also stained positive. Panel CI–III: High-dose diclofenac treatment. Hepatocytes of an inflamed liver lobule abundantly express Per2 (CIII). Panel DI–III: Liver sections of three individual control animals. In one control (DI) bile duct epithelium appeared slightly positive; none of the controls expressed the protein (DI–III). Panel EI–III: Diclofenac low-dose treatment. Shown in panel EI is the liver section of a low-dose-treated animal with marked CRY1-positive macrophage infiltrates within an inflamed hepatic lobule. Conversely, EIII illustrates marked portal histiocytic infiltrates of monocytes and macrophages; however, none express CRY1, while panel F1 documents CRY-positive histiocytic infiltrates forming a granuloma adjacent to the central vein of an inflamed liver lobule. Panel FI–III: High-dose diclofenac treatment. We observed a clear dose-related increase in CRY1 expression.
Ijms 24 01445 g015
Figure 16. Immunohistochemistry of the liver clock components CLOCK and CYP1A1 in liver sections of control and diclofenac-treated animals after daily dosing for 28 days. CLOCK is a transcription factor and, together with BMAL1, forms a heterodimer and binds to E-Box in the promoter of Per1/2 and Cry1/2 to augment their expression. Furthermore, the aryl hydrocarbon receptor (AhR) senses exposure to foreign chemicals, including drugs, and forms functional complexes with the bHLH PAS domain protein ARNT to control the expression of genes coding for xenobiotic defense, such as CYP1A1 and CYP1B1. Panel AI–III: Liver sections of three individual control animals: Except for panel AIII, where a few hepatocytes and very rarely macrophages stained positive, none of the controls expressed the CLOCK protein. Panel BI–III: Diclofenac low-dose treatment caused marked cytosolic and nuclear CLOCK expression. Depicted in BIII is an inflamed hepatic lobule with marked CLOCK-positive macrophage and monocytic infiltrates. Panel CI–III: High-dose diclofenac treatment. Most macrophages stained positive for CLOCK (CI–II), and its expression did not apparently follow the zonation of hepatocytes (CIII). Panel DI–III: Liver sections of three individual controls. Note the slight to moderate cytosolic staining of hepatocytes, even though individual hepatocytes displayed marked expression of this protein (DIII). The sinusoids are demarcated by positive CYP1A1 staining. Very rarely, resident Kupffer cells expressed CYP1A1. Panel EI–III: Diclofenac low-dose treatment. Depicted in panel EII–III is a mosaic-like expression pattern of hepatocytes with obvious expression of the CYP1A1 protein and marked CYP1A1 endothelial expression in a portal triad (EIII). Within inflamed lobules, hepatocytes expressed less CYP1A1 (EI&EIII). Panel FI–III: High-dose diclofenac treatment. We did not observe dose-related changes in CYP1A1 expression, and inflamed lobules expressed less CYP1A1 (FI–III). Notwithstanding, the number of CYP1A1-positive macrophages significantly increased (FIII).
Ijms 24 01445 g016
Figure 17. Immunohistochemistry of corticosteroid binding globulin and the glucocorticoid receptor in liver sections of control and diclofenac-treated animals after daily dosing for 28 days. In the circulation, cortisol is primarily transported by the corticosteroid binding globulin (CBG), and this protein is mainly synthesized in the liver. Only free cortisol binds to the glucocorticoid receptor (GR) and diffuses across the cell membrane and binds to the GR. Panel AI–III: Liver sections of three individual control animals. We observed slight to moderate cytosolic and nuclear staining of CBG. Panel BI–III: Diclofenac low-dose treatment caused marked increases in CBG, with a dust-like appearance in the sinusoids of treated animals. Additionally, BIII exemplifies the mosaic-like CBG expression pattern with harmed hepatocytes less capable of its synthesis. Panel CI–III: High-dose diclofenac treatment. Hepatocytic CBG expression was significantly reduced; this results in increased pool size of unbound/free and, therefore, biologically active cortisol. The high-dose regimen harmed hepatocytes severely and some failed to synthesize CBG (CI–II). Note the CBG-positive macrophages (CIII), which suggests CBG directly interacts with the glucocorticoid receptor of sinusoidal macrophages to dampen their pro-inflammatory activity. Panel DI–III: Liver sections of three individual control animals. We noted a faint cytosolic and, in part, sinusoidal expression of GR. Panel EI–III: Diclofenac low-dose treatment caused marked increases in cytosolic GR expression, which was independent of the dose (panels E,F). We did not observe nuclear GR staining, as exemplified in an HPV of a low-dose-treated animal (EIII). Panel FI–III: High-dose diclofenac treatment. We did not observe dose-related changes in GR expression, which implies the lower dose to elicit a maximum response.
Ijms 24 01445 g017
Figure 18. Immunohistochemistry of the corticotropin-releasing hormone receptor in liver sections of control and diclofenac-treated animals after daily dosing for 28 days. For its important role in stress signaling, we investigated hepatic expression of CRF1, which is the receptor of the corticotropin-releasing factor (CRF), and the CRF neuropeptide plays an important role in liver pathology. Panel AI–III: Liver sections of three individual control animals. We observed faint sinusoidal and, very rarely, CRF-positive macrophages. Panel BI–III: Diclofenac low-dose treatment. CRF1 activation of macrophages promotes their M1 polarization, and we observed marked increases in CRF-positive macrophages in low (BI)-treated animals. Furthermore, vascular endothelial cells stained positive (BI, CII), and we observed cytosolic expression of the receptor among liver cells of inflamed liver lobules (BII–III, CII). However, not all cells expressed the CRF receptor, and we speculate regenerating hepatocytes to express CRF1 more abundantly to support anti-inflammatory and anti-apoptotic reactions. Panel CI–III: Diclofenac high-dose treatment. Marked increase in CRF-positive macrophages (CI, CIII) with induced cytosolic expression of the receptor among liver cells of inflamed liver lobules (CII). Sinusoidal endothelial cells stain positive (CII).
Ijms 24 01445 g018
Figure 19. Experimental validation of master regulators by quantitative real-time PCR. Panel A: Expression of hepatic master regulator genes after low- and high-dose diclofenac treatment. Panel B: Expression of master regulatory genes in kidney after low- and high-dose diclofenac treatment. The y-axis indicates the individual fold changes in treated animals (diclofenac-treated vs. controls). Data are Fold change ± SD. ** p < 0.01. MR = master regulator, LD = low-dose, HD = high-dose.
Ijms 24 01445 g019
Figure 20. Experimental validation of highly regulated genes in liver and kidney in response to diclofenac treatment. Panel A1,A2: Liver-regulated genes in response to low- and high-dose diclofenac treatments. Panel B: Highly regulated genes in the kidney. The y-axis indicates the individual fold changes in treated animals (diclofenac-treated vs. controls). Fold changes obtained from high-dose treatments are marked in red color. Data are Fold change ± SD. * p < 0.05, *** p < 0.001. LD = low-dose, HD = high-dose.
Ijms 24 01445 g020
Table 1. Commonly regulated hepatic DEGs after low- and high-dose diclofenac treatment. Minipigs were given 3mg/kg or 15 mg/kg daily for 28 days. Whole genome expression profiling was performed and DEGs were calculated based on the criteria fold change > 1.5 and a p-value < 0.05. Collectively, 70 genes were regulated in common when low- and high-dose treatment groups were compared.
Gene SymbolGene DescriptionFold Change (Average) ± SD
LD_LiverHD_Liver
Immune and inflammatory response
ATG12Autophagy related 121.48 ± 0.21.53 ± 0.15
BLNKB-cell linker−1.57 ± 0.08−1.74 ± 0.48
CXCL2C-X-C motif chemokine ligand 24.33 ± 1.262.56 ± 1.05
GBP1Guanylate binding protein 1−1.65 ± 0.65−2.55 ± 0.54
HSP90AA1Heat shock protein 90 alpha family class A member 11.58 ± 0.22.01 ± 0.3
HSPA5Heat shock protein family A (Hsp70) member 51.54 ± 0.271.81 ± 0.65
IFIT1Interferon induced protein with tetratricopeptide repeats 1−1.75 ± 0.07−2.03 ± 0.56
IL10RBInterleukin 10 receptor, beta1.9 ± 0.062.6 ± 0.28
IRG6Inflammatory response protein 6−1.82 ± 0.84−3.24 ± 1.23
LYZLysozyme2.78 ± 1.935.89 ± 1.04
MAPK14Mitogen-activated protein kinase 141.51 ± 0.271.53 ± 0.08
MAPK6Mitogen-activated protein kinase 61.52 ± 0.302.17 ± 0.5
PRKD1Protein kinase D1−2.04 ± 1.13−2.52 ± 0.42
SPP1Secreted phosphoprotein 1−1.53 ± 0.13−1.58 ± 0.67
THY1Thy-1 cell surface antigen−1.68 ± 0.27−1.54 ± 0.38
Response to oxidative stress
NUDT15Nudix hydrolase 151.53 ± 0.251.62 ± 0.11
SOD2Superoxide dismutase 2, mitochondrial2.22 ± 0.91.91 ± 0.53
Response to stress
PLLPPlasmolipin1.62 ± 0.481.7 ± 0.41
PTPLAD1Protein tyrosine phosphatase-like A domain containing 1−1.78 ± 0.19−1.87 ± 0.14
RBM3RNA binding motif (RNP1, RRM) protein 3−1.51 ± 0.15−1.93 ± 0.12
SPRSepiapterin reductase−1.61 ± 0.49−1.67 ± 0.38
STC1Stanniocalcin 11.54 ± 0.31.58 ± 0.35
Cell death and apoptosis
DNPH12’-deoxynucleoside 5’-phosphate N-hydrolase 1−1.52 ± 0.48−1.57 ± 0.15
FYNFYN Proto-Oncogene, Src Family Tyrosine Kinase−1.52 ± 0.21−1.56 ± 0.24
GAS1Growth Arrest Specific 1−1.53 ± 0.22−1.52 ± 0.32
HSPH1Heat shock protein family H (Hsp110) member 11.74 ± 0.41.77 ± 0.48
KLF11Kruppel like factor 11−1.77 ± 0.64−1.88 ± 0.38
VIL1Villin 1−1.89 ± 0.35−1.79 ± 0.58
Circadian rhythm
ARNTL/BMAL1Aryl hydrocarbon receptor nuclear translocator-like2.07 ± 0.462.69 ± 0.1
CRY1Cryptochrome 14.13 ± 1.234.28 ± 0.51
DBPD-box binding PAR bZIP transcription factor−1.83 ± 0.35−2.41 ± 0.65
NR1D2/ REVERBBNuclear receptor subfamily 1, group D, member 2−2.79 ± 0.38−5.25 ± 1.01
Drug metabolism
CYP3A39Cytochrome P450 3A39−6.52 ± 2.58−6.78 ± 1.82
CYP3A46Cytochrome P450 3A46−1.95 ± 1.42−1.9 ± 0.34
NR1I3 (CAR)Nuclear Receptor Subfamily 1 Group I Member 31.42 ± 0.251.77 ± 0.1
Cell cycle
CENPFCentromere protein F−1.59 ± 0.2−1.51 ± 0.28
FOXA1Forkhead box A11.6 ± 0.551.79 ± 0.37
TOP2ATopoisomersae II−1.62 ± 0.49−1.77 ± 0.33
USP2Ubiquitin specific peptidase 2−2.08 ± 2.26−1.91 ± 0.42
Lipid metabolism
ACSL3Acyl-CoA synthetase long-chain family member 3−1.52 ± 0.83−1.66 ± 0.58
DDHD1DDHD domain containing 11.5 ± 0.381.73 ± 0.27
ECHDC3Enoyl-CoA hydratase domain containing 3−1.44 ± 0.31−1.58 ± 0.42
ELOVL2ELOVL fatty acid elongase 22.66 ± 0.93.53 ± 0.59
FASNFatty Acid Synthase−1.61 ± 0.22−2.12 ± 0.54
FNDC3BFibronectin type III domain containing 3B1.42 ± 0.22.09 ± 0.33
KRT8Keratin 81.9 ± 0.382.6 ± 0.28
KRT18Keratin 181.74 ± 0.621.67 ± 0.25
LPPR4Lipid phosphate phosphatase-related protein type 4−2.04 ± 0.41−2.38 ± 0.79
PLIN2Perilipin 23.01 ± 1.394.7 ± 1.15
PLP1Proteolipid protein 1−2.4 ± 1.2−5.01 ± 1.01
PPARGC1APeroxisome proliferator activated receptor gamma, coactivator 1 alpha−1.63 ± 0.28−2.11 ± 0.46
SERPINA6Serpin peptidase inhibitor, clade A, member 6−1.6 ± 0.57−1.54 ± 0.33
SERPINE1Serpin family E member 11.87 ± 0.951.58 ± 0.04
ST3GAL1ST3 beta-galactoside alpha-2,3-sialyltransferase 11.53 ± 0.271.68 ± 0.27
VLDLRVery low density lipoprotein receptor−1.53 ± 0.211.98 ± 0.15
Glucose metabolic process
ENO4Enolase family member 4−1.9 ± 1.02−2.40 ± 0.40
Collagen biosynthesis
COL5A3Collagen type V alpha 3 chain1.58 ± 0.111.74 ± 0.12
Transmembrane transport
ATP6V1HATPase H+ transporting V1 subunit H−1.51 ± 0.26−1.44 ± 0.24
ATP9AATPase phospholipid transporting 9A2.52 ± 0.241.6 ± 0.59
ODCOrnithine decarboxylase1.47 ± 0.242.13 ± 0.54
P2Y12RPurinergic receptor P2Y12−1.71 ± 0.61−1.61 ± 0.35
SLC11A2Solute carrier family 11, member 21.68 ± 0.331.97 ± 0.4
SLC1A1Solute carrier family 1 member 11.53 ± 0.231.72 ± 0.31
SLC30A10Solute carrier family 30, member 102.08 ± 0.682.21 ± 0.45
TMEM9Transmembrane protein 9−1.56 ± 0.12−1.45 ± 0.35
Signal transduction
ARHGAP1Rho GTPase activating protein 11.62 ± 0.121.7 ± 0.17
CLDN11Claudin 11−1.72 ± 0.49−1.94 ± 0.24
Transcriptional regulation
RNPC3RNA-binding region (RNP1, RRM) containing 31.57 ± 0.31.59 ± 0.35
ZNF12Zinc finger protein 12−1.62 ± 0.34−1.87 ± 0.41
ZNF280DZinc finger protein 280D1.61 ± 0.211.88 ± 0.4
Table 2. Commonly regulated genes in kidney after low- and high-dose diclofenac treatment. A total of 66 statistically significant DEGs were regulated in common amongst low- and high-dose diclofenac treatments.
Gene SymbolGene DescriptionFold Change (Average) ± SD
LD_KidneyHD_Kidney
Immune and inflammatory response
C1QAComplement C1q A chain2.33 ± 1.621.51 ± 0.2
C1QCComplement C1q C chain2.31 ± 1.611.64 ± 0.25
CCL28Chemokine (C-C motif) ligand 281.52 ± 0.211.58 ± 0.12
CFBComplement Factor B6.55 ± 2.452.82 ± 0.34
CFHComplement Factor H2.86 ± 2.251.91 ± 0.38
CXXC1CXXC finger protein 1−1.59 ± 0.17−1.55 ± 0.06
HSP90B1Heat shock protein 90kDa beta, member 1−1.6 ± 0.4−1.64 ± 0.12
IFITM2Interferon induced transmembrane protein 21.66 ± 0.431.57 ± 0.15
IL10RBInterleukin 10 receptor, beta1.51 ± 0.281.93 ± 0.11
IRG6 (RSAD2)Inflammatory response protein 6−1.99 ± 0.17−2.75 ± 0.59
KIF3AKinesin family member 3A−1.56 ± 0.1−1.63 ± 0.11
KNG1Kininogen 1−1.96 ± 1−2.13 ± 0.14
PTGR1Prostaglandin reductase 13.4 ± 2.613.13 ± 1.91
SAA2Serum amyloid A22.12 ± 1.371.54 ± 0.13
USP18Ubiquitin specific peptidase 18−1.52 ± 0.08−1.68 ± 0.47
VCAM1Vascular cell adhesion molecule 11.87 ± 1.11.57 ± 0.63
Response to stress
AK3L1Adenylate kinase 3-like 1−1.58 ± 0.15−1.79 ± 0.1
CHD2Chromodomain helicase DNA binding protein 2−1.53 ± 0.22−2.13 ± 0.28
COL3A1Collagen, type III, alpha 11.57 ± 0.881.51 ± 0.17
GSTA1Glutathione S-transferase alpha 13.23 ± 1.404.6 ± 1.27
LRP11Low density lipoprotein receptor-related protein 111.55 ± 0.111.56 ± 0.32
RAD50RAD50 homolog−1.58 ± 0.03−1.79 ± 0.33
TCEA1Transcription elongation factor A (SII), 1−1.61 ± 0.21−1.71 ± 0.1
UBXN4UBX domain protein 4−1.52 ± 0.31−1.92 ± 0.24
UPF3BUPF3 regulator of nonsense transcripts Homolog B−1.73 ± 0.3−1.51 ± 0.15
ZCCHC11Zinc finger, CCHC domain containing 11−1.56 ± 0.19−1.55 ± 0.09
Cell death and apoptosis
CRYABCrystallin, alpha B2.02 ± 0.432.1 ± 0.63
DAB2Dab, mitogen-responsive Phosphoprotein, homolog 2−1.63 ± 0.08−1.62 ± 0.21
DSG2Desmoglein 21.55 ± 0.32.12 ± 0.62
IGFBP3Insulin-like growth factor binding protein 3−1.83 ± 0.98−2.47 ± 0.7
PDPK13-phosphoinositide dependent protein kinase 1−1.55 ± 0.06−1.74 ± 0.06
PPTC7PTC7 protein phosphatase homolog−1.49 ± 0.51−2.31 ± 0.77
SCAF11SR-related CTD-associated factor 11−1.67 ± 0.36−2.1 ± 0.49
UCP2Uncoupling protein 2 (mitochondrial, proton carrier)1.59 ± 0.221.78 ± 0.36
Cell cycle process
SEPT7Septin 7−1.52 ± 0.21−1.63 ± 0.21
CDC5LCell division cycle 5-like−1.53 ± 0.12−1.77 ± 0.18
PRIM2Primase, DNA, polypeptide 2−1.64 ± 0.22−1.55 ± 0.12
Circadian rhythmic process
CCND2Cyclin D2−1.56 ± 0.18−1.7 ± 0.06
CRY1Cryptochrome circadian clock 11.62 ± 0.321.82 ± 0.53
NR1D2/REVERBBNuclear receptor subfamily 1, group D, member 2−1.99 ± 0.56−1.99 ± 0.77
PER2Period circadian clock 2−1.56 ± 0.32−1.85 ± 0.29
Lipid metabolism
FADS6Fatty acid desaturase domain family, member 61.56 ± 0.311.87 ± 0.29
KRT8keratin 81.51 ± 0.281.93 ± 0.11
LDLRLow density lipoprotein receptor1.52 ± 0.21.51 ± 0.1
SIRT1Sirtuin 1−1.51 ± 0.21−1.52 ± 0.38
Protein metabolism
ARSJArylsulfatase family, member J1.53 ± 0.021.75 ± 0.29
RBM3RNA binding motif (RNP1, RRM) protein 3−1.52 ± 0.27−2.56 ± 0.55
TET2Tet methylcytosine dioxygenase 2−1.67 ± 0.04−1.83 ± 0.18
TTLTubulin tyrosine ligase1.84 ± 0.191.89 ± 0.36
Collagen biosynthesis
COL16A1Collagen Type XVI alpha 11.55 ± 0.351.94 ± 0.12
COL21A1Collagen, type XXI, alpha 1−1.51 ± 0.37−2.09 ± 0.41
Signal transduction
ARHGAP29Rho GTPase activating protein 29−1.81 ± 0.17−1.94 ± 0.28
GPNMBGlycoprotein (transmembrane) nmb2.48 ± 0.392.47 ± 0.85
S100A6S100 Calcium Binding Protein A62.49 ± 1.831.74 ± 0.29
Transmembrane and ion-channel transport
FXYD4FXYD Domain Containing Ion Transport Regulator 41.61 ± 0.341.62 ± 0.12
GAPVD1GTPase activating protein and VPS9 domains 1−1.55 ± 0.05−1.89 ± 0.3
SLC25A25Solute carrier family 25 (mitochondrial; phosphate carrier), member 251.68 ± 0.272.19 ± 0.57
SLC4A4Solute carrier family 4 (sodium bicarbonate cotransporter), member 4−2.34 ± 0.16−2.33 ± 0.42
TMEM87ATransmembrane protein 87A−1.54 ± 0.1−1.53 ± 0.14
Transcriptional regulation
DDX6DEAD box helicase 6−1.52 ± 0.21−1.76 ± 0.12
GTF2IRD2GTF2I repeat domain containing 2−1.5 ± 0.41−1.77 ± 0.29
HNRNPRHeterogeneous nuclear ribonucleoprotein R−1.55 ± 0.41−1.82 ± 0.14
METTL12Methyltransferase like 121.51 ± 0.211.61 ± 0.22
NOL8Nucleolar protein 8−1.54 ± 0.08−1.65 ± 0.14
ZNF12Zinc finger protein 12−1.81 ± 0.25−1.94 ± 0.21
Vascular smooth muscle contraction
CALD1Caldesmon 1−1.94 ± 0.4−2.55 ± 0.37
Table 3. Gene ontology enrichment of hepatic DEGs after diclofenac treatment. Gene ontologies were analyzed with the GeneXplain and ClueGO database; significantly enriched biological processes were considered at a p-value < 0.05. The percentage of genes associated with a given biological term and specific pathway were calculated with the AmiGO 2 database (http://amigo.geneontology.org/amigo/landing, accessed on 4 January 2023) and KEGG repository data entries.
GO ID.Biological ProcessLow-DoseHigh-Dose
No of Genes
(% Genes Associated
with Terms)
p-ValueAdjusted p-ValueNo of Genes
(% Genes Associated
with Terms)
p-ValueAdjusted
p-Value
GO:0006955Immune response13 (0.59%)0.02980.0015042 (1.90%)9.47 × 10−40.0153
GO:0006954Inflammatory response9 (1.17%)0.00100.0457013(1.69%)0.01010.0428
GO:0006950Response to stress41 (1.06%)9.30 × 10−110.0263091 (2.36%)4.58 × 10−40.0129
GO:0033554Cellular response to stress17 (0.90%)1.16 × 10−70.0000044 (2.34%)0.00150.0241
GO:0001666Response to hypoxia9 (2.98%)1.51 × 10−40.0000014 (4.64%)0.00940.0502
GO:0055114Oxidation-reduction process10 (0.91%)0.01150.0011037 (3.39%)5.05 × 10−40.0136
GO:0006979Response to oxidative stress4 (1.14%)1.12 × 10−40.0251014 (3.28%)6.07 × 10−40.0144
GO:0071345Cellular response to cytokine stimulus9 (0.88%)0.00120.0090125 (2.46%)7.62 × 10−50.0033
GO:0019221Cytokine-mediated signaling pathwayNo enrichment 18 (2.50%)0.00990.0496
GO:0060333IFNG-mediated signaling pathwayNo enrichment 7 (7.78%)0.03250.0116
GO:0002694Regulation of leukocyte activation7 (1.25%)0.00300.0050019 (3.40%)0.01230.0497
GO:0050900Leukocyte migration4 (0.84%)0.00150.0097010 (2.09%)0.03390.1196
GO:0000165MAPK cascade5 (0.56%)0.00130.0058010 (1.12%)0.04660.1400
GO:0007623Circadian rhythm6 (3.08%)0.00280.0442012 (6.15%)0.00210.0292
GO:0007049Cell cycle6 (0.34%)4.49 × 10−40.0419022 (1.25%)0.03300.1173
GO:0008219Cell death and apoptosis20 (0.92%)0.00850.0025049 (2.25%)0.00540.0440
GO:0097190Apoptotic signaling pathway7 (1.20%)7.45 × 10−70.0203014 (2.41%)0.03650.0143
GO:0006952Defense response14 (0.85%)2.93 × 10−60.0000146 (2.79%)1.81 × 10−40.0053
GO:0001525Angiogenesis8 (1.69%)0.03420.0001014 (2.97%)0.00580.0459
GO:0006805Xenobiotic metabolic process4 (3.22%)0.00110.017409 (7.26%)0.01570.0438
GO:0006629Lipid metabolic processNo enrichment 44 (3.12%)2.23 × 10−40.0083
GO:0006631Fatty acid metabolic process6 (1.66%)0.01180.0046014 (3.87%)0.02840.1085
GO:0006006Glucose metabolic process4 (1.98%)0.00830.025409 (4.46%)2.58 × 10−40.0069
GO:0034762Transmembrane transport regulation12 (2.30%)0.039640.0426018 (3.45%)0.01050.0717
hsa0415PI3K-AKT signaling pathway5 (1.41%)0.01410.0307611 (3.11%)0.00560.0003
hsa03320PPAR signaling pathwayNo enrichment 7 (9.46%)0.00990.0129
Table 4. Gene ontology enrichment of kidney-related DEGs after diclofenac treatment. Gene ontologies were analyzed with the GeneXplain and ClueGO databases; significantly enriched biological processes were considered at a p-value < 0.05. The percentage of genes associated with biological terms and pathways were calculated with the AmiGO 2 database (http://amigo.geneontology.org/amigo/landing, accessed on 4 January 2023) and KEGG repository data entries.
GO IDBiological ProcessLow-DoseHigh-Dose
No of Genes (% Genes Associated with Terms)p-ValueAdjusted p-ValueNo of Genes (% Genes Associated with Terms)p-ValueAdjusted p-Value
GO:0007623Circadian rhythm7 (3.60%)0.00160.043913 (6.67%)3.97 × 10−50.0028
GO:0006955Immune response11 (0.54%)0.02270.090227 (1.28%)0.00210.0417
GO:0045087Innate immune responseNo enrichment 17 (1.86%)4.73 × 10−20.0194
GO:0006954Inflammatory response9 (1.17%)0.00220.026117 (2.21%)6.59 × 10−68.14 × 10−4
GO:0006950Response to stress35 (0.91%)3.09 × 10−63.09 × 10−469 (1.79%)5.79 × 10−82.68 × 10−5
GO:0001666Response to hypoxia16 (5.30%)1.47 × 10−99.49 × 10−7No enrichment
GO:0055114Oxidation-reduction process13 (1.19%)0.04570.126922 (2.01%)0.03220.0462
GO:0000302Response to reactive oxygen species8 (3.79%)2.76 × 10−40.00657 (3.32%)0.03720.1728
GO:0006956Complement activation5 (2.65%)9.47 × 10−50.00328 (4.23%)1.67 × 10−74.69 × 10−5
GO:0071345Cellular response to cytokine stimulus8 (0.79%)1.10 × 10−40.003415 (1.48%)0.02500.0204
GO:0019221Cytokine-mediated signaling pathwayNo enrichment 11 (1.53%)0.01170.0998
GO:0050900Leukocyte migrationNo enrichment 7 (1.46%)0.02580.0446
GO:0032496Response to lipopolysaccharideNo enrichment 11 (3.45%)0.02730.0478
GO:0008219Cell death and apoptosis13 (0.60%)0.03070.043727 (1.24%)0.01350.0148
GO:0009611Response to woundingNo enrichment 17 (2.68%)1.06 × 10−40.0054
GO:0006952Defense response23 (1.39%)3.13 × 10−40.007136 (2.18%)5.73 × 10−67.59 × 10−4
GO:0006631Fatty acid metabolic processNo enrichment 9 (2.49%)0.02980.0453
hsa0415PI3K-AKT signaling pathway5 (1.41%)0.00963.08 × 10−65 (1.41%)0.03660.0389
Table 5. Differentially expressed genes targeted by the glucocorticoid receptor (GR) in the liver. The target genes of GR were retrieved from TransFac, Harmonizome, GeneGlobe and TRRUST databases and compared to the DEGs of the liver. A total of 64 hepatic DEGs are considered bona fide targets of GR and are compiled based on their biological functions. * Differentially expressed genes (Foldchange > ±1.5, p-value < 0.05 and FDR < 0.05).
Gene SymbolGene DescriptionFold Change ± SD
LD_LiverHD_LiverLD_KidneyHD_Kidney
Circadian rhythm
ARNTL/BMAL1Aryl hydrocarbon receptor nuclear translocator like2.07 ± 0.46 *2.69 ± 0.1 *1.48 ± 0.351.9 ± 0.24 *
BHLHE41Basic helix-loop-helix family member e41−1.52 ± 0.29 *−2.41 ± 0.32 *−1.1 ± 0.2−1.51 ± 0.09
CRY1Cryptochrome 14.13 ± 1.23 *4.28 ± 0.51 *1.62 ± 0.32 *1.82 ± 0.53 *
DBPD-box binding PAR bZIP transcription factor−1.83 ± 0.35 *−2.41 ± 0.65 *−1.38 ± 0.33−1.55 ± 0.08 *
NPAS2Neuronal PAS domain protein 21.3 ± 0.22.46 ± 0.51 *1.15 ± 0.211.47 ± 0.18
NR1D2/REVERBbetaNuclear receptor subfamily 1 group D member 2−2.79 ± 0.77 *−5.25 ± 1.01 *−1.99 ± 0.56 *−1.99 ± 0.77 *
PER2Period circadian clock 2−1.38 ± 0.69−2.6 ± 1.36 *−1.56 ± 0.32 *−1.85 ± 0.29 *
RORCRAR related orphan receptor C1.76 ± 0.26 *1.41 ± 0.08−1.02 ± 0.111.01 ± 0.05
Immune and inflammatory response
BIRC3Baculoviral IAP repeat containing 31.52 ± 0.26 *1.64 ± 0.23 *1.03 ± 0.111.16 ± 0.09
CD27CD27 molecule−1.41 ± 0.15−1.53 ± 0.15 *1.23 ± 0.091.04 ± 0.03
CSF2RBColony stimulating factor 2 receptor beta1.51 ± 0.92 *1.51 ± 0.11 *1.25 ± 0.531.07 ± 0.17
DDX58DExD/H-box helicase 58−1.06 ± 0.17−1.57 ± 0.07 *−1.13 ± 0.19−1.27 ± 0.16
IL5Interleukin 5−1.1 ± 0.25−1.52 ± 0.15 *−1.04 ± 0.05−1.04 ± 0.07
LYZLysozyme2.78 ± 1.93 *5.89 ± 1.04 *5.31 ± 5.173.27 ± 0.93 *
MAPKAPK3Mitogen-activated protein kinase-activated protein kinase 31.16 ± 0.231.55 ± 0.11 *1.08 ± 0.161.08 ± 0.07
PDE4BPhosphodiesterase 4B1.32 ± 0.411.59 ± 0.07 *−1.1 ± 0.081.31 ± 0.22
Drug metabolic process
CYP1A1Cytochrome P450 family 1 subfamily A member 14.86 ± 3.712.66 ± 2.8317.05 ± 25.151.75 ± 0.72 *
CYP2C19Cytochrome P450 family 2 subfamily C member 19−1.59 ± 0.2 *−1.51 ± 0.28 *−1.14 ± 0.151.04 ± 0.03
CYP2C42 (CYP2C9)Cytochrome P450 family 2 subfamily C member 9−1.67 ± 1.11−2.05 ± 0.27 *1.01 ± 0.011.54 ± 1.01
CYP3A29 (CYP3A4)Cytochrome P450 family 3 subfamily A member 4−1.24 ± 0.12−1.57 ± 0.28 *−1.27 ± 0.14−1.62 ± 0.67
Cellular response to stress
ANGPTL4Angiopoietin like 4−1.58 ± 0.85 *−1.54 ± 0.29 *−1.32 ± 0.13−1.01 ± 0.04
CALUCalumenin1.18 ± 0.191.55 ± 0.25 *1.01 ± 0.151.02 ± 0.09
HSP90AA1Heat shock protein 90 alpha family class A member 11.58 ± 0.2 *2.01 ± 0.3 *−1.25 ± 0.17−1.15 ± 0.24
MAOBMonoamine oxidase B−1.32 ± 0.3−1.86 ± 0.22 *−1.04 ± 0.11.05 ± 0.07
MAT1AMethionine adenosyltransferase 1A−1.06 ± 0.24−1.53 ± 0.22 *−1.14 ± 0.19−1.04 ± 0.02
Oxidation-reduction process
ALOX5APArachidonate 5-lipoxygenase activating protein1.33 ± 0.361.87 ± 0.31 *1.8 ± 1.241.41 ± 0.26
APOA2Apolipoprotein A2−1.31 ± 0.13−1.57 ± 0.07 *−1.03 ± 0.1−1.07 ± 0.05
CREG1Cellular repressor of E1A stimulated genes 1−1.11 ± 0.1−1.57 ± 0.17 *1.07 ± 0.151.05 ± 0.04
DAOD-amino acid oxidase1 ± 0.99−2 ± 0.93 *−1.09 ± 0.19−1.36 ± 0.06
GRHPRGlyoxylate and hydroxypyruvate reductase−1.26 ± 0.46−1.61 ± 0.18 *−1.13 ± 0.05−1.1 ± 0.08
PAMPeptidylglycine alpha-amidating monooxygenase−1.18 ± 0.19−1.5 ± 0.29 *1.19 ± 0.16−1.07 ± 0.19
Interferon-gamma-mediated signaling pathway
B2MBeta-2-microglobulin−1.21 ± 0.25−1.53 ± 0.34 *−1.03 ± 0.07−1.03 ± 0.03
MT2AMetallothionein 2A1.26 ± 0.381.65 ± 0.37 *1.85 ± 0.79 *1.85 ± 1.55
SP100SP100 nuclear antigen1.08 ± 0.151.74 ± 0.57 *−1.09 ± 0.121.31 ± 0.18
Cell cycle and arrest
CDKN1CCyclin dependent kinase inhibitor 1C1.8 ± 0.69 *2.74 ± 1.11 *1.43 ± 0.351.2 ± 0.08
GADD45Ggrowth arrest and DNA damage inducible gamma2.09 ± 1.65 *1.75 ± 0.29 *1.29 ± 0.031.42 ± 0.71
GAS1Growth arrest specific 11.09 ± 0.22−1.51 ± 0.32 *−1.24 ± 0.08−1.35 ± 0.23
TOP2ATopoisomerase (DNA) II alpha−1.62 ± 0.49 *−1.77 ± 0.33 *1.79 ± 1.14−1.02 ± 0.09
Response to glucocorticoid stimulus and metabolism
LMO3LIM domain only 3−1.1 ± 0.09−1.6 ± 0.38 *−1.18 ± 0.1−1.22 ± 0.18
NR3C1Nuclear receptor subfamily 3 group C member 11.57 ± 0.08 *1.22 ± 0.06−1.15 ± 0.12−1.21 ± 0.28
SERPINA6Serpin family A member 6−1.6 ± 0.57 *−1.54 ± 0.33 *−1.15 ± 0.05−1.13 ± 0.11
STC1Stanniocalcin 11.54 ± 0.3 *1.58 ± 0.35 *−1.15 ± 0.161.02 ± 0.02
TATTyrosine aminotransferase1.11 ± 0.35−2.15 ± 0.45 *−1.13 ± 0.05−1.13 ± 0.19
Lipid metabolism
AFPAlpha fetoprotein−1.57 ± 0.36 *−1.33 ± 0.131.11 ± 0.292.12 ± 1.01 *
LPIN1Lipin 1−1.09 ± 0.12−1.55 ± 0.35 *−1.19 ± 0.06−1.08 ± 0.07
Aminoacid synthesis
PHGDHPhosphoglycerate dehydrogenase−1.42 ± 0.56−2.49 ± 1.05 *−1.03 ± 0.05−1.31 ± 0.19
Carbohydrate metabolic process
XYLBXylulokinase−1.25 ± 0.38−1.52 ± 0.35 *−1.52 ± 0.27 *−1.60 ± 0.27 *
Transmembrane transport
ABCA8ATP binding cassette subfamily A member 81.05 ± 0.22−1.55 ± 1.03 *−1.44 ± 0.34−1.47 ± 0.31
ATP1A2ATPase Na+/K+ transporting subunit alpha 2−1.34 ± 0.54−1.69 ± 0.26 *1.22 ± 0.191.35 ± 0.18
ATP1B1ATPase Na+/K+ transporting subunit beta 11.21 ± 0.351.51 ± 0.37 *1.02 ± 0.021.02 ± 0.03
ATP9AATPase phospholipid transporting 9A2.35 ± 0.35 *1.6 ± 0.22 *1.3 ± 0.111.3 ± 0.29
Extracellular matrix organization
ANXA2Annexin A2−1.42 ± 0.66−1.78 ± 0.27 *1.46 ± 0.621.09 ± 0.11
FMODFibromodulin−1.2 ± 0.23−1.52 ± 0.39 *−1.07 ± 0.07−1.18 ± 0.12
ITGA8Integrin subunit alpha 81.24 ± 0.271.51 ± 0.03 *−1 ± 0.121.24 ± 0.39
SPP1Secreted phosphoprotein 1−1.53 ± 0.13 *−1.17 ± 0.673 ± 3.561.38 ± 0.28
Signal transduction
NR1I3 (CAR)Nuclear receptor subfamily 1 group I member 31.51 ± 0.34 *1.77 ± 0.1 *1.07 ± 0.09−1.01 ± 0.08
PLEKPleckstrin1.21 ± 0.691.51 ± 0.12 *1.62 ± 0.66 *1.56 ± 0.17 *
REEP5Receptor accessory protein 5−1 ± 0.291.79 ± 0.42 *1.04 ± 0.141.02 ± 0.1
Protein complex assembly and cell adhesion
CLDN14Claudin 14−1.34 ± 0.57−1.69 ± 0.32 *1.13 ± 0.071.44 ± 0.82
CNTN4Contactin 41.09 ± 0.35−1.95 ± 0.52 *1.05 ± 0.011.37 ± 0.25
MOGSMannosyl-oligosaccharide glucosidase1.25 ± 0.281.68 ± 0.28 *1.25 ± 0.121.25 ± 0.26
SERPINI1Serpin family I member 1−1.52 ± 0.18 *−1.01 ± 0.09−1.22 ± 0.08−1.02 ± 0.04
Transcriptional regulation
RPL32Ribosomal protein L321.32 ± 0.221.56 ± 0.35 *1.03 ± 0.111 ± 0.01
YIPF1Yip1 domain family member 1−1.08 ± 0.22−1.51 ± 0.17 *−1.03 ± 0.04−1.27 ± 0.03
Table 6. Drug-induced steatosis-regulated genes in the liver and kidney. Based on mechanistically linked and lipid-droplet-associated gene regulations, a total of 65 DEGs were identified after diclofenac treatment and categorized based on their biological processes. * Differentially expressed genes (Foldchange > ±1.5, p-value < 0.05 and FDR < 0.05).
Probeset IDGene SymbolDescriptionLiverKidney
LDHDLDHD
Fold Change (Average) ± SD
Lipogenesis
Ssc.4891.1.A1_atAGPAT9 (GPAT3)Glycerol-3-phosphate acyltransferase 31.14 ± 0.392.99 ± 1.11 *1.16 ± 0.291.08 ± 0.02
Ssc.12241.1.A1_atANXA2Annexin A2−1.42 ± 0.66−1.78 ± 0.27 *1.46 ± 0.621.09 ± 0.11
Ssc.3703.1.S1_atAPOA2Apolipoprotein A2−1.31 ± 0.13−1.57 ± 0.07 *−1.03 ± 0.1−1.07 ± 0.05
Ssc.14503.1.S1_atAPOA4Apolipoprotein A41.16 ± 4.91.56 ± 0.29 *1.01 ± 0.081.07 ± 0.16
Ssc.1039.1.S1_atAPOC3Apolipoprotein C3−1.01 ± 0.01−1.03 ± 0.04−3.97 ± 1.42 *1.01 ± 0.11
Ssc.5848.1.S1_atB4GALT5Beta-1,4-galactosyltransferase 51.98 ± 1.281.51 ± 0.35 *1.58 ± 0.76 *1.15 ± 0.14
Ssc.2224.1.S1_atCYP2C19Cytochrome P450 family 2 subfamily C member 19−1.59 ± 0.2 *−1.51 ± 0.28 *1.11 ± 0.15−1.04 ± 0.11
Ssc.19298.2.S1_atDHCR2424-dehydrocholesterol reductase−1.01 ± 0.391.01 ± 0.121.36 ± 0.21.56 ± 0.03 *
Ssc.30467.1.A1_atELOVL2ELOVL fatty acid elongase 22.66 ± 2.93.53 ± 0.59 *1.04 ± 0.03−1.18 ± 0.08
Ssc.1595.1.S1_a_atFADS1Fatty acid desaturase 1−1.64 ± 3.48−1.91 ± 0.79 *1 ± 0.11.55 ± 0.06 *
Ssc.18175.1.A1_atFASNFatty acid synthase−1.61 ± 0.22 *−2.12 ± 0.54 *1.03 ± 0.041.14 ± 0.11
Ssc.4417.1.A1_atGALNT2Polypeptide N-acetylgalactosaminyltransferase 21.55 ± 0.77 *1.45 ± 0.11.01 ± 0.02−1.14 ± 0.05
Ssc.11103.1.S1_atMDH1Malate dehydrogenase 11.04 ± 0.061.54 ± 0.07 *1.01 ± 0.031.09 ± 0.09
Ssc.3345.2.S1_atMVKMevalonate kinase−1.53 ± 1.07−2.36 ± 0.93 *1.05 ± 0.07−1.08 ± 0.07
Ssc.9781.1.S1_atSERPINE1Serpin family E member 11.87 ± 0.95 *1.58 ± 0.04 *3.32 ± 3.931.41 ± 0.53
Ssc.4552.1.S1_atVLDLRVery low density lipoprotein receptor−1.53 ± 0.21 *1.98 ± 0.15 *1.08 ± 0.061.08 ± 0.02
Fatty acid oxidation/mitochondrial stress
Ssc.2176.1.A1_atACSL3Acyl-CoA synthetase long-chain family member 3−1.52 ± 0.83 *−1.66 ± 0.58 *1.03 ± 0.081.07 ± 0.06
Ssc.18933.1.A1_atADH4Alcohol dehydrogenase 4−1.72 ± 0.86 *−2.93 ± 1.27 *1.01 ± 0.08−1.06 ± 0.11
Ssc.17183.1.S1_atATP5DATP synthase subunit delta, mitochondrial-like1.28 ± 0.061.56 ± 0.36 *1.08 ± 0.131.1 ± 0.04
Ssc.26021.1.S1_atFOXA1Forkhead box A11.6 ± 0.55 *1.79 ± 0.37 *1.12 ± 0.171.01 ± 0.05
Lipid transport
Ssc.13622.1.S1_atAQP4Aquaporin 4−1.56 ± 0.24 *−1.14 ± 0.151 ± 0.021.09 ± 0.17
Ssc.604.1.S1_atFABP1Fatty acid binding protein 1, liver−1.12 ± 0.561.01 ± 0.111.59 ± 0.18 *1.32 ± 0.29
Ssc.6605.1.S1_atHDLBPHigh density lipoprotein binding protein1.35 ± 0.181.64 ± 0.28 *−1.18 ± 0.181.03 ± 0.08
Ssc.21926.1.S1_atLDLRLow density lipoprotein receptor−1.11 ± 0.51−1.13 ± 0.131.52 ± 0.2 *1.59 ± 0.1 *
Ssc.29043.1.S1_atNR5A2Nuclear receptor subfamily 5, group A, member 2−1.3 ± 0.64−1.57 ± 0.46 *1.1 ± 0.1−1.31 ± 0.3
LD growth/ER stress
Ssc.29181.1.A1_s_atATP2A2 (SERCA2)ATPase sarcoplasmic/endoplasmic reticulum Ca2+ transporting 21.44 ± 0.312.04 ± 1.08 *1.01 ± 0.041.11 ± 0.14
Ssc.3106.1.S1_atCALRCalreticulin1.35 ± 0.252.42 ± 1.21 *1.32 ± 0.141.79 ± 0.37 *
Ssc.12842.1.S1_atCAV1Caveolin 1−2.05 ± 0.39 *−1.74 ± 0.38 *1.2 ± 0.27−1.2 ± 0.08
Ssc.250.1.S1_atCBR1Carbonyl reductase 1−1.97 ± 0.69 *−1.6 ± 1.08−1.49 ± 0.64−1.09 ± 0.08
Ssc.6784.1.S1_atLIPELipase E1.04 ± 0.09−1.23 ± 0.311.14 ± 0.131.57 ± 0.29 *
Ssc.6323.1.S1_atPLIN2Perilipin 23.01 ± 1.39 *4.7 ± 1.15 *1.06 ± 0.121.32 ± 0.28
Ssc.17391.2.S1_atRAB35RAB35, member RAS oncogene family−1.2 ± 0.38−1.57 ± 0.38 *1.08 ± 0.07−1.26 ± 0.27
Ssc.29036.1.S1_atTUBA4ATubulin, alpha 4a1.59 ± 0.61 *1.62 ± 0.43 *1.2 ± 0.141.26 ± 0.03
Oxidative stress/signalling events
Ssc.22673.1.S1_atAKR1C1Aldo-keto reductase family 1, member C1−1.16 ± 0.03−1.81 ± 0.31 *−1.3 ± 0.45−1.7 ± 0.31 *
Ssc.8987.1.A1_atARHGAP1Rho GTPase activating protein 11.62 ± 0.12 *1.7 ± 0.17 *1.27 ± 0.181.18 ± 0.19
Ssc.27539.2.A1_a_atASPHAspartate beta-hydroxylase1.13 ± 0.151.57 ± 0.14 *1.08 ± 0.081.11 ± 0.06
Ssc.22002.2.A1_atCXCL13Chemokine lignad 131.11 ± 0.141.54 ± 0.16 *−1.07 ± 0.141.26 ± 0.22
Ssc.20578.1.S1_atCXCL14Chemokine ligand 141.01 ± 0.051.24 ± 0.161.61 ± 0.68 *1.58 ± 0.4 *
Ssc.19692.1.S1_atCXCL2Chemokine ligand 24.33 ± 1.26 *2.56 ± 1.05 *4.05 ± 5.081.76 ± 0.56 *
Ssc.390.1.A1_atHIF1AHypoxia inducible factor 1 alpha subunit−1.67 ± 0.04 *−1.08 ± 0.181.16 ± 0.091.11 ± 0.11
Ssc.12191.1.A1_atHSP90AA1Heat shock protein 90kDa1.58 ± 0.2 *1.32 ± 0.3−1.25 ± 0.17−1.15 ± 0.24
Ssc.308.1.S1_atHSP90B1Heat shock protein 90 beta family member 11.26 ± 0.311.93 ± 0.8 *−1.6 ± 0.4 *−1.64 ± 0.12 *
Ssc.9056.1.A1_atHSPA5Heat shock protein family A (Hsp70) member 51.66 ± 0.3 *1.81 ± 0.1 *1.16 ± 0.211.2 ± 0.04
Ssc.23054.1.S1_atJAK3Janus kinase 31.27 ± 0.411.52 ± 0.19 *1.42 ± 0.491.34 ± 0.13
Ssc.18557.1.S1_atKNG1Kininogen 1−1.2 ± 0.04−1.61 ± 0.15 *−1.96 ± 1 *−2.13 ± 0.14 *
Ssc.7297.1.S1_atMAOBMonoamine oxidase B−1.32 ± 0.3−1.86 ± 0.22 *−1.04 ± 0.11.05 ± 0.07
Ssc.7478.1.A1_atMARCH5Membrane associated ring-CH-type finger 5−1.18 ± 0.07−1.5 ± 0.29 *−1.11 ± 0.06−1.25 ± 0.25
Ssc.10955.1.S1_atMGST3Microsomal glutathione S-transferase 3−1.21 ± 0.25−1.7 ± 0.36 *1.21 ± 0.151.11 ± 0.09
Ssc.9170.1.A1_atPRKD1Protein kinase D1−2.04 ± 1.13 *−2.52 ± 0.42 *1.06 ± 0.11.14 ± 0.05
Ssc.830.1.S1_atPSME2Proteasome activator subunit 2−1.14 ± 0.15−1.51 ± 0.26 *1.14 ± 0.27−1.09 ± 0.07
Ssc.14490.1.S1_atPTGR1Prostaglandin reductase 1−1.27 ± 0.68−1.18 ± 0.223.4 ± 2.61 *3.13 ± 1.91 *
Ssc.3706.1.S2_atSOD2Superoxide dismutase 2, mitochondrial2.22 ± 0.9 *1.91 ± 0.53 *1.09 ± 0.141.07 ± 0.05
Ssc.11252.1.S1_atSPRSepiapterin reductase−1.61 ± 0.49 *−1.67 ± 0.38 *−1.22 ± 0.05−1.24 ± 0.02
Ssc.14066.2.S1_atTATTyrosine aminotransferase1.11 ± 0.35−2.15 ± 0.45 *−1.13 ± 0.05−1.13 ± 0.19
Ssc.3753.1.S1_atTFRC (CD71)Transferrin receptor1.64 ± 0.69 *1.34 ± 0.351.68 ± 0.31 *1.44 ± 0.36
Ssc.28413.1.A1_atUBXN4UBX domain-protein 41.06 ± 0.041.12 ± 0.15−1.52 ± 0.31 *−1.92 ± 0.24 *
Ssc.16350.1.S1_atUCP2Uncoupling protein 21.25 ± 0.041.17 ± 0.121.59 ± 0.22 *1.78 ± 0.36 *
Ssc.3185.1.S1_atTXNDC5Thioredoxin domain-containing protein 51.07 ± 0.161.53 ± 0.02 *1.12 ± 0.181.28 ± 0.01
Lipid metabolism marker genes
Ssc.16377.1.A1_s_atGSTA1Glutathione S-transferase alpha 1−1.08 ± 0.1−1.61 ± 1.073.23 ± 1.40 *4.60 ± 1.27 *
Ssc.5991.1.A1_atKRT18Keratin 181.74 ± 0.62 *1.67 ± 0.25 *4.01 ± 5.19−1.06 ± 0.05
Ssc.5955.1.A1_atKRT8keratin 81.9 ± 0.38 *2.6 ± 0.28 *1.51 ± 0.28 *1.93 ± 0.11 *
Glucose metabolism
Ssc.8980.1.A1_atANGPTL4Angiopoietin-like 4−1.58 ± 1.15−1.54 ± 0.29 *−1.32 ± 0.13−1.01 ± 0.04
Ssc.27727.1.S1_atPGM5Phosphoglucomutase 5−1.39 ± 0.33−1.79 ± 0.11 *−1.59 ± 0.28 *−1.48 ± 0.48
Ssc.21431.3.A1_s_atPHGDHPhosphoglycerate dehydrogenase−1.42 ± 0.56−2.49 ± 1.05 *−1.03 ± 0.05−1.31 ± 0.19
Ssc.4717.1.S1_atPHKBPhosphorylase b kinase regulatory subunit beta−1.32 ± 0.34−1.58 ± 0.16 *−1.04 ± 0.1−1.17 ± 0.02
Table 7. Commonly regulated genes in the liver and kidney after diclofenac treatment. * Differentially expressed genes (Foldchange > ±1.5, p-value < 0.05 and FDR < 0.05).
Gene SymbolGene DescriptionFold Change (Average) ± SD
LD_LiverHD_LiverLD_KidneyHD_Kidney
Immune and inflammatory response
C9Complement component 92.73 ± 0.77 *1 ± 0.05−1.81 ± 0.78 *−1.23 ± 0.32
CD163CD163 antigen1.49 ± 0.752.04 ± 0.42 *2.01 ± 1.67 *1.36 ± 0.45
CXCL2Chemokine (C-X-C motif) ligand 24.33 ± 0.37 *2.56 ± 1.05 *4.05 ± 5.081.76 ± 0.56 *
GJA1Gap junction protein, alpha 11.63 ± 0.16 *1.32 ± 0.251.86 ± 1.5 *−1.59 ± 0.19 *
IFI44LInterferon-induced protein 44-like−1.18 ± 0.31−2.03 ± 0.41 *−1.18 ± 0.08−1.51 ± 0.31 *
IL10RBInterleukin 10 receptor, beta1.9 ± 0.06 *2.6 ± 0.28 *1.51 ± 0.28 *1.93 ± 0.11 *
IRG6 (RSAD2)Inflammatory response protein 6−1.82 ± 0.84 *−3.24 ± 1.23 *−1.99 ± 0.17 *−2.75 ± 0.59 *
ISG15ISG15 ubiquitin-like modifier−1.2 ± 0.151.86 ± 0.11 *−1.32 ± 0.12−1.91 ± 0.24 *
KNG1Kininogen 1−1.2 ± 0.22−1.61 ± 0.15 *−1.96 ± 1 *−2.13 ± 0.14 *
LYZLysozyme2.78 ± 1.93 *5.89 ± 1.045.31 ± 5.173.27 ± 0.93 *
S100A9S100 calcium binding protein A97.03 ± 5.214.13 ± 2.55 *6.17 ± 8.482.58 ± 0.65 *
TFRCTransferrin receptor (CD71)1.64 ± 0.69 *1.34 ± 0.351.68 ± 0.31 *1.44 ± 0.36
TNFAIP6Tumor necrosis factor, alpha-induced protein 6−1.58 ± 0.27 *−1 ± 0.13−2.09 ± 0.39 *−1.18 ± 0.28
USP18Ubiquitin specific peptidase 18−1.39 ± 0.53−2.25 ± 0.11 *−1.52 ± 0.08 *−1.68 ± 0.47 *
VCAM1Vascular cell adhesion molecule 1−1.21 ± 0.071.85 ± 1.1 *1.87 ± 1.1 *1.57 ± 0.63 *
Drug metabolism
CYB5D2Cytochrome B5 domain containing 2−1.07 ± 0.451.8 ± 0.29 *1.15 ± 0.371.56 ± 0.24 *
CYP3A29Cytochrome P450 3A29−1.24 ± 0.25−1.57 ± 0.28 *−1.27 ± 0.14−1.62 ± 0.67 *
Response to stress
IGFBP2Insulin-like growth factor binding protein 2−1.37 ± 0.29−1.85 ± 0.37 *1.52 ± 0.28 *1.26 ± 0.09
RBM3RNA binding motif (RNP1, RRM) protein 3−1.51 ± 0.15−1.93 ± 0.12 *−1.52 ± 0.27 *−2.56 ± 0.55 *
Oxidation-reduction process
ACAD10Acyl-CoA dehydrogenase family, member 101.23 ± 0.461.93 ± 0.35 *1.19 ± 0.442.14 ± 0.1 *
AKR1C1Aldo-keto reductase family 1, member C1−1.81 ± 0.03 *−1.81 ± 0.31 *−1.3 ± 0.45−1.7 ± 0.31 *
PIRPirin-like−1.15 ± 0.77−1.53 ± 0.34 *2.1 ± 0.83 *1.25 ± 0.08
Response to hypoxia
ANGPT1Angiopoietin 1−1.15 ± 0.19−1.51 ± 0.39 *−1.56 ± 0.37 *−1.14 ± 0.22
Cell death and apoptosis
CALRCalreticulin1.35 ± 0.252.42 ± 1.21 *1.32 ± 0.141.79 ± 0.37 *
EVA1AProtein FAM176A-like−1.54 ± 3.19−2.06 ± 0.14 *−1.44 ± 0.79−1.82 ± 0.52 *
HRGHistidine-rich glycoprotein−1.52 ± 0.38 *−2.26 ± 0.53 *−1.16 ± 0.28−1.75 ± 0.34 *
HSP90B1Heat shock protein 90kDa beta, member 11.34 ± 0.311.93 ± 0.80 *−1.59 ± 0.40 *−1.64 ± 0.12 *
Circadian rhythmic process
ARNTL/BMAL1Aryl hydrocarbon receptor nuclear translocator-like2.07 ± 0.46 *2.69 ± 0.1 *1.48 ± 0.351.9 ± 0.24 *
BHLHE41Basic helix-loop-helix family, member e41−1.52 ± 1.23 *−2.41 ± 0.32 *−1.1 ± 0.2−1.51 ± 0.09 *
CRY1Cryptochrome 14.13 ± 1.23 *4.28 ± 0.51 *1.62 ± 0.32 *1.82 ± 0.53 *
NPAS2Neuronal PAS domain protein 21.3 ± 0.12.46 ± 0.51 *1.15 ± 0.211.57 ± 0.18 *
NR1D2/REVERBBNuclear receptor subfamily 1, group D, member 2−2.79 ± 0.38 *−5.25 ± 1.01 *−1.99 ± 0.56 *−1.99 ± 0.77 *
PER2Period homolog 2−1.38 ± 0.2−2.6 ± 1.36 *−1.56 ± 0.32 *−1.85 ± 0.29 *
Lipid metabolism
ARSDArylsulfatase D−1.05 ± 0.23−1.73 ± 0.11 *−1.12 ± 0.18−1.73 ± 0.15 *
KRT8keratin 81.9 ± 0.38 *2.6 ± 0.28 *1.51 ± 0.28 *1.93 ± 0.11 *
PLEKPleckstrin1.21 ± 0.691.5 ± 0.12 *1.62 ± 0.66 *1.56 ± 0.17 *
Protein metabolism
ANKRD28Ankyrin repeat domain 281.09 ± 0.141.51 ± 0.12 *−1.13 ± 0.23−1.52 ± 0.07 *
ASRGL1L-asparaginase-like−1.19 ± 0.29−1.53 ± 0.07 *−1.38 ± 0.08−1.63 ± 0.14 *
GTF2H3General transcription factor IIH, polypeptide 31.07 ± 0.191.82 ± 0.05 *−1.07 ± 0.071.59 ± 0.15 *
IGFBP3Insulin-like growth factor binding protein 3−1.41 ± 0.04−1.65 ± 0.13 *−1.83 ± 0.98−2.47 ± 0.7 *
Carbohydrate metabolism
XYLBXylulose kinase-like−1.25 ± 0.3−1.52 ± 0.35 *−1.52 ± 0.27 *−1.60 ± 0.27 *
Signal transduction
GPNMBGlycoprotein (transmembrane) nmb−1.1 ± 0.19−2.01 ± 0.35 *2.48 ± 0.39 *2.47 ± 0.85 *
RND3Rho family GTPase 31.32 ± 0.151.80 ± 0.02 *1.27 ± 0.151.55 ± 0.24 *
Table 8. Master regulatory genes in the liver and kidney after low- and high-dose diclofenac treatments. The key master molecules were identified and their regulatory networks were constructed using the GeneXplain software. Given is a summary of master regulatory genes and the associated networks with the number of total interacting genes and DEGs, network score, Z-score and average fold change. The filtering criteria Z- Score > 1 and Score > 0.2 were set to select statistically significant master regulators.
Master Regulatory GenesNo of GenesScoreFDRZ-ScoreFold Change
(Average) ± SD
Total No. of Genes in the NetworkStatistically Significant DEGs
DCF_low dose_liver
Cryptochrome 1 (CRY1)51270.277850.022.84964.13 ± 1.23
Hypoxia inducible factor 1, alpha subunit (HIF1A)76390.470520.0111.90028−1.67 ± 0.04
Nuclear receptor subfamily 3, group C, member 1 (NR3C1)90420.582760.0471.484311.57 ± 0.08
DCF_high dose_liver
Cryptochrome 1 (CRY1)113660.235930.0243.412684.28 ± 0.51
Insulin-like growth factor binding protein 2 (IGFBP2)1961110.369270.0163.01892−1.85 ± 0.37
Lipopolysaccharide-induced TNF factor (LITAF)1991110.400460.0272.202011.81 ± 0.22
Angiopoietin-like 4 (ANGPTL4)130770.221030.0282.10328−1.54 ± 0.29
DCF_low dose_kidney
Dipeptidyl-peptidase 4 (DPP4)83400.506860.0052.69108−1.52 ± 0.51
Angiopoietin 1 (ANGPT1)43250.250060.0112.86388−1.56 ± 0.37
Sirtuin 1 (SIRT1)77380.570720.0211.51382−1.51 ± 0.21
DCF_high dose_kidney
Matrix metallopeptidase 7 (MMP7)103520.440090.0073.185952.99 ± 0.75
Complement component 1, q subcomponent, alpha polypeptide (C1QA)102490.474050.0023.332351.51 ± 0.2
Nuclear factor of kappa light polypeptide gene enhancer in B cells inhibitor, zeta (NFKBIZ)114560.379810.022.350221.59 ± 0.2
Insulin-like growth factor binding protein 3 (IGFBP3)113560.488650.0291.92918−2.47 ± 0.7
Table 9. Antibodies used for immunohistochemistry.
AntibodyVendorCat no.Lot NumberDilutionAntigen
Retrieval
Cortisol Binding Globulin (CBG)Abcam (Cambridge, UK)ab107368GR74750-201:100pH 6
CPS1 / Hepar-1Santa Cruz Biotechnology, (Heidelberg, Germany)sc-58693C12131:7500pH 6
CRF1Abcamab150561GR139717-151:250pH 9
CYP1A1Abcamab3568 1:200pH 6
Cryptochrome I (CRY1)Abcamab3518GR307241-61:300pH 6
ELOVL2Abcamab111162GR48113-11:100pH 6
Glucocorticoid Receptor (GR)Abcamab233165GR3222243-11:100pH 9
HIF1aAbcamab463GR2528601:40pH 6
KAT-13D (CLOCK)Abcamab65033GR88646-11:50pH 6
MPODako (Hamburg, Germany)REFA0398200010761:500pH 6
Per2Abcamab200388GR221389-81:300pH 6
SOD-1Santa Cruzsc-11407B04151:500pH 6
SOD-2Santa Cruzsc-30080J07131:250pH 6
Disclaimer/Publisher’s Note: The statements, opinions and data contained in all publications are solely those of the individual author(s) and contributor(s) and not of MDPI and/or the editor(s). MDPI and/or the editor(s) disclaim responsibility for any injury to people or property resulting from any ideas, methods, instructions or products referred to in the content.

