
Hepatitis C Virus Infection Upregulates Plasma Phosphosphingolipids and Endocannabinoids and Downregulates Lysophosphoinositols

 ,
, 
 and
and 
Abstract
1. Introduction
2. Results
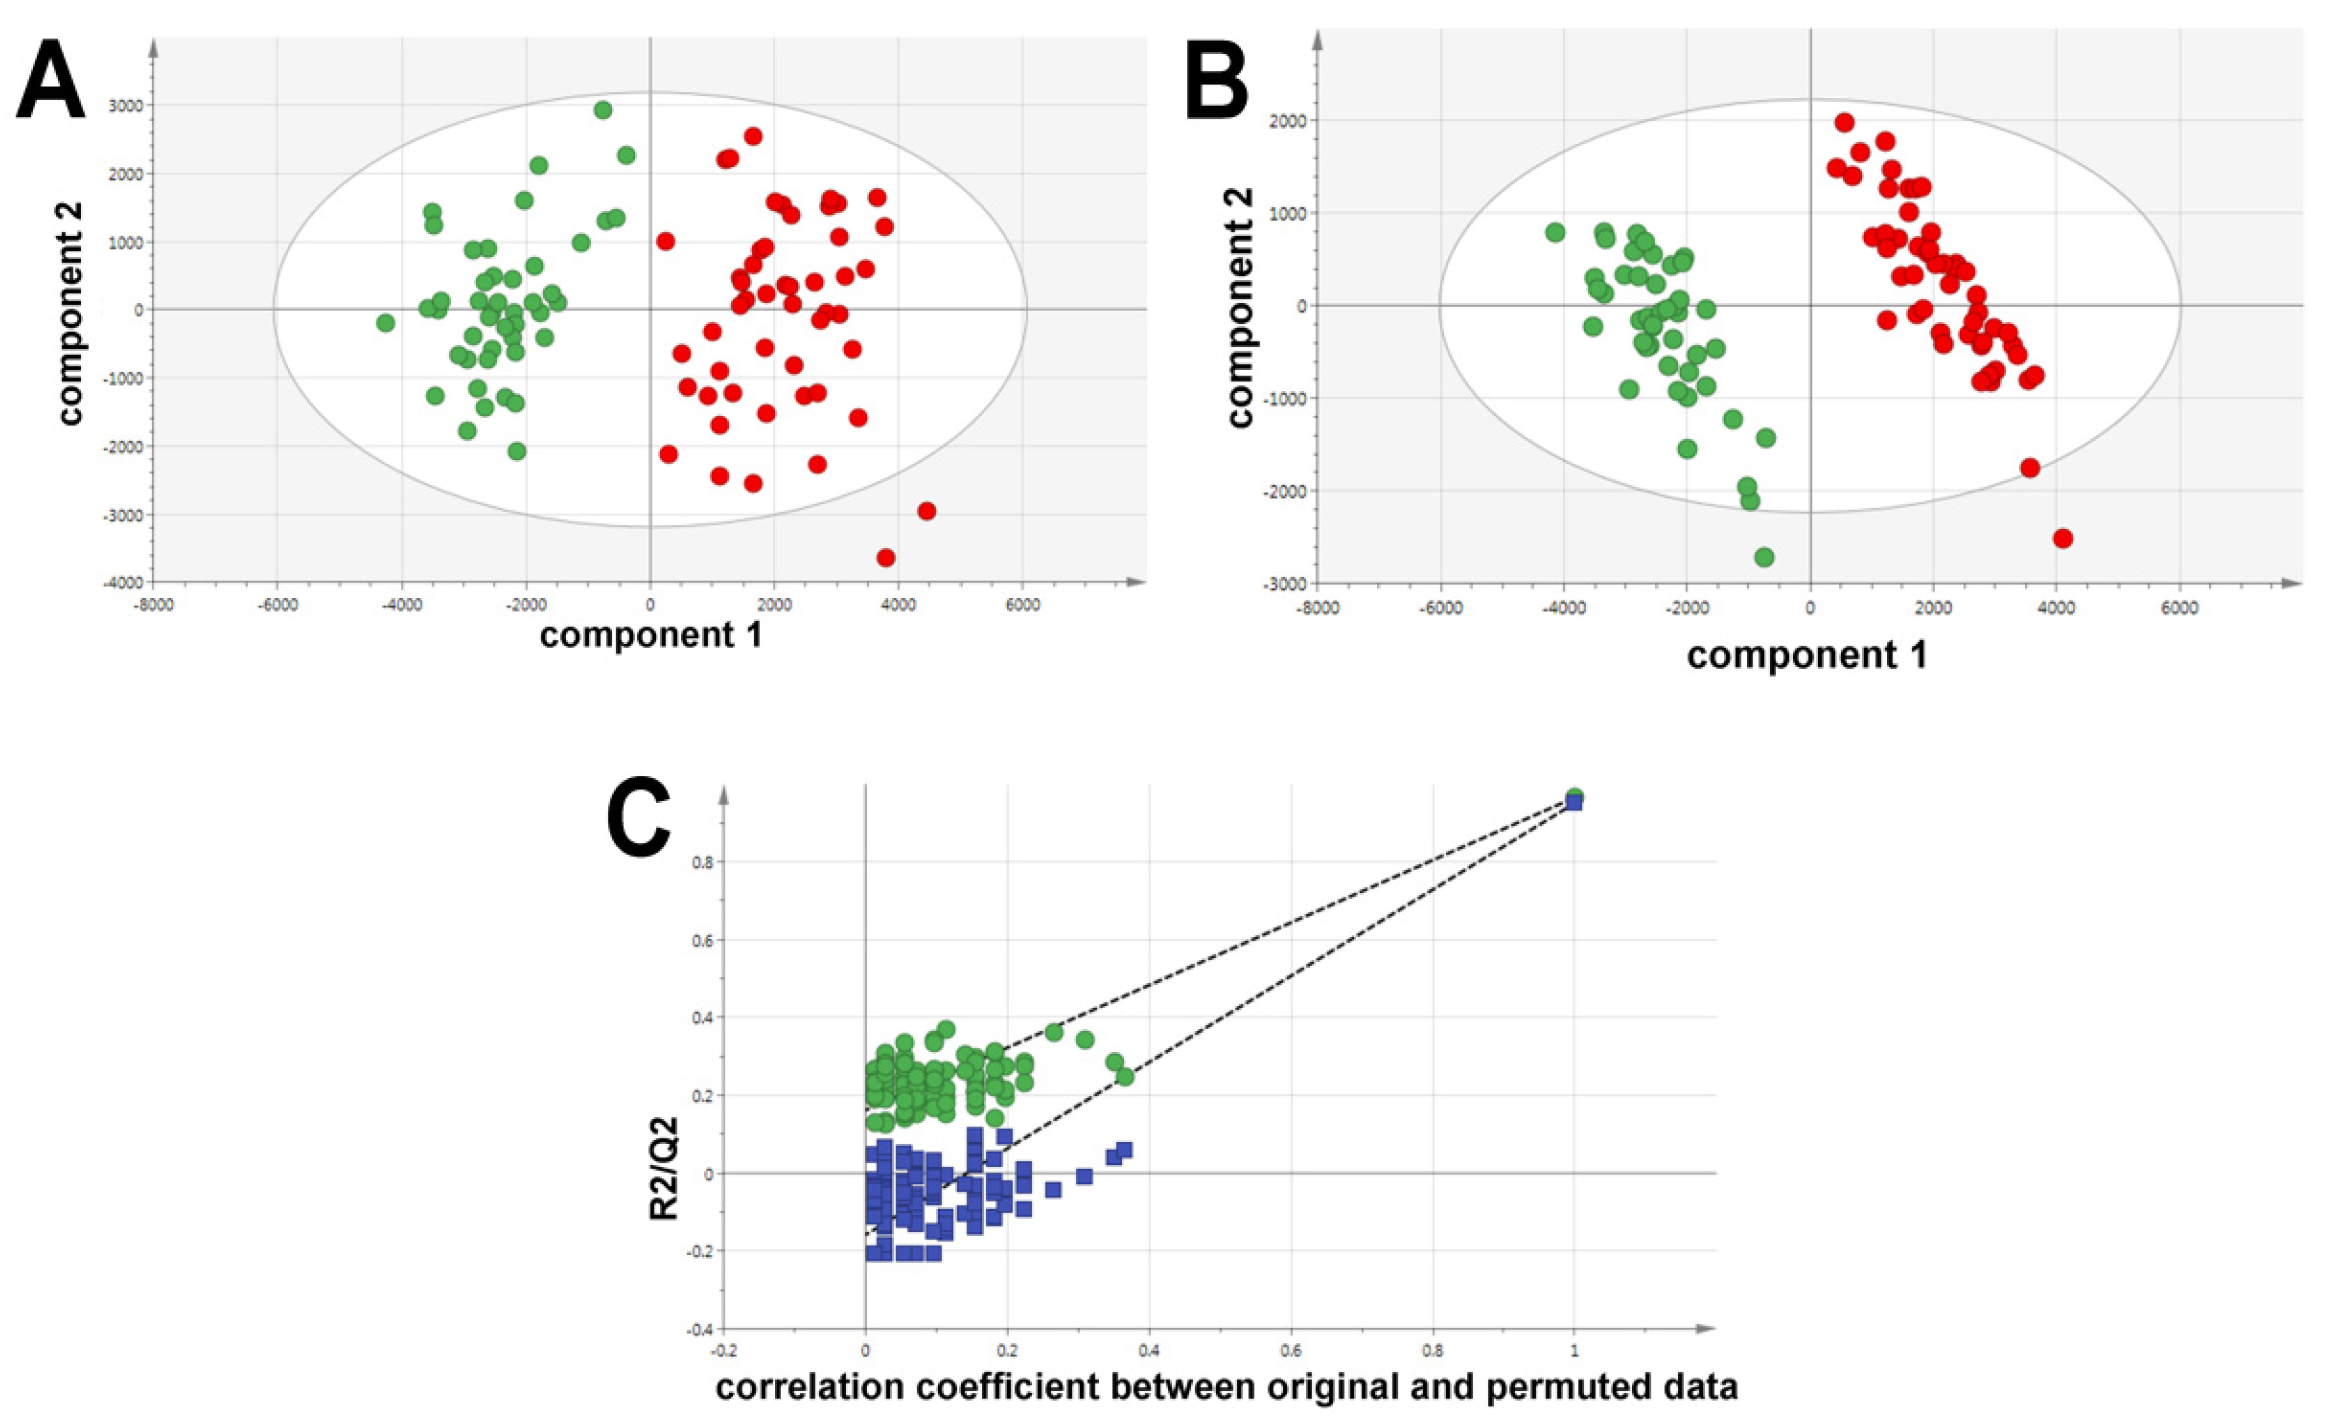
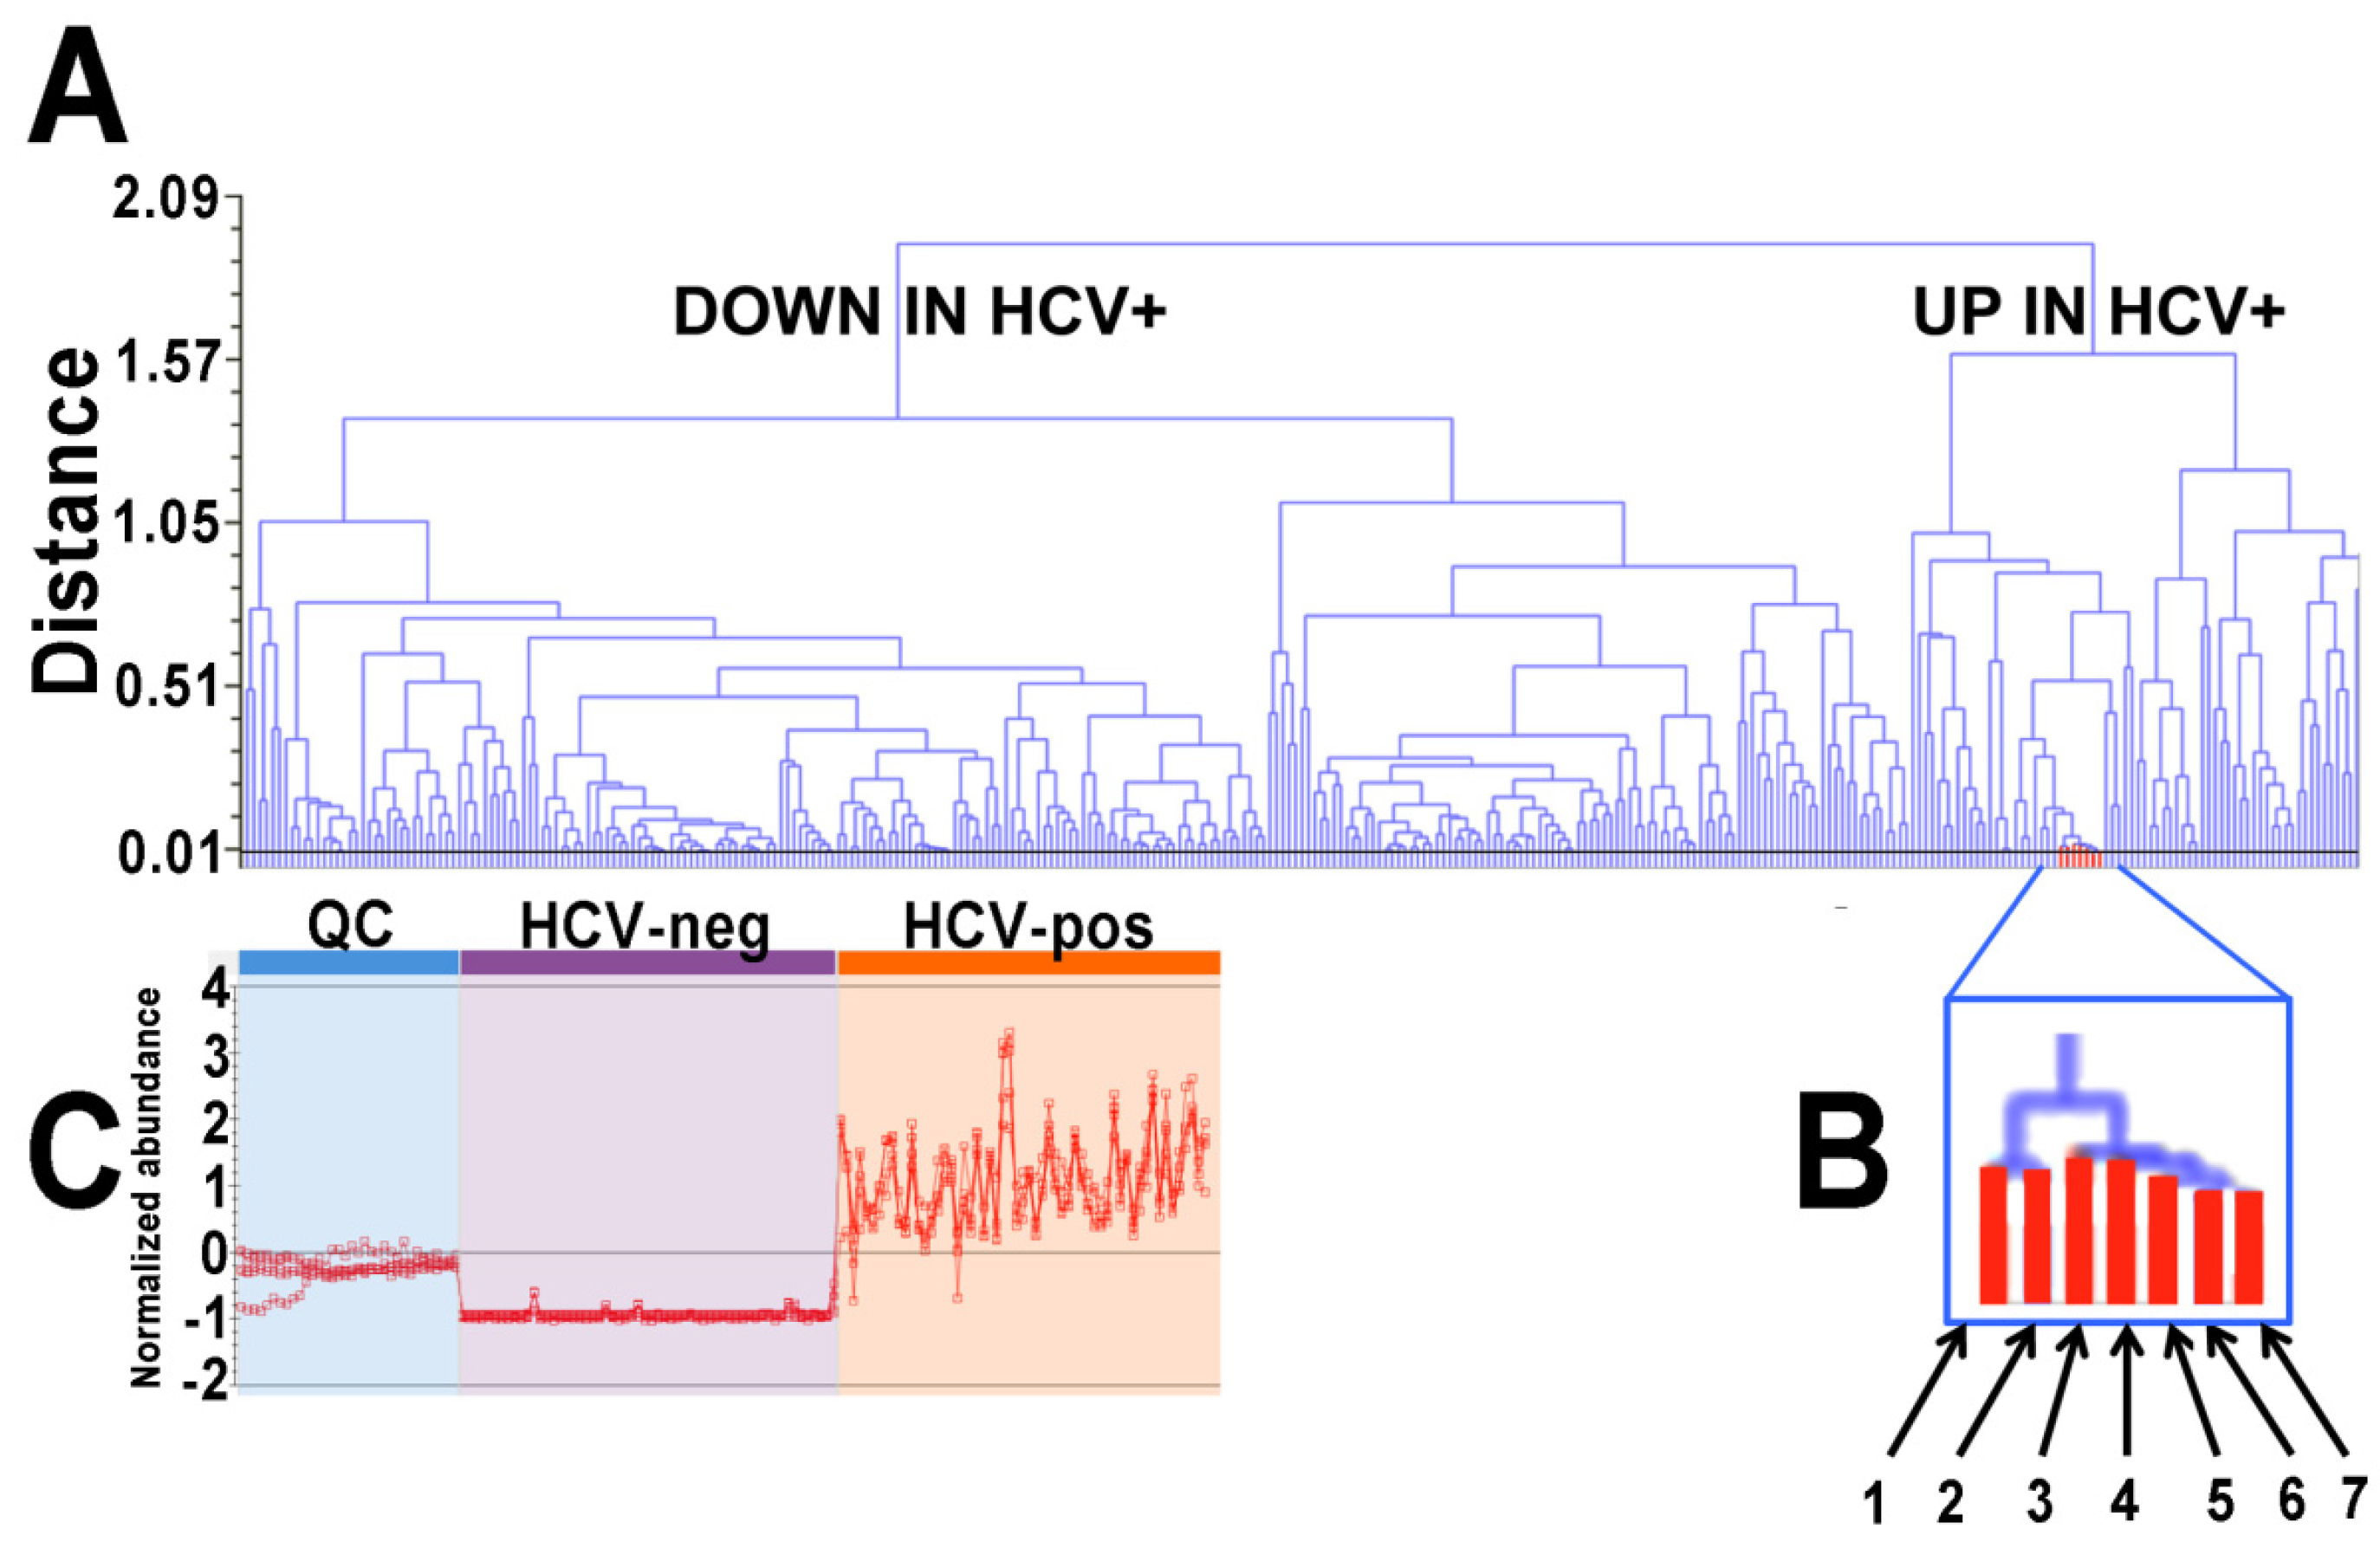
2.1. Ultraperformance Liquid Chromatography-Electrospray Ionization-Quadrupole Time-of-Flight Mass Spectrometry (UPLC-ESI-QTOFMS)-Based Lipidomics
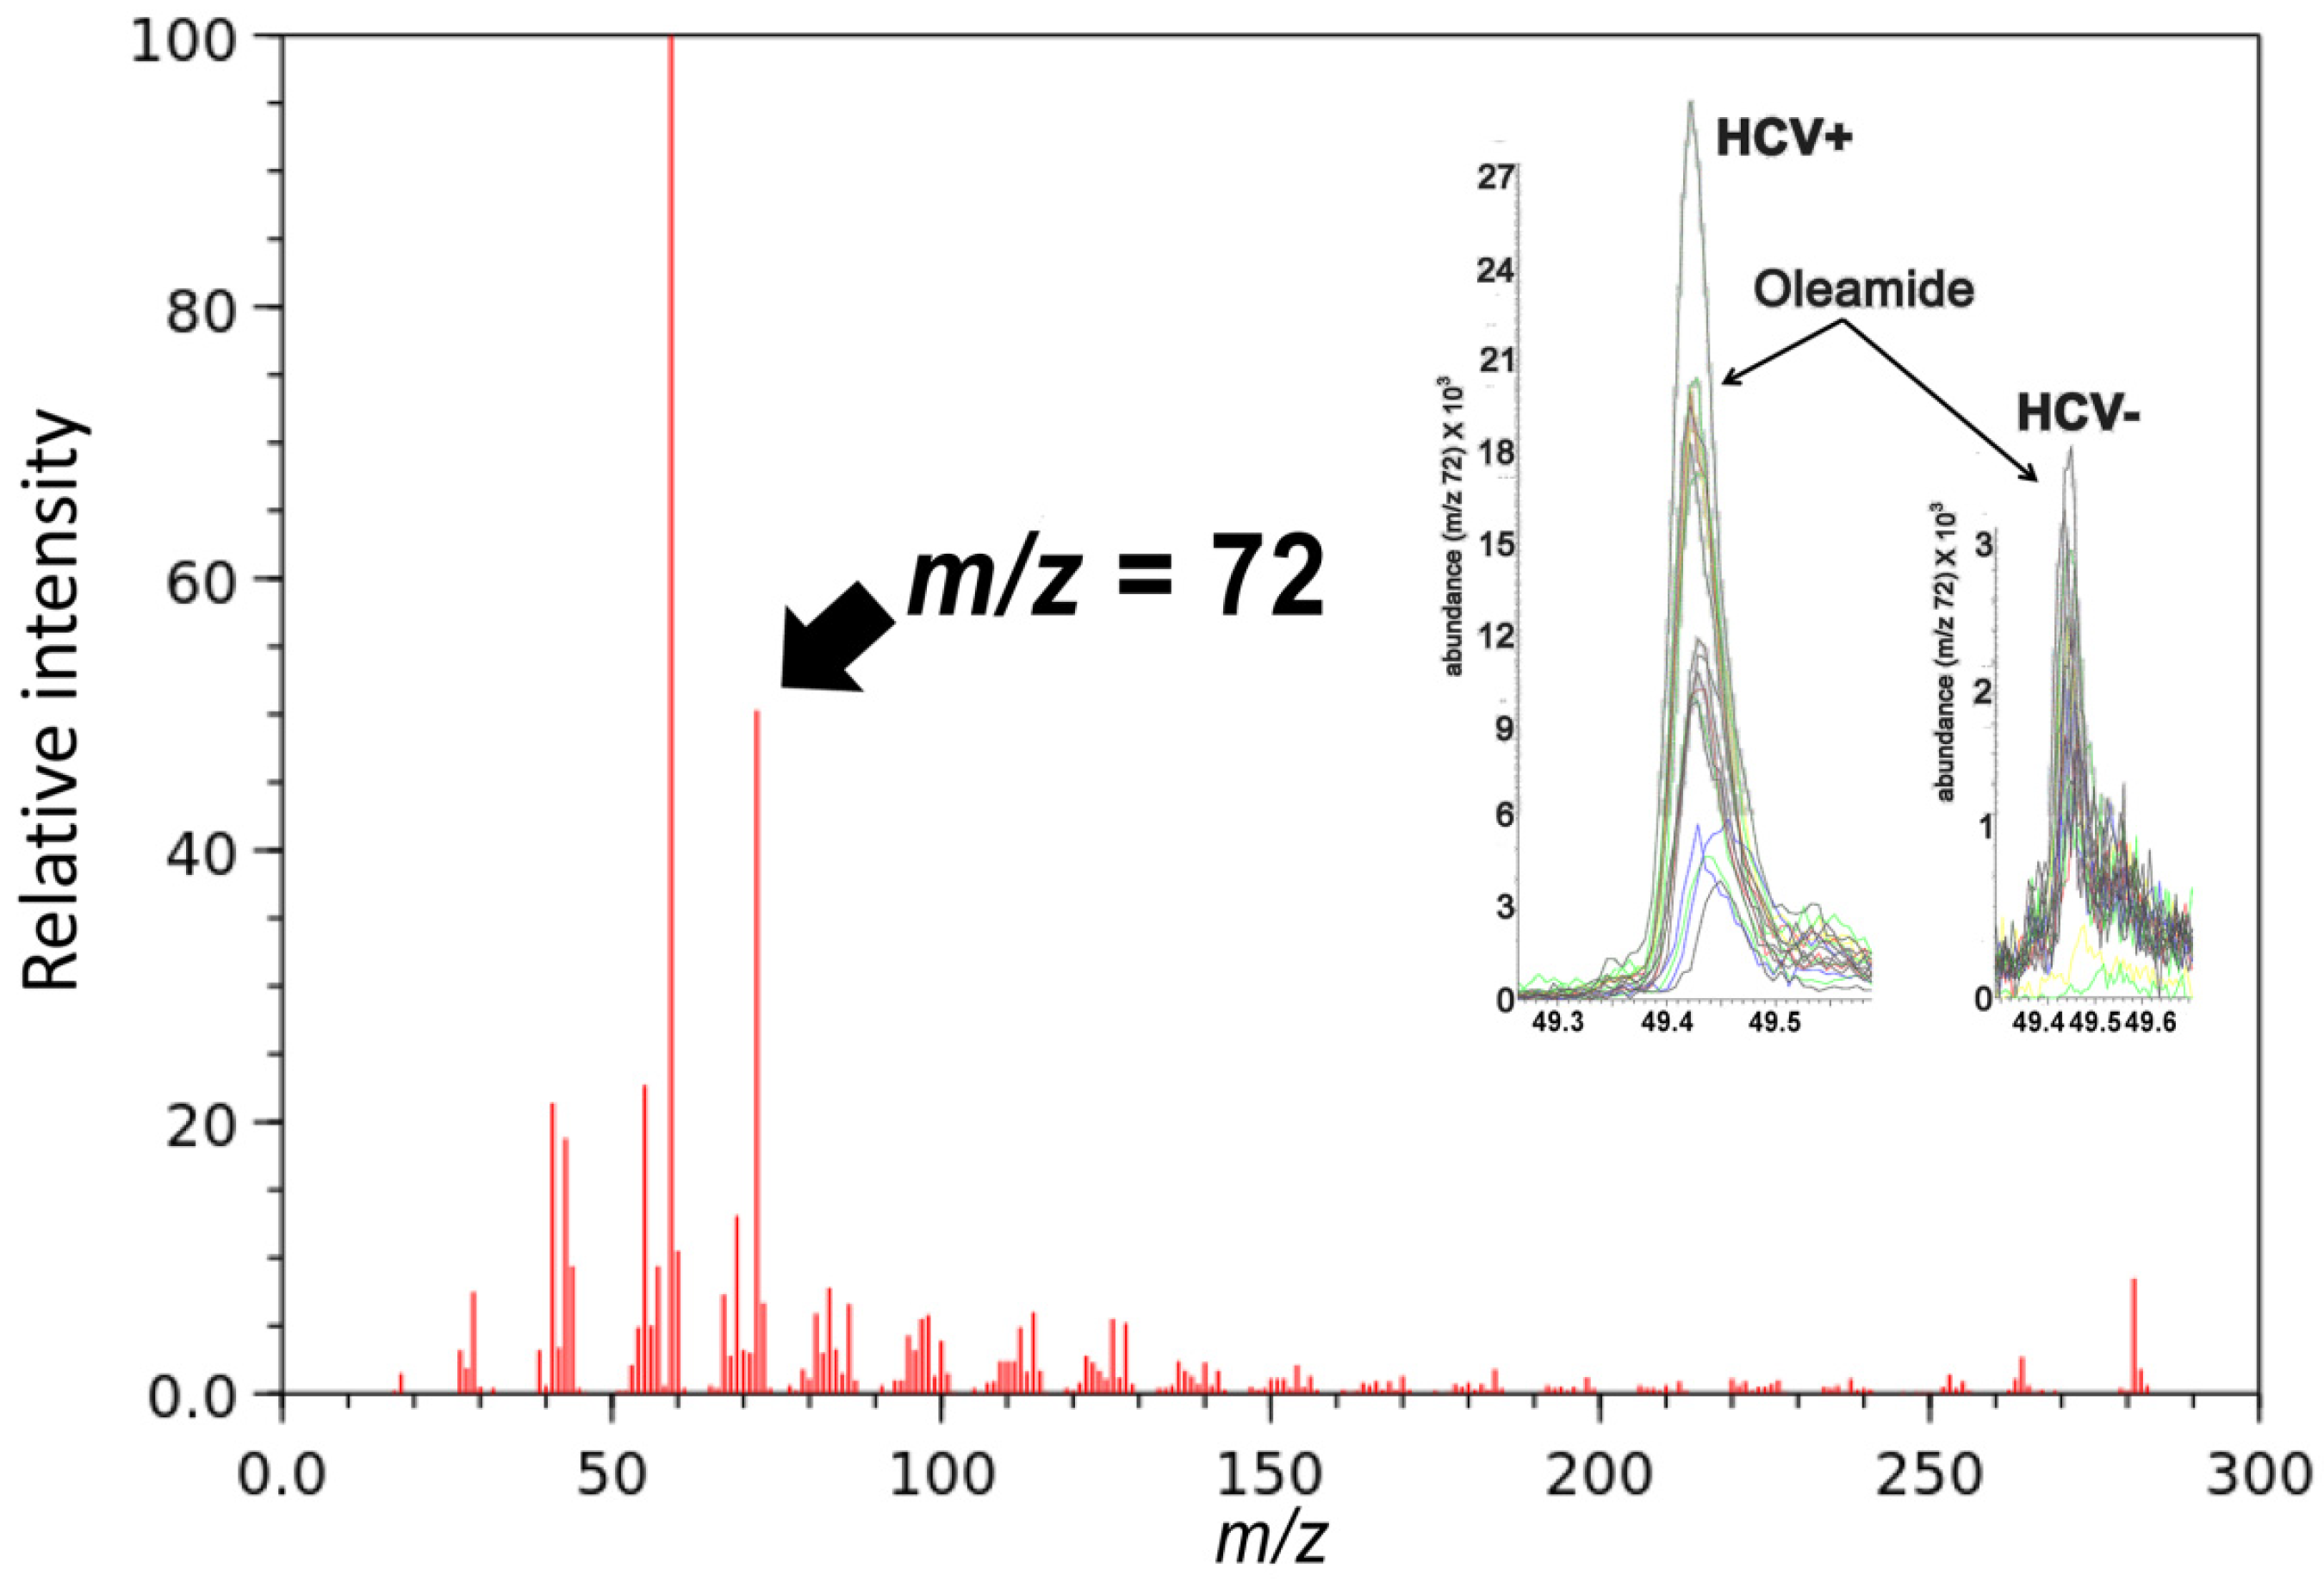
2.2. Gas Chromatography-Mass Spectrometry-Based Metabolomics
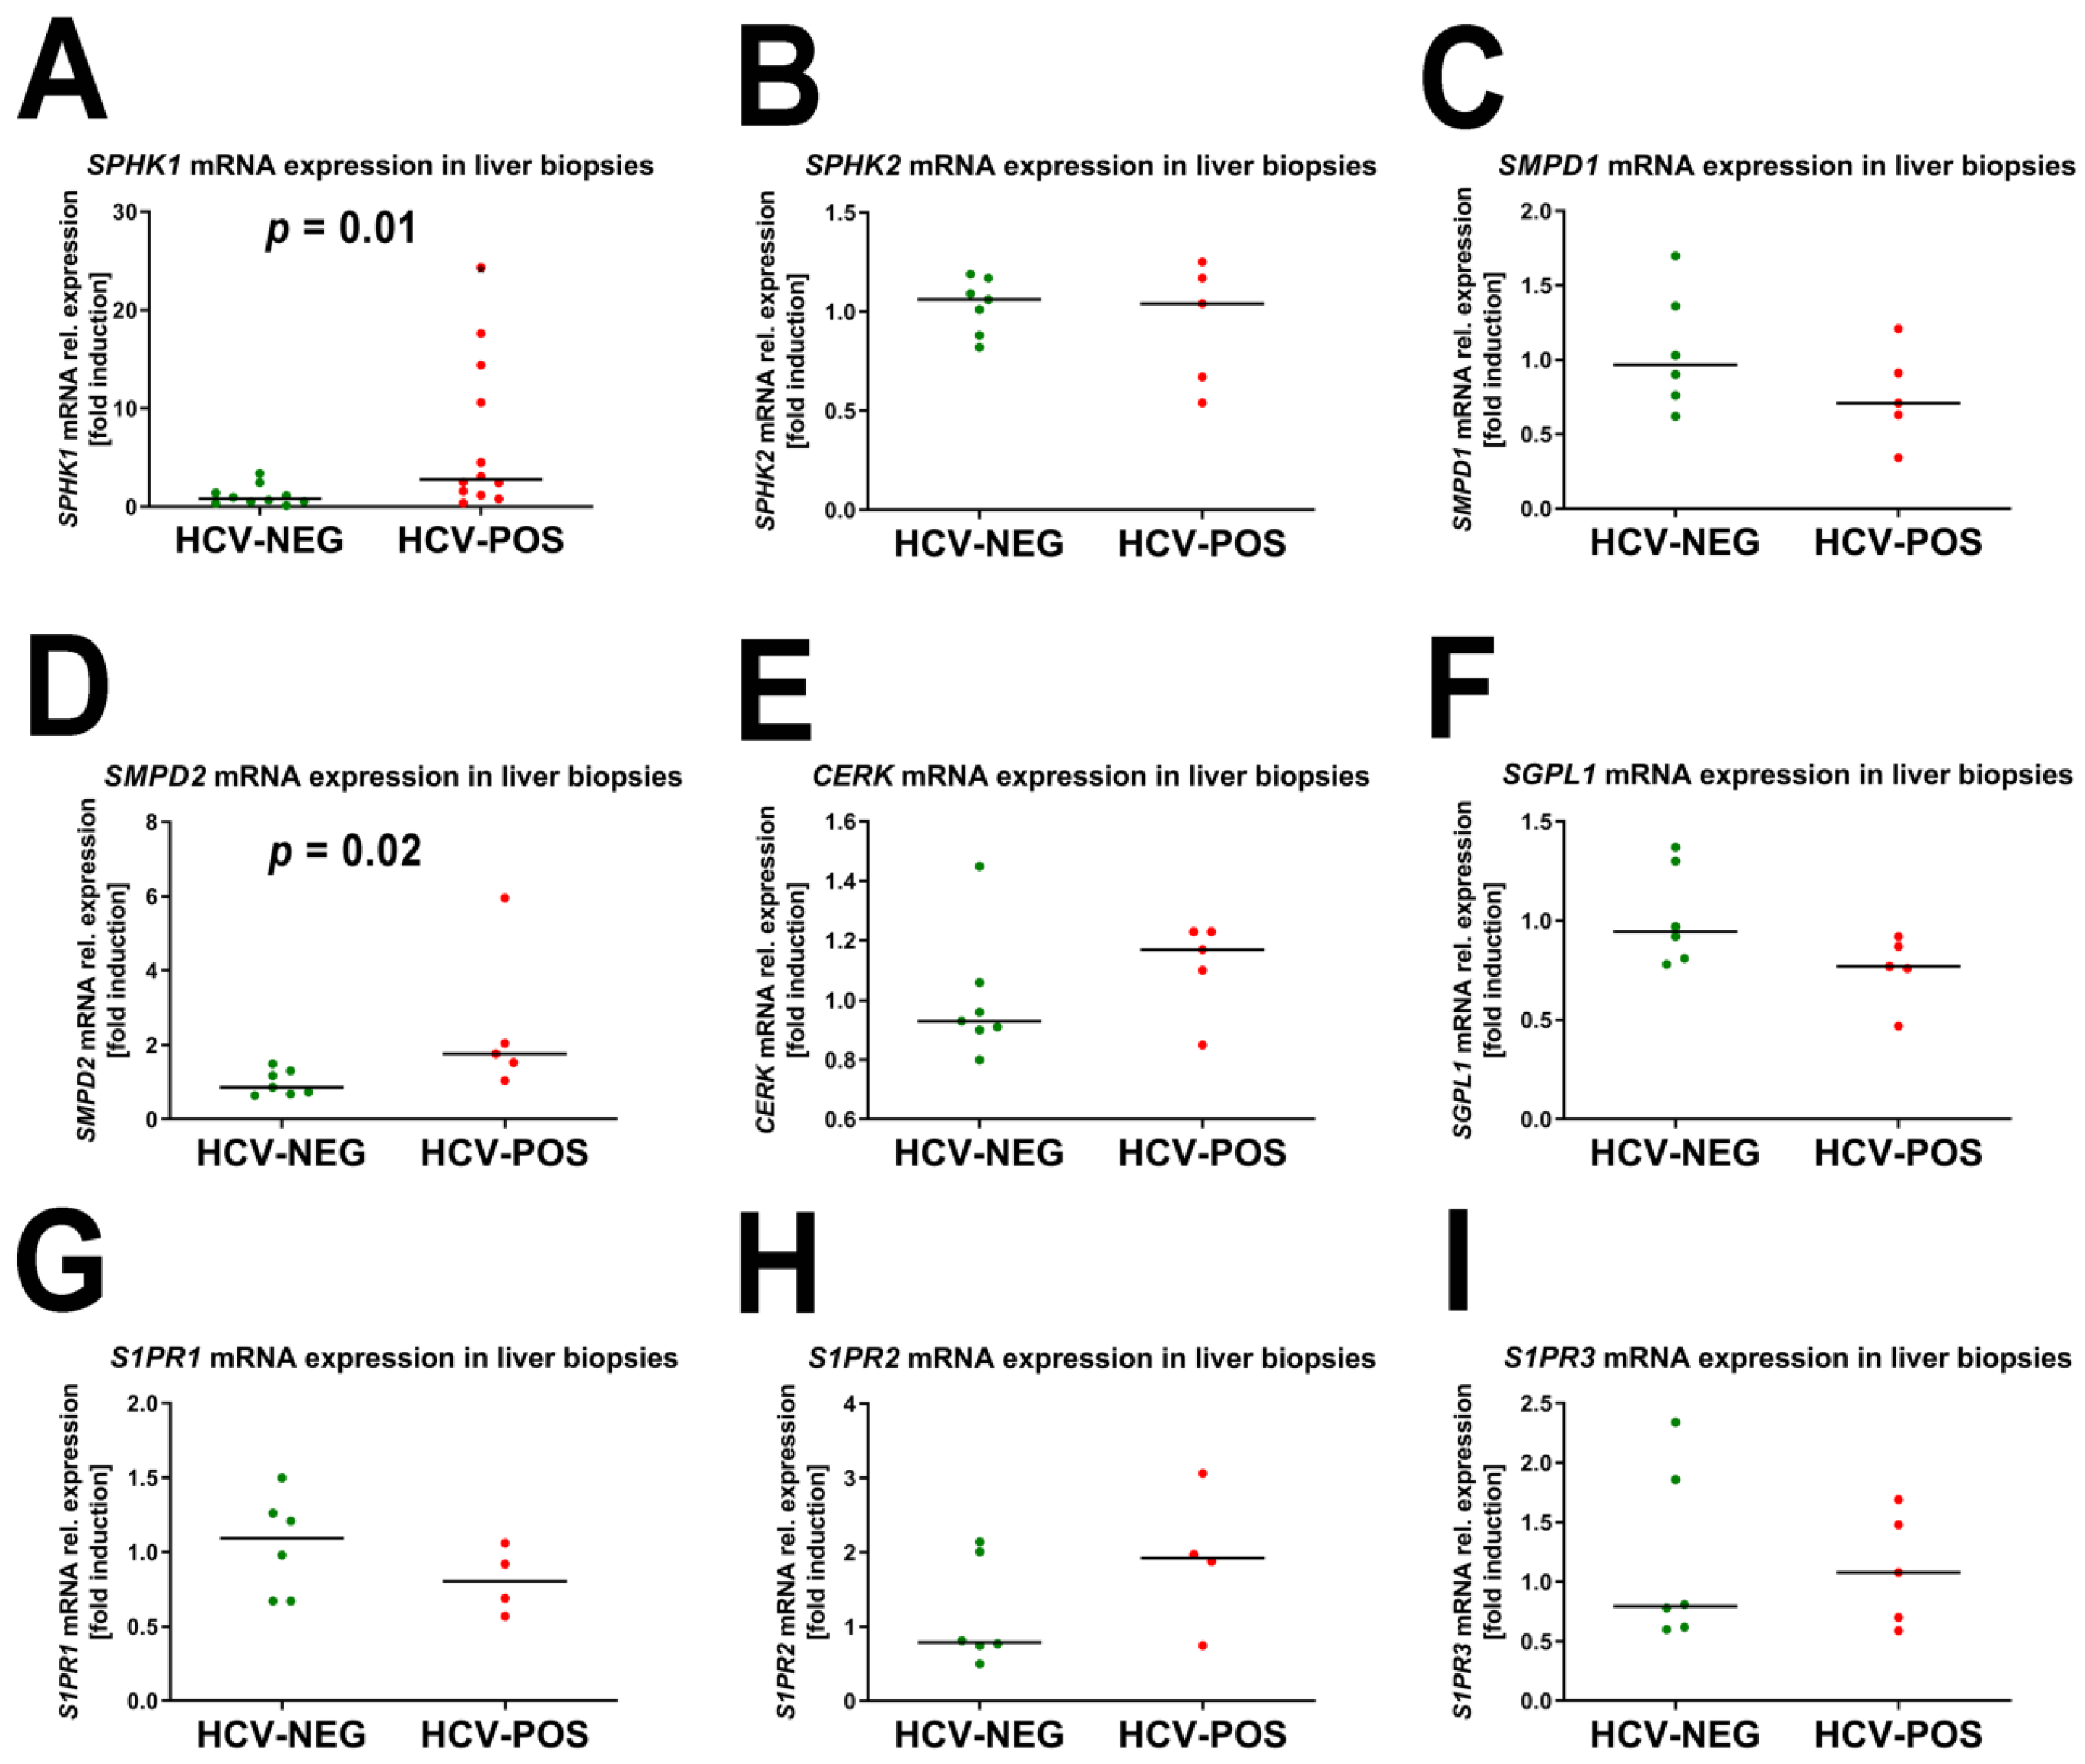
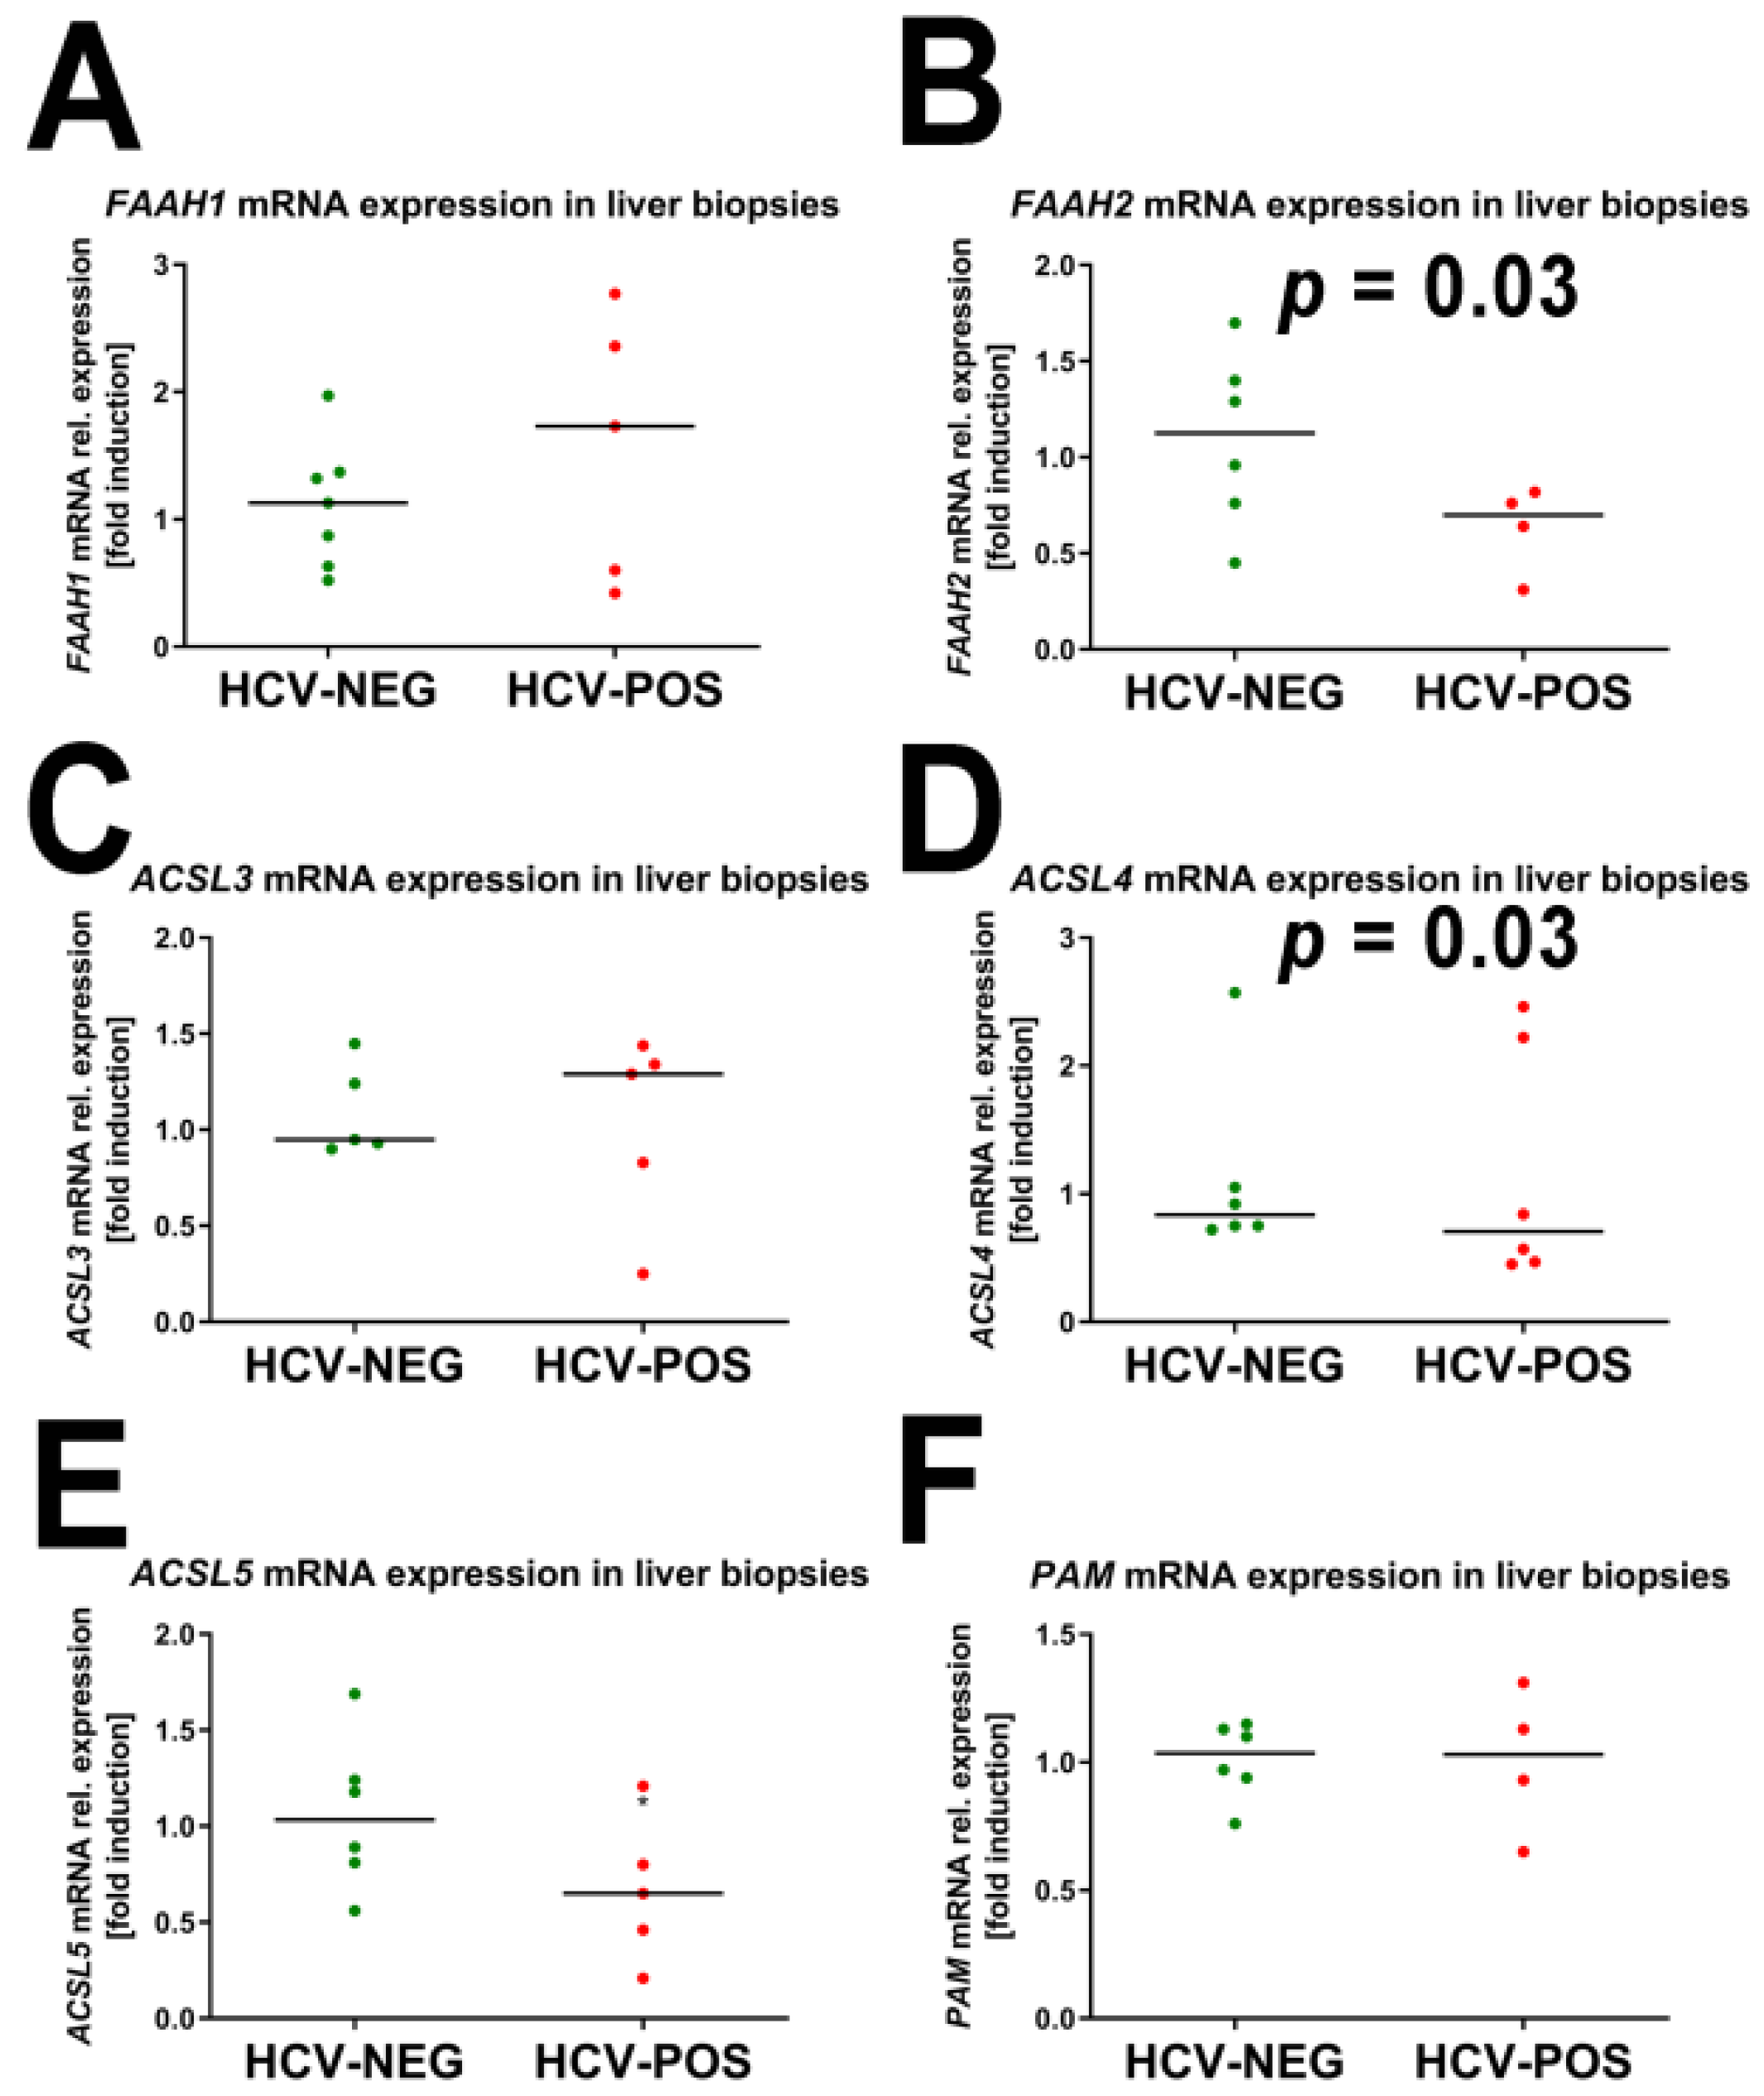
2.3. Gene Expression Analysis by Quantitative RT-PCR (qRT-PCR)
2.4. Correlation of mRNA Fold Induction with Viral Load
3. Discussion
4. Materials and Methods
4.1. Authentic Standards
4.2. Subjects and Clinical Materials
4.3. RNA Extraction and Quantitative PCR Analysis
4.4. Ultraperformance Liquid Chromatography-Electrospray Ionization-Quadrupole Time-of-Flight Mass Spectrometry (UPLC-ESI-QTOFMS)
4.5. Gas Chromatography-Mass Spectrometry (GC-MS)
4.6. Multivariate Data Analysis and Univariate Statistics
Author Contributions
Funding
Institutional Review Board Statement
Informed Consent Statement
Data Availability Statement
Conflicts of Interest
References
- Bley, H.; Schobel, A.; Herker, E. Whole Lotta Lipids-from HCV RNA Replication to the Mature Viral Particle. Int. J. Mol. Sci. 2020, 21, 2888. [Google Scholar] [CrossRef] [PubMed]
- Lupberger, J.; Croonenborghs, T.; Roca Suarez, A.A.; Van Renne, N.; Juhling, F.; Oudot, M.A.; Virzi, A.; Bandiera, S.; Jamey, C.; Meszaros, G.; et al. Combined Analysis of Metabolomes, Proteomes, and Transcriptomes of Hepatitis C Virus-Infected Cells and Liver to Identify Pathways Associated With Disease Development. Gastroenterology 2019, 157, 537–551.e9. [Google Scholar] [CrossRef] [PubMed]
- Hofmann, S.; Krajewski, M.; Scherer, C.; Scholz, V.; Mordhorst, V.; Truschow, P.; Schobel, A.; Reimer, R.; Schwudke, D.; Herker, E. Complex lipid metabolic remodeling is required for efficient hepatitis C virus replication. Biochim. Biophys. Acta Mol. Cell. Biol. Lipids 2018, 1863, 1041–1056. [Google Scholar] [CrossRef]
- Douglas, D.N.; Pu, C.H.; Lewis, J.T.; Bhat, R.; Anwar-Mohamed, A.; Logan, M.; Lund, G.; Addison, W.R.; Lehner, R.; Kneteman, N.M. Oxidative Stress Attenuates Lipid Synthesis and Increases Mitochondrial Fatty Acid Oxidation in Hepatoma Cells Infected with Hepatitis C Virus. J. Biol. Chem. 2016, 291, 1974–1990. [Google Scholar] [CrossRef]
- Felmlee, D.J.; Hafirassou, M.L.; Lefevre, M.; Baumert, T.F.; Schuster, C. Hepatitis C virus, cholesterol and lipoproteins--impact for the viral life cycle and pathogenesis of liver disease. Viruses 2013, 5, 1292–1324. [Google Scholar] [CrossRef]
- Horing, M.; Peschel, G.; Grimm, J.; Krautbauer, S.; Muller, M.; Weigand, K.; Liebisch, G.; Buechler, C. Serum Ceramide Species Are Associated with Liver Cirrhosis and Viral Genotype in Patients with Hepatitis C Infection. Int. J. Mol. Sci. 2022, 23, 9806. [Google Scholar] [CrossRef]
- Dienes, H.P.; Popper, H.; Arnold, W.; Lobeck, H. Histologic observations in human hepatitis non-A, non-B. Hepatology 1982, 2, 562–571. [Google Scholar] [CrossRef] [PubMed]
- Serfaty, L.; Andreani, T.; Giral, P.; Carbonell, N.; Chazouilleres, O.; Poupon, R. Hepatitis C virus induced hypobetalipoproteinemia: A possible mechanism for steatosis in chronic hepatitis C. J. Hepatol. 2001, 34, 428–434. [Google Scholar] [CrossRef]
- Wiesner, P.; Leidl, K.; Boettcher, A.; Schmitz, G.; Liebisch, G. Lipid profiling of FPLC-separated lipoprotein fractions by electrospray ionization tandem mass spectrometry. J. Lipid Res. 2009, 50, 574–585. [Google Scholar] [CrossRef]
- Gewaid, H.; Aoyagi, H.; Arita, M.; Watashi, K.; Suzuki, R.; Sakai, S.; Kumagai, K.; Yamaji, T.; Fukasawa, M.; Kato, F.; et al. Sphingomyelin Is Essential for the Structure and Function of the Double-Membrane Vesicles in Hepatitis C Virus RNA Replication Factories. J. Virol. 2020, 94, e01080-20. [Google Scholar] [CrossRef]
- Beyoglu, D.; Imbeaud, S.; Maurhofer, O.; Bioulac-Sage, P.; Zucman-Rossi, J.; Dufour, J.F.; Idle, J.R. Tissue metabolomics of hepatocellular carcinoma: Tumor energy metabolism and the role of transcriptomic classification. Hepatology 2013, 58, 229–238. [Google Scholar] [CrossRef] [PubMed]
- Vazquez-Fresno, R.; Llorach, R.; Perera, A.; Mandal, R.; Feliz, M.; Tinahones, F.J.; Wishart, D.S.; Andres-Lacueva, C. Clinical phenotype clustering in cardiovascular risk patients for the identification of responsive metabotypes after red wine polyphenol intake. J. Nutr. Biochem. 2016, 28, 114–120. [Google Scholar] [CrossRef] [PubMed]
- McHugh, D.; McMaster, R.S.; Pertwee, R.G.; Roy, S.; Mahadevan, A.; Razdan, R.K.; Ross, R.A. Novel compounds that interact with both leukotriene B4 receptors and vanilloid TRPV1 receptors. J. Pharmacol. Exp. Ther. 2006, 316, 955–965. [Google Scholar] [CrossRef]
- Devane, W.A.; Hanus, L.; Breuer, A.; Pertwee, R.G.; Stevenson, L.A.; Griffin, G.; Gibson, D.; Mandelbaum, A.; Etinger, A.; Mechoulam, R. Isolation and structure of a brain constituent that binds to the cannabinoid receptor. Science 1992, 258, 1946–1949. [Google Scholar] [CrossRef] [PubMed]
- Pacher, P.; Batkai, S.; Kunos, G. The endocannabinoid system as an emerging target of pharmacotherapy. Pharmacol. Rev. 2006, 58, 389–462. [Google Scholar] [CrossRef] [PubMed]
- Grevengoed, T.J.; Trammell, S.A.J.; McKinney, M.K.; Petersen, N.; Cardone, R.L.; Svenningsen, J.S.; Ogasawara, D.; Nexoe-Larsen, C.C.; Knop, F.K.; Schwartz, T.W.; et al. N-acyl taurines are endogenous lipid messengers that improve glucose homeostasis. Proc. Natl. Acad. Sci. USA 2019, 116, 24770–24778. [Google Scholar] [CrossRef]
- Carr, J.M.; Mahalingam, S.; Bonder, C.S.; Pitson, S.M. Sphingosine kinase 1 in viral infections. Rev. Med. Virol. 2013, 23, 73–84. [Google Scholar] [CrossRef]
- Bu, S.; Kapanadze, B.; Hsu, T.; Trojanowska, M. Opposite effects of dihydrosphingosine 1-phosphate and sphingosine 1-phosphate on transforming growth factor-beta/Smad signaling are mediated through the PTEN/PPM1A-dependent pathway. J. Biol. Chem. 2008, 283, 19593–19602. [Google Scholar] [CrossRef]
- Nazzaro-Porro, M. Azelaic acid. J. Am. Acad. Dermatol. 1987, 17, 1033–1041. [Google Scholar] [CrossRef]
- Hrcka Krausova, B.; Kysilov, B.; Cerny, J.; Vyklicky, V.; Smejkalova, T.; Ladislav, M.; Balik, A.; Korinek, M.; Chodounska, H.; Kudova, E.; et al. Site of Action of Brain Neurosteroid Pregnenolone Sulfate at the N-Methyl-D-Aspartate Receptor. J. Neurosci. 2020, 40, 5922–5936. [Google Scholar] [CrossRef]
- Hirata, T.; Kizuka, Y. N-Glycosylation. Adv. Exp. Med. Biol. 2021, 1325, 3–24. [Google Scholar]
- West, A.L.; Michaelson, L.V.; Miles, E.A.; Haslam, R.P.; Lillycrop, K.A.; Georgescu, R.; Han, L.; Napier, J.A.; Calder, P.C.; Burdge, G.C. Lipidomic Analysis of Plasma from Healthy Men and Women Shows Phospholipid Class and Molecular Species Differences between Sexes. Lipids 2021, 56, 229–242. [Google Scholar] [CrossRef]
- Hoeferlin, L.A.; Wijesinghe, D.S.; Chalfant, C.E. The role of ceramide-1-phosphate in biological functions. In Handbook of Experimental Pharmacology; Springer: Vienna, Austria, 2013; pp. 153–166. [Google Scholar]
- Fowler, C.J.; Jonsson, K.O.; Andersson, A.; Juntunen, J.; Jarvinen, T.; Vandevoorde, S.; Lambert, D.M.; Jerman, J.C.; Smart, D. Inhibition of C6 glioma cell proliferation by anandamide, 1-arachidonoylglycerol, and by a water soluble phosphate ester of anandamide: Variability in response and involvement of arachidonic acid. Biochem. Pharmacol. 2003, 66, 757–767. [Google Scholar] [CrossRef] [PubMed]
- Barnes, S.; Burhol, P.G.; Zander, R.; Haggstrom, G.; Settine, R.L.; Hirschowitz, B.I. Enzymatic sulfation of glycochenodeoxycholic acid by tissue fractions from adult hamsters. J. Lipid Res. 1979, 20, 952–959. [Google Scholar] [CrossRef] [PubMed]
- Perreault, M.; Gauthier-Landry, L.; Trottier, J.; Verreault, M.; Caron, P.; Finel, M.; Barbier, O. The Human UDP-glucuronosyltransferase UGT2A1 and UGT2A2 enzymes are highly active in bile acid glucuronidation. Drug. Metab. Dispos. 2013, 41, 1616–1620. [Google Scholar] [PubMed]
- Steinhilber, D.; Roth, H.J. New series of lipoxins isolated from human eosinophils. FEBS Lett. 1989, 255, 143–148. [Google Scholar] [CrossRef]
- Semmo, N.; Weber, T.; Idle, J.R.; Beyoglu, D. Metabolomics reveals that aldose reductase activity due to AKR1B10 is upregulated in hepatitis C virus infection. J. Viral Hepat. 2015, 22, 617–624. [Google Scholar] [CrossRef] [PubMed]
- Gomez-Munoz, A. Ceramide 1-phosphate/ceramide, a switch between life and death. Biochim. Biophys. Acta 2006, 1758, 2049–2056. [Google Scholar] [CrossRef]
- Pastukhov, O.; Schwalm, S.; Zangemeister-Wittke, U.; Fabbro, D.; Bornancin, F.; Japtok, L.; Kleuser, B.; Pfeilschifter, J.; Huwiler, A. The ceramide kinase inhibitor NVP-231 inhibits breast and lung cancer cell proliferation by inducing M phase arrest and subsequent cell death. Br. J. Pharmacol. 2014, 171, 5829–5844. [Google Scholar] [CrossRef]
- Meoni, G.; Lorini, S.; Monti, M.; Madia, F.; Corti, G.; Luchinat, C.; Zignego, A.L.; Tenori, L.; Gragnani, L. The metabolic fingerprints of HCV and HBV infections studied by Nuclear Magnetic Resonance Spectroscopy. Sci. Rep. 2019, 9, 4128. [Google Scholar]
- Peschel, G.; Grimm, J.; Muller, M.; Horing, M.; Krautbauer, S.; Weigand, K.; Liebisch, G.; Buechler, C. Sex-specific changes in triglyceride profiles in liver cirrhosis and hepatitis C virus infection. Lipids Health Dis. 2022, 21, 106. [Google Scholar] [CrossRef] [PubMed]
- Iannotti, F.A.; Piscitelli, F. Endocannabinoidome. In eLS; John Wiley & Sons, Ltd.: Chichester, UK, 2018. [Google Scholar]
- Maione, S.; Costa, B.; Di Marzo, V. Endocannabinoids: A unique opportunity to develop multitarget analgesics. Pain 2013, 154 (Suppl. S1), S87–S93. [Google Scholar] [CrossRef] [PubMed]
- Ryberg, E.; Larsson, N.; Sjogren, S.; Hjorth, S.; Hermansson, N.O.; Leonova, J.; Elebring, T.; Nilsson, K.; Drmota, T.; Greasley, P.J. The orphan receptor GPR55 is a novel cannabinoid receptor. Br. J. Pharmacol. 2007, 152, 1092–1101. [Google Scholar] [CrossRef] [PubMed]
- Bird, C.W.; Molton, P. The metabolism of n-decane by a Pseudomonas. Biochem. J. 1967, 104, 987–990. [Google Scholar] [CrossRef]
- Andre, R.; Guedes, R.; Lopez, J.; Serralheiro, M.L. Untargeted metabolomic study of HepG2 cells under the effect of Fucus vesiculosus aqueous extract. Rapid Commun. Mass Spectrom. 2021, 35, e9197. [Google Scholar] [CrossRef]
- Kumar, A.; Patel, S.; Bhatkar, D.; Sarode, S.C.; Sharma, N.K. A novel method to detect intracellular metabolite alterations in MCF-7 cells by doxorubicin induced cell death. Metabolomics 2021, 17, 3. [Google Scholar] [CrossRef]
- Tan, G.; Zhao, B.; Li, Y.; Liu, X.; Zou, Z.; Wan, J.; Yao, Y.; Xiong, H.; Wang, Y. Pharmacometabolomics identifies dodecanamide and leukotriene B4 dimethylamide as a predictor of chemosensitivity for patients with acute myeloid leukemia treated with cytarabine and anthracycline. Oncotarget 2017, 8, 88697–88707. [Google Scholar] [CrossRef]
- Hu, X.; Liu, Z.; Lu, Y.; Chi, X.; Han, K.; Wang, H.; Wang, Y.; Ma, L.; Xu, B. Glucose metabolism enhancement by 10-hydroxy-2-decenoic acid via the PI3K/AKT signaling pathway in high-fat-diet/streptozotocin induced type 2 diabetic mice. Food Funct. 2022, 13, 9931–9946. [Google Scholar] [CrossRef]
- Cheng, W.J.; Yang, H.T.; Chiang, C.C.; Lai, K.H.; Chen, Y.L.; Shih, H.L.; Kuo, J.J.; Hwang, T.L.; Lin, C.C. Deer Velvet Antler Extracts Exert Anti-Inflammatory and Anti-Arthritic Effects on Human Rheumatoid Arthritis Fibroblast-Like Synoviocytes and Distinct Mouse Arthritis. Am. J. Chin. Med. 2022, 50, 1617–1643. [Google Scholar] [CrossRef]
- Radman, S.; Cizmek, L.; Babic, S.; Cikos, A.M.; Coz-Rakovac, R.; Jokic, S.; Jerkovic, I. Bioprospecting of Less-Polar Fractions of Ericaria crinita and Ericaria amentacea: Developmental Toxicity and Antioxidant Activity. Mar. Drugs 2022, 20, 57. [Google Scholar] [CrossRef]
- Tao, R.; Huang, S.; Zhou, J.; Ye, L.; Shen, X.; Wu, J.; Qian, L. Neonatal Supplementation of Oleamide During Suckling Promotes Learning Ability and Memory in Adolescent Mice. J. Nutr. 2022, 152, 889–898. [Google Scholar] [CrossRef] [PubMed]
- Capo, X.; Martorell, M.; Tur, J.A.; Sureda, A.; Pons, A. 5-Dodecanolide, a Compound Isolated from Pig Lard, Presents Powerful Anti-Inflammatory Properties. Molecules 2021, 26, 7363. [Google Scholar] [CrossRef] [PubMed]
- Zhou, L.; Ding, L.; Yin, P.; Lu, X.; Wang, X.; Niu, J.; Gao, P.; Xu, G. Serum metabolic profiling study of hepatocellular carcinoma infected with hepatitis B or hepatitis C virus by using liquid chromatography-mass spectrometry. J. Proteome Res. 2012, 11, 5433–5442. [Google Scholar] [CrossRef] [PubMed]
- Sun, L.J.; Yu, J.W.; Wan, L.; Zhang, X.Y.; Shi, Y.G.; Chen, M.Y. Endocannabinoid system activation contributes to glucose metabolism disorders of hepatocytes and promotes hepatitis C virus replication. Int. J. Infect. Dis. 2014, 23, 75–81. [Google Scholar] [CrossRef] [PubMed]
- Patsenker, E.; Sachse, P.; Chicca, A.; Gachet, M.S.; Schneider, V.; Mattsson, J.; Lanz, C.; Worni, M.; de Gottardi, A.; Semmo, M.; et al. Elevated levels of endocannabinoids in chronic hepatitis C may modulate cellular immune response and hepatic stellate cell activation. Int. J. Mol. Sci. 2015, 16, 7057–7076. [Google Scholar] [CrossRef]
- Inoue, Y.; Murakami, K.; Hmwe, S.S.; Aizaki, H.; Suzuki, T. Transcriptomic comparison of human hepatoma Huh-7 cell clones with different hepatitis C virus replication efficiencies. Jpn. J. Infect. Dis. 2007, 60, 173–178. [Google Scholar]
- Bishe, B.; Syed, G.; Siddiqui, A. Phosphoinositides in the hepatitis C virus life cycle. Viruses 2012, 4, 2340–2358. [Google Scholar] [CrossRef]
- Balgoma, D.; Montero, O.; Balboa, M.A.; Balsinde, J. Calcium-independent phospholipase A2-mediated formation of 1,2-diarachidonoyl-glycerophosphoinositol in monocytes. FEBS J. 2008, 275, 6180–6191. [Google Scholar] [CrossRef]
- Oka, S.; Nakajima, K.; Yamashita, A.; Kishimoto, S.; Sugiura, T. Identification of GPR55 as a lysophosphatidylinositol receptor. Biochem. Biophys. Res. Commun. 2007, 362, 928–934. [Google Scholar] [CrossRef]
- Oka, S.; Toshida, T.; Maruyama, K.; Nakajima, K.; Yamashita, A.; Sugiura, T. 2-Arachidonoyl-sn-glycero-3-phosphoinositol: A possible natural ligand for GPR55. J. Biochem. 2009, 145, 13–20. [Google Scholar] [CrossRef]
- Falasca, M.; Ferro, R. Role of the lysophosphatidylinositol/GPR55 axis in cancer. Adv. Biol. Regul. 2016, 60, 88–93. [Google Scholar] [CrossRef] [PubMed]
- Hu, P.; Wilhelm, J.; Gerresheim, G.K.; Shalamova, L.A.; Niepmann, M. Lnc-ITM2C-1 and GPR55 Are Proviral Host Factors for Hepatitis C Virus. Viruses 2019, 11, 549. [Google Scholar] [CrossRef] [PubMed]
- Yamane, D.; Zahoor, M.A.; Mohamed, Y.M.; Azab, W.; Kato, K.; Tohya, Y.; Akashi, H. Inhibition of sphingosine kinase by bovine viral diarrhea virus NS3 is crucial for efficient viral replication and cytopathogenesis. J. Biol. Chem. 2009, 284, 13648–13659. [Google Scholar] [CrossRef]
- Hamdane, N.; Juhling, F.; Crouchet, E.; El Saghire, H.; Thumann, C.; Oudot, M.A.; Bandiera, S.; Saviano, A.; Ponsolles, C.; Roca Suarez, A.A.; et al. HCV-Induced Epigenetic Changes Associated With Liver Cancer Risk Persist After Sustained Virologic Response. Gastroenterology 2019, 156, 2313–2329.e7. [Google Scholar] [CrossRef] [PubMed]
- Zhao, S.; Si, M.; Deng, X.; Wang, D.; Kong, L.; Zhang, Q. HCV inhibits M2a, M2b and M2c macrophage polarization via HCV core protein engagement with Toll-like receptor 2. Exp. Ther. Med. 2022, 24, 522. [Google Scholar] [CrossRef] [PubMed]
- Ghosh, M.; Thangada, S.; Dasgupta, O.; Khanna, K.M.; Yamase, H.T.; Kashgarian, M.; Hla, T.; Shapiro, L.H.; Ferrer, F.A. Cell-intrinsic sphingosine kinase 2 promotes macrophage polarization and renal inflammation in response to unilateral ureteral obstruction. PLoS ONE 2018, 13, e0194053. [Google Scholar] [CrossRef]
- Panganamala, R.V.; Geer, J.C.; Cornwell, D.G. Long-chain bases in the sphingolipids of atherosclerotic human aorta. J. Lipid Res. 1969, 10, 445–455. [Google Scholar] [CrossRef]
- Morrison, W.R. Long-chain bases in the sphingolipids of bovine milk and kidney, rumen bacteria, rumen protozoa, hay and concentrate. Biochim. Biophys. Acta 1973, 316, 98–107. [Google Scholar] [CrossRef]
- Gupta, P.K.; Godec, J.; Wolski, D.; Adland, E.; Yates, K.; Pauken, K.E.; Cosgrove, C.; Ledderose, C.; Junger, W.G.; Robson, S.C.; et al. CD39 Expression Identifies Terminally Exhausted CD8+ T Cells. PLoS Pathog. 2015, 11, e1005177. [Google Scholar] [CrossRef]
- Cai, C.; Samir, J.; Pirozyan, M.R.; Adikari, T.N.; Gupta, M.; Leung, P.; Hughes, B.; Van der Byl, W.; Rizzetto, S.; Elthala, A.; et al. Identification of human progenitors of exhausted CD8(+) T cells associated with elevated IFN-gamma response in early phase of viral infection. Nat. Commun. 2022, 13, 7543. [Google Scholar] [CrossRef]
- Gupta, P.; Kadamberi, I.P.; Mittal, S.; Tsaih, S.W.; George, J.; Kumar, S.; Vijayan, D.K.; Geethadevi, A.; Parashar, D.; Topchyan, P.; et al. Tumor Derived Extracellular Vesicles Drive T Cell Exhaustion in Tumor Microenvironment through Sphingosine Mediated Signaling and Impacting Immunotherapy Outcomes in Ovarian Cancer. Adv. Sci. 2022, 9, e2104452. [Google Scholar] [CrossRef]
- Olesch, C.; Sirait-Fischer, E.; Berkefeld, M.; Fink, A.F.; Susen, R.M.; Ritter, B.; Michels, B.E.; Steinhilber, D.; Greten, F.R.; Savai, R.; et al. S1PR4 ablation reduces tumor growth and improves chemotherapy via CD8+ T cell expansion. J. Clin. Investig. 2020, 130, 5461–5476. [Google Scholar] [CrossRef] [PubMed]
- Beyoglu, D.; Krausz, K.W.; Martin, J.; Maurhofer, O.; Dorow, J.; Ceglarek, U.; Gonzalez, F.J.; Dufour, J.F.; Idle, J.R. Disruption of tumor suppressor gene Hint1 leads to remodeling of the lipid metabolic phenotype of mouse liver. J. Lipid Res. 2014, 55, 2309–2319. [Google Scholar] [CrossRef] [PubMed]
- Pabst, T.; Kortz, L.; Fiedler, G.M.; Ceglarek, U.; Idle, J.R.; Beyoglu, D. The plasma lipidome in acute myeloid leukemia at diagnosis in relation to clinical disease features. BBA Clin. 2017, 7, 105–114. [Google Scholar] [CrossRef] [PubMed]
- Beyoglu, D.; Park, E.J.; Quinones-Lombrana, A.; Dave, A.; Parande, F.; Pezzuto, J.M.; Idle, J.R. Addition of grapes to both a standard and a high-fat Western pattern diet modifies hepatic and urinary metabolite profiles in the mouse. Food Funct. 2022, 13, 8489–8499. [Google Scholar] [CrossRef]
- Wang, M.; Keogh, A.; Treves, S.; Idle, J.R.; Beyoglu, D. The metabolomic profile of gamma-irradiated human hepatoma and muscle cells reveals metabolic changes consistent with the Warburg effect. PeerJ 2016, 4, e1624. [Google Scholar] [CrossRef]


| Metabolites Upregulated in HCV+ Patients | m/z | Adducts | Max Fold Up in HCV-Pos |
| Azelaic acid | 171.1033 | M + H − H2O | 2.7 |
| Decanamide (10:0) | 172.1686 | M + H | 2.8 |
| Dodecanamide (12:0) | 200.2004 | M + H | 2.3 |
| Palmitamide (16:0) | 255.2561n | M + H, M + Na | 7.1 |
| Palmitoleamide (16:1) | 253.2404n | M + H, M + Na | 14.3 |
| Stearamide (18:0) | 306.2750 | M + Na | 81.3 |
| Oleamide (18:1) | GC-MS | 8.0 | |
| Linoleamide (18:2) | 279.2559n | M + H, M + Na | 20.0 |
| (5Z,8Z,11Z,14Z)-Eicosatetraenamide (20:4) | 303.2537 | M + H, M + Na | 11.0 |
| LTB4-ethanolamide (20:4) | 402.2630 | M + Na | 4.6 |
| Anandamide (20:4) | 362.2118 | M + Na | 4.3 |
| N-Linoleoyltaurine (18:2) | 388.2509 | M + H | 2.0 |
| Sphingosine 1-phosphate d18:1 | 362.2454 | M + H − H2O | 3.1 |
| Sphingosine 1-phosphate d16:1 | 352.2252 | M + H | 2.0 |
| Sphingosine 1-phosphate d19:1 | 416.2545 | M + Na | 5.3 |
| Sphinganine 1-phosphate d18:0 | 382.2680 | M + H | 2.0 |
| Pregnenolone sulfate | 379.1956 | M + H − H2O | 2.6 |
| Dolichol phosphate | 463.2966 | M + Na | 3.0 |
| PG(14:1(9Z)/12:0) | 659.3857 | M + Na | 2.6 |
| PS(O-16:0/12:0) | 666.4694 | M + H | 3.7 |
| PS(22:0/22:0) | 904.7051 | M + H | 446 |
| Metabolites Downregulated in HCV+ Patients | m/z | Adducts | Max Fold Down in HCV-Pos |
| TG(66:17) | 1047.7374 | M + Na | 4.2 |
| TG(42:1) | 721.6286 | M + H | 18.0 |
| PG(38:9) | 771.4636 | M + H − H2O | 2.6 |
| PC(16.1(9Z)/2:0) | 535.3254n | M + H, M + H − H2O | 3.1 |
| PC(16:0/3:0) | 550.3495 | M − H | 2.5 |
| PS(13:0/18:4) | 736.4173 | M + Na | 4.2 |
| PS(O-16:0/20:0) | 812.5563 | M + Cl | 12.3 |
| PE(6:0/6:0) | 412.2115 | M + H | 30.5 |
| PE(18:4(6Z,9Z,12Z,15Z)/18:4(6Z,9Z,12Z,15Z) | 754.4474 | M + Na | 2.0 |
| LPC(3:1(2E)) | 312.1205 | M + H | ∞ |
| LPC(16:0) | 494.3204 | M − H | 2.4 |
| LPC(P-19:1(12Z)) | 554.3234 | M + Cl | 2.1 |
| LPC(20:2(11Z,14Z)) | 570.3500 | M + Na | 1.5 |
| LPS(17:1(9Z)) | 492.2705 | M + H − H2O | 1011 |
| LPS(22:2(13Z,16Z)) | 600.3262 | M + Na | 2.0 |
| LPE(18:3(6Z,9Z,12Z)) | 458.2696 | M + H − H2O | 347 |
| LPA(17:1(9Z)) | 445.2295 | M + Na | 4.7 |
| LPA(17:2(9Z,12Z) | 455.1969 | M + Cl | 3.5 |
| LPA(20:3(8Z,11Z,14Z)) | 483.2455 | M + Na | 159 |
| LPA(22:1(11Z)) | 515.3127 | M + Na | 2.0 |
| LPA(22:4(7Z,10Z,13Z,16Z)) | 509.2618 | M + Na | 9.9 |
| LPG(22:4(5Z,8Z,11Z,14Z)) | 555.2697 | M + Na | 48.6 |
| LPI(20:2(11Z,14Z)) | 625.3370 | M + H | ∞ |
| LPI(20:5(5Z,8Z,11Z,14Z,17Z)) | 619.2895 | M + H | 461 |
| LPI(21:0) | 643.3766 | M + H | 3.3 |
| LPI(22:4(7Z,10Z,13Z,16Z)) | 631.3230 | M + H − H2O | 161 |
| LPI(22:6(4Z,7Z,10Z,13Z,16Z,19Z)) | 645.3042 | M + H | 2879 |
| N-Acetylsphingosine 1-phosphate | 444.2489 | M + Na | ∞ |
| Anandamide O-phosphate | 410.2431 | M + H − H2O | 2.4 |
| Glycochenodeoxycholic acid 7-sulfate | 552.2596 | M + Na | 184 |
| Cholic acid glucuronide | 585.3295 | M + H | 5.4 |
| Lipoxin C4 | 640.2959 | M − H | 2.5 |
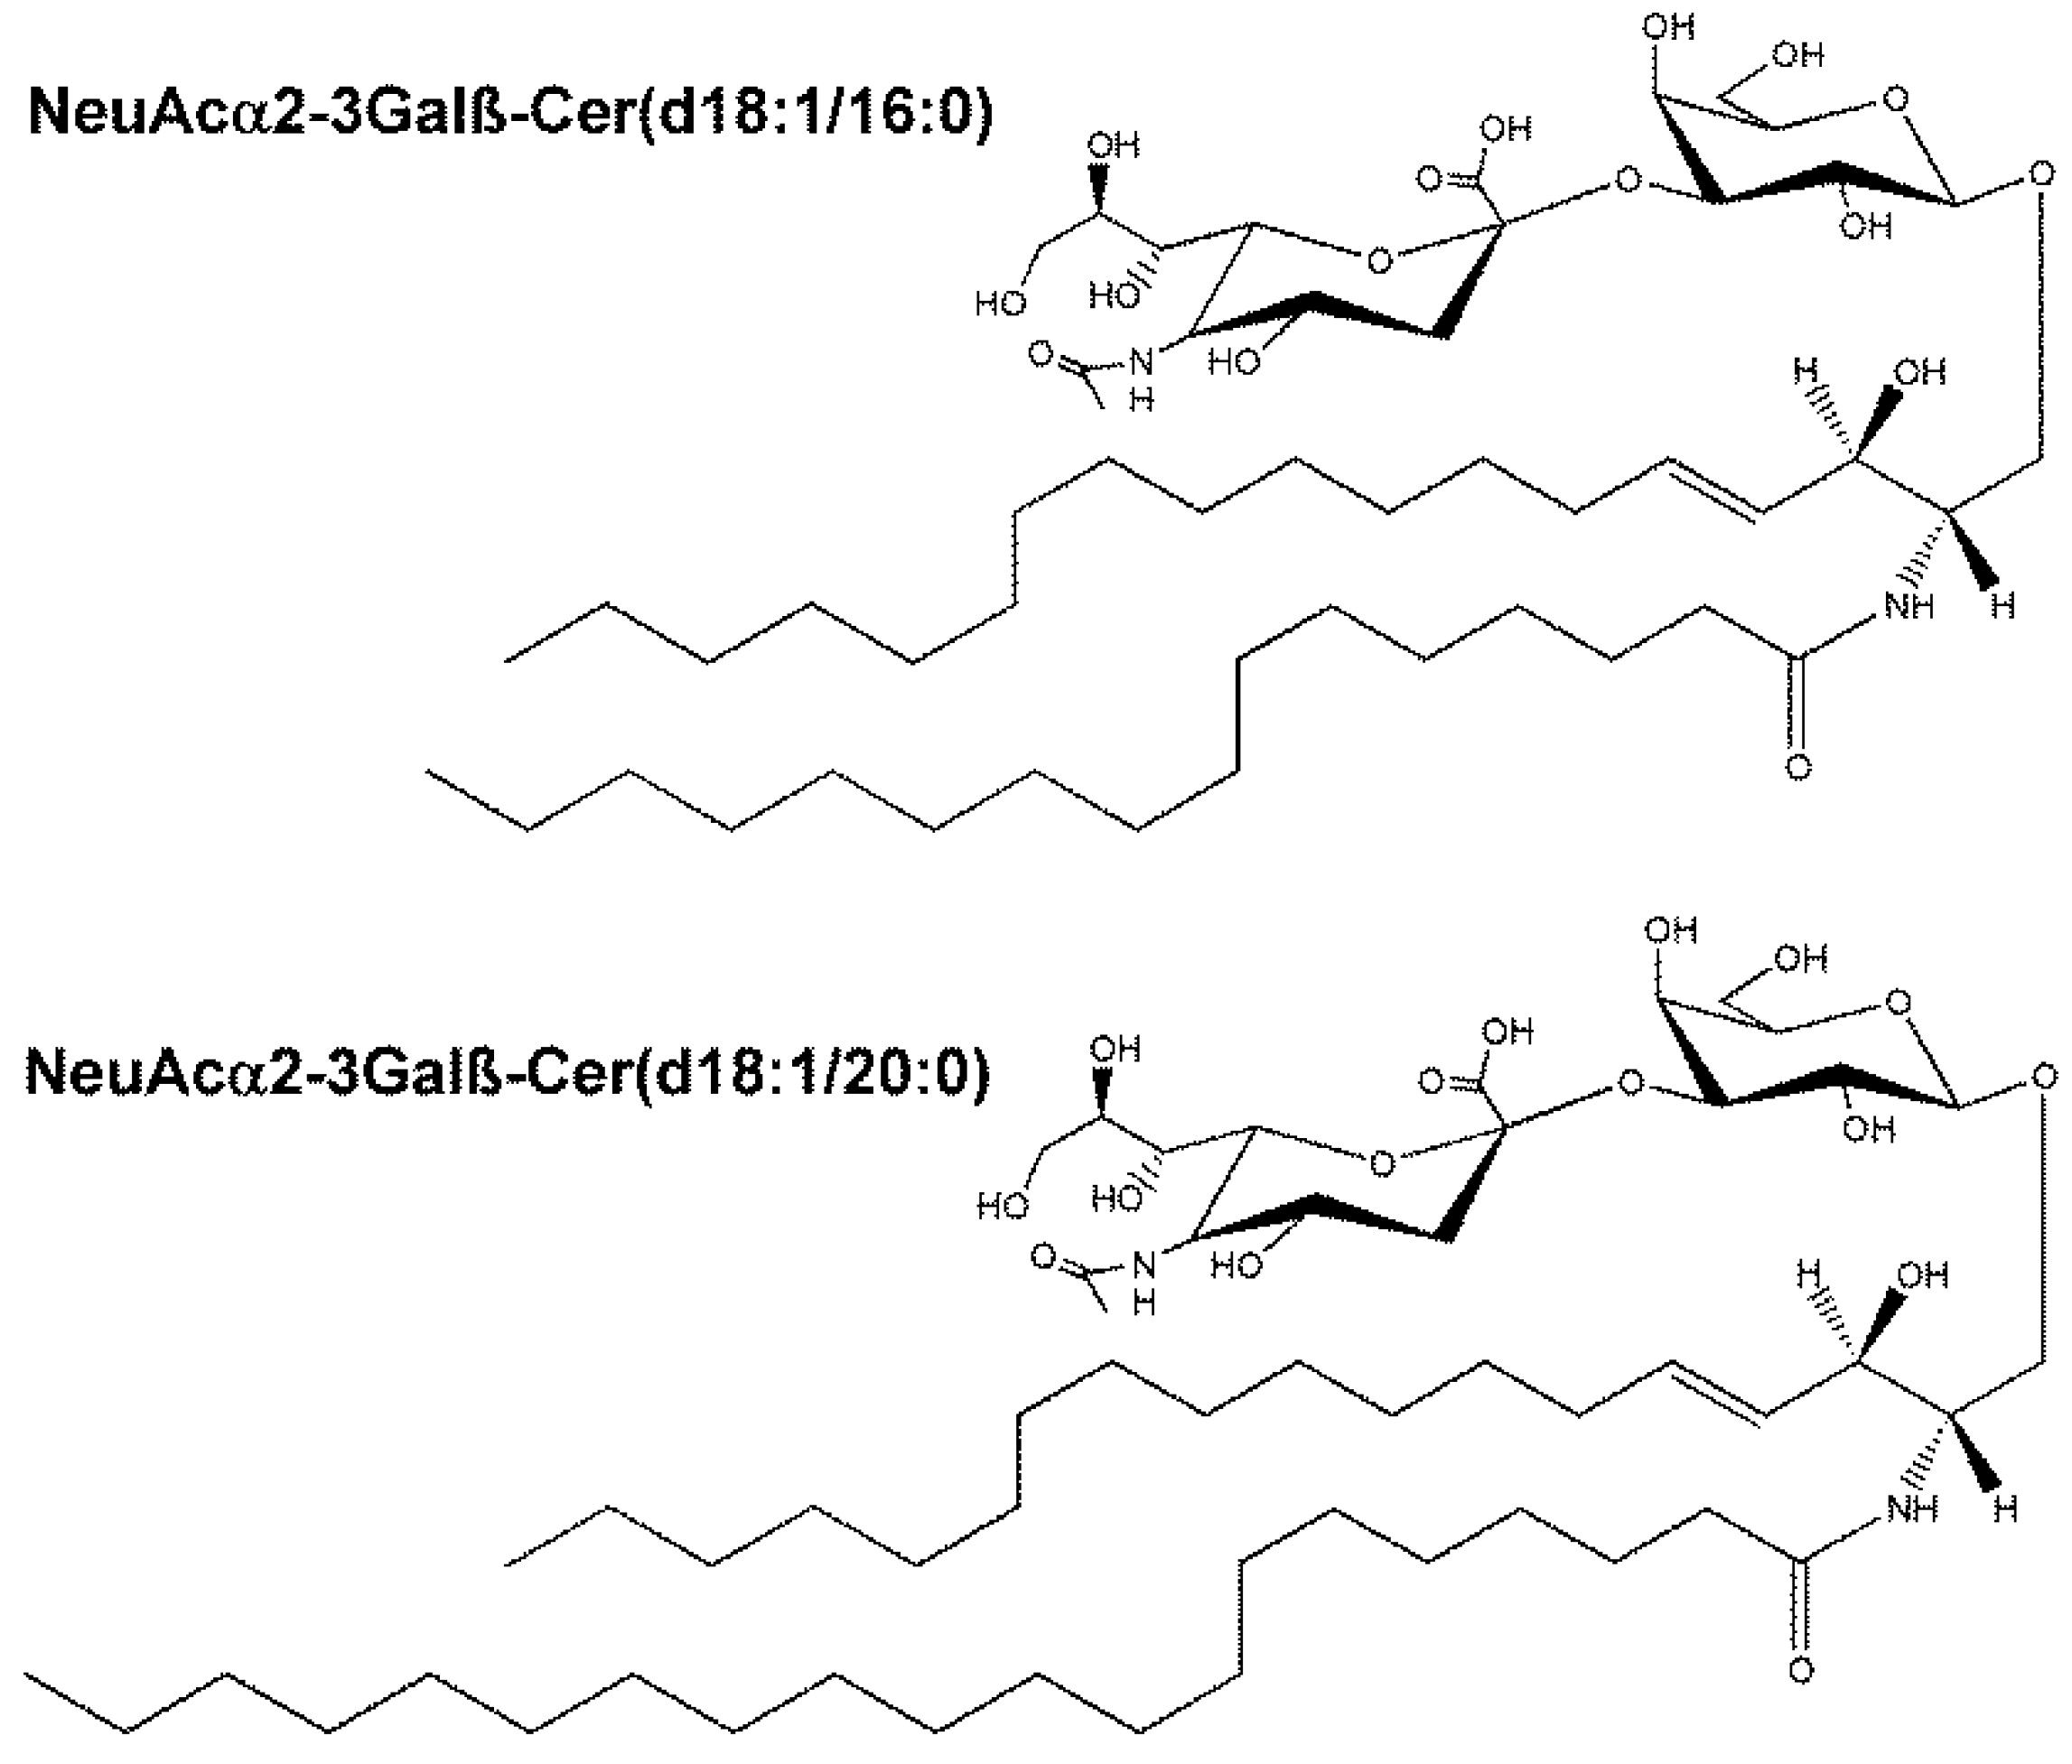
| NeuAcα2-3Galβ-Cer(d18:1/16:0) | 1013.6566 | M + Na | 3.4 |
| NeuAcα2-3Galβ-Cer(d18:1/20:0) | 1069.7198 | M + Na | 2.8 |
Disclaimer/Publisher’s Note: The statements, opinions and data contained in all publications are solely those of the individual author(s) and contributor(s) and not of MDPI and/or the editor(s). MDPI and/or the editor(s) disclaim responsibility for any injury to people or property resulting from any ideas, methods, instructions or products referred to in the content. |
© 2023 by the authors. Licensee MDPI, Basel, Switzerland. This article is an open access article distributed under the terms and conditions of the Creative Commons Attribution (CC BY) license (https://creativecommons.org/licenses/by/4.0/).
Share and Cite
Beyoğlu, D.; Schwalm, S.; Semmo, N.; Huwiler, A.; Idle, J.R. Hepatitis C Virus Infection Upregulates Plasma Phosphosphingolipids and Endocannabinoids and Downregulates Lysophosphoinositols. Int. J. Mol. Sci. 2023, 24, 1407. https://doi.org/10.3390/ijms24021407
Beyoğlu D, Schwalm S, Semmo N, Huwiler A, Idle JR. Hepatitis C Virus Infection Upregulates Plasma Phosphosphingolipids and Endocannabinoids and Downregulates Lysophosphoinositols. International Journal of Molecular Sciences. 2023; 24(2):1407. https://doi.org/10.3390/ijms24021407
Chicago/Turabian StyleBeyoğlu, Diren, Stephanie Schwalm, Nasser Semmo, Andrea Huwiler, and Jeffrey R. Idle. 2023. "Hepatitis C Virus Infection Upregulates Plasma Phosphosphingolipids and Endocannabinoids and Downregulates Lysophosphoinositols" International Journal of Molecular Sciences 24, no. 2: 1407. https://doi.org/10.3390/ijms24021407
APA StyleBeyoğlu, D., Schwalm, S., Semmo, N., Huwiler, A., & Idle, J. R. (2023). Hepatitis C Virus Infection Upregulates Plasma Phosphosphingolipids and Endocannabinoids and Downregulates Lysophosphoinositols. International Journal of Molecular Sciences, 24(2), 1407. https://doi.org/10.3390/ijms24021407