
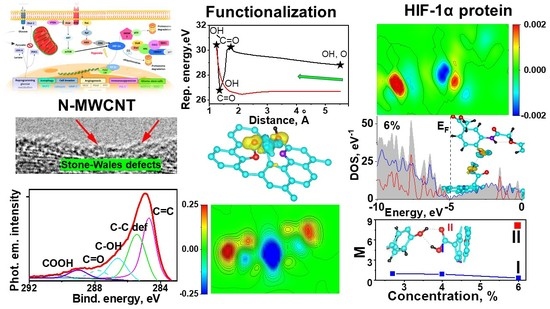
Carboxyl Functionalization of N-MWCNTs with Stone–Wales Defects and Possibility of HIF-1α Wave-Diffusive Delivery

 ,
, 
 ,
, 
Abstract
1. Introduction
2. Results and Discussion
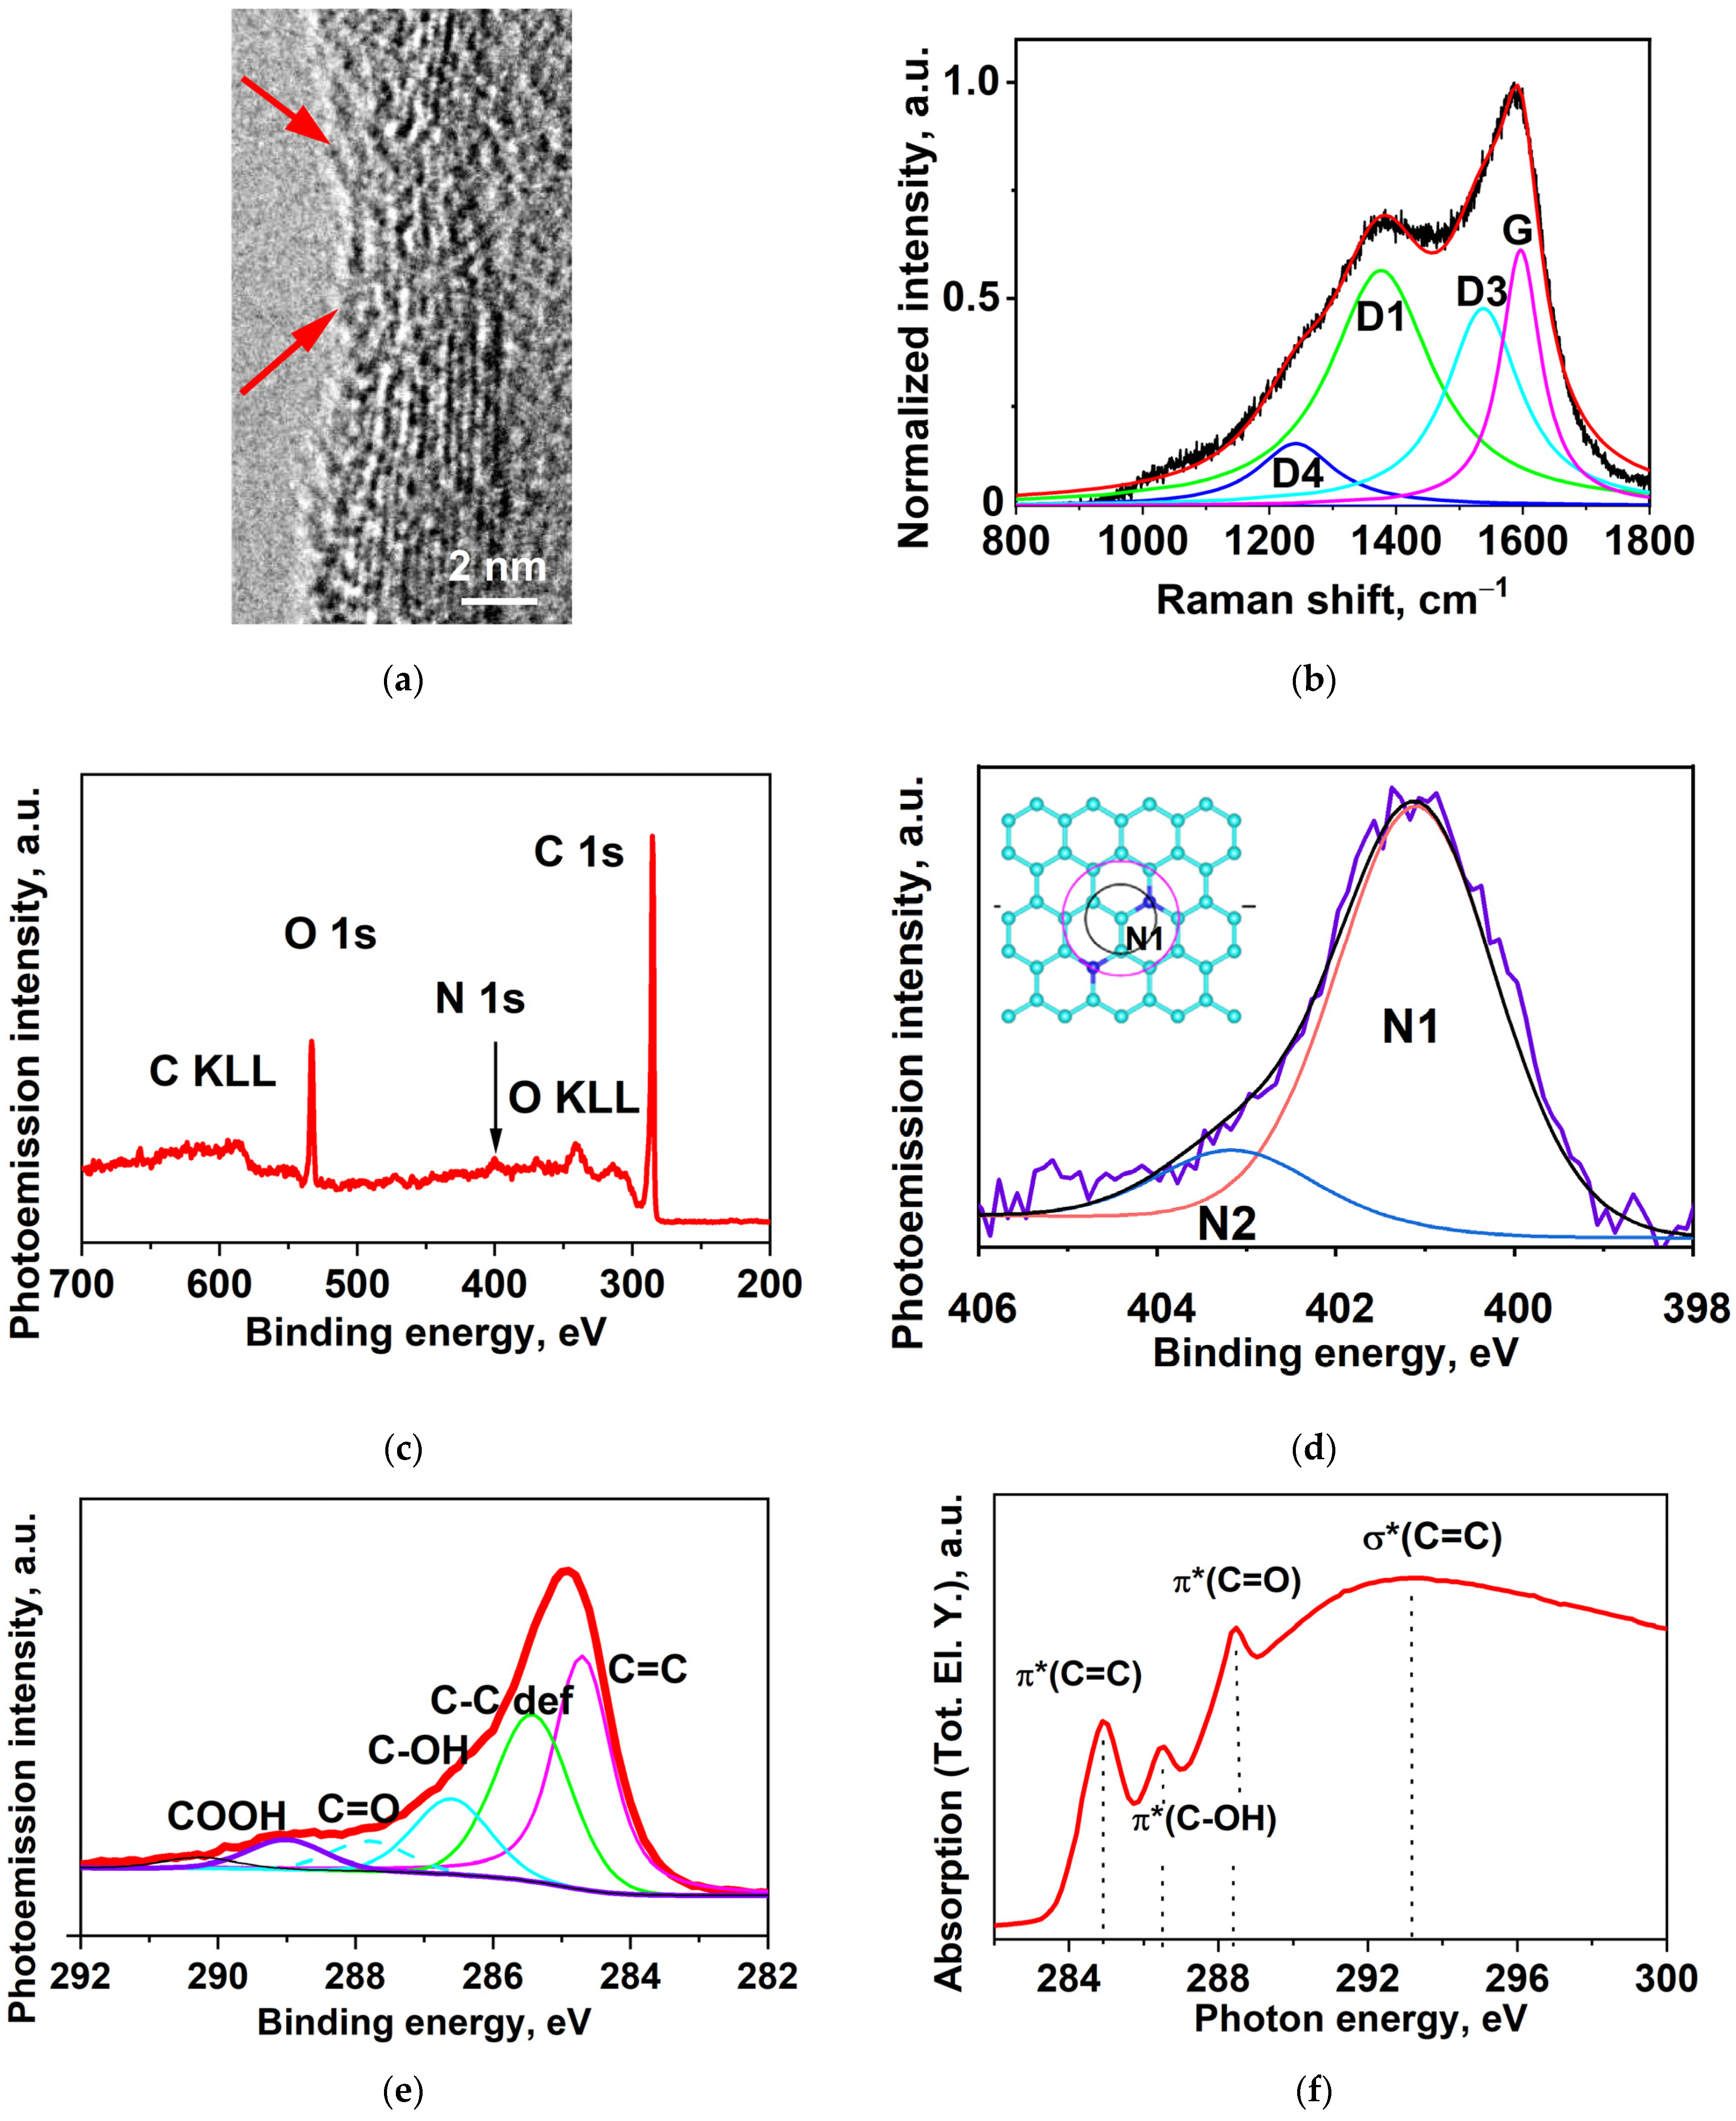
2.1. High-Resolution Transmission Electron Microscopy (HRTEM)
2.2. Raman Spectroscopy
2.3. XPS (X-ray Photoelectron Spectroscopy)
2.4. Near-Edge X-ray Absorption Fine Structure (NEXAFS)
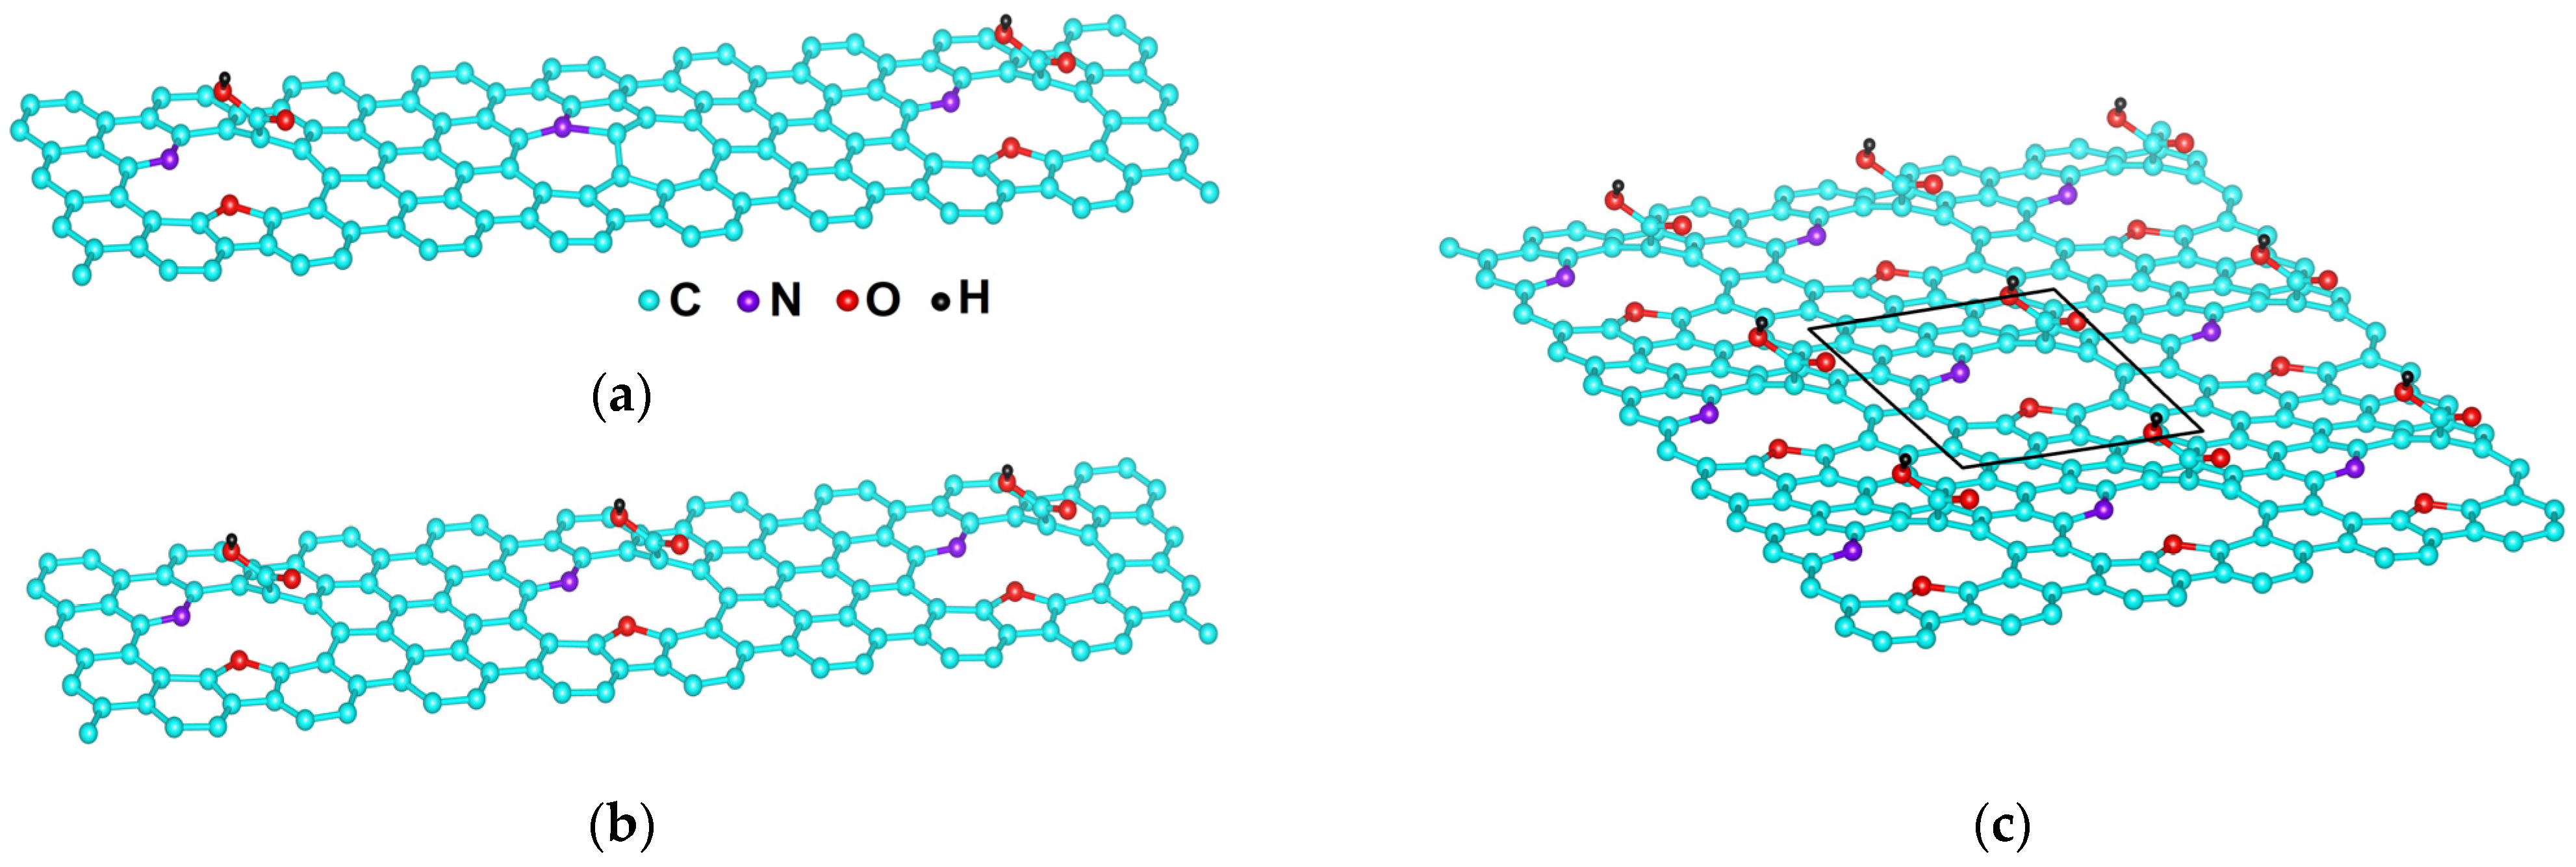
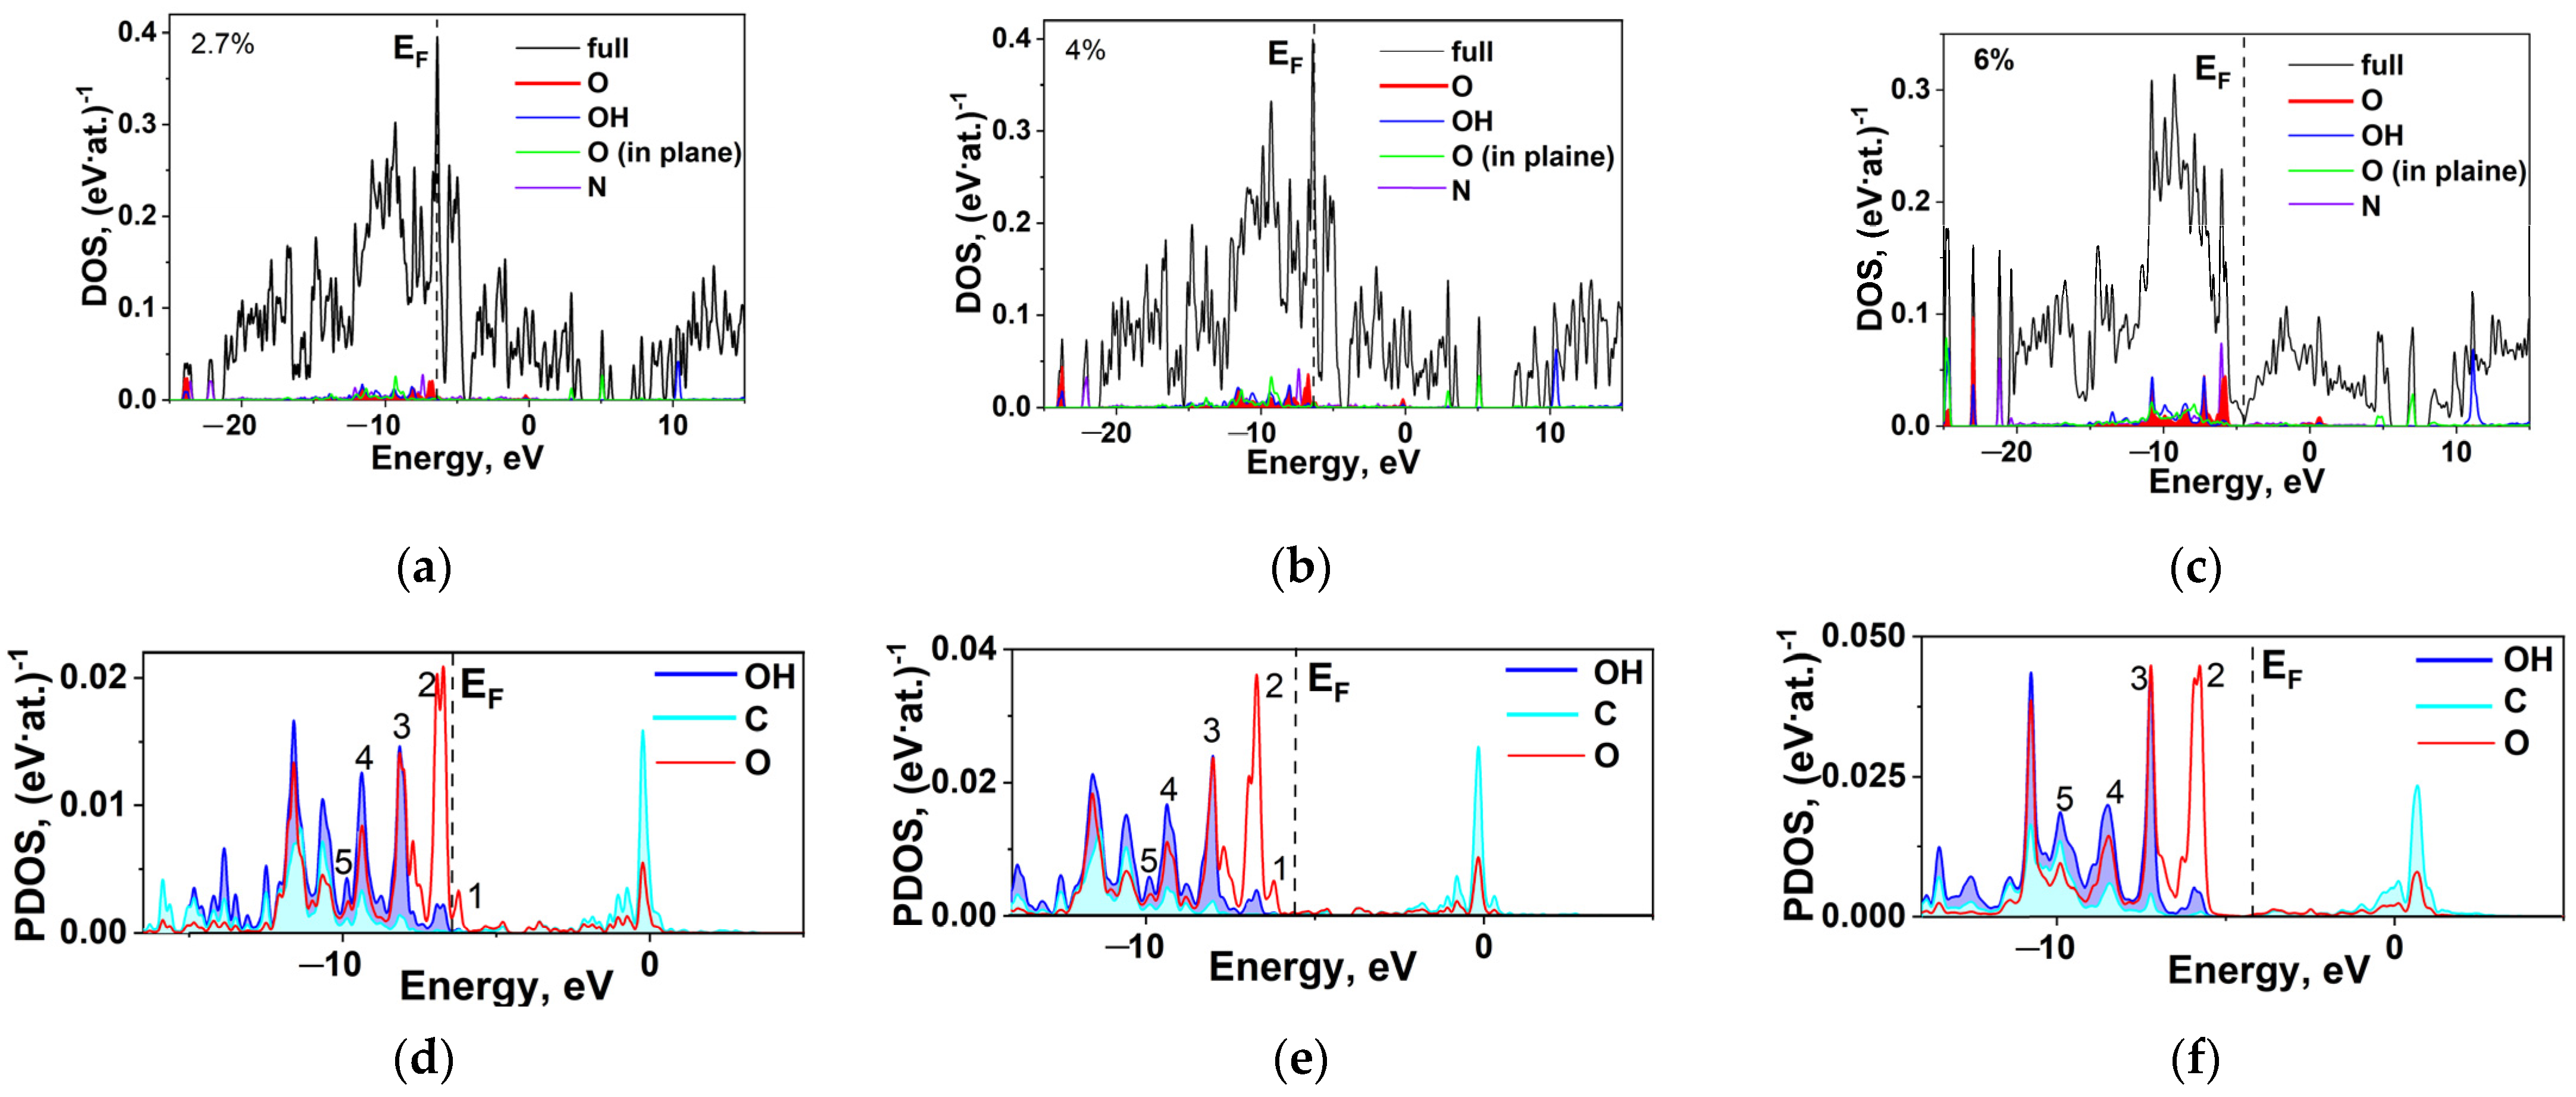
2.5. DFT Calculation of Carboxyl Functionalization and Its Enhancement with Stone–Wales Defects
2.6. Hybridization and Wave-Diffusion Drug Delivery
3. Materials and Methods
4. Conclusions
Supplementary Materials
Author Contributions
Funding
Institutional Review Board Statement
Informed Consent Statement
Acknowledgments
Conflicts of Interest
References
- Gerasimenko, A.Y.; Kitsyuk, E.; Kurilova, U.E.; Suetina, I.A.; Russu, L.; Mezentseva, M.V.; Markov, A.; Narovlyansky, A.N.; Kravchenko, S.; Selishchev, S.V.; et al. Interfaces Based on Laser-Structured Arrays of Carbon Nanotubes with Albumin for Electrical Stimulation of Heart Cell Growth. Polymers 2022, 14, 1866. [Google Scholar] [CrossRef] [PubMed]
- Gerasimenko, A.Y.; Kurilova, U.E.; Savelyev, M.S.; Murashko, D.T.; Glukhova, O.E. Laser fabrication of composite layers from biopolymers with branched 3D networks of single-walled carbon nanotubes for cardiovascular implants. Compos. Struct. 2021, 260, 113517. [Google Scholar] [CrossRef]
- Gerasimenko, A.Y.; Zhurbina, N.N.; Cherepanova, N.G.; Semak, A.E.; Zar, V.V.; Fedorova, Y.O.; Eganova, E.M.; Pavlov, A.A.; Telyshev, D.V.; Selishchev, S.V.; et al. Frame Coating of Single-Walled Carbon Nanotubes in Collagen on PET Fibers for Artificial Joint Ligaments. Int. J. Mol. Sci. 2020, 21, 6163. [Google Scholar] [CrossRef] [PubMed]
- Murjani, B.O.; Kadu, P.S.; Bansod, M.; Vaidya, S.S.; Yadav, M.D. Carbon nanotubes in biomedical applications: Current status, promises, and challenges. Carbon Lett. 2022, 32, 1207–1226. [Google Scholar] [CrossRef]
- Cheng, Z.; Li, M.; Dey, R.; Chen, Y. Nanomaterials for cancer therapy: Current progress and perspectives. J. Hematol. Oncol. 2021, 14, 85. [Google Scholar] [CrossRef]
- Beg, S.; Rahman, M.; Jain, A.; Saini, S.; Hasnain, M.S.; Swain, S.; Imam, S.; Kazmi, I.; Akhter, S. Emergence in the functionalized carbon nanotubes as smart nanocarriers for drug delivery applications. Fuller. Graphenes Nanotub. 2018, 105, 33. [Google Scholar]
- Bura, C.; Mocan, T.; Grapa, C.; Mocan, L. Carbon Nanotubes-Based Assays for Cancer Detection and Screening. Pharmaceutics 2022, 14, 781. [Google Scholar] [CrossRef]
- Gulbake, A.S.; Jain, A.; Shilpi, S.; Kumar, P. Mannosylated multiwalled carbon nanotubes assisted artesunate delivery for cerebral malaria: Multiwalled carbon nanotubes assisted artesunate delivery. Int. J. Appl. Pharm. 2019, 11, 24–30. [Google Scholar] [CrossRef]
- Sadr Karimi, S.; Pante, N. Carbon nanotubes as molecular transporters to study a new mechanism for molecular entry into the cell nucleus using actin polymerization force. PLoS ONE 2019, 14, e0221562. [Google Scholar] [CrossRef]
- Wang, Y.; Wang, C.; Jia, Y.; Cheng, X.; Lin, Q.; Zhu, M.; Lu, Y.; Ding, L.; Weng, Z.; Wu, K. Oxygen-Carbon Nanotubes as a Chemotherapy Sensitizer for Paclitaxel in Breast Cancer Treatment. PLoS ONE 2014, 9, e104209. [Google Scholar] [CrossRef]
- Bartholomeusz, G.; Cherukuri, P.; Kingston, J.; Cognet, L.; Lemos, R.; Leeuw, T.K.; Gumbiner-Russo, L.; Weisman, R.B.; Powis, G. In Vivo Therapeutic Silencing of Hypoxia-Inducible Factor 1 Alpha (HIF-1α) Using Single-Walled Carbon Nanotubes Noncovalently Coated with siRNA. Nano Res. 2009, 2, 279–291. [Google Scholar] [CrossRef] [PubMed]
- Giaccia, A.; Siim, B.G.; Johnson, R.S. HIF-1 as a target for drug development. Nat. Rev. Drug Discov 2003, 2, 803–811. [Google Scholar] [CrossRef] [PubMed]
- Pang, L.; Tian, P.; Cui, X.; Wu, X.; Zhao, X.; Wang, H.; Wang, D.; Pan, H. In Situ Photo-Cross-Linking Hydrogel Accelerates Diabetic Wound Healing through Restored Hypoxia-Inducible Factor 1-Alpha Pathway and Regulated Inflammation. ACS Appl. Mater. Interfaces 2021, 13, 29363–29379. [Google Scholar] [CrossRef] [PubMed]
- Zeng, C.Y.; Wang, X.F.; Hua, F.Z. HIF-1α in Osteoarthritis: From Pathogenesis to Therapeutic Implications. Front. Pharmacol. 2022, 13, 927126. [Google Scholar] [CrossRef] [PubMed]
- Hutami, I.R.; Izawa, T.; Khurel-Ochir, T.; Sakamaki, T.; Iwasa, A.; Tanaka, E. Macrophage Motility in Wound Healing Is Regulated by HIF-1α via S1P Signaling. Int. J. Mol. Sci. 2021, 22, 8992. [Google Scholar] [CrossRef] [PubMed]
- Chudoba, D.; Jażdżewska, M.; Łudzik, K.; Wołoszczuk, S.; Juszyńska-Gałązka, E.; Kościński, M. Description of Release Process of Doxorubicin from Modified Carbon Nanotubes. Int. J. Mol. Sci. 2021, 22, 12003. [Google Scholar] [CrossRef] [PubMed]
- Tan, J.M.; Bullo, S.; Fakurazi, S.; Hussein, M.Z. Preparation, characterisation and biological evaluation of biopolymer-coated multi-walled carbon nanotubes for sustained-delivery of silibinin. Sci. Rep. 2020, 10, 16941. [Google Scholar] [CrossRef] [PubMed]
- Prosolov, K.A.; Komarova, E.G.; Kazantseva, E.A.; Lozhkomoev, A.S.; Kazantsev, S.O.; Bakina, O.V.; Mishina, M.V.; Zima, A.P.; Krivoshchekov, S.V.; Khlusov, I.A.; et al. UMAOH Calcium Phosphate Coatings Designed for Drug Delivery: Vancomycin, 5-Fluorouracil, Interferon α-2b Case. Materials 2022, 15, 4643. [Google Scholar] [CrossRef]
- Lotfi, M.; Morsali, A.; Bozorgmehr, M.R. Comprehensive quantum chemical insight into the mechanistic understanding of the surface functionalization of carbon nanotube as a nanocarrier with cladribine anticancer drug. Appl. Surf. Sci. 2018, 462, 720–729. [Google Scholar] [CrossRef]
- Lari, H.; Morsali, A.; Herav, M. The prediction of COOH functionalized carbon nanotube application in melphalan drug delivery. Nanosyst. Phys. Chem. Math. 2019, 10, 438–446. [Google Scholar] [CrossRef]
- Karimzadeh, S.; Safaei, B.; Jen, T.-C. Theorical investigation of adsorption mechanism of doxorubicin anticancer drug on the pristine and functionalized single-walled carbon nanotube surface as a drug delivery vehicle: A DFT study. J. Mol. Liq. 2021, 322, 114890. [Google Scholar] [CrossRef]
- Nouara, A.; Wu, Q.; Li, Y.; Tang, M.; Wang, H.; Zhaod, Y.; Wang, D. Carboxylic acid functionalization prevents the translocation of multi-walled carbon nanotubes at predicted environmentally relevant concentrations into targeted organs of nematode Caenorhabditis elegans. Nanoscale 2013, 5, 6088–6096. [Google Scholar] [CrossRef] [PubMed]
- Saidi, W.A. Functionalization of Single-Wall Zigzag Carbon Nanotubes by Carboxyl Groups: Clustering Effect. J. Phys. Chem. C 2013, 117, 9864–9871. [Google Scholar] [CrossRef]
- Lara, I.V.; Zanella, I.; Filhoc, A.G.; Fagan, S.B. Influence of concentration and position of carboxyl groups on the electronic properties of single-walled carbon nanotubes. Phys. Chem. Chem. Phys. 2014, 16, 21602–21608. [Google Scholar] [CrossRef] [PubMed]
- Beheshtian, J.; Peyghan, A.; Bagheri, Z. Carbon nanotube functionalization with carboxylic derivatives: A DFT study. J. Mol. Model. 2013, 19, 391–396. [Google Scholar] [CrossRef] [PubMed]
- Bobenko, N.G.; Bolotov, V.V.; Egorushkin, V.E.; Korusenko, P.M.; Melnikova, N.V.; Nesov, S.N.; Ponomarev, A.N.; Povoroznyuk, S.N. Experimental and theoretical study of electronic structure of disordered MWCNTs. Carbon 2019, 153, 40–51. [Google Scholar] [CrossRef]
- Fedoseeva, Y.V.; Bulusheva, L.G.; Koroteev, V.O.; Mevellec, J.-Y.; Senkovskiy, B.V.; Emmanuel, F.; Okotrub, A.V. Preferred attachment of fluorine near oxygen-containing groups on the surface of double-walled carbon nanotubes. Appl. Surf. Sci. 2020, 504, 144357. [Google Scholar] [CrossRef]
- Voznyakovskii, A.; Neverovskaya, A.; Vozniakovskii, A.; Kidalov, S.A. Quantitative Chemical Method for Determining the Surface Concentration of Stone–Wales Defects for 1D and 2D Carbon Nanomaterials. Nanomaterials 2022, 12, 883. [Google Scholar] [CrossRef] [PubMed]
- Kim, J.; Lee, N.; Min, Y.H.; Noh, S.; Kim, N.-K.; Jung, S.; Joo, M.; Yamada, Y. Distinguishing zigzag and armchair edges on graphene nanoribbons by X-ray photoelectron and Raman spectroscopies. ACS Omega 2018, 3, 17789–17796. [Google Scholar] [CrossRef]
- Sharma, V.; Uy, D.; Gangopadhyay, A.; O’Neill, A.; Paxton, W.A.; Sammut, A.; Ford, M.A.; Aswath, P.B. Structure and chemistry of crankcase and exhaust soot extracted from diesel engines. Carbon 2016, 103, 327–338. [Google Scholar] [CrossRef]
- Can, L.G.; Takai, K.; Enoki, T.; Endo, M.; Kim, Y.A.; Mizusaki, H.; Jorio, A.; Coelho, L.N.; Magalhães-Paniago, R.; Pimenta, M.A. General equation for the determination of the crystallite size la of nanographite by Raman spectroscopy. Appl. Phys. Lett. 2006, 88, 163106. [Google Scholar]
- Korusenko, P.M.; Nesov, S.N.; Iurchenkova, A.A.; Fedorovskaya, E.O.; Bolotov, V.V.; Povoroznyuk, S.N.; Smirnov, D.A.; Vinogradov, A.S. Comparative Study of the Structural Features and Electrochemical Properties of Nitrogen-Containing Multi-Walled Carbon Nanotubes after Ion-Beam Irradiation and Hydrochloric Acid Treatment. Nanomaterials 2021, 11, 2163. [Google Scholar] [CrossRef] [PubMed]
- Yoon, K.; Rahnamoun, A.; Swett, J.L.; Iberi, V.; Cullen, D.A.; Vlassiouk, I.V.; Belianinov, A.; Jesse, S.; Sang, X.; Ovchinnikova, O.S.; et al. Atomistic-scale simulations of defect formation in graphene under noble gas ion irradiation. ACS Nano 2016, 10, 8376–8384. [Google Scholar] [CrossRef] [PubMed]
- Lehtinen, O.; Nikitin, T.; Krasheninnikov, A.V.; Sun, L.; Banhart, F.; Khriachtchev, L.; Keinonen, J. Characterization of ion-irradiation-induced defects in multi-walled carbon nanotubes. New J. Phys. 2011, 13, 073004. [Google Scholar] [CrossRef]
- Lobov, I.A.; Davletkildeev, N.A.; Nesov, S.N.; Sokolov, D.V.; Korusenko, P.M. Effect of Nitrogen Atoms in the CNT Structure on the Gas Sensing Properties of PANI/CNT Composite. Appl. Sci. 2022, 12, 7169. [Google Scholar] [CrossRef]
- Brzhezinskaya, M.M.; Vinogradov, N.A.; Muradyan, V.E.; Shul’ga, Y.M.; Polyakova, N.V.; Vinogradov, A.S. Characterization of fluorinated multiwalled carbon nanotubes by x-ray absorption spectroscopy. Phys. Solid State 2008, 50, 587–594. [Google Scholar] [CrossRef]
- Chua, C.K.; Pumera, M. Renewal of sp2 bonds in graphene oxides via dehydrobromination. J. Mater. Chem. 2012, 22, 23227–23231. [Google Scholar] [CrossRef]
- Zhang, X.; Zhou, J.; Song, H.; Chen, X.; Fedoseeva Yu, V.; Okotrub, A.V.; Bulusheva, L.G. “Butterfly Effect” in CuO/Graphene Composite Nanosheets: A Small Interfacial Adjustment Triggers Big Changes in Electronic Structure and Li-Ion Storage Performance. ACS Appl. Mater. Interfaces 2014, 6, 17236–17244. [Google Scholar] [CrossRef]
- Nesov, S.N.; Bolotov, V.V.; Knyazev, E.V.; Povoroznyuk, S.N. Analysis of structure and electrochemical characteristics of multi-walled carbon nanotubes doped with nitrogen using ion irradiation. Nucl. Instrum. Methods Phys. Res. B Nucl. Instrum. Meth. B 2022, 525, 25–33. [Google Scholar] [CrossRef]
- Belosludtseva, A.A.; Bobenko, N.G.; Egorushkin, V.E.; Korusenko, P.M.; Melnikova, N.V.; Nesov, S.N. Oxygen functionalization and electronic band gap control in the disordered multi-walled carbon nanotubes. Synth. Met. 2021, 280, 116866. [Google Scholar]
- Veloso, M.V.; Filho, A.S.; Filho, J.M.; Fagan, S.B.; Mota, R. Ab Initio Study of Covalently Functionalized Carbon Nanotubes. Chem. Phys. Lett. 2006, 430, 71–74. [Google Scholar] [CrossRef]
- Wang, C.; Zhou, G.; Liu, H.; Wu, J.; Qiu, Y.; Gu, B.-L.; Duan, W. Chemical Functionalization of Carbon Nanotubes by Carboxyl Groups on Stone-Wales Defects: A Density Functional Theory Study. J. Phys. Chem. B 2006, 110, 10266–10271. [Google Scholar] [CrossRef] [PubMed]
- National Center for Biotechnology Information. PubChem Compound Summary for CID 16124726. Available online: https://pubchem.ncbi.nlm.nih.gov/compound/lw6 (accessed on 25 November 2022).
- Lifshitz, E.M.; Pitaevskii, L.P. Physical Kinetics; Pergamon: London, UK, 1981; p. 452. [Google Scholar]
- Forster, D. Hydrodynamic Fluctuations, Broken Symmetry, and Correlation Functions; CRC Press: Boca Raton, FL, USA, 2018; (W.A. Benjamin, Reading, 1975). [Google Scholar]
- Fu, Y.; Kao, W.J. Drug release kinetics and transport mechanisms of non-degradable and degradable polymeric delivery systems. Expert Opin Drug Deliv. 2010, 7, 429–444. [Google Scholar] [CrossRef] [PubMed]
- Qing, Z.; Qin, Y.; Haifeng, Y.; Wenyi, W. Oxygen sensing and adaptability won the 2019 Nobel Prize in Physiology or medicine. Genes Dis. 2019, 6, 328–332. [Google Scholar]
- Kanamori, T.; Ohmori, T.; Yamaguchi, T.; Shinbo, T. Oscillations with a long periodical time observed in solute transport by diffusion combined with convection through a single hollow-fiber membrane. J. Membr. Sci. 2001, 184, 287–292. [Google Scholar] [CrossRef]
- Elstner, M.; Porezag, D.; Jungnickel, G.; Elsner, J.; Haugk, M.; Frauenheim, T. Self-consistent-charge density-functional tight-binding method for simulations of complex materials properties. Phys. Rev. B 1998, 58, 7260–7268. [Google Scholar] [CrossRef]
- Shunaev, V.V.; Glukhova, O.E. Topology Influence on the Process of Graphene Functionalization by Epoxy and Hydroxyl Groups. J. Phys. Chem. C 2016, 120, 4145–4149. [Google Scholar] [CrossRef]
- Shunaev, V.V.; Glukhova, O.E. Interaction of Co3O4 Nanocube with Graphene and Reduced Graphene Oxide: Adhesion and Quantum Capacitance. Lubricants 2022, 10, 79. [Google Scholar] [CrossRef]
- Gaus, M.; Goez, A.; Elstner, M. Parametrization and Benchmark of DFTB3 for Organic Molecules. J. Chem. Theory Comput. 2013, 9, 338–354. [Google Scholar] [CrossRef]
- Mulliken, R.S. Electronic Population Analysis on LCAO-MO Molecular Wave Functions. J. Chem. Phys. 1995, 23, 1833–1840. [Google Scholar] [CrossRef]


| G, cm−1 | D1, cm−1 | D3, cm−1 | D4, cm−1 | ID/IG | ID1/ID | ID3/ID | ID4/ID |
|---|---|---|---|---|---|---|---|
| 1597 | 1385 | 1539 | 1242 | 3.0 | 0.7 | 0.2 | 0.1 |
| Characteristic | S1 | S2 | S3 |
|---|---|---|---|
| EF, eV | −5.58 | −5.60 | −4.48 |
| n(EF), (eV·atom)−1 | 0.25 | 0.25 | 0.01 |
| Eb, eV | −8.18 | −7.91 | −8.28 |
| R (C=O), Å | 1.23 | ||
| R (C–OH), Å | 1.36 | ||
| q(C), (e/atom) | −0.68 | ||
| q(O), e | +0.55 | ||
| q(OH), e | +0.11 | ||
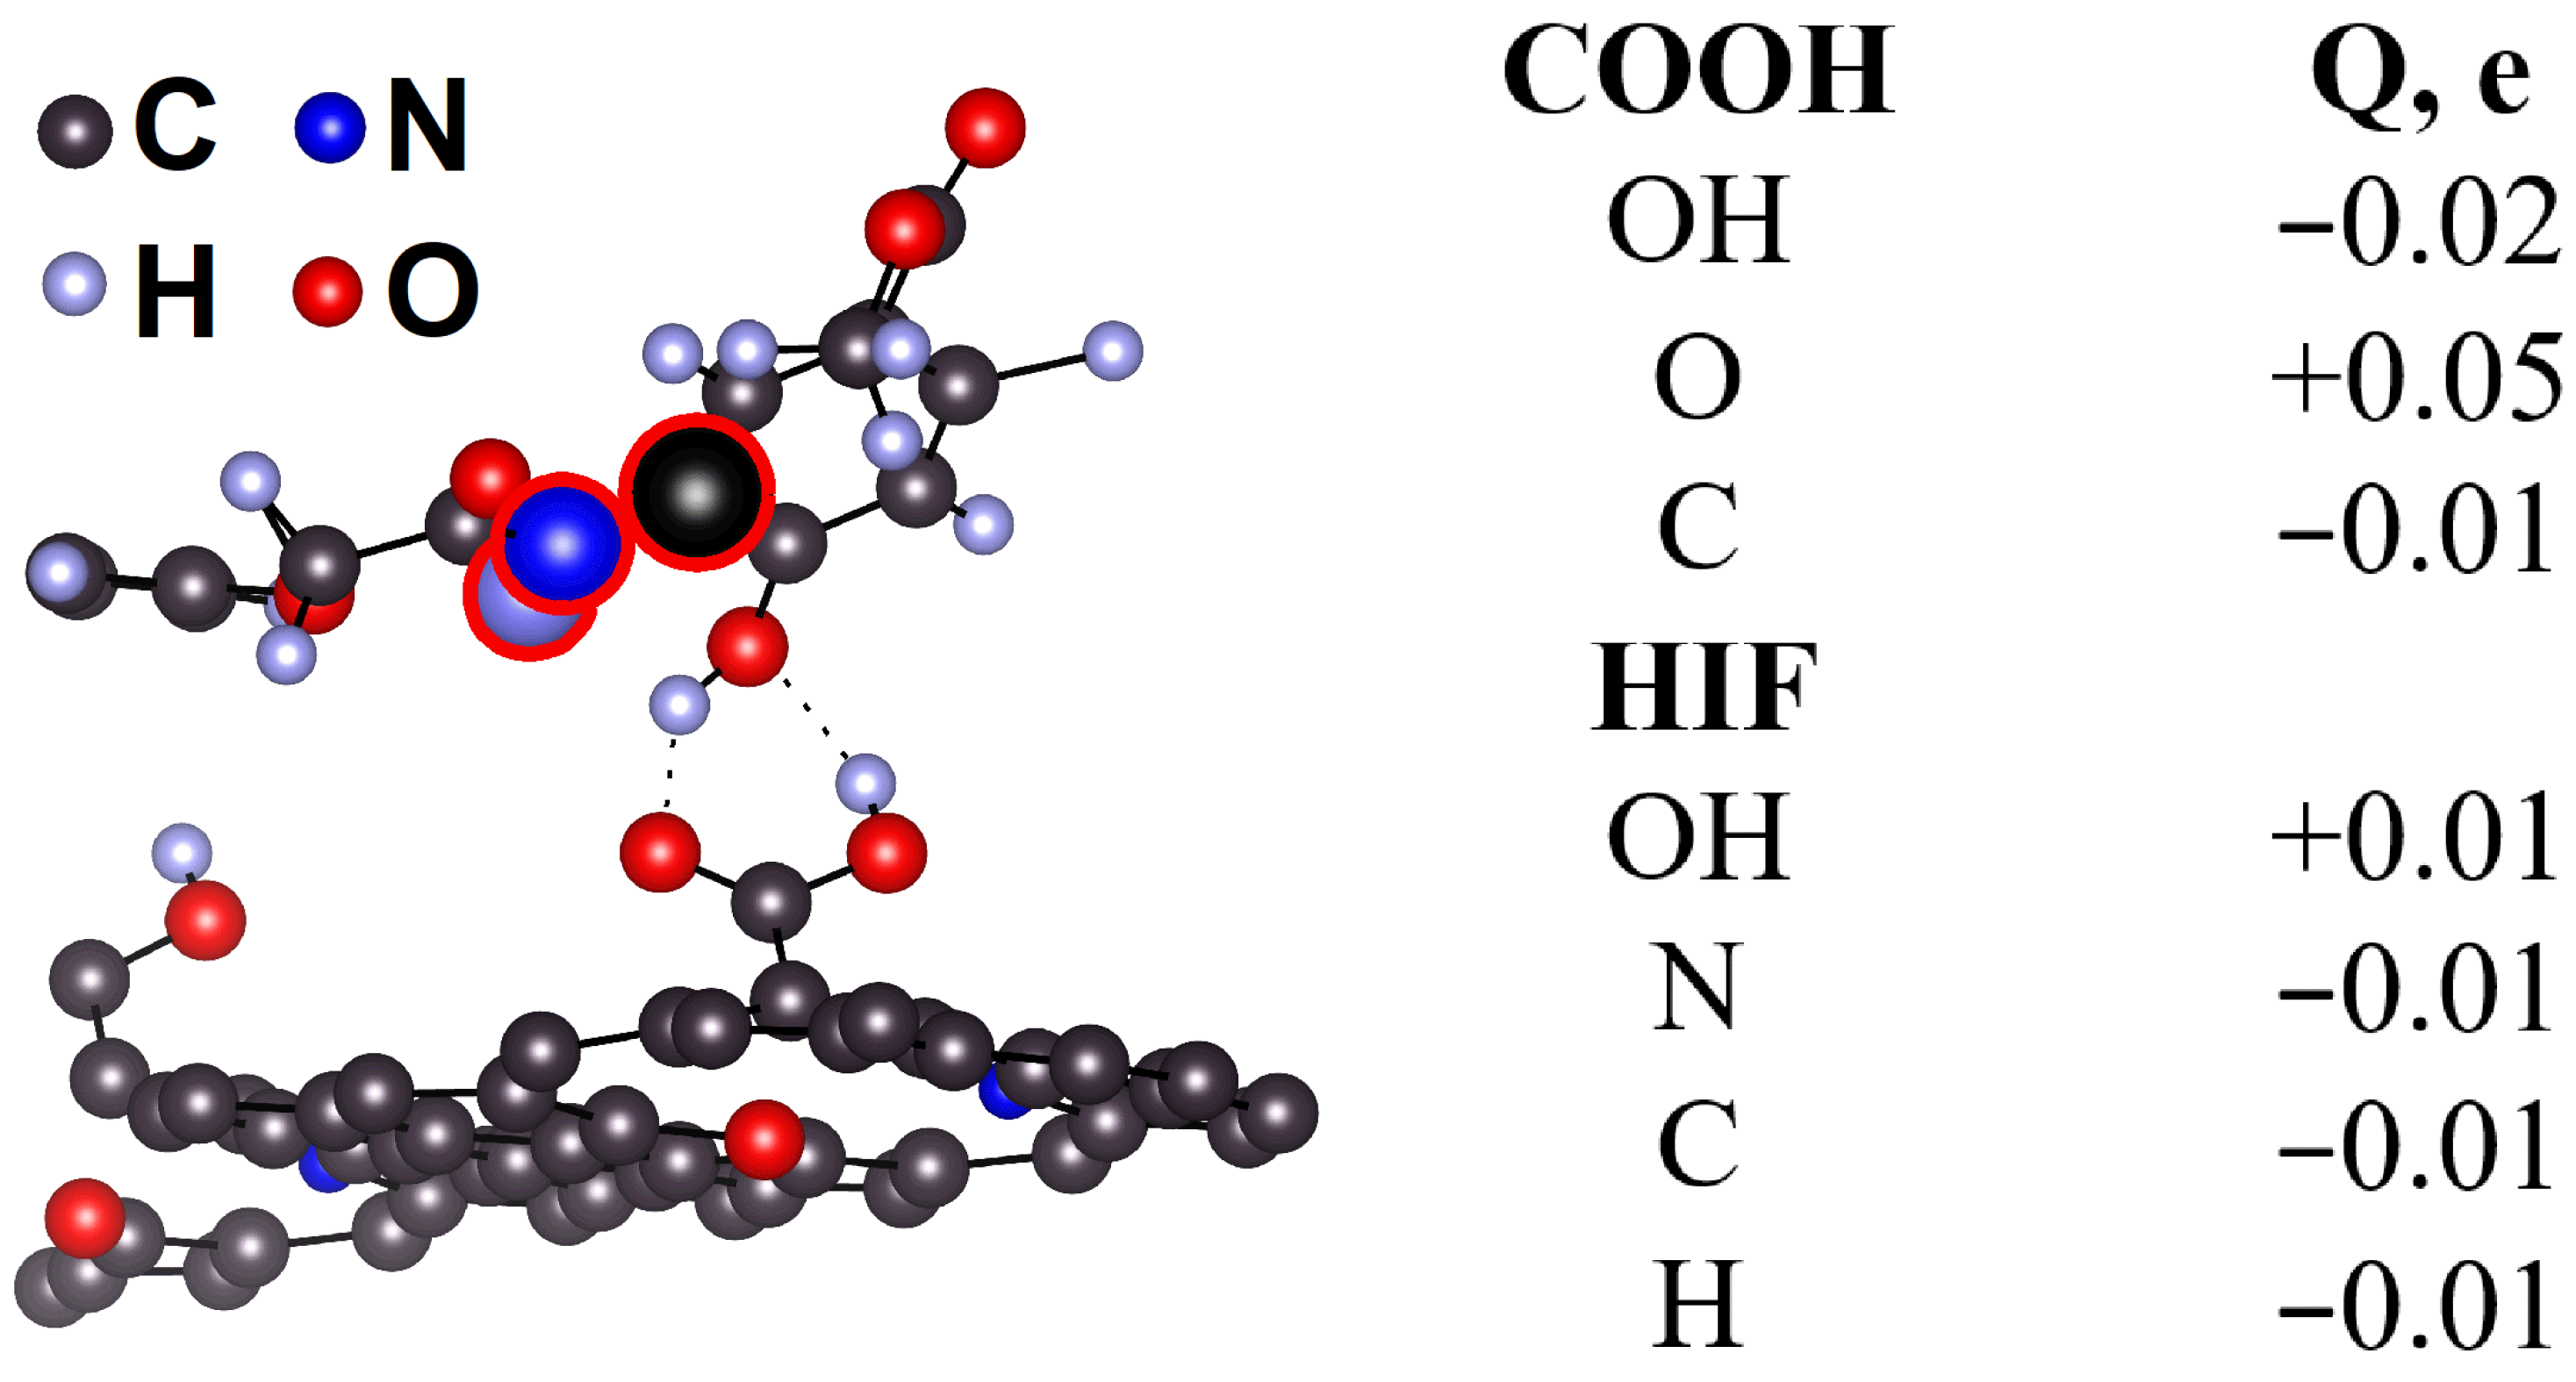
| q(C), e | +0.02 | ||
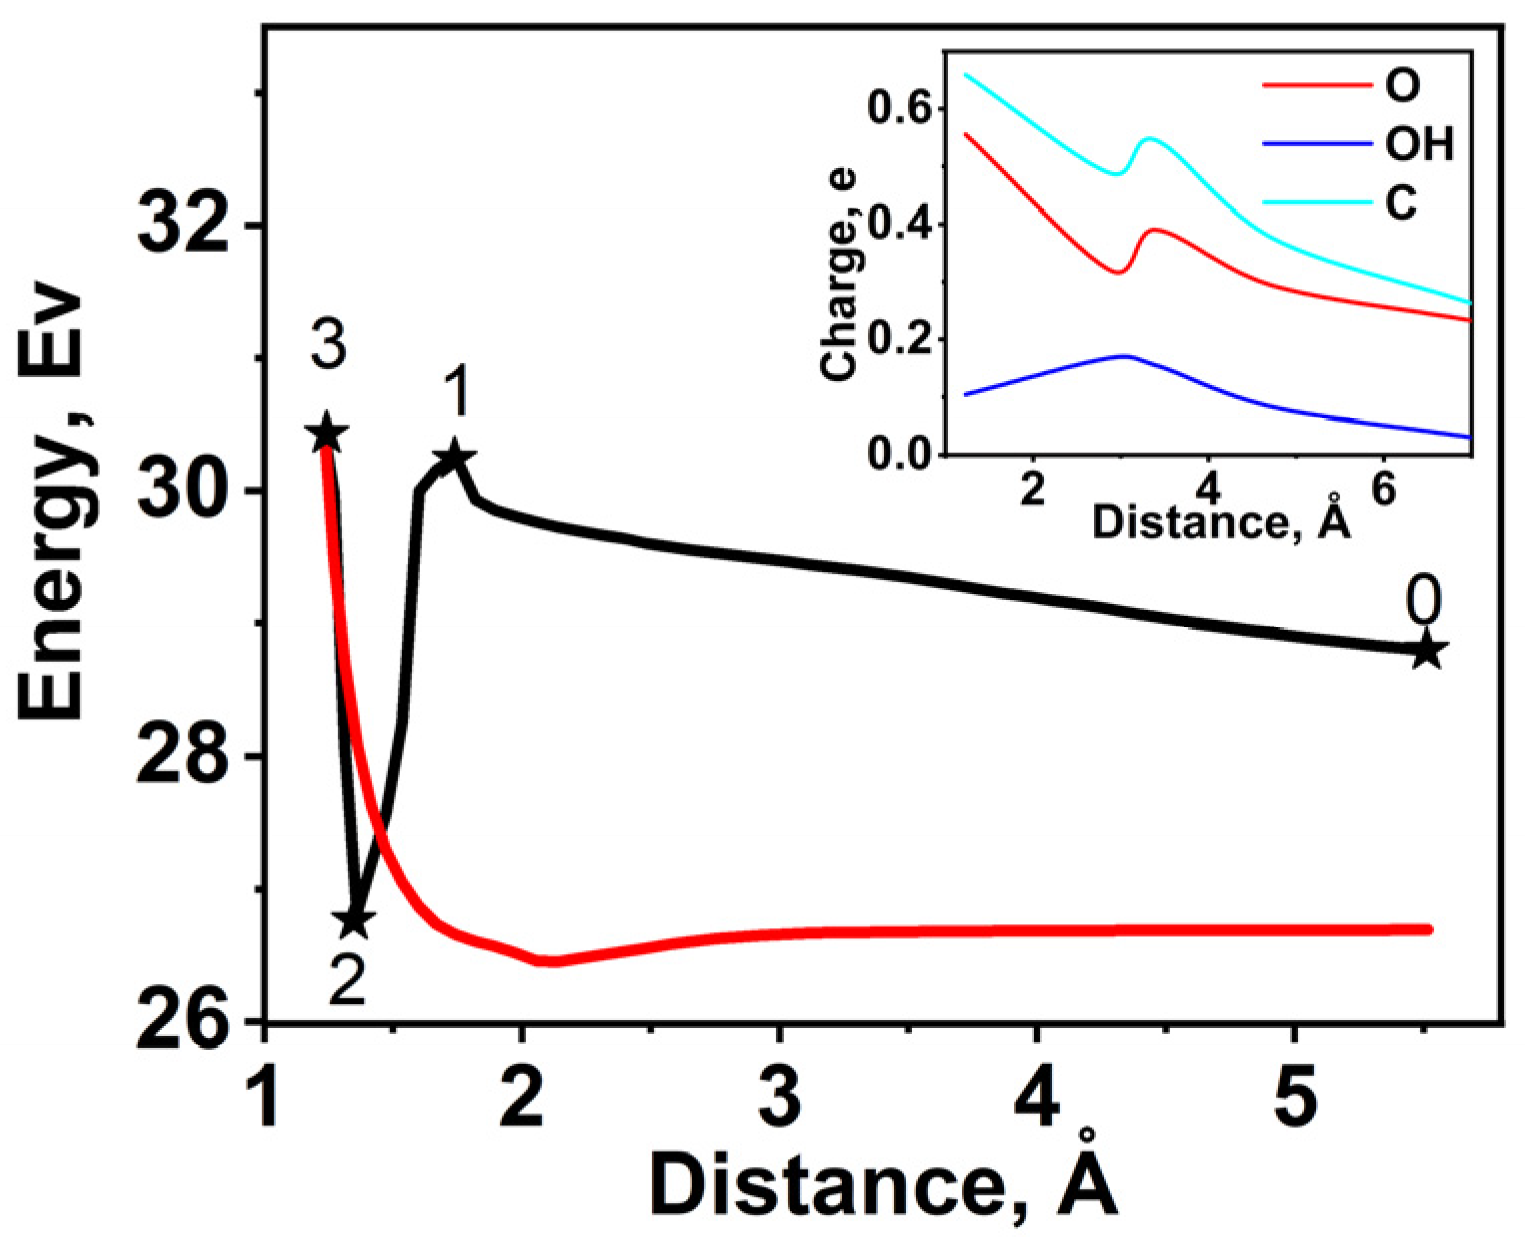
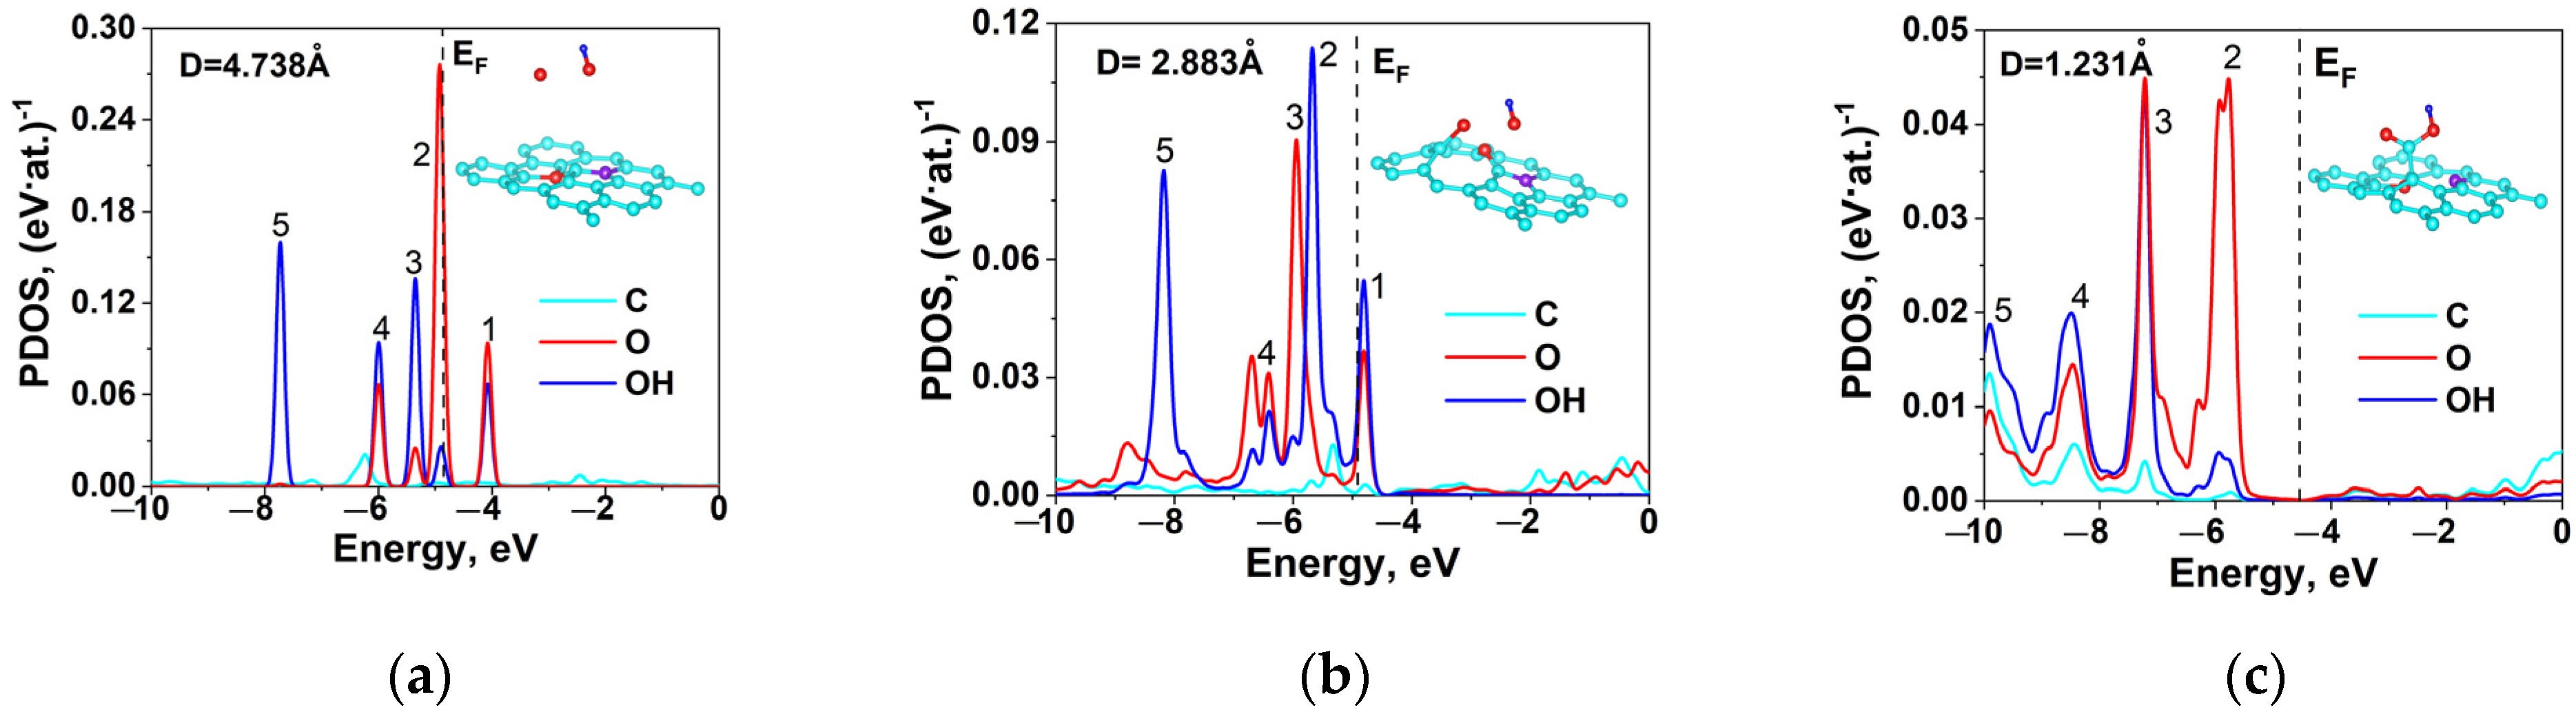
| R, Å | EF, eV | q(C), e/Atom | q(O), e/Atom | q(OH), e/Atom | Peak 1, eV | Peak 2, eV | Peak 3, eV | Peak 4, eV | Peak 5, eV |
|---|---|---|---|---|---|---|---|---|---|
| 4.738 | −0.8667 | 0.014 | 0.056 | 0.072 | −4.08 | −4.92 | −5.35 | −6 | −7.73 |
| 2.883 | −0.9435 | 0.012 | 0.061 | 0.073 | −4.81 | −5.66 | −5.96 | −6.70 | −8.18 |
| 1.231 | −0.4831 | 0.012 | 0.053 | 0.04 | - | −5.77 | −7.22 | −8.47 | −9.90 |
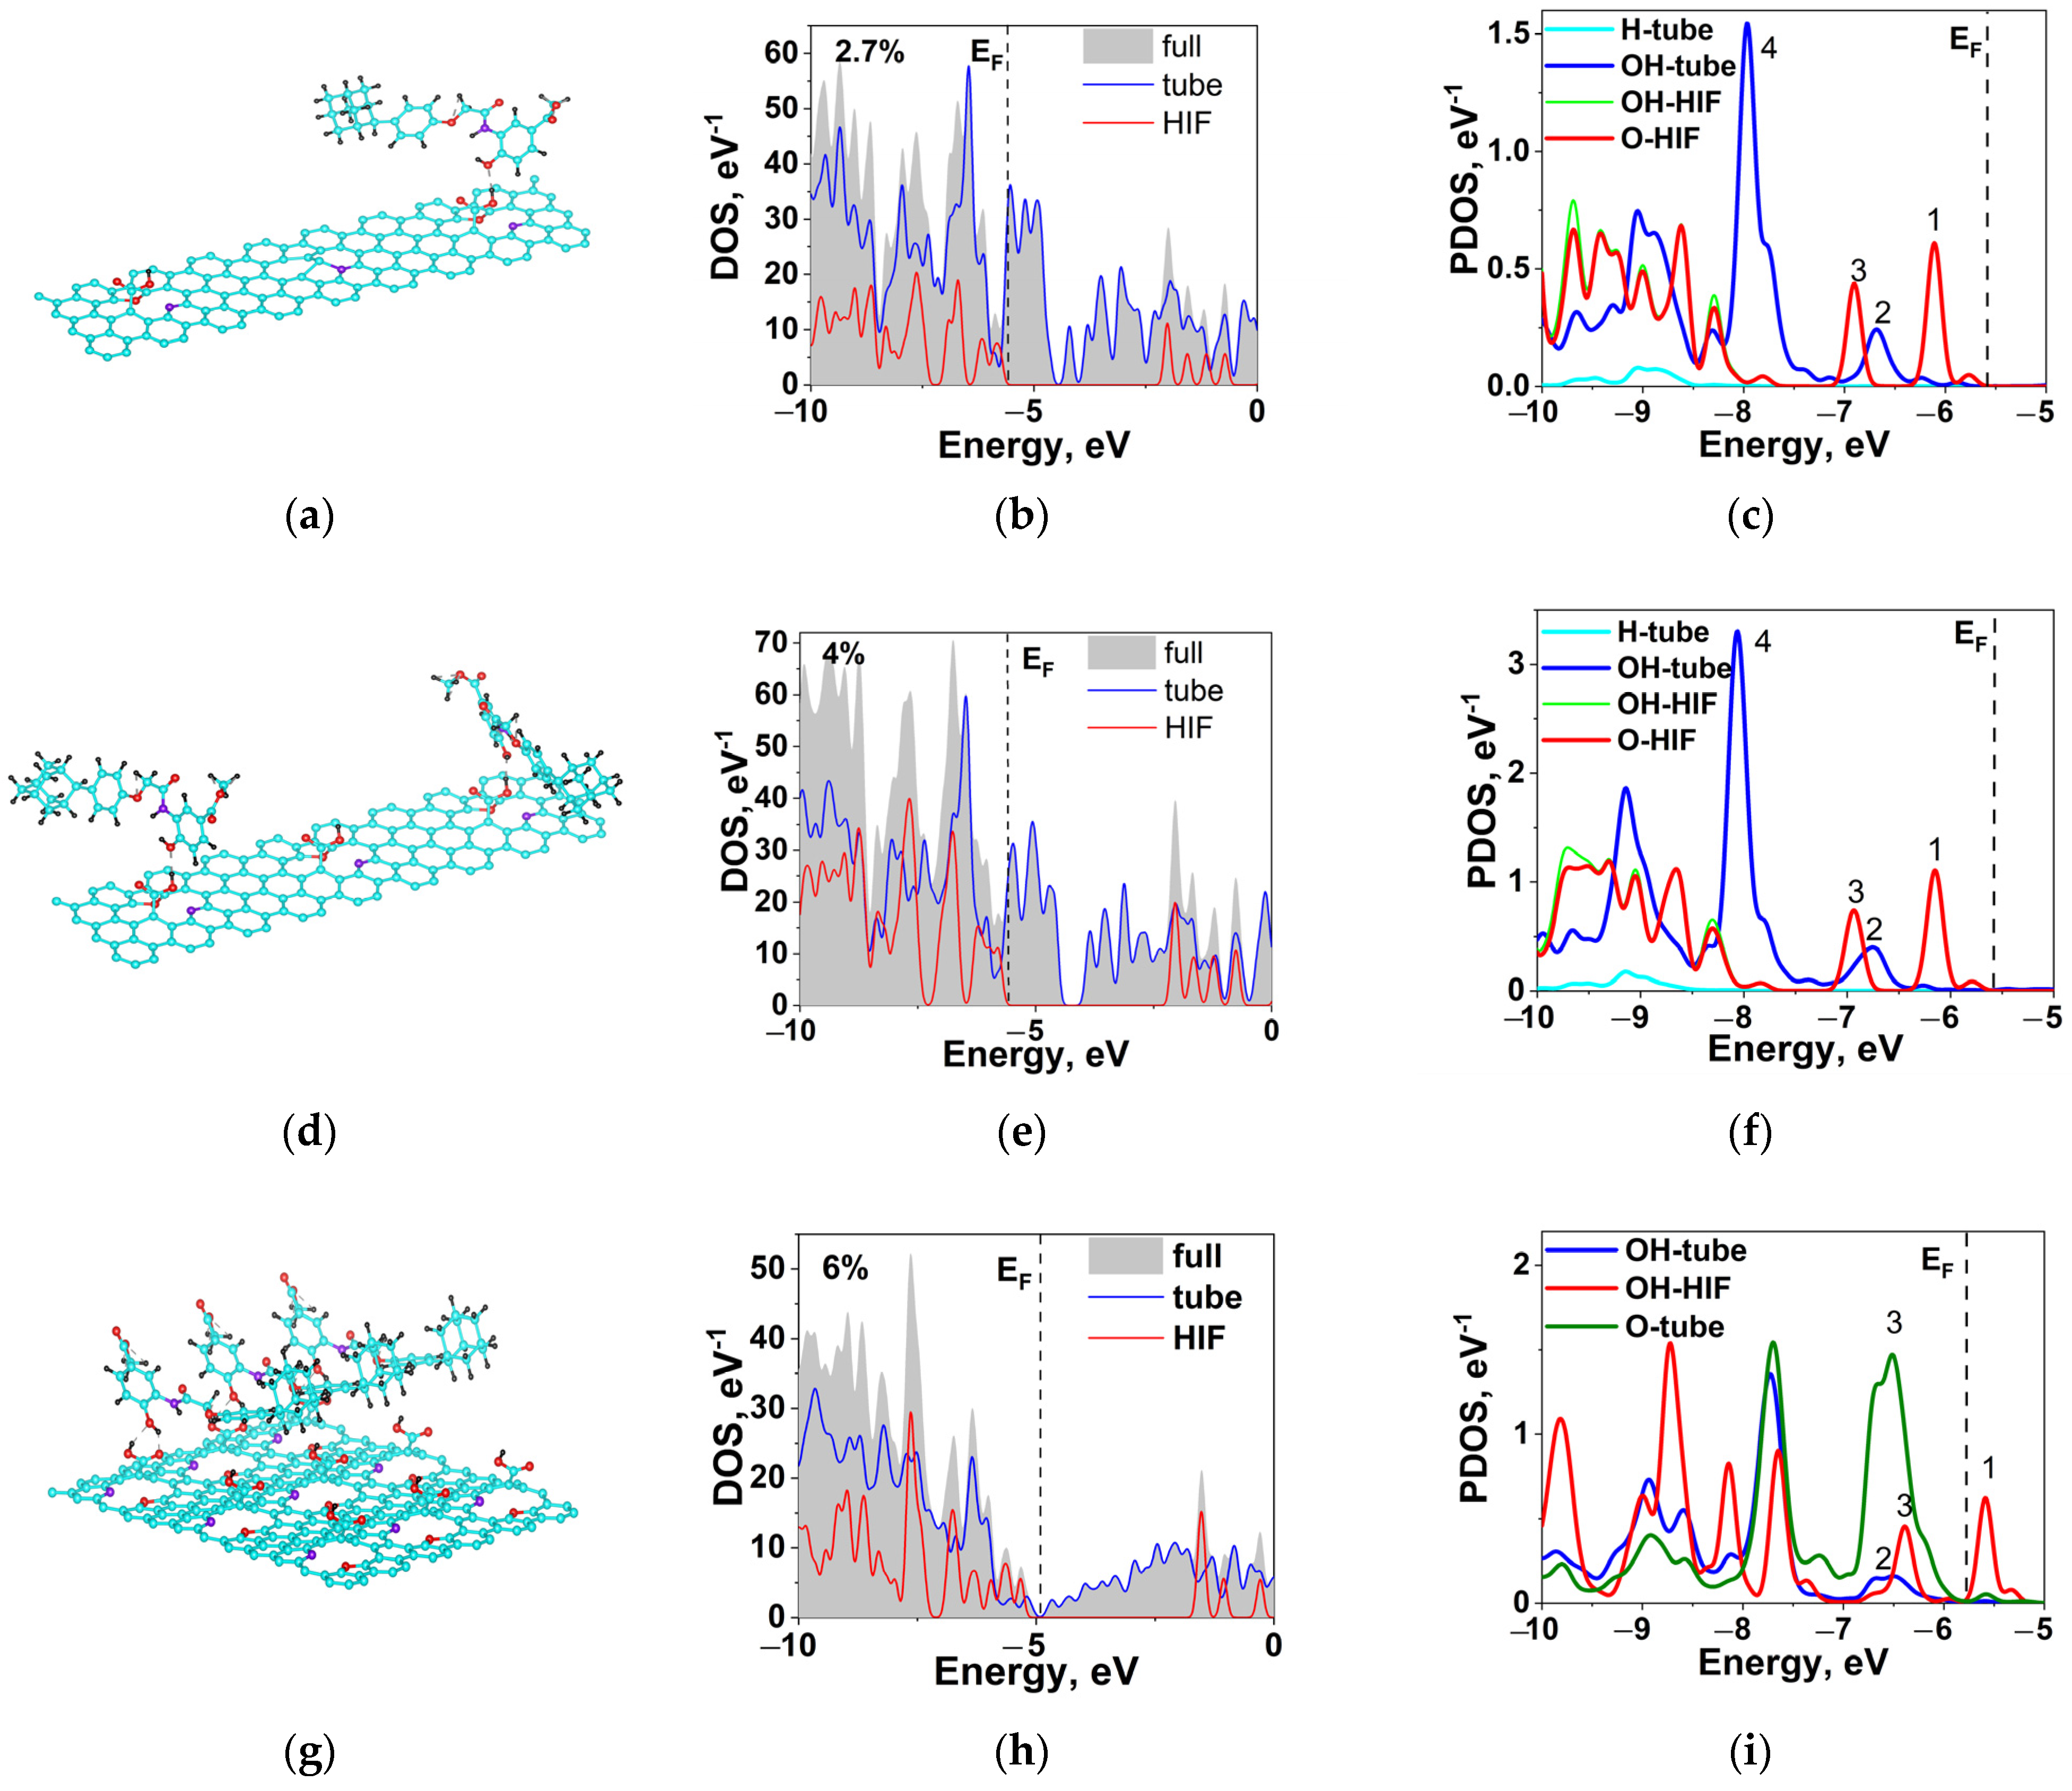
| Peak, eV Concentration | 1 | 2 | 3 | 4 | Ω |
|---|---|---|---|---|---|
| S1 | −6.11 (HIF-O) | −6.68 (tube-OH) | −6.89 (HIF-O) | −7.98 (tube-OH) | 0.57 (1–2) |
| S2 | −6.15 (HIF-O) | −6.75 (tube-OH) | −6.94 (HIF-O) | −8.06 (tube-OH) | 0.60 (1–2) |
| S3 | −5.58 (HIF-OH) | −6.60 (tube-OH) | −6.39 (HIF-OH) | −6.59 (tube-O) | 1.02 (1–2) 0.20 (3–4) |
| Characteristic | S1 | S2 | S3 |
|---|---|---|---|
| EF, eV | −5.56 | −5.60 | −4.88 |
| n(EF), (eV·atom)−1 | 0.168 | 0.092 | 0.001 |
| Eb, eV | −0.51 | −0.51/−0.35 | −0.64 |
| R (OH-OH), Å | 1.60 | 1.60/1.90 | 1.88 |
| R (O-OH), Å | - | - | 1.94 |
Disclaimer/Publisher’s Note: The statements, opinions and data contained in all publications are solely those of the individual author(s) and contributor(s) and not of MDPI and/or the editor(s). MDPI and/or the editor(s) disclaim responsibility for any injury to people or property resulting from any ideas, methods, instructions or products referred to in the content. |
© 2023 by the authors. Licensee MDPI, Basel, Switzerland. This article is an open access article distributed under the terms and conditions of the Creative Commons Attribution (CC BY) license (https://creativecommons.org/licenses/by/4.0/).
Share and Cite
Shunaev, V.V.; Bobenko, N.G.; Korusenko, P.M.; Egorushkin, V.E.; Glukhova, O.E. Carboxyl Functionalization of N-MWCNTs with Stone–Wales Defects and Possibility of HIF-1α Wave-Diffusive Delivery. Int. J. Mol. Sci. 2023, 24, 1296. https://doi.org/10.3390/ijms24021296
Shunaev VV, Bobenko NG, Korusenko PM, Egorushkin VE, Glukhova OE. Carboxyl Functionalization of N-MWCNTs with Stone–Wales Defects and Possibility of HIF-1α Wave-Diffusive Delivery. International Journal of Molecular Sciences. 2023; 24(2):1296. https://doi.org/10.3390/ijms24021296
Chicago/Turabian StyleShunaev, Vladislav V., Nadezhda G. Bobenko, Petr M. Korusenko, Valeriy E. Egorushkin, and Olga E. Glukhova. 2023. "Carboxyl Functionalization of N-MWCNTs with Stone–Wales Defects and Possibility of HIF-1α Wave-Diffusive Delivery" International Journal of Molecular Sciences 24, no. 2: 1296. https://doi.org/10.3390/ijms24021296
APA StyleShunaev, V. V., Bobenko, N. G., Korusenko, P. M., Egorushkin, V. E., & Glukhova, O. E. (2023). Carboxyl Functionalization of N-MWCNTs with Stone–Wales Defects and Possibility of HIF-1α Wave-Diffusive Delivery. International Journal of Molecular Sciences, 24(2), 1296. https://doi.org/10.3390/ijms24021296