
A Catalog of Coding Sequence Variations in Salivary Proteins’ Genes Occurring during Recent Human Evolution

 , ,
, ,  , , ,
, , ,  , ,
, ,  and
and
Abstract
:1. Introduction
2. Results
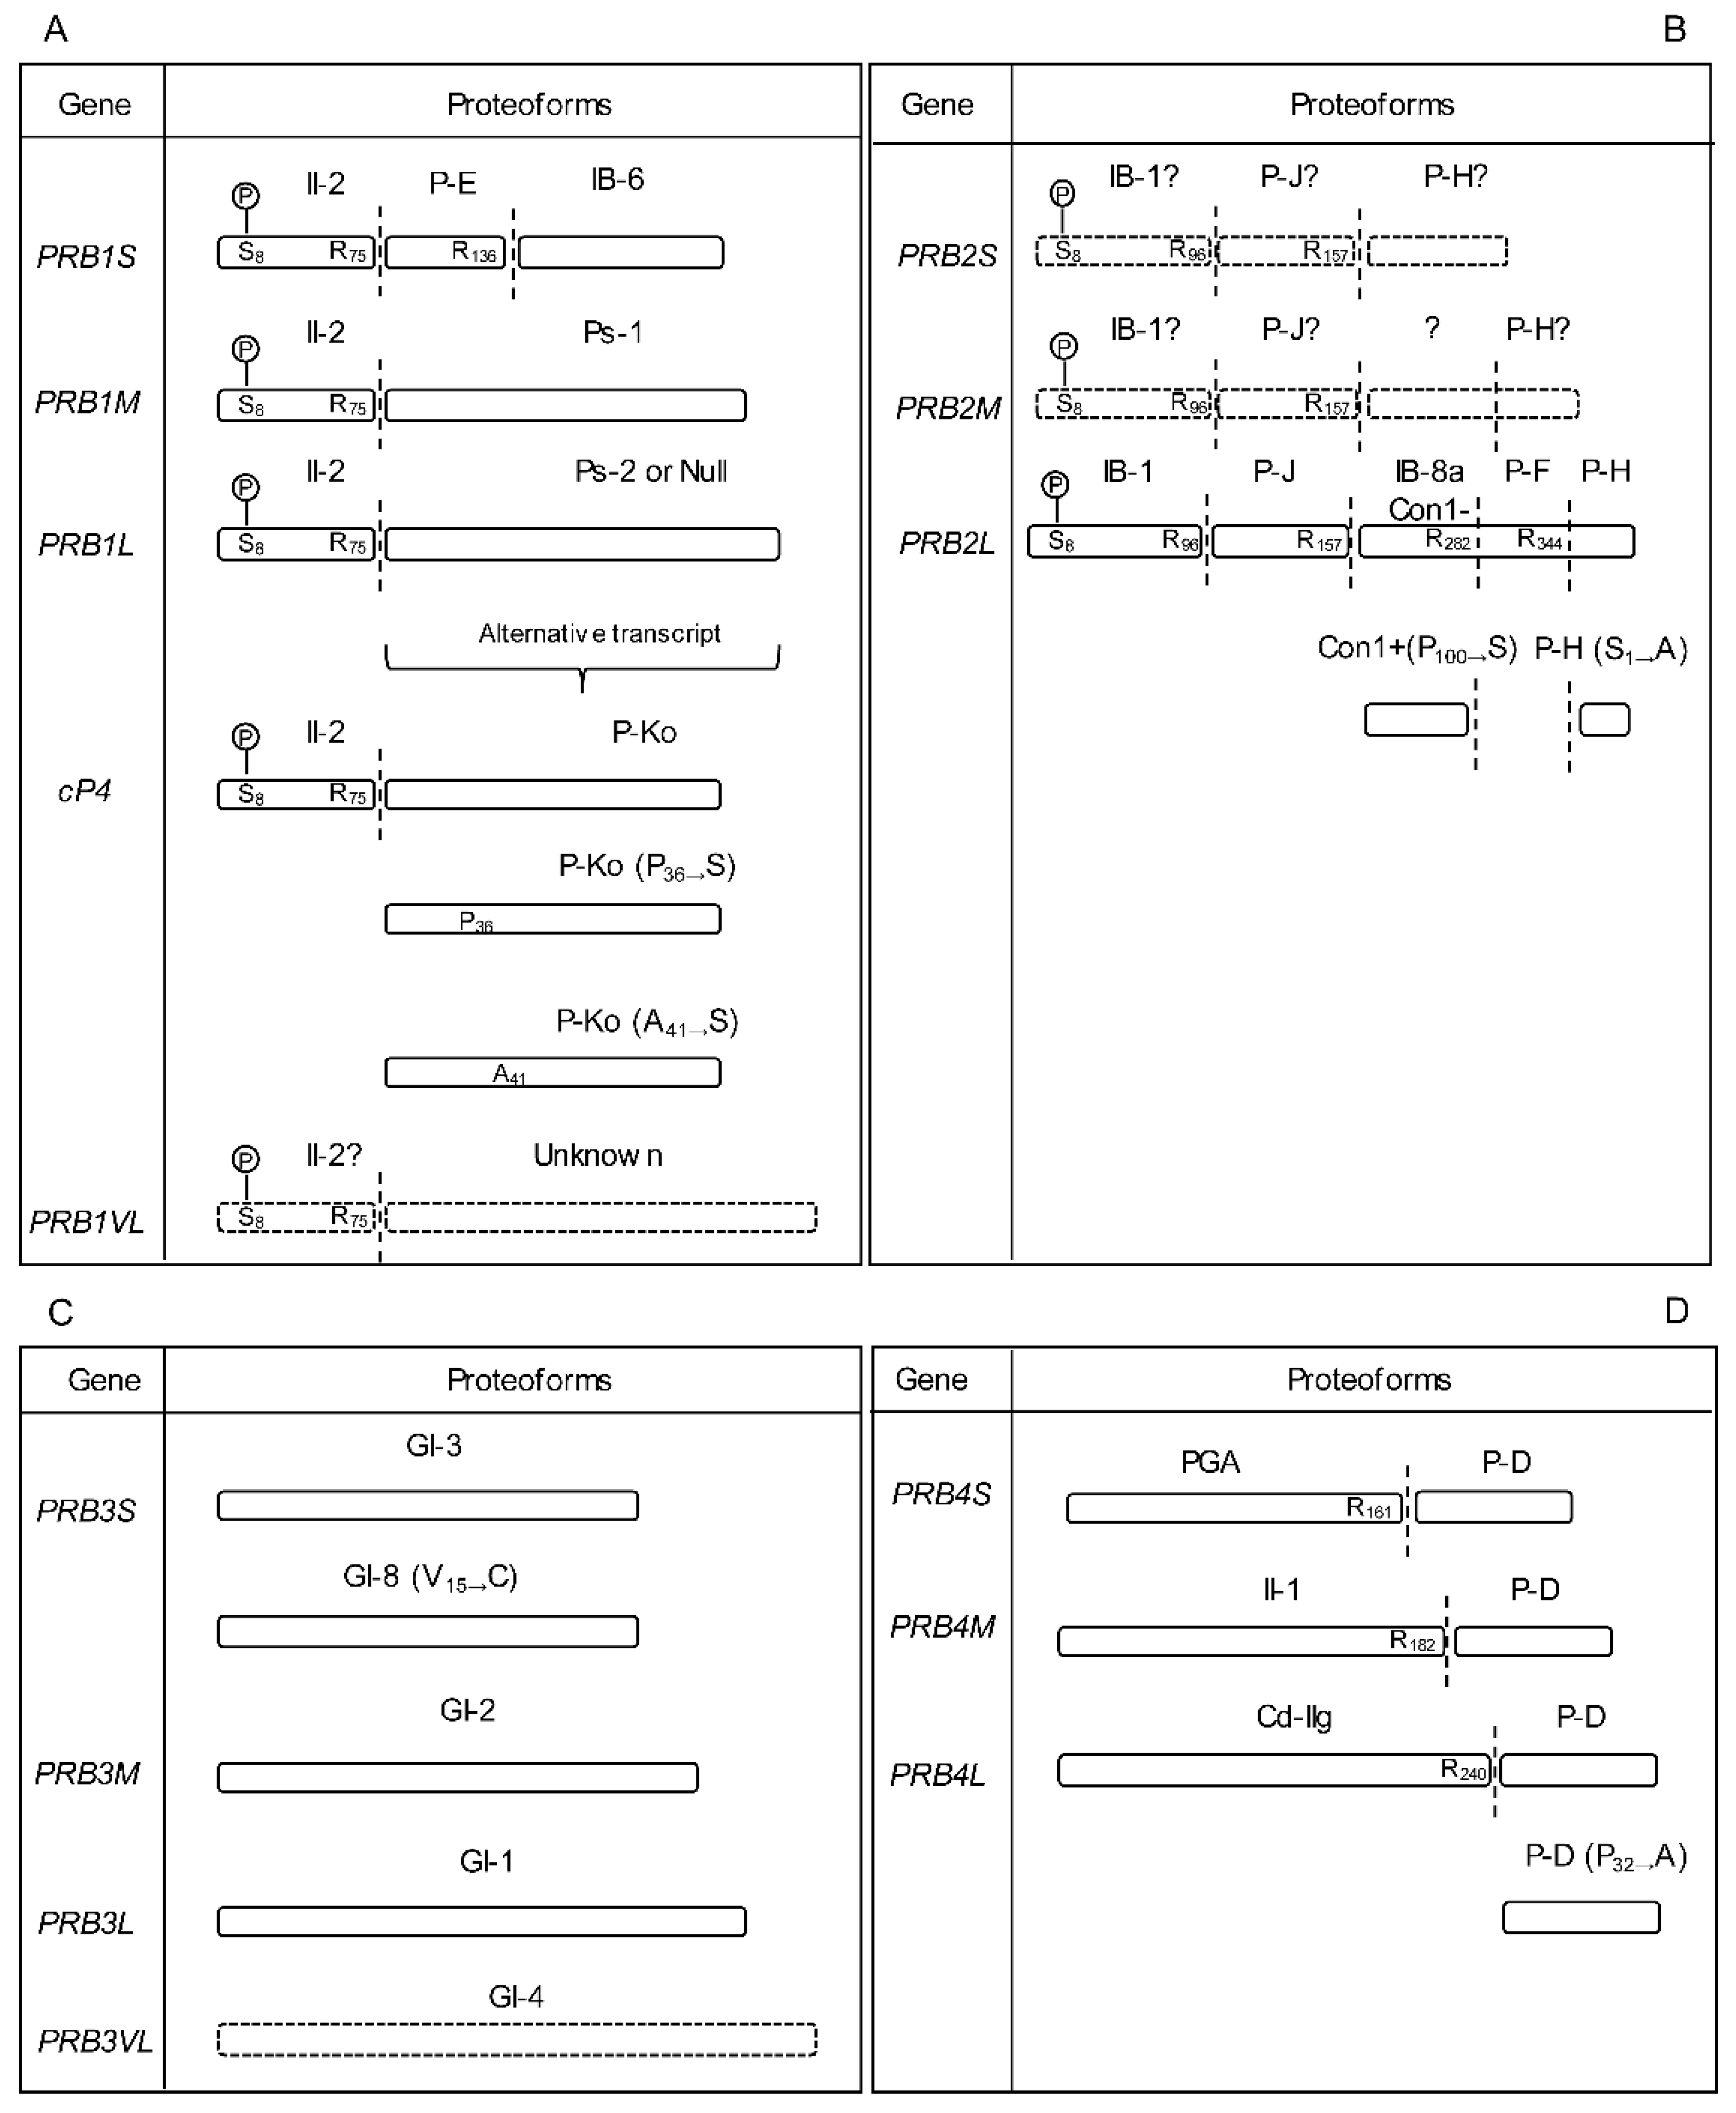
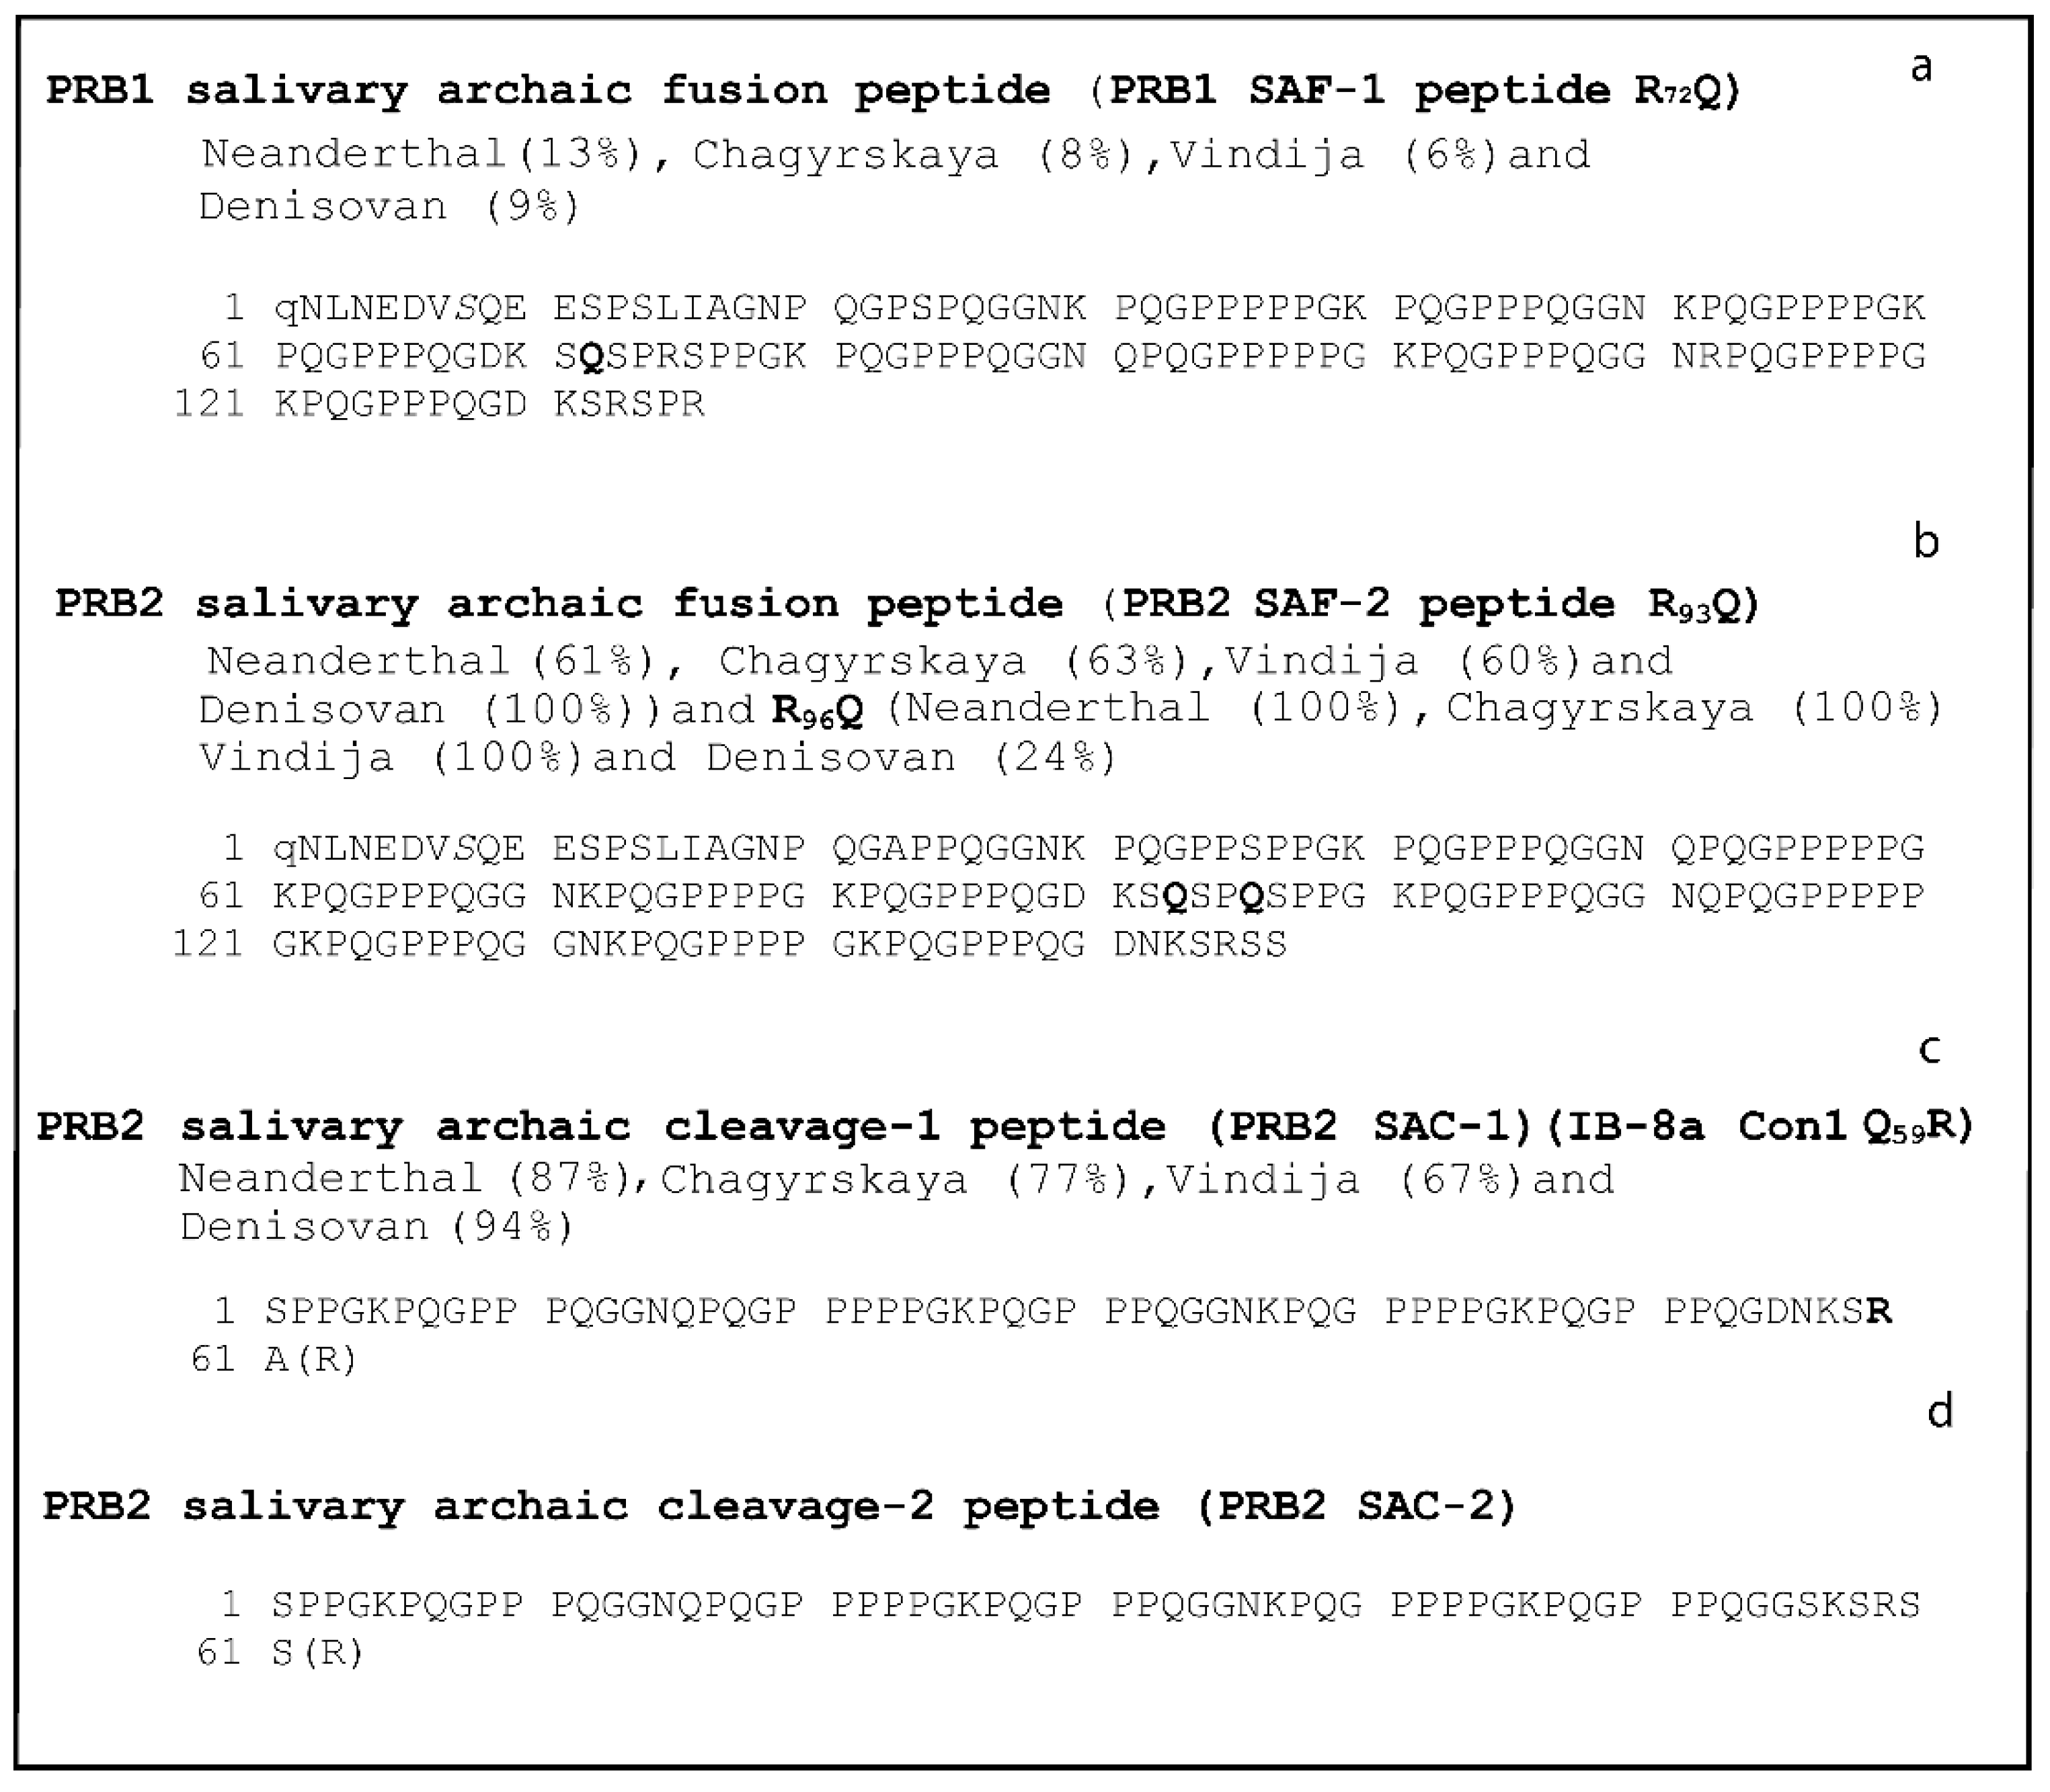
2.1. Nucleotide Variations in the Gene Loci Encoding Basic Proline-Rich Proteins
2.1.1. PRB1 Gene
2.1.2. PRB2 Gene
2.1.3. PRB3 Gene
2.1.4. PRB4 Gene
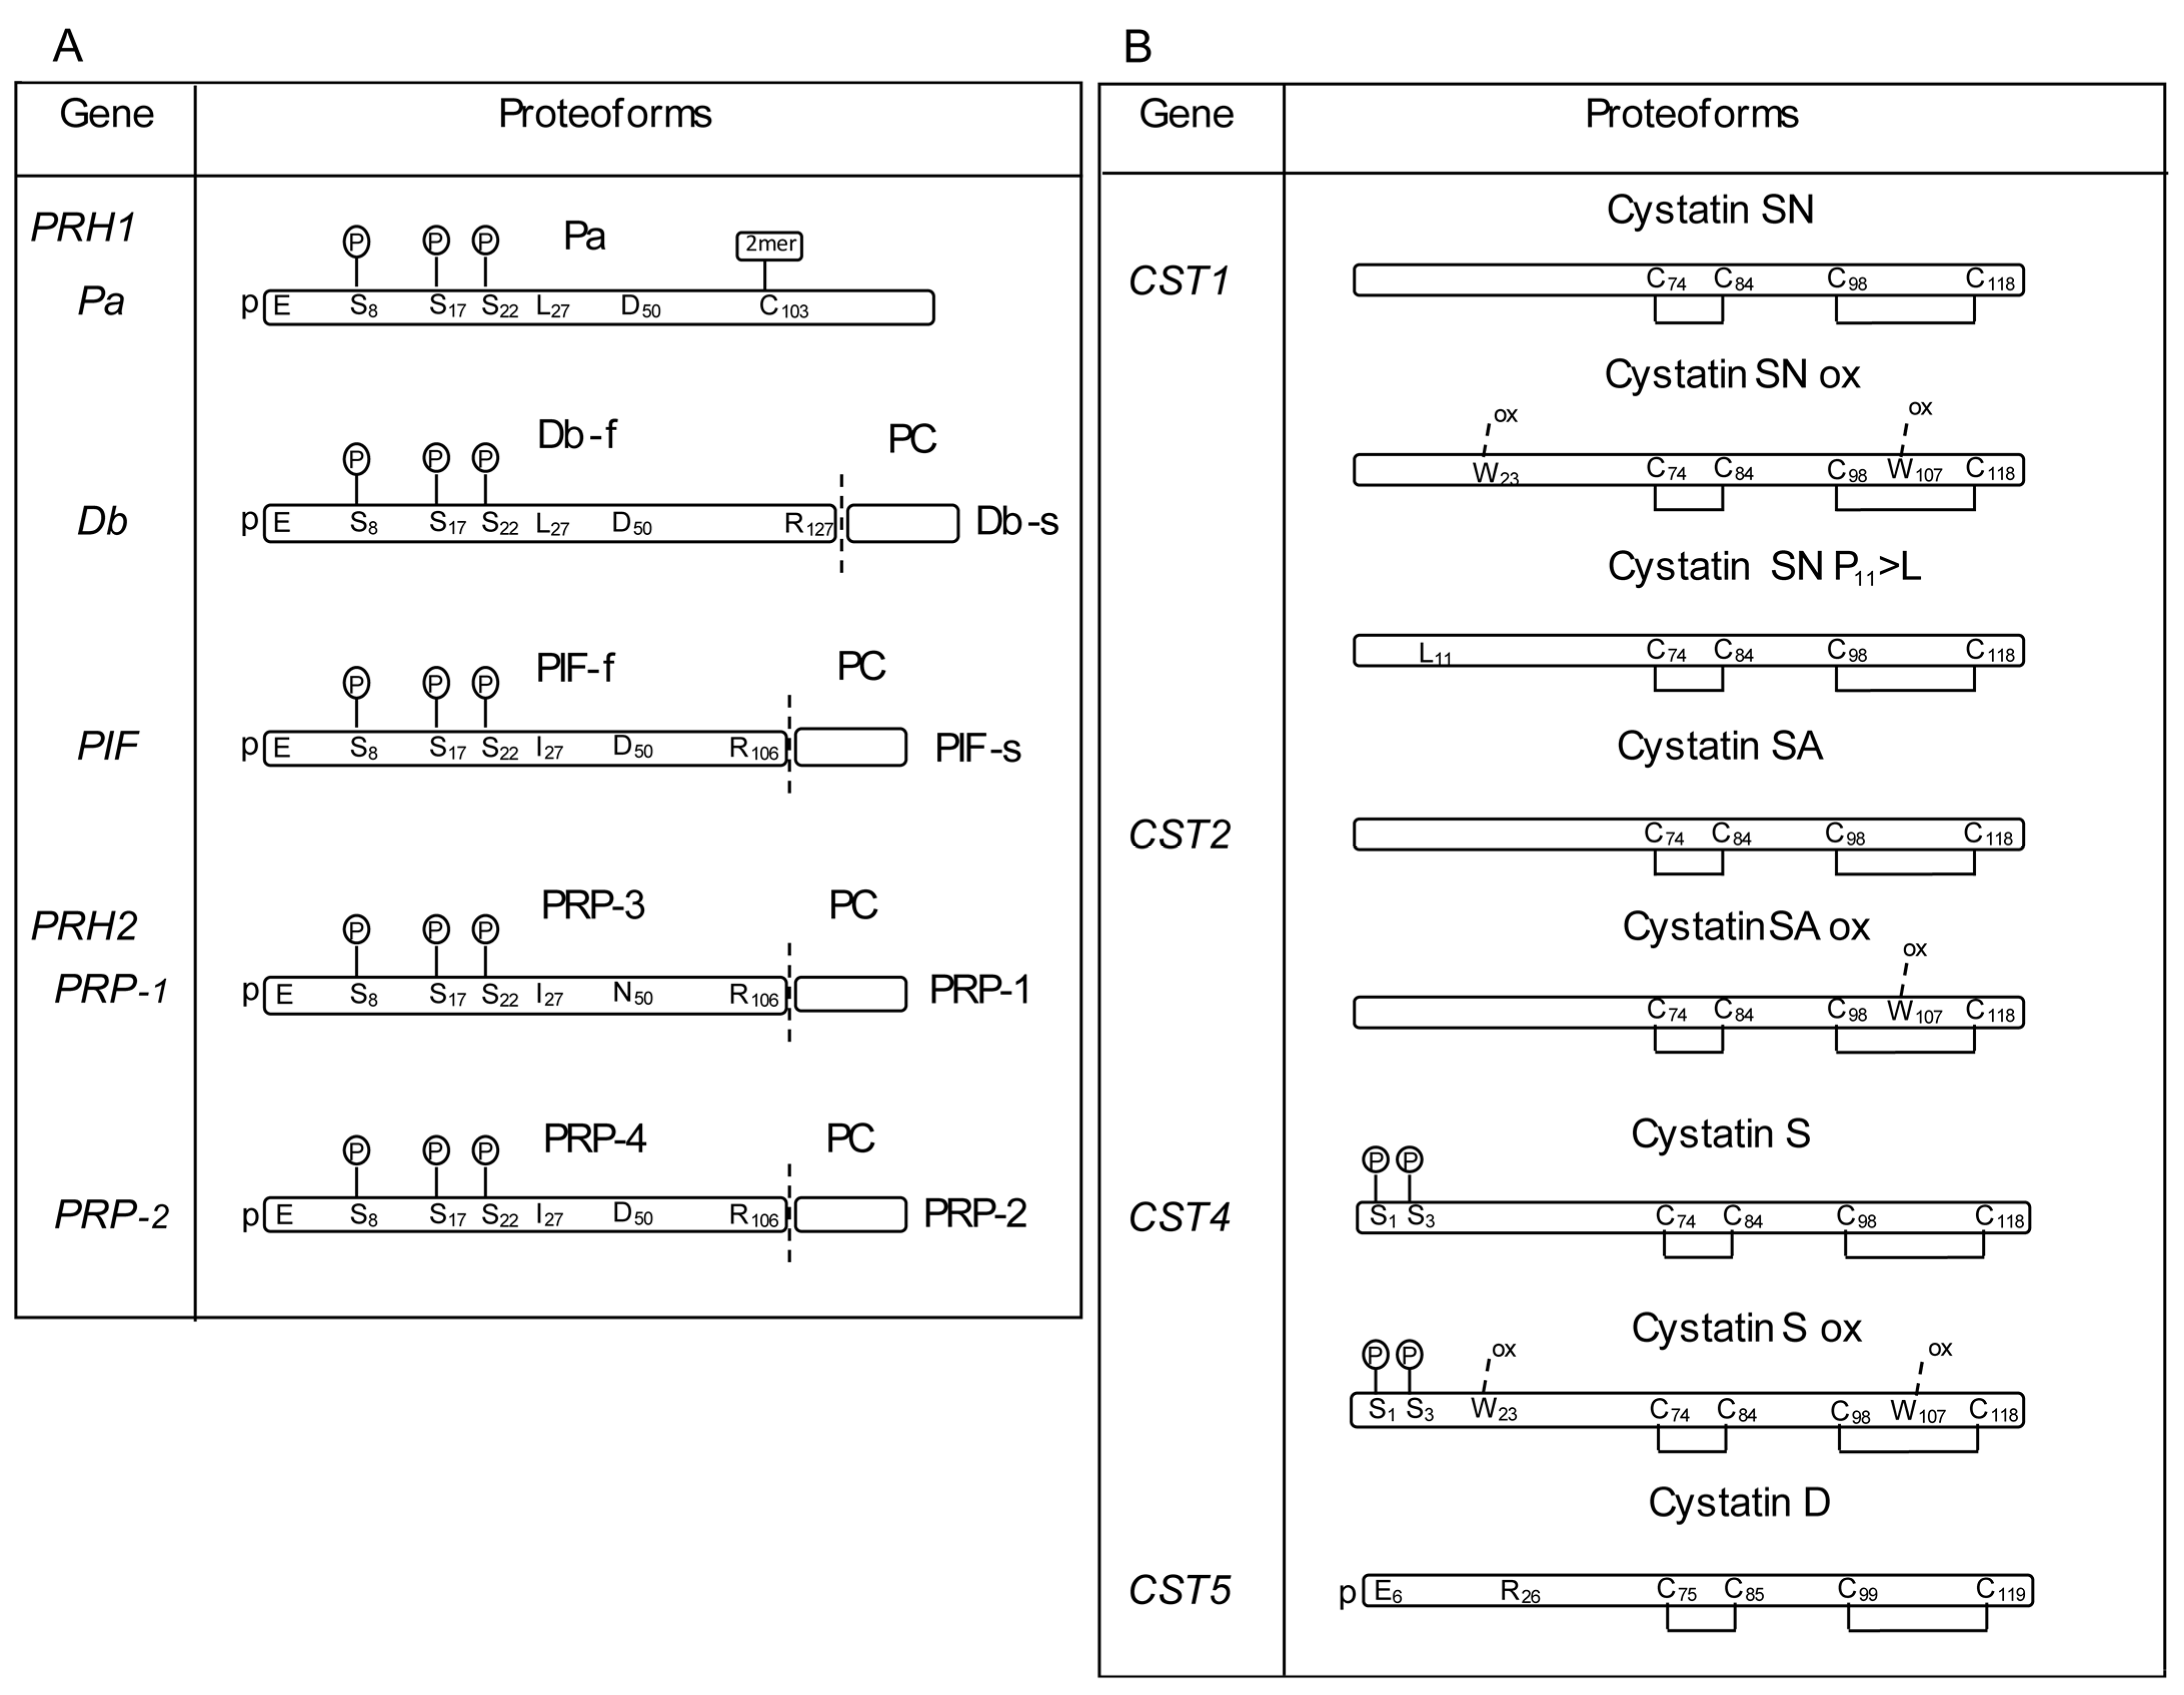
2.2. Nucleotide Variations in the Gene Locus Encoding the a-PRP
2.3. Nucleotide Variations in the HTN Gene Loci
2.4. Nucleotide Variations in the AMY1A Gene Locus
2.5. Nucleotide Variations in the STATH and P-B Gene Loci
2.6. Nucleotide Variations in the CST Gene Loci
2.6.1. CST1 Gene
2.6.2. CST2 Gene
2.6.3. CST3 Gene
2.6.4. CST4 Gene
2.6.5. CST5 Gene
2.6.6. CSTA and CSTB Genes
2.7. Geographic Distribution of Genetic Variants in Modern Humans
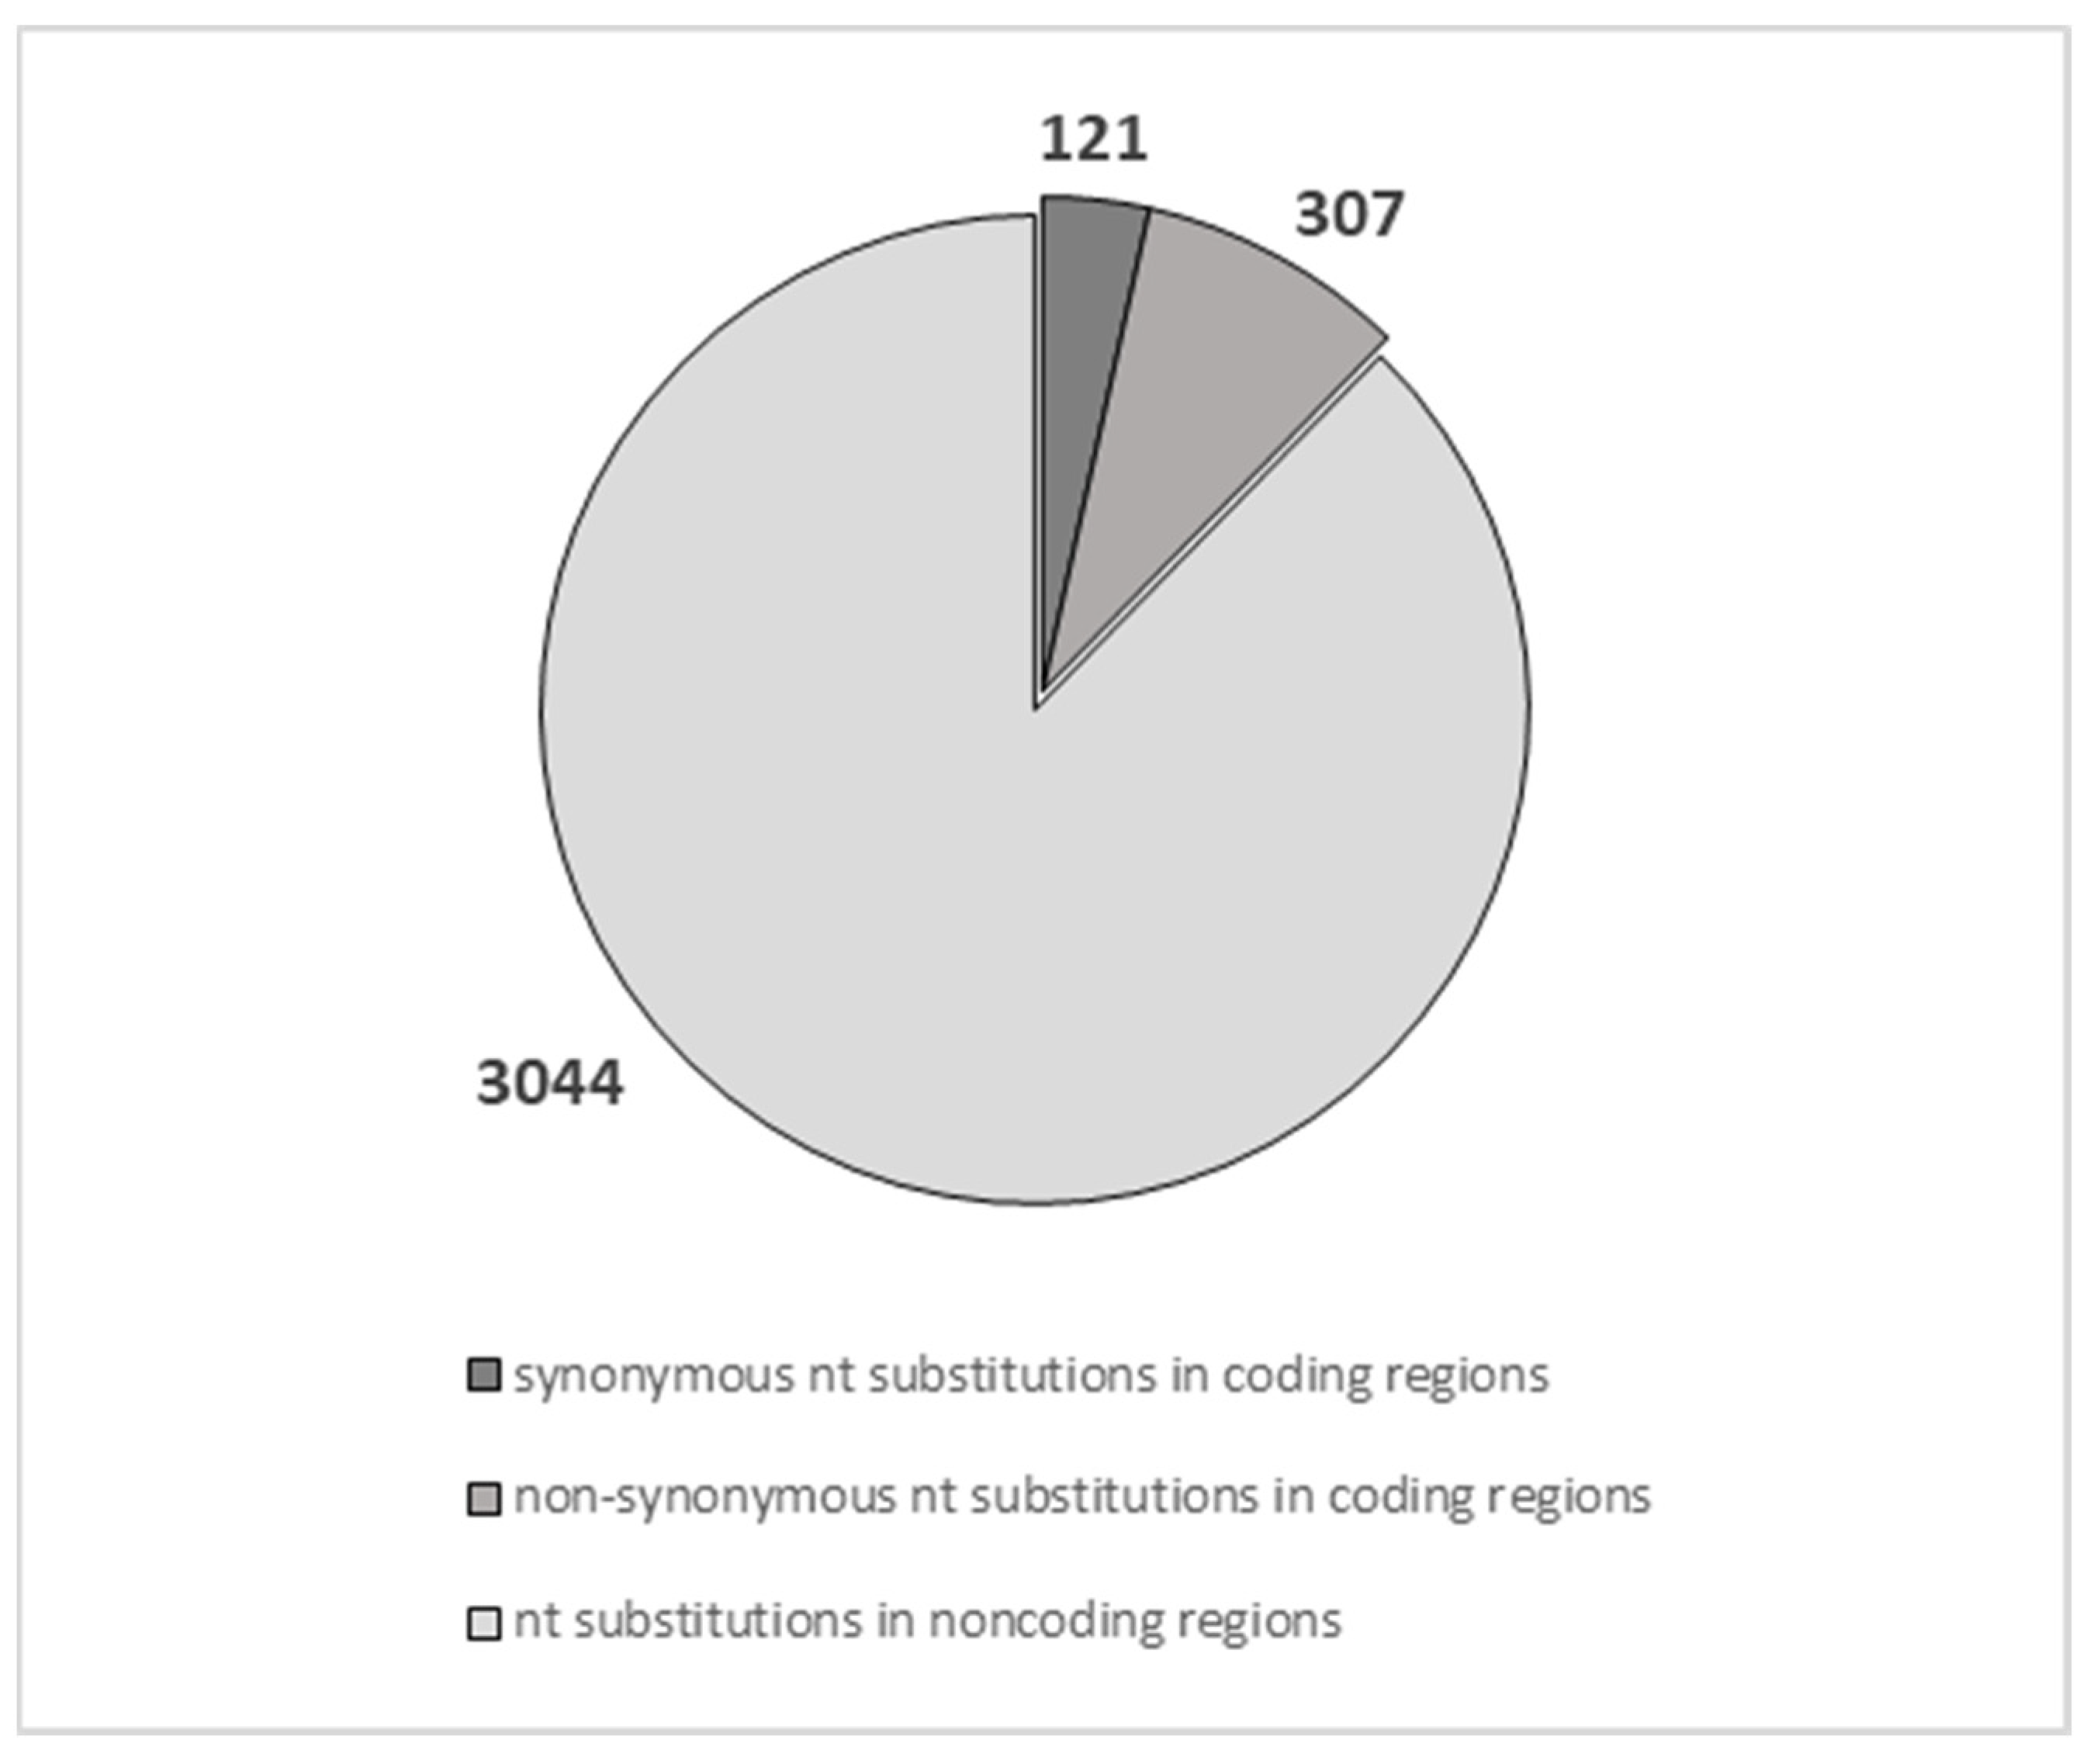
2.8. Evolutionary Pressure of Salivary Protein Genes
3. Discussion
4. Materials and Methods
4.1. Nucleotide Variants Annotation
4.2. Protein Data Analysis
4.3. Selective Pressure Analysis
5. Conclusions
Supplementary Materials
Author Contributions
Funding
Data Availability Statement
Acknowledgments
Conflicts of Interest
References
- Cabras, T.; Iavarone, F.; Manconi, B.; Olianas, A.; Sanna, M.T.; Castagnola, M.; Messana, I. Top-down analytical platforms for the characterization of the human salivary proteome. Bioanalysis 2014, 6, 563–581. [Google Scholar] [CrossRef] [PubMed]
- Bandhakavi, S.; Stone, M.D.; Onsongo, G.; Van Riper, S.K.; Griffin, T.J. A Dynamic Range Compression and Three-Dimensional Peptide Fractionation Analysis Platform Expands Proteome Coverage and the Diagnostic Potential of Whole Saliva. J. Proteome Res. 2009, 8, 5590–5600. [Google Scholar] [CrossRef] [PubMed]
- Vila, T.; Rizk, A.M.; Sultan, A.S.; Jabra-Rizk, M.A. The power of saliva: Antimicrobial and beyond. PLoS Pathog. 2019, 15, e1008058. [Google Scholar] [CrossRef]
- Ngo, L.H.; Veith, P.D.; Chen, Y.Y.; Chen, D.; Darby, I.B.; Reynolds, E.C. Mass Spectrometric Analyses of Peptides and Proteins in Human Gingival Crevicular Fluid. J. Proteome Res. 2010, 9, 1683–1693. [Google Scholar] [CrossRef] [PubMed]
- Boroumand, M.; Olianas, A.; Cabras, T.; Manconi, B.; Fanni, D.; Faa, G.; Desiderio, C.; Messana, I.; Castagnola, M. Saliva, a bodily fluid with recognized and potential diagnostic applications. J. Sep. Sci. 2021, 44, 3677–3690. [Google Scholar] [CrossRef]
- Beeley, J.A. Basic proline-rich proteins: Multifunctional defence molecules? Oral Dis. 2012, 7, 69–70. [Google Scholar] [CrossRef]
- Hajishengallis, G.; Russell, M.W. Innate Humoral Defense Factors. Mucosal Immunol. 2015, 1, 251–270. [Google Scholar] [CrossRef]
- Lyons, K.M.; Azen, E.A.; Goodman, P.A.; Smithies, O. Many protein products from a few loci: Assignment of human salivary proline-rich proteins to specific loci. Genetics 1988, 120, 255–265. [Google Scholar] [CrossRef]
- Padiglia, A.; Orrù, R.; Boroumand, M.; Olianas, A.; Manconi, B.; Sanna, M.T.; Desiderio, C.; Iavarone, F.; Liori, B.; Messana, I.; et al. Extensive Characterization of the Human Salivary Basic Proline-Rich Protein Family by Top-Down Mass Spectrometry. J. Proteome Res. 2018, 17, 3292–3307. [Google Scholar] [CrossRef]
- Manconi, B.; Castagnola, M.; Cabras, T.; Olianas, A.; Vitali, A.; Desiderio, C.; Sanna, M.T.; Messana, I. The intriguing heterogeneity of human salivary proline-rich proteins. J. Proteom. 2016, 134, 47–56. [Google Scholar] [CrossRef]
- Lyons, K.M.; Stein, J.H.; Smithies, O. Length polymorphisms in human proline-rich protein genes generated by intragenic unequal crossing over. Genetics 1988, 120, 267–278. [Google Scholar] [CrossRef] [PubMed]
- Azen, E.A.; Amberger, E.; Fisher, S.; Prakobphol, A.; Niece, R.L. PRB1, PRB2, and PRB4 coded polymorphisms among human salivary concanavalin-A binding, II-1, and Po proline-rich proteins. Am. J. Hum. Genet. 1966, 58, 143–153. [Google Scholar]
- Messana, I.; Cabras, T.; Pisano, E.; Sanna, M.T.; Olianas, A.; Manconi, B.; Pellegrini, M.; Paludetti, G.; Scarano, E.; Fiorita, A.; et al. Trafficking and Postsecretory Events Responsible for the Formation of Secreted Human Salivary Peptides: A Proteomics Approach. Mol. Cell. Proteom. 2008, 7, 911–926. [Google Scholar] [CrossRef] [PubMed]
- Jensen, J.L.; Lamkin, M.S.; Troxler, R.F.; Oppenheim, F.G. Multiple forms of statherin in human salivary secretions. Arch. Oral Biol. 1991, 36, 529–534. [Google Scholar] [CrossRef] [PubMed]
- Inzitari, R.; Cabras, T.; Rossetti, D.V.; Fanali, C.; Vitali, A.; Pellegrini, M.; Paludetti, G.; Manni, A.; Giardina, B.; Messana, I.; et al. Detection in human saliva of different statherin and P-B fragments and derivatives. Proteomics 2006, 6, 6370–6379. [Google Scholar] [CrossRef]
- Cabras, T.; Inzitari, R.; Fanali, C.; Scarano, E.; Patamia, M.; Sanna, M.T.; Pisano, E.; Giardina, B.; Castagnola, M.; Messana, I. HPLC–MS characterization of cyclo-statherin Q-37, a specific cyclization product of human salivary statherin generated by transglutaminase 2. J. Sep. Sci. 2006, 29, 2600–2608. [Google Scholar] [CrossRef]
- Torres, P.; Castro, M.; Reyes, M.; Torres, V. Histatins, wound healing, and cell migration. Oral Dis. 2018, 24, 1150–1160. [Google Scholar] [CrossRef]
- Castagnola, M.; Inzitari, R.; Rossetti, D.V.; Olmi, C.; Cabras, T.; Piras, V.; Nicolussi, P.; Sanna, M.T.; Pellegrini, M.; Giardina, B.; et al. A Cascade of 24 Histatins (Histatin 3 Fragments) in Human Saliva: Suggestion for a Pre-Secretory Sequential Cleavage Pathway. J. Biol. Chem. 2004, 279, 41436–41443. [Google Scholar] [CrossRef]
- Wang, G. Human Antimicrobial Peptides and Proteins. Pharmaceuticals 2014, 7, 545–594. [Google Scholar] [CrossRef]
- Dickinson, D.P. Cysteine peptidases of mammals: Their biological roles and potential effects in the oral cavity and other tissues in health and disease. Crit. Rev. Oral Biol. Med. 2022, 13, 238–275. [Google Scholar] [CrossRef]
- Manconi, B.; Liori, B.; Cabras, T.; Vincenzoni, F.; Iavarone, F.; Castagnola, M.; Messana, I.; Olianas, A. Salivary Cystatins: Exploring New Post-Translational Modifications and Polymorphisms by Top-Down High-Resolution Mass Spectrometry. J. Proteome Res. 2017, 16, 4196–4207. [Google Scholar] [CrossRef] [PubMed]
- Perry, G.H.; Dominy, N.J.; Claw, K.G.; Lee, A.S.; Fiegler, H.; Redon, R.; Werner, J.; Villanea, F.A.; Mountain, J.L.; Misra, R.; et al. Diet and the evolution of human amylase gene copy number variation. Nat. Genet. 2007, 39, 1256–1260. [Google Scholar] [CrossRef] [PubMed]
- Polley, S.; Louzada, S.; Forni, D.; Sironi, M.; Balaskas, T.; Hains, D.S.; Yang, F.; Hollox, E.J. Evolution of the rapidly mutating human salivary agglutinin gene (DMBT1) and population subsistence strategy. Proc. Natl. Acad. Sci. USA 2015, 112, 5105–5110. [Google Scholar] [CrossRef] [PubMed]
- Xu, D.; Pavlidis, P.; Taskent, R.O.; Alachiotis, N.; Flanagan, C.; DeGiorgio, M.; Blekhman, R.; Ruhl, S.; Gokcumen, O. Archaic Hominin Introgression in Africa Contributes to Functional Salivary MUC7 Genetic Variation. Mol. Biol. Evol. 2017, 34, 2704–2715. [Google Scholar] [CrossRef]
- Xu, D.; Pavlidis, P.; Thamadilok, S.; Redwood, E.; Fox, S.; Blekhman, R.; Ruhl, S.; Gokcumen, O. Recent evolution of the salivary mucin MUC7. Sci. Rep. 2016, 6, 31791. [Google Scholar] [CrossRef] [PubMed]
- Thamadilok, S.; Choi, K.S.; Ruhl, L.; Schulte, F.; Kazim, A.L.; Hardt, M.; Gokcumen, O.; RuhL, S. Human and Nonhuman Primate Lineage-Specific Footprints in the Salivary Proteome. Mol. Biol. Evol. 2020, 37, 395–405. [Google Scholar] [CrossRef] [PubMed]
- Edwards, A.W.F. The Genetical Theory of Natural Selection. Genetics 2000, 154, 1419–1426. [Google Scholar] [CrossRef]
- Lynch, M. Rate, molecular spectrum, and consequences of human mutation. Proc. Natl. Acad. Sci. USA 2010, 107, 961–968. [Google Scholar] [CrossRef]
- Marcus, J.H.; Novembre, J. Visualizing the geography of genetic variants. Bioinformatics 2017, 33, 594–595. [Google Scholar] [CrossRef]
- Yi, X.; Liang, Y.; Huerta-Sanchez, E.; Jin, X.; Cuo, Z.X.; Pool, J.E.; Xu, X.; Jiang, H.; Vinckenbosch, N.; Korneliussen, T.S.; et al. Sequencing of 50 human exomes reveals adaptation to high altitude. Science 2010, 329, 75–78. [Google Scholar] [CrossRef]
- Tajima, F. Statistical method for testing the neutral mutation hypothesis by DNA polymorphism. Genetics 1989, 123, 585–595. [Google Scholar] [CrossRef] [PubMed]
- Skoglund, P.; Jakobsson, M. Archaic human ancestry in East Asia. Proc. Natl. Acad. Sci. USA 2011, 108, 18301–18306. [Google Scholar] [CrossRef] [PubMed]
- Sankararaman, S.; Mallick, S.; Patterson, N.; Reich, D. The Combined Landscape of Denisovan and Neanderthal Ancestry in Present-Day Humans. Curr. Biol. 2016, 26, 1241–1247. [Google Scholar] [CrossRef]
- Racimo, F.; Marnetto, D.; Huerta-Sánchez, E. Signatures of Archaic Adaptive Introgression in Present-Day Human Populations. Mol. Biol. Evol. 2017, 34, 296–317. [Google Scholar] [CrossRef]
- Jagoda, E.; Lawson, D.J.; Wall, J.D.; Lambert, D.; Muller, C.; Westaway, M.; Leavesley, M.; Capellini, T.D.; Mirazón Lahr, M.; Gerbault, P.; et al. Disentangling Immediate Adaptive Introgression from Selection on Standing Introgressed Variation in Humans. Mol. Biol. Evol. 2018, 35, 623–630. [Google Scholar] [CrossRef] [PubMed]
- Vernot, B.; Akey, J.M. Resurrecting surviving Neandertal lineages from modern human genomes. Science 2014, 343, 1017–1021. [Google Scholar] [CrossRef] [PubMed]
- Weyrich, L.S.; Duchene, S.; Soubrier, J.; Arriola, L.; Llamas, B.; Breen, J.; Morris, A.G.; Alt, K.W.; Caramelli, D.; Dresely, V.; et al. Neanderthal behaviour, diet, and disease inferred from ancient DNA in dental calculus. Nature 2017, 544, 357–361. [Google Scholar] [CrossRef] [PubMed]
- El Zaatari, S.; Grine, F.E.; Ungar, P.S.; Hublin, J.J. Neandertal versus Modern Human Dietary Responses to Climatic Fluctuations. PLoS ONE 2016, 11, e0153277. [Google Scholar] [CrossRef]
- Cornejo Ulloa, P.; van der Veen, M.H.; Krom, B.P. Review: Modulation of the oral microbiome by the host to promote ecological balance. Odontology 2019, 107, 437–448. [Google Scholar] [CrossRef]
- Lamont, R.J.; Jenkinson, H.F. Subgingival colonization by Porphyromonas gingivalis. Oral Microbiol. Immunol. 2000, 15, 341–349. [Google Scholar] [CrossRef]
- Laputková, G.; Schwartzová, V.; Bánovčin, J.; Alexovič, M.; Sabo, J. Salivary Protein Roles in Oral Health and as Predictors of Caries Risk. Open Life Sci. 2018, 13, 174–200. [Google Scholar] [CrossRef] [PubMed]
- Lynge Pedersen, A.M.; Belstrøm, D. The role of natural salivary defences in maintaining a healthy oral microbiota. J. Dent. 2019, 80, S3–S12. [Google Scholar] [CrossRef] [PubMed]
- Chen, W.; Jiang, Q.; Yan, G.; Yang, D. The oral microbiome and salivary proteins influence caries in children aged 6 to 8 years. BMC Oral Health 2020, 20, 295. [Google Scholar] [CrossRef] [PubMed]
- Cabras, T.; Melis, M.; Castagnola, M.; Padiglia, A.; Tepper, B.J.; Messana, I.; Tomassini Barbarossa, I. Responsiveness to 6-n-Propylthiouracil (PROP) Is Associated with Salivary Levels of Two Specific Basic Proline-Rich Proteins in Humans. PLoS ONE 2012, 7, e30962. [Google Scholar] [CrossRef]
- Rodrigues, L.; Costa, G.; Cordeiro, C.; Pinheiro, C.; Amado, F.; Lamy, E. Salivary proteome and glucose levels are related with sweet taste sensitivity in young adults. Food Nutr. Res. 2017, 61, 1389208. [Google Scholar] [CrossRef]
- Stolle, T.; Grondinger, F.; Dunkel, A.; Meng, C.; Médard, G.; Kuster, B.; Hofmann, T. Salivary Proteome Patterns Affecting Human Salt Taste Sensitivity. J. Agric. Food Chem. 2017, 65, 9275–9286. [Google Scholar] [CrossRef]
- Scinska-Bienkowska, A.; Wrobel, E.; Turzynska, D.; Bidzinski, A.; Jezewska, E.; Sienkiewicz-Jarosz, H.; Golembiowska, K.; Kostowski, W.; Kukwa, A.; Plaznik, A.; et al. Glutamate concentration in whole saliva and taste responses to monosodium glutamate in humans. Nutr. Neurosci. 2006, 9, 25–31. [Google Scholar] [CrossRef]
- Méjean, C.; Morzel, M.; Neyraud, E.; Issanchou, S.; Martin, C.; Bozonnet, S.; Urbano, C.; Schlich, P.; Hercberg, S.; Péneau, S.; et al. Salivary Composition Is Associated with Liking and Usual Nutrient Intake. PLoS ONE 2015, 10, e0137473. [Google Scholar] [CrossRef]
- Morzel, M.; Chabanet, C.; Schwartz, C.; Lucchi, G.; Ducoroy, P.; Nicklaus, S. Salivary protein profiles are linked to bitter taste acceptance in infants. Eur. J. Pediatr. 2014, 173, 575–582. [Google Scholar] [CrossRef]
- Perry, G.H.; Kistler, L.; Kelaita, M.A.; Sams, A.J. Insights into hominin phenotypic and dietary evolution from ancient DNA sequence data. J. Hum. Evol. 2015, 79, 55–63. [Google Scholar] [CrossRef]
- Green, R.E.; Krause, J.; Briggs, A.W.; Maricic, T.; Stenzel, U.; Kircher, M.; Patterson, N.; Li, H.; Zhai, W.; Fritz, M.H.; et al. A Draft Sequence of the Neandertal Genome. Science 2010, 328, 710–722. [Google Scholar] [CrossRef] [PubMed]
- Burbano, H.A.; Hodges, E.; Green, R.E.; Briggs, A.W.; Krause, J.; Meyer, M.; Good, J.M.; Maricic, T.; Johnson, P.L.; Xuan, Z.; et al. Targeted Investigation of the Neandertal Genome by Array-Based Sequence Capture. Science 2010, 328, 723–725. [Google Scholar] [CrossRef] [PubMed]
- Bode, W.; Engh, R.; Musil, D.; Thiele, U.; Huber, R.; Karshikov, A.; Brzin, J.; Kos, J.; Turk, V. The 2.0 A X-ray crystal structure of chicken egg white cystatin and its possible mode of interaction with cysteine proteinases. EMBO J. 1988, 7, 2593–2599. [Google Scholar] [CrossRef] [PubMed]
- Mednikova, B.B. A Proximal Pedal Phalanx of a Paleolithic Hominin from Denisova Cave, Altai. Archaeol. Ethnol. Anthropol. Eurasia 2011, 39, 129–138. [Google Scholar] [CrossRef]
- Meyer, M.; Kircher, M.; Gansauge, M.T.; Li, H.; Racimo, F.; Mallick, S.; Schraiber, J.G.; Jay, F.; Prüfer, K.; de Filippo, C.; et al. A high-coverage genome sequence from an archaic Denisovan individual. Science 2012, 338, 222–226. [Google Scholar] [CrossRef]
- Prüfer, K.; de Filippo, C.; Grote, S.; Mafessoni, F.; Korlević, P.; Hajdinjak, M.; Vernot, B.; Skov, L.; Hsieh, P.; Peyrégne, S.; et al. A high-coverage Neandertal genome from Vindija Cave in Croatia. Science 2017, 358, 655–658. [Google Scholar] [CrossRef]
- Prüfer, K.; Racimo, F.; Patterson, N.; Jay, F.; Sankararaman, S.; Sawyer, S.; Heinze, A.; Renaud, G.; Sudmant, P.H.; de Filippo, C.; et al. The complete genome sequence of a Neanderthal from the Altai Mountains. Nature 2014, 505, 43–49. [Google Scholar] [CrossRef]
- Mafessoni, F.; Grote, S.; de Filippo, C.; Slon, V.; Kolobova, K.A.; Viola, B.; Markin, S.V.; Chintalapati, M.; Peyrégne, S.; Skov, L.; et al. A high-coverage Neandertal genome from Chagyrskaya Cave. Proc. Natl. Acad. Sci. USA 2020, 117, 15132–15136. [Google Scholar] [CrossRef]
- Robinson, J.T.; Thorvaldsdóttir, H.; Winckler, W.; Guttman, M.; Lander, E.S.; Getz, G.; Mesirov, J.P. Integrative genomics viewer. Nat. Biotechnol. 2011, 29, 24–26. [Google Scholar] [CrossRef]
- Thorvaldsdottir, H.; Robinson, J.T.; Mesirov, J.P. Integrative Genomics Viewer (IGV): High-performance genomics data visualization and exploration. Brief. Bioinform. 2013, 14, 178–192. [Google Scholar] [CrossRef]
- Robinson, J.T.; Thorvaldsdóttir, H.; Wenger, A.M.; Zehir, A.; Mesirov, J.P. Variant Review with the Integrative Genomics Viewer. Cancer Res. 2017, 77, e31–e34. [Google Scholar] [CrossRef] [PubMed]
- Ng, P.C. SIFT: Predicting amino acid changes that affect protein function. Nucleic Acids Res. 2003, 31, 3812–3814. [Google Scholar] [CrossRef] [PubMed]
- Pfeifer, B.; Alachiotis, N.; Pavlidis, P.; Schimek, M.G. Genome scans for selection and introgression based on k-nearest neighbour techniques. Mol. Ecol. Resour. 2020, 20, 1597–1609. [Google Scholar] [CrossRef] [PubMed]
- Bhatia, G.; Patterson, N.; Pasaniuc, B.; Zaitlen, N.; Genovese, G.; Pollack, S.; Mallick, S.; Myers, S.; Tandon, A.; Spencer, C.; et al. Genome-wide comparison of African-ancestry populations from CARe and other cohorts reveals signals of natural selection. Am. J. Hum. Genet. 2011, 89, 368–381. [Google Scholar] [CrossRef]
- Danecek, P.; Auton, A.; Abecasis, G.; Albers, C.A.; Banks, E.; DePristo, M.A.; Handsaker, R.E.; Lunter, G.; Marth, G.T.; Sherry, S.T.; et al. The variant call format and VCFtools. Bioinformatics 2011, 27, 2156–2158. [Google Scholar] [CrossRef]
- Purcell, S.; Neale, B.; Todd-Brown, K.; Thomas, L.; Ferreira, M.A.; Bender, D.; Maller, J.; Sklar, P.; de Bakker, P.I.; Daly, M.J.; et al. PLINK: A tool set for whole-genome association and population-based linkage analyses. Am. J. Hum. Genet. 2007, 81, 559–575. [Google Scholar] [CrossRef]


| Chromosome Position (hg19) | Gene Region | Modern Human | Altai Neanderthal (Variant Frequency a) | Chagyrskaya Neanderthal (Variant Frequency a) | Vindija Neanderthal (Variant Frequency a) | Denisovan (Variant Frequency a) | Codon→Amino Acid | SNP id | SNP Total Frequency (ALFA) | SIFT Results (Score) |
|---|---|---|---|---|---|---|---|---|---|---|
| PRB1 (reverse reading, chromosome 12) | ||||||||||
| 11,507,477 | Exon 2 (II-2) | CTT | CTT (100%) | TTT (13%) | TTT (7%) * | CTT (100%) | GAA→E10 AAA→K10 | n.a. | n.a. | Damaging (0.02) |
| 11,507,464 | Exon 2 (II-2) | AGG | AGG (100%) | AGG (100%) | AAG (12%) | AGG (100%) | UCC→S14 UUC→F14 | rs1173856027 | A = 0% | Tolerated (0.72) |
| 11,506,888 | Exon 3 (II-2) | GGG | GGG (100%) | GGG (100%) | GAG (12%) | GGG (100%) | CCC→P35 CUC→L35 | n.a. | n.a. | Tolerated (0.06) |
| 11,506,856 | Exon 3 (II-2) | GGG | GGG (100%) | AGG (11%) | GGG (100%) | GGG (100%) | CCC→P45 UCC→S45 | rs762910991 | A = 0.003% | Tolerated (0.17) |
| 11,506,853 | Exon 3 (II-2) | GGT | TGT (3%) * | GGT (100%) | AGT (15%) | GGT (100%) | CCA→P46 UCA→S46 | rs745726339 | A = 0% | Damaging (0) |
| 11,506,852 | Exon 3 (II-2) | GGT | GGT (100%) | GGT (100%) | GAT (11%) | GGT (100%) | CCA→P46 CUA→L46 | n.a. | n.a. | Damaging (0) |
| 11,506,804 | Exon 3 (II-2) | GTT | GAT (61%) | GAT (63%) | GAT (60%) | GTT (100%) | CAA→Q62 CUA→L62 | n.a. | n.a. | Tolerated (0.29) |
| 11,506,801 | Exon 3 (II-2) | CCT | CCT (100%) | CTT (11%) | CTT (5%) * | CCT (100%) | GGA→G63 GAA→E63 | n.a. | n.a. | Damaging (0.01) |
| 11,506,790 | Exon 3 (II-2) | GTT | GTT (100%) | ATT (11%) | ATT (6%) * | GTT (100%) | CAA→Q67 UAA→stop | rs1409612167 | A = 0% | Damaging due to stop |
| 11,506,784 | Exon 3 (II-2) | CTG | CTG (100%) | CTG (100%) | TTG (13%) | CTG (100%) | GAC→D69 AAC→N69 | rs554211998 | T = 0% | Tolerated (0.95) |
| 11,506,774 | Exon 3 (II-2) | GCT | GTT (13%) | GTT (8%) * | GTT (6%) * | GTT (9%) * | CGA→R72 CAA→Q72 | rs202083397 | T = 10.6% | Tolerated (0.08) |
| 11,506,766 | Exon 3 (II-2) | GCT | GCT (100%) | GCT (100%) | ACT (12%) | GCT (100%) | CGA→R75 UGA→stop | rs766131639 | A = 0% | Damaging due to stop |
| 11,506,730 | Exon 3 (Ps-2) | GTT | GTT (100%) | ATT (16%) | GTT (100%) | GTT (100%) | CAA→Q12 UAA→stop | n.a. | n.a. | Damaging due to stop |
| 11,506,723 | Exon 3 (Ps-2) | CCA | CCA (100%) | CTA (12%) | CTA (3%) * | CCA (100%) | GGU→G14 GAU→D14 | rs534597111 | T = 0% | NS |
| 11,506,669 | Exon 3 (Ps-2) | GGT | GTT (39%) | GTT (36%) | GTT (55%) | GTT (26%) | CCA→P32 CAA→Q32 | rs772365043 | C = 0% | NS |
| 11,506,618 | Exon 3 (Ps-2) | CCT | CCT (100%) | CTT (17%) | CTT (3%) * | CCT (100%) | GGA→G49 GAA→E49 | n.a. | n.a. | NS |
| 11,506,612 | Exon 3 (Ps-2) | GGG | GGG (100%) | GAG (11%) | GGG (100%) | GGG (100%) | CCC→P51 CUC→L51 | n.a. | n.a. | NS |
| 11,506,577 | Exon 3 (IB-6) | GGA | GGA (100%) | AGA (13%) | GGA (100%) | GGA (100%) | CCU→P2 UCU→S2 | n.a. | n.a. | NS |
| 11,506,514 | Exon 3 (IB-6) | GGA | GGA (100%) | AGA (6%) * | AGA (11%) | GGA (100%) | CCU→P23 UCU→S23 | n.a. | n.a. | NS |
| 11,506,492 | Exon 3 (IB-6) | GGT | GGT (100%) | GGT (100%) | GAT (13%) | GGT (100%) | CCA→P30 CUA→L30 | n.a. | n.a. | NS |
| 11,506,490 | Exon 3 (IB-6) | GGG | AGG (5%) * | AGG (18%) | AGG (8%) * | GGG (100%) | CCC→P31 UCC→S31 | n.a. | n.a. | NS |
| 11,506,486 | Exon 3 (IB-6) | GGT | GGT (100%) | GGT (100%) | GTT (18%) | GGT (100%) | CCA→P32 CAA→Q32 | rs755622101 | T = 1.3% | NS |
| 11,506,473 | Exon 3 (Ps-2) | TTC | TTG(100%) | TTG(83%) ** | TTG(100%) ** | TTG(75%) ** | AAG→K37 AAC→N37 | rs61930109 | G = 72.1% | NS |
| 11,506,403 | Exon 3 (Ps-2) | AGG | GGG (50%) ** | GGG (50%) ** | AGG (100%) ** | GGG (100%) | UCC→S59 CCC→P59 | n.a. | n.a. | NS |
| 11,506,370 | Exon 3 (Ps-2) | GGG | GGG (100%) | GGG (100%) | AGG (21%) | GGG (100%) | CCC→P70 UCC→S70 | rs774158904 | A = 0% | NS |
| 11,506,369 | Exon 3 (Ps-2) | GGG | GGG (93%) | GGG (100%) | GAG (16%) | GGG (100%) | CCC→P71 CUC→L71 | rs369001998 | A = 0.007% | NS |
| 11,506,339 | Exon 3 (Ps-2) | GGG | GGG (97%) | GAG (5%) * | GAG (23%) | GGG (100%) | CCC→P81 CUC→L81 | n.a. | n.a. | NS |
| 11,506,333 | Exon 3 (Ps-2) | GGA | GGA (100%) | GAA (5%) * | GAA (11%) | GGA (100%) | CCU→P83 CUU→L83 | n.a. | n.a. | NS |
| 11,506,309 | Exon 3 (Ps-2) | GGT | GAT (4%) * | GAT (6%) * | GAT (17%) | GGT (100%) | CCA→P91 CUU→L91 | n.a. | n.a. | Damaging (0.01) |
| 11,506,303 | Exon 3 (Ps-2) | GGT | GTT (3%) * | GTT (13%) | GGT (100%) | GGT (100%) | CCA→P93 CAA→Q93 | rs201682460 | T = 2.8% | Damaging (0) |
| 11,506,301 | Exon 3 (Ps-2) | GTT | ATT (4%) * | GTT (100%) | ATT (15%) | GTT (100%) | CAA→Q94 UAA→stop | n.a. | n.a. | Damaging due to stop |
| 11,506,285 | Exon 3 (Ps-2) | GGA | GGA (100%) | GGA (100%) | GAA (14%) | GGA (100%) | CCU→P99 CUU→L99 | n.a. | n.a. | Damaging (0.01) |
| 11,506,283 | Exon 3 (Ps-2) | GTT | GTT (100%) | ATT (14%) | ATT (13%) | GTT (100%) | CAA→Q100 UAA→stop | n.a. | n.a. | Damaging due to stop |
| 11,506,250 | Exon 3 (Ps-2) | GGT | GGT (100%) ** | GGT (100%) | AGT (14%) | GGT (100%) | CCA→P111 UCA→S111 | n.a. | n.a. | Tolerated (0.08) |
| 11,506,249 | Exon 3 (Ps-2) | GGT | GGT (100%) ** | GGT (100%) | GAT (13%) | GGT (100%) | CCA→P111 CUA→L111 | rs1208300501 | A = 0% | Tolerated (0.09) |
| 11,506,246 | Exon 3 (Ps-2) | GGG | GGG (100%) ** | GAG (18%) | GGG (100%) | GGG (100%) | CCC→P112 CUC→L112 | rs1303924609 | A = 0% | Damaging (0.02) |
| 11,506,241 | Exon 3 (Ps-2) | GTT | GTT (100%) ** | GTT (100%) | ATT (14%) | GTT (100%) | CAA→Q114 UAA→stop | rs751826141 | A = 0% | Damaging due to stop |
| 11,506,217 | Exon 3 (IB-6) | CGG | GGG (67%) ** | GGG (17%) ** | GGG (25%) | CGG (100%) | GCC→A61 CCC→P61 | rs771648794 | G = 0.04% | Tolerated (1) |
| 11,506,154 | Exon 3 (IB-6) | GGG | GGG (100%) | AGG (17%) | AGG (4%) * | GGG (100%) | CCC→P82 UCC→S82 | n.a. | n.a. | Tolerated (0.15) |
| 11,506,150 | Exon 3 (IB-6) | GGT | GGT (100%) | GAT (14%) | GGT (100%) | GAT (6%) * | CCA→P83 CUA→L83 | rs747444571 | A = 0% | Damaging (0.03) |
| 11,506,079 | Exon 3 (IB-6) | GGA | GGA (100%) | GGA (100%) | AGA (13%) | GGA (100%) | CCU→P107 UCU→S107 | n.a. | n.a. | Tolerated (0.06) |
| 11,506,075 | Exon 3 (IB-6) | GGA | GGA (100%) | GGA (100%) | GAA (13%) | GGA (100%) | CCU→P108 CUU→L108 | n.a. | n.a. | Damaging (0.01) |
| 11,506,070 | Exon 3 (IB-6) | CCC | CCC (100%) | CCC (100%) | TCC (12%) | CCC (100%) | GGG→G110 AGG→R110 | n.a. | n.a. | Tolerated (0.3) |
| 11,506,057 | Exon 3 (IB-6) | AGG | AGG (100%) | AAG (11%) | AAG (5%) * | AGG (100%) | UCC→S114 UUC→F114 | n.a. | n.a. | Damaging (0.03) |
| 11,506,052 | Exon 3 (IB-6) | GGA | GGA (100%) | AGA (10%) * | AGA (18%) | GGA (100%) | CCU→P116 UCU→S116 | rs1372423355 | A = 0% | Tolerated (0.06) |
| PRB2 (reverse reading, chromosome 12) | ||||||||||
| 11,548,429 | Exon 1 (Signal) | CGG | CGG (100%) | CAG (3%) * | CAG (13%) | CGG (100%) | GCC→A11(sp) GUC→V11(sp) | rs1415819382 | A = 0% | Damaging (0) |
| 11,547,429 | Exon 2 (IB-1) | CCT | TCT (4%) * | CCT (100%) | TCT (12%) | CCT (100%) | GGA→G18 AGA→R18 | n.a. | n.a. | Damaging (0.2) |
| 11,546,899 | Exon 3 (IB-1) | CCT | CCT (100%) | CTT (11%) | CCT (100%) | CCT (100%) | GGA→G22 GAA→E22 | rs188924826 | T = 0.007% | Tolerated (0.1) |
| 11,546,894 | Exon 3 (IB-1) | GGG | GGG (100%) | AGG (14%) | GGG (100%) | GGG (100%) | CCC→P24 UCC→S24 | n.a. | n.a. | Tolerated (0.73) |
| 11,546,872 | Exon 3 (IB-1) | GGA | GGA (100%) | GGA (100%) | GAA (11%) | GGA (100%) | CCU→P31 CUU→L31 | rs748769813 | A = 0% | Tolerated (0.46) |
| 11,546,830 | Exon 3 (IB-1) | GGG | GGG (100%) | GAG (9%) * | GAG (17%) | GGG (100%) | CCC→P45 CUC→L45 | n.a. | n.a. | Tolerated (0.1) |
| 11,546,828 | Exon 3 (IB-1) | GGT | AGT (3%) * | GGT (100%) | AGT (17%) | GGT (100%) | CCA→P46 UCA→S46 | rs755161117 | A = 0.007% | Tolerated (0.36) |
| 11,546,825 | Exon 3 (IB-1) | GTT | GTT (97%) | GTT (100%) | ATT (17%) | GTT (100%) | CAA→Q47 UAA→stop | n.a. | n.a. | Damaging due to stop |
| 11,546,810 | Exon 3 (IB-1) | GGA | GGA (100%) | GGA (100%) | AGA (13%) | GGA (100%) | CCU→P52 UCU→S52 | rs1347881375 | A = 0% | Tolerated (0.97) |
| 11,546,809 | Exon 3 (IB-1) | GGA | GGA (100%) | GAA (6%) * | GAA (12%) | GGA (100%) | CCU→P52 CUU→L52 | n.a. | n.a. | Tolerated (0.3) |
| 11,546,807 | Exon 3 (IB-1) | GTT | GTT (97%) | ATT (11%) | ATT (11%) | GTT (100%) | CAA→Q53 UAA→stop | n.a. | n.a. | Damaging due to stop |
| 11,546,792 | Exon 3 (IB-1) | GGA | GGA (100%) | AGA (18%) | GGA (100%) | GGA (100%) | CCU→P58 UCU→S58 | n.a. | n.a. | Tolerated (0.76) |
| 11,546,780 | Exon 3 (IB-1) | GGT | GGT (100%) | GGT (100%) | AGT (12%) | GGT (100%) | CCA→P62 UCA→S62 | n.a. | n.a. | Tolerated (0.64) |
| 11,546,770 | Exon 3 (IB-1) | GGT | GGT (100%) | GGT (100%) | GAT (13%) | GGT (100%) | CCA→P65 CUA→L65 | n.a. | n.a. | Tolerated (1) |
| 11,546,764 | Exon 3 (IB-1) | GGT | GGT (100%) | GGT (96%) | GAT (12%) | GGT (100%) | CCA→P67 CAA→Q67 | rs201994479 | T = 0.008% | Tolerated (0.43) |
| 11,546,732 | Exon 3 (IB-1) | GGA | GGA (100%) | GGA (100%) | AGA (13%) | GGA (100%) | CCU→P78 UCU→S78 | n.a. | n.a. | Tolerated (0.38) |
| 11,546,716 | Exon 3 (IB-1) | GTT | GAT (4%) * | GAT (14%) | GTT (97%) | GTT (100%) | CAA→Q83 CUA→L83 | n.a. | n.a. | Tolerated (0.32) |
| 11,546,686 | Exon 3 (IB-1) | GCT | GTT (42%) | GTT (39%) | GTT (51%) | GTT (29%) | CGA→R93 CAA→Q93 | rs76832300 | n.a. | Tolerated (0.5) |
| 11,546,677 | Exon 3 (IB-1) | GCT | GCT (100%) | GCT (100%) | GCT (100%) | GTT (24%) | CGA→R96 CAA→Q96 | rs201144571 | T = 0.08% | Tolerated (0.47) |
| 11,546,647 | Exon 3 (P-J) | GGG | GGG (100%) | GGG (100%) | GAG (15%) | GGG (100%) | CCC→P10 CUC→L10 | n.a. | n.a. | Tolerated (0.18) |
| 11,546,642 | Exon 3 (P-J) | GTT | GTT (100%) | GTT (100%) | ATT (17%) | GTT (100%) | CAA→Q12 UAA→stop | n.a. | n.a. | Damaging due to stop |
| 11,546,627 | Exon 3 (P-J) | GGA | AGA (3%) * | AGA (11%) | AGA (5%) * | GGA (100%) | CCU→P17 UCU→S17 | n.a. | n.a. | Tolerated (0.45) |
| 11,546,618 | Exon 3 (P-J) | GGA | GGA (100%) | GGA (93%) | AGA (17%) | GGA (100%) | CCU→P20 UCU→S20 | n.a. | n.a. | Tolerated (0.81) |
| 11,546,617 | Exon 3 (P-J) | GGA | GGA (100%) | GGA (100%) | GAA (17%) | GGA (100%) | CCU→P20 CUU→L20 | rs780517289 | A = 0% | Tolerated (0.82) |
| 11,546,615 | Exon 3 (P-J) | GGT | GGT (100%) | AGT (12%) | AGT (8%) * | GGT (100%) | CCA→P21 UCA→S21 | n.a. | n.a. | Tolerated (0.39) |
| 11,546,614 | Exon 3 (P-J) | GGT | GGT (100%) | GAT (11%) | GGT (100%) | GGT (100%) | CCA→P21 CUA→L21 | n.a. | n.a. | Tolerated (0.29) |
| 11,546,585 | Exon 3 (P-J) | GGG | GGG (100%) | GGG (100%) | AGG (13%) | GGG (100%) | CCC→P31 UCC→S31 | n.a. | n.a. | Tolerated (0.53) |
| 11,546,581 | Exon 3 (P-J) | GGT | GTT (6%) * | GTT (13%) | GGT (100%) | GGT (100%) | CCA→ P32 CAA→Q32 | n.a. | n.a. | Damaging (0.05) |
| 11,546,566 | Exon 3 (P-J) | TTT | TCT (8%) * | TCT (12%) | TTT (100%) | TTT (100%) | AAA→K37 AGA→R37 | rs746515947 | C = 0% | Tolerated (1) |
| 11,546,462 | Exon 3 (IB-8a) | GGG | GGG (100%) | AGG (13%) | GGG (100%) | GGG (100%) | CCC→P9 UCC→S9 | rs201392419 | A = 0% | Tolerated (0.58) |
| 11,546,395 | Exon 3 (IB-8a) | GGT | GTT (16%) | GTT (10%) * | GTT (13%) | GTT (4%) * | CCA→P31 CAA→Q31 | rs11054277 | T = 0.01% | Damaging (0) |
| 11,546,380 | Exon 3 (IB-8a) | TTT | TCT (17%) | TCT (14%) | TCT (6%) * | TTT (100%) | AAA→K37 AGA→R37 | rs11054276 | C = 0.01% | Tolerated (1) |
| 11,546,381 | Exon 3 (IB-8a) | TTT | TTT (100%) | CTT (100%) | TTT (100%) | GTT (13%) | AAA→K37 CAA→Q37 | rs201455726 | G = 0.2% | Tolerated (0.42) |
| 11,546,369 | Exon 3 (IB-8a) | GGG | GGG (100%) | AGG (12%) | GGG (100%) | GGG (100%) | CCC→P41 UCC→S41 | rs1238238576 | A = 0% | Tolerated (0.42) |
| 11,546,347 | Exon 3 (IB-8a) | GTT | GAT (6%) * | GAT (4%) * | GAT (15%) | GTT (100%) | CAA→Q48 CUA→L48 | n.a. | n.a. | Tolerated (0.32) |
| 11,546,342 | Exon 3 (IB-8a) | GGT | GGT (100%) | GGT (100%) | AGT (18%) | GGT (100%) | CCA→P50 UCA→S50 | n.a. | n.a. | Tolerated (0.41) |
| 11,546,327 | Exon 3 (IB-8a) | CTG | CTG (100%) | TTG (11%) | TTG (18%) | CTG (100%) | GAC→D55 AAC→N55 | n.a. | n.a. | Tolerated (0.28) |
| 11,546,314 | Exon 3 (IB-8a) | GTT | GCT (87%) | GCT (77%) | GCT (67%) | GCT (94%) | CAA→Q59 CGA→R59 | rs34305575 | C = 7.6% | Tolerated (0.35) |
| 11,546,309 | Exon 3 (IB-8a) | CGG | GGG (12%) | GGG (13%) | GGG (18%) | GGG (5%) * | GCC→A61 CCC→P61 | rs201308939 | G = 3.8% | Tolerated (0.25) |
| 11,546,305 | Exon 3 (IB-8a) | GCT | GTT (3%) * | GCT (100%) | GTT (11%) | GCT (100%) | CGA→R62 CAA→Q62 | rs199748368 | T = 0.07% | Tolerated (0.46) |
| 11,546,300 | Exon 3 (IB-8a) | GGA | GGA (100%) | AGA (13%) | GGA (100%) | GGA (100%) | CCU→P64 UCU→S64 | rs755713521 | n.a. | Tolerated (0.66) |
| 11,546,294 | Exon 3 (IB-8a) | CCT | CCT (100%) | TCT (13%) | CCT (100%) | CCT (100%) | GGA→G66 AGA→R66 | n.a. | n.a. | Damaging (0.03) |
| 11,546,279 | Exon 3 (IB-8a) | GGT | AGT (2%) * | GGT (100%) | AGT (13%) | GGT (100%) | CCA→P71 UCA→S71 | n.a. | n.a. | Tolerated (0.67) |
| 11,546,278 | Exon 3 (IB-8a) | GGT | GAT (2%) * | GGT (100%) | GAT (13%) | GGT (100%) | CCA→P71 CUA→L71 | rs766408532 | n.a. | Tolerated (0.26) |
| 11,546,246 | Exon 3 (IB-8a) | GGG | GGG (100%) | GGG (100%) | AGG (14%) | GGG (100%) | CCC→P82 UCC→S82 | rs1440556057 | A = 0.0004% | Tolerated (0.42) |
| 11,546,245 | Exon 3 (IB-8a) | GGG | GGG (97%) | GAG (7%) * | GAG (26%) | GAG (7%) * | CCC→P82 CUC→L82 | rs1262267049 | A = 0.0004% | Tolerated (0.15) |
| 11,546,213 | Exon 3 (IB-8a) | GGG | GGG (100%) | AGG (8%) * | AGG (25%) | GGG (100%) | CCC→P93 UCC→S93 | rs1408969762 | n.a. | Tolerated (0.26) |
| 11,546,187 | Exon 3 (IB-8a) | GTT | GTT (96%) | GTC (10%) * | GTC (12%) | GTC (4%) * | CAA→Q101 CAC→H101 | n.a. | n.a. | Tolerated (0.23) |
| 11,546,161 | Exon 3 (IB-8a) | GTT | GAT (21%) | GTT (100%) | GAT (30%) | GTT (100%) | CAA→Q110 CUA→L110 | n.a. | n.a. | Tolerated (0.61) |
| 11,546,089 | Exon 3 (P-F) | GGG | GGG (100%) | GAG (17%) ** | GAG (17%) | GGG (100%) | CCC→P10 CUC→L10 | n.a. | n.a. | Tolerated (0.61) |
| 11,546,084 | Exon 3 (P-F) | GTT | GTT (100%) | GTT (100%) | ATT (15%) | GTT (100%) | CAA→Q12 UAA→stop | n.a. | n.a. | Damaging due to stop |
| 11,546,059 | Exon 3 (P-F) | GGG | GGG (100%) | GAG (7%) * | GAG (21%) | GGG (100%) | CCC→P20 CUC→L20 | n.a. | n.a. | Tolerated (0.19) |
| 11,546,050 | Exon 3 (P-F) | GGA | GTA (4%) * | GTA (13%) | GGA (100%) | GTA (7%) * | CCU→P23 CAU→H23 | n.a. | n.a. | Tolerated (0.56) |
| 11,546,027 | Exon 3 (P-F) | GGG | GGG (100%) | AGG (11%) | AGG (7%) * | GGG (100%) | CCC→P31 UCC→S31 | rs1201001162 | n.a. | Tolerated (0.61) |
| 11,546,023 | Exon 3 (P-F) | GGT | GGT (100%) | GTT (5%) * | GTT (13%) | GTT (4%) * | CCA→P32 CAA→Q32 | rs201391404 | T = 0.059% | Damaging (0.03) |
| 11,546,009 | Exon 3 (P-F) | TTT | TTT (100%) | TTT (100%) | TTT (95%) | GTT (12%) | AAA→K37 CAA→ Q37 | n.a. | n.a. | Tolerated (0.26) |
| 11,545,975 | Exon 3 (P-F) | GTT | GAT (2%) * | GAT (16%) | GAT (33%) | GTT (100%) | CAA→Q48 CUA→L48 | n.a. | n.a. | Tolerated (0.31) |
| 11,545,964 | Exon 3 (P-F) | GGT | GGT (100%) | CGT (20%) | CGT (22%) | CGT (19%) | CCA→P51 GCA→A51 | n.a. | n.a. | Tolerated (0.74) |
| 11,545,904 | Exon 3 (P-H) | GGG | GGG (100%) | AGG (3%) * | AGG (11%) | GGG (100%) | CCC→P10 UCC→S10 | n.a. | n.a. | Tolerated (0.8) |
| 11,545,868 | Exon 3 (P-H) | GGA | GGA (100%) | GGA (100%) | AGA (13%) | GGA (100%) | CCU→P22 UCU→S22 | n.a. | n.a. | Tolerated (0.69) |
| 11,545,814 | Exon 3 (P-H) | GTC | GTC (100%) | ATC (4%) * | ATC (12%) | GTC (100%) | CAG→Q40 UAG→stop | n.a. | n.a. | Damaging due to stop |
| 11,545,802 | Exon 3 (P-H) | GCG | GCG (100%) | GCG (100%) | ACG (11%) | GCG (100%) | CGC→R44 UGC→C44 | rs748815572 | A = 0% | Tolerated (0.07) |
| 11,545,793 | Exon 3 (P-H) | GTT | GTT (100%) | ATT (12%) | GTT (100%) | GTT (100%) | CAA→Q47 UAA→stop | n.a. | n.a. | Damaging due to stop |
| 11,545,790 | Exon 3 (P-H) | CCC | CCC (100%) | CCC (100%) | TCC (13%) | CCC (100%) | GGG→G48 AGG→R48 | n.a. | n.a. | Tolerated (0.7) |
| PRB3 (reverse reading, chromosome 12) | ||||||||||
| 11,422,578 | Exon 1 (Signal) | CGG | CGG (100%) | CAG (14%) | CAG (3%) * | CGG (100%) | GCC→A8(sp) GUC→V8(sp) | rs1337927316 | n.a. | Tolerated (0.06) |
| 11,421,578 | Exon 2 (Gl-5) | AGG | AGG (100%) | AAG (11%) | AAG (11%) | AGG (100%) | UCC→S14 UUC→F14 | n.a. | n.a. | Tolerated (0.32) |
| 11,421,002 | Exon 3 (Gl-5) | GGG | GGG (100%) | AGG (11%) | AGG (4%) * | GGG (100%) | CCC→P45 UCC→S45 | rs533382585 | n.a. | Damaging (0.04) |
| 11,420,989 | Exon 3 (Gl-5) | CCG | CCG (100%) | CTG (14%) | CTG (5%) * | CCG (96%) | GGC→G49 GAC→D49 | n.a. | n.a. | Damaging (0) |
| 11,420,975 | Exon 3 (Gl-5) | CCA | TCA (2%) * | TCA (17%) | CCA (100%) | CCA (100%) | GGU→G54 AGU→S54 | rs1197023343 | n.a. | Tolerated (0.12) |
| 11,420,974 | Exon 3 (Gl-5) | CCA | CCA (100%) | CTA (8%) * | CTA (21%) | CCA (100%) | GGU→G54 GAU→D54 | n.a. | n.a. | Tolerated (0.19) |
| 11,420,971 | Exon 3 (Gl-5) | GGG | GGG (100%) | GGG (100%) | GAG (11%) | GGG (100%) | CCC→P55 CUC→L55 | n.a. | n.a. | Damaging (0.02) |
| 11,420,956 | Exon 3 (Gl-5) | CCT | CCT (98%) | CCT (100%) | CTT (14%) | CCT (100%) | GGA→G60 GAA→E60 | rs745804122 | T = 0% | Tolerated (0.06) |
| 11,420,945 | Exon 3 (Gl-5) | CCT | CCT (100%) | CCT (100%) | TCT (14%) | TCT (4%) * | GGA→G64 AGA→R64 | rs781151188 | T = 0% | Damaging (0.02) |
| 11,420,939 | Exon 3 (Gl-5) | GGG | GGG (100%) | AGG (11%) ** | AGG (11%) | GGG (100%) | CCC→P66 UCC→S66 | n.a. | n.a. | Damaging (0.04) |
| 11,420,927 | Exon 3 (Gl-5) | CCT | CCT (100%) | CCT (100%) | TCT (11%) | CCT (100%) | GGA→G70 AGA→R70 | n.a. | n.a. | Damaging (0) |
| 11,420,926 | Exon 3 (Gl-5) | CCT | CCT (100%) | CCT (100%) | CTT (16%) | CCT (100%) | GGA→G70 GAA→E70 | n.a. | n.a. | Damaging (0) |
| 11,420,906 | Exon 3 (Gl-5) | GGT | GGT (100%) | GGT (100%) | AGT (12%) | GGT (100%) | CCA→P77 UCA→S77 | n.a. | n.a. | Damaging (0.04) |
| 11,420,899 | Exon 3 (Gl-5) | GCA | GTA (73%) | GCA (100%) | GTA (65%) | GTA (80%) | CGU→R79 CAU→H79 | rs769836435 | T = 0.02% | Tolerated (0.59) |
| 11,420,896 | Exon 3 (Gl-5) | GGC | GGC (100%) | GGC (100%) | GAC (13%) | GGC (100%) | CCG→P80 CUG→L80 | n.a. | n.a. | Tolerated (0.09) |
| 11,420,836 | Exon 3 (Gl-5) | GCA | GTA (7%) * | GTA (5%) * | GTA (9%) * | GTA (22%) | CGU→R100 CAU→H100 | n.a. | n.a. | Tolerated (0.24) |
| 11,420,815 | Exon 3 (Gl-5) | GGT | GTT (18%) | GGT (100%) | GGT (96%) | GGT (100%) | CCA→P107 CAA→Q107 | rs201963893 | T = 0% | Tolerated (0.45) |
| 11,420,803 | Exon 3 (Gl-5) | CCT | CCT (100%) | CCT (100%) | CTT (15%) | CCT (100%) | GGA→G111 GAA→E111 | n.a. | n.a. | Tolerated (0.41) |
| 11,420,800 | Exon 3 (Gl-5) | CCT | CCT (97%) | CCT (100%) | CTT (11%) | CCT (100%) | GGA→G112 GAA→E112 | n.a. | n.a. | Damaging (0.01) |
| 11,420,780 | Exon 3 (Gl-5) | GGC | GGC (100%) | AGC (11%) | GGC (100%) | GGC (100%) | CCG→P119 UCG→S119 | n.a. | n.a. | Damaging (0.04) |
| 11,420,779 | Exon 3 (Gl-5) | GGC | GAC (4%) * | GAC (6%) * | GAC (35%) | GGC (100%) | CCG→P119 CUG→L119 | n.a. | n.a. | Damaging (0.03) |
| 11,420,728 | Exon 3 (Gl-5) | AGG | AAG (4%) * | AGG (100%) | AAG (11%) | AGG (100%) | UCC→S136 UUC→F136 | n.a. | n.a. | Damaging (0.04) |
| 11,420,716 | Exon 3 (Gl-5) | GGC | GAC (4%) * | GGC (100%) | GAC (17%) | GGC (100%) | CCG→P140 CUG→L140 | n.a. | n.a. | Tolerated (0.12) |
| 11,420,687 | Exon 3 (Gl-5) | GGG | GGG (98%) | AGG (15%) | GGG (100%) | GGG (100%) | CCC→P150 UCC→S150 | n.a. | n.a. | Tolerated (0.15) |
| 11,420,686 | Exon 3 (Gl-5) | GGG | GGG (98%) | GAG (8%) * | GAG (18%) | GGG (100%) | CCC→P150 CUC→L150 | n.a. | n.a. | Tolerated (0.15) |
| 11,420,614 | Exon 3 (Gl-2) | CCT | CCT (100%) | CCT (100%) | CTT (11%) | CCT (100%) | GGA→G132 GAA→E132 | rs768625455 | n.a. | NS |
| 11,420,597 | Exon 3 (Gl-2) | CCA | CCA (100%) | CCA (100%) | TCA (13%) | CCA (100%) | GGU→G138 AGU→S138 | rs780713977 | n.a. | Tolerated (0.09) |
| 11,420,588 | Exon 3 (Gl-2) | GGA | AGA (4%) * | AGA (10%) * | AGA (16%) | GGA (100%) | CCU→P141 UCU→S141 | n.a. | n.a. | Tolerated (0.78) |
| 11,420,495 | Exon 3 (Gl-2) | GGT | AGT (12%) | AGT (3%) * | AGT (6%) * | AGT (14%) | CCA→P172 UCA→S172 | n.a. | n.a. | Tolerated (0.14) |
| 11,420,308 | Exon 4 (Gl-2) | GGG | GGG (100%) | AGG (17%) | GGG (100%) | GGG (100%) | CCC→P234 UCC→S234 | rs760324380 | A = 0.0008% | Tolerated (0.09) |
| 11,420,307 | Exon 4 (Gl-2) | GGG | GGG (100%) | GAG (12%) | GGG (100%) | GGG (100%) | CCC→P234 CUC→L234 | n.a. | n.a. | Damaging (0.03) |
| 11,420,304 | Exon 4 (Gl-2) | GGT | GGT (100%) | GAT (12%) | GGT (100%) | GGT (100%) | CCA→P235 CUA→L235 | n.a. | n.a. | Damaging (0.01) |
| 11,420,281 | Exon 4 (Gl-2) | GCA | GCA (100%) | ACA (13%) | ACA (10%) * | GCA (100%) | CGU→R243 UGU→C243 | rs758570507 | A = 0% | Damaging (0.05) |
| 11,420,278 | Exon 4 (Gl-2) | GGG | GGG (100%) | GGG (100%) | AGG (11%) | GGG (100%) | CCC→P244 UCC→S244 | n.a. | n.a. | Tolerated (0.27) |
| 11,420,182 | Exon 4 (Gl-2) | GGT | GGT (100%) | GGT (100%) | AGT (11%) | GGT (100%) | CCA→P277 UCA→S277 | rs755939114 | A = 0% | Tolerated (0.06) |
| 11,420,170 | Exon 4 (Gl-2) | CCC | CCC (100%) | CCC (100%) | TCC (11%) | CCC (100%) | GGG→G280 AGG→R280 | n.a. | n.a. | Tolerated (0.07) |
| 11,420,161 | Exon 4 (Gl-2) | GGT | GGT (100%) | GGT (100%) | AGT (13%) | GGT (100%) | CCA→P283 UCA→S283 | n.a. | n.a. | Tolerated (0.21) |
| 11,420,160 | Exon 4 (Gl-2) | GGT | GGT (100%) | GGT (100%) | GAT (19%) | GGT (100%) | CCA→P283 CUA→L283 | n.a. | n.a. | Tolerated (0.09) |
| 11,420,154 | Exon 4 (Gl-2) | TCT | TTT (3%) * | TCT (100%) | TTT (11%) | TCT (100%) | AGA→R285 AAA→K285 | n.a. | n.a. | Tolerated (0.63) |
| PRB4 (reverse reading, chromosome 12) | ||||||||||
| 11,463,280 | Exon 1 (PGA) | TCA | TGA (100%) | TGA (100%) | TGA (97%) | TGA (100%) | AGU→S2 ACU→T2 | n.a. | n.a. | Tolerated (0.83) |
| 11,461,801 | Exon 3 (PGA) | GCT | GCT (98%) | GCT (97%) | GTT (13%) | GCT (100%) | CGA→R23 CAA→Q23 | n.a. | n.a. | Tolerated (0.57) |
| 11,461,772 | Exon 3 (PGA) | GCA | GCA (100%) | GCA (96%) | ACA (12%) | GCA (100%) | CGU→R33 UGU→C33 | rs77775235 | A = 0% | Tolerated (0.06) |
| 11,461,769 | Exon 3 (PGA) | GGG | TGG (5%) * | TGG (9%) * | TGG (5%) * | TGG (13%) | CCC→P34 ACC→T34 | rs144658455 | T = 0% | Tolerated (0.53) |
| 11,461,745 | Exon 3 (PGA) | GTT | CTT (8%) * | CTT (8%) * | CTT (5%) * | CTT (12%) | CAA→Q42 GAA→E42 | rs76859544 | C = 6.8% | Tolerated (1) |
| 11,461,742 | Exon 3 (PGA) | CCT | TCT (10%) * | TCT (27%) | TCT (11%) | TCT (7%) * | GGA→G43 AGA→R43 | rs776943151 | T = 0.05% | Tolerated (0.45) |
| 11,461,706 | Exon 3 (PGA) | GGG | TGG (14%) | TGG (23%) | TGG (13%) | TGG (20%) | CCC→P55 ACC→T55 | rs12308381 | T = 21.6% | Tolerated (0.12) |
| 11,461,675 | Exon 3 (PGA) | GCT | GGT (1%) * | GGT (2%) * | GGT (2%) * | GGT (28%) | CGA→R65 CCA→P65 | rs75743553 | G = 0% | Tolerated (0.32) |
| 11,461,673 | Exon 3 (PGA) | GGG | GGG (99%) | AGG (13%) | AGG (2%) * | GGG (100%) | CCC→P66 UCC→S66 | rs1332850459 | A = 0% | Tolerated (0.25) |
| 11,461,580 | Exon 3 (PGA) | TGG | GGG (65%) | GGG (52%) | GGG (24%) | GGG (54%) | ACC→T97 CCC→P97 | n.a. | n.a. | Tolerated (0.81) |
| 11,461,570 | Exon 3 (PGA) | GGA | GTA (51%) | GTA (54%) | GTA (8%) * | GTA (47%) | CCU→P100 CAU→H100 | n.a. | n.a. | Tolerated (0.59) |
| 11,461,553 | Exon 3 (PGA) | TCT | CCT (13%) | CCT (15%) | TCT (100%) | CCT (24%) | AGA→R106 GGA→G106 | n.a. | n.a. | Tolerated (0.84) |
| 11,461,550 | Exon 3 (PGA) | GGT | GGT (100%) | AGT (17%) | GGT (100%) | GGT (100%) | CCA→P107 UCA→S107 | n.a. | n.a. | Tolerated (0.50) |
| 11,461,549 | Exon 3 (PGA) | GGT | GCT (13%) | GCT (6%) * | GGT (100%) | GCT (13%) | CCA→P107 CGA→R107 | n.a. | n.a. | Tolerated (0.9) |
| 11,461,525 | Exon 3 (PGA) | AGG | AGG (100%) | AAG (100%) | AAG (100%) | AGG (100%) | UCC→S115 UUC→F115 | n.a. | n.a. | Damaging (0.04) |
| 11,461,513 | Exon 3 (PGA) | GGT | GGT (100%) | GAT (10%) * | GAT (11%) | GGT (100%) | CCA→P119 CUA→L119 | n.a. | n.a. | Damaging (0.04) |
| 11,461,471 | Exon 3 (PGA) | CCA | CCA (100%) | CTA (4%) * | CTA (14%) | CCA (100%) | GGU→G133 GAU→D133 | n.a. | n.a. | Tolerated (0.46) |
| 11,461,421 | Exon 3 (PGA) | GGG | GGG (100%) | AGG (5%) * | AGG (6%) * | AGG (100%) | CCC→P150 UCC→S150 | n.a. | n.a. | Tolerated (0.18) |
| 11,461,420 | Exon 3 (PGA) | GGG | GGG (100%) | GAG (11%) | GGG (100%) | GGG (100%) | CCC→P150 CUC→L150 | n.a. | n.a. | Tolerated (0.1) |
| 11,461,412 | Exon 3 (PGA) | CTT | CTT (100%) | TTT (14%) | CTT (100%) | CTT (100%) | GAA→E153 AAA→K153 | n.a. | n.a. | Tolerated (0.85) |
| 11,461,319 | Exon 4 (P-D P32A) | GGA | GGA (97%) | AGA (9%) * | AGA (11%) | GGA (100%) | CCU→P23 UCU→S23 | n.a. | n.a. | Tolerated (0.55) |
| 11,461,309 | Exon 4 (P-D P32A) | GGT | GGT (100%) | GGT (100%) | GAT (11%) | GGT (100%) | CCA→P26 CUA→L26 | n.a. | n.a. | Damaging (0.01) |
| 11,461,229 | Exon 4 (P-D P32A) | GGA | GGA (100%) | AGA (13%) | AGA (4%) * | GGA (100%) | CCU→P54 UCU→S54 | n.a. | n.a. | Tolerated (0.13) |
| Chromosome Position (hg19) | Gene Region | Modern Human | Altai Neanderthal (Variant Frequency a) | Chagyrskaya Neanderthal (Variant Frequency a) | Vindija Neanderthal (Variant Frequency a) | Denisovan (Variant Frequency a) | Codon→Amino Acid | SNP id | SNP Total Frequency (ALFA) | SIFT Results (Score) |
|---|---|---|---|---|---|---|---|---|---|---|
| PRH2 (direct reading, chromosome 12) | ||||||||||
| 11,082,885 | Exon 2 (PRP-1) | GTT | ATT (2%) * | ATT (12%) | ATT (4%) * | GTT (100%) | GUU→V12 AUU→I12 | rs776898585 | A = 0% | N.S |
| 11,082,894 | Exon 2 (PRP-1) | GTA | GTA (100%) | ATA (12%) | ATA (10%) * | GTA (100%) | GUA→V15 AUA→I15 | n.a. | n.a. | Tolerated (0.26) |
| 11,083,305 | Exon 3 (PRP-1) | CCA | CCA (98%) | TCA (14%) | TCA (14%) | CCA (100%) | CCA→P33 UCA→S33 | n.a. | n.a. | Tolerated (0.07) |
| 11,083,318 | Exon 3 (PRP-1) | GGA | GGA (100%) | GAA (14%) | GGA (100%) | GGA (100%) | GGA→G37 GAA→E37 | n.a. | n.a. | Tolerated (0.07) |
| 11,083,323 | Exon 3 (PRP-1) | CAA | CAA (100%) | TAA (8%) * | TAA (12%) | CAA (100%) | CAA→Q39 UAA→stop | n.a. | n.a. | Damaging due to stop |
| 11,083,426 | Exon 3 (PRP-1) | GGA | GGA (100%) | GGA (100%) | GAA (11%) | GGA (100%) | GGA→G73 GAA→E73 | n.a. | n.a. | Damaging (0.02) |
| 11,083,431 | Exon 3 (PRP-1) | CCA | CCA (100%) | TCA (13%) | TCA (8%) * | TCA (6%) * | CCA→P75 UCA→S75 | n.a. | n.a. | Tolerated (0.23) |
| 11,083,452 | Exon 3 (PRP-1) | GGA | GGA (100%) | AGA (6%) * | AGA (14%) | GGA (100%) | GGA→G82 AGA→R82 | n.a. | n.a. | Damaging (0.01) |
| 11,083,455 | Exon 3 (PRP-1) | GGC | GGC (100%) | AGC (17%) | GGC (100%) | GGC (100%) | GGC→G83 AGC→S83 | n.a. | n.a. | N.S. |
| 11,083,488 | Exon 3 (PRP-1) | GGA | GGA (100%) | GGA (100%) | AGA (11%) | GGA (100%) | GGA→G94 AGA→R94 | n.a. | n.a. | Damaging (0.04) |
| 11,083,531 | Exon 3 (PRP-1) | AGG | AGG (100%) | AGG (100%) | AAG (18%) | AGG (100%) | AGG→R108 AAG→K108 | n.a. | n.a. | N.S. |
| 11,083,536 | Exon 3 (PRP-1) | CAA | CAA (100%) | TAA (11%) | CAA (100%) | CAA (100%) | CAA→Q110 UAA→stop | n.a. | n.a. | N.S. |
| 11,083,545 | Exon 3 (PRP-1) | CCC | CCC (100%) | TCC (12%) | TCC (6%) * | CCC (100%) | CCC→P113 UCC→S113 | rs1289206423 | T = 0% | N.S. |
| 11,083,551 | Exon 3 (PRP-1) | CAG | CAG (97%) | CAG (100%) | TAG (13%) | CAG (100%) | CAG→Q115 UAG→stop | n.a. | n.a. | N.S. |
| 11,083,570 | Exon 3 (PRP-1) | GGT | GGT (100%) | GAT (18%) | GGT (100%) | GGT (100%) | GGU→G121 GAU→D121 | n.a. | n.a. | N.S. |
| 11,083,575 | Exon 3 (PRP-1) | CCC | CCC (96%) | TCC (8%) * | TCC (15%) | CCC (100%) | CCC→P123 UCC→S123 | n.a. | n.a. | N.S. |
| 11,083,581 | Exon 3 (PRP-1) | CCT | CCT (100%) | TCT (20%) | TCT (8%) * | CCT (100%) | CCU→P125 UCU→S125 | n.a. | n.a. | N.S. |
| 11,083,582 | Exon 3 (PRP-1) | CCT | CCT (100%) | CTT (13%) | CTT (8%) * | CCT (100%) | CCU→P125 CUU→L125 | n.a. | n.a. | N.S. |
| 11,083,605 | Exon 3 (PRP-1) | CCA | CCA (100%) | TCA (11%) | CCA (100%) | CCA (100%) | CCA→P133 UCA→S133 | rs1343870622 | T = 0% | N.S. |
| 11,083,618 | Exon 3 (PRP-1) | GGG | GGG (100%) | GAG (11%) | GGG (100%) | GGG (100%) | GGG→G137 GAG→E137 | n.a. | n.a. | N.S. |
| 11,083,635 | Exon 3 (PRP-1) | CCT | CCT (100%) | CCT (100%) | TCT (16%) | CCT (100%) | CCU→P143 UCU→S143 | n.a. | n.a. | N.S. |
| 11,083,636 | Exon 3 (PRP-1) | CCT | CCT (100%) | CCT (100%) | CTT (11%) | CCT (100%) | CCU→P143 CUU→L143 | n.a. | n.a. | N.S. |
| 11,083,663 | Exon 3 (C-term removal) | TCT | TCT (100%) | TCT (100%) | TTT (17%) | TCT (100%) | UCU→S152(rem) UUU→F152(rem) | rs746351335 | n.a. | N.S. |
| HTN1 (direct reading, chromosome 4) | ||||||||||
| 70,920,165 | Exon 4 | CAT | CAT (100%) | TAT (2%) * | TAT (13%) | CAT (100%) | CAU→H15 UAU→Y15 | n.a. | n.a. | Tolerated (0.37) |
| 70,921,215 | Exon 5 | GAA | GAA (100%) | AAA (3%) * | AAA (11%) | GAA (100%) | GAA→E16 AAA→K16 | n.a. | n.a. | N.S |
| 70,921,234 | Exon 5 | CGA | CAA (2%) * | CAA (58%) | CAA (3%) * | CGA (100%) | CGA→R32 CAA→Q32 | rs375127098 | A = 0.014% | N.S |
| HTN3 (direct reading, chromosome 4) | ||||||||||
| 70,896,460 | Exon 2 (Signal) | ATG | ATG (100%) | ATA (11%) | ATG (100%) | ATG (100%) | AUG→M0(sp) AUA→I0(sp) | n.a. | n.a. | N.S |
| 70,897,696 | Exon 3 (Signal) | GGA | GGA (100%) | AGA (12%) | AGA (4%) * | GGA (100%) | GGA→G17(sp) AGA→R17(sp) | rs1254624179 | n.a. | N.S |
| AMY1A (reverse reading, chromosome 1) | ||||||||||
| 104,238,248 | Exon 2 (Signal) | ACC | ACC (100%) | ACC (100%) | ATC (15%) | ACC (100%) | UGG→W4(sp) UAG→stop | n.a. | n.a. | Damaging due to stop |
| 104,238,189 | Exon 2 | GCT | GCT (100%) | ACT (13%) | ACT (20%) ** | GCT (100%) | CGA→R10 UGA→stop | n.a. | n.a. | Damaging due to stop |
| 104,237,696 | Exon 3 | ACC | ACC (100%) | ACC (100%) | ATC (17%) | ACC (100%) | UGG→W59 UAG→stop | n.a. | n.a. | Damaging due to stop |
| 104,237,685 | Exon 3 | GTT | GTT (100%) | GTT (100%) | ATT (14%) | GTT (100%) | CAA→Q63 UAA→stop | n.a. | n.a. | Damaging due to stop |
| 104,237,626 | Exon 3 | TAC | TAC (100%) | TAC (100%) | TAT (15%) | TAC (100%) | AUG→M82 AUA→I82 | n.a. | n.a. | Damaging (0.01) |
| 104,236,795 | Exon 4 | GCA | GCA (100%) | GCA (100%) | ACA (13%) | GCA (100%) | CGU→R92 UGU→C92 | n.a. | n.a. | Damaging (0) |
| 104,236,666 | Exon 4 | CTA | CTA (100%) | CTA (100%) | TTA (11%) | CTA (100%) | GAU→D135 AAU→N135 | n.a. | n.a. | Tolerated (0.08) |
| 104,236,654 | Exon 4 | CCA | CCA (100%) | TCA (5%) * | TCA (11%) | CCA (100%) | GGU→G139 AGU→S139 | n.a. | n.a. | Tolerated (0.6) |
| 104,236,152 | Exon 5 | CAG | CAG (100%) | TAG (15%) | TAG (20%) | CAG (100%) | GUC→V157 AUC→I157 | n.a. | n.a. | Tolerated (0.17) |
| 104,236,146 | Exon 5 | CTA | CTA (100%) | TTA (8%) * | TTA (12%) | CTA (100%) | GAU→D159 AAU→N159 | n.a. | n.a. | Tolerated (1) |
| 104,236,139 | Exon 5 | GCA | GTA (4%) * | GTA (7%) * | GTA (12%) | GCA (100%) | CGU→R161 CAU→H161 | n.a. | n.a. | Damaging (0.01) |
| 104,236,080 | Exon 5 | CTT | CTT (100%) | CTT (100%) | TTT (13%) | CTT (100%) | GAA→E181 AAA→K181 | n.a. | n.a. | Tolerated (0.11) |
| 104,235,996 | Exon 5 | CGT | CGT (96%) | CGT (100%) | TGT (13%) | CGT (100%) | GCA→A209 ACA→T209 | n.a. | n.a. | Tolerated (0.27) |
| 104,235,164 | Exon 6 | CTC | CTC (100%) | CTC (100%) | TTC (11%) | CTC (100%) | GAG→E240 AAG→K240 | n.a. | n.a. | Damaging (0.01) |
| 104,235,148 | Exon 6 | TCA | TCA (100%) | TCA (100%) | TTA (18%) | TCA (100%) | AGU→S245 AAU→N245 | n.a. | n.a. | Tolerated (0.52) |
| 104,235,083 | Exon 6 | GCG | ACG (3%) * | ACG (6%) * | ACG (12%) | GCG (100%) | CGC→R267 UGC→C267 | n.a. | n.a. | Damaging (0) |
| 104,234,224 | Exon 7 | CCT | CCT (100%) | CCT (100%) | CTT (13%) | CCT (100%) | GGA→G281 GAA→E281 | n.a. | n.a. | Damaging (0) |
| 104,234,218 | Exon 7 | CCA | CCA (100%) | CTA (13%) | CTA (15%) | CCA (100%) | GGU→G283 GAU→D283 | n.a. | n.a. | Tolerated (0.25) |
| 104,234,129 | Exon 7 | GAA | GAA (100%) | AAA (13%) | GAA (100%) | GAA (100%) | CUU→L313 UUU→F313 | n.a. | n.a. | Damaging (0) |
| 104,234,125 | Exon 7 | TGG | TGG (100%) | TAG (17%) | TGG (100%) | TGG (100%) | ACC→T314 AUC→I314 | n.a. | n.a. | Damaging (0) |
| 104,233,978 | Exon 8 | GGA | GGA (100%) | AGA (13%) | AGA (11%) | GGA (100%) | CCU→P332 UCU→S332 | n.a. | n.a. | Damaging (0.05) |
| 104,233,977 | Exon 8 | GGA | GGA (100%) | GAA (6%) * | GAA (11%) | GGA (100%) | CCU→P332 CUU→L332 | n.a. | n.a. | Damaging (0) |
| 104,233,963 | Exon 8 | GCT | GCT (100%) | GCT (100%) | ACT (14%) | GCT (100%) | CGA→R337 UGA→stop | rs19955486 | A = 0.08% | Damaging due to stop |
| 104,231,858 | Exon 9 | ACA | ACA (100%) | ACA (100%) | ATA (11%) | ACA (100%) | UGU→C378 UAU→Y378 | n.a. | n.a. | Damaging (0) |
| 104,231,680 | Exon 10 | CAC | CAC (100%) | TAC (4%) * | TAC (20%) | CAC (100%) | GUG→V401 AUG→M401 | n.a. | n.a. | Damaging (0) |
| 104,231,643 | Exon 10 | CCC | CCC (100%) | CTC (5%) * | CTC (11%) | CCC (100%) | GGG→G413 GAG→E413 | n.a. | n.a. | Damaging (0.02) |
| 104,231,622 | Exon 10 | CCC | CCC (100%) | CCC (100%) | CTC (13%) | CCC (100%) | GGG→G420 GAG→E420 | n.a. | n.a. | Tolerated (0.08) |
| 104,230,237 | Exon 11 | TGA | TGA (100%) | TGA (100%) | TAA (13%) | TGA (100%) | ACU→T442 AUU→I442 | n.a. | n.a. | Damaging (0) |
| 104,230,129 | Exon 11 | AGA | AGA (100%) | AGA (100%) | AAA (13%) | AGA (100%) | UCU→S478 UUU→F478 | n.a. | n.a. | Tolerated (0.62) |
| STATH (direct reading, chromosome 4) | ||||||||||
| 70,866,583 | Exon 5 | GGG | GGG (100%) | AGG (13%) | AGG (3%) * | GGG (100%) | GGG→G17 AGG→R17 | n.a. | n.a. | N.A. |
| 70,866,616 | Exon 5 | CCA | CCA (98%) | CCA (100%) | TCA (11%) | TCA (3%) * | CCA→P28 UCA→S28 | n.a. | n.a. | N.A. |
| 70,866,626 | Exon 5 | CCA | CCA (100%) | CTA (15%) | CCA (100%) | CCA (96%) | CCA→P31 CUA→L31 | n.a. | n.a. | N.A. |
| 70,866,628 | Exon 5 | CAA | CAA (100%) | TAA (15%) | CAA (100%) | CAA (100%) | CAA→Q32 UAA→stop | n.a. | n.a. | Damaging due to stop |
| SMR3B (direct reading, chromosome 4) | ||||||||||
| 71,255,405 | Exon 3 | AGG | AGG (100%) | AGG (100%) | AAG (12%) | AGG (100%) | AGG→R5 AAG→K5 | rs777831757 | A = 0% | NS |
| 71,255,444 | Exon 3 | CCT | CCT (100%) | CTT (12%) | CTT (3%) * | CCT (100%) | CCU→P18 CUU→L18 | n.a. | n.a. | NS |
| 71,255,495 | Exon 3 | GGG | GGG (100%) | GGG (94%) | GAG (17%) | GGG (100%) | GGG→G35 GAG→E35 | n.a. | n.a. | NS |
| Chromosome Position (hg19) | Gene Region | Modern Human | Altai Neanderthal (Variant Frequency a) | Chagyrskaya Neanderthal (Variant Frequency a) | Vindija Neanderthal (Variant Frequency a) | Denisovan (Variant Frequency a) | Codon→Amino Acid | SNP id | SNP Total Frequency (ALFA) | SIFT Results (Score) |
|---|---|---|---|---|---|---|---|---|---|---|
| CST1 (reverse reading, chromosome 20) | ||||||||||
| 23,731,494 | Exon 1 (Signal) | ATA | GTA (100%) | GTA (95%) | GTA (100%) | GTA (100%) | UAU→Y3(sp) CAU→H3(sp) | rs6076122 | G = 71.1% | Tolerated (0.11) |
| 23,731,463 | Exon 1 (Signal) | TGG | TAG (2%) * | TAG (13%) | TAG (5%) * | TGG (100%) | ACC→T13(sp) AUC→I13(sp) | n.a. | n.a. | Tolerated (0.39) |
| 23,731,455 | Exon 1 (Signal) | CAC | CAC (100%) | CAC (100%) | TAC (16%) | CAC (100%) | GUG→V16(sp) AUG→M16(sp) | n.a. | n.a. | Tolerated (0.23) |
| 23,731,446 | Exon 1 (Signal) | CGG | CGG (100%) | CGG (100%) | TGG (11%) | CGG (100%) | GCC→A19(sp) ACC→T19(sp) | rs1425228752 | T = 0.001% | Damaging (0.01) |
| 23,731,439 | Exon 1 | TCG | TCG (100%) | TTG (6%) * | TTG (14%) | TCG (100%) | AGC→S2 AAC→N2 | n.a. | n.a. | Tolerated (0.15) |
| 23,731,428 | Exon 1 | CTC | CTC (100%) | CTC (100%) | TTC (21%) | CTC (100%) | GAG→E6 AAG→K6 | rs1292698911 | T = 0.0004% | Tolerated (0.66) |
| 23,731,394 | Exon 1 | CGT | CGT (100%) | CAT (13%) | CGT (100%) | CGT (100%) | GCA→A17 GUA→V17 | n.a. | n.a. | Tolerated (0.25) |
| 23,731,344 | Exon 1 | CTC | TTC (3%) * | CTC (100%) | TTC (11%) | TTC (3%) * | GAG→E34 AAG→K34 | rs368203290 | T = 0.008% | Tolerated (0.07) |
| 23,731,307 | Exon 1 | GCA | GCA (100%) | GTA (14%) | GCA (100%) | GTA (6%) * | CGU→R46 CAU→H46 | rs758187154 | T = 0% | Damaging (0.01) |
| 23,731,281 | Exon 1 | GTT | GTT (100%) | GTT (100%) | ATT (13%) | GTT (100%) | CAA→Q55 UAA→stop | n.a. | n.a. | Damaging due to stop |
| 23,729,759 | Exon 2 | CCC | CCC (100%) | CCC (100%) | CGC (26%) | CCC (100%) | GGG→G59 GCG→A59 | n.a. | n.a. | Tolerated (1) |
| 23,729,700 | Exon 2 | GGG | GGG (100%) | GGG (100%) | AGG (11%) | GGG (100%) | CCC→P79 UCC→S79 | n.a. | n.a. | Tolerated (0.38) |
| 23,729,699 | Exon 2 | GGG | GGG (100%) | GAG (3%) * | GAG (11%) | GGG (100%) | CCC→P79 CUC→L79 | rs756782667 | A = 0% | Tolerated (0.06) |
| 23,729,687 | Exon 2 | TGG | TGG (100%) | TAG (16%) | TAG (4%) * | TGG (100%) | ACC→T83 AUC→I83 | n.a. | n.a. | Damaging (0.02) |
| 23,728,503 | Exon 3 | GGG | GGG (100%) | AGG (11%) | AGG (3%) * | GGG (100%) | CCC→P106 UCC→S106 | rs754531104 | A = 0.004% | Tolerated (0.09) |
| 23,728,494 | Exon 3 (Cys-SN) | TTG | CTG (10%) * | CTG (11%) | CTG (14%) | CTG (4%) * | AAC→N109 GAC→D109 | rs3188319 | C = 0.004% | Tolerated (1) |
| 23,728,490 | Exon 3 | TCT | TTT (2%) * | TTT (14%) | TCT (100%) | TCT (100%) | AGA→R110 AAA→K110 | n.a. | n.a. | Tolerated (1) |
| 23,728,487 | Exon 3 | TCC | TCC (100%) | TTC (13%) | TTC (7%) * | TCC (100%) | AGG→R111 AAG→K111 | rs3188320 | T = 0% | Tolerated (0.85) |
| CST2 (reverse reading, chromosome 20) | ||||||||||
| 23,807,260 | Exon 1 (Signal) | CGG | CGG (100%) | CGG (100%) | CAG (14%) | CGG (100%) | GCC→A12(sp) GUC→V12(sp) | rs1411653443 | A = 0.007% | Damaging (0.02) |
| 23,807,257 | Exon 1 (Signal) | TGG | TGG (100%) | TAG (14%) | TGG (100%) | TGG (100%) | ACC→T13(sp) AUC→I13(sp) | n.a. | n.a. | Tolerated (0.43) |
| 23,807,245 | Exon 1 (Signal) | CGG | CGG (100%) | CAG (14%) | CGG (100%) | CGG (100%) | GCC→A17(sp) GUC→V17(sp) | n.a. | n.a. | Tolerated (0.1) |
| 23,807,231 | Exon 1 | GGG | GGG (100%) | AGG (14%) | AGG (8%) * | GGG (100%) | CCC→P3 UCC→S3 | n.a. | n.a. | Tolerated (1) |
| 23,807,162 | Exon 1 | GCA | ACA (95%) | ACA (100%) | ACA (100%) | ACA (8%) * | CGU→R26 UGU→C26 | rs111349461 | A = 0.06% | Damaging (0.05) |
| 23,807,138 | Exon 1 | CTC | TTC (3%) * | TTC (12%) | TTC (6%) * | CTC (100%) | GAG→E34 AAG→K34 | rs541427772 | T = 0.017% | Tolerated (0.07) |
| 23,807,102 | Exon 1 | GCG | ACG (3%) * | GCG (100%) | ACG (11%) | GCG (100%) | CGC→R46 UGC→C46 | rs112783512 | A = 0.019% | Tolerated (0.07) |
| 23,807,093 | Exon 1 | GCC | GCC (100%) | ACC (4%) | ACC (20%) | GCC (100%) | CGG→R49 UGG→W49 | rs55860552 | A = 0.12% | Damaging (0) |
| 23,807,084 | Exon 1 | GCT | GCT (100%) | ACT (5%) * | ACT (15%) | GCT (100%) | CGA→R52 UGA→stop | rs568411970 | A = 0% | Damaging due to stop |
| 23,807,077 | Exon 1 | TCC | TCC (100%) | TCC (100%) | TTC (13%) | TCC (100%) | AGG→R54 AAG→K54 | n.a. | n.a. | Tolerated (0.34) |
| 23,807,075 | Exon 1 | CTC | CTC (100%) | TTC (12%) | TTC (12%) | CTC (100%) | GAG→E55 AAG→K55 | n.a. | n.a. | Tolerated (1) |
| 23,805,930 | Exon 2 | TAT | CAT (7%) * | CAT (5%) * | CAT (14%) | CAT (4%) * | AUA→I67 GUA→V67 | rs199856966 | C = 0.004% | Tolerated (1) |
| 23,805,917 | Exon 2 | GCT | GTT (2%) * | GTT (13%) | GTT (5%) * | GTT (2%) * | CGA→R71 CAA→Q71 | rs150428155 | T = 0.008% | Damaging (0.01) |
| 23,805,878 | Exon 2 | ACA | ACA (100%) | ACA (97%) | ATA (14%) | ACA (100%) | UGU→C84 UAU→Y84 | n.a. | n.a. | Damaging (0) |
| 23,805,875 | Exon 2 | CGG | CGG (100%) | CAG (15%) | CAG (2%) * | CGG (100%) | GCC→A85 GUC→V85 | n.a. | n.a. | Tolerated (0.06) |
| 23,804,730 | Exon 3 | ACG | ACG (100%) | ATG (7%) * | ATG (11%) | ACG (100%) | UGC→C98 UAC→Y98 | n.a. | n.a. | Damaging (0) |
| 23,804,702 | Exon 3 | ACC | ACC (100%) | ACT (12%) | ACC (100%) | ACC (100%) | UGG→W107 UGA→stop | rs1380420803 | n.a. | Damaging due to stop |
| 23,804,691 | Exon 3 | TAC | TCC (13%) | TCC (10%) * | TCC (9%) * | TAC (100%) | AUG→M111 AGG→R111 | rs202150666 | C = 0.01% | Tolerated (0.31) |
| CST3 (reverse reading, chromosome 20) | ||||||||||
| 23,618,472 | Exon 1 (Signal) | GAG | GAG (100%) | AAG (8%) * | AAG (15%) | GAG (100%) | CUC→L8(sp) UUC→F8(sp) | rs1285248919 | n.a. | Damaging (0) |
| 23,618,433 | Exon 1 | GGG | GGG (100%) | GGG (100%) | AGG (13%) | GGG (100%) ** | CCC→P22(sp) UCC→S22(sp) | n.a. | n.a. | Tolerated (0.5) |
| 23,618,370 | Exon 1 | CAC | CAC (100%) | CAC (100%) | TAC (13%) | CAC (100%) | GUG→V18 AUG→M18 | n.a. | n.a. | Tolerated (0.11) |
| 23,618,358 | Exon 1 | CCA | CCA (100%) | TCA (22%) | TCA (4%) * | CCA (100%) | GGU→G22 AGU→S22 | n.a. | n.a. | Tolerated (0.48) |
| 23,618,357 | Exon 1 | CCA | CCA (100%) | CTA (11%) | CCA (100%) | CCA (100%) | GGU→G22 GAU→D22 | n.a. | n.a. | Tolerated (0.56) |
| 23,618,295 | Exon 1 | GTG | GTG (100%) | GTG (100%) | ATG (13%) | GTG (100%) | CAC→H43 UAC→Y43 | n.a. | n.a. | Tolerated (1) |
| 23,615,994 | Exon 2 | CCC | CTC (3%) * | CCC (100%) | CTC (13%) | CCC (100%) | GGG→G59 GAG→E59 | n.a. | n.a. | Damaging (0.01) |
| 23,614,564 | Exon 3 | GTC | GTC (100%) | GTC (100%) | ATC (13%) | GTC (100%) | CAG→Q118 UAG→stop | n.a. | n.a. | Damaging due to stop |
| CST4 (reverse reading, chromosome 20) | ||||||||||
| 23,669,566 | Exon 1 (Signal) | TGG | TGG (100%) | TAG (7%) * | TAG (11%) | TGG (100%) | ACC→T13(sp) AUC→I13(sp) | rs770415022 | n.a. | Tolerated (0.37) |
| 23,669,561 | Exon 1 (Signal) | CGA | CGA (100%) | CGA (100%) | CGA (100%) | AGA (100%) | GCU→A15(sp) UCU→S15(sp) | n.a. | n.a. | Tolerated (0.39) |
| 23,669,539 | Exon 1 | AGG | AGG (100%) | AAG (5%) * | AAG (13%) | AGG (100%) | UCC→S3 UUC→F3 | n.a. | n.a. | Tolerated (0.08) |
| 23,669,470 | Exon 1 | GCA | GCA (100%) | GTA (15%) | GCA (100%) | GTA (17%) | CGU→R26 CAU→H26 | rs201273557 | T = 0.01% | Tolerated (0.08) |
| 23,669,462 | Exon 1 | GTG | GTG (100%) | GTG (100%) | ATG (18%) | GTG (100%) | CAC→H29 UAC→Y29 | n.a. | n.a. | Tolerated (0.06) |
| 23,669,408 | Exon 1 | GGC | GGC (100%) | AGC (12%) | GGC (100%) | GGC (100%) | CCG→P47 UCG→S47 | n.a. | n.a. | Tolerated (0.06) |
| 23,667,835 | Exon 2 | AAA | CAA (97%) | CAA (100%) | CAA (90%) | AAA (100%) | UUU→F58 GUU→V58 | rs145608577 | C = 0.2% | Tolerated (1) |
| 23,667,828 | Exon 2 | CCC | CCC (100%) | CTC (18%) | CCC (100%) | CCC (100%) | GGG→G60 GAG→E60 | rs144556333 | T = 0.007% | Damaging (0) |
| 23,667,826 | Exon 2 | CAC | CAC (100%) | TAC (10%) * | TAC (27%) | CAC (100%) | GUG→V61 AUG→M61 | n.a. | n.a. | Tolerated (0.24) |
| 23,667,808 | Exon 2 | CAT | CAT (100%) | TAT (13%) | CAT (100%) | TAT (4%) * | GUA→V67 AUA→I67 | rs774067751 | T = 0.007% | Tolerated (0.23) |
| 23,667,792 | Exon 2 | TGG | TGG (100%) | TAG (13%) | TGG (100%) | TGG (100%) | ACC→T72 AUC→I72 | n.a. | n.a. | Damaging (0) |
| 23,667,783 | Exon 2 | TGG | TGG (100%) | TGG (95%) | TAG (15%) | TGG (100%) | ACC→T75 AUC→I75 | rs760057501 | A = 0% | Damaging (0.01) |
| 23,666,565 | Exon 3 | TAC | TCC (88%) | TCC (14%) | TCC (80%) | TAC (100%) | AUG→M111 AGG→R111 | rs779547810 | C = 0% | Tolerated (0.87) |
| CST5 (reverse reading, chromosome 20) | ||||||||||
| 23,860,243 | Exon 1 | AGC | AAC (3%) * | AGC (100%) | AAC (11%) | AAC (5%) * | UCG→S4 UUG→L4 | rs145031249 | A = 0.011% | Tolerated (0.27) |
| 23,860,211 | Exon 1 | GTA | GTA (100%) | GTA (100%) | ATA (12%) | GTA (100%) | CAU→H15 UAU→Y15 | n.a. | n.a. | Tolerated (1) |
| 23,860,199 | Exon 1 | GAG | GAG (100%) | AAG (11%) | GAG (100%) | GAG (100%) | CUC→L19 UUC→F19 | rs370924959 | A = 0% | Tolerated (0.66) |
| 23,860,178 | Exon 1 | ACA | GCA (93%) | GCA (100%) | GCA (95%) | GCA (100%) | UGU→ C26 CGU→ R26 | rs1799841 | G = 43.2% | Tolerated (1) |
| 23,860,174 | Exon 1 | CGG | CGG (100%) | CGG (100%) | CAG (11%) | CGG (100%) | GCC→A27 GUC→V27 | n.a. | n.a. | Tolerated (0.18) |
| 23,860,130 | Exon 1 | CTA | CTA (100%) | CTA (100%) | TTA (14%) | CTA (100%) | GAU→D42 AAU→N42 | rs1257216384 | n.a. | Tolerated (0.11) |
| 23,860,093 | Exon 1 | CGG | CGG (100%) | CGG (100%) | CAG (11%) | CGG (100%) | GCC→A54 GUC→V54 | n.a. | n.a. | Tolerated (0.11) |
| 23,858,200 | Exon 2 | TGG | TGG (100%) | TAG (22%) | TGG (100%) | TGG (100%) | ACC→T76 AUC→I76 | rs41282292 | A = 0.061% | Damaging (0) |
| CSTA (direct reading, chromosome 3) | ||||||||||
| 122,044,197 | Exon 1 | GTT | GTT (100%) | ATT (11%) | GTT (100%) | GTT (100%) | GUU→V20 AUU→I20 | rs778366890 | A = 0% | Tolerated (0.23) |
| 122,056,400 | Exon 2 | CCA | CCA (100%) | CCA (100%) | TCA (12%) | CCA (100%) | CCA→P25 UCA→S25 | n.a. | n.a. | Tolerated (0.74) |
| 122,060,361 | Exon 3 | CTT | CTT (100%) | CTT (100%) | TTT (16%) | CTT (100%) | CUU→L82 UUU→F82 | n.a. | n.a. | Damaging (0) |
| 122,060,373 | Exon 3 | CAG | CAG (100%) | CAG (100%) | TAG (12%) | CAG (100%) | CAG→Q86 UAG→stop | n.a. | n.a. | Damaging due to stop |
| CSTB (reverse reading, chromosome 21) | ||||||||||
| 45,194,562 | Exon 2 | CGC | TGC (2%) * | TGC (11%) | CGC (100%) | CGC (100%) | GCG→A49 ACG→T49 | rs559906825 | T = 0.007% | Damaging (0) |
| 45,194,138 | Exon 3 | TGG | TGG (98%) | TCG (13%) | TGG (95%) | TGG (100%) | ACC→T81 AGC→S81 | n.a. | n.a. | Tolerated (0.65) |
| 45,194,132 | Exon 3 | AGA | AGA (100%) | AGA (100%) | AAA (15%) | AGA (100%) | UCU→S83 UUU→F83 | n.a. | n.a. | Tolerated (0.1) |
Disclaimer/Publisher’s Note: The statements, opinions and data contained in all publications are solely those of the individual author(s) and contributor(s) and not of MDPI and/or the editor(s). MDPI and/or the editor(s) disclaim responsibility for any injury to people or property resulting from any ideas, methods, instructions or products referred to in the content. |
© 2023 by the authors. Licensee MDPI, Basel, Switzerland. This article is an open access article distributed under the terms and conditions of the Creative Commons Attribution (CC BY) license (https://creativecommons.org/licenses/by/4.0/).
Share and Cite
Di Pietro, L.; Boroumand, M.; Lattanzi, W.; Manconi, B.; Salvati, M.; Cabras, T.; Olianas, A.; Flore, L.; Serrao, S.; Calò, C.M.; et al. A Catalog of Coding Sequence Variations in Salivary Proteins’ Genes Occurring during Recent Human Evolution. Int. J. Mol. Sci. 2023, 24, 15010. https://doi.org/10.3390/ijms241915010
Di Pietro L, Boroumand M, Lattanzi W, Manconi B, Salvati M, Cabras T, Olianas A, Flore L, Serrao S, Calò CM, et al. A Catalog of Coding Sequence Variations in Salivary Proteins’ Genes Occurring during Recent Human Evolution. International Journal of Molecular Sciences. 2023; 24(19):15010. https://doi.org/10.3390/ijms241915010
Chicago/Turabian StyleDi Pietro, Lorena, Mozhgan Boroumand, Wanda Lattanzi, Barbara Manconi, Martina Salvati, Tiziana Cabras, Alessandra Olianas, Laura Flore, Simone Serrao, Carla M. Calò, and et al. 2023. "A Catalog of Coding Sequence Variations in Salivary Proteins’ Genes Occurring during Recent Human Evolution" International Journal of Molecular Sciences 24, no. 19: 15010. https://doi.org/10.3390/ijms241915010
APA StyleDi Pietro, L., Boroumand, M., Lattanzi, W., Manconi, B., Salvati, M., Cabras, T., Olianas, A., Flore, L., Serrao, S., Calò, C. M., Francalacci, P., Parolini, O., & Castagnola, M. (2023). A Catalog of Coding Sequence Variations in Salivary Proteins’ Genes Occurring during Recent Human Evolution. International Journal of Molecular Sciences, 24(19), 15010. https://doi.org/10.3390/ijms241915010