Article

High and Low Levels of ABCB1 Expression Are Associated with Two Distinct Gene Signatures in Lung Tissue of Pulmonary TB Patients with High Inflammation Activity

by
Ekaterina N. Pavlova
1,2,
Larisa N. Lepekha
1,
Ekaterina Yu. Rybalkina
1,3,
Ruslan V. Tarasov
1,
Ksenia A. Sychevskaya
1,3,
Elena E. Voronezhskaya
4,
Alexander G. Masyutin
1,2,
Atadzhan E. Ergeshov
5 and
Maria V. Erokhina
1,2,*
1
Central Tuberculosis Research Institute, 107564 Moscow, Russia
2
Faculty of Biology, Lomonosov Moscow State University, 119234 Moscow, Russia
3
FSBI N.N. Blokhin National Medical Research Center of Oncology, 115478 Moscow, Russia
4
Koltzov Institute of Developmental Biology of Russian Academy of Sciences, 119334 Moscow, Russia
5
Director of the Institute, Central Tuberculosis Research Institute, 2 Yauzskaya Alleya, 107564 Moscow, Russia
*
Author to whom correspondence should be addressed.
Int. J. Mol. Sci. 2023, 24(19), 14839; https://doi.org/10.3390/ijms241914839
Submission received: 24 August 2023 / Revised: 23 September 2023 / Accepted: 27 September 2023 / Published: 2 October 2023
(This article belongs to the Special Issue Functional Role of Cytokines in Cancer and Chronic Inflammation)

Abstract

:
P-glycoprotein (encoded by the ABCB1 gene) has a dual role in regulating inflammation and reducing chemotherapy efficacy in various diseases, but there are few studies focused on pulmonary TB patients. In this study, our objective was to identify a list of genes that correlate with high and low levels of ABCB1 gene expression in the lungs of pulmonary TB patients with different activity of chronic granulomatous inflammation. We compared gene expression in two groups of samples (with moderate and high activity of tuberculomas) to identify their characteristic gene signatures. Gene expression levels were determined using quantitative PCR in samples of perifocal area of granulomas, which were obtained from 65 patients after surgical intervention. Subsequently, two distinct gene signatures associated with high inflammation activity were identified. The first signature demonstrated increased expression of HIF1a, TGM2, IL6, SOCS3, and STAT3, which correlated with high ABCB1 expression. The second signature was characterized by high expression of TNFa and CD163 and low expression of ABCB1. These results provide insight into various inflammatory mechanisms and association with P-gp gene expression in lung tissue of pulmonary TB patients and will be useful in the development of a host-directed therapy approach to improving the effectiveness of anti-TB treatment.

1. Introduction

Pulmonary tuberculosis (TB) is an infectious disease caused by Mycobacterium tuberculosis (M.tb). TB granulomas lead to chronic inflammation in the lungs, tissue damage and organ dysfunction. According to the World Health Organization, TB is one of the 10 leading causes of death in the world. Despite the success of antibiotic therapy, there has been an increase in the number of drug-resistant TB cases [1]. The proportion of TB caused by drug-resistant pathogen strains has been growing since 2014 in different regions of the world [2]. Currently, resistance of M.tb to one of the newest anti-TB drug bedaquiline has also been reported [3,4]. TB treatment is an expensive and time-consuming process. Therefore, there is a constant search for new targets to increase the effectiveness of TB chemotherapy. The development of host-directed therapy (HDT) is considered as a crucial direction, through which it may be possible to increase the effectiveness of anti-TB therapy and reduce inflammation to prevent subsequent damage to lung tissue [5,6,7,8]. As part of this direction, the search for prognostic biomarkers and new targets for therapeutic interventions is carried out [8,9,10]. Of particular interest in this context is P-glycoprotein (P-gp), which is able to alter the pharmacokinetics of anti-TB drugs, reducing their accumulation in the lungs and macrophages infected with M.tb [11].
P-gp was discovered in 1976 [12] by researchers Juliano and Ling, who named it after the capital letter of the word “Permeability”. P-gp belongs to the ATP Binding Cassette superfamily, encoded by the ABCB1 gene, and transports compounds of various chemical nature from the cytoplasm to the extracellular environment. P-gp has wide substrate “omnivorousness”: the list of substrates for P-gp is constantly updated and includes hundreds of drugs according to DrugBank database [13]. Moreover, there is evidence suggesting that P-gp may transport endogenous substrates, possibly including cytokines [14]. The interaction between anti-TB drugs and P-gp is a relevant concern, as studies have demonstrated that rifampicin, a key anti-TB drug, is a substrate for P-gp [11,15,16,17]. High expression of P-gp has been observed in human lung cells [15] as well as in various immune cell types [16].
In different diseases, P-gp plays a critical role in both regulating inflammation activity [17,18] and reducing chemotherapy efficacy [19]. The presence of the pathogen [20], hypoxia [21,22], inflammation [23,24] and rifampicin [25,26] induce ABCB1 gene expression in different cell types, including immune cells. These factors are relevant to TB but the underlying mechanisms behind ABCB1 expression and P-gp function in TB remain unknown.
In this study, our objective was to identify a list of genes that correlate with high and low levels of ABCB1 gene expression in the lungs of pulmonary TB patients with different activity of chronic granulomatous inflammation. We used samples of lung tissues obtained from patients diagnosed with pulmonary tuberculoma. In addition, all of them in the preoperative periods received anti-TB treatment the duration of which varied widely from 4 months to 5.5 years (average mean 25 months). Up to 18% of patients with pulmonary tuberculosis have this form of tuberculosis, and surgical intervention is recommended for them [27,28,29]. We compared gene expression in two groups of samples (with moderate and high activity of tuberculomas) to identify their characteristic gene signatures.
We conducted a correlation analysis between ABCB1 expression and three groups of genes: (i) transcription factors that regulate inflammation, including STAT 1-3-6, SOCS3 [30,31,32,33,34] and hypoxia-related markers HIF1a [35,36,37]; (ii) key cytokines involved in granuloma formation and the regulation of TB inflammation, such as IL6, IL10, INFg, TGFb1, TNFa, IL1b [38,39]; (iii) markers of pro-inflammatory (M1) and anti-inflammatory (M2) macrophages, CD86, CD206, CD163, TGM, as well as T-lymphocytes markers CD3D, GZMB.
Macrophages are key cells in controlling granulomatous inflammation during TB and serve as the primary host cells for M.tb [40]. The M1/M2 ratio of macrophages is considered a prognostic marker for the severity of TB [41,42]. ABCB1 expression is higher in M2 macrophages [43]. The Human Protein Atlas project has indicated that high levels of ABCB1 expression are typical in T-lymphocytes, especially cytotoxic lymphocytes, compared to other immune cell types [44].
Additionally, analyzing the expression of transglutaminase type 2 (TGM2) is relevant. TGM2 has various other functions in addition to being a macrophage M2 marker [45]. A high level of TGM2 is associated with infiltration by immune cells, which has been shown using tumor tissue as an example [46,47]. It is also considered as a prognostic marker in lung cancer [48], and may be involved in the pathogenesis of TB [49].
We propose that this panel of genes will enable a comprehensive comparison of PCR analysis data with the morphological characteristics of granulomas (tuberculomas) with signs of moderate or high inflammatory activity, facilitating the identification of key genes associated with high or low levels of ABCB1 expression in lung tissues of TB patients.

2. Results

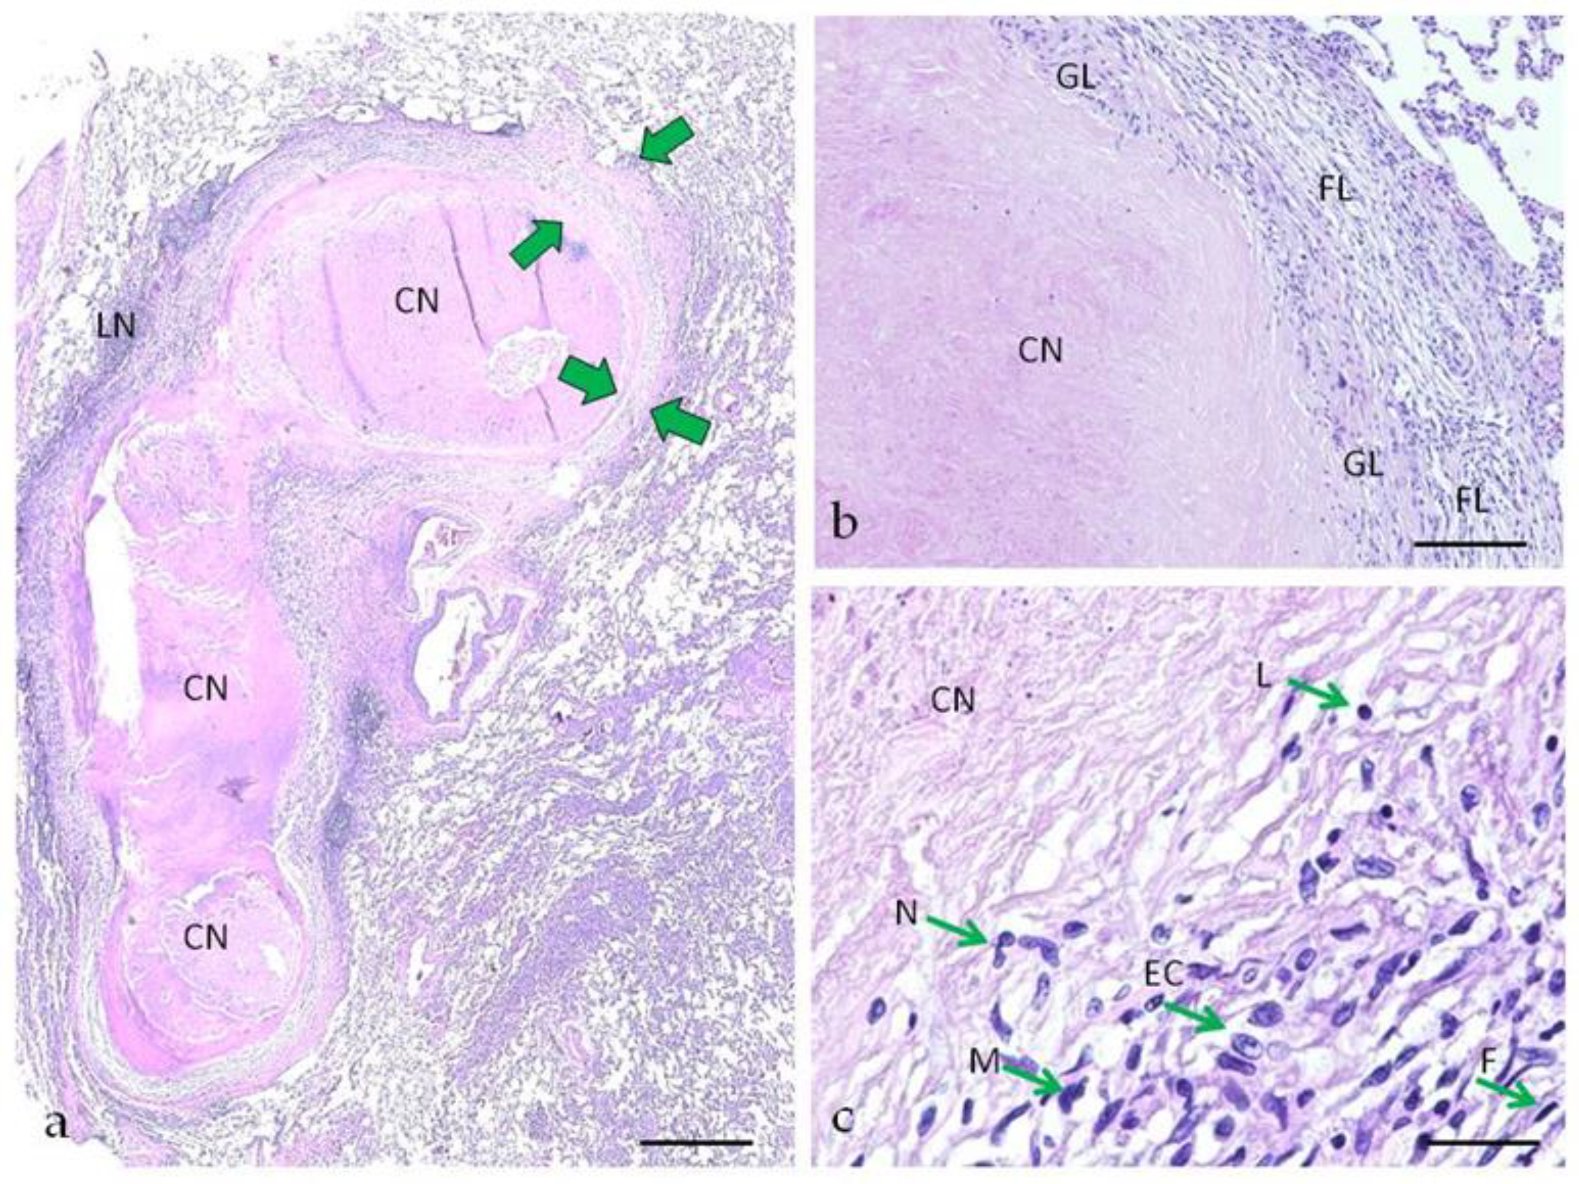
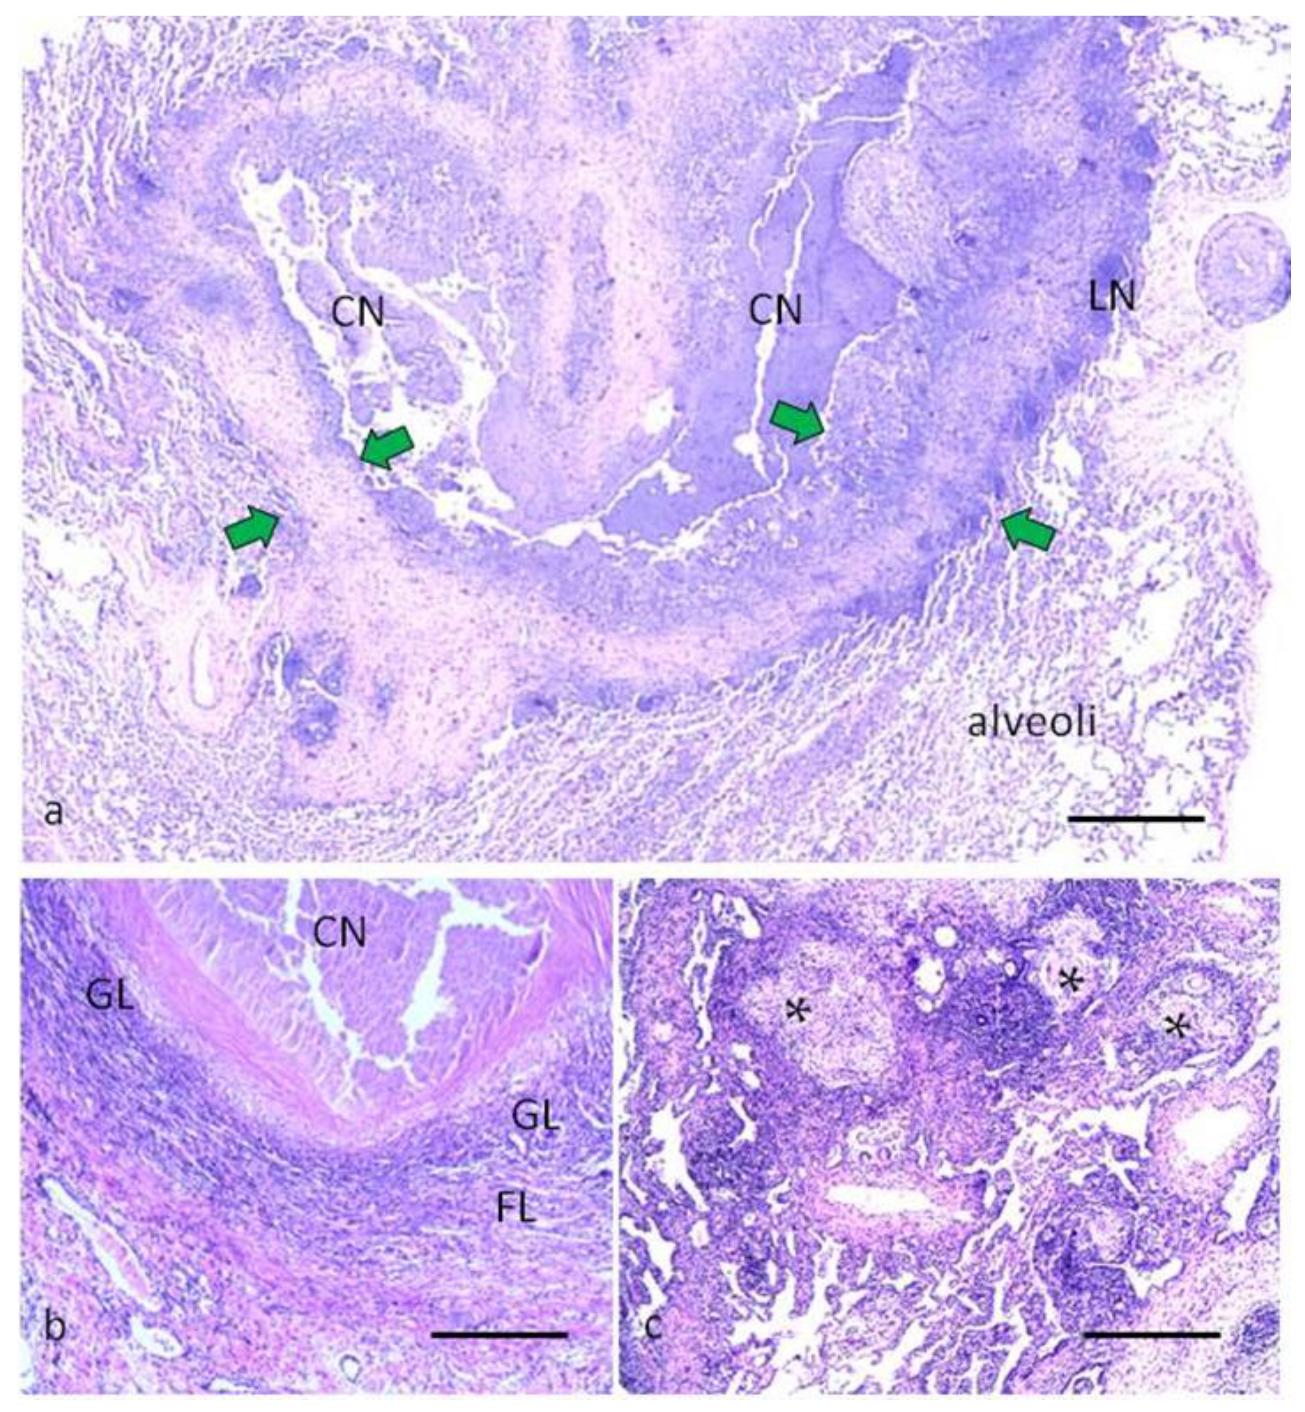
2.1. Morphological Characteristics of Pulmonary Tuberculoma with Moderate and High Activity of Tuberculosis Inflammation

For pulmonary tuberculoma with moderate activity of the inflammatory process, the following morphological features are characteristic: in the center of the granuloma there is an area of compacted caseous necrosis, which is surrounded by a two-layer capsule consisting of granulation (inner) and fibrous (outer) layers. In the perifocal area, the alveoli retain their normal structure (Figure 1a). The fibrous layer of the capsule prevails over the granulation layer, is well expressed, and is formed by compactly located connective tissue fibers (Figure 1b). Unlike the fibrous layer, the granulation layer is weakly expressed, represented by a few cells, among which macrophages, lymphocytes, as well as individual neutrophils and epithelioid cells are detected, single Langhans cells can also be found (Figure 1c).
Tuberculomas with a high activity of the inflammatory process are characterized by caseous necrosis with signs of decay, a predominance of the granulation layer and a weakly expressed fibrous layer of the capsule (Figure 2). In the granulation layer, inflammatory cells, including neutrophils, are determined. The formation of lymph nodes along the periphery of the capsule is observed. The fibrous layer is poorly expressed and is in the process of formation. In the perifocal area, “screening centers” are determined—lympho-hematogenous zones of the spread of tuberculosis infection.
As a result of the morphological analysis, 13 patients from 2017 to 2018 and 15 patients from 2021 to 2022 were selected in the group of tuberculomas with signs of a moderate inflammatory process, in the group of tuberculomas with signs of a high inflammatory process—17 and 20 patients, respectively.

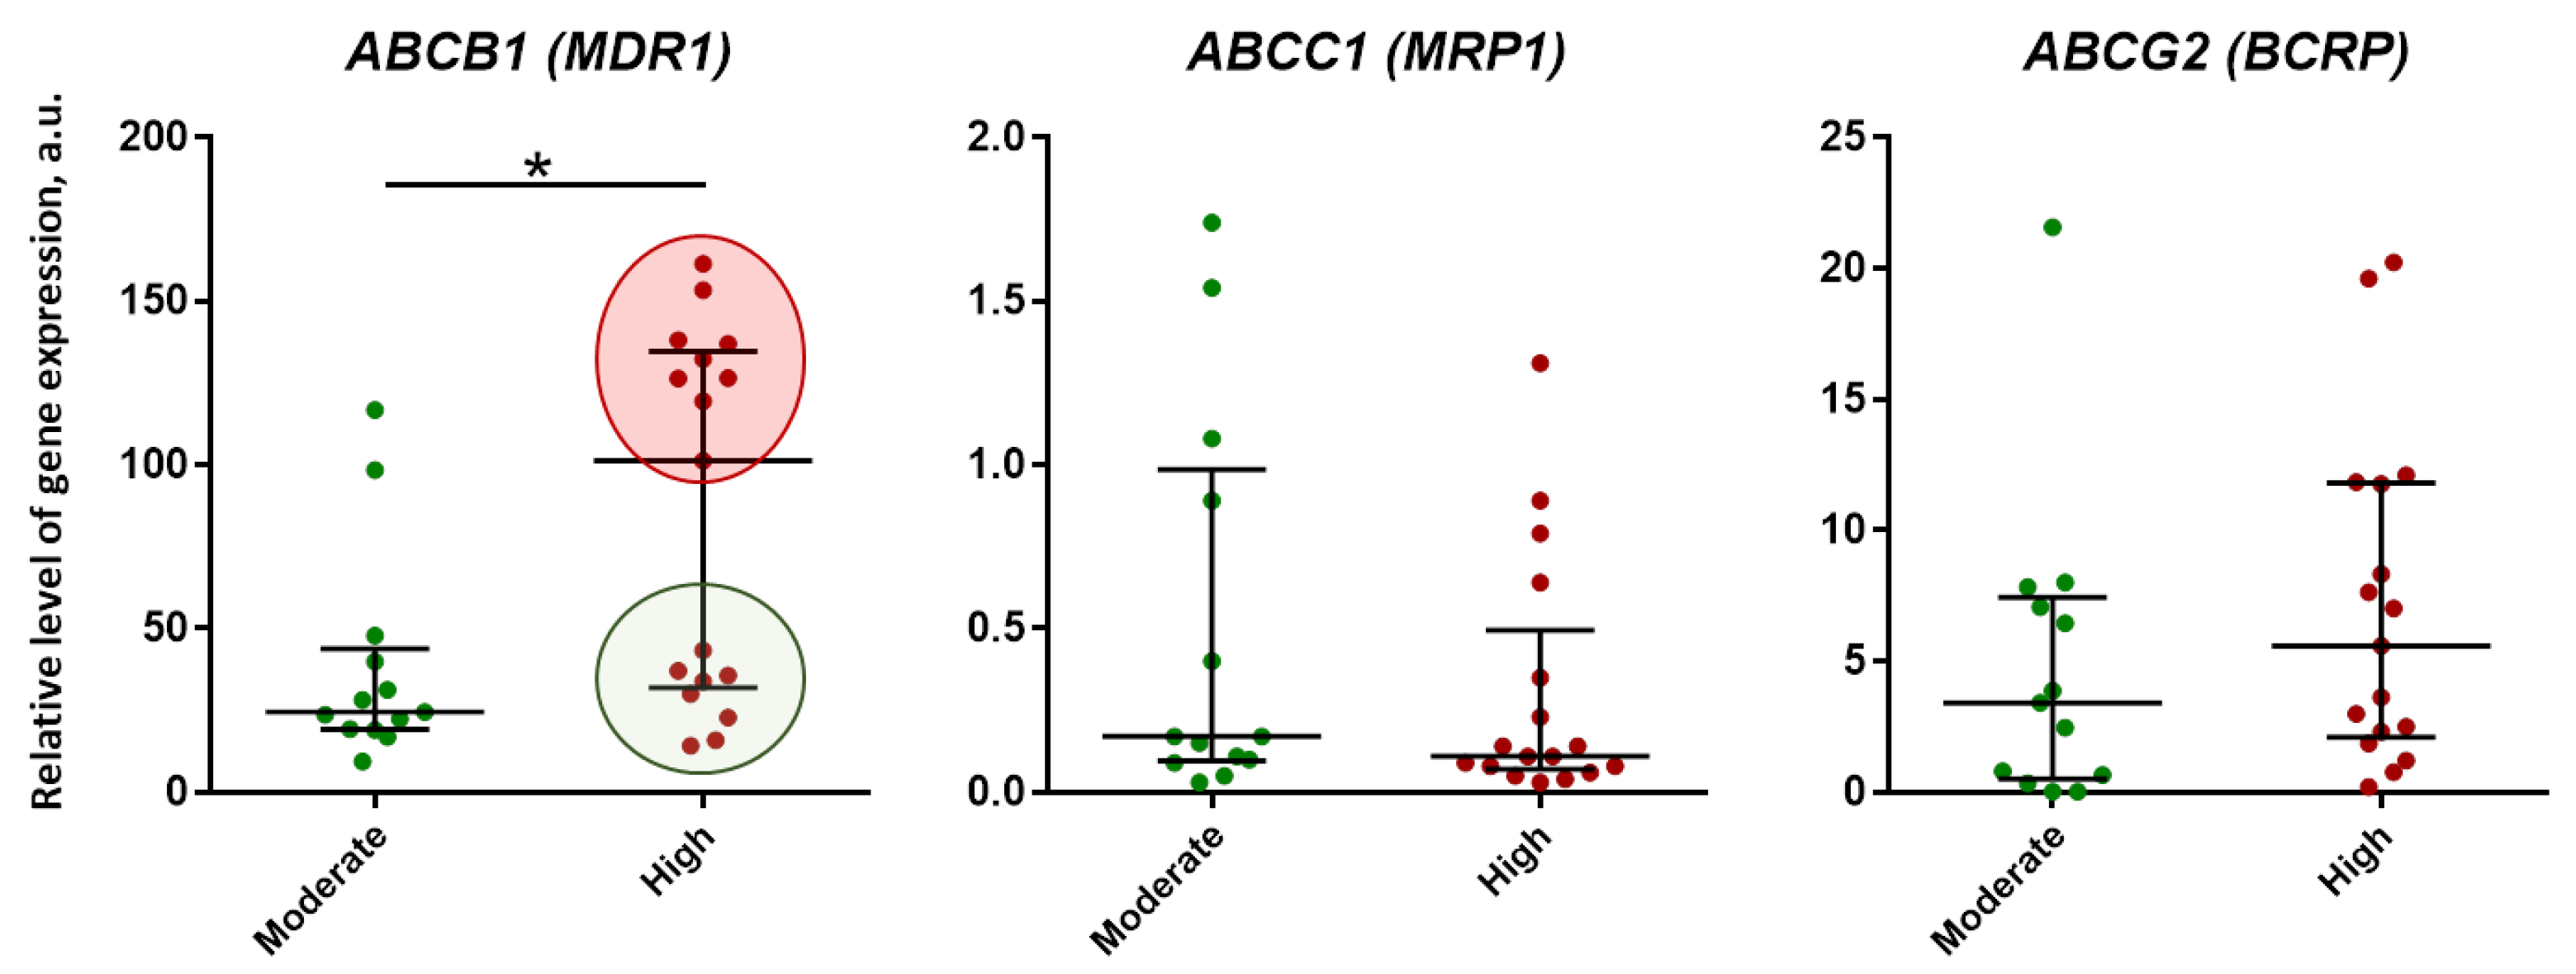
2.2. Expression of ABC-Transporter (P-gp, MRP1, BCRP) Genes in Lung Tissue of TB Patients with Pulmonary Tuberculoma

A study conducted on the samples obtained in 2017–2018 used real-time PCR to determine the expression of genes coding for ABC drug transporter proteins, including P-glycoprotein (P-gp, ABCB1), Multidrug Resistance associated protein (MRP1, ABCC1), and Breast cancer resistance protein (BCRP, ABCG2), in the surgical material of lungs of patients diagnosed with pulmonary tuberculoma (n = 30).
The study found significant variability in the expression of these genes, with high values of relative expression level typical for ABCB1—36.34 (23.02–118.81) a.u., medium values for ABCG2—3.75 (1.36–7.96) a.u, and low values for ABCC1—0.14 (0.08–0.58) a.u. The analysis also showed that only ABCB1 gene expression was significantly higher (p = 0.02) in samples with high inflammation activity compared to moderate activity. In the group with high inflammation activity, two subgroups with different levels of ABCB1 expression were identified: a subgroup with high expression, significantly higher than the values in the group with moderate inflammation activity (figure with red fill), and a subgroup with low expression (figure with green fill), matching the values in the moderate group (Figure 3).
These findings suggest that the expression of ABCB1 at high inflammation activity is heterogeneous and can be influenced by various factors. This hypothesis was tested on samples collected during the period 2021–2022, and the results are presented below.

2.3. Correlation Analysis of Genes Expression in Lung Tissue of TB Patients

To investigate the relationship between ABCB1 expression and inflammatory activity, we analyzed the correlation between ABCB1 and various genes, including cytokines (IL1, IL6, IL10, TNFa, TGFb1, and INFg), transcription factors (STAT1-3-6, SOCS3, and HIF1a), and markers of macrophages (CD86, CD163, CD206, and TGM2) and T-lymphocytes (CD3D and GZMB).
We found that ABCB1 has the highest correlation with STAT3 and SOCS3 (r = 0.76 and 0.71, respectively) (Figure 4).
Additionally, ABCB1 expression was strongly correlated with TGM2 (r = 0.69), HIF1a (r = 0.65) and IL6 (r = 0.65) genes, while moderately positive correlated with STAT6 (r = 0.52) and negatively correlated with INFg (r = −0.54).
Using hierarchical cluster analysis based on correlation, we identify three large clusters of co-expressed genes (Figure 5).
Cluster I, including ABCB1 gene, contains predominant transcription factor genes such as STAT3, SOCS3, HIF1a, cytokine IL6 and TGM2. IL6 gene expression demonstrates a very strong correlation with HIF1a (r = 0.91), STAT3 (r = 0.83) and SOCS3 (r = 0.82). In turn, STAT3 expression strongly correlates with SOCS3 expression (r = 0.79). TGM2 gene expression exhibits a very strong correlation with STAT3 (r = 0.82) and a strong correlation with SOCS3 (r = 0.72). HIF1a, in addition to the genes listed above, strongly correlates with STAT3 (r = 0.78) and IL10 (r = 0.69). Also in this cluster, a separate subcluster of STAT6 and TGFb1 is distinguished, which most closely correlate with each other (r = 0.601). At the same time, STAT6 has a strong correlation with TGM2 (r = 0.65) and moderate correlation with ABCB1 (r = 0.52) and STAT3 (r = 0.47).
Cluster II includes predominantly macrophage markers CD86, CD206, and CD163, which correlate most closely with TNFa gene expression. Interestingly, the expression of CD163 gene, which is predominantly a macrophage M2 marker, correlates to a greater extent with CD86, a macrophage M1 marker (r = 0.77), than with the expression of another M2 marker, CD206 (r = 0.62). CD163 also has a strong correlation with TNFa (r = 0.67) and IL1b (r = 0.62). However, no significant correlation was found between the expression of IL1b and TNF-α. In this cluster, IL1b and IL10 form a separate subcluster, the expression of which strongly correlates with each other (r = 0.63).
Cluster III is represented mainly by genes of T-lymphocytes markers. The expression of the gene marker of cytotoxic lymphocytes GZMB is combined into one subcluster with STAT1, despite the fact that a weak correlation was found between them (r = 0.37), and CD3D with INFg moderately correlate with each other (r = 0.55). It should be noted that the expression of INFg gene included in this cluster, in addition to ABCB1 gene, also exhibits moderate negative correlations with STAT3 (r = −0.55) and TGM2 (r = −0.49).
Clusters II and III are hierarchically related to each other, but not to Cluster I.

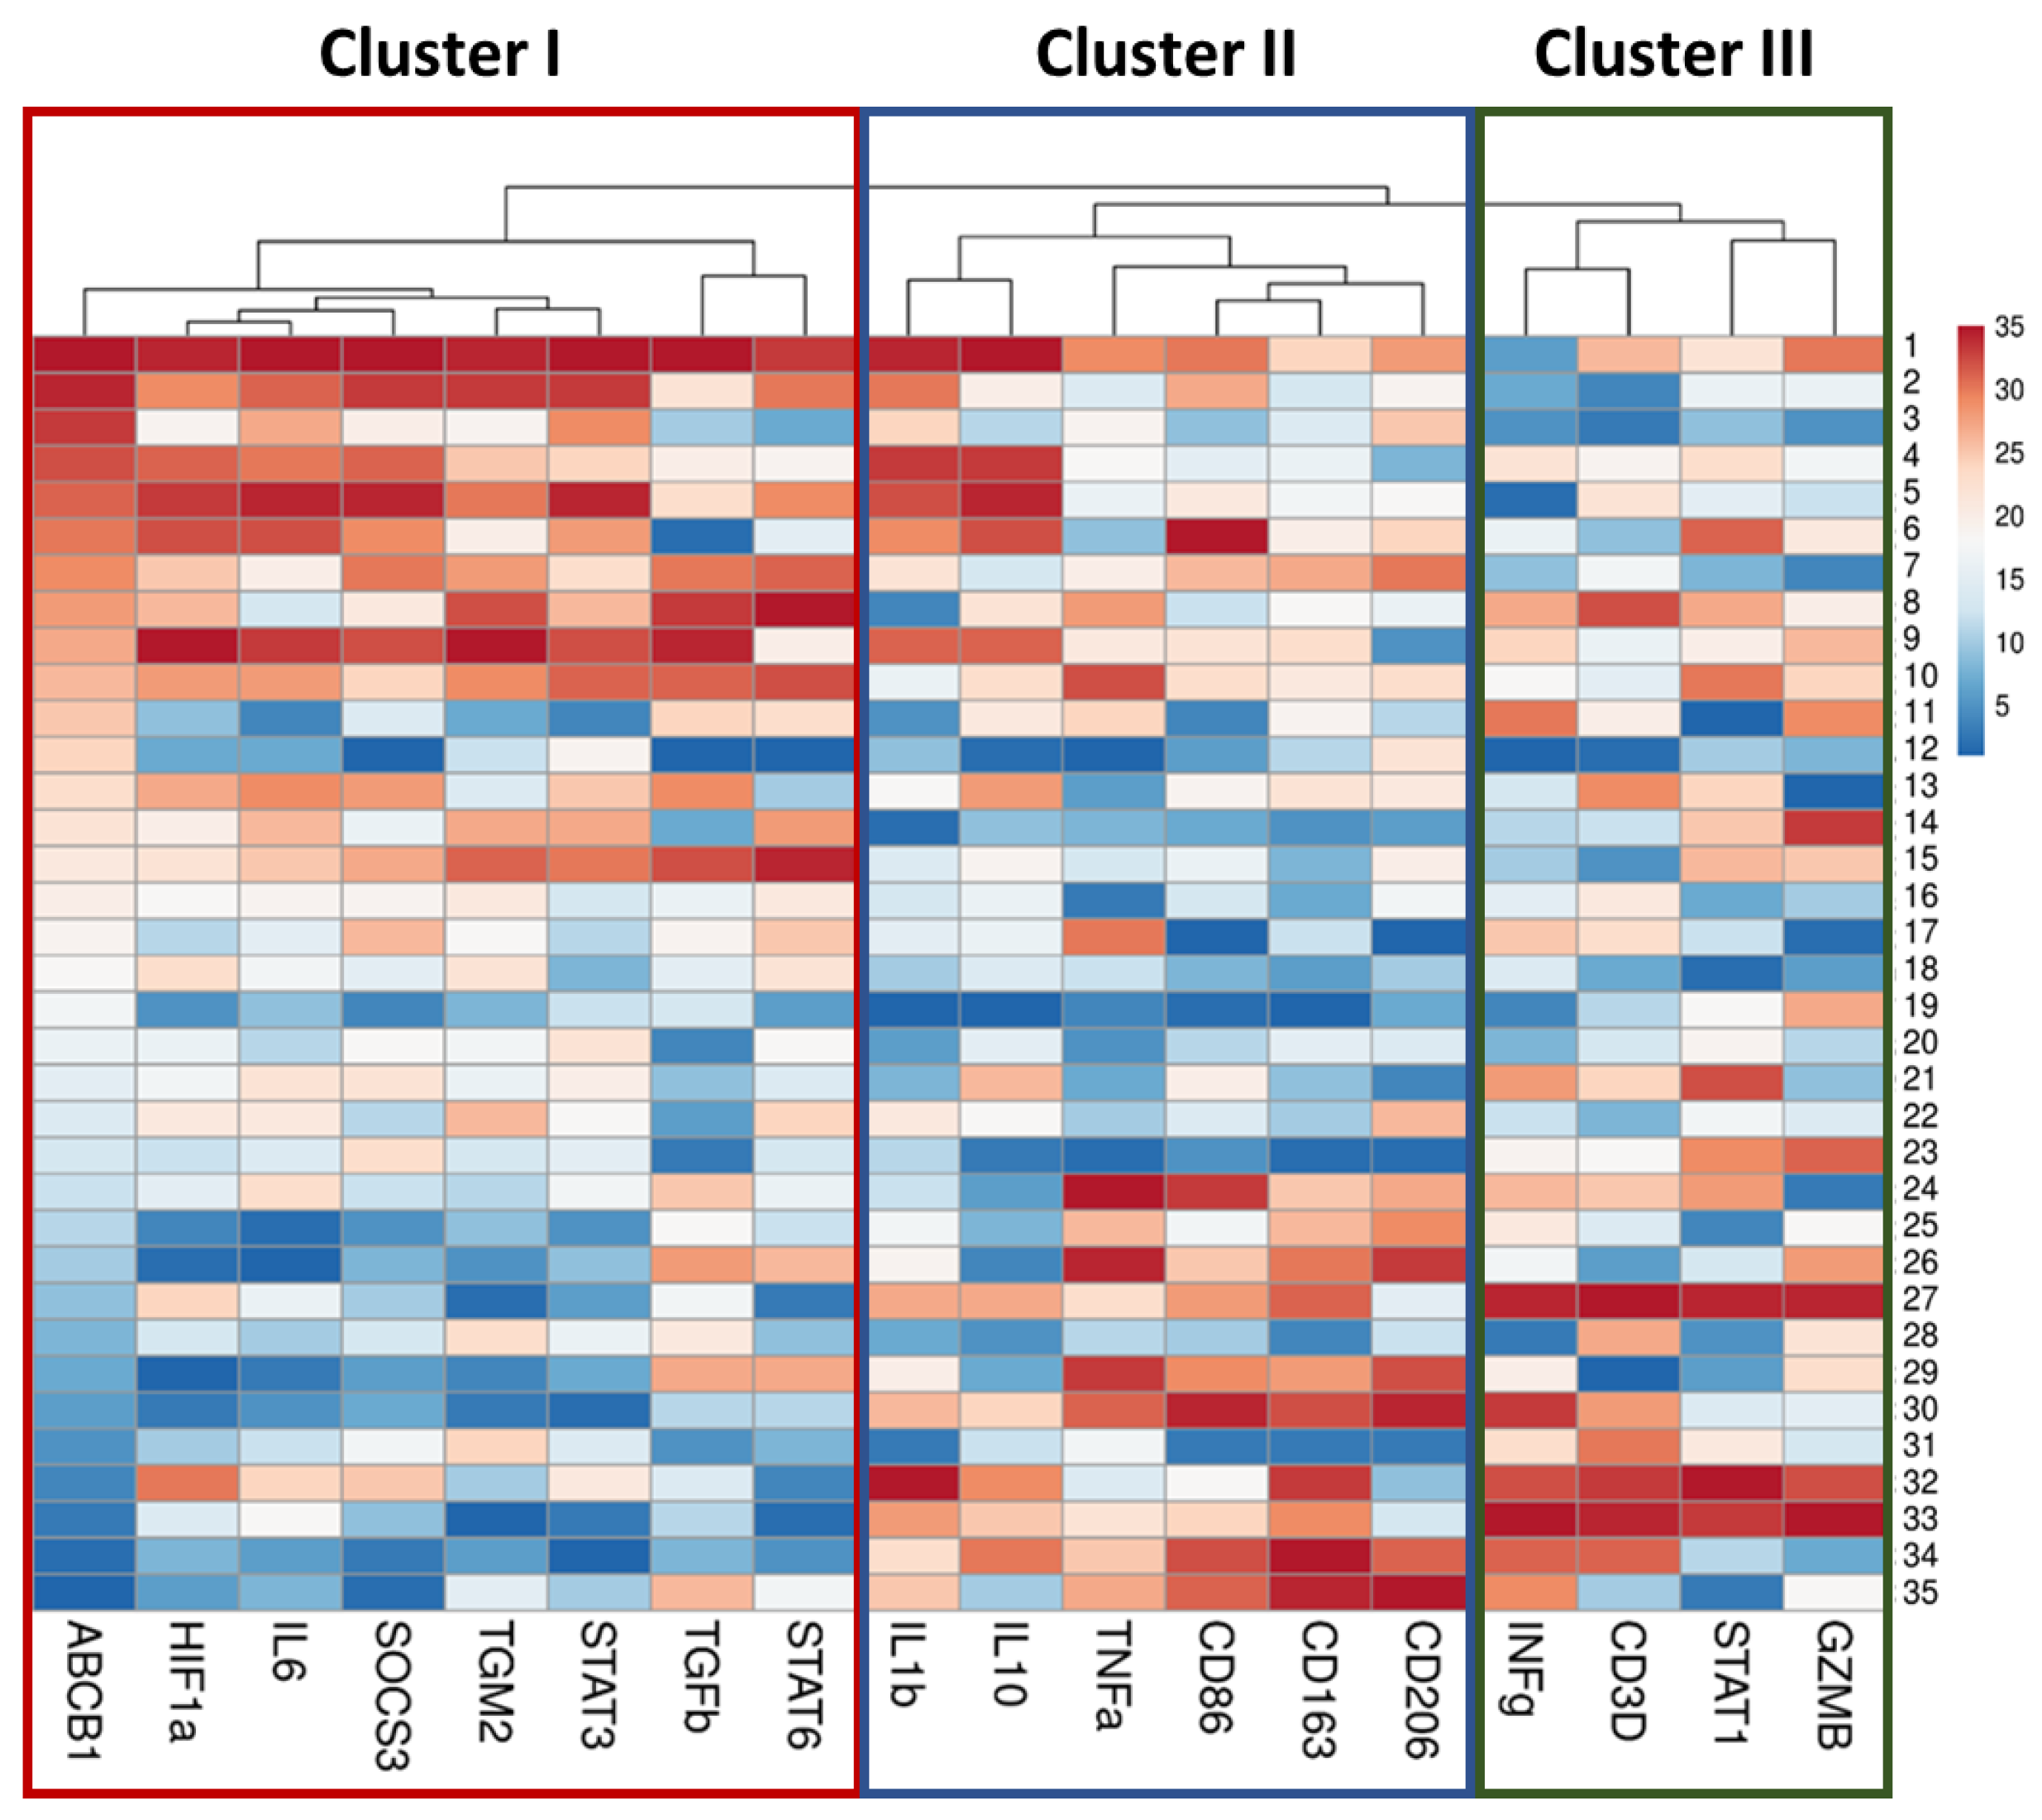
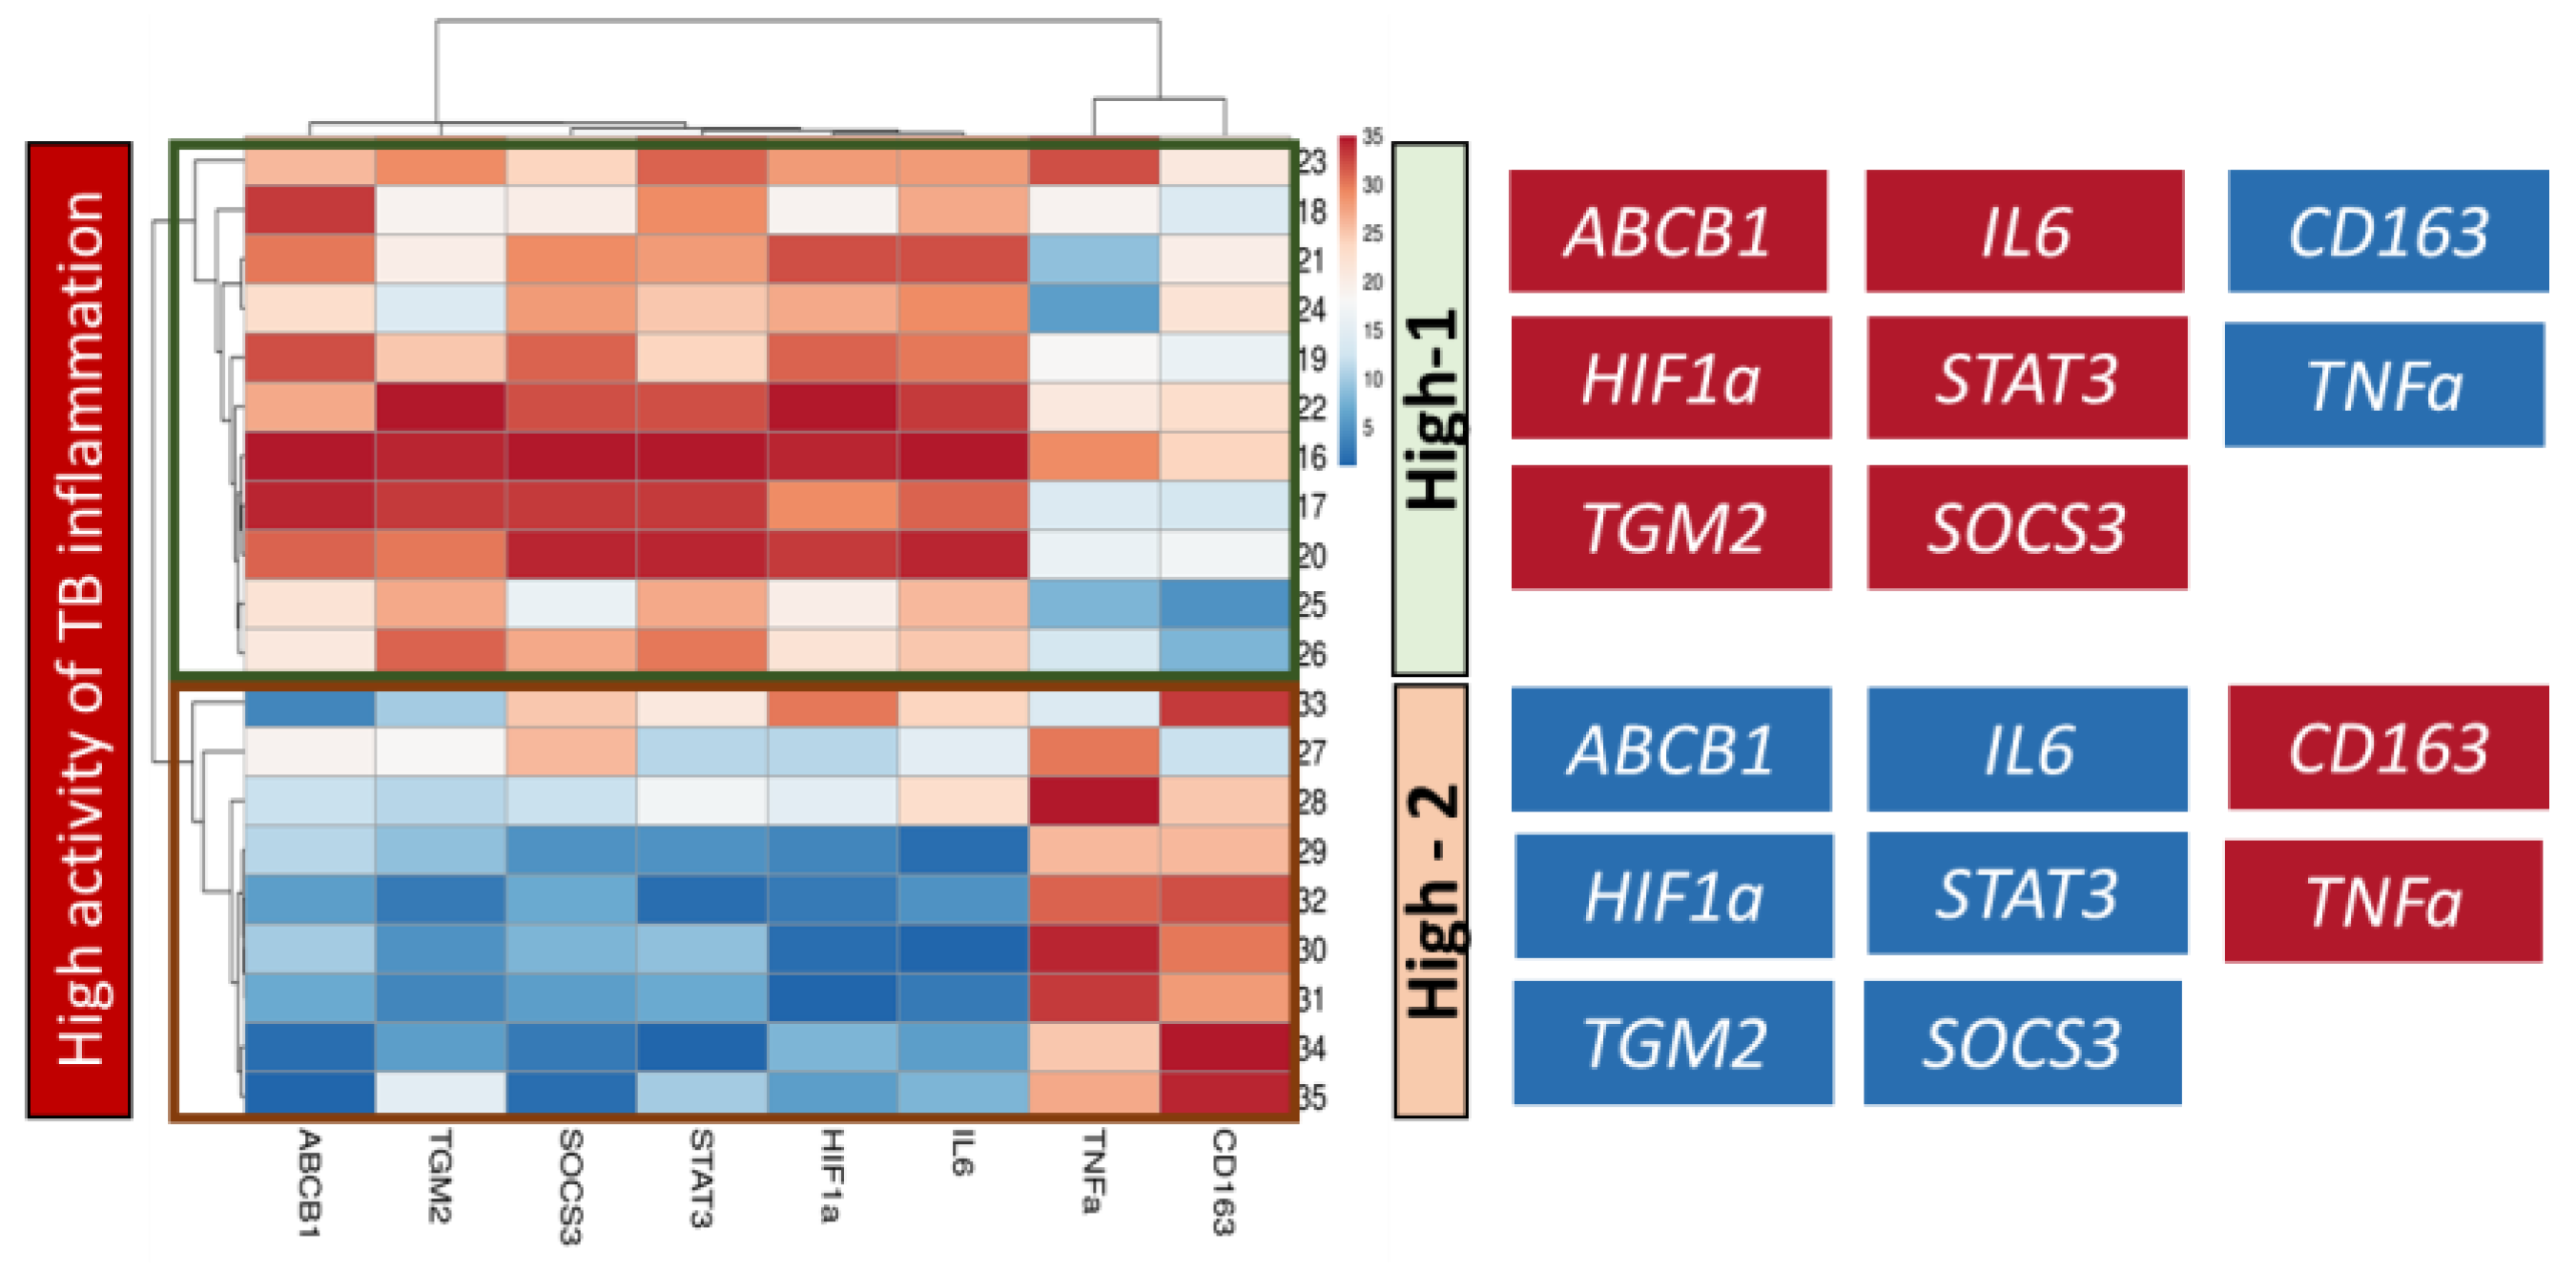
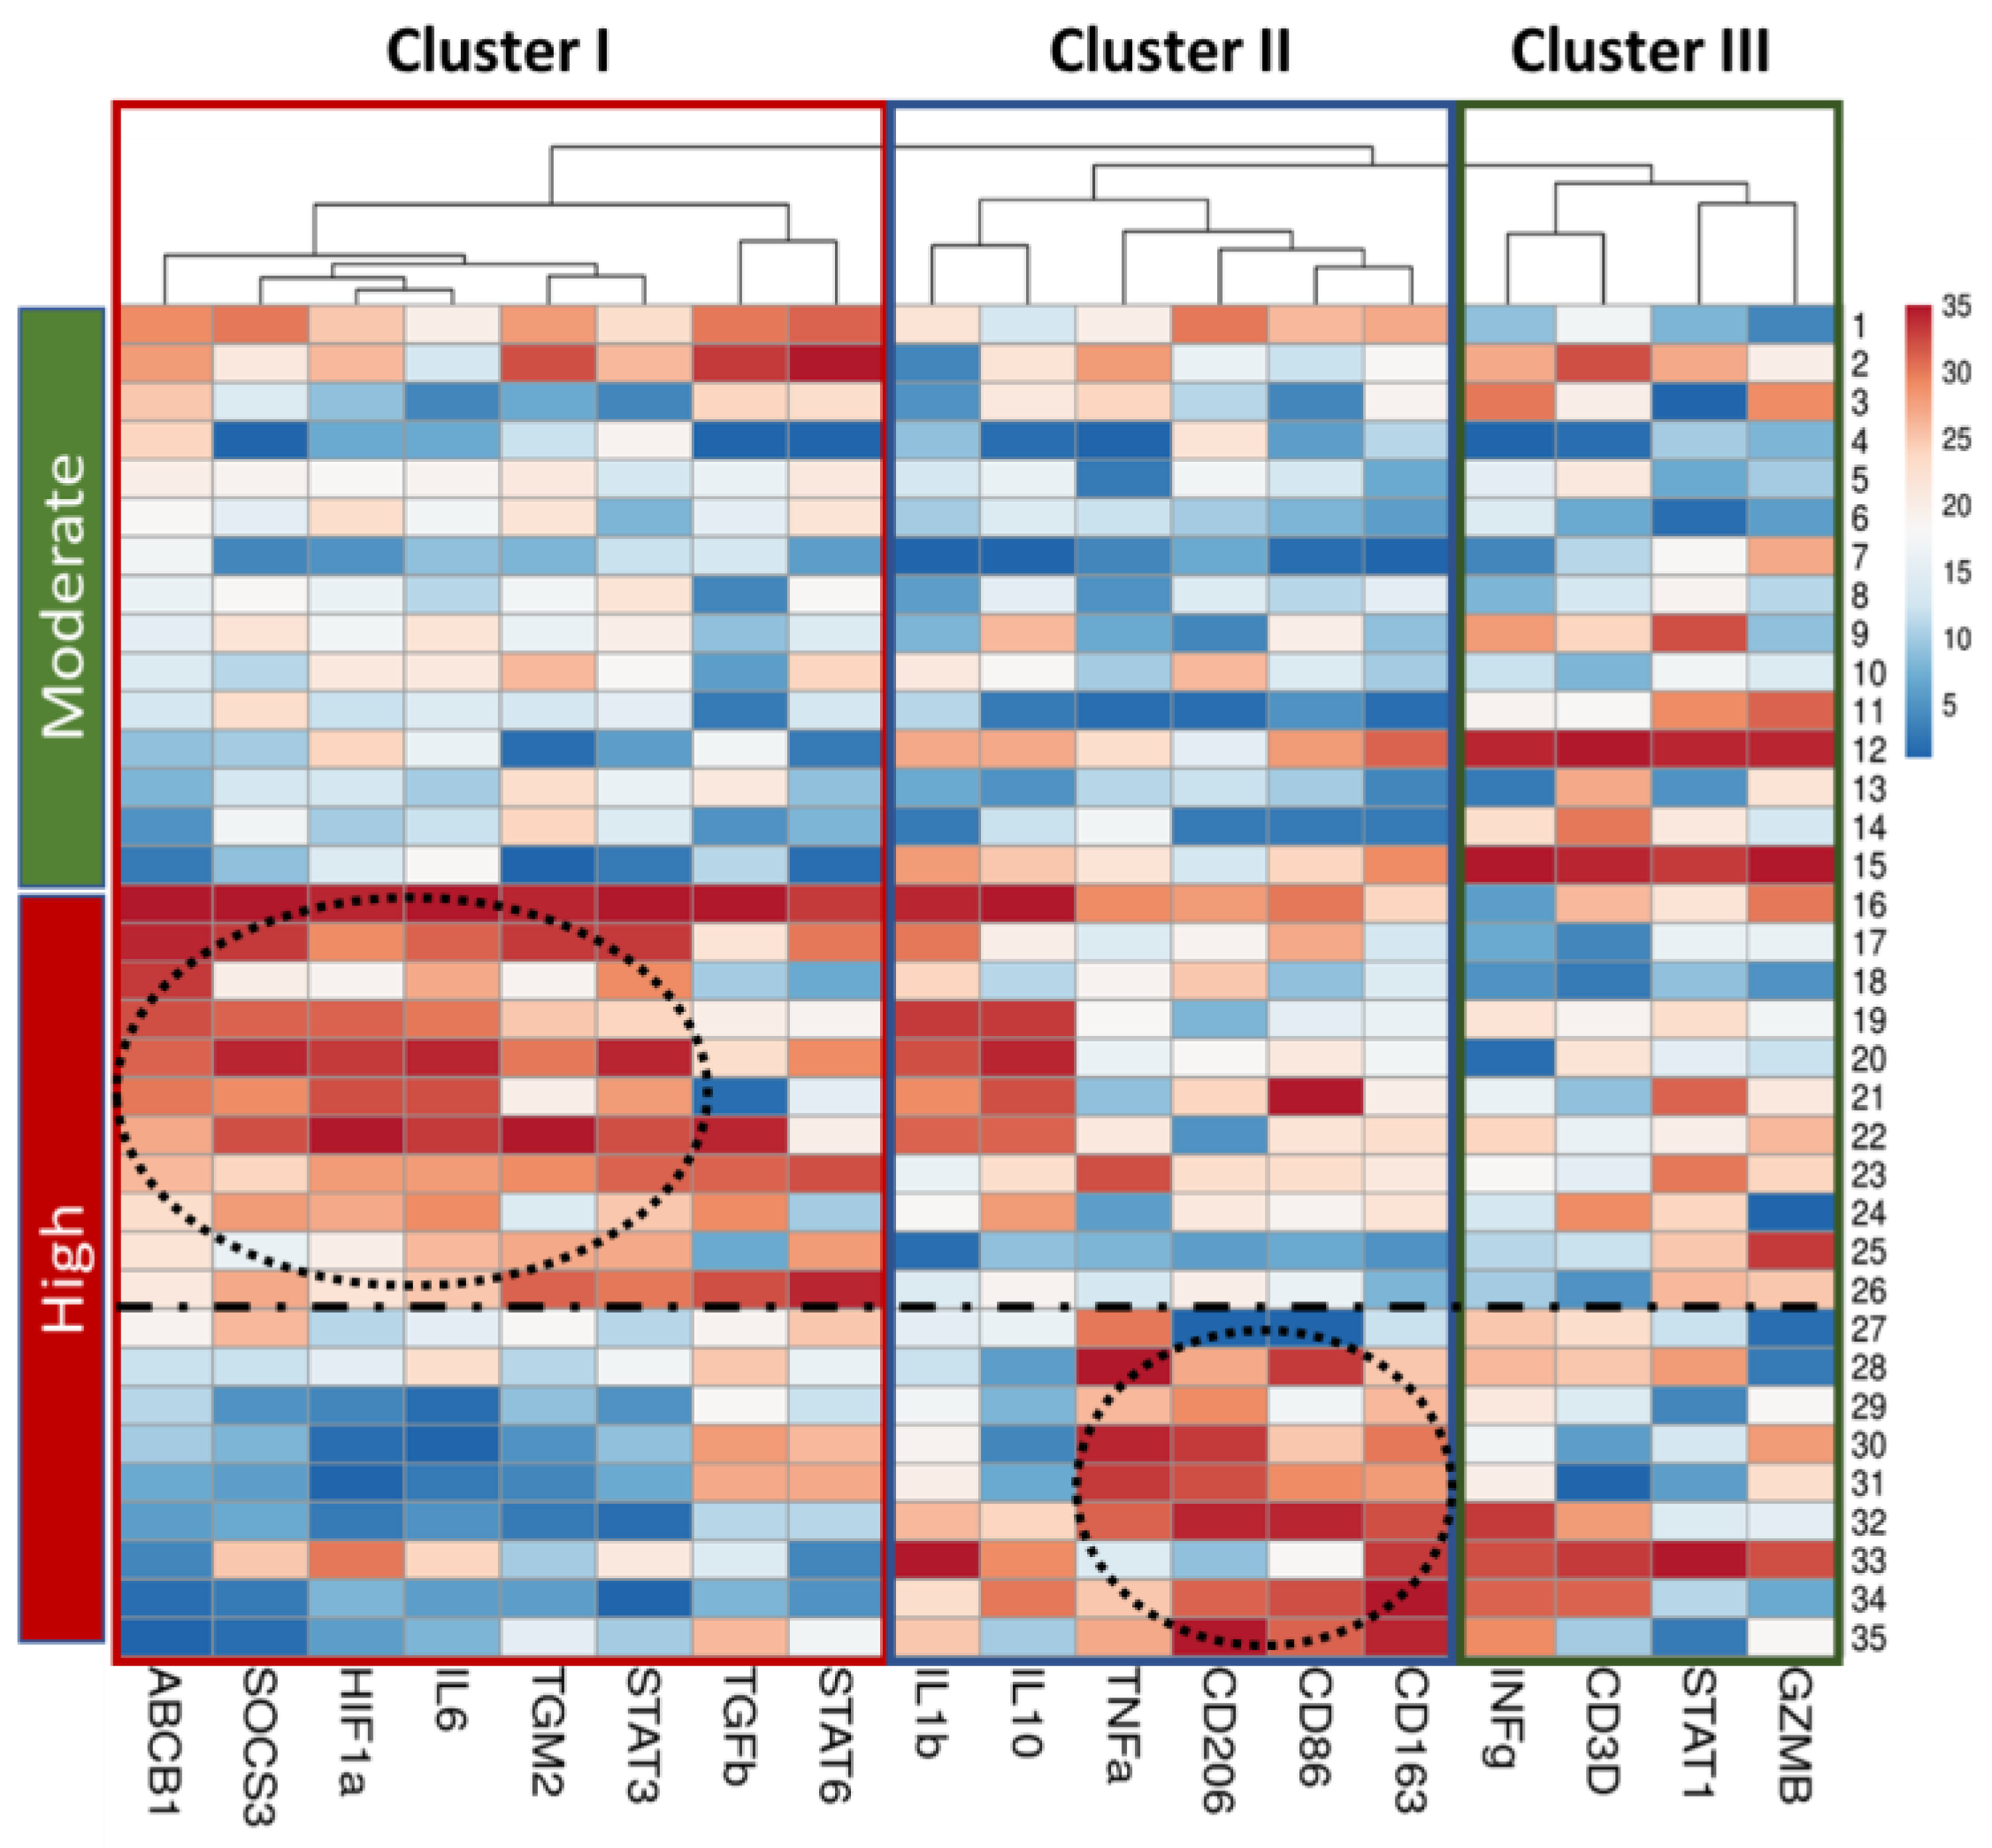
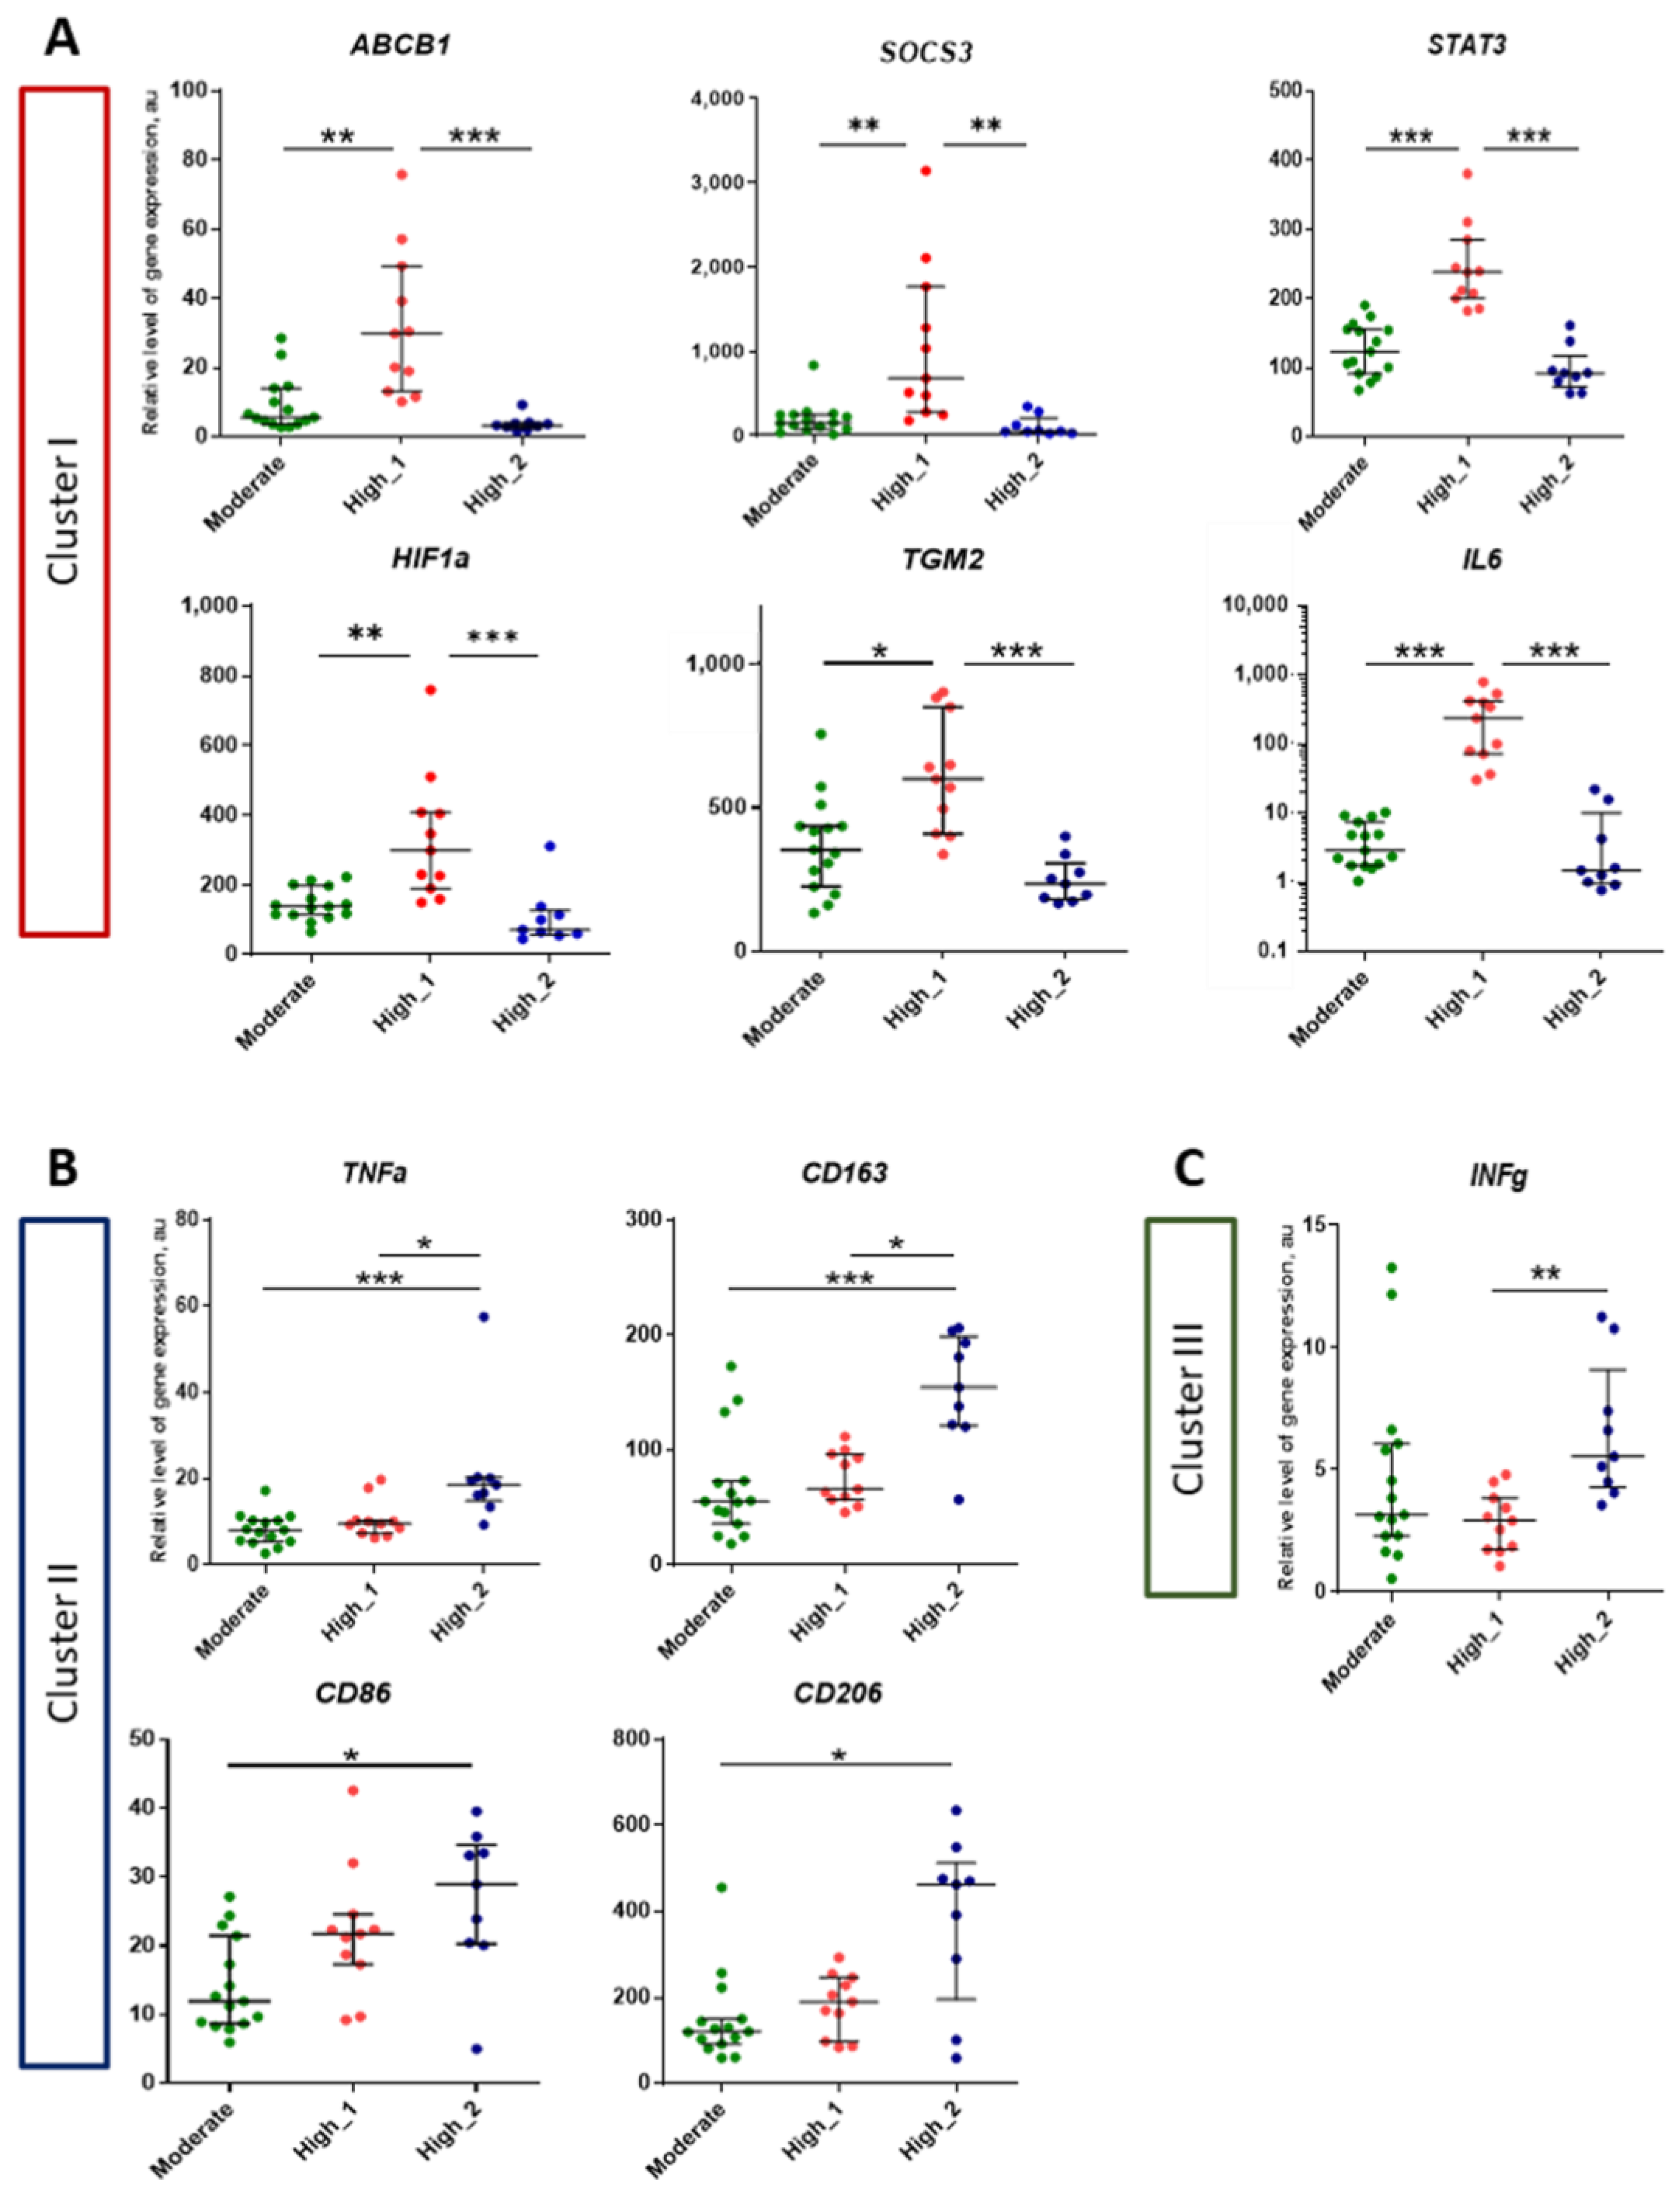
2.4. Analysis of Genes Expression in Lung Tissue of TB Patients Depending on the Activity of Inflammation

The relative level of expression of cytokine genes such as IL1b, TGFb1 and TNFa, and macrophage markers CD86, CD163 and CD206 was higher in the lung tissue of patients with high inflammation activity (“High” group) compared to moderate (“Moderate” group) (Figure 6). No statistically significant differences were found in the level of expression of all other studied genes.
According to the heatmap data presented, the “High” group exhibits heterogeneity in gene expression levels. Within this group, some samples are predominantly characterized by high expression of genes in Cluster I, while others show predominantly high expression in Cluster II (Figure 7).
Based on the gene expression profile, primarily by the level of ABCB1 expression, we divided the group with high activity inflammation into two subgroups: the first subgroup included samples with line numbers 16–26 (n = 11), the second subgroup included samples with line numbers 27–35 (n = 9) (Figure 7). We conducted a comparative gene expression analysis in these subgroups against “Moderate” group for each of the identified clusters.
A comparative analysis of gene expression showed that in Cluster I, the expression of ABCB1, IL6, SOCS3, STAT3, HIF1a, and TGM2 in “High-1” subgroup is higher than in “High-2” subgroup. The median relative level of expression of these genes in “High-1” subgroup is also significantly higher than in “Moderate” group. At the same time, the expression of these genes in “High-2” subgroup does not differ from “Moderate” group (Figure 8A).
In Cluster II, the expression of TNFa and CD163 genes in “High-2” subgroup is higher than in “High-1” subgroup and the median expression of these genes in “High-2” subgroup is significantly higher than in “Moderate” group, while the expression of these genes in “High-1” subgroup does not differ from “Moderate”. The expression of CD86 and CD206 genes in “High-2” subgroup significantly exceeds the values in “Moderate” group. However, we did not find significant differences in the expression of these genes between the “High-1” and “High-2” subgroups (Figure 8B).
In Cluster III, differences were found only in the level of INFg gene expression between the “High-1” and “High-2” subgroups. At the same time, no difference was found between these two subgroups with the “Moderate” group (Figure 8C).
Thus, differences in the level of gene expression between subgroups with high inflammation activity and their comparison with the group with moderate inflammation activity made it possible to identify two different genetic signatures that may cause high inflammation activity. The first subgroup of genes includes ABCB1, HIF1a, SOCS3, STAT3, IL6 and TGM2, and the second subgroup of genes includes CD163 and TNFa. At high inflammation activity, as analysis shows, either one or the other signature predominates in the lung tissue of TB patients (Figure 9).

3. Discussion

In this study, we utilized surgically acquired samples exclusively from patients diagnosed with pulmonary tuberculoma. Focusing only on this clinical form allowed us to standardize the samples for analysis and eliminate the influence of factors associated with other forms of TB. We identified differences in ABCB1 gene expression and its correlation with other genes depending on the inflammation activity of tuberculomas.
On the samples obtained in 2017–2018, we investigated the expression of the most clinically relevant ABC drug transporter genes, such as ABCB1 (P-gp), ABCC1 (MRP1), and ABCG2 (BCRP), expressed in the lungs [50]. Our findings revealed higher expression of the ABCB1 gene in patients with active inflammation activity. The same result was confirmed during the PCR analysis of samples obtained in 2021–2022. Notably, both materials also revealed the heterogeneity of ABCB1 gene expression in the lung tissue with a high activity of inflammation in lung tissue. This confirms that high activity of inflammatory process (according to the morphological assessment of pulmonary tuberculoma) can be accompanied by both high and low expression of ABCB1 gene. This raises the question of identifying genetic profile differences between subgroups with varying levels of ABCB1 expression.
It is assumed that the functional activity of P-gp and polymorphisms in ABCB1 gene may reduce the accumulation of anti-TB drugs in the foci of TB inflammation [51,52]. Consequently, this can lead to the selection/emergence of drug-resistant strains of M.tb [11], and ultimately contribute to inflammation progression. Thus, our goal was to explore the relationship between various genes associated with high inflammation activity and ABCB1 gene expression in the lung tissue of TB patients. Various factors involved in inflammation during TB can act as inducers of ABCB1 gene expression.
Cytokines such as IL1b, IL6, TNFa, INFg, and TGFb1 have been shown to increase the expression of ABCB1 [23,24]. Transcription factors NF-kB and STAT3, which play crucial roles in regulating inflammation in TB, directly bind to the promoter region of ABCB1 gene and induce its expression [53,54,55]. Human TB lesions are severely hypoxic and M.tb infection drove HIF1α accumulation even in normoxia [36]. Notably, HIF1a, a transcription factor involved in hypoxia responses, was found to have a binding site within ABCB1 gene [56].
TB is characterized by the formation of granulomas, organized aggregates of immune cells. Cellular composition and gene expression analyses within granulomas during TB progression have received considerable attention [57,58,59,60]. It is important to note that individual lung granulomas within the same patient exhibit heterogeneity in terms of inflammation activity, cellular composition, and the ability of their cells to eliminate M.tb [61]. In our study, we analyzed gene expression not in the granuloma itself, but in the area of the lung tissue adjacent to the wall of the granuloma, so-called perifocal area (PFA). Lung tissues surrounding TB foci are sensitized and highly responsive to tuberculin, even when injected at a distant site [62]. We hypothesized that gene expression in the PFA would reflect the systemic nature of inflammation and immune system parameters to a greater extent than directly within the granulomas.
In TB inflammation, the cellular composition of PFA changes: CD3+ and CD68+ cells are detected, although in low levels compared to granuloma [57]. We previously demonstrated the presence of M.tb aggregates and clusters within the PFA [63]. At high inflammation activity, we also observed PFA infiltration by inflammatory cells and the formation of granulomas without foci of necrosis. We hypothesized that these infiltrates may include immune cells with high expression of ABCB1.
ABCB1 expression is characteristic of many types of immune cells [16]. Although we have not found a correlation between ABCB1 expression and lymphocyte or macrophage markers in this study, we believe that further analysis of lung tissue in TB patients using multiplex transcriptomics (e.g., single-cell RNA sequencing) or proteomics is required to identify specific cell types associated with high ABCB1 gene expression.
We observed that, overall, the expression levels of macrophage markers CD86, CD163, and CD206 were higher in the group with high inflammation activity compared to the moderate group. Suzuki et al. found that the expression levels of CD206 and CD163 proteins in lung tissue correlated with their soluble forms in the blood serum of TB patients. Furthermore, plasma concentrations of sCD206 and sCD163 were higher in patients with active pulmonary TB compared to control subjects, and increased levels of sCD163 and sCD206 were associated with higher mortality in pulmonary TB patients [64,65]. Serum sCD163 concentrations also correlated with TB severity [66].
We observed the highest expression of CD163 gene in the group of patients characterized by low expression of the ABCB1 gene and high expression of TNFa gene. Additionally, in the high inflammation activity group, the expression levels of TNFa, IL1b, and TGFb1 cytokine genes were generally higher compared to the moderate inflammation activity group. Numerous studies have reported that elevated levels of these cytokines correlate with TB severity. Serum levels of TNFa, IL1b, and TGFb1 were found to be related to radiological severity in patients with active pulmonary tuberculosis [67]. Similarly, serum levels of TNFa and TGFb were significantly higher in the advanced TB cases when compared with mild–moderate TB patients [68]. Patients with pulmonary TB and bilateral or cavitary lesions of lung tissue had significantly higher levels of TNFa and IL1b compared with those with unilateral or non-cavitary lesions [69]. Serum TNFa levels correlate with the increase in clinical severity score in TB patients [70,71]. According to our data, TNFa expression demonstrated a strong correlation with CD163 expression. Moreover, the macrophage genes were grouped together in a gene co-expression cluster with TNFa.
Furthermore, while TGFb1 moderately correlated with TNFa expression (r = 0.56), we identified a strong correlation between TGFb1 expression and STAT6 (r = 0.60), with STAT6 moderately correlating with STAT3 (r = 0.47). Protective immunity against M.tb is believed to require activation of Type 1 INFg-dependent signaling pathway [72]. However, it has been shown that both Type 1 and Type 2 signaling pathways may be required for mycobacterial granuloma formation [32]. Therefore, the increased level of TGFb1 expression in the lung tissue of TB patients with high activity inflammation may be associated with the predominance of Type 2 signaling pathways. In our correlation analysis, we found a negative moderate correlation between STAT3 and INFg gene expression.
TNFa, a pro-inflammatory cytokine, plays a crucial role in the immune response against M.tb [73]. It is produced by various immune cells, particularly macrophages, in response to mycobacterial infection and is required for pathogen control. TNFa signaling activates the canonical NF-κB pathway. However, excessive and uncontrolled production of TNFa can lead to tissue damage and hyperinflammation [74]. Interestingly, Beig et al. found that some patients had normal serum TNFa values despite severe lymphadenopathy and necrosis, suggesting the involvement of factors other than TNFa in high inflammation activity [71].
We found that two subgroups, “High-1” and “High-2”, are distinguished at high inflammatory TB activity. “High-1” is characterized by high levels of gene expression, indicated in the heatmap as Cluster I, and “High-2” is characterized by a high level of gene expression from Cluster II. Analyzing gene expressions between these clusters allowed us to identify two genetic signatures characterizing these subgroups. Importantly, either one or the other signature predominated in cases of high inflammation activity. Notably, no significant morphological changes were observed between these subgroups on standard H&E histological sections. It is possible that further analysis of cellular composition using additional cellular markers and immunohistochemistry methods could reveal such differences.
We previously mentioned TNFa and CD163, as their expression was generally higher in the group with high inflammation activity. In the other subgroup, the median expression of ABCB1, as well as IL6, STAT3, SOCS3, HIF1a, and TGM2, was significantly higher compared to the group with moderate inflammation activity.
IL6, similar to TNFa, plays a role in the immune response against M.tb by activating immune cells and promoting the production of other pro-inflammatory cytokines. Elevated plasma levels of IL6 have been observed in TB patients with more severe disease and are associated with pulmonary inflammation and lung damage [75,76]. IL-6 signaling primarily occurs through JAK/STAT pathway, predominantly via STAT3 [77]. High levels of IL6, like TNF-a, can result in tissue damage and hyperinflammation [78].
Utilizing the GeneMANIA.org resource, we constructed a network of interactions between genes, which not only correlated with the expression of ABCB1, but were also increased at high inflammation activity. STAT3 was found to represent a core gene that connects all these genes (Figure 10).
It is known that STAT3 plays an important role in the pathogenesis of TB [30]. Single nucleotide polymorphisms of the STAT3 gene are associated with vulnerability to active TB or correlate with disease severity [79].
STAT3 (Signal Transducers and Activators of Transcription) is a component of the IL6-activated Acute Response Phase Factor (APRF) complex that stimulates the production of innate immune mediators [80]. In the cell, it can be in un-phosphorylated (uSTAT3) and phosphorylated (pSTAT3) form. IL6 stimulates the formation of pSTAT3, which activates many genes, including the STAT3 gene itself. This results in an increase in the concentration of uSTAT3 which drives a second wave of expression of IL6 [81]. The SOCS3 (cytokine signaling suppressor 3) inhibits STAT3 phosphorylation by binding to the gp130 subunit of IL6 receptor. While SOCS3 is generally a negative regulator of IL6 signaling, it can positively regulate inflammatory responses by inhibiting STAT3 in certain cases. Aberrant expression levels of SOCS3/STAT3 have been reported in various cell types, suggesting their involvement in the pathogenesis of various inflammatory diseases [82].
IL6, IL10, pSTAT3, and SOCS3 have been identified as influential factors distinguishing tuberculosis patients from healthy individuals [83]. Although IL10 was not included in the same cluster as IL6 gene expression in our study, we found moderate correlations between IL10 expression and IL6 (r = 0.59) and SOCS3 (r = 0.57). Previous studies have demonstrated a correlation between high serum levels of IL6 and IL10 in the blood of patients with active TB, which has been attributed to aberrant activation of STAT3 in immune cells [84].
Initially, we included TGM2 in our study as a macrophage M2 marker. We observed a negative moderate correlation between TGM2 and CD163 expression (r = −0.41). TGM2 is a pleiotropic enzyme involved in various biological functions, including post-translational protein modifications, cell death, and signaling [85]. It has been shown that TGM2 activates the IL-6/JAK/STAT3 signaling pathway, and suppressing TGM2 expression reduces STAT3 phosphorylation [86]. In TB inflammation, TGM2 plays a significant role, promoting the survival of M.tb in infected macrophages: its inactivation enhances the bactericidal properties of macrophages. TGM2 may be a potential target for HDT for TB [87]. In addition, TGM2 constitutively activates the HIF1a promoter [88].
Hypoxia is a characteristic feature of TB inflammation in the lungs of patients [36]. Hypoxia-inducible factor 1 (HIF1) is a transcription factor composed of HIF1a and HIF1b subunits. While HIF1b is constitutively expressed, HIF1a levels can vary. HIF1a can be stabilized by STAT3 and IL-6 [89]. In turn, STAT3 inhibition blocks HIF1a expression [90]. The role of HIF1a in tuberculosis is ambiguous: it promotes antimicrobial activity of human macrophages against M.tb, but also impairs CD4 T cell activation and differentiation, leading to increased susceptibility to M.tb infection [91]. HIF1a restricts NF-κB-dependent gene expression to control innate immunity signals, thereby preventing excessive and damaging pro-inflammatory responses [92]. Hence, high HIF1a expression can contribute to pathogen destruction, but its excessive activation can also lead to inflammation progression and tissue damage [93]. Comparing our correlation analysis results with existing knowledge, we can support the relationship between high ABCB1 expression and the expression of IL6, STAT3, SOCS3, HIF1a, and TGM2 genes. Moreover, the correlations we identified suggest that the induction of ABCB1 expression in the lung tissue of TB patients is mainly mediated by the activation of the STAT3 signaling pathway.
It is worth noting that elevated levels of secreted P-gp have been associated with disease severity or therapeutic response failure in conditions such as chronic rhinosinusitis, rheumatoid arthritis, and systemic lupus erythematosus [94,95,96]. ABCB1 is included in a list of 20 differentially expressed genes in whole blood that distinguish patients with active tuberculosis from healthy individuals [97]. Increased expression and functional activity of P-gp have been found in memory CD4 T cells of patients with latent TB compared to non-infected controls [98]. These findings underscore the importance of studying the regulation of ABCB1 gene expression and the functional activity of P-gp in patients with pulmonary TB.

4. Materials and Methods

4.1. Patients and Lung Tissue Samples

This study exclusively enrolled patients diagnosed with pulmonary tuberculoma, a clinical–anatomical form of tuberculosis (TB) according to the Russian classification system [99] and were referred for surgical treatment. The diagnosis of TB was confirmed through bacteriological and PCR methods.
Lung tissue samples were obtained from 30 patients (18 women and 12 men) aged 28–49 years (mean 35.24) in 2017–2018 and from 35 patients (14 women and 21 men) aged 18–56 years old (mean 32.43) in 2021–2022 in Central Tuberculosis Research Institute (CTRI, Moscow, Russian Federation). All patients in the preoperative periods received anti-TB treatment and its duration varied widely: from 11 months to 4 years in patients in 2017–2018 (mean 28.3 months) and from 4 months to 5.5 years in patients in 2021–2022 (mean 22.2 months).

4.2. Histology

Following surgical resection, lung tissue specimens were immediately fixed in 10% formalin (BioVitrum, Moscow, Russia). Dehydration was carried out according to the standard protocol in a series of alcohols from 70 to 96%, 100% ethanol was replaced by isopropyl alcohol. After dehydration with isopropyl alcohol, the samples were embedded in paraffin Hystomix (BioVitrum, Moscow, Russia), and then were cut at 5 μm thickness for preparation of serial section slides. Tissue sections were stained with hematoxylin & eosin (H&E) and embedded in Canada balsam for histological examination. Slides were used to classify the clinical material into tuberculoma with high and moderate activity of TB inflammation. A Biozero BZ-9000E from Keyence (Keyence, Osaka, Japan) was used for light microscopy. The research was carried out using the equipment of the Core Centrum of the Institute of Developmental Biology RAS.

4.3. Gene Expression Analyses

A sample of lung tissue (about 25–50 mg) was taken immediately after surgery from an area about 0.5 cm from the granuloma wall, referred to as the perifocal area (PFA). The samples were frozen and stored at −80 °C for subsequent PCR analysis.
RNA extraction was performed using TRI Reagent (MRC, Cincinnati, OH, USA) according to the manufacturer’s instructions. The RNA concentration was measured using a NanoDrop 8000 spectrophotometer (Thermo Fisher Scientific, Waltham, MA, USA). RNA integrity was assessed by gel electrophoresis, and samples with visible bands of 5S and 18S RNA were taken for analysis.
For cDNA synthesis, 1 μg of RNA was treated with DNase (Thermo Fisher Scientific, Waltham, MA, USA) as per the manufacturer’s instructions. Reverse transcription was performed using the MMLV RT kit (Evrogen, Moscow, Russia) following the provided instructions and utilizing random hexamer primers. The resulting cDNA was used for quantitative PCR analysis. For real-time PCR, the commercial mixture qPCRmix-HS SYBR and Low-Rox (Evrogen, Moscow, Russia) containing polymerase, buffer, and a mixture of nucleotides was used according to the manufacturer’s manual. A 250 ng sample of the synthesized cDNA was taken into the reaction, followed by the addition of a forward and reverse primer at a final concentration of 1 µM.
Real-time PCR for samples obtained between 2017 and 2018 was performed in 2018 using a CFX96 Touch (Bio-Rad Laboratories, Inc., Hercules, CA, USA) with the primers listed in Table 1.
Each sample was amplified in triplicate using the following PCR cycling profile: 95 °C for 5 min, followed by 39 cycles at 95 °C for 13 s, 60 °C for 20 s and 72 °C for 15 s. Relative expression levels were quantified using the ΔCt method and arbitrary units (a.u.) were calculated as 2−ΔCt × 103, where ΔCt is the difference between the threshold cycles of the target gene and the housekeeping gene RPL27.
Real-time PCR for samples obtained between 2021 and 2022 was performed in 2022 using a QuantStudio 12K Flex system (Applied Biosystems, Waltham, MA, USA) using the primers shown in Table 2.
Each sample was amplified in duplicate using the following PCR cycling profile: 95 °C for 3 min, followed by 40 cycles at 95 °C for 15 s and 60 °C for 60 s. Relative expression levels were quantified using the ΔCt method and arbitrary units (a.u.) were calculated as 2−ΔCt × 104, where ΔCt is the difference between the threshold cycles of the target gene and the B2M housekeeping gene.

4.4. Data Analyses

Statistical processing was carried out using the statistical package GraphPad Prism Version 7.04 (GraphPad Software, La Jolla, CA, USA). The data are presented as medians with interquartile ranges. Nonparametric Mann–Whitney U-test was used for two-group comparisons, and nonparametric Kruskal–Wallis’s test followed by the Dunn’s multiple comparison test were employed. All p-values were two-tailed, and p < 0.05 was considered statistically significant. The correlation between variables was assessed using the Spearman correlation coefficient. Hierarchical clustering analysis and heatmap visualization of rank-transformed relative gene expression were performed with ClustVis 2.0 using correlation distance and average linkage (https://biit.cs.ut.ee/clustvis, accessed on 25 June 2023) [100].

5. Conclusions

During the analysis of gene expression in the lung tissue of TB patients, we observed that despite similar morphological characteristic of high inflammation activity, the genetic profile of the samples differed. This study provides novel evidence that high inflammation activity can arise from various factors. This can be either the development of a pathological process caused by high levels of IL6 and STAT3, or a high level of TNFa and, possibly, infiltration of the affected area with CD163-positive macrophages. We identified a gene expression signature characterized by increased expression of HIF1a, TGM2, IL6, SOCS3, and STAT3 genes, which not only associated with high inflammation activity but also correlated with ABCB1 expression. Consequently, we propose that elevated ABCB1 expression in lung tissue of TB patients is potentially mediated through the activation of the STAT3 signaling pathway. Another gene expression signature associated with high inflammatory activity was marked by elevated levels of TNFa and CD163. Moving forward, these identified signatures may improve our understanding of immunopathology regarding TB and potentially be useful in the development of an HDT approach to improving the effectiveness of anti-TB treatment and preventing lung tissue damage mediated by high inflammation activity.

Author Contributions

Conceptualization, E.N.P. and M.V.E.; methodology, E.N.P., E.Y.R. and M.V.E.; software, E.N.P. and E.E.V.; validation, M.V.E., L.N.L. and R.V.T.; formal analysis, E.N.P., L.N.L. and K.A.S.; investigation, E.N.P., E.Y.R., L.N.L. and R.V.T.; resources, A.E.E. and M.V.E.; data curation, M.V.E. and E.N.P.; writing—original draft preparation, E.N.P. and M.V.E.; writing—review and editing, K.A.S., A.G.M., E.Y.R., L.N.L., E.E.V. and R.V.T.; visualization, E.N.P. and A.G.M.; supervision, A.E.E.; funding acquisition, M.V.E. All authors have read and agreed to the published version of the manuscript.

Funding

This research was funded by Russian Foundation for Basic Research, grant number 20-34-90161.

Institutional Review Board Statement

All procedures involving patients were approved by Central Tuberculosis Research Institute Ethics Committee (protocol #1, 15 January 2017 and protocol #1, 18 January 2021) and conducted in accordance with the principles expressed in the Helsinki Declaration. Written informed consent was obtained from each patient participating in this study. Identifying private information is omitted from the manuscript thus the patients cannot be identified from any material in the manuscript.

Informed Consent Statement

Informed consent was obtained from all subjects involved in the study.

Data Availability Statement

Data available on request.

Conflicts of Interest

The authors declare no conflict of interest.

Abbreviations

BCRP—breast cancer resistance protein, CD—cluster of differentiation, HDT—host-directed therapy, HIF—hypoxia-inducible factor, IL—interleukin, INFg—interferon gamma, M.tbMycobacterium tuberculosis, MRP1—multidrug resistance protein, PFA—perifocal area, P-gp—P-glycoprotein, SOCS—suppressor of cytokine signaling, STAT—Signal Transducers and Activators of Transcription, TB—tuberculosis, TGFb1—transforming growth factor-beta 1, TGM2—transglutaminase type 2, TNFa—tumor necrosis factor-alpha.

References

  1. Global Tuberculosis Report. Available online: https://www.who.int/teams/global-tuberculosis-programme/tb-reports/global-tuberculosis-report-2022 (accessed on 25 June 2023).
  2. Dean, A.S.; Auguet, O.T.; Glaziou, P.; Zignol, M.; Ismail, N.; Kasaeva, T.; Floyd, K. 25 Years of Surveillance of Drug-Resistant Tuberculosis: Achievements, Challenges, and Way Forward. Lancet Infect. Dis. 2022, 22, e191–e196. [Google Scholar] [CrossRef]
  3. Andres, S.; Merker, M.; Heyckendorf, J.; Kalsdorf, B.; Rumetshofer, R.; Indra, A.; Hofmann-Thiel, S.; Hoffmann, H.; Lange, C.; Niemann, S.; et al. Bedaquiline-Resistant Tuberculosis: Dark Clouds on the Horizon. Am. J. Respir. Crit. Care Med. 2020, 201, 1564–1568. [Google Scholar] [CrossRef] [PubMed]
  4. Ismail, N.A.; Omar, S.V.; Moultrie, H.; Bhyat, Z.; Conradie, F.; Enwerem, M.; Ferreira, H.; Hughes, J.; Joseph, L.; Kock, Y.; et al. Assessment of Epidemiological and Genetic Characteristics and Clinical Outcomes of Resistance to Bedaquiline in Patients Treated for Rifampicin-Resistant Tuberculosis: A Cross-Sectional and Longitudinal Study. Lancet Infect. Dis. 2022, 22, 496–506. [Google Scholar] [CrossRef] [PubMed]
  5. Tobin, D.M. Host-Directed Therapies for Tuberculosis. Cold Spring Harb. Perspect. Med. 2015, 5, a021196. [Google Scholar] [CrossRef] [PubMed]
  6. Kolloli, A.; Subbian, S. Host-Directed Therapeutic Strategies for Tuberculosis. Front. Med. 2017, 4, 171. [Google Scholar] [CrossRef]
  7. Ahmed, S.; Raqib, R.; Guðmundsson, G.H.; Bergman, P.; Agerberth, B.; Rekha, R.S. Host-Directed Therapy as a Novel Treatment Strategy to Overcome Tuberculosis: Targeting Immune Modulation. Antibiotics 2020, 9, 21. [Google Scholar] [CrossRef]
  8. Tiwari, D.; Martineau, A.R. Inflammation-Mediated Tissue Damage in Pulmonary Tuberculosis and Host-Directed Therapeutic Strategies. Semin. Immunol. 2023, 65, 101672. [Google Scholar] [CrossRef]
  9. Young, C.; Walzl, G.; du Plessis, N. Therapeutic Host-Directed Strategies to Improve Outcome in Tuberculosis. Mucosal Immunol. 2020, 13, 190–204. [Google Scholar] [CrossRef]
  10. Wallis, R.S.; Ginindza, S.; Beattie, T.; Arjun, N.; Likoti, M.; Sebe, M.; Edward, V.A.; Rassool, M.; Ahmed, K.; Fielding, K.; et al. Lung and Blood Early Biomarkers for Host-Directed Tuberculosis Therapies: Secondary Outcome Measures from a Randomized Controlled Trial. PLoS ONE 2022, 17, e0252097. [Google Scholar] [CrossRef]
  11. Te Brake, L.H.M.; de Knegt, G.J.; de Steenwinkel, J.E.; van Dam, T.J.P.; Burger, D.M.; Russel, F.G.M.; van Crevel, R.; Koenderink, J.B.; Aarnoutse, R.E. The Role of Efflux Pumps in Tuberculosis Treatment and Their Promise as a Target in Drug Development: Unraveling the Black Box. Annu. Rev. Pharmacol. Toxicol. 2018, 58, 271–291. [Google Scholar] [CrossRef]
  12. Juliano, R.L.; Ling, V. A Surface Glycoprotein Modulating Drug Permeability in Chinese Hamster Ovary Cell Mutants. Biochim. Biophys. Acta 1976, 455, 152–162. [Google Scholar] [CrossRef] [PubMed]
  13. P-Glycoprotein Substrates|DrugBank Online. Available online: https://go.drugbank.com/categories/DBCAT002668 (accessed on 25 June 2023).
  14. Seelig, A. P-Glycoprotein: One Mechanism, Many Tasks and the Consequences for Pharmacotherapy of Cancers. Front. Oncol. 2020, 10, 576559. [Google Scholar] [CrossRef] [PubMed]
  15. Campbell, L.; Abulrob, A.-N.G.; Kandalaft, L.E.; Plummer, S.; Hollins, A.J.; Gibbs, A.; Gumbleton, M. Constitutive Expression of P-Glycoprotein in Normal Lung Alveolar Epithelium and Functionality in Primary Alveolar Epithelial Cultures. J. Pharmacol. Exp. Ther. 2003, 304, 441–452. [Google Scholar] [CrossRef] [PubMed]
  16. Bossennec, M.; di Roio, A.; Caux, C.; Ménétrier-Caux, C. MDR1 in Immunity: Friend or Foe? Oncoimmunology 2018, 7, e1499388. [Google Scholar] [CrossRef] [PubMed]
  17. Kooij, G.; Backer, R.; Koning, J.J.; Reijerkerk, A.; van Horssen, J.; van der Pol, S.M.A.; Drexhage, J.; Schinkel, A.; Dijkstra, C.D.; den Haan, J.M.M.; et al. P-Glycoprotein Acts as an Immunomodulator during Neuroinflammation. PLoS ONE 2009, 4, e8212. [Google Scholar] [CrossRef]
  18. van der Deen, M.; Timens, W.; Timmer-Bosscha, H.; van der Strate, B.W.; Scheper, R.J.; Postma, D.S.; de Vries, E.G.; Kerstjens, H.A. Reduced Inflammatory Response in Cigarette Smoke Exposed Mrp1/Mdr1a/1b Deficient Mice. Respir. Res. 2007, 8, 49. [Google Scholar] [CrossRef]
  19. Hartkoorn, R.C.; Chandler, B.; Owen, A.; Ward, S.A.; Bertel Squire, S.; Back, D.J.; Khoo, S.H. Differential Drug Susceptibility of Intracellular and Extracellular Tuberculosis, and the Impact of P-Glycoprotein. Tuberculosis 2007, 87, 248–255. [Google Scholar] [CrossRef]
  20. Gollapudi, S.; Reddy, M.; Gangadharam, P.; Tsuruo, T.; Gupta, S. Mycobacterium Tuberculosis Induces Expression of P-Glycoprotein in Promonocytic U1 Cells Chronically Infected with HIV Type 1. Biochem. Biophys. Res. Commun. 1994, 199, 1181–1187. [Google Scholar] [CrossRef]
  21. Ding, Z.; Yang, L.; Xie, X.; Xie, F.; Pan, F.; Li, J.; He, J.; Liang, H. Expression and Significance of Hypoxia-Inducible Factor-1 Alpha and MDR1/P-Glycoprotein in Human Colon Carcinoma Tissue and Cells. J. Cancer Res. Clin. Oncol. 2010, 136, 1697–1707. [Google Scholar] [CrossRef]
  22. Xie, A.; Robles, R.J.; Mukherjee, S.; Zhang, H.; Feldbrügge, L.; Csizmadia, E.; Wu, Y.; Enjyoji, K.; Moss, A.C.; Otterbein, L.E.; et al. HIF-1α-Induced Xenobiotic Transporters Promote Th17 Responses in Crohn’s Disease. J. Autoimmun. 2018, 94, 122–133. [Google Scholar] [CrossRef]
  23. Ho, E.A.; Piquette-Miller, M. Regulation of Multidrug Resistance by Pro-Inflammatory Cytokines. Curr. Cancer Drug Targets 2006, 6, 295–311. [Google Scholar] [CrossRef]
  24. Liptrott, N.J.; Penny, M.; Bray, P.G.; Sathish, J.; Khoo, S.H.; Back, D.J.; Owen, A. The Impact of Cytokines on the Expression of Drug Transporters, Cytochrome P450 Enzymes and Chemokine Receptors in Human PBMC. Br. J. Pharmacol. 2009, 156, 497–508. [Google Scholar] [CrossRef]
  25. Bhagyaraj, E.; Tiwari, D.; Ahuja, N.; Nanduri, R.; Saini, A.; Kalra, R.; Kumar, S.; Janmeja, A.K.; Gupta, P. A Human Xenobiotic Nuclear Receptor Contributes to Nonresponsiveness of Mycobacterium Tuberculosis to the Antituberculosis Drug Rifampicin. J. Biol. Chem. 2018, 293, 3747–3757. [Google Scholar] [CrossRef] [PubMed]
  26. Pavlova, E.N.; Erokhina, M.V.; Rybalkina, E.Y.; Potashnikova, D.M.; Masyutin, A.G.; Lepekha, L.N.; Ergeshov, A.E. The Effect of Rifampicin on the Induction of MDR1/P-gp Activity in Proinflammatory Human Macrophages. Antibiot. Chemother. 2022, 67, 16–22. [Google Scholar] [CrossRef]
  27. Kholodok, O.A.; Grigorenko, A.A.; Cheryemkin, M.I. Pulmonary tuberculoma as a form of tuberculous process. Bull. Physiol. Pathol. Respir. 2014, 53, 126–131. [Google Scholar]
  28. Giller, D.B.; Giller, B.D.; Giller, G.V.; Shcherbakova, G.V.; Bizhanov, A.B.; Enilenis, I.I.; Glotov, A.A. Treatment of Pulmonary Tuberculosis: Past and Present. Eur. J. Cardiothorac. Surg. 2018, 53, 967–972. [Google Scholar] [CrossRef] [PubMed]
  29. Krasnikova, E.; Lepeha, L.; Tarasov, R.; Erokhina, M.; Aliev, V.; Sadovnikova, S.; Bagirov, M. Indicaions to Surgery for Lung Tuberculomas Today. In Proceedings of the Tuberculosis, European Respiratory Society, Madrid, Spain, 28 September 2019; p. PA2960. [Google Scholar]
  30. Rottenberg, M.E.; Carow, B. SOCS3 and STAT3, Major Controllers of the Outcome of Infection with Mycobacterium Tuberculosis. Semin. Immunol. 2014, 26, 518–532. [Google Scholar] [CrossRef]
  31. Yi, X.; Zhang, B.; Fu, Y.; Yi, Z. STAT1 and Its Related Molecules as Potential Biomarkers in Mycobacterium Tuberculosis Infection. J. Cell. Mol. Med. 2020, 24, 2866–2878. [Google Scholar] [CrossRef]
  32. Cronan, M.R.; Hughes, E.J.; Brewer, W.J.; Viswanathan, G.; Hunt, E.G.; Singh, B.; Mehra, S.; Oehlers, S.H.; Gregory, S.G.; Kaushal, D.; et al. A Non-Canonical Type 2 Immune Response Coordinates Tuberculous Granuloma Formation and Epithelialization. Cell 2021, 184, 1757–1774.e14. [Google Scholar] [CrossRef]
  33. Akter, S.; Chauhan, K.S.; Dunlap, M.D.; Choreño-Parra, J.A.; Lu, L.; Esaulova, E.; Zúñiga, J.; Artyomov, M.N.; Kaushal, D.; Khader, S.A. Mycobacterium Tuberculosis Infection Drives a Type I IFN Signature in Lung Lymphocytes. Cell Rep. 2022, 39, 110983. [Google Scholar] [CrossRef]
  34. Lungu, P.; Mushota, K.; Njelesani, E.; Sukwa, T.; Lakhi, S.; Mwaba, P. Expression of mycobacterium tuberculosis induced SOCS3 and STAT3 and the implications on innate immunity in TB patients vs healthy contacts in high TB/HIV endemic setting: A cross-sectional analytical study. PLoS ONE 2022, 17, e0263624. [Google Scholar] [CrossRef]
  35. Braverman, J.; Sogi, K.M.; Benjamin, D.; Nomura, D.K.; Stanley, S.A. HIF-1α Is an Essential Mediator of IFN-γ-Dependent Immunity to Mycobacterium Tuberculosis. J. Immunol. 2016, 197, 1287–1297. [Google Scholar] [CrossRef]
  36. Belton, M.; Brilha, S.; Manavaki, R.; Mauri, F.; Nijran, K.; Hong, Y.T.; Patel, N.H.; Dembek, M.; Tezera, L.; Green, J.; et al. Hypoxia and Tissue Destruction in Pulmonary TB. Thorax 2016, 71, 1145–1153. [Google Scholar] [CrossRef]
  37. McGettrick, A.F.; O’Neill, L.A.J. The Role of HIF in Immunity and Inflammation. Cell Metab. 2020, 32, 524–536. [Google Scholar] [CrossRef] [PubMed]
  38. Silva Miranda, M.; Breiman, A.; Allain, S.; Deknuydt, F.; Altare, F. The Tuberculous Granuloma: An Unsuccessful Host Defence Mechanism Providing a Safety Shelter for the Bacteria? Clin. Dev. Immunol. 2012, 2012, 139127. [Google Scholar] [CrossRef]
  39. Domingo-Gonzalez, R.; Prince, O.; Cooper, A.; Khader, S.A. Cytokines and Chemokines in Mycobacterium Tuberculosis Infection. Microbiol. Spectr. 2016, 4. [Google Scholar] [CrossRef]
  40. Flynn, J.; Chan, J.; Lin, P. Macrophages and Control of Granulomatous Inflammation in Tuberculosis. Mucosal Immunol. 2011, 4, 271–278. [Google Scholar] [CrossRef] [PubMed]
  41. Marino, S.; Cilfone, N.A.; Mattila, J.T.; Linderman, J.J.; Flynn, J.L.; Kirschner, D.E. Macrophage Polarization Drives Granuloma Outcome during Mycobacterium Tuberculosis Infection. Infect. Immun. 2015, 83, 324–338. [Google Scholar] [CrossRef] [PubMed]
  42. Cho, H.J.; Lim, Y.-J.; Kim, J.; Koh, W.-J.; Song, C.-H.; Kang, M.-W. Different Macrophage Polarization between Drug-Susceptible and Multidrug-Resistant Pulmonary Tuberculosis. BMC Infect. Dis. 2020, 20, 81. [Google Scholar] [CrossRef]
  43. Cory, T.J.; He, H.; Winchester, L.C.; Kumar, S.; Fletcher, C.V. Alterations in P-Glycoprotein Expression and Function Between Macrophage Subsets. Pharm. Res. 2016, 33, 2713–2721. [Google Scholar] [CrossRef]
  44. Immune Cell—ABCB1—The Human Protein Atlas. Available online: https://www.proteinatlas.org/ENSG00000085563-ABCB1/immune+cell (accessed on 25 June 2023).
  45. Martinez, F.O.; Gordon, S. The M1 and M2 Paradigm of Macrophage Activation: Time for Reassessment. F1000Prime Rep. 2014, 6, 13. [Google Scholar] [CrossRef]
  46. Cho, S.-Y.; Oh, Y.; Jeong, E.M.; Park, S.; Lee, D.; Wang, X.; Zeng, Q.; Qin, H.; Hu, F.; Gong, H.; et al. Amplification of Transglutaminase 2 Enhances Tumor-Promoting Inflammation in Gastric Cancers. Exp. Mol. Med. 2020, 52, 854–864. [Google Scholar] [CrossRef] [PubMed]
  47. Agnihotri, N.; Kumar, S.; Mehta, K. Tissue Transglutaminase as a Central Mediator in Inflammation-Induced Progression of Breast Cancer. Breast Cancer Res. 2013, 15, 202. [Google Scholar] [CrossRef] [PubMed]
  48. Choi, C.-M.; Jang, S.-J.; Park, S.-Y.; Choi, Y.-B.; Jeong, J.-H.; Kim, D.-S.; Kim, H.-K.; Park, K.-S.; Nam, B.-H.; Kim, H.-R.; et al. Transglutaminase 2 as an Independent Prognostic Marker for Survival of Patients with Non-Adenocarcinoma Subtype of Non-Small Cell Lung Cancer. Mol. Cancer 2011, 10, 119. [Google Scholar] [CrossRef]
  49. Palucci, I.; Matic, I.; Falasca, L.; Minerva, M.; Maulucci, G.; de Spirito, M.; Petruccioli, E.; Goletti, D.; Rossin, F.; Piacentini, M.; et al. Transglutaminase Type 2 Plays a Key Role in the Pathogenesis of Mycobacterium Tuberculosis Infection. J. Intern. Med. 2018, 283, 303–313. [Google Scholar] [CrossRef] [PubMed]
  50. Nwabufo, C.K.; Hoque, M.T.; Yip, L.; Khara, M.; Mubareka, S.; Pollanen, M.S.; Bendayan, R. SARS-CoV-2 Infection Dysregulates the Expression of Clinically Relevant Drug Metabolizing Enzymes in Vero E6 Cells and Membrane Transporters in Human Lung Tissues. Front. Pharmacol. 2023, 14, 1124693. [Google Scholar] [CrossRef]
  51. Rodríguez-Castillo, J.A.; Arce-Mendoza, A.Y.; Quintanilla-Siller, A.; Rendon, A.; Salinas-Carmona, M.C.; Rosas-Taraco, A.G. Possible Association of Rare Polymorphism in the ABCB1 Gene with Rifampin and Ethambutol Drug-Resistant Tuberculosis. Tuberculosis 2015, 95, 532–537. [Google Scholar] [CrossRef]
  52. Pontual, Y.; Pacheco, V.S.S.; Monteiro, S.P.; Quintana, M.S.B.; Costa, M.J.M.; Rolla, V.C.; de Castro, L. ABCB1 Gene Polymorphism Associated with Clinical Factors Can Predict Drug-Resistant Tuberculosis. Clin. Sci. 2017, 131, 1831–1840. [Google Scholar] [CrossRef]
  53. Zhang, X.; Xiao, W.; Wang, L.; Tian, Z.; Zhang, J. Deactivation of Signal Transducer and Activator of Transcription 3 Reverses Chemotherapeutics Resistance of Leukemia Cells via Down-Regulating P-Gp. PLoS ONE 2011, 6, e20965. [Google Scholar] [CrossRef]
  54. Chen, Q.; Bian, Y.; Zeng, S. Involvement of AP-1 and NF-κB in the Up-Regulation of P-Gp in Vinblastine Resistant Caco-2 Cells. Drug Metab. Pharmacokinet. 2014, 29, 223–226. [Google Scholar] [CrossRef]
  55. Liu, J.; Zhou, F.; Chen, Q.; Kang, A.; Lu, M.; Liu, W.; Zang, X.; Wang, G.; Zhang, J. Chronic Inflammation Up-Regulates P-Gp in Peripheral Mononuclear Blood Cells via the STAT3/Nf-Κb Pathway in 2,4,6-Trinitrobenzene Sulfonic Acid-Induced Colitis Mice. Sci. Rep. 2015, 5, 13558. [Google Scholar] [CrossRef] [PubMed]
  56. Comerford, K.M.; Wallace, T.J.; Karhausen, J.; Louis, N.A.; Montalto, M.C.; Colgan, S.P. Hypoxia-Inducible Factor-1-Dependent Regulation of the Multidrug Resistance (MDR1) Gene. Cancer Res. 2002, 62, 3387–3394. [Google Scholar] [PubMed]
  57. Subbian, S.; Tsenova, L.; Kim, M.-J.; Wainwright, H.C.; Visser, A.; Bandyopadhyay, N.; Bader, J.S.; Karakousis, P.C.; Murrmann, G.B.; Bekker, L.-G.; et al. Lesion-Specific Immune Response in Granulomas of Patients with Pulmonary Tuberculosis: A Pilot Study. PLoS ONE 2015, 10, e0132249. [Google Scholar] [CrossRef] [PubMed]
  58. Abengozar-Muela, M.; Esparza, M.V.; Garcia-Ros, D.; Vásquez, C.E.; Echeveste, J.I.; Idoate, M.A.; Lozano, M.D.; Melero, I.; de Andrea, C.E. Diverse Immune Environments in Human Lung Tuberculosis Granulomas Assessed by Quantitative Multiplexed Immunofluorescence. Mod. Pathol. 2020, 33, 2507–2519. [Google Scholar] [CrossRef]
  59. McCaffrey, E.F.; Donato, M.; Keren, L.; Chen, Z.; Delmastro, A.; Fitzpatrick, M.B.; Gupta, S.; Greenwald, N.F.; Baranski, A.; Graf, W.; et al. The Immunoregulatory Landscape of Human Tuberculosis Granulomas. Nat. Immunol. 2022, 23, 318–329. [Google Scholar] [CrossRef]
  60. Sawyer, A.J.; Patrick, E.; Edwards, J.; Wilmott, J.S.; Fielder, T.; Yang, Q.; Barber, D.L.; Ernst, J.D.; Britton, W.J.; Palendira, U.; et al. Spatial Mapping Reveals Granuloma Diversity and Histopathological Superstructure in Human Tuberculosis. J. Exp. Med. 2023, 220, e20221392. [Google Scholar] [CrossRef]
  61. Lenaerts, A.; Barry, C.E.; Dartois, V. Heterogeneity in Tuberculosis Pathology, Microenvironments and Therapeutic Responses. Immunol. Rev. 2015, 264, 288–307. [Google Scholar] [CrossRef]
  62. Hunter, R.L. The Pathogenesis of Tuberculosis–The Koch Phenomenon Reinstated. Pathogens 2020, 9, 813. [Google Scholar] [CrossRef]
  63. Erokhina, M.V.; Lepekha, L.N.; Voronezhskaya, E.E.; Nezlin, L.P.; Avdienko, V.G.; Ergeshov, A.E. Application of Laser Scanning Confocal Microscopy for the Visualization of M. Tuberculosis in Lung Tissue Samples with Weak Ziehl–Neelsen Staining. J. Clin. Med. 2019, 8, 1185. [Google Scholar] [CrossRef]
  64. Suzuki, Y.; Shirai, M.; Asada, K.; Miwa, S.; Karayama, M.; Nakamura, Y.; Inui, N.; Shirai, T.; Hayakawa, H.; Baba, S.; et al. Utility of Macrophage-Activated Marker CD163 for Diagnosis and Prognosis in Pulmonary Tuberculosis. Ann. Am. Thorac. Soc. 2017, 14, 57–64. [Google Scholar] [CrossRef]
  65. Suzuki, Y.; Shirai, M.; Asada, K.; Yasui, H.; Karayama, M.; Hozumi, H.; Furuhashi, K.; Enomoto, N.; Fujisawa, T.; Nakamura, Y.; et al. Macrophage Mannose Receptor, CD206, Predict Prognosis in Patients with Pulmonary Tuberculosis. Sci. Rep. 2018, 8, 13129. [Google Scholar] [CrossRef]
  66. Liu, Q.; Ou, Q.; Chen, H.; Gao, Y.; Liu, L.; Xu, Y.; Ruan, Q.; Zhang, W.; Zhang, L. Differential Expression and Predictive Value of Monocyte Scavenger Receptor CD163 in Populations with Different Tuberculosis Infection Statuses. BMC Infect. Dis. 2019, 19, 1006. [Google Scholar] [CrossRef]
  67. Chowdhury, I.H.; Ahmed, A.M.; Choudhuri, S.; Sen, A.; Hazra, A.; Pal, N.K.; Bhattacharya, B.; Bahar, B. Alteration of Serum Inflammatory Cytokines in Active Pulmonary Tuberculosis Following Anti-Tuberculosis Drug Therapy. Mol. Immunol. 2014, 62, 159–168. [Google Scholar] [CrossRef] [PubMed]
  68. Fiorenza, G.; Rateni, L.; Farroni, M.A.; Bogué, C.; Dlugovitzky, D.G. TNF-α, TGF-β and NO Relationship in Sera from Tuberculosis (TB) Patients of Different Severity. Immunol. Lett. 2005, 98, 45–48. [Google Scholar] [CrossRef] [PubMed]
  69. Kumar, N.P.; Moideen, K.; Banurekha, V.V.; Nair, D.; Babu, S. Plasma Proinflammatory Cytokines Are Markers of Disease Severity and Bacterial Burden in Pulmonary Tuberculosis. Open Forum Infect. Dis. 2019, 6, ofz257. [Google Scholar] [CrossRef] [PubMed]
  70. De Andrade Júnior, D.R.; dos Santos, S.A.; de Castro, I.; de Andrade, D.R. Correlation between Serum Tumor Necrosis Factor Alpha Levels and Clinical Severity of Tuberculosis. Braz. J. Infect. Dis. 2008, 12, 226–233. [Google Scholar] [CrossRef] [PubMed]
  71. Beig, T.Y.; Khan, U.H.; Ganie, B.A.; Tahir, S.; Shah, S.; Dhobi, G.N. Correlation Between Serum Tumor Necrosis Factor-Alpha (TNF-α) and Clinical Severity of Tuberculosis: A Hospital-Based Study. Cureus 2023, 15, e35626. [Google Scholar] [CrossRef]
  72. Ghanavi, J.; Farnia, P.; Farnia, P.; Velayati, A.A. The Role of Interferon-Gamma and Interferon-Gamma Receptor in Tuberculosis and Nontuberculous Mycobacterial Infections. Int. J. Mycobacteriology 2021, 10, 349. [Google Scholar] [CrossRef]
  73. Dorhoi, A.; Kaufmann, S.H.E. Tumor Necrosis Factor Alpha in Mycobacterial Infection. Semin. Immunol. 2014, 26, 203–209. [Google Scholar] [CrossRef]
  74. van Loo, G.; Bertrand, M.J.M. Death by TNF: A Road to Inflammation. Nat. Rev. Immunol. 2023, 23, 289–303. [Google Scholar] [CrossRef]
  75. Tang, S.; Cui, H.; Yao, L.; Hao, X.; Shen, Y.; Fan, L.; Sun, H.; Zhang, Z.; Huang, J.A. Increased Cytokines Response in Patients with Tuberculosis Complicated with Chronic Obstructive Pulmonary Disease. PLoS ONE 2013, 8, e62385. [Google Scholar] [CrossRef] [PubMed]
  76. Guzmán-Beltrán, S.; Carreto-Binaghi, L.E.; Carranza, C.; Torres, M.; Gonzalez, Y.; Muñoz-Torrico, M.; Juárez, E. Oxidative Stress and Inflammatory Mediators in Exhaled Breath Condensate of Patients with Pulmonary Tuberculosis. A Pilot Study with a Biomarker Perspective. Antioxidants 2021, 10, 1572. [Google Scholar] [CrossRef]
  77. Heinrich, P.C.; Behrmann, I.; Haan, S.; Hermanns, H.M.; Müller-Newen, G.; Schaper, F. Principles of Interleukin (IL)-6-Type Cytokine Signalling and Its Regulation. Biochem. J. 2003, 374, 1–20. [Google Scholar] [CrossRef]
  78. Boni, F.G.; Hamdi, I.; Koundi, L.M.; Shrestha, K.; Xie, J. Cytokine Storm in Tuberculosis and IL-6 Involvement. Infect. Genet. Evol. 2022, 97, 105166. [Google Scholar] [CrossRef] [PubMed]
  79. Wang, F.; Huang, G.; Shen, L.; Peng, Y.; Sha, W.; Chen, Z.W.; Shen, H. Genetics and Functional Mechanisms of STAT3 Polymorphisms in Human Tuberculosis. Front. Cell. Infect. Microbiol. 2021, 11, 669394. [Google Scholar] [CrossRef]
  80. Zhong, Z.; Wen, Z.; Darnell, J.E. Stat3: A STAT Family Member Activated by Tyrosine Phosphorylation in Response to Epidermal Growth Factor and Interleukin-6. Science 1994, 264, 95–98. [Google Scholar] [CrossRef]
  81. Yang, J.; Liao, X.; Agarwal, M.K.; Barnes, L.; Auron, P.E.; Stark, G.R. Unphosphorylated STAT3 Accumulates in Response to IL-6 and Activates Transcription by Binding to NFkappaB. Genes Dev. 2007, 21, 1396–1408. [Google Scholar] [CrossRef] [PubMed]
  82. Gao, Y.; Zhao, H.; Wang, P.; Wang, J.; Zou, L. The Roles of SOCS3 and STAT3 in Bacterial Infection and Inflammatory Diseases. Scand. J. Immunol. 2018, 88, e12727. [Google Scholar] [CrossRef] [PubMed]
  83. Adankwah, E.; Seyfarth, J.; Phillips, R.; Jacobsen, M. Aberrant Cytokine Milieu and Signaling Affect Immune Cell Phenotypes and Functions in Tuberculosis Pathology: What Can We Learn from This Phenomenon for Application to Inflammatory Syndromes? Cell. Mol. Immunol. 2021, 18, 2062–2064. [Google Scholar] [CrossRef] [PubMed]
  84. Harling, K.; Adankwah, E.; Güler, A.; Afum-Adjei Awuah, A.; Adu-Amoah, L.; Mayatepek, E.; Owusu-Dabo, E.; Nausch, N.; Jacobsen, M. Constitutive STAT3 Phosphorylation and IL-6/IL-10 Co-Expression Are Associated with Impaired T-Cell Function in Tuberculosis Patients. Cell. Mol. Immunol. 2019, 16, 275–287. [Google Scholar] [CrossRef]
  85. Piacentini, M.; D’Eletto, M.; Farrace, M.G.; Rodolfo, C.; del Nonno, F.; Ippolito, G.; Falasca, L. Characterization of Distinct Sub-Cellular Location of Transglutaminase Type II: Changes in Intracellular Distribution in Physiological and Pathological States. Cell Tissue Res. 2014, 358, 793–805. [Google Scholar] [CrossRef] [PubMed]
  86. Wang, Y.; Zheng, N.; Sun, T.; Zhao, H.; Chen, Y.; Liu, C. Role of TGM2 in T-cell Lymphoblastic Lymphoma via Regulation of IL-6/JAK/STAT3 Signalling. Mol. Med. Rep. 2022, 25, 76. [Google Scholar] [CrossRef] [PubMed]
  87. Palucci, I.; Maulucci, G.; de Maio, F.; Sali, M.; Romagnoli, A.; Petrone, L.; Fimia, G.M.; Sanguinetti, M.; Goletti, D.; de Spirito, M.; et al. Inhibition of Transglutaminase 2 as a Potential Host-Directed Therapy Against Mycobacterium Tuberculosis. Front. Immunol. 2019, 10, 3042. [Google Scholar] [CrossRef]
  88. Kumar, S.; Mehta, K. Tissue Transglutaminase Constitutively Activates HIF-1α Promoter and Nuclear Factor-κB via a Non-Canonical Pathway. PLoS ONE 2012, 7, e49321. [Google Scholar] [CrossRef]
  89. O’Donnell, J.L.; Joyce, M.R.; Shannon, A.M.; Harmey, J.; Geraghty, J.; Bouchier-Hayes, D. Oncological Implications of Hypoxia Inducible Factor-1alpha (HIF-1alpha) Expression. Cancer Treat. Rev. 2006, 32, 407–416. [Google Scholar] [CrossRef] [PubMed]
  90. Xu, Q.; Briggs, J.; Park, S.; Niu, G.; Kortylewski, M.; Zhang, S.; Gritsko, T.; Turkson, J.; Kay, H.; Semenza, G.L.; et al. Targeting Stat3 Blocks Both HIF-1 and VEGF Expression Induced by Multiple Oncogenic Growth Signaling Pathways. Oncogene 2005, 24, 5552–5560. [Google Scholar] [CrossRef] [PubMed]
  91. Liu, R.; Muliadi, V.; Mou, W.; Li, H.; Yuan, J.; Holmberg, J.; Chambers, B.J.; Ullah, N.; Wurth, J.; Alzrigat, M.; et al. HIF-1 Stabilization in T Cells Hampers the Control of Mycobacterium Tuberculosis Infection. Nat. Commun. 2022, 13, 5093. [Google Scholar] [CrossRef]
  92. Bandarra, D.; Biddlestone, J.; Mudie, S.; Müller, H.-A.J.; Rocha, S. HIF-1α Restricts NF-κB-Dependent Gene Expression to Control Innate Immunity Signals. Dis. Models Mech. 2015, 8, 169–181. [Google Scholar] [CrossRef]
  93. Suresh, M.V.; Balijepalli, S.; Solanki, S.; Aktay, S.; Choudhary, K.; Shah, Y.M.; Raghavendran, K. Hypoxia-Inducible Factor 1α and Its Role in Lung Injury: Adaptive or Maladaptive. Inflammation 2023, 46, 491–508. [Google Scholar] [CrossRef]
  94. Nocera, A.L.; Meurer, A.T.; Miyake, M.M.; Sadow, P.M.; Han, X.; Bleier, B.S. Secreted P-Glycoprotein Is a Noninvasive Biomarker of Chronic Rhinosinusitis. Laryngoscope 2017, 127, E1–E4. [Google Scholar] [CrossRef]
  95. Perez-Guerrero, E.E.; Gonzalez-Lopez, L.; Muñoz-Valle, J.F.; Vasquez-Jimenez, J.C.; Ramirez-Villafaña, M.; Sanchez-Rodriguez, E.N.; Gutierrez-Ureña, S.R.; Cerpa-Cruz, S.; Aguilar-Chavez, E.A.; Cardona-Muñoz, E.G.; et al. Serum P-Glycoprotein Level: A Potential Biomarker of DMARD Failure in Patients with Rheumatoid Arthritis. Inflammopharmacology 2018. [Google Scholar] [CrossRef] [PubMed]
  96. Perez-Guerrero, E.E.; Gamez-Nava, J.I.; Muñoz-Valle, J.F.; Cardona-Muñoz, E.G.; Bonilla-Lara, D.; Fajardo-Robledo, N.S.; Nava-Zavala, A.H.; Garcia-Cobian, T.A.; Rincón-Sánchez, A.R.; Murillo-Vazquez, J.D.; et al. Serum Levels of P-Glycoprotein and Persistence of Disease Activity despite Treatment in Patients with Systemic Lupus Erythematosus. Clin. Exp. Med. 2018, 18, 109–117. [Google Scholar] [CrossRef] [PubMed]
  97. Ponnusamy, N.; Arumugam, M. Meta-Analysis of Active Tuberculosis Gene Expression Ascertains Host Directed Drug Targets. Front. Cell. Infect. Microbiol. 2022, 12, 1010771. [Google Scholar] [CrossRef] [PubMed]
  98. Burel, J.G.; Lindestam Arlehamn, C.S.; Khan, N.; Seumois, G.; Greenbaum, J.A.; Taplitz, R.; Gilman, R.H.; Saito, M.; Vijayanand, P.; Sette, A.; et al. Transcriptomic Analysis of CD4+ T Cells Reveals Novel Immune Signatures of Latent Tuberculosis. J. Immunol. 2018, 200, 3283–3290. [Google Scholar] [CrossRef]
  99. Perelman, M.I. (Ed.) Phthisiology. National Guidelines; GEOTAR-Media: Moscow, Russia, 2007; pp. 288–295. (In Russian) [Google Scholar]
  100. Metsalu, T.; Vilo, J. ClustVis: A Web Tool for Visualizing Clustering of Multivariate Data Using Principal Component Analysis and Heatmap. Nucleic Acids Res. 2015, 43, W566–W570. [Google Scholar] [CrossRef] [PubMed]
Figure 1. Pulmonary tuberculoma with moderate inflammatory activity of TB inflammation. (a)—the granuloma (conglomerate of cells) with compacted necrosis, delimited by a two-layer capsule; green arrows show the boundaries of the capsule; (b)—an enlarged fragment of granuloma with a fibrous layer of the capsule; (c)—a large fragment of the capsule wall, cells are marked with green arrows. CN—caseous necrosis, GL—granulation layer, FL—fibrous layer, LN—lymphonoduli, N—neutrophil, M—macrophage, L—lymphocyte, F—fibroblast, EC—epithelioid cell. Hematoxylin and eosin staining. Scale bars (a) = 500 µm, (b) = 100 µm, (c) = 20 µm.
Ijms 24 14839 g001
Figure 2. Pulmonary tuberculoma with high activity of TB inflammation. (a)—general view of granuloma with signs of decay of caseous necrosis; green arrows show the capsule boundaries; (b)—an enlarged fragment of granuloma with a granulation layer of the capsule and a developing fibrous layer; (c)—dropout centers. CN—caseous necrosis, GL—granulation layer, FL—fibrous layer, LN—lymphonoduli, *—zones of the spread of tuberculosis infection. Hematoxylin and eosin staining. Scale bars (a) = 500 µm, (b,c) = 100 µm.
Ijms 24 14839 g002
Figure 3. Relative level of gene expression of ABC transporter proteins depending on the activity of inflammation (Moderate and High) in the surgical material of patients diagnosed with multiple pulmonary tuberculomas. According to the level of ABCB1 gene expression in the group with high inflammation activity, two subgroups are distinguished: with high expression (figure with red fill) and low expression (green fill). Data are presented as median and interquartile range (25% and 75%). The relative level of gene expression was calculated as 2−ΔCt × 103 and expressed in arbitrary units (a.u.). Statistical analysis was performed using the Mann–Whitney U-test. Significant differences between groups: *—p < 0.05.
Ijms 24 14839 g003
Figure 4. The matrix of significant nonparametric Spearman’s coefficients of correlation (r) between the levels of gene expression. Color of the cells indicates significant differences: p < 0.05—yellow, p < 0.01—green, p < 0.001—dark green. The value of coefficient r = 0.2–0.39 as weak (black italic), 0.40–0.59 as moderate (black bold), 0.6–0.79 (white bold) as strong and 0.8–1 (yellow bold) as very strong correlation.
Ijms 24 14839 g004
Figure 5. Heatmap correlation of co-expression genes in the lung tissue of patients with pulmonary granulomas reveals 3 clusters. Columns are clustered using correlation distance and average linkage. Expression of the ABCB1 gene is ranked in descending order. A three-color scale was used with blue indicating low, white—average, and red representing high relative level of gene expression. This heatmap was performed on rank-transformed relative gene expression using the webtool ClustVis (https://biit.cs.ut.ee/clustvis/, accessed on 25 June 2023).
Ijms 24 14839 g005
Figure 6. Significant differences in the level of expression between pulmonary granulomas with moderate and high inflammation activity. Data are presented as median and interquartile range (25% and 75%). The relative level of gene expression was calculated as 2−ΔCt × 104 and expressed in arbitrary units (a.u.). Statistical analysis was performed using Mann–Whitney U-test. Asterisks indicate significant differences: *, p < 0.05; **, p < 0.01.
Ijms 24 14839 g006
Figure 7. The heatmap demonstrates the heterogeneity of the genetic signature in a group with high inflammation activity. The relative level of ABCB1 gene expression is ranked in descending order in each group with moderate (Moderate) and high (High) inflammatory activity. A three-color scale was used, where blue indicated low, white—medium and red—high relative level of gene expression. This heatmap was performed on rank-transformed relative gene expression using the webtool ClustVis (https://biit.cs.ut.ee/clustvis/, accessed on 25 June 2023).
Ijms 24 14839 g007
Figure 8. Analysis of gene expression in the lung tissue of patients with different activity of TB inflammation in Clusters I–III (AC). Data are presented as median and interquartile range (25% and 75%). The relative level of gene expression was calculated as 2−ΔCt × 104 and expressed in arbitrary units (a.u.). Statistical analysis was performed using Kruskal–Wallis’s test followed by the Dunn’s multiple comparison test. Asterisks in the graphs indicate significant differences: *, p < 0.05; **, p < 0.01; ***, p < 0.001.
Ijms 24 14839 g008
Figure 9. Genetic signatures of gene expression characteristic of each of the subgroups with high inflammation activity in the lung tissue of TB patients. A three-color scale was used with blue indicating low, white—average, and red representing high relative level of gene expression. This heatmap was performed on rank-transformed relative gene expression using the webtool ClustVis (https://biit.cs.ut.ee/clustvis/, accessed on 25 June 2023).
Ijms 24 14839 g009
Figure 10. Interaction network between genes based on their co-expression as retrieved by GeneMANIA. Two genes are linked if their expression levels are similar across conditions in a gene expression study.
Ijms 24 14839 g010
Table 1. Primer pairs used for real-time PCR for surgical material obtained in 2017 and 2018.
GeneForward PrimerReverse PrimerProduct Length, bp
ABCB1GGGATGGTCAGTGTTGATGGAGCTATCGTGGTGGCAAACAATA110
ABCC1GTGAATCGTGGCATCGACATAGCTTGGGACGGAAGGGAATC184
ABCG2TGAGCCTACAACTGGCTTAGACCCTGCTTAGACATCCTTTTCAG75
RPL27ACCGCTACCCCCGCAAAGTGCCCGTCGGGCCTTGCGTTTA198
Table 2. Primer pairs used for real-time PCR for surgical material obtained in 2021 and 2022.
GeneForward PrimerReverse PrimerProduct Length, bp
B2MGGGTTTCATCCATCCGACATTGACACGGCAGGCATACTC161
RPL27ACCGCTACCCCCGCAAAGTGCCCGTCGGGCCTTGCGTTTA198
ABCB1TTGCTGCTTACATTCAGGTTTCAAGCCTATCTCCTGTCGCATTA105
HIF1aCTGAACGTCGAAAAGAAAAGTCAAATCACCAGCATCCAGAAGT190
IL1bTTACAGTGGCAATGAGGATGACTGTAGTGGTGGTCGGAGATTC131
IL6ACTCACCTCTTCAGAACGAATTGCCATCTTTGGAAGGTTCAGGTTG149
IL10CGCTGTCATCGATTTCTTCCCAGAGTCGCCACCCTGATGTC185
TNFaTCAGCAAGGACAGCAGAGGAGTCAGTATGTGAGAGGAAGAGAACC128
INFgTCGGTAACTGACTTGAATGTCCATCGCTTCCCTGTTTTAGCTGC93
TGFb1AACAATTCCTGGCGATACCTCAAAGCCCTCAATTTCCCCTCC125
STAT1TGGTTCACTATAGTTGCGGAGAGTGAATGAGCTGCTGGAAAAGA158
STAT3CATATGCGGCCAGCAAAGAAATACCTGCTCTGAAGAAACT152
STAT6AGGATGGCAGGGGTTATGTGGGGGATGGAGTGAGAGTG198
SOCS3AAGATCCCCCTGGTGTTGATTAAAGCGGGGCATCGTA162
CD3DGAGGGAACGGTGGGAACACAAAGCAAGGAGCAGAGTGG228
GZMBCCCTGGGAAAACACTCACACCCCCACGCACAACTCAAT116
CD86CAAAACCAAAGCCTGAGTGAGGCTTTTTGTGATGGATGATAC215
CD163ATCCCGTCAGTCATCCTTTATTCTGTCTCTGTCTTCGCTTTTTAGT103
CD206CTACAAGGGATCGGGTTTATGGATTGGCATTGCCTAGTAGCGTA105
TGM2CGTGACCAACTACAACTCGGCATCCACGACTCCACCCAG136
Disclaimer/Publisher’s Note: The statements, opinions and data contained in all publications are solely those of the individual author(s) and contributor(s) and not of MDPI and/or the editor(s). MDPI and/or the editor(s) disclaim responsibility for any injury to people or property resulting from any ideas, methods, instructions or products referred to in the content.

