

Single-Nucleotide Polymorphisms in Genes Maintaining the Stability of Mitochondrial DNA Affect the Occurrence, Onset, Severity and Treatment of Major Depressive Disorder

 , , ,
, , ,  , , , , ,
  , , and
Abstract
:1. Introduction
2. Results
2.1. Single-Nucelotide Polymorphisms of Genes Involved in Mitochodrial DNA Metabolism Are Linked to the Incidence of Depression
2.2. Haplotypes of the Studied Single-Nucelotide Polymorphisms Located in ENDOG and EXOG Are Associated with the Incidence of Depression
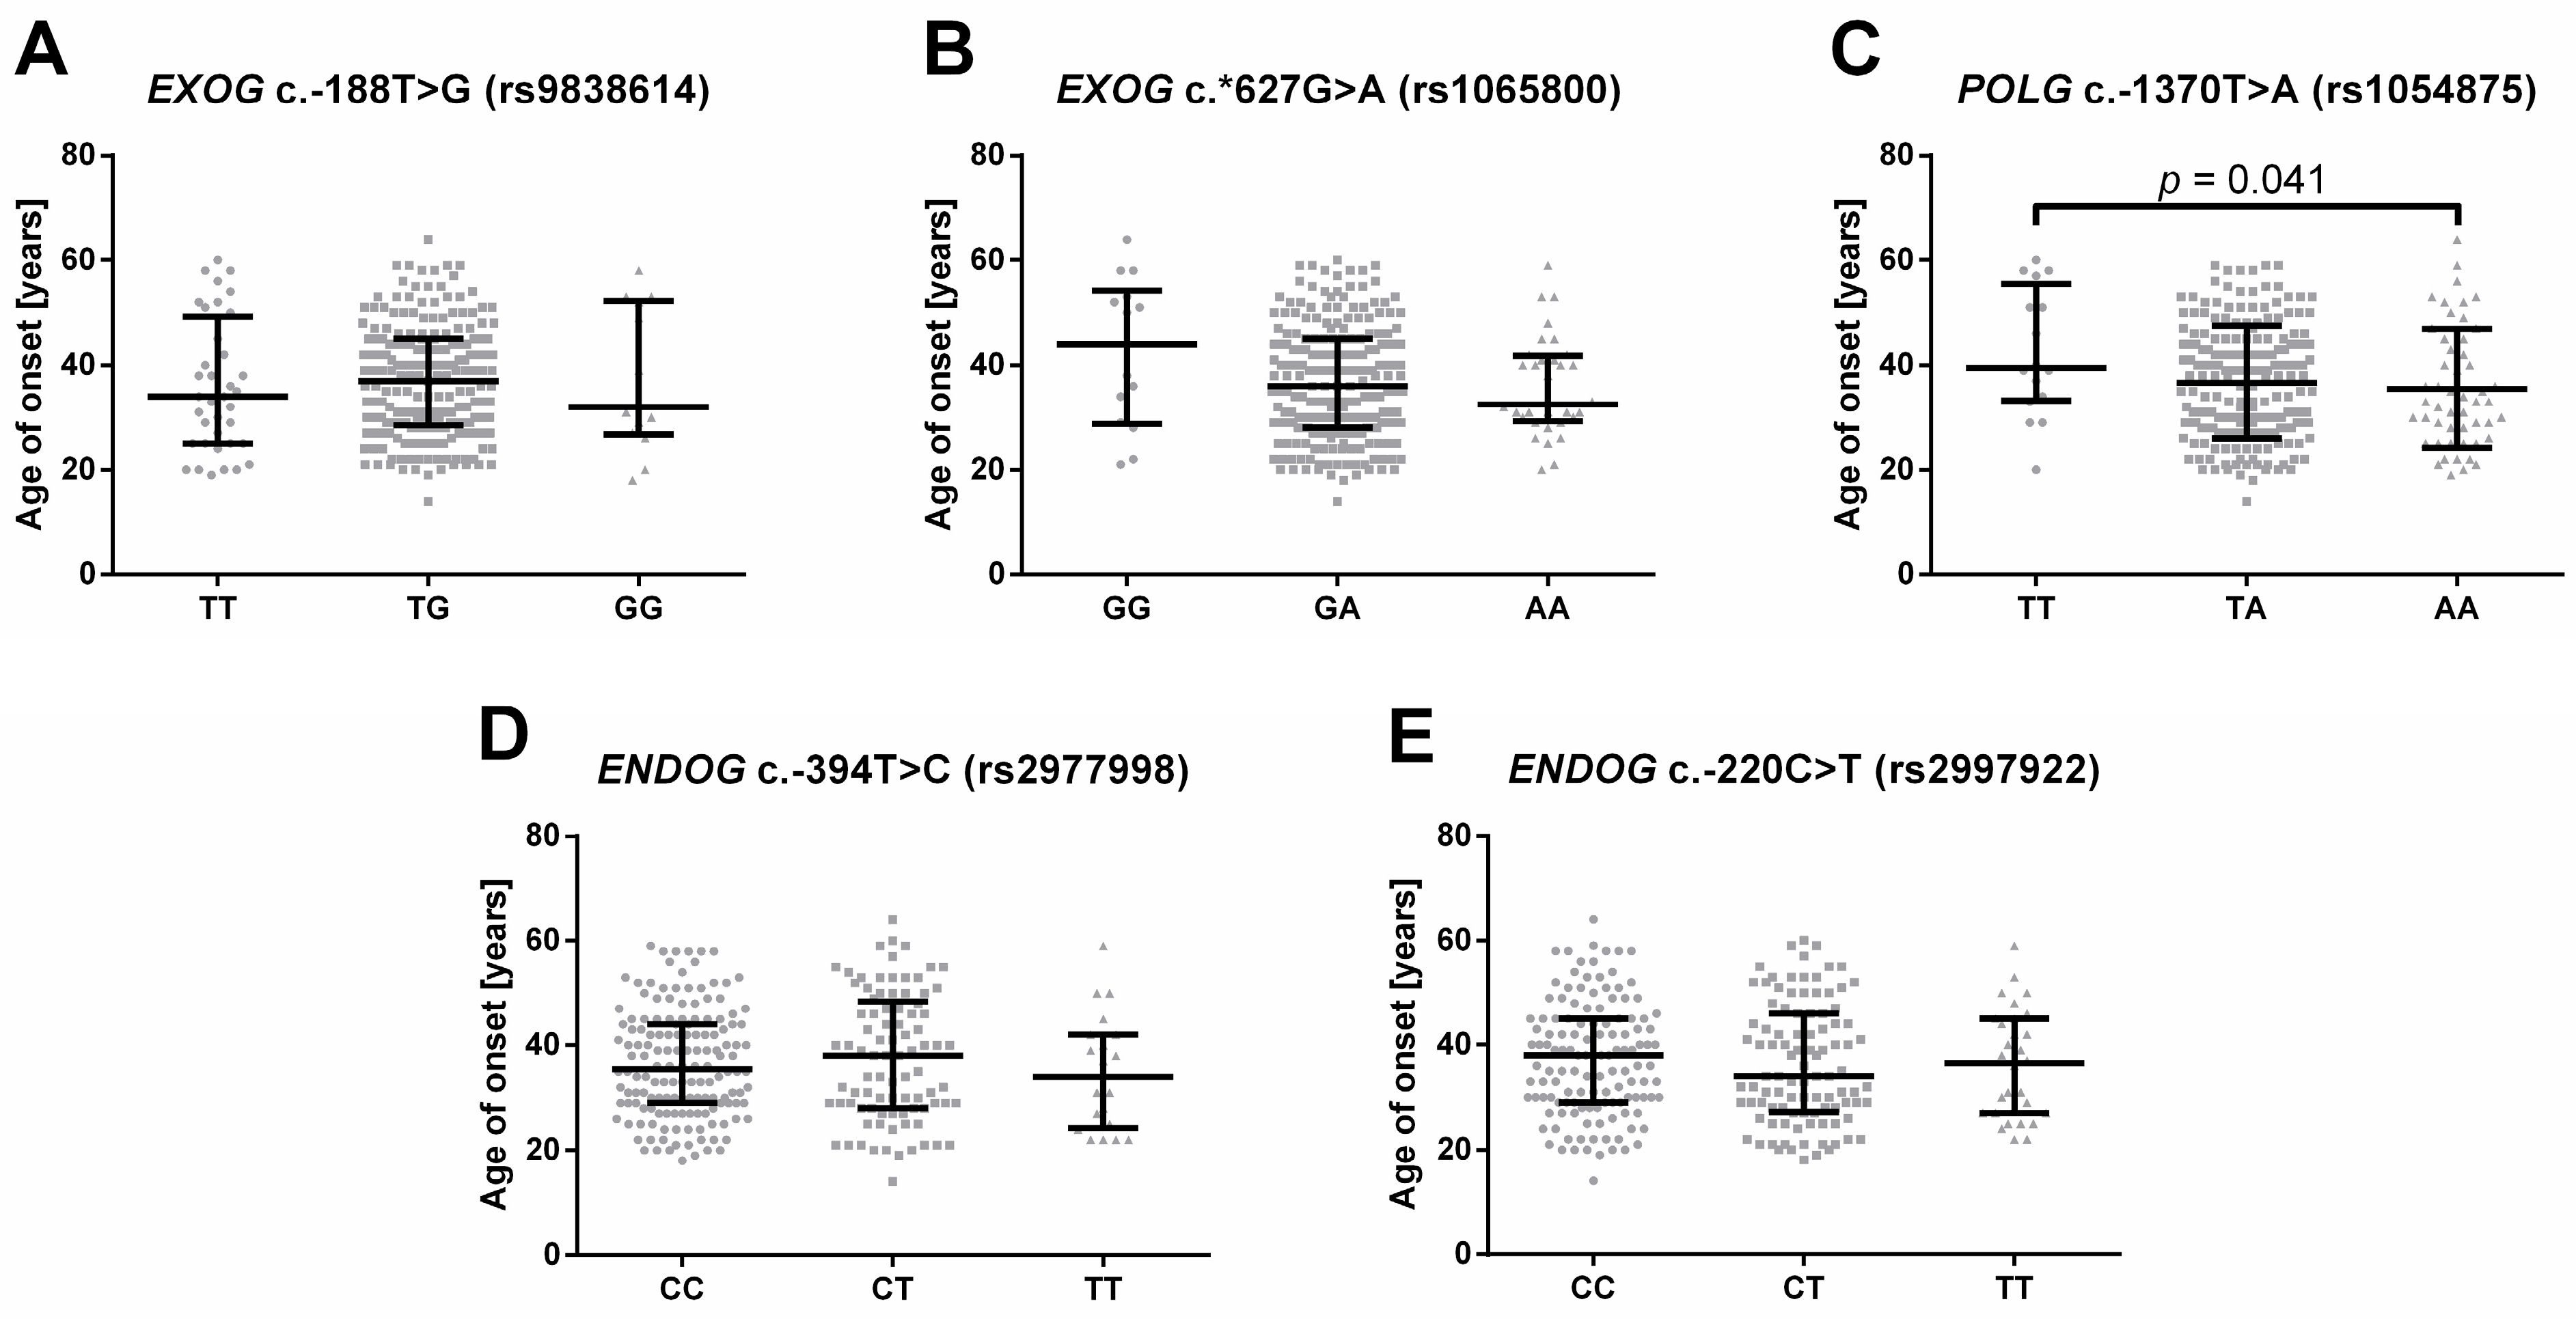
2.3. Single-Nucleotide Polymorphisms of Genes Involved in Mitochondrial DNA Metabolism Are Linked to the Onset of Depression
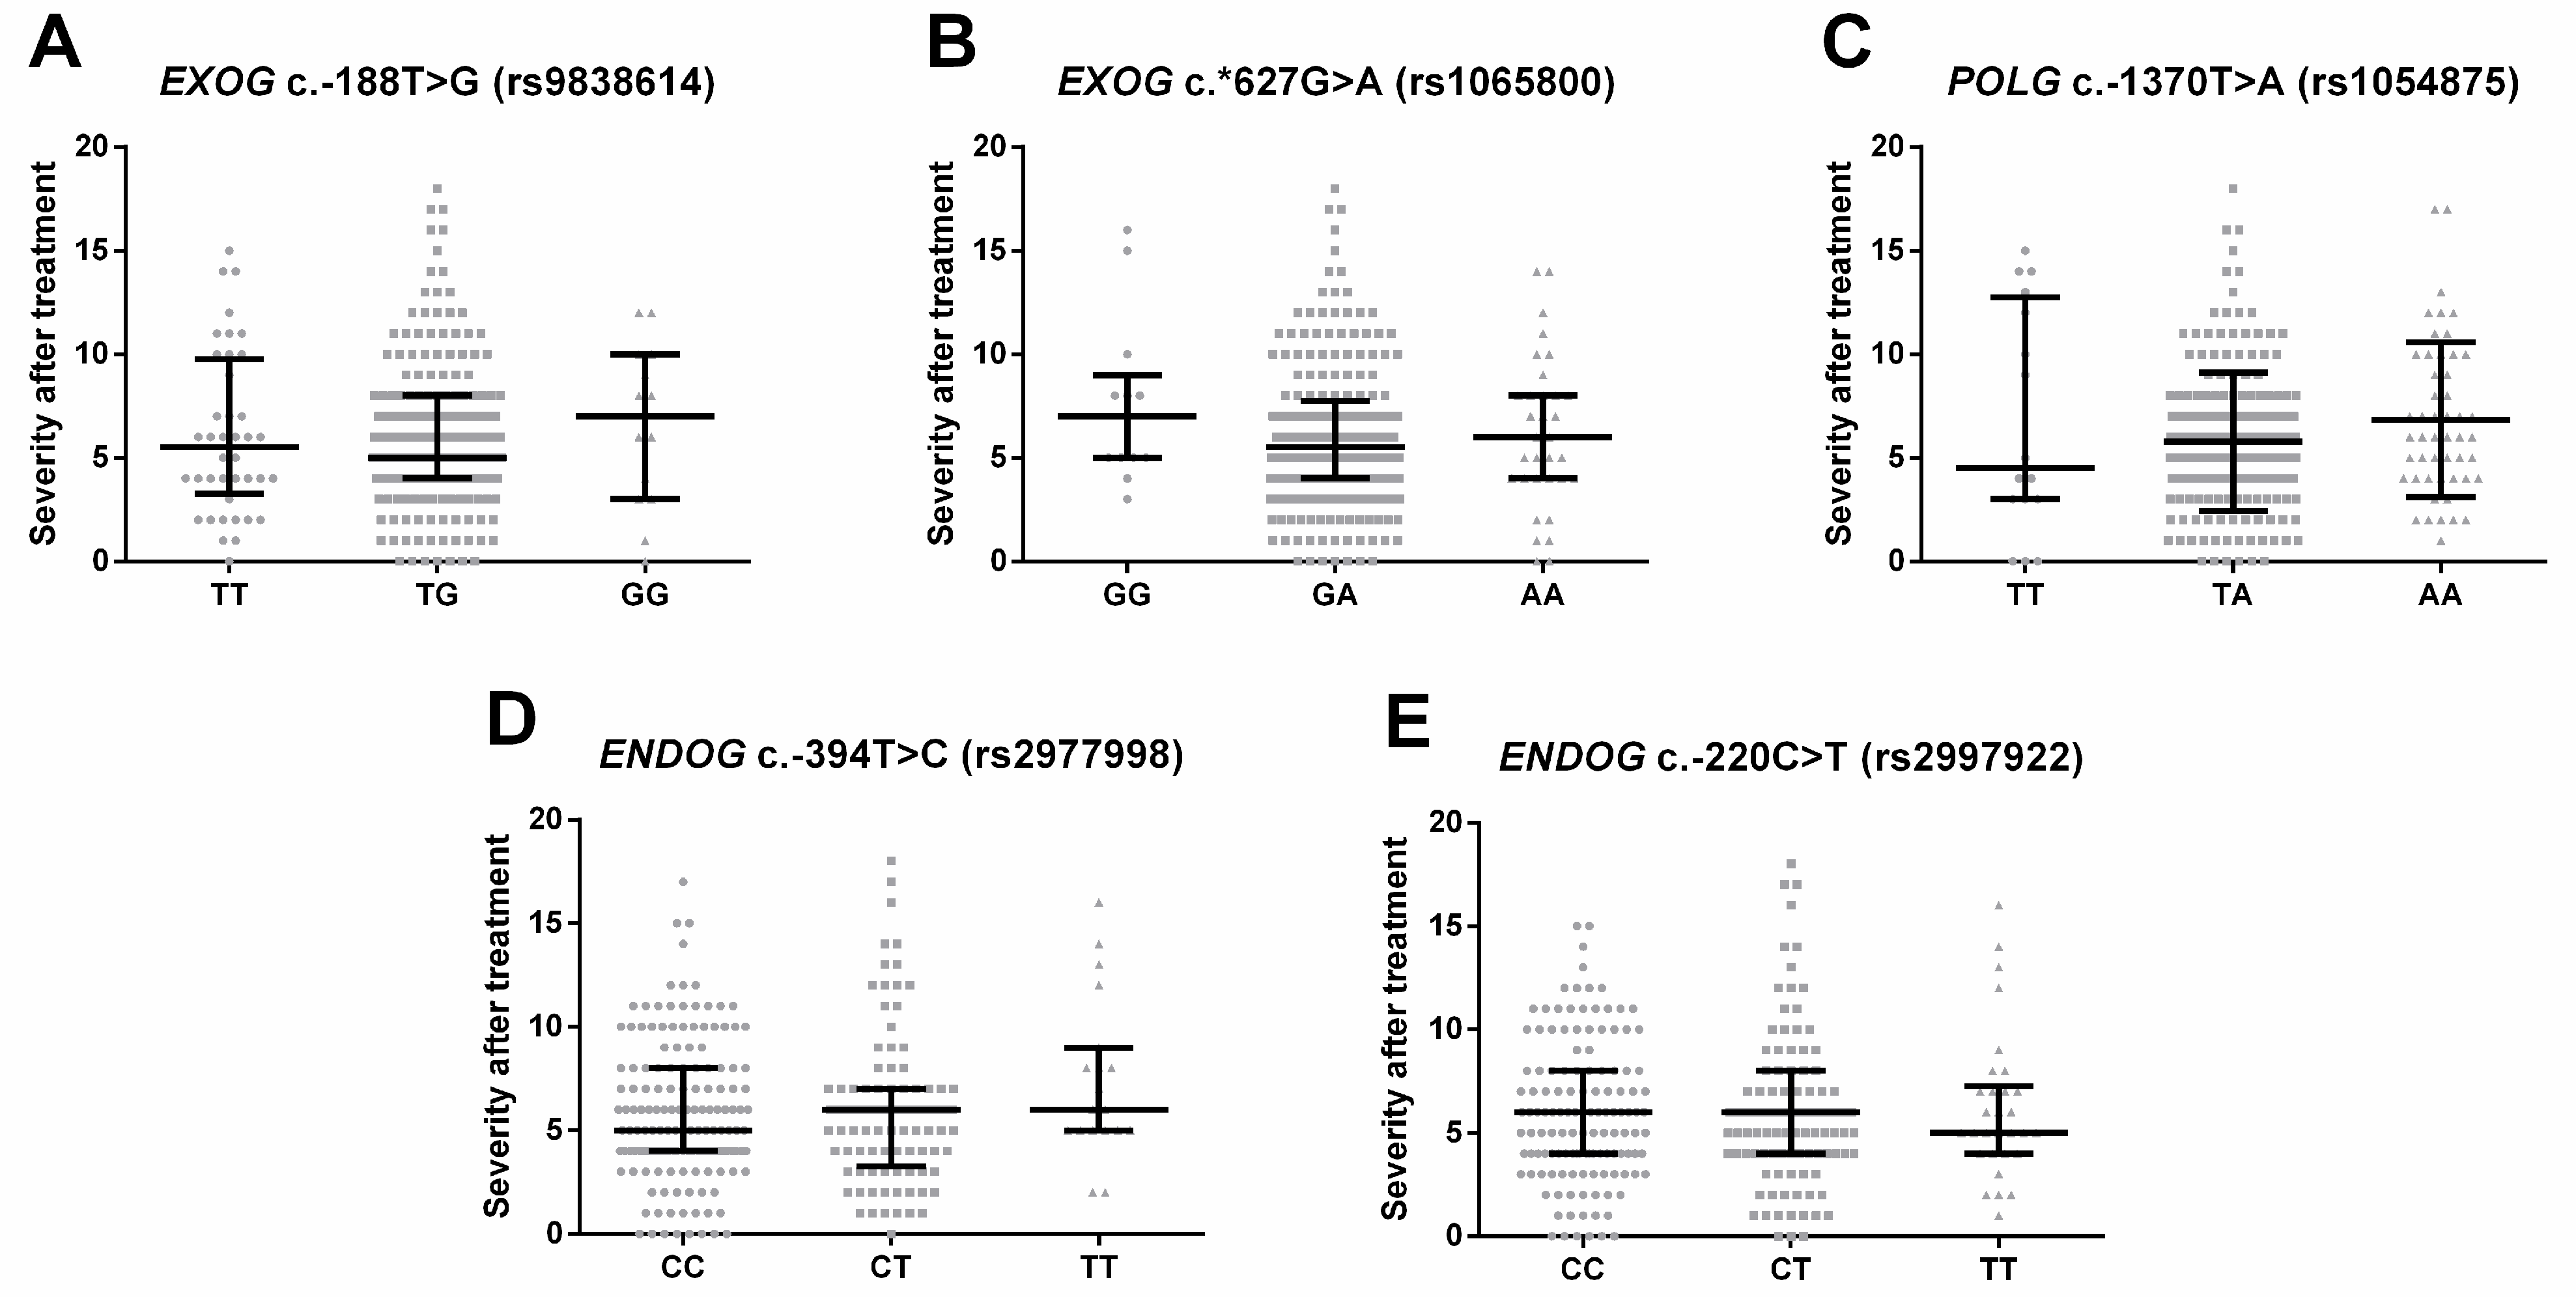
2.4. Single-Nucleotide Polymorphisms of Genes Involved in Mitochondrial DNA Metabolism Are Linked to the Severity of the Depression Episode
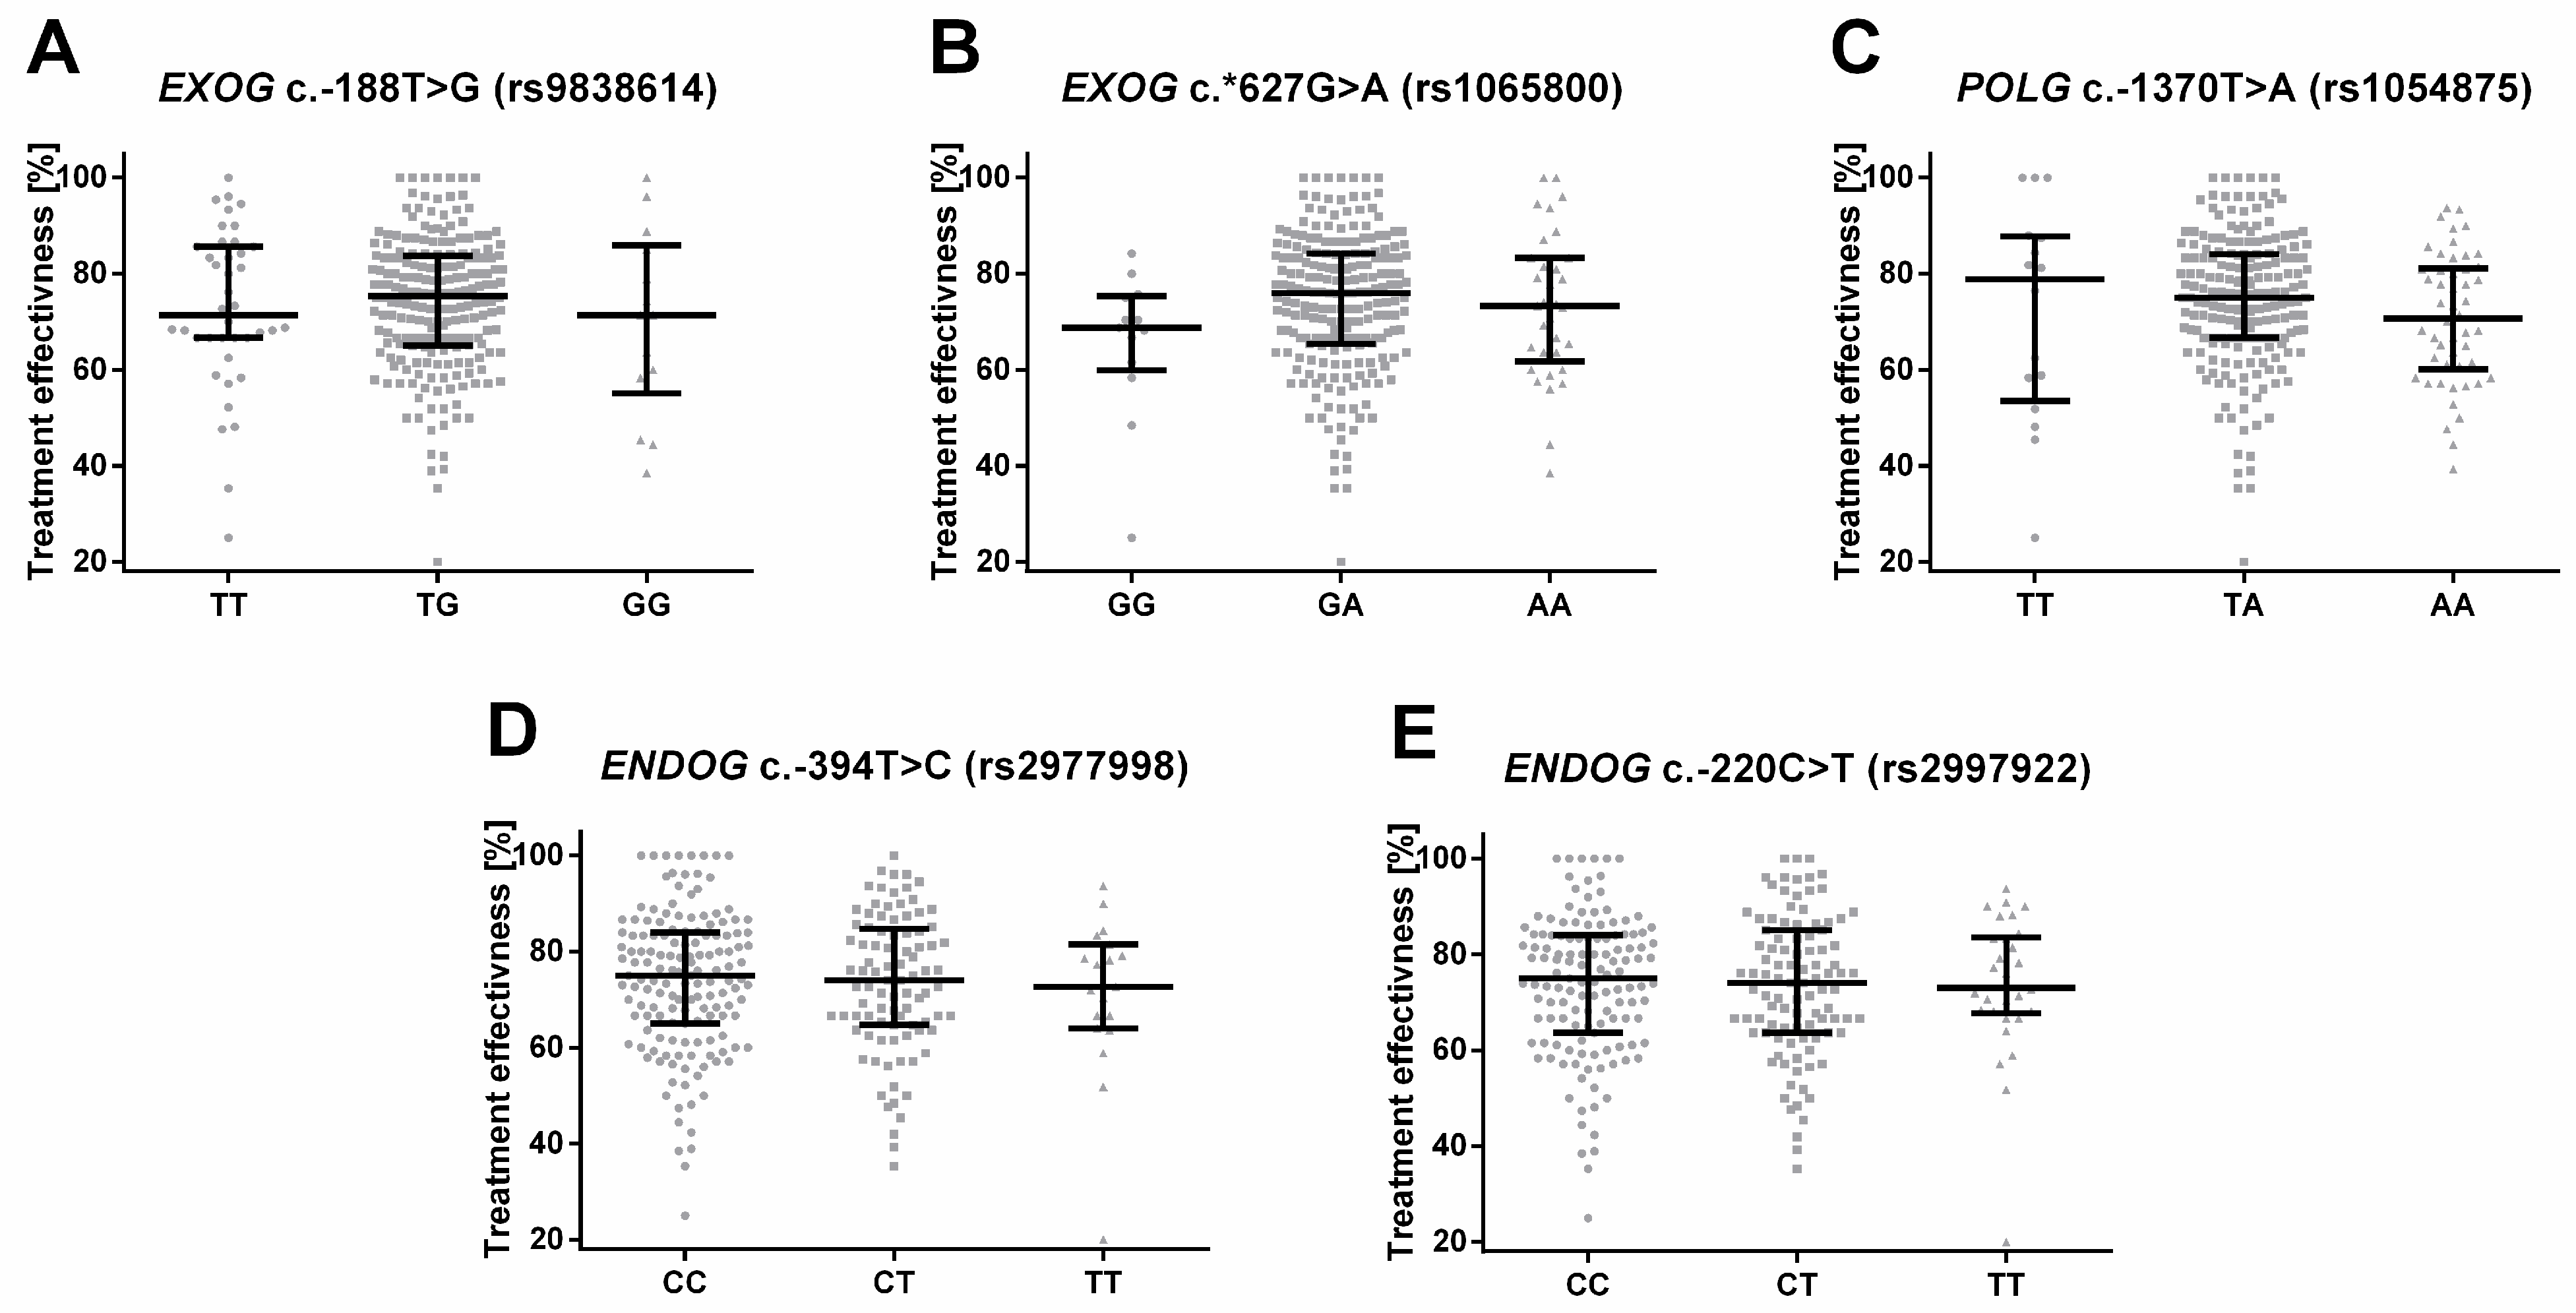
2.5. Single-Nucleotide Polymorphisms of Genes Involved in Mitochondrial DNA Metabolism Are Associated with the Treatment of Depression
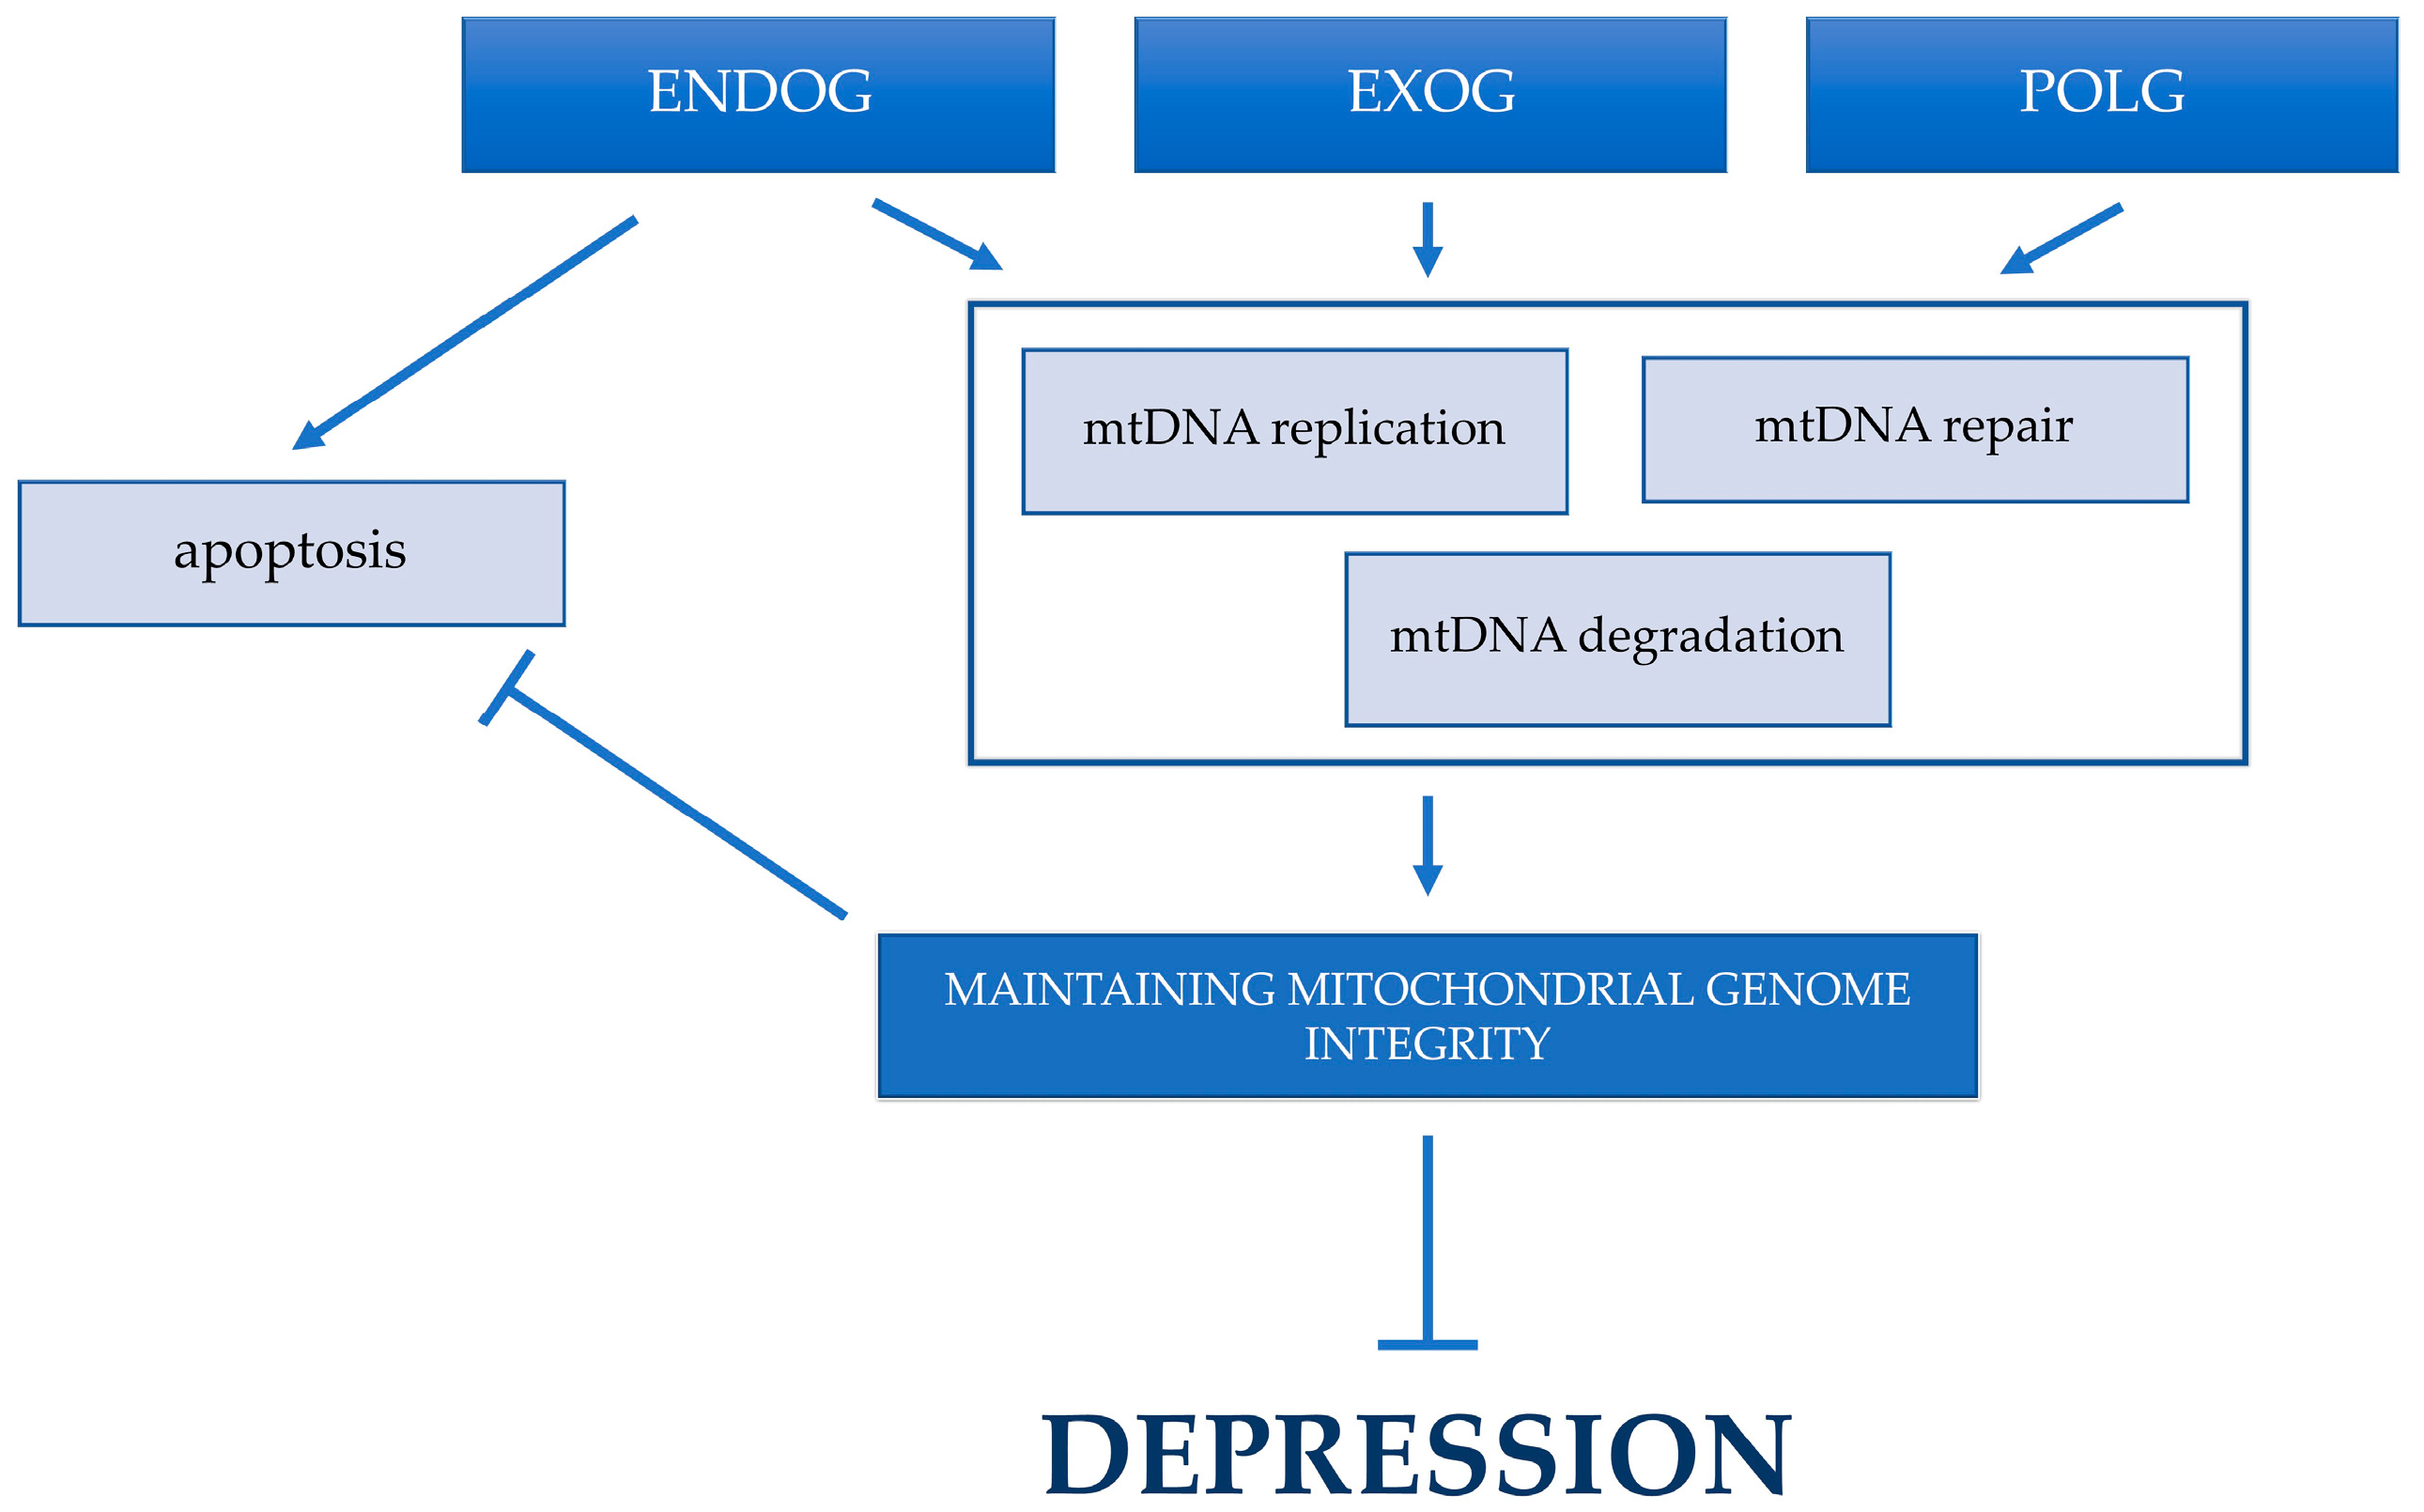
3. Discussion
4. Materials and Methods
4.1. Characteristics of the Studied Group
4.2. DNA Extraction
4.3. SNPs Selection and Genotyping
4.4. Statistical Analysis
5. Conclusions
Supplementary Materials
Author Contributions
Funding
Institutional Review Board Statement
Informed Consent Statement
Data Availability Statement
Conflicts of Interest
References
- Moussavi, S.; Chatterji, S.; Verdes, E.; Tandon, A.; Patel, V.; Ustun, B. Depression, Chronic Diseases, and Decrements in Health: Results from the World Health Surveys. Lancet 2007, 370, 851–858. [Google Scholar] [CrossRef] [PubMed]
- WHO Depressive Disorder (Depression). Available online: https://www.who.int/news-room/fact-sheets/detail/depression (accessed on 16 June 2023).
- Institute of Healht Metrics and Evaluation Global Health Data Exchange (GHDx). Available online: https://vizhub.healthdata.org/gbd-results (accessed on 4 March 2023).
- Gruenberg, A.M.; Goldstein, R.D.; Pincus, H.A. Classification of Depression: Research and Diagnostic Criteria: DSM-IV and ICD-10. In Biology of Depression: From Novel Insights to Therapeutic Strategies; Julio, L., Wong, M.-L., Eds.; Wiley-Blackwell: Hoboken, NJ, USA, 2008; pp. 1–12. ISBN 3527307850. [Google Scholar]
- Al-Harbi, K.S. Treatment-Resistant Depression: Therapeutic Trends, Challenges, and Future Directions. Patient Prefer. Adherence 2012, 6, 369–388. [Google Scholar] [CrossRef] [PubMed]
- Ionescu, D.F.; Rosenbaum, J.F.; Alpert, J.E. Pharmacological Approaches to the Challenge of Treatment-Resistant Depression. Dialogues Clin. Neurosci. 2015, 17, 111–126. [Google Scholar] [CrossRef]
- Czarny, P.; Wigner, P.; Galecki, P.; Sliwinski, T. The Interplay between Inflammation, Oxidative Stress, DNA Damage, DNA Repair and Mitochondrial Dysfunction in Depression. Prog. Neuro-Psychopharmacol. Biol. Psychiatry 2018, 80, 309–321. [Google Scholar] [CrossRef] [PubMed]
- Wigner, P.; Czarny, P.; Galecki, P.; Su, K.-P.; Sliwinski, T. The Molecular Aspects of Oxidative & Nitrosative Stress and the Tryptophan Catabolites Pathway (TRYCATs) as Potential Causes of Depression. Psychiatry Res. 2018, 262, 566–574. [Google Scholar] [CrossRef]
- Correia, A.S.; Cardoso, A.; Vale, N. Oxidative Stress in Depression: The Link with the Stress Response, Neuroinflammation, Serotonin, Neurogenesis and Synaptic Plasticity. Antioxidants 2023, 12, 470. [Google Scholar] [CrossRef]
- Irie, M.; Asami, S.; Nagata, S.; Ikeda, M.; Miyata, M.; Kasai, H. Psychosocial Factors as a Potential Trigger of Oxidative DNA Damage in Human Leukocytes. Jpn. J. Cancer Res. 2001, 92, 367–376. [Google Scholar] [CrossRef]
- Irie, M.; Asami, S.; Ikeda, M.; Kasai, H. Depressive State Relates to Female Oxidative DNA Damage via Neutrophil Activation. Biochem. Biophys. Res. Commun. 2003, 311, 1014–1018. [Google Scholar] [CrossRef]
- Forlenza, M.J.; Miller, G.E. Increased Serum Levels of 8-Hydroxy-2′-Deoxyguanosine in Clinical Depression. Psychosom. Med. 2006, 68, 1–7. [Google Scholar] [CrossRef]
- Maes, M.; Mihaylova, I.; Kubera, M.; Uytterhoeven, M.; Vrydags, N.; Bosmans, E. Increased 8-Hydroxy-Deoxyguanosine, a Marker of Oxidative Damage to DNA, in Major Depression and Myalgic Encephalomyelitis/Chronic Fatigue Syndrome. Neuroendocrinol. Lett. 2009, 30, 715–722. [Google Scholar]
- Wei, Y.C.; Zhou, F.L.; He, D.L.; Bai, J.R.; Ding, H.; Wang, X.Y.; Nan, K.J. Oxidative Stress in Depressive Patients with Gastric Adenocarcinoma. Int. J. Neuropsychopharmacol. 2009, 12, 1089–1096. [Google Scholar] [CrossRef]
- Kupper, N.; Gidron, Y.; Winter, J.; Denollet, J. Association between Type D Personality, Depression, and Oxidative Stress in Patients with Chronic Heart Failure. Psychosom. Med. 2009, 71, 973–980. [Google Scholar] [CrossRef] [PubMed]
- Black, C.N.; Bot, M.; Scheffer, P.G.; Cuijpers, P.; Penninx, B.W.J.H. Is Depression Associated with Increased Oxidative Stress? A Systematic Review and Meta-Analysis. Psychoneuroendocrinology 2015, 51, 164–175. [Google Scholar] [CrossRef] [PubMed]
- Lindqvist, D.; Dhabhar, F.S.; James, S.J.; Hough, C.M.; Jain, F.A.; Bersani, F.S.; Reus, V.I.; Verhoeven, J.E.; Epel, E.S.; Mahan, L.; et al. Oxidative Stress, Inflammation and Treatment Response in Major Depression. Psychoneuroendocrinology 2017, 76, 197–205. [Google Scholar] [CrossRef] [PubMed]
- Czarny, P.; Kwiatkowski, D.; Kacperska, D.; Kawczyńska, D.; Talarowska, M.; Orzechowska, A.; Bielecka-Kowalska, A.; Szemraj, J.; Gałecki, P.; Śliwiński, T. Elevated Level of DNA Damage and Impaired Repair of Oxidative DNA Damage in Patients with Recurrent Depressive Disorder. Med. Sci. Monit. 2015, 21, 412–418. [Google Scholar] [CrossRef]
- Czarny, P.; Kwiatkowski, D.; Toma, M.; Kubiak, J.; Sliwinska, A.; Talarowska, M.; Szemraj, J.; Maes, M.; Galecki, P.; Sliwinski, T. Impact of Single Nucleotide Polymorphisms of Base Excision Repair Genes on DNA Damage and Efficiency of DNA Repair in Recurrent Depression Disorder. Mol. Neurobiol. 2017, 54, 4150–4159. [Google Scholar] [CrossRef]
- Czarny, P.; Kwiatkowski, D.; Galecki, P.; Talarowska, M.; Orzechowska, A.; Bobinska, K.; Bielecka-Kowalska, A.; Szemraj, J.; Maes, M.; Su, K.-P.; et al. Association between Single Nucleotide Polymorphisms of MUTYH, HOGG1 and NEIL1 Genes, and Depression. J. Affect. Disord. 2015, 184, 90–96. [Google Scholar] [CrossRef]
- Czarny, P.; Kwiatkowski, D.; Toma, M.; Gałecki, P.; Orzechowska, A.; Bobińska, K.; Bielecka-Kowalska, A.; Szemraj, J.; Berk, M.; Anderson, G.; et al. Single-Nucleotide Polymorphisms of Genes Involved in Repair of Oxidative DNA Damage and the Risk of Recurrent Depressive Disorder. Med. Sci. Monit. 2016, 22, 4455–4474. [Google Scholar] [CrossRef]
- Czarny, P.; Wigner, P.; Strycharz, J.; Watala, C.; Swiderska, E.; Synowiec, E.; Galecki, P.; Talarowska, M.; Szemraj, J.; Su, K.-P.; et al. Single-Nucleotide Polymorphisms of Uracil-Processing Genes Affect the Occurrence and the Onset of Recurrent Depressive Disorder. PeerJ 2018, 2018, e5116. [Google Scholar] [CrossRef]
- Alcocer-Gómez, E.; de Miguel, M.; Casas-Barquero, N.; Núñez-Vasco, J.; Sánchez-Alcazar, J.A.; Fernández-Rodríguez, A.; Cordero, M.D. NLRP3 Inflammasome Is Activated in Mononuclear Blood Cells from Patients with Major Depressive Disorder. Brain. Behav. Immun. 2014, 36, 111–117. [Google Scholar] [CrossRef]
- Klinedinst, N.J.; Regenold, W.T. A Mitochondrial Bioenergetic Basis of Depression. J. Bioenerg. Biomembr. 2015, 47, 155–171. [Google Scholar] [CrossRef]
- Czarny, P.; Bialek, K.; Ziolkowska, S.; Strycharz, J.; Sliwinski, T. DNA Damage and Repair in Neuropsychiatric Disorders. What Do We Know and What Are the Future Perspectives? Mutagenesis 2020, 35, 79–106. [Google Scholar] [CrossRef]
- Khan, M.; Baussan, Y.; Hebert-chatelain, E. Connecting Dots between Mitochondrial Dysfunction and Depression. Biomolecules 2023, 13, 695. [Google Scholar] [CrossRef]
- Holt, I.J.; Harding, A.E.; Morgan-Hughes, J.A. Deletions of Muscle Mitochondrial DNA in Patients with Mitochondrial Myopathies. Nature 1988, 331, 717–719. [Google Scholar] [CrossRef] [PubMed]
- Lestienne, P.; Ponsot, G. Kearns-Sayre Syndrome with Muscle Mitochondrial DNA Deletion. Lancet 1988, 1, 885. [Google Scholar] [CrossRef] [PubMed]
- Wallace, D.C.; Singh, G.; Lott, M.T.; Hodge, J.A.; Schurr, T.G.; Lezza, A.M.S.; Elsas, L.J.; Nikoskelainen, E.K. Mitochondrial DNA Mutation Associated with Leber’s Hereditary Optic Neuropathy. Science 1988, 242, 1427–1430. [Google Scholar] [CrossRef]
- Shoffner, J.M.; Lott, M.T.; Voljavec, A.S.; Soueidan, S.A.; Costigan, D.A.; Wallace, D.C. Spontaneous Kearns-Sayre/Chronic External Ophthalmoplegia plus Syndrome Associated with a Mitochondrial DNA Deletion: A Slip-Replication Model and Metabolic Therapy. Proc. Natl. Acad. Sci. USA 1989, 86, 7952–7956. [Google Scholar] [CrossRef]
- Gardner, A.; Johansson, A.; Wibom, R.; Nennesmo, I.; Von Döbeln, U.; Hagenfeldt, L.; Hällström, T. Alterations of Mitochondrial Function and Correlations with Personality Traits in Selected Major Depressive Disorder Patients. J. Affect. Disord. 2003, 76, 55–68. [Google Scholar] [CrossRef]
- Chang, C.C.; Jou, S.H.; Lin, T.T.; Lai, T.J.; Liu, C.S. Mitochondria DNA Change and Oxidative Damage in Clinically Stable Patients with Major Depressive Disorder. PLoS ONE 2015, 10, e0125855. [Google Scholar] [CrossRef]
- Czarny, P.; Wigner, P.; Strycharz, J.; Swiderska, E.; Synowiec, E.; Szatkowska, M.; Sliwinska, A.; Talarowska, M.; Szemraj, J.; Su, K.-P.; et al. Mitochondrial DNA Copy Number, Damage, Repair and Degradation in Depressive Disorder. World J. Biol. Psychiatry 2020, 21, 91–101. [Google Scholar] [CrossRef] [PubMed]
- Lee, H.C.; Wei, Y.H. Mitochondrial Biogenesis and Mitochondrial DNA Maintenance of Mammalian Cells under Oxidative Stress. Int. J. Biochem. Cell Biol. 2005, 37, 822–834. [Google Scholar] [CrossRef]
- Clay Montier, L.L.; Deng, J.J.; Bai, Y. Number Matters: Control of Mammalian Mitochondrial DNA Copy Number. J. Genet. Genom. 2009, 36, 125–131. [Google Scholar] [CrossRef]
- He, Y.; Tang, J.; Li, Z.; Li, H.; Liao, Y.; Tang, Y.; Tan, L.; Chen, J.; Xia, K.; Chen, X. Leukocyte Mitochondrial DNA Copy Number in Blood Is Not Associated with Major Depressive Disorder in Young Adults. PLoS ONE 2014, 9, e96869. [Google Scholar] [CrossRef]
- Tymofiyeva, O.; Henje Blom, E.; Ho, T.C.; Connolly, C.G.; Lindqvist, D.; Wolkowitz, O.M.; Lin, J.; LeWinn, K.Z.; Sacchet, M.D.; Han, L.K.M.; et al. High Levels of Mitochondrial DNA Are Associated with Adolescent Brain Structural Hypoconnectivity and Increased Anxiety but Not Depression. J. Affect. Disord. 2018, 232, 283–290. [Google Scholar] [CrossRef] [PubMed]
- Cai, N.; Li, Y.; Chang, S.; Liang, J.; Lin, C.; Zhang, X.; Liang, L.; Hu, J.; Chan, W.; Kendler, K.S.; et al. Genetic Control over MtDNA and Its Relationship to Major Depressive Disorder. Curr. Biol. 2015, 25, 3170–3177. [Google Scholar] [CrossRef] [PubMed]
- Tyrka, A.R.; Parade, S.H.; Price, L.H.; Kao, H.T.; Porton, B.; Philip, N.S.; Welch, E.S.; Carpenter, L.L. Alterations of Mitochondrial DNA Copy Number and Telomere Length with Early Adversity and Psychopathology. Biol. Psychiatry 2016, 79, 78–86. [Google Scholar] [CrossRef]
- Wang, X.; Sundquist, K.; Rastkhani, H.; Palmér, K.; Memon, A.A.; Sundquist, J. Association of Mitochondrial DNA in Peripheral Blood with Depression, Anxiety and Stress- and Adjustment Disorders in Primary Health Care Patients. Eur. Neuropsychopharmacol. 2017, 27, 751–758. [Google Scholar] [CrossRef]
- Ryan, K.M.; Doody, E.; McLoughlin, D.M. Whole Blood Mitochondrial DNA Copy Number in Depression and Response to Electroconvulsive Therapy. Prog. Neuro-Psychopharmacol. Biol. Psychiatry 2023, 121, 110656. [Google Scholar] [CrossRef]
- Kim, M.Y.; Lee, J.W.; Kang, H.C.; Kim, E.; Lee, D.C. Leukocyte Mitochondrial DNA (MtDNA) Content Is Associated with Depression in Old Women. Arch. Gerontol. Geriatr. 2011, 53, e218–e221. [Google Scholar] [CrossRef] [PubMed]
- Lindqvist, D.; Wolkowitz, O.M.; Picard, M.; Ohlsson, L.; Bersani, F.S.; Fernström, J.; Westrin, Å.; Hough, C.M.; Lin, J.; Reus, V.I.; et al. Circulating Cell-Free Mitochondrial DNA, but Not Leukocyte Mitochondrial DNA Copy Number, Is Elevated in Major Depressive Disorder. Neuropsychopharmacology 2018, 43, 1557–1564. [Google Scholar] [CrossRef]
- Chiu, R.W.K.; Chan, L.Y.S.; Lam, N.Y.L.; Tsui, N.B.Y.; Ng, E.K.O.; Rainer, T.H.; Lo, Y.M.D. Quantitative Analysis of Circulating Mitochondrial DNA in Plasma. Clin. Chem. 2003, 49, 719–726. [Google Scholar] [CrossRef]
- Zhang, Q.; Itagaki, K.; Hauser, C.J. Mitochondrial DNA Is Released by Shock and Activates Neutrophils via P38 Map Kinase. Shock 2010, 34, 55–59. [Google Scholar] [CrossRef]
- Yu, M. Circulating Cell-Free Mitochondrial DNA as a Novel Cancer Biomarker: Opportunities and Challenges. Mitochondrial DNA 2012, 23, 329–332. [Google Scholar] [CrossRef] [PubMed]
- Kageyama, Y.; Kasahara, T.; Kato, M.; Sakai, S.; Deguchi, Y.; Tani, M.; Kuroda, K.; Hattori, K.; Yoshida, S.; Goto, Y.; et al. The Relationship between Circulating Mitochondrial DNA and Inflammatory Cytokines in Patients with Major Depression. J. Affect. Disord. 2018, 233, 15–20. [Google Scholar] [CrossRef] [PubMed]
- Melamud, M.M.; Buneva, V.N.; Ermakov, E.A. Circulating Cell-Free DNA Levels in Psychiatric Diseases: A Systematic Review and Meta-Analysis. Int. J. Mol. Sci. 2023, 24, 3402. [Google Scholar] [CrossRef] [PubMed]
- Lindqvist, D.; Fernström, J.; Grudet, C.; Ljunggren, L.; Träskman-Bendz, L.; Ohlsson, L.; Westrin, A. Increased Plasma Levels of Circulating Cell-Free Mitochondrial DNA in Suicide Attempters: Associations with HPA-Axis Hyperactivity. Transl. Psychiatry 2016, 6, e971. [Google Scholar] [CrossRef]
- Fernström, J.; Ohlsson, L.; Asp, M.; Lavant, E.; Holck, A.; Grudet, C.; Westrin, Å.; Lindqvist, D. Plasma Circulating Cell-Free Mitochondrial DNA in Depressive Disorders. PLoS ONE 2021, 16, e0259591. [Google Scholar] [CrossRef]
- Behnke, A.; Gumpp, A.M.; Rojas, R.; Sänger, T.; Lutz-Bonengel, S.; Moser, D.; Schelling, G.; Krumbholz, A.; Kolassa, I.T. Circulating Inflammatory Markers, Cell-Free Mitochondrial DNA, Cortisol, Endocannabinoids, and N-Acylethanolamines in Female Depressed Outpatients. World J. Biol. Psychiatry 2023, 24, 58–69. [Google Scholar] [CrossRef]
- Hunter, M.S. Letter to the Editor. Menopause 2014, 21, 909. [Google Scholar] [CrossRef]
- Hamilton, M. A rating scale for depression. J. Neurol. Neurosurg. Psychiatry 1960, 23, 56. [Google Scholar] [CrossRef]
- Anderson, G.; Maes, M. Oxidative/Nitrosative Stress and Immuno-Inflammatory Pathways in Depression: Treatment Implications. Curr. Pharm. Des. 2014, 20, 3812–3847. [Google Scholar] [CrossRef]
- Liu, W.; Zhou, C. Corticosterone Reduces Brain Mitochondrial Function and Expression of Mitofusin, BDNF in Depression-like Rodents Regardless of Exercise Preconditioning. Psychoneuroendocrinology 2012, 37, 1057–1070. [Google Scholar] [CrossRef] [PubMed]
- Gong, Y.; Chai, Y.; Ding, J.H.; Sun, X.L.; Hu, G. Chronic Mild Stress Damages Mitochondrial Ultrastructure and Function in Mouse Brain. Neurosci. Lett. 2011, 488, 76–80. [Google Scholar] [CrossRef] [PubMed]
- Rezin, G.T.; Amboni, G.; Zugno, A.I.; Quevedo, J.; Streck, E.L. Mitochondrial Dysfunction and Psychiatric Disorders. Neurochem. Res. 2009, 34, 1021–1029. [Google Scholar] [CrossRef]
- Martins-De-Souza, D.; Guest, P.C.; Harris, L.W.; Vanattou-Saifoudine, N.; Webster, M.J.; Rahmoune, H.; Bahn, S. Identification of Proteomic Signatures Associated with Depression and Psychotic Depression in Post-Mortem Brains from Major Depression Patients. Transl. Psychiatry 2012, 2, e87. [Google Scholar] [CrossRef] [PubMed]
- Emmerzaal, T.L.; Preston, G.; Geenen, B.; Verweij, V.; Wiesmann, M.; Vasileiou, E.; Grüter, F.; de Groot, C.; Schoorl, J.; de Veer, R.; et al. Impaired Mitochondrial Complex I Function as a Candidate Driver in the Biological Stress Response and a Concomitant Stress-Induced Brain Metabolic Reprogramming in Male Mice. Transl. Psychiatry 2020, 10, 176. [Google Scholar] [CrossRef]
- Moreno-Fernández, A.M.; Cordero, M.D.; Garrido-Maraver, J.; Alcocer-Gómez, E.; Casas-Barquero, N.; Carmona-López, M.I.; Sánchez-Alcázar, J.A.; de Miguel, M. Oral Treatment with Amitriptyline Induces Coenzyme Q Deficiency and Oxidative Stress in Psychiatric Patients. J. Psychiatr. Res. 2012, 46, 341–345. [Google Scholar] [CrossRef]
- Zheng, Y.; Pan, L.; He, J.; Yan, J.; Xia, Y.; Lin, C.; Chen, X.; Zhao, Q.; Zeng, Q.; Julikezi, M.; et al. Electroacupuncture-Modulated Extracellular ATP Levels in Prefrontal Cortex Ameliorated Depressive-like Behavior of Maternal Separation Rats. Behav. Brain Res. 2023, 452, 114548. [Google Scholar] [CrossRef] [PubMed]
- Haj-Mirzaian, A.; Amiri, S.; Amini-Khoei, H.; Hosseini, M.J.; Haj-Mirzaian, A.; Momeny, M.; Rahimi-Balaei, M.; Dehpour, A.R. Anxiety- and Depressive-Like Behaviors Are Associated with Altered Hippocampal Energy and Inflammatory Status in a Mouse Model of Crohn’s Disease. Neuroscience 2017, 366, 124–137. [Google Scholar] [CrossRef]
- Mangrulkar, S.V.; Wankhede, N.L.; Kale, M.B.; Upaganlawar, A.B.; Taksande, B.G.; Umekar, M.J.; Anwer, M.K.; Dailah, H.G.; Mohan, S.; Behl, T. Mitochondrial Dysfunction as a Signaling Target for Therapeutic Intervention in Major Neurodegenerative Disease. Neurotox. Res. 2023, 1–22. [Google Scholar] [CrossRef]
- Daniels, T.E.; Olsen, E.M.; Tyrka, A.R. Stress and Psychiatric Disorders: The Role of Mitochondria. Annu. Rev. Clin. Psychol. 2020, 16, 165–186. [Google Scholar] [CrossRef]
- DiMauro, S.; Davidzon, G. Mitochondrial DNA and Disease. Ann. Med. 2005, 37, 222–232. [Google Scholar] [CrossRef]
- Marazziti, D.; Baroni, S.; Picchetti, M.; Landi, P.; Silvestri, S.; Vatteroni, E.; Catena Dell’Osso, M. Psychiatric Disorders and Mitochondrial Dysfunctions. Eur. Rev. Med. Pharmacol. Sci. 2012, 16, 270–275. [Google Scholar]
- Bersani, F.S.; Morley, C.; Lindqvist, D.; Epel, E.S.; Picard, M.; Yehuda, R.; Flory, J.; Bierer, L.M.; Makotkine, I.; Abu-Amara, D.; et al. Mitochondrial DNA Copy Number Is Reduced in Male Combat Veterans with PTSD. Prog. Neuro-Psychopharmacol. Biol. Psychiatry 2016, 64, 10–17. [Google Scholar] [CrossRef] [PubMed]
- Anderson, S.; Bankier, A.T.; Barrell, B.G.; De Bruijn, M.H.L.; Coulson, A.R.; Drouin, J.; Eperon, I.C.; Nierlich, D.P.; Roe, B.A.; Sanger, F.; et al. Sequence and Organization of the Human Mitochondrial Genome. Nature 1981, 290, 457–465. [Google Scholar] [CrossRef] [PubMed]
- Waltz, F.; Salinas-Giegé, T.; Englmeier, R.; Meichel, H.; Soufari, H.; Kuhn, L.; Pfeffer, S.; Förster, F.; Engel, B.D.; Giegé, P.; et al. How to Build a Ribosome from RNA Fragments in Chlamydomonas Mitochondria. Nat. Commun. 2021, 12, 7176. [Google Scholar] [CrossRef] [PubMed]
- Lan, Q.; Lim, U.; Liu, C.S.; Weinstein, S.J.; Chanock, S.; Bonner, M.R.; Virtamo, J.; Albanes, D.; Rothman, N. A Prospective Study of Mitochondrial DNA Copy Number and Risk of Non-Hodgkin Lymphoma. Blood 2008, 112, 4247–4249. [Google Scholar] [CrossRef]
- Ziegler, D.V.; Wiley, C.D.; Velarde, M.C. Mitochondrial Effectors of Cellular Senescence: Beyond the Free Radical Theory of Aging. Aging Cell 2015, 14, 1–7. [Google Scholar] [CrossRef]
- Balaban, R.S.; Nemoto, S.; Finkel, T. Mitochondria, Oxidants, and Aging. Cell 2005, 120, 483–495. [Google Scholar] [CrossRef]
- Alexeyev, M.; Shokolenko, I.; Wilson, G.; LeDoux, S. The Maintenance of Mitochondrial DNA Integrity-Critical Analysis and Update. Cold Spring Harb. Perspect. Biol. 2013, 5, a012641. [Google Scholar] [CrossRef]
- Shokolenko, I.; LeDoux, S.; Wilson, G.; Alexeyev, M. Mitochondrial DNA Damage, Repair, Degradation and Experimental Approaches to Studying These Phenomena. In DNA Repair-On the Pathways to Fixing DNA Damage and Errors; Storici, F., Ed.; InTech: London, UK, 2011. [Google Scholar]
- Shokolenko, I.N.; Alexeyev, M.F. Mitochondrial DNA: A Disposable Genome? Biochim. Biophys. Acta 2015, 1852, 1805–1809. [Google Scholar] [CrossRef]
- Moretton, A.; Morel, F.; Macao, B.; Lachaume, P.; Ishak, L.; Lefebvre, M.; Garreau-Balandier, I.; Vernet, P.; Falkenberg, M.; Farge, G. Selective Mitochondrial DNA Degradation Following Double-Strand Breaks. PLoS ONE 2017, 12, e0176795. [Google Scholar] [CrossRef]
- Fuke, S.; Kubota-Sakashita, M.; Kasahara, T.; Shigeyoshi, Y.; Kato, T. Regional Variation in Mitochondrial DNA Copy Number in Mouse Brain. Biochim. Biophys. Acta-Bioenerg. 2011, 1807, 270–274. [Google Scholar] [CrossRef]
- Wang, Y.; Nartiss, Y.; Steipe, B.; McQuibban, G.A.; Kim, P.K. ROS-Induced Mitochondrial Depolarization Initiates PARK2/PARKIN-Dependent Mitochondrial Degradation by Autophagy. Autophagy 2012, 8, 1462–1476. [Google Scholar] [CrossRef]
- Wen, X.; Tang, L.; Zhong, R.; Liu, L.; Chen, L.; Zhang, H. Role of Mitophagy in Regulating Intestinal Oxidative Damage. Antioxidants 2023, 12, 480. [Google Scholar] [CrossRef]
- Cymerman, I.A.; Chung, I.; Beckmann, B.M.; Bujnicki, J.M.; Meiss, G. EXOG, a Novel Paralog of Endonuclease G in Higher Eukaryotes. Nucleic Acids Res. 2008, 36, 1369–1379. [Google Scholar] [CrossRef] [PubMed]
- Tann, A.W.; Boldogh, I.; Meiss, G.; Qian, W.; Van Houten, B.; Mitra, S.; Szczesny, B. Apoptosis Induced by Persistent Single-Strand Breaks in Mitochondrial Genome: Critical Role of EXOG (5′-Exo/Endonuclease) in Their Repair. J. Biol. Chem. 2011, 286, 31975–31983. [Google Scholar] [CrossRef]
- Szczesny, B.; Tann, A.W.; Longley, M.J.; Copeland, W.C.; Mitra, S. Long Patch Base Excision Repair in Mammalian Mitochondrial Genomes. J. Biol. Chem. 2008, 283, 26349–26356. [Google Scholar] [CrossRef] [PubMed]
- Van Houten, B.; Hunter, S.E.; Meyer, J.N. Mitochondrial DNA Damage Induced Autophagy, Cell Death, and Disease. Front. Biosci.-Landmark 2016, 21, 42–54. [Google Scholar] [CrossRef]
- Wu, C.C.; Lin, J.L.J.; Yang-Yen, H.F.; Yuan, H.S. A Unique Exonuclease ExoG Cleaves between RNA and DNA in Mitochondrial DNA Replication. Nucleic Acids Res. 2019, 47, 5405–5419. [Google Scholar] [CrossRef] [PubMed]
- Karlowicz, A.; Dubiel, A.B.; Czerwinska, J.; Bledea, A.; Purzycki, P.; Grzelewska, M.; McAuley, R.J.; Szczesny, R.J.; Brzuska, G.; Krol, E.; et al. In Vitro Reconstitution Reveals a Key Role of Human Mitochondrial EXOG in RNA Primer Processing. Nucleic Acids Res. 2022, 50, 7991–8007. [Google Scholar] [CrossRef]
- National Center for Biotechnology Information (NCBI); National Library of Medicine; National Institutes of Health. Department of Health and Human Services Variation Viewer. Available online: https://www.ncbi.nlm.nih.gov/variation/view/ (accessed on 22 August 2020).
- Kalifa, L.; Beutner, G.; Phadnis, N.; Sheu, S.S.; Sia, E.A. Evidence for a Role of FEN1 in Maintaining Mitochondrial DNA Integrity. DNA Repair 2009, 8, 1242–1249. [Google Scholar] [CrossRef] [PubMed]
- Duxin, J.P.; Dao, B.; Martinsson, P.; Rajala, N.; Guittat, L.; Campbell, J.L.; Spelbrink, J.N.; Stewart, S.A. Human Dna2 Is a Nuclear and Mitochondrial DNA Maintenance Protein. Mol. Cell. Biol. 2009, 29, 4274–4282. [Google Scholar] [CrossRef]
- Pedersen, Z.O.; Holm-Yildiz, S.; Dysgaard, T. Nutritional Interventions for Patients with Mitochondrial POLG-Related Diseases: A Systematic Review on Efficacy and Safety. Int. J. Mol. Sci. 2022, 23, 10658. [Google Scholar] [CrossRef] [PubMed]
- Tzoulis, C.; Tran, G.T.; Coxhead, J.; Bertelsen, B.; Lilleng, P.K.; Balafkan, N.; Payne, B.; Miletic, H.; Chinnery, P.F.; Bindoff, L.A. Molecular Pathogenesis of Polymerase Gamma-Related Neurodegeneration. Ann. Neurol. 2014, 76, 66–81. [Google Scholar] [CrossRef] [PubMed]
- Kaguni, L.S. DNA Polymerase γ, the Mitochondrial Replicase. Annu. Rev. Biochem. 2004, 73, 293–320. [Google Scholar] [CrossRef] [PubMed]
- Park, J.; Baruch-Torres, N.; Yin, Y.W. Structural and Molecular Basis for Mitochondrial DNA Replication and Transcription in Health and Antiviral Drug Toxicity. Molecules 2023, 28, 1796. [Google Scholar] [CrossRef]
- Zhao, L. Mitochondrial DNA Degradation: A Quality Control Measure for Mitochondrial Genome Maintenance and Stress Response. Enzymes 2019, 45, 311–341. [Google Scholar] [CrossRef]
- Graziewicz, M.A.; Longley, M.J.; Copeland, W.C. DNA Polymerase γ in Mitochondrial DNA Replication and Repair. Chem. Rev. 2006, 106, 383–405. [Google Scholar] [CrossRef]
- Rahman, S.; Copeland, W.C. POLG-Related Disorders and Their Neurological Manifestations. Nat. Rev. Neurol. 2019, 15, 40–52. [Google Scholar] [CrossRef]
- Peeva, V.; Blei, D.; Trombly, G.; Corsi, S.; Szukszto, M.J.; Rebelo-Guiomar, P.; Gammage, P.A.; Kudin, A.P.; Becker, C.; Altmüller, J.; et al. Linear Mitochondrial DNA Is Rapidly Degraded by Components of the Replication Machinery. Nat. Commun. 2018, 9, 1727. [Google Scholar] [CrossRef]
- Bruni, F.; Lightowlers, R.N.; Chrzanowska-Lightowlers, Z.M. Human Mitochondrial Nucleases. FEBS J. 2017, 284, 1767–1777. [Google Scholar] [CrossRef]
- Li, L.Y.; Luo, X.; Wang, X. Endonuclease G Is an Apoptotic DNase When Released from Mitochondria. Nature 2001, 412, 95–99. [Google Scholar] [CrossRef] [PubMed]
- Ohsato, T.; Ishihara, N.; Muta, T.; Umeda, S.; Ikeda, S.; Mihara, K.; Hamasaki, N.; Kang, D. Mammalian Mitochondrial Endonuclease G: Digestion of R-Loops and Localization in Intermembrane Space. Eur. J. Biochem. 2002, 269, 5765–5770. [Google Scholar] [CrossRef] [PubMed]
- Zhou, Q.; Li, H.; Li, H.; Nakagawa, A.; Lin, J.L.J.; Lee, E.S.; Harry, B.L.; Skeen-Gaar, R.R.; Suehiro, Y.; William, D.; et al. Mitochondrial Endonuclease G Mediates Breakdown of Paternal Mitochondria upon Fertilization. Science 2016, 353, 394–399. [Google Scholar] [CrossRef]
- Yan, C.; Duanmu, X.; Zeng, L.; Liu, B.; Song, Z. Mitochondrial DNA: Distribution, Mutations, and Elimination. Cells 2019, 8, 379. [Google Scholar] [CrossRef] [PubMed]
- Côté, J.; Ruiz-Carrillo, A. Primers for Mitochondrial DNA Replication Generated by Endonuclease G. Science 1993, 261, 765–769. [Google Scholar] [CrossRef]
- David, K.K.; Sasaki, M.; Yu, S.W.; Dawson, T.M.; Dawson, V.L. EndoG Is Dispensable in Embryogenesis and Apoptosis. Cell Death Differ. 2006, 13, 1147–1155. [Google Scholar] [CrossRef] [PubMed]
- Irvine, R.A.; Adachi, N.; Shibata, D.K.; Cassell, G.D.; Yu, K.; Karanjawala, Z.E.; Hsieh, C.-L.; Lieber, M.R. Generation and Characterization of Endonuclease G Null Mice. Mol. Cell. Biol. 2005, 25, 294–302. [Google Scholar] [CrossRef]
- Wang, W.; Li, J.; Tan, J.; Wang, M.; Yang, J.; Zhang, Z.M.; Li, C.; Basnakian, A.G.; Tang, H.W.; Perrimon, N.; et al. Endonuclease G Promotes Autophagy by Suppressing MTOR Signaling and Activating the DNA Damage Response. Nat. Commun. 2021, 12, 476. [Google Scholar] [CrossRef]
- Wiehe, R.S.; Gole, B.; Chatre, L.; Walther, P.; Calzia, E.; Ricchetti, M.; Wiesmüller, L. Endonuclease G Promotes Mitochondrial Genome Cleavage and Replication. Oncotarget 2018, 9, 18309–18326. [Google Scholar] [CrossRef] [PubMed]
- Büttner, S.; Habernig, L.; Broeskamp, F.; Ruli, D.; Nora Vögtle, F.; Vlachos, M.; Macchi, F.; Küttner, V.; Carmona-Gutierrez, D.; Eisenberg, T.; et al. Endonuclease G Mediates α-Synuclein Cytotoxicity during Parkinson’s Disease. EMBO J. 2013, 32, 3041–3054. [Google Scholar] [CrossRef] [PubMed]
- McDermott-Roe, C.; Ye, J.; Ahmed, R.; Sun, X.M.; Serafín, A.; Ware, J.; Bottolo, L.; Muckett, P.; Cañas, X.; Zhang, J.; et al. Endonuclease G Is a Novel Determinant of Cardiac Hypertrophy and Mitochondrial Function. Nature 2011, 478, 114–118. [Google Scholar] [CrossRef]
- Pardo, R.; Blasco, N.; Vilà, M.; Beiroa, D.; Nogueiras, R.; Cañas, X.; Simó, R.; Sanchis, D.; Villena, J.A. EndoG Knockout Mice Show Increased Brown Adipocyte Recruitment in White Adipose Tissue and Improved Glucose Homeostasis. Endocrinology 2016, 157, 3873–3887. [Google Scholar] [CrossRef] [PubMed]
- Czarny, P.; Białek, K.; Ziółkowska, S.; Strycharz, J.; Barszczewska, G.; Sliwinski, T. The Importance of Epigenetics in Diagnostics and Treatment of Major Depressive Disorder. J. Pers. Med. 2021, 11, 167. [Google Scholar] [CrossRef]
- Demyttenaere, K.; De Fruyt, J. Getting What You Ask for: On the Selectivity of Depression Rating Scales. Psychother. Psychosom. 2003, 72, 61–70. [Google Scholar] [CrossRef]
- Upadhya, S.; Liu, H.; Luo, S.; Lutz, M.W.; Chiba-Falek, O. Polygenic Risk Score Effectively Predicts Depression Onset in Alzheimer’s Disease Based on Major Depressive Disorder Risk Variants. Front. Neurosci. 2022, 16, 827447. [Google Scholar] [CrossRef]
- Cao, Z.; Yang, H.; Ye, Y.; Zhang, Y.; Li, S.; Zhao, H.; Wang, Y. Polygenic Risk Score, Healthy Lifestyles, and Risk of Incident Depression. Transl. Psychiatry 2021, 11, 189. [Google Scholar] [CrossRef]
- Langaee, T.; Shin, J. The Genetics Basis of Pharmacogenomics. In Concepts in Pharmacogenomics; Zdanowicz, M.M., Ed.; Bethesda, American Society of Health-System Pharmacists: Rockville, MD, USA, 2010; p. 29. ISBN 978-1-58528-234-0. [Google Scholar]
- Nadeau, J.H. Single Nucleotide Polymorphisms: Tackling Complexity. Nature 2002, 420, 517–518. [Google Scholar] [CrossRef]
- World Health Organization. International Statistical Classification of Diseases and Related Health Problems, 10th Revision, 5th ed.; World Health Organization: Geneva, Switzerland, 2015. [Google Scholar]
- Patten, S.B.; Brandon-Christie, J.; Devji, J.; Sedmak, B. Performance of the Composite International Diagnostic Interview Short Form for Major Depression in a Community Sample. Chronic Dis. Can. 2000, 21, 68–72. [Google Scholar]


| Genotype /Allele | Control (n = 261) | Depression (n = 277) | Crude OR (95% CI) | p | Adjusted OR (95% CI) * | p | ||
|---|---|---|---|---|---|---|---|---|
| Number | Frequency | Number | Frequency | |||||
| EXOG c.-188T > G (rs9838614) | ||||||||
| T/T | 31 | 0.119 | 41 | 0.148 | 1.289 (0.781–2.126) | 0.320 | 1.293 (0.783–2.133) | 0.315 |
| T/G | 195 | 0.747 | 222 | 0.801 | 1.366 (0.910–2.051) | 0.132 | 1.366 (0.910–2.051) | 0.132 |
| G/G | 35 | 0.134 | 14 | 0.051 | 0.344 (0.180–0.655) & 0.338 (0.172–0.664) | 0.001 0.002 | 0.342 (0.179–0.652) & 0.330 (0.168–0.649) | 0.001 0.0015 |
| χ2 = 11.672; p = 0.003 | ||||||||
| T | 257 | 0.492 | 304 | 0.549 | 1.677 (1.158–2.428) & 1.678 (1.164–2.420) | 0.006 0.006 | 1.684 (1.162–2.439) & 1.680 (1.151–2.452) | 0.006 0.008 |
| G | 265 | 0.508 | 250 | 0.451 | 0.596 (0.412–0.863) & 0.595 (0.408–0.870) | 0.006 0.008 | 0.594 (0.410–0.860) & 0.586 (0.399–0.862) | 0.006 0.007 |
| EXOG c.*627G > A (rs1065800) | ||||||||
| G/G | 75 | 0.287 | 14 | 0.051 | 0.132 (0.072–0.241) & 0.127 (0.069- 0.237) | <0.001 <0.001 | 0.131 (0.072–0.240) & 0.126 (0.066–0.239) | <0.001 <0.001 |
| G/A | 147 | 0.563 | 230 | 0.830 | 3.795 (2.549–5.649) & 3.841(2.593–5.689) | <0.001 <0.001 | 3.809 (2.558–5.672) & 3.836 (2.581–5.701) | <0.001 <0.001 |
| A/A | 39 | 0.149 | 33 | 0.119 | 0.770 (0.468–1.267) | 0.303 | 0.769 (0.467–1.265) | 0.301 |
| χ2 = 60.160; p < 0.001 | ||||||||
| G | 297 | 0.569 | 258 | 0.466 | 0.486 (0.349–0.676) & 0.480 (0.340–0.678) | <0.001 <0.001 | 0.485 (0.349–0.675) & 0.479 (0.338–0.679) | <0.001 <0.001 |
| A | 225 | 0.431 | 296 | 0.534 | 2.058 (1.480–2.863) & 2.081 (1.472–2.942) | <0.001 <0.001 | 2.060 (1.481–2.865) & 2.061 (1.471–2.889) | <0.001 <0.0001 |
| POLG c.-1370T > A (rs1054875) | ||||||||
| T/T | 24 | 0.092 | 18 | 0.065 | 0.686 (0.363–1.296) | 0.246 | 0.685 (0.362–1.294) | 0.243 |
| T/A | 175 | 0.670 | 203 | 0.733 | 1.348 (0.930–1.953) | 0.114 | 1.350 (0.931–1.956) | 0.113 |
| A/A | 62 | 0.238 | 56 | 0.202 | 0.813 (0.540–1.224) | 0.322 | 0.813 (0.540–1.224) | 0.321 |
| χ2 = 2.763; p = 0.251 | ||||||||
| T | 223 | 0.427 | 239 | 0.431 | 1.031 (0.748–1.421) | 0.853 | 1.030 (0.747–1.420) | 0.855 |
| A | 299 | 0.573 | 315 | 0.569 | 0.970 (0.704–1.337) | 0.853 | 0.970 (0.704–1.338) | 0.855 |
| ENDOG c.-394T > C (rs2977998) | ||||||||
| C/C | 162 | 0.621 | 158 | 0.570 | 0.811 (0.575–1.146) | 0.235 | 0.811 (0.575–1.146) | 0.235 |
| C/T | 90 | 0.345 | 98 | 0.354 | 1.040 (0.730–1.483) | 0.827 | 1.039 (0.729–1.482) | 0.831 |
| T/T | 9 | 0.034 | 21 | 0.076 | 2.297 (1.032–5.112) & 2.365 (1.006–5.563) | 0.042 0.049 | 2.305 (1.035–5.131) & 2.330 (0.989–5.487) | 0.041 0.053 |
| χ2 = 4.719; p = 0.094 | ||||||||
| C | 414 | 0.793 | 414 | 0.747 | 0.774 (0.582–1.029) | 0.078 | 0.773 (0.582–1.028) | 0.077 |
| T | 108 | 0.207 | 140 | 0.253 | 1.292 (0.972–1.718) | 0.078 | 1.293 (0.972–1.719) | 0.077 |
| ENDOG c.-220C > T (rs2997922) | ||||||||
| C/C | 155 | 0.594 | 140 | 0.505 | 0.699 (0.497–0.983) & 0.702 (0.494–0.998) | 0.040 0.049 | 0.700 (0.498–0.986) & 0.702 (0.502–0.983) | 0.041 0.039 |
| C/T | 94 | 0.360 | 103 | 0.372 | 1.052 (0.740–1.494) | 0.779 | 1.048 (0.737–1.490) | 0.795 |
| T/T | 12 | 0.046 | 34 | 0.123 | 2.903 (1.469–5.739) & 3.006 (1.527–5.917) | 0.002 0.001 | 2.912 (1.473–5.757) & 2.989 (1.452–6.155) | 0.002 0.003 |
| χ2 = 11.230; p = 0.004 | ||||||||
| C | 404 | 0.774 | 383 | 0.691 | 0.670 (0.513–0.875) & 0.666 (0.514–0.864) | 0.003 0.002 | 0.671 (0.513–0.876) & 0.666 (0.510–0.871) | 0.003 0.003 |
| T | 118 | 0.226 | 171 | 0.309 | 1.493 (1.142–1.950) & 1.493 (1.142–1.952) | 0.003 0.003 | 1.491 (1.141–1.948) & 1.496 (1.154–1.941) | 0.003 0.002 |
| Haplotype | Control (n = 261) | Depression (n = 277) | Crude OR (95% CI) | p | ||
|---|---|---|---|---|---|---|
| Number | Frequency | Number | Frequency | |||
| EXOG c.-188T > G (rs9838614) and c.*627G > A (rs1065800) | ||||||
| TA | 153 | 0.293 | 252 | 0.454 | 2.012 (1.564–2.589) | <0.001 |
| GG | 193 | 0.369 | 206 | 0.371 | 1.009 (0.787–1.292) | 0.942 |
| TG | 104 | 0.199 | 52 | 0.093 | 0.416 (0.291–0.595) | <0.001 |
| GA | 72 | 0.137 | 44 | 0.079 | 0.539 (0.362–0.801) | 0.001 |
| ENDOG c.-394T > C (rs2977998) and c.-220C > T (rs2997922) | ||||||
| CC | 380 | 0.727 | 359 | 0.648 | 0.687 (0.530–0.892) | 0.005 |
| TC | 24 | 0.045 | 24 | 0.043 | 0.739 (0.553–0.987) | 0.040 |
| CT | 34 | 0.065 | 55 | 0.099 | 1.581 (1.013–2.469) | 0.046 |
| TT | 84 | 0.160 | 116 | 0.209 | 1.380 (1.012–1.883) | 0.041 |
| Genotype /Allele | Control (n = 261) | Early Onset Depression (n = 129) | Crude OR (95% CI) | p | Adjusted OR (95% CI) * | p | Late-Onset Depression (n = 132) | Crude OR (95% CI) | p | Adjusted OR (95% CI) * | p | |||
|---|---|---|---|---|---|---|---|---|---|---|---|---|---|---|
| Number | Frequency | Number | Frequency | Number | Frequency | |||||||||
| EXOG c.-188T > G (rs9838614) | ||||||||||||||
| T/T | 31 | 0.119 | 21 | 0.163 | 1.443 (0.792–2.627) | 0.231 | 1.456 (0.799–2.654) | 0.220 | 17 | 0.129 | 1.097 (0.583–2.064) | 0.775 | 1.094 (0.581–2.061) | 0.780 |
| T/G | 195 | 0.747 | 100 | 0.775 | 1.167 (0.709–1.922) | 0.544 | 1.169 (0.710–1.926) | 0.540 | 109 | 0.826 | 1.604 (0.945–2.723) | 0.080 | 1.593 (0.937–2.706) | 0.085 |
| G/G | 35 | 0.134 | 8 | 0.062 | 0.427 (0.192–0.949) | 0.037 | 0.420 (0.189–0.936) | 0.034 | 6 | 0.045 | 0.307 (0.126–0.751) | 0.010 | 0.311 (0.127–0.762) | 0.011 |
| & 0.403 (0.171–0.953) | 0.038 | & 0.393 (0.163–0.946) | 0.037 | & 0.301 (0.116–0.778) | 0.013 | & 0.299 (0.112–0.805) | 0.017 | |||||||
| χ2 = 5.413; p = 0.067 | χ2 = 7.376; p = 0.025 | |||||||||||||
| T | 257 | 0.492 | 142 | 0.550 | 1.623 (1.048–2.513) | 0.030 | 1.641 (1.059–2.543) | 0.027 | 143 | 0.542 | 1.555 (0.993–2.433) | 0.054 | 1.545 (0.986–2.421) | 0.058 |
| & 1.649 (1.053–2.583) | 0.029 | & 1.644 (1.068–2.533) | 0.024 | & 1.553(1.017–2.370) | 0.041 | & 1.547 (1.001–2.394) | 0.049 | |||||||
| G | 265 | 0.508 | 116 | 0.450 | 0.616 (0.398–0.954) | 0.030 | 0.610 (0.393–0.945) | 0.027 | 121 | 0.458 | 0.643 (0.411–1.007) | 0.054 | 0.647 (0.413–1.014) | 0.058 |
| & 0.612 (0.397–0.942) | 0.026 | & 0.604 (0.389–0.941) | 0.026 | & 0.635 (0.404–0.999) | 0.050 | & 0.639 (0.422–0.969) | 0.035 | |||||||
| EXOG c.*627G > A (rs1065800) | ||||||||||||||
| G/G | 75 | 0.287 | 5 | 0.039 | 0.100 (0.039–0.254) | <0.001 | 0.099 (0.039–0.251) | <0.001 | 9 | 0.068 | 0.181 (0.088–0.376) | <0.001 | 0.182 (0.088–0.378) | <0.001 |
| & 0.091 (0.030–0.277) | <0.001 | & 0.083 (0.028–0.253) | <0.001 | & 0.175 (0.080–0.381) | <0.0001 | & 0.170 (0.076–0.377) | <0.0001 | |||||||
| G/A | 147 | 0.563 | 107 | 0.829 | 3.772 (2.243–6.344) | <0.001 | 3.793 (2.254–6.385) | <0.001 | 108 | 0.818 | 3.490 (2.105–5.785) | <0.001 | 3.472 (2.093–5.761) | <0.001 |
| & 3.829 (2.212–6.629) | <0.001 | & 3.838 (2.182–6.750) | <0.001 | & 3.582 (2.124–6.038) | <0.0001 | & 3.561 (2.141–5.923) | <0.0001 | |||||||
| A/A | 39 | 0.149 | 17 | 0.132 | 0.864 (0.468–1.595) | 0.640 | 0.867 (0.470–1.603) | 0.650 | 15 | 0.114 | 0.730 (0.386–1.379) | 0.332 | 0.737 (0.390–1.393) | 0.347 |
| χ2 = 35.592; p < 0.001 | χ2 = 29.302; p < 0.001 | |||||||||||||
| G | 297 | 0.569 | 117 | 0.453 | 0.500 (0.343–0.730) | <0.001 | 0.497 (0.340–0.726) | <0.001 | 126 | 0.477 | 0.581 (0.402–0.840) | 0.004 | 0.580 (0.401–0.839) | 0.004 |
| & 0.492 (0.352–0.689) | <0.001 | & 0.490 (0.349–0.688) | <0.001 | & 0.580 (0.418–0.805) | 0.001 | & 0.581 (0.419–0.804) | 0.001 | |||||||
| A | 225 | 0.431 | 141 | 0.547 | 2.000 (1.370–2.920) | <0.001 | 2.013 (1.378–2.942) | <0.001 | 138 | 0.523 | 1.720 (1.191–2.485) | 0.004 | 1.723 (1.192–2.491) | 0.004 |
| & 2.023 (1.464–2.797) | <0.001 | & 2.025 (1.459–2.812) | <0.001 | & 1.729 (1.251–2.390) | <0.001 | & 1.739 (1.249–2.422) | 0.001 | |||||||
| POLG c.-1370T > A (rs1054875) | ||||||||||||||
| T/T | 24 | 0.092 | 5 | 0.039 | 0.398 (0.148–1.069) | 0.068 | 0.398 (0.148–1.069) | 0.068 | 11 | 0.083 | 0.898 (0.426–1.894) | 0.777 | 0.901 (0.427–1.901) | 0.783 |
| T/A | 175 | 0.670 | 94 | 0.729 | 1.320 (0.828–2.103) | 0.243 | 1.315 (0.825–2.097) | 0.250 | 100 | 0.758 | 1.536 (0.959–2.468) | 0.076 | 1.537 (0.956–2.471) | 0.076 |
| A/A | 62 | 0.238 | 30 | 0.233 | 0.973 (0.591–1.601) | 0.913 | 0.977 (0.594–1.609) | 0.928 | 21 | 0.159 | 0.607 (0.352–1.049) | 0.074 | 0.606 (0.350–1.046) | 0.072 |
| χ2 = 3.718; p = 0.156 | χ2 = 3.578; p = 0.167 | |||||||||||||
| T | 223 | 0.427 | 104 | 0.403 | 0.844 (0.568–1.254) | 0.401 | 0.841 (0.566–1.251) | 0.393 | 122 | 0.462 | 1.279 (0.862–1.899) | 0.222 | 1.283 (0.864–1.905) | 0.217 |
| A | 299 | 0.573 | 154 | 0.597 | 1.185 (0.797–1.761) | 0.401 | 1.189 (0.800–1.768) | 0.393 | 142 | 0.538 | 0.782 (0.526–1.161) | 0.222 | 0.780 (0.525–1.158) | 0.217 |
| ENDOG c.-394T > C (rs2977998) | ||||||||||||||
| C/C | 162 | 0.621 | 76 | 0.589 | 0.876 (0.570–1.348) | 0.548 | 0.872 (0.567–1.343) | 0.535 | 76 | 0.576 | 0.829 (0.542–1.270) | 0.390 | 0.831 (0.543–1.273) | 0.395 |
| C/T | 90 | 0.345 | 43 | 0.333 | 0.950 (0.608–1.484) | 0.822 | 0.948 (0.607–1.482) | 0.816 | 46 | 0.348 | 1.016 (0.655–1.577) | 0.943 | 1.013 (0.652–1.573) | 0.955 |
| T/T | 9 | 0.034 | 10 | 0.078 | 2.353 (0.932–5.943) | 0.070 | 2.439 (0.961–6.187) | 0.061 | 10 | 0.076 | 2.295 (0.909–5.794) | 0.079 | 2.310 (0.914–5.836) | 0.077 |
| χ2 = 3.456; p = 0.178 | χ2 = 3.385; p = 0.184 | |||||||||||||
| C | 414 | 0.793 | 195 | 0.756 | 0.808 (0.567–1.152) | 0.238 | 0.801 (0.562–1.144) | 0.222 | 198 | 0.750 | 0.781 (0.550–1.111) | 0.170 | 0.782 (0.550–1.112) | 0.171 |
| T | 108 | 0.207 | 63 | 0.244 | 1.238 (0.868–1.765) | 0.238 | 1.248 (0.874–1.781) | 0.222 | 66 | 0.250 | 1.280 (0.900–1.820) | 0.170 | 1.279 (0.899–1.819) | 0.171 |
| ENDOG c.-220C > T (rs2997922) | ||||||||||||||
| C/C | 155 | 0.594 | 62 | 0.481 | 0.633 (0.414–0.968) | 0.035 | 0.638 (0.417–0.976) | 0.038 | 69 | 0.523 | 0.749 (0.491–1.142) | 0.179 | 0.743 (0.487–1.134) | 0.168 |
| & 0.635 (0.413–0.976) | 0.038 | & 0.642 (0.423–0.974) | 0.037 | |||||||||||
| C/T | 94 | 0.360 | 53 | 0.411 | 1.239 (0.804–1.909) | 0.331 | 1.225 (0.794–1.890) | 0.359 | 47 | 0.356 | 0.982 (0.635–1.520) | 0.936 | 0.989 (0.639–1.532) | 0.961 |
| T/T | 12 | 0.046 | 14 | 0.109 | 2.526 (1.133–5.634) | 0.024 | 2.564 (1.147–5.727) | 0.022 | 16 | 0.121 | 2.862 (1.312–6.245) | 0.008 | 2.869 (1.314–6.264) | 0.008 |
| & 2.569 (1.113–5.930) | 0.027 | & 2.566 (1.098–6.000) | 0.030 | & 2.890 (1.210–6.898) | 0.017 | & 2.896 (1.322–6.340) | 0.008 | |||||||
| χ2 = 7.645; p = 0.022 | χ2 = 7.747; p = 0.021 | |||||||||||||
| C | 404 | 0.774 | 177 | 0.686 | 0.638 (0.456–0.894) | 0.009 | 0.640 (0.457–0.896) | 0.009 | 185 | 0.701 | 0.694 (0.499–0.965) | 0.030 | 0.690 (0.496–0.960) | 0.028 |
| & 0.635 (0.448–0.899) | 0.011 | & 0.633 (0.444–0.901) | 0.011 | & 0.687 (0.490–0.964) | 0.030 | & 0.690 (0.491–0.970) | 0.033 | |||||||
| T | 118 | 0.226 | 81 | 0.314 | 1.567 (1.119–2.195) | 0.009 | 1.563 (1.116–2.190) | 0.009 | 79 | 0.299 | 1.441 (1.037–2.003) | 0.030 | 1.449 (1.042–2.015) | 0.028 |
| & 1.568 (1.112–2.211) | 0.010 | & 1.585 (1.128–2.229) | 0.008 | & 1.433 (1.038–2.004) | 0.030 | & 1.446 (1.038–2.014) | 0.030 | |||||||
| Genotype /Allele | Control (n = 261) | Moderate Depression (n = 130) | Crude OR (95% CI) | p | Adjusted OR (95% CI) * | p | Severe Depression (n = 132) | Crude OR (95% CI) | p | Adjusted OR (95% CI) * | p | |||
|---|---|---|---|---|---|---|---|---|---|---|---|---|---|---|
| Number | Frequency | Number | Frequency | Number | Frequency | |||||||||
| EXOG c.-188T > G (rs9838614) | ||||||||||||||
| T/T | 31 | 0.119 | 25 | 0.192 | 1.767 (0.994–3.140) | 0.053 | 1.762 (0.991–3.132) | 0.054 | 15 | 0.114 | 0.951 (0.494–1.832) | 0.881 | 0.954 (0.495–1.837) | 0.887 |
| & 1.778 (0.963–3.281) | 0.065 | & 1.778 (0.983–3.218) | 0.057 | |||||||||||
| T/G | 195 | 0.747 | 96 | 0.738 | 0.956 (0.591–1.545) | 0.853 | 0.953 (0.589–1.542) | 0.845 | 112 | 0.848 | 1.895 (1.092–3.290) | 0.023 | 1.900 (1.094–3.300) | 0.023 |
| & 1.923 (1.088–3.399) | 0.025 | & 1.929 (1.065–3.494) | 0.030 | |||||||||||
| G/G | 35 | 0.134 | 9 | 0.069 | 0.480 (0.223–1.032) | 0.060 | 0.483 (0.225–1.040) | 0.063 | 5 | 0.038 | 0.254 (0.0972–0.665) | 0.005 | 0.251 (0.096–0.659) | 0.005 |
| & 0.455 (0.199–1.043) | 0.063 | & 0.460 (0.208–1.020) | 0.056 | & 0.255 (0.096–0.677) | 0.006 | & 0.253 (0.096–0.671) | 0.006 | |||||||
| χ2 = 6.530; p = 0.038 | χ2 = 9.147; p = 0.010 | |||||||||||||
| T | 257 | 0.492 | 146 | 0.562 | 1.738 (1.132–2.669) | 0.011 | 1.733 (1.128–2.663) | 0.012 | 142 | 0.538 | 1.523 (0.967–2.401) | 0.070 | 1.531 (0.971–2.415) | 0.067 |
| & 1.726 (1.136–2.622) | 0.011 | & 1.748 (1.151–2.653) | 0.009 | |||||||||||
| G | 265 | 0.508 | 114 | 0.438 | 0.575 (0.375–0.883) | 0.011 | 0.577 (0.376–0.886) | 0.012 | 122 | 0.462 | 0.656 (0.416–1.035) | 0.070 | 0.653 (0.414–1.030) | 0.067 |
| & 0.570 (0.366–0.889) | 0.013 | & 0.583 (0.375–0.907) | 0.017 | |||||||||||
| EXOG c.*627G > A (rs1065800) | ||||||||||||||
| G/G | 75 | 0.287 | 7 | 0.054 | 0.141 (0.063–0.316) | <0.001 | 0.141 (0.063–0.317) | <0.001 | 6 | 0.045 | 0.118 (0.050–0.280) | <0.001 | 0.118 (0.050–0.279) | <0.001 |
| & 0.131 (0.053–0.324) | <0.001 | & 0.131 (0.053–0.328) | <0.001 | & 0.110 (0.044–0.276) | <0.0001 | & 0.107 (0.039–0.294) | <0.0001 | |||||||
| G/A | 147 | 0.563 | 109 | 0.838 | 4.025 (2.376–6.820) | <0.001 | 4.036 (2.377–6.850) | <0.001 | 107 | 0.811 | 3.319 (2.014–5.469) | <0.001 | 3.323 (2.017–5.477) | <0.001 |
| & 4.133 (2.378–7.183) | <0.001 | & 4.130 (2.404–7.095) | <0.001 | & 3.354 (2.076–5.419) | <0.0001 | & 3.358 (2.009–5.646) | <0.0001 | |||||||
| A/A | 39 | 0.149 | 14 | 0.108 | 0.687 (0.358–1.317) | 0.258 | 0.691 (0.360–1.325) | 0.266 | 19 | 0.144 | 0.957 (0.529–1.732) | 0.885 | 0.958 (0.529–1.734) | 0.887 |
| χ2 = 33.718; p < 0.001 | χ2 = 33.208; p = < 0.001 | |||||||||||||
| G | 297 | 0.569 | 123 | 0.473 | 0.561 (0.386–0.816) | 0.002 | 0.561 (0.385–0.816) | 0.002 | 119 | 0.451 | 0.497 (0.342–0.722) | <0.001 | 0.496 (0.342–0.721) | <0.001 |
| & 0.555 (0.401–0.769) | 0.0004 | & 0.556 (0.398–0.778) | 0.0006 | & 0.492 (0.347–0.697) | <0.0001 | & 0.489 (0.345–0.694) | <0.0001 | |||||||
| A | 225 | 0.431 | 137 | 0.527 | 1.783 (1.226–2.593) | 0.002 | 1.783 (1.226–2.594) | 0.002 | 145 | 0.549 | 2.012 (1.385–2.922) | <0.001 | 2.015 (1.387–2.927) | <0.001 |
| & 1.775 (1.273–2.475) | 0.0007 | & 1.802 (1.299–2.501) | 0.0004 | & 2.038 (1.467–2.831) | <0.0001 | & 2.033 (1.476–2.800) | <0.0001 | |||||||
| POLG c.-1370T > A (rs1054875) | ||||||||||||||
| T/T | 24 | 0.092 | 8 | 0.062 | 0.648 (0.283–1.484) | 0.304 | 0.648 (0.282–1.484) | 0.304 | 8 | 0.061 | 0.637 (0.278–1.460) | 0.287 | 0.636 (0.278–1.458) | 0.285 |
| T/A | 175 | 0.670 | 96 | 0.738 | 1.388 (0.868–2.217) | 0.171 | 1.391 (0.870–2.222) | 0.168 | 100 | 0.758 | 1.536 (0.956–2.468) | 0.076 | 1.537 (0.956–2.470) | 0.076 |
| A/A | 62 | 0.238 | 26 | 0.200 | 0.802 (0.479–1.344) | 0.403 | 0.800 (0.478–1.341) | 0.398 | 24 | 0.182 | 0.713 (0.421–1.207) | 0.208 | 0.713 (0.421–1.207) | 0.208 |
| χ2 = 2.103; p = 0.349 | χ2 = 3.252; p = 0.197 | |||||||||||||
| T | 223 | 0.427 | 112 | 0.431 | 1.025 (0.692–1.519) | 0.901 | 1.027 (0.693–1.522) | 0.895 | 116 | 0.439 | 1.091 (0.735–1.619) | 0.667 | 1.090 (0.734–1.619) | 0.668 |
| A | 299 | 0.573 | 148 | 0.569 | 0.975 (0.658–1.445) | 0.901 | 0.974 (0.657–1.433) | 0.895 | 148 | 0.561 | 0.917 (0.617–1.361) | 0.667 | 0.917 (0.618–1.362) | 0.668 |
| ENDOG c.-394T > C (rs2977998) | ||||||||||||||
| C/C | 162 | 0.621 | 78 | 0.600 | 0.917 (0.596–1.410) | 0.692 | 0.921 (0.598–1.418) | 0.708 | 73 | 0.553 | 0.756 (0.495–1.156) | 0.197 | 0.756 (0.495–1.156) | 0.197 |
| C/T | 90 | 0.345 | 47 | 0.362 | 1.076 (0.693–1.670) | 0.744 | 1.074 (0.692–1.667) | 0.752 | 45 | 0.341 | 0.983 (0.632–1.528) | 0.938 | 0.983 (0.632–1.528) | 0.939 |
| T/T | 9 | 0.034 | 5 | 0.038 | 1.120 (0.368–3.412) | 0.842 | 1.100 (0.360–3.365) | 0.867 | 14 | 0.106 | 3.322 (1.398–7.893) | 0.007 | 3.321 (1.397–7.891) | 0.007 |
| & 3.401 (1.312–8.816) | 0.012 | & 3.429 (1.351–8.706) | <0.01 | |||||||||||
| χ2 = 0.168; p = 0.919 | χ2 = 8.349; p = 0.015 | |||||||||||||
| C | 414 | 0.793 | 203 | 0.781 | 0.925 (0.638–1.343) | 0.683 | 0.930 (0.640–1.351) | 0.704 | 191 | 0.723 | 0.689 (0.490–0.969) | 0.032 | 0.689 (0.490–0.969) | 0.032 |
| & 0.696 (0.498–0.972) | 0.034 | & 0.692 (0.484–0.990) | 0.044 | |||||||||||
| T | 108 | 0.207 | 57 | 0.219 | 1.081 (0.745–1.568) | 0.683 | 1.075 (0.740–1.562) | 0.704 | 73 | 0.277 | 1.451 (1.032–2.040) | 0.032 | 1.451 (1.032–2.040) | 0.032 |
| & 1.446 (1.026–2.038) | 0.035 | & 1.446 (1.012–2.065) | 0.043 | |||||||||||
| ENDOG c.-220C > T (rs2997922) | ||||||||||||||
| C/C | 155 | 0.594 | 65 | 0.500 | 0.684 (0.448–1.044) | 0.079 | 0.683 (0.447–1.044) | 0.078 | 66 | 0.500 | 0.684 (0.449–1.042) | 0.077 | 0.686 (0.450–1.047) | 0.080 |
| C/T | 94 | 0.360 | 51 | 0.392 | 1.147 (0.744–1.769) | 0.535 | 1.152 (0.747–1.779) | 0.522 | 50 | 0.379 | 1.083 (0.703–1.670) | 0.717 | 1.079 (0.699–1.665) | 0.733 |
| T/T | 12 | 0.046 | 14 | 0.108 | 2.504 (1.123–5.584) | 0.025 | 2.486 (1.112–5.560) | 0.027 | 16 | 0.121 | 2.862 (1.312–6.245) | 0.008 | 2.853 (1.307–6.229) | 0.008 |
| & 2.499 (1.056–5.915) | 0.041 | & 2.4478 (1.028–5.972) | 0.043 | & 2.915 (1.289–6.595) | 0.010 | & 2.848 (1.240–6.543) | 0.013 | |||||||
| χ2 = 6.571; p = 0.037 | χ2 = 8.421; p = 0.015 | |||||||||||||
| C | 404 | 0.774 | 181 | 0.696 | 0.672 (0.480–0.939) | 0.020 | 0.673 (0.481–0.941) | 0.021 | 182 | 0.689 | 0.656 (0.471–0.912) | 0.012 | 0.657 (0.472–0.914) | 0.013 |
| & 0.671 (0.474–0.948) | 0.024 | & 0.672 (0.475–0.951) | 0.025 | & 0.652 (0.466–0.913) | 0.013 | & 0.655 (0.474–0.906) | 0.010 | |||||||
| T | 118 | 0.226 | 79 | 0.304 | 1.489 (1.065–2.082) | 0.020 | 1.486 (1.063–2.079) | 0.021 | 82 | 0.311 | 1.525 (1.097–2.122) | 0.012 | 1.523 (1.094–2.120) | 0.013 |
| & 1.483 (1.052–2.088) | 0.024 | & 1.489 (1.046–2.120) | 0.027 | & 1.531 (1.097–2.137) | 0.012 | & 1.532 (1.093–2.147) | 0.013 | |||||||
| Genotype /Allele | Moderate Depression (n = 130) | Severe Depression (n = 132) | Crude OR (95% CI) | p | Adjusted OR (95% CI) * | p | ||
|---|---|---|---|---|---|---|---|---|
| Number | Frequency | Number | Frequency | |||||
| EXOG c.-188T > G (rs9838614) | ||||||||
| T/T | 25 | 0.192 | 15 | 0.114 | 0.538 (0.269–1.076) | 0.080 | 0.538 (0.269–1.076) | 0.080 |
| & 0.515 (0.247–1.073) | 0.076 | 0.526 (0.258–1.072) | 0.077 | |||||
| T/G | 96 | 0.738 | 112 | 0.848 | 1.983 (1.071–3.672) | 0.029 | 1.977 (1.067–3.662) | 0.030 |
| & 2.065 (1.082–3.940) | 0.028 | & 2.019 (1.090–3.736) | 0.025 | |||||
| G/G | 9 | 0.069 | 5 | 0.038 | 0.529 (0.172–1.624) | 0.266 | 0.535 (0.174–1.643) | 0.275 |
| χ2 = 4.859; p = 0.088 | ||||||||
| T | 146 | 0.562 | 142 | 0.538 | 0.785 (0.453–1.361) | 0.388 | 0.783 (0.451–1.357) | 0.383 |
| G | 114 | 0.438 | 122 | 0.462 | 1.274 (0.735–2.209) | 0.388 | 1.278 (0.737–2.216) | 0.383 |
| EXOG c.*627G > A (rs1065800) | ||||||||
| G/G | 7 | 0.054 | 6 | 0.045 | 0.837 (0.273–2.560) | 0.755 | 0.832 (0.272–2.548) | 0.747 |
| G/A | 109 | 0.838 | 107 | 0.811 | 0.825 (0.435–1.562) | 0.554 | 0.827 (0.437–1.567) | 0.560 |
| A/A | 14 | 0.108 | 19 | 0.144 | 1.393 (0.666–2.912) | 0.378 | 1.391 (0.665–2.909) | 0.381 |
| χ2 = 0.838; p = 0.658 | ||||||||
| G | 123 | 0.473 | 119 | 0.451 | 0.768 (0.424–1.389) | 0.382 | 0.767 (0.424–1.388) | 0.381 |
| A | 137 | 0.527 | 145 | 0.549 | 1.303 (0.720–2.357) | 0.382 | 1.304 (0.720–2.359) | 0.381 |
| POLG c.-1370T > A (rs1054875) | ||||||||
| T/T | 8 | 0.062 | 8 | 0.061 | 0.984 (0.358–2.705) | 0.975 | 0.974 (0.354–2.682) | 0.960 |
| T/A | 96 | 0.738 | 100 | 0.758 | 1.107 (0.633–1.934) | 0.722 | 1.120 (0.640–1.961) | 0.691 |
| A/A | 26 | 0.200 | 24 | 0.182 | 0.889 (0.480–1.647) | 0.708 | 0.879 (0.474–1.631) | 0.683 |
| χ2 = 0.146; p = 0.929 | ||||||||
| T | 112 | 0.431 | 116 | 0.439 | 1.076 (0.653–1.774) | 0.773 | 1.081 (0.656–1.784) | 0.759 |
| A | 148 | 0.569 | 148 | 0.561 | 0.929 (0.564–1.532) | 0.773 | 0.925 (0.561–1.525) | 0.759 |
| ENDOG c.-394T > C (rs2977998) | ||||||||
| C/C | 78 | 0.600 | 73 | 0.553 | 0.825 (0.505–1.347) | 0.442 | 0.830 (0.508–1.358) | 0.459 |
| C/T | 47 | 0.362 | 45 | 0.341 | 0.913 (0.550–1.517) | 0.727 | 0.902 (0.542–1.501) | 0.691 |
| T/T | 5 | 0.038 | 14 | 0.106 | 2.966 (1.036–8.490) | 0.043 | 3.020 (1.053–8.664) | 0.040 |
| & 2.948 (0.993–8.753) | 0.051 | & 3.003 (1.007–8.960) | 0.049 | |||||
| χ2 = 4.457; p = 0.108 | ||||||||
| C | 203 | 0.781 | 191 | 0.723 | 0.746 (0.505–1.102) | 0.142 | 0.748 (0.506–1.105) | 0.144 |
| T | 57 | 0.219 | 73 | 0.277 | 1.340 (0.907–1.979) | 0.142 | 1.337 (0.905–1.975) | 0.144 |
| ENDOG c.-220C > T (rs2997922) | ||||||||
| C/C | 65 | 0.500 | 66 | 0.500 | 1.000 (0.616–1.623) | 1.000 | 1.014 (0.623–1.650) | 0.955 |
| C/T | 51 | 0.392 | 50 | 0.379 | 0.945 (0.574–1.554) | 0.822 | 0.859 (0.529–1.394) | 0.537 |
| T/T | 14 | 0.108 | 16 | 0.121 | 1.143 (0.533–2.449) | 0.731 | 1.158 (0.539–2.484) | 0.707 |
| χ2 = 0.136; p = 0.934 | ||||||||
| C | 181 | 0.696 | 182 | 0.689 | 0.971 (0.681–1.385) | 0.873 | 0.976 (0.684–1.393) | 0.894 |
| T | 79 | 0.304 | 82 | 0.311 | 1.029 (0.722–1.468) | 0.873 | 1.025 (0.718–1.462) | 0.894 |
| Genotype /Allele | Control (n = 261) | Cured Depression (n = 167) | Crude OR (95% CI) | p | Adjusted OR (95% CI) * | p | Uncured Depression (n = 95) | Crude OR (95% CI) | p | Adjusted OR (95% CI) * | p | |||
|---|---|---|---|---|---|---|---|---|---|---|---|---|---|---|
| Number | Frequency | Number | Frequency | Number | Frequency | |||||||||
| EXOG c.-188T > G (rs9838614) | ||||||||||||||
| T/T | 31 | 0.119 | 26 | 0.156 | 1.368 (0.780–2.399) | 0.274 | 1.380 (0.786–2.424) | 0.262 | 14 | 0.147 | 1.282 (0.650–2.531) | 0.473 | 1.287 (0.652–2.542) | 0.467 |
| T/G | 195 | 0.747 | 134 | 0.802 | 1.374 (0.857–2.204) | 0.187 | 1.372 (0.855–2.200) | 0.190 | 74 | 0.779 | 1.193 (0.682–2.086) | 0.537 | 1.176 (0.671–2.060) | 0.572 |
| G/G | 35 | 0.134 | 7 | 0.042 | 0.283 (0.122–0.652) | 0.003 | 0.280 (0.121–0.647) | 0.003 | 7 | 0.042 | 0.514 (0.220–1.199) | 0.124 | 0.524 (0.224–1.226) | 0.136 |
| & 0.269 (0.110–0.658) | 0.0041 | & 0.264 (0.103–0.679) | 0.005 | |||||||||||
| χ2 = 10.266; p = 0.006 | χ2 = 2.699; p = 0.259 | |||||||||||||
| T | 257 | 0.492 | 186 | 0.557 | 1.774 (1.167–2.696) | 0.007 | 1.790 (1.176–2.725) | 0.007 | 102 | 0.537 | 0.514 (0.220–1.199) | 0.124 | 1.435 (0.886–2.323) | 0.142 |
| & 1.780 (1.183–2.680) | 0.006 | & 1.817 (1.218–2.711) | 0.003 | |||||||||||
| G | 265 | 0.508 | 148 | 0.443 | 0.564 (0.371–0.857) | 0.007 | 0.559 (0.367–0.850) | 0.007 | 88 | 0.463 | 0.693 (0.429–1.120) | 0.134 | 0.697 (0.431–1.128) | 0.142 |
| & 0.559 (0.369–0.849) | 0.006 | & 0.552 (0.365–0.835) | <0.005 | |||||||||||
| EXOG c.*627G > A (rs1065800) | ||||||||||||||
| G/G | 75 | 0.287 | 6 | 0.036 | 0.092 (0.039–0.218) | <0.001 | 0.091 (0.039–0.215) | <0.001 | 7 | 0.074 | 0.197 (0.087–0.446) | <0.001 | 0.198 (0.088–0.448) | <0.001 |
| & 0.076 (0.010–0.559) | 0.011 | & 0.078 (0.015–0.394) | 0.002 | & 0.183 (0.077–0.434) | 0.0001 | & 0.166 (0.063–0.432) | 0.0002 | |||||||
| G/A | 147 | 0.563 | 143 | 0.856 | 4.621 (2.812–7.594) | <0.001 | 4.720 (2.864–7.778) | <0.001 | 73 | 0.768 | 2.573 (1.506–4.397) | <0.001 | 2.567 (1.502–4.388) | <0.001 |
| & 4.720 (2.845–7.831) | <0.0001 | & 4.843 (2.914–8.050) | <0.0001 | & 2.607 (1.519–4.474) | <0.0001 | & 2.632 (1.518–4.566) | <0.0001 | |||||||
| A/A | 39 | 0.149 | 18 | 0.108 | 0.688 (0.379–1.248) | 0.218 | 0.682 (0.376–1.240) | 0.210 | 15 | 0.158 | 1.067 (0.558–2.040) | 0.844 | 1.065 (0.557–2.036) | 0.850 |
| χ2 = 48.252; p < 0.001 | χ2 = 18.584; p < 0.001 | |||||||||||||
| G | 297 | 0.569 | 155 | 0.464 | 0.506 (0.352–0.727) | <0.001 | 0.506 (0.352–0.727) | <0.001 | 87 | 0.458 | 0.547(0.368–0.813) | 0.003 | 0.548(0.369–0.815) | 0.003 |
| & 0.499 (0.353–0.705) | <0.0001 | & 0.503 (0.360–0.703) | <0.0001 | & 0.546 (0.386–0.771) | 0.0006 | & 0.542 (0.378–0.776) | <0.001 | |||||||
| A | 225 | 0.431 | 179 | 0.536 | 1.977 (1.375–2.842) | <0.001 | 1.977 (1.375–2.842) | <0.001 | 103 | 0.542 | 1.829 (1.230–2.719) | 0.003 | 1.825 (1.227–2.714) | 0.003 |
| & 1.986 (1.414–2.790) | <0.0001 | & 2.001 (1.438–2.785) | <0.0001 | & 1.832 (1.288–2.607) | 0.0008 | & 1.867 (1.315–2.650) | <0.0005 | |||||||
| POLG c.-1370T > A (rs1054875) | ||||||||||||||
| T/T | 24 | 0.092 | 9 | 0.054 | 0.563 (0.255–1.242) | 0.155 | 0.562 (0.255–1.242) | 0.154 | 7 | 0.074 | 0.786 (0.327–1.888) | 0.589 | 0.788 (0.328–1.896) | 0.595 |
| T/A | 175 | 0.670 | 131 | 0.784 | 1.788 (1.140–2.805) | 0.011 | 1.785 (1.137–2.800) | 0.012 | 65 | 0.684 | 1.065 (0.643–1.762) | 0.807 | 1.061 (0.641–1.757) | 0.818 |
| & 1.799 (1.137–2.845) | 0.012 | & 1.796 (1.149–2.808) | 0.010 | |||||||||||
| A/A | 62 | 0.238 | 27 | 0.162 | 0.619 (0.375–1.022) | 0.061 | 0.621 (0.376–1.025) | 0.062 | 23 | 0.242 | 1.025 (0.592–1.776) | 0.929 | 1.028 (0.593–1.781) | 0.922 |
| χ2 = 6.582; p = 0.037 | χ2 = 0.292; p = 0.864 | |||||||||||||
| T | 223 | 0.427 | 149 | 0.446 | 1.152 (0.791–1.679) | 0.461 | 1.150 (0.789–1.676) | 0.468 | 79 | 0.416 | 0.927 (0.605–1.421) | 0.729 | 0.927 (0.605–1.421) | 0.727 |
| A | 299 | 0.573 | 185 | 0.554 | 0.868 (0.596–1.265) | 0.461 | 0.870 (0.597–1.268) | 0.468 | 111 | 0.584 | 1.078 (0.704–1.652) | 0.729 | 1.079 (0.704–1.654) | 0.727 |
| ENDOG c.-394T > C (rs2977998) | ||||||||||||||
| CC | 162 | 0.621 | 96 | 0.575 | 0.826 (0.556–1.227) | 0.345 | 0.826 (0.556–1.227) | 0.344 | 55 | 0.579 | 0.840 (0.521–1.355) | 0.475 | 0.848 (0.525–1.368) | 0.499 |
| CT | 90 | 0.345 | 61 | 0.365 | 1.093 (0.729–1.640) | 0.666 | 1.090 (0.727–1.636) | 0.676 | 31 | 0.326 | 0.920 (0.559–1.516) | 0.744 | 0.908 (0.551–1.499) | 0.707 |
| TT | 9 | 0.034 | 10 | 0.60 | 1.783 (0.709–4.486) | 0.219 | 1.824 (0.722–4607) | 0.203 | 9 | 0.095 | 2.930 (1.127–7.621) | 0.027 | 2.973 (1.141–7.747) | 0.026 |
| & 2.953 (1.103–7.902) | 0.031 | & 2.951 (1.136–7.666) | 0.026 | |||||||||||
| χ2 = 1.955; p = 0.376 | χ2 = 5.270; p = 0.072 | |||||||||||||
| C | 414 | 0.793 | 253 | 0.757 | 0.810 (0.581–1.130) | 0.215 | 0.808 (0.579–1.127) | 0.209 | 141 | 0.742 | 0.753 (0.511–1.109) | 0.150 | 0.755 (0.512–1.114) | 0.157 |
| T | 108 | 0.207 | 81 | 0.243 | 1.234 (0.885–1.722) | 0.215 | 1.238 (0.887–1.728) | 0.209 | 49 | 0.258 | 1.329 (0.902–1.958) | 0.150 | 1.324 (0.898–1.952) | 0.157 |
| ENDOG c.-220C > T (rs2997922) | ||||||||||||||
| C/C | 155 | 0.594 | 81 | 0.485 | 0.644 (0.436–0.953) | 0.028 | 0.645 (0.436–0.954) | 0.028 | 62 | 0.481 | 0.760 (0.474–1.219) | 0.255 | 0.749 (0.466–1.203) | 0.232 |
| & 0.643 (0.436–0.947) | 0.025 | & 0.648 (0.438–0.935) | 0.021 | |||||||||||
| C/T | 94 | 0.360 | 67 | 0.401 | 1.190 (0.798–1.775) | 0.393 | 1.183 (0.793–1.767) | 0.410 | 53 | 0.411 | 0.990 (0.607–1.616) | 0.969 | 0.996 (0.610–1.626) | 0.987 |
| T/T | 12 | 0.046 | 19 | 0.114 | 2.664 (1.257–5.644) | 0.011 | 2.748 (1.290–5.855) | 0.009 | 14 | 0.109 | 2.717 (1.156–6.387) | 0.022 | 2.830 (1.196–6.694) | 0.018 |
| & 2.675 (1.210–5.911) | 0.015 | & 2.858 (1.243–6.571) | 0.013 | & 2.790(1.138–6.840) | 0.025 | & 2.899(1.133–7.420) | 0.026 | |||||||
| χ2 = 9.106; p = 0.011 | χ2 = 5.807; p = 0.055 | |||||||||||||
| C | 404 | 0.774 | 229 | 0.686 | 0.641 (0.470–0.874) | 0.005 | 0.639 (0.469–0.872) | 0.005 | 134 | 0.705 | 0.704 (0.486–1.021) | 0.064 | 0.692 (0.476–1.006) | 0.054 |
| & 0.636 (0.467–0.867) | 0.004 | & 0.634 (0.462–0.869) | <0.005 | & 0.707 (0.497–1.004) | 0.052 | & 0.687 (0.466–1.014) | 0.059 | |||||||
| T | 118 | 0.226 | 105 | 0.314 | 1.560 (1.144–2.126) | 0.005 | 1.564 (1.147–2.132) | 0.005 | 56 | 0.295 | 1.420 (0.980–2.057) | 0.064 | 1.444 (0.994–2.099) | 0.054 |
| & 1.567 (1.139–2.156) | 0.006 | & 1.578 (1.166–2.137) | 0.003 | & 1.447 (1.011–2.070) | 0.043 | & 1.445 (1.002–2.084) | 0.049 | |||||||
| Depression Severity (HAM-D Range of Scores) | Percentage of Patients Before Treatment | Percentage of Patients After Treatment |
|---|---|---|
| None (0–7) | 0% | 72.52% * |
| Mild (8–16) | 13.74% | 26.34% * |
| Moderate (17–23) | 35.88% | 1.15% * |
| Severe (≥24) | 50.38% | 1.15% * |
| Mean age of patients ± SD | 49.40 ± 10.36 # | |
| Mean age of controls ± SD | 53.88 ± 12.39 | |
| Gender (male/female) of patients | 132/130 | |
| Gender (male/female) of controls | 132/129 & | |
| Duration of disease from the first episode | Percentage of patients | |
| 0–10 years | 55.91% | |
| 11–20 years | 18.90% | |
| 21–30 years | 15.75% | |
| 31–40 years | 9.06% | |
| ≥41 years | 0.39% | |
| Number of episodes | Percentage of patients | |
| 1 | 14.98% | |
| 2 | 30.77% | |
| 3 | 28.74% | |
| 4 | 17.41% | |
| 5 | 4.45% | |
| ≥6 | 3.64% |
Disclaimer/Publisher’s Note: The statements, opinions and data contained in all publications are solely those of the individual author(s) and contributor(s) and not of MDPI and/or the editor(s). MDPI and/or the editor(s) disclaim responsibility for any injury to people or property resulting from any ideas, methods, instructions or products referred to in the content. |
© 2023 by the authors. Licensee MDPI, Basel, Switzerland. This article is an open access article distributed under the terms and conditions of the Creative Commons Attribution (CC BY) license (https://creativecommons.org/licenses/by/4.0/).
Share and Cite
Czarny, P.; Ziółkowska, S.; Kołodziej, Ł.; Watała, C.; Wigner-Jeziorska, P.; Bliźniewska-Kowalska, K.; Wachowska, K.; Gałecka, M.; Synowiec, E.; Gałecki, P.; et al. Single-Nucleotide Polymorphisms in Genes Maintaining the Stability of Mitochondrial DNA Affect the Occurrence, Onset, Severity and Treatment of Major Depressive Disorder. Int. J. Mol. Sci. 2023, 24, 14752. https://doi.org/10.3390/ijms241914752
Czarny P, Ziółkowska S, Kołodziej Ł, Watała C, Wigner-Jeziorska P, Bliźniewska-Kowalska K, Wachowska K, Gałecka M, Synowiec E, Gałecki P, et al. Single-Nucleotide Polymorphisms in Genes Maintaining the Stability of Mitochondrial DNA Affect the Occurrence, Onset, Severity and Treatment of Major Depressive Disorder. International Journal of Molecular Sciences. 2023; 24(19):14752. https://doi.org/10.3390/ijms241914752
Chicago/Turabian StyleCzarny, Piotr, Sylwia Ziółkowska, Łukasz Kołodziej, Cezary Watała, Paulina Wigner-Jeziorska, Katarzyna Bliźniewska-Kowalska, Katarzyna Wachowska, Małgorzata Gałecka, Ewelina Synowiec, Piotr Gałecki, and et al. 2023. "Single-Nucleotide Polymorphisms in Genes Maintaining the Stability of Mitochondrial DNA Affect the Occurrence, Onset, Severity and Treatment of Major Depressive Disorder" International Journal of Molecular Sciences 24, no. 19: 14752. https://doi.org/10.3390/ijms241914752
APA StyleCzarny, P., Ziółkowska, S., Kołodziej, Ł., Watała, C., Wigner-Jeziorska, P., Bliźniewska-Kowalska, K., Wachowska, K., Gałecka, M., Synowiec, E., Gałecki, P., Bijak, M., Szemraj, J., & Śliwiński, T. (2023). Single-Nucleotide Polymorphisms in Genes Maintaining the Stability of Mitochondrial DNA Affect the Occurrence, Onset, Severity and Treatment of Major Depressive Disorder. International Journal of Molecular Sciences, 24(19), 14752. https://doi.org/10.3390/ijms241914752