


Quantification of Oligonucleotides Using Tandem Mass Spectrometry with Isobaric Internal Standards


Abstract
:1. Introduction
2. Results
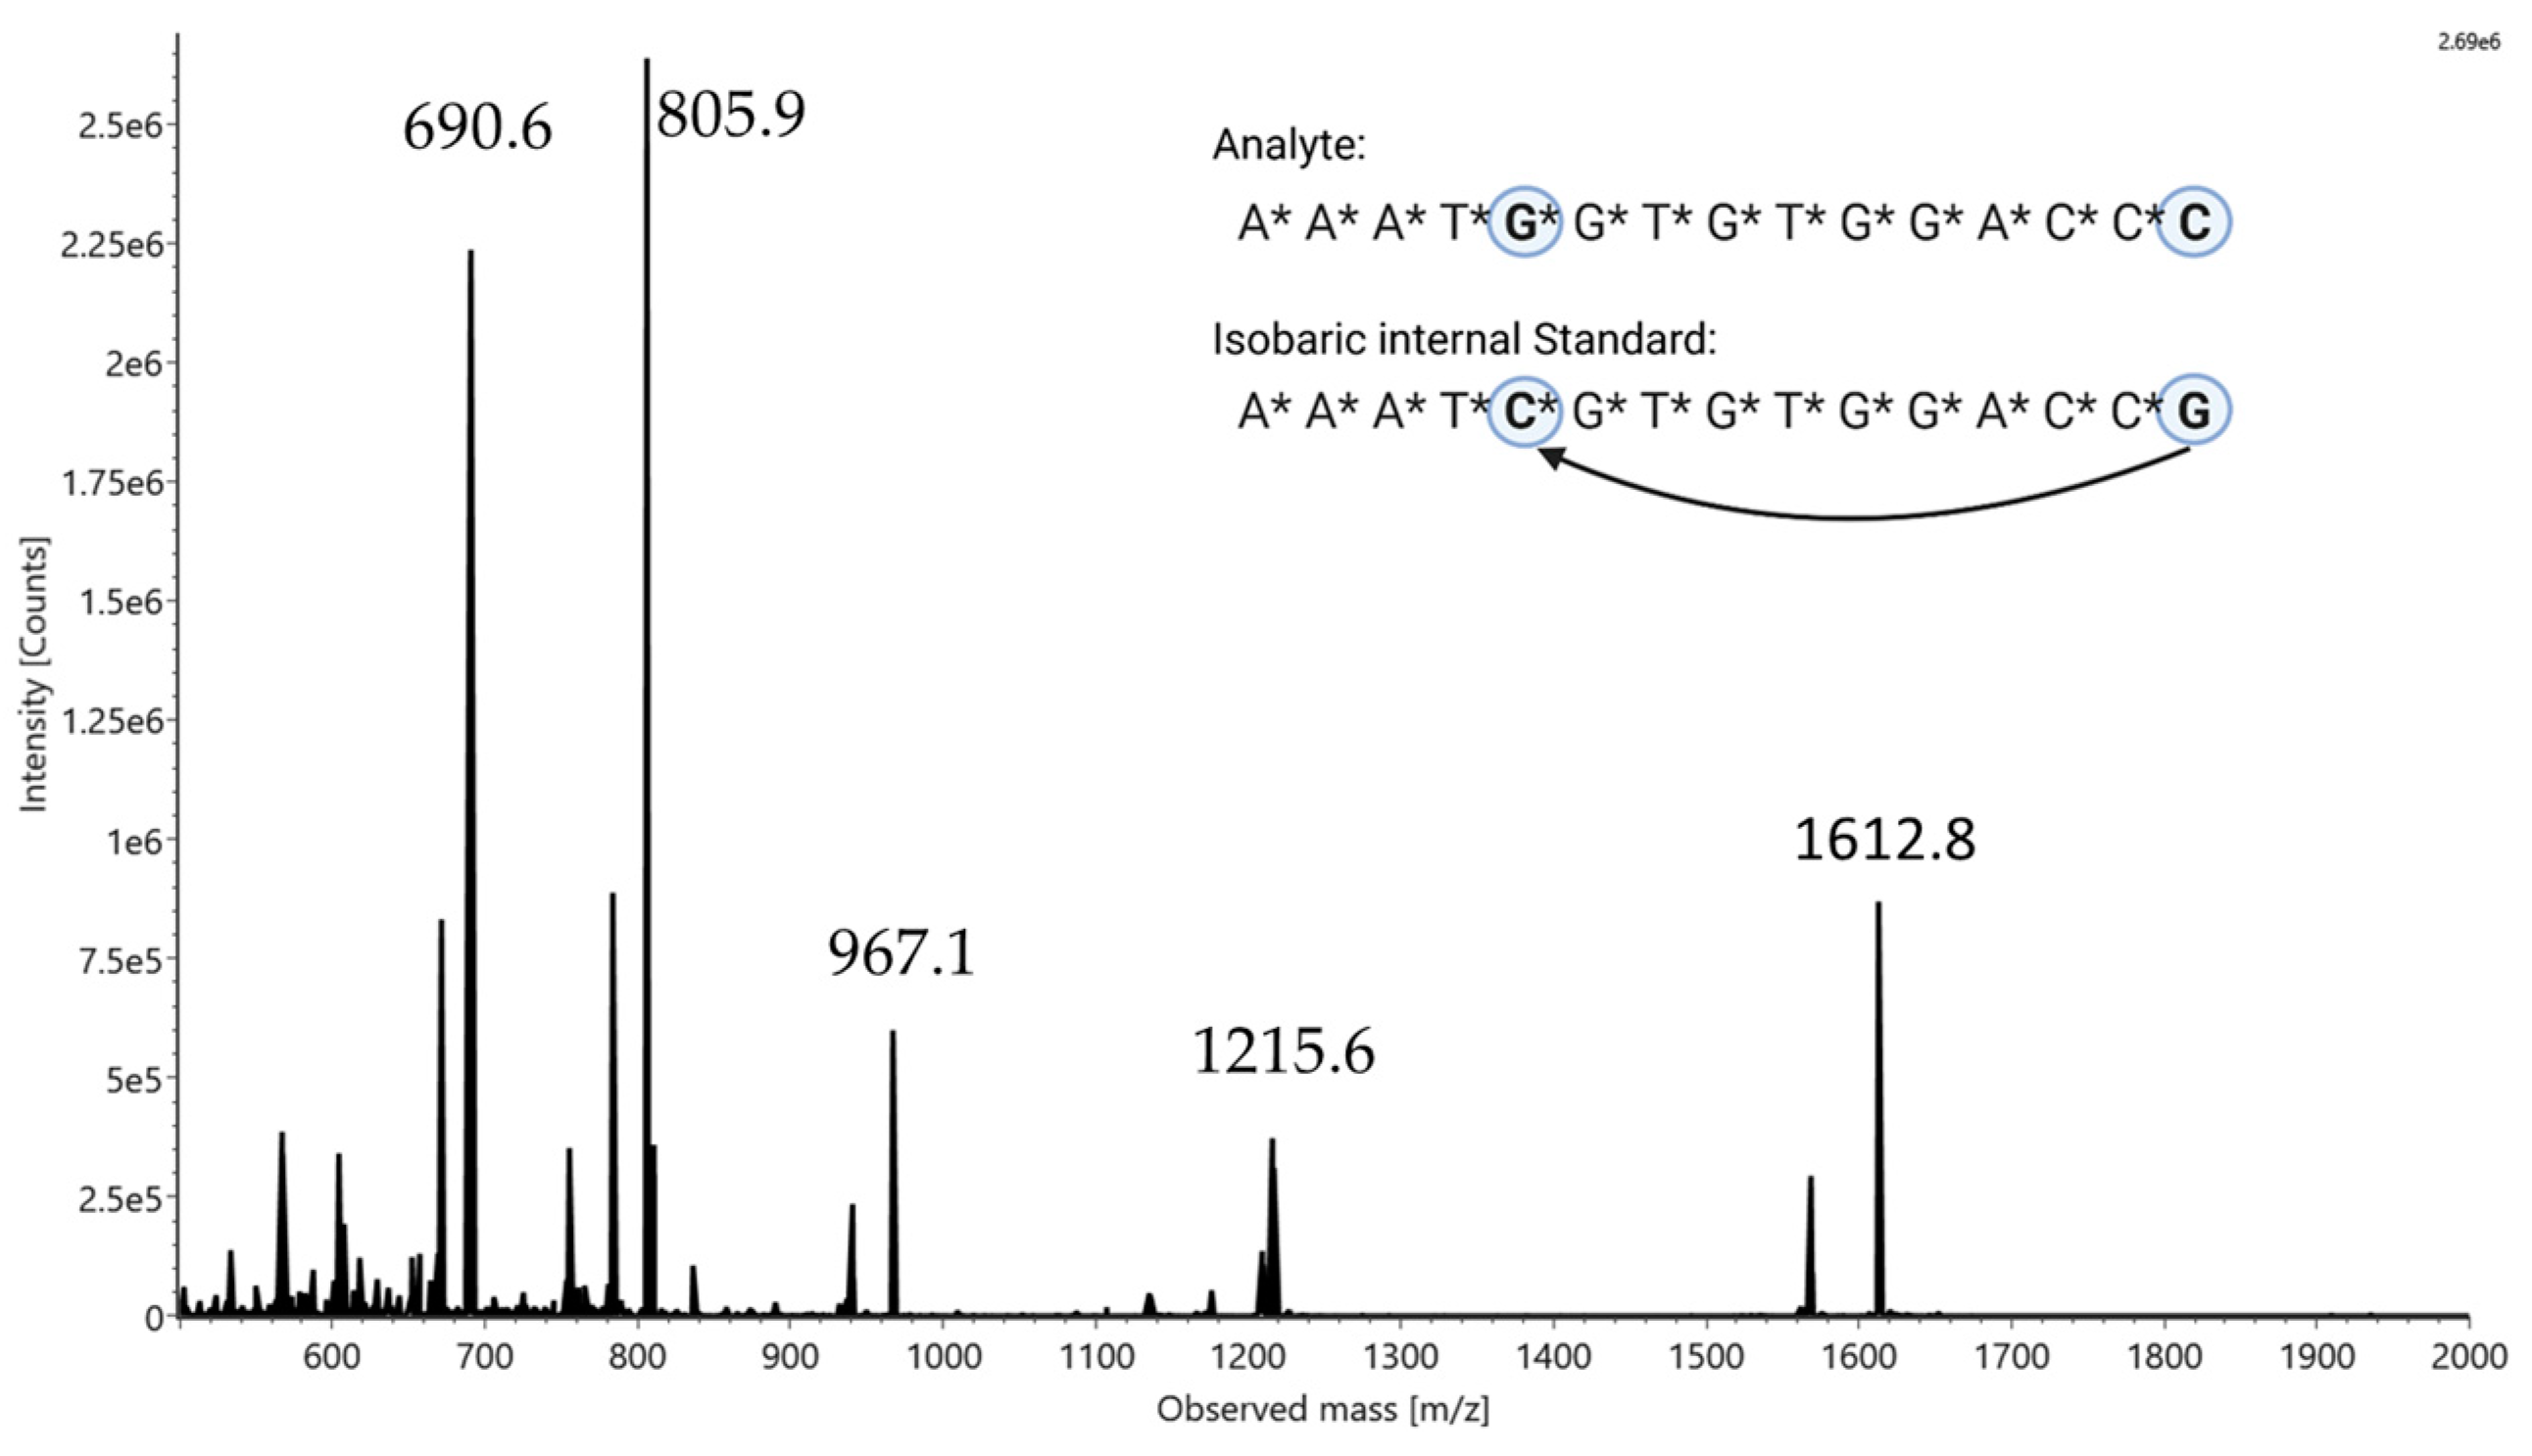
2.1. Proof of Principle
2.2. Qualification of Method Using ICH Q2 Guidelines
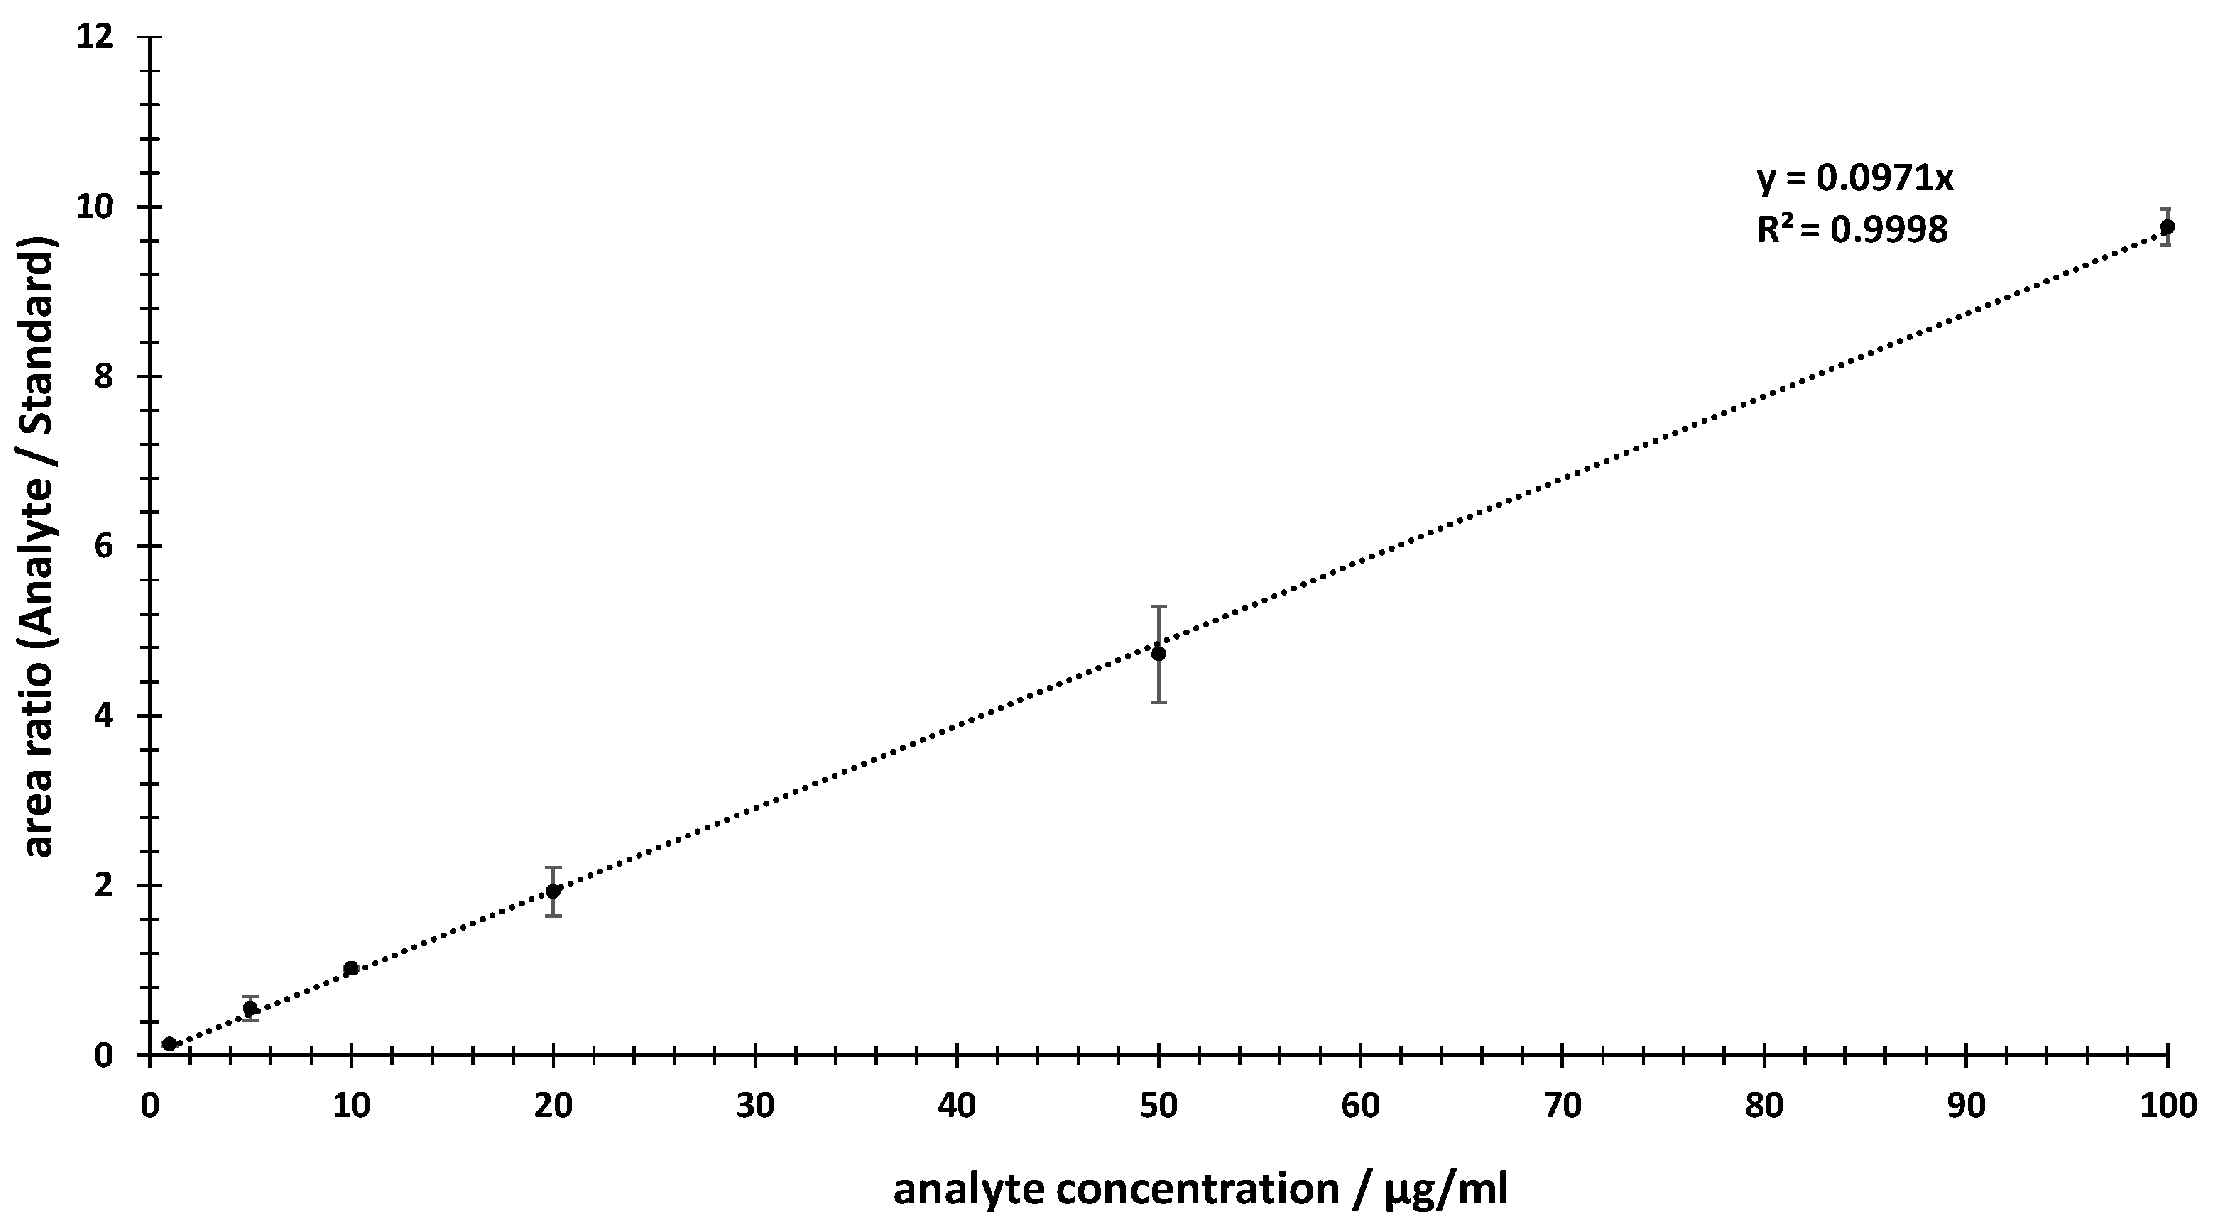
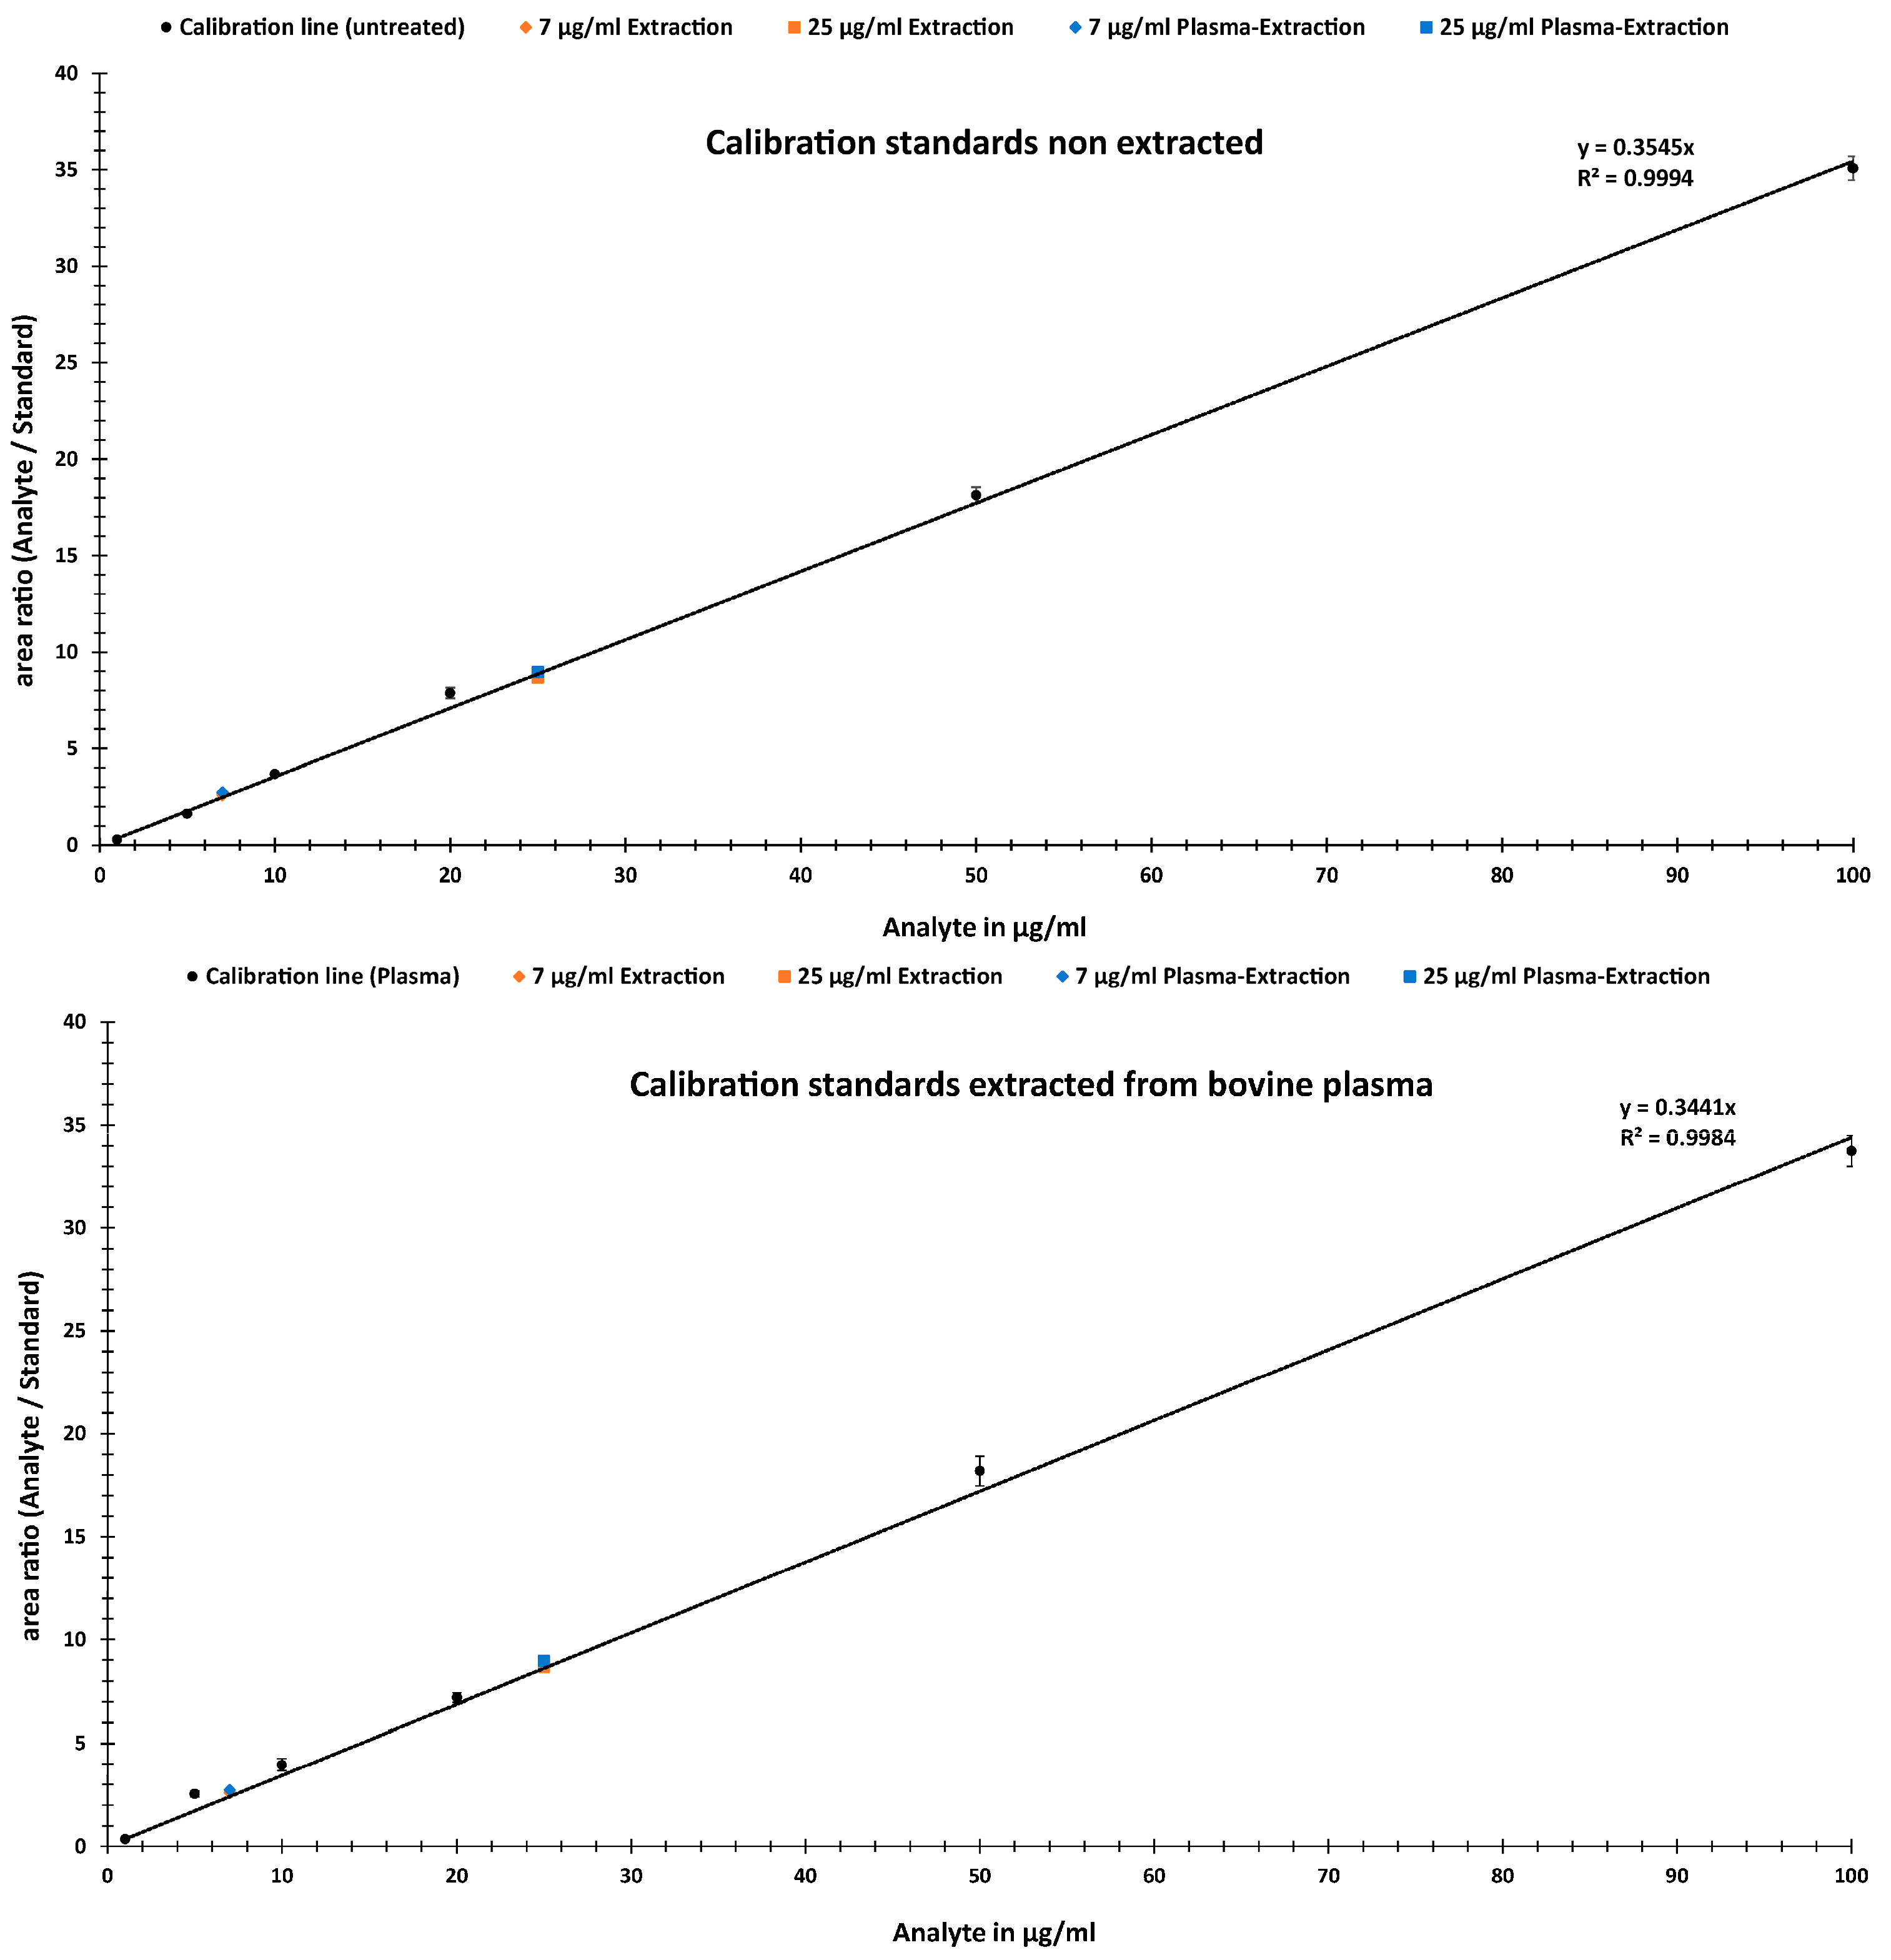
2.2.1. Linearity
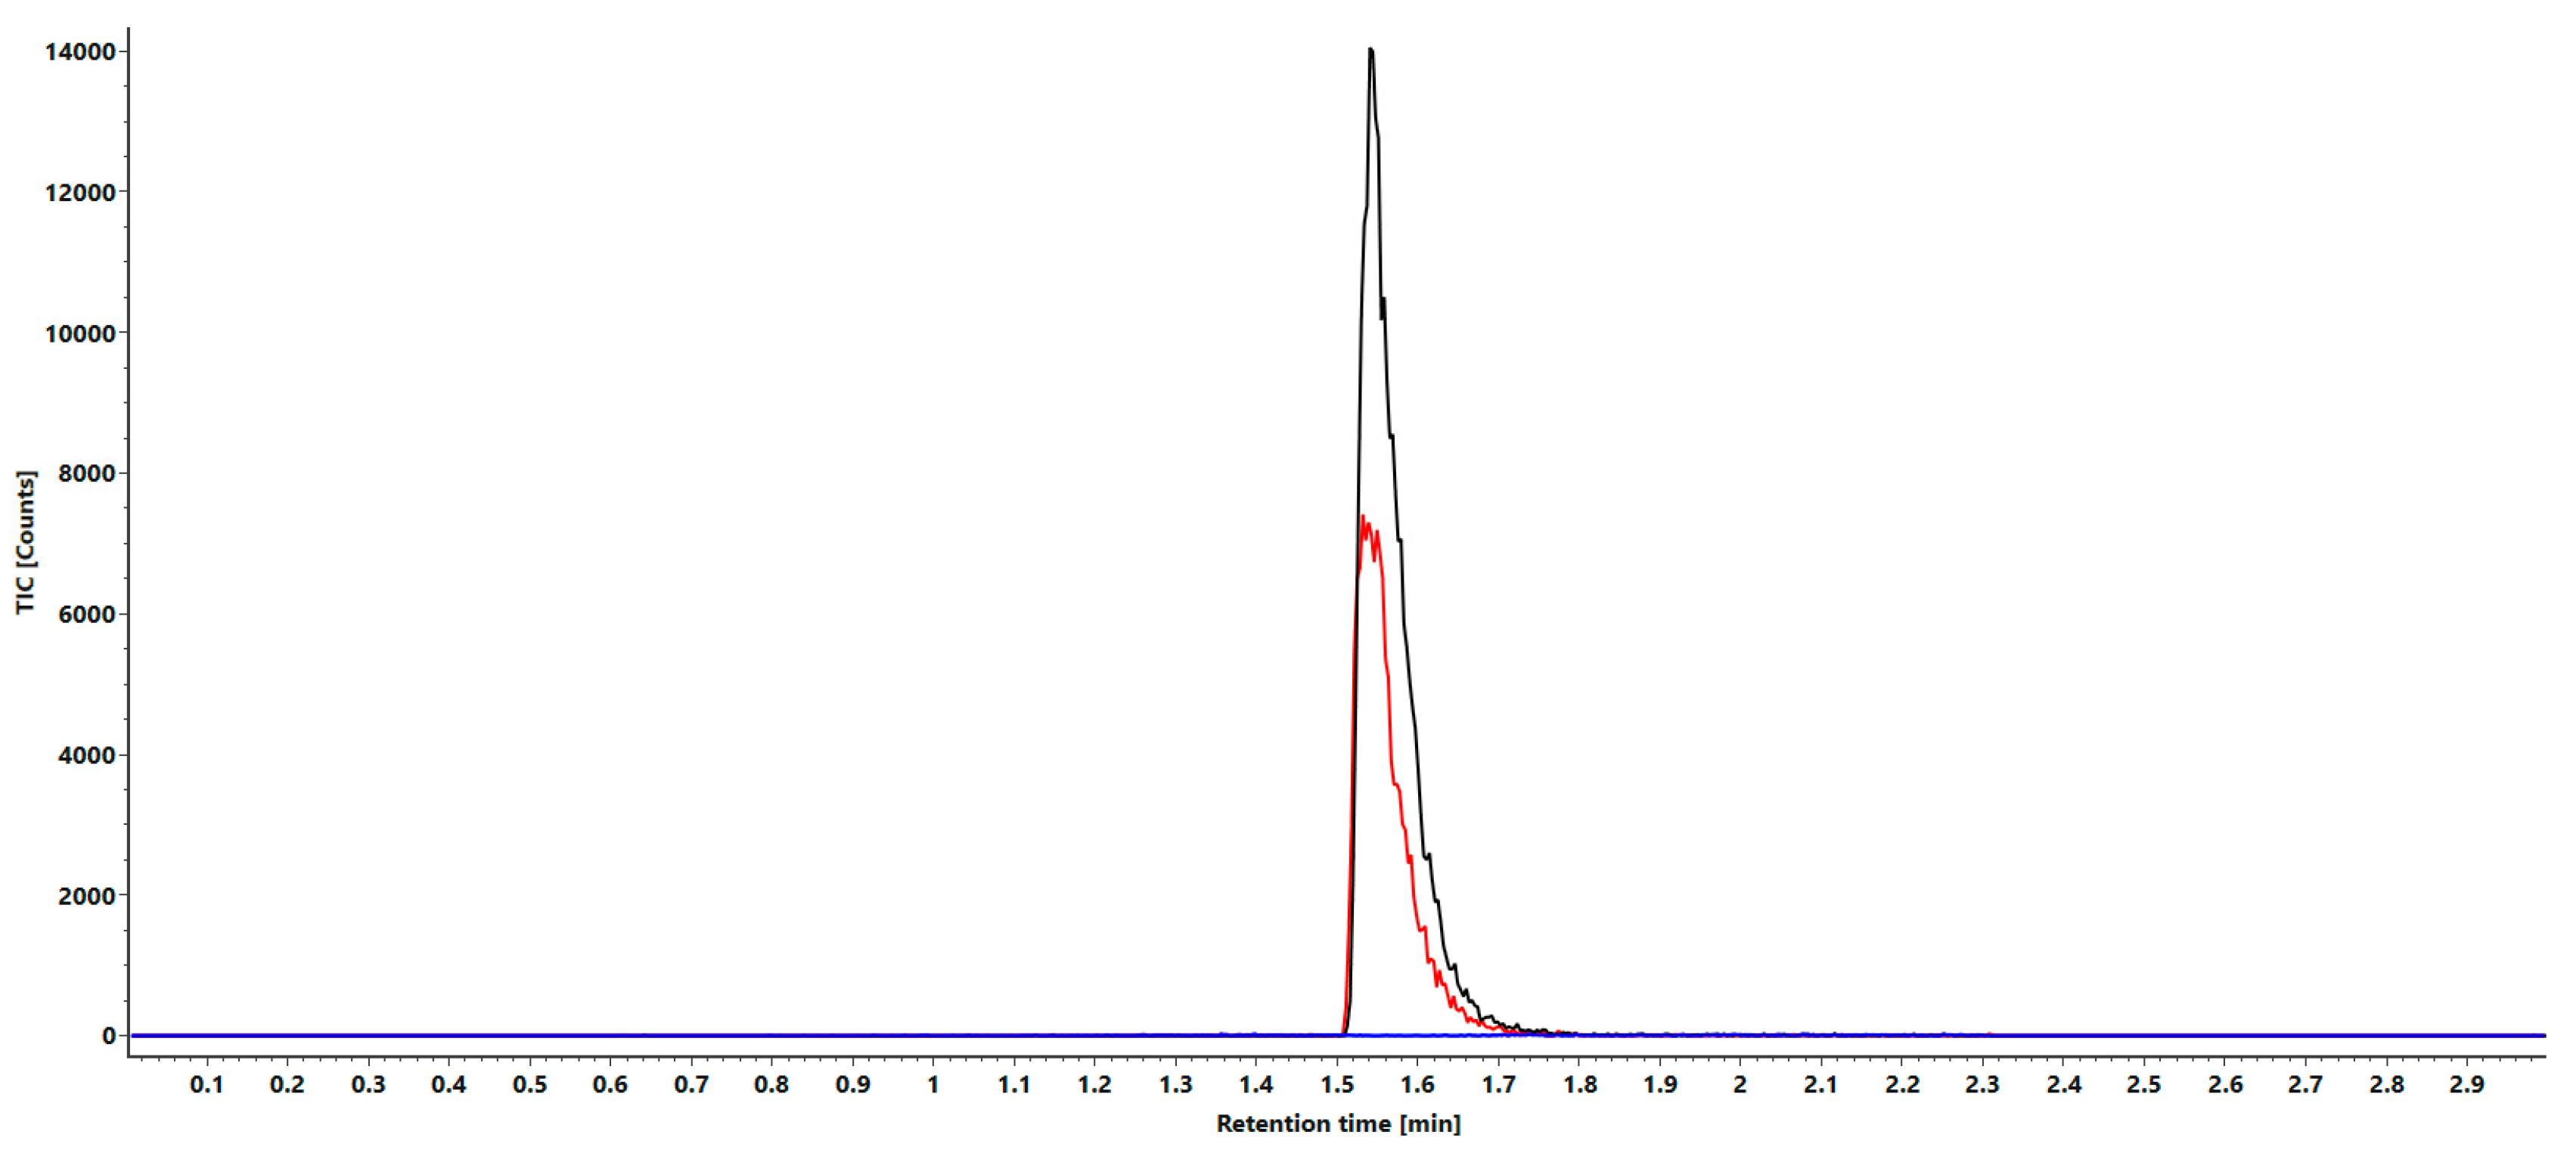
2.2.2. Sensitivity
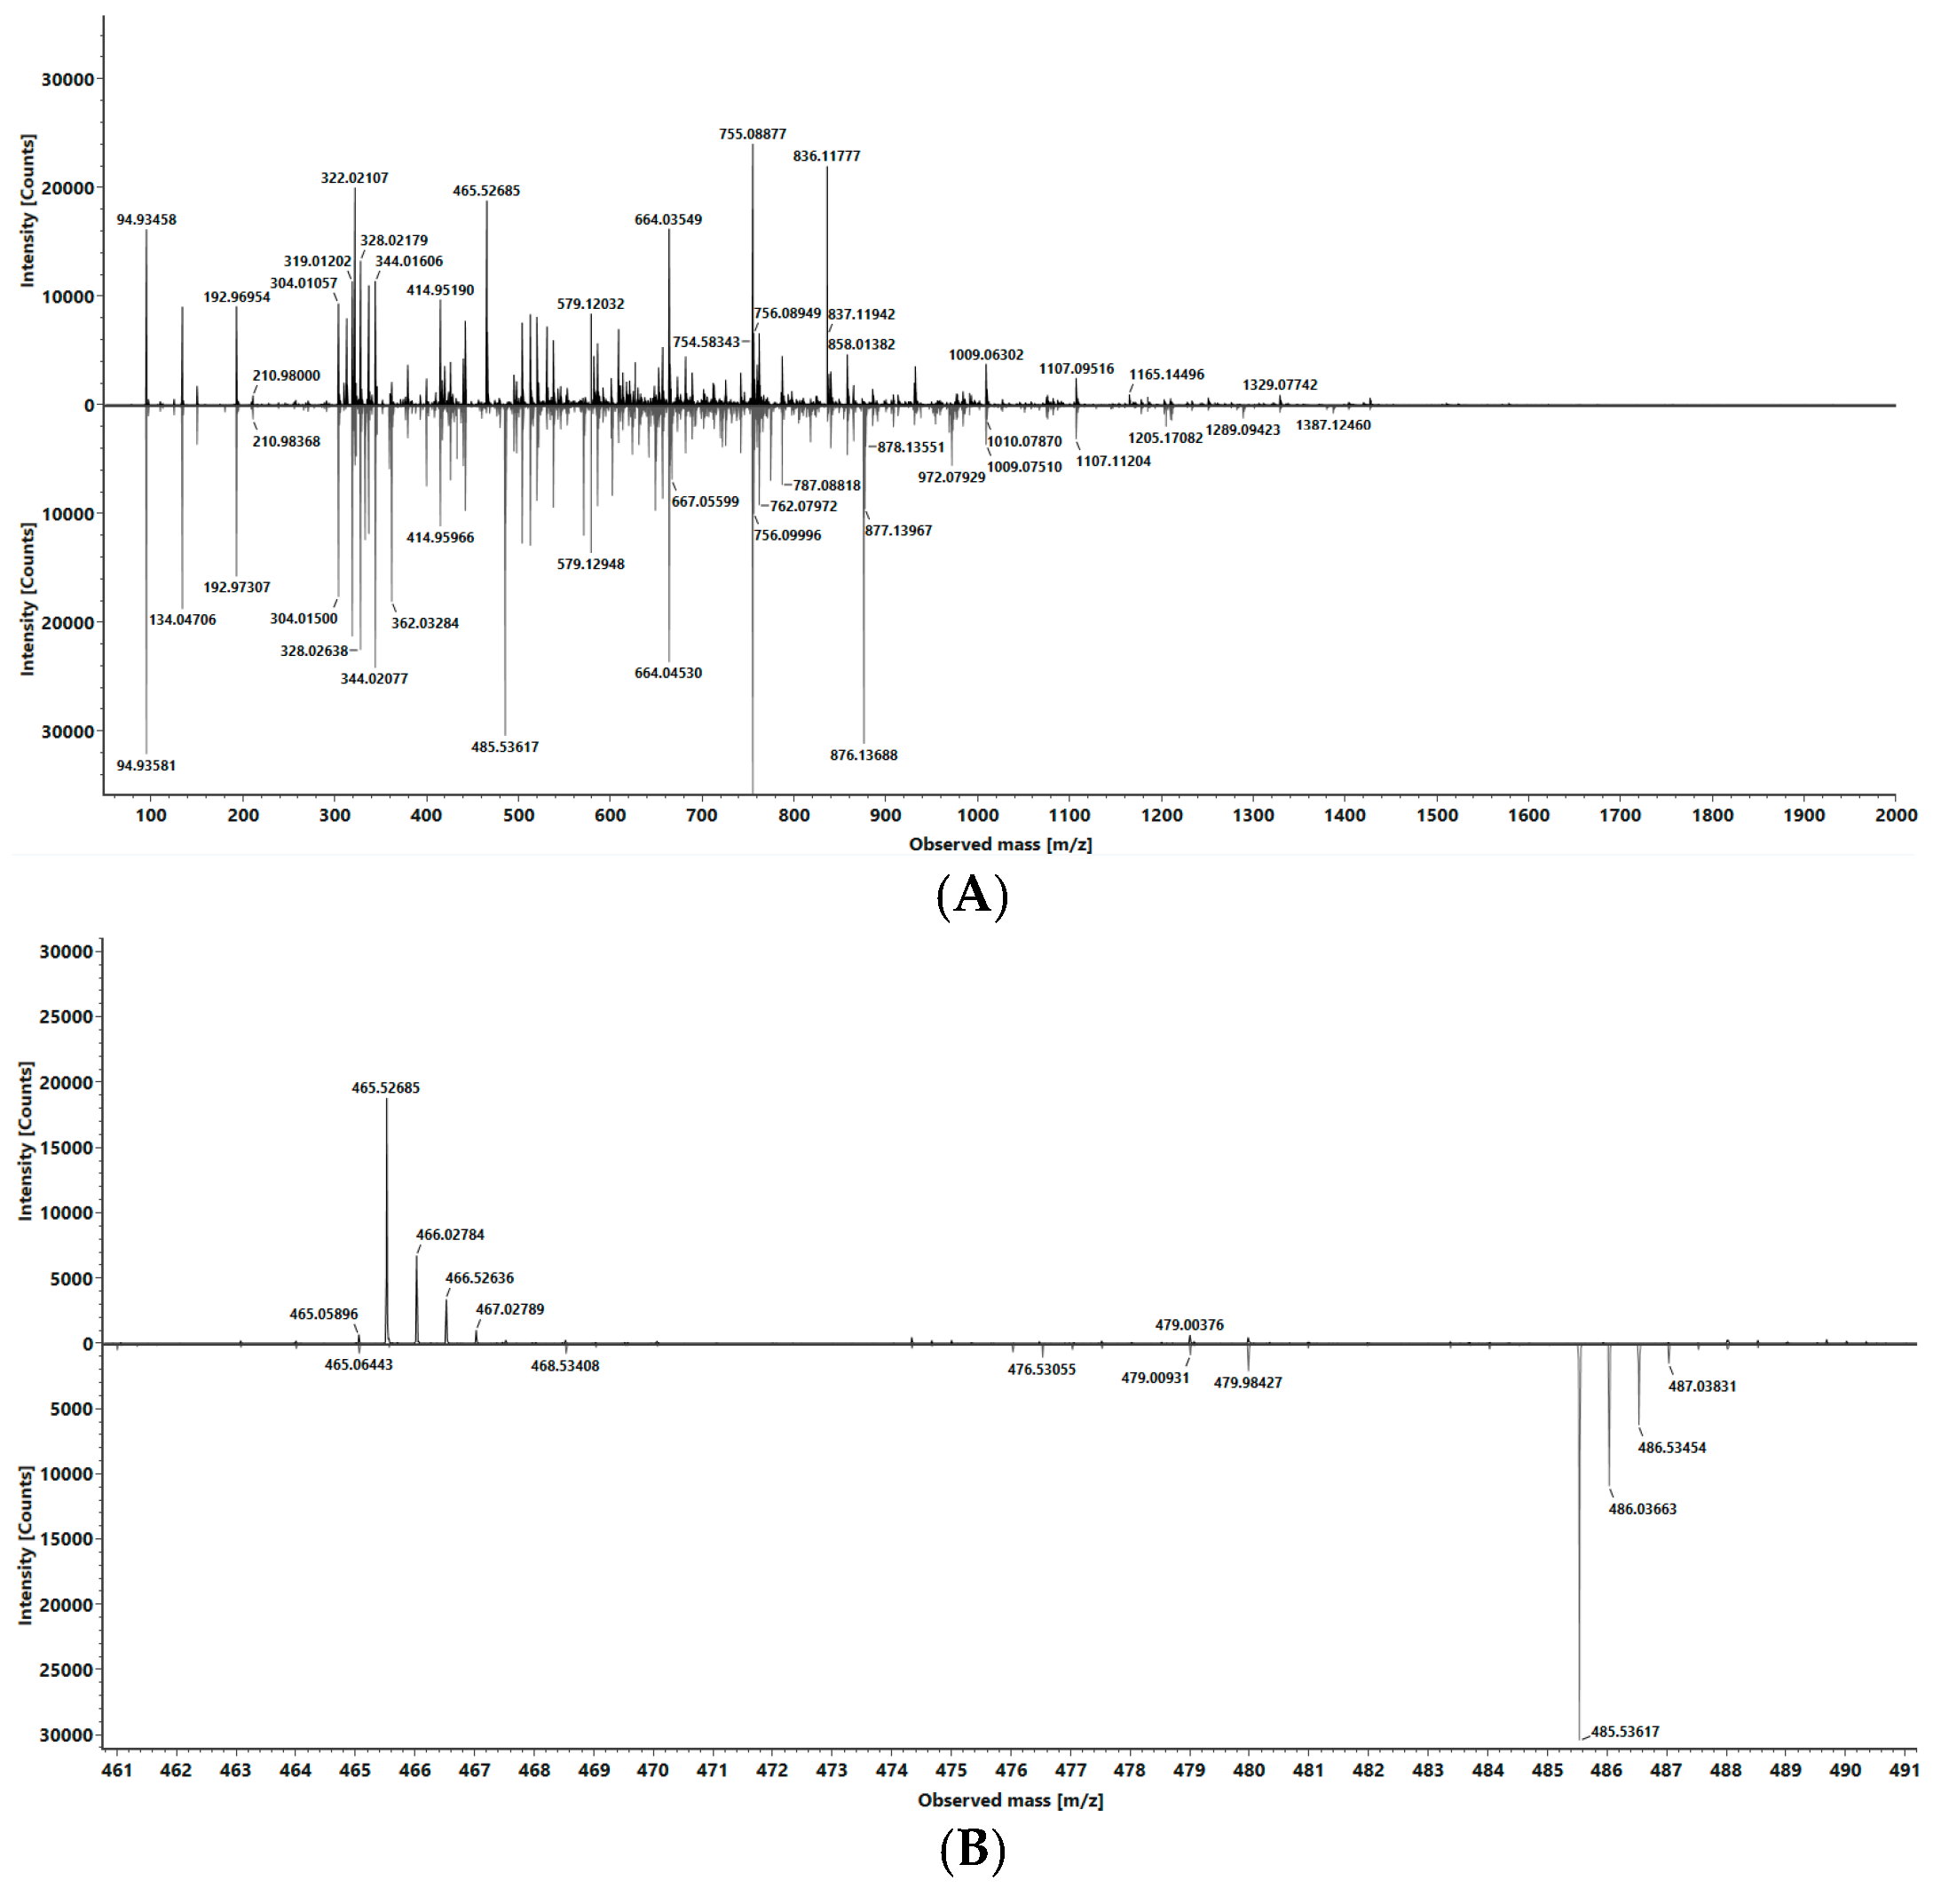
2.2.3. Selectivity
2.2.4. Accuracy, Precision and Analyte Recoveries
- (a)
- Calibration standards and samples from water extraction
- (b)
- Calibration standards and samples of non- and bovine plasma extract
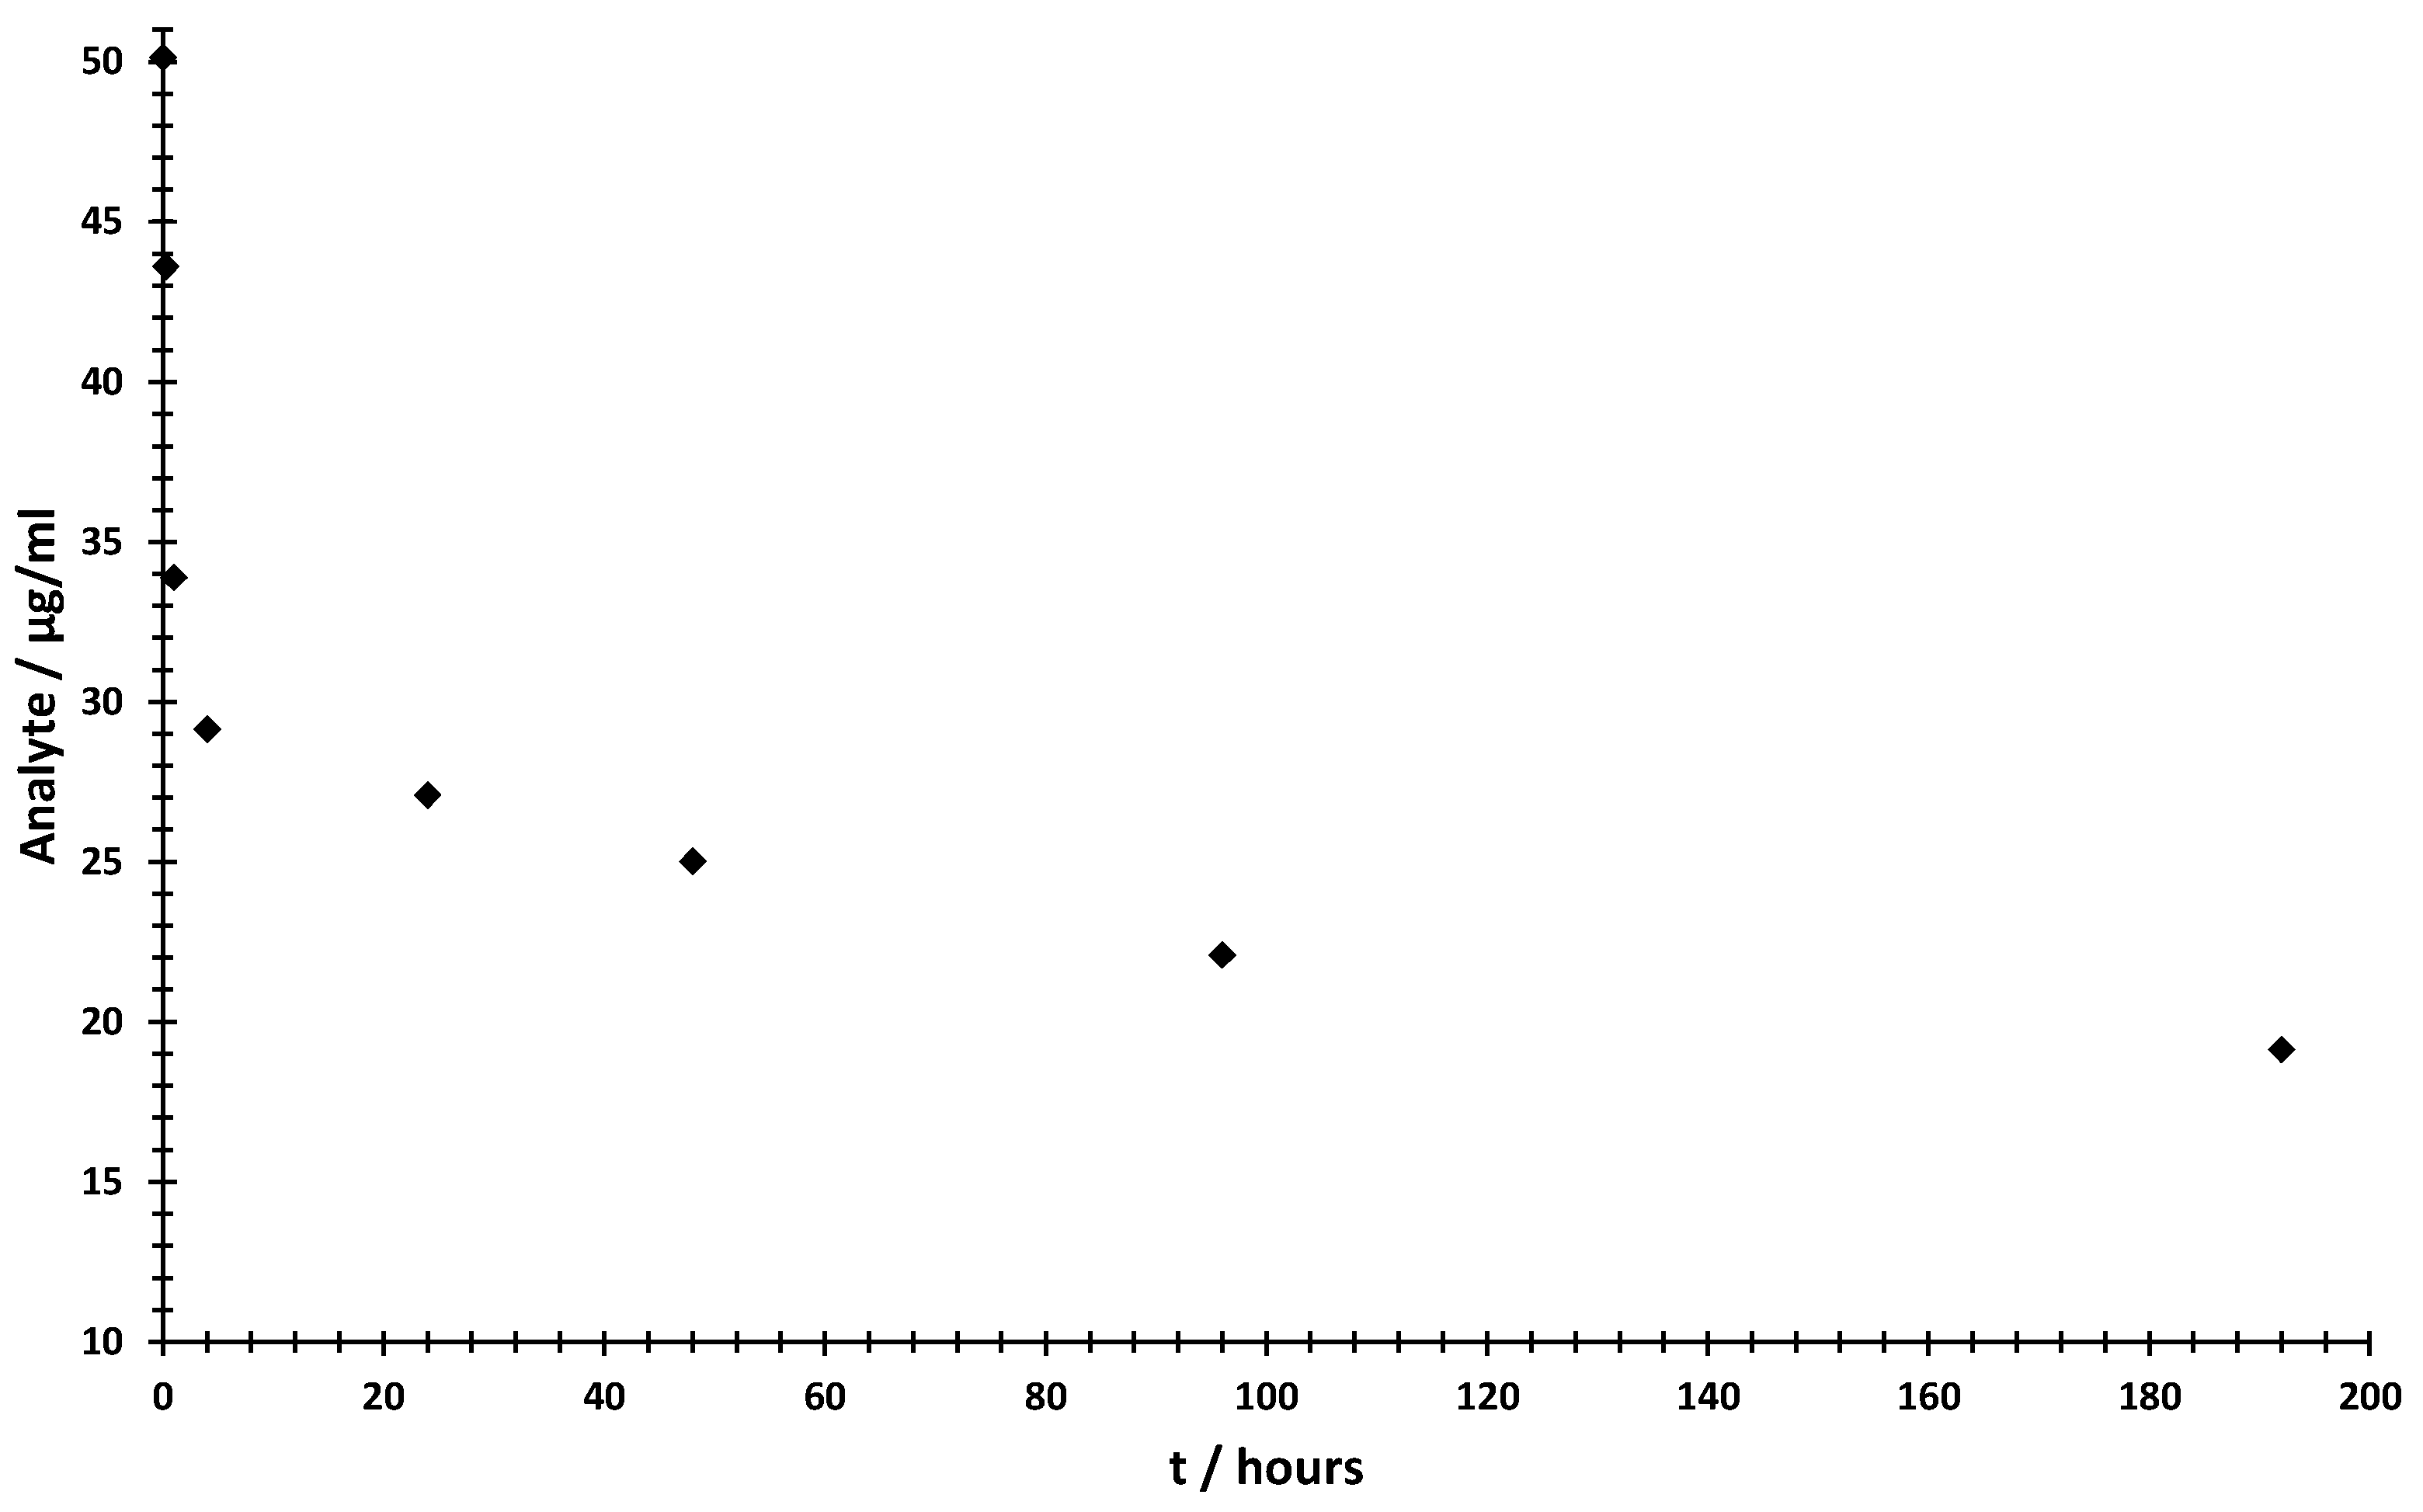
2.3. Short-Term Biofluid Stability Study
3. Discussion
3.1. Linearity
3.2. Sensitivity
3.3. Selectivity
3.4. Accuracy, Precision and Matrix Effect Evaluation
3.5. Short-Term Biofluid Stability Study
4. Materials and Methods
4.1. Materials
4.2. Sample Preparation
4.2.1. Preparation of Testing Analytes and Calibration Standards
4.2.2. Solid-Phase Extraction from Biological Medium
4.2.3. Preparation of In Vitro Degradation Samples
4.3. HPLC-MS/MS Analysis
4.4. Data Analysis and Visualization
5. Conclusions
Supplementary Materials
Author Contributions
Funding
Institutional Review Board Statement
Informed Consent Statement
Data Availability Statement
Acknowledgments
Conflicts of Interest
References
- Al Musaimi, O.; Al Shaer, D.; Albericio, F.; de la Torre, B.G. 2020 FDA TIDES (Peptides and Oligonucleotides) Harvest. Pharmaceuticals 2021, 14, 145. [Google Scholar] [CrossRef]
- Al Shaer, D.; Al Musaimi, O.; Albericio, F.; de la Torre, B.G. 2021 FDA TIDES (Peptides and Oligonucleotides) Harvest. Pharmaceuticals 2022, 15, 222. [Google Scholar] [CrossRef]
- Al Musaimi, O.; Al Shaer, D.; Albericio, F.; de la Torre, B.G. 2022 FDA TIDES (Peptides and Oligonucleotides) Harvest. Pharmaceuticals 2023, 16, 336. [Google Scholar] [CrossRef]
- Rüger, J.; Ioannou, S.; Castanotto, D.; Stein, C.A. Oligonucleotides to the (Gene) Rescue: FDA Approvals 2017–2019. Trends Pharmacol. Sci. 2020, 41, 27–41. [Google Scholar] [CrossRef]
- Rossi, J.J.; Rossi, D.J. siRNA Drugs: Here to Stay. Mol. Ther. 2021, 29, 431–432. [Google Scholar] [CrossRef]
- Scott, L.J.; Keam, S.J. Lumasiran: First Approval. Drugs 2021, 81, 277–282. [Google Scholar] [CrossRef] [PubMed]
- Dhuri, K.; Bechtold, C.; Quijano, E.; Pham, H.; Gupta, A.; Vikram, A.; Bahal, R. Antisense Oligonucleotides: An Emerging Area in Drug Discovery and Development. J. Clin. Med. 2020, 9, 2004. [Google Scholar] [CrossRef]
- Dimitri, A.; Herbst, F.; Fraietta, J.A. Engineering the Next-Generation of CAR T-Cells with CRISPR-Cas9 Gene Editing. Mol. Cancer 2022, 21, 78. [Google Scholar] [CrossRef] [PubMed]
- Behr, M.; Zhou, J.; Xu, B.; Zhang, H. In Vivo Delivery of CRISPR-Cas9 Therapeutics: Progress and Challenges. Acta Pharm. Sin. B 2021, 11, 2150–2171. [Google Scholar] [CrossRef] [PubMed]
- Pourshahian, S. Therapeutic Oligonucleotides, Impurities, Degradants, and Their Characterization by Mass Spectrometry. Mass Spectrom. Rev. 2021, 40, 75–109. [Google Scholar] [CrossRef]
- Lin, Z.J.; Li, W.; Dai, G. Application of LC–MS for Quantitative Analysis and Metabolite Identification of Therapeutic Oligonucleotides. J. Pharm. Biomed. Anal. 2007, 44, 330–341. [Google Scholar] [CrossRef] [PubMed]
- Tian, Q.; Rogness, J.; Meng, M.; Li, Z. Quantitative Determination of a siRNA (AD00370) in Rat Plasma Using Peptide Nucleic Acid Probe and HPLC with Fluorescence Detection. Bioanalysis 2017, 9, 861–872. [Google Scholar] [CrossRef] [PubMed]
- Orlando, C.; Pinzani, P.; Pazzagli, M. Developments in Quantitative PCR. Clin. Chem. Lab. Med. 1998, 36, 255–269. [Google Scholar] [CrossRef] [PubMed]
- Karabiber, F.; McGinnis, J.L.; Favorov, O.V.; Weeks, K.M. QuShape: Rapid, Accurate, and Best-Practices Quantification of Nucleic Acid Probing Information, Resolved by Capillary Electrophoresis. RNA 2013, 19, 63–73. [Google Scholar] [CrossRef]
- Jones, L.J.; Yue, S.T.; Cheung, C.-Y.; Singer, V.L. RNA Quantitation by Fluorescence-Based Solution Assay: RiboGreen Reagent Characterization. Anal. Biochem. 1998, 265, 368–374. [Google Scholar] [CrossRef]
- Singer, V.L.; Jones, L.J.; Yue, S.T.; Haugland, R.P. Characterization of PicoGreen Reagent and Development of a Fluorescence-Based Solution Assay for Double-Stranded DNA Quantitation. Anal. Biochem. 1997, 249, 228–238. [Google Scholar] [CrossRef]
- Yu, R.Z.; Baker, B.; Chappell, A.; Geary, R.S.; Cheung, E.; Levin, A.A. Development of an Ultrasensitive Noncompetitive Hybridization-Ligation Enzyme-Linked Immunosorbent Assay for the Determination of Phosphorothioate Oligodeoxynucleotide in Plasma. Anal. Biochem. 2002, 304, 19–25. [Google Scholar] [CrossRef]
- Wei, X.; Dai, G.; Marcucci, G.; Liu, Z.; Hoyt, D.; Blum, W.; Chan, K.K. A Specific Picomolar Hybridization-Based ELISA Assay for the Determination of Phosphorothioate Oligonucleotides in Plasma and Cellular Matrices. Pharm. Res. 2006, 23, 1251–1264. [Google Scholar] [CrossRef]
- Gong, L. Comparing Ion-Pairing Reagents and Counter Anions for Ion-Pair Reversed-Phase Liquid Chromatography/Electrospray Ionization Mass Spectrometry Analysis of Synthetic Oligonucleotides. Rapid Commun. Mass Spectrom. 2015, 29, 2402–2410. [Google Scholar] [CrossRef]
- Kung, A.-W.; Kilby, P.M.; Portwood, D.E.; Dickman, M.J. Quantification of dsRNA Using Stable Isotope Labeling Dilution Liquid Chromatography/Mass Spectrometry. Rapid Commun. Mass Spectrom. 2018, 32, 590–596. [Google Scholar] [CrossRef]
- Waghmare, S.P.; Dickman, M.J. Characterization and Quantification of RNA Post-Transcriptional Modifications Using Stable Isotope Labeling of RNA in Conjunction with Mass Spectrometry Analysis. Anal. Chem. 2011, 83, 4894–4901. [Google Scholar] [CrossRef] [PubMed]
- Ross, P.L.; Huang, Y.N.; Marchese, J.N.; Williamson, B.; Parker, K.; Hattan, S.; Khainovski, N.; Pillai, S.; Dey, S.; Daniels, S.; et al. Multiplexed Protein Quantitation in Saccharomyces Cerevisiae Using Amine-Reactive Isobaric Tagging Reagents. Mol. Cell. Proteom. 2004, 3, 1154–1169. [Google Scholar] [CrossRef] [PubMed]
- Thompson, A.; Schäfer, J.; Kuhn, K.; Kienle, S.; Schwarz, J.; Schmidt, G.; Neumann, T.; Hamon, C. Tandem Mass Tags: A Novel Quantification Strategy for Comparative Analysis of Complex Protein Mixtures by MS/MS. Anal. Chem. 2003, 75, 1895–1904. [Google Scholar] [CrossRef] [PubMed]
- Liu, A.; Cheng, M.; Zhou, Y.; Deng, P. Bioanalysis of Oligonucleotide by LC–MS: Effects of Ion Pairing Regents and Recent Advances in Ion-Pairing-Free Analytical Strategies. Int. J. Mol. Sci. 2022, 23, 15474. [Google Scholar] [CrossRef] [PubMed]
- EMA ICH Q2(R2) Validation of Analytical Procedures—Scientific Guideline. Available online: https://www.ema.europa.eu/en/ich-q2r2-validation-analytical-procedures-scientific-guideline (accessed on 3 July 2023).
- Mcluckey, S.A.; Berkel, G.J.V.; Glish, G.L. Tandem Mass Spectrometry of Small, Multiply Charged Oligonucleotides. J. Am. Soc. Mass Spectrom. 1992, 3, 60–70. [Google Scholar] [CrossRef]
- Riter, L.S.; Vitek, O.; Gooding, K.M.; Hodge, B.D.; Julian, R.K., Jr. Statistical Design of Experiments as a Tool in Mass Spectrometry. J. Mass Spectrom. 2005, 40, 565–579. [Google Scholar] [CrossRef]
- Eder, P.S.; DeVINE, R.J.; Dagle, J.M.; Walder, J.A. Substrate Specificity and Kinetics of Degradation of Antisense Oligonucleotides by a 3′ Exonuclease in Plasma. Antisense Res. Dev. 1991, 1, 141–151. [Google Scholar] [CrossRef]
- Li, P.; Dupuis, J.-F.; Vrionis, V.; Mekhssian, K.; Magee, T.; Yuan, L. Validation and Application of Hybridization Liquid Chromatography-Tandem Mass Spectrometry Methods for Quantitative Bioanalysis of Antisense Oligonucleotides. Bioanalysis 2022, 14, 589–601. [Google Scholar] [CrossRef]
- Li, P.; Gong, Y.; Kim, J.; Liu, X.; Gilbert, J.; Kerns, H.M.; Groth, R.; Rooney, M. Hybridization Liquid Chromatography–Tandem Mass Spectrometry: An Alternative Bioanalytical Method for Antisense Oligonucleotide Quantitation in Plasma and Tissue Samples. Anal. Chem. 2020, 92, 10548–10559. [Google Scholar] [CrossRef]
- Sun, Y.; Nitta, S.; Saito, K.; Hosogai, R.; Nakai, K.; Goda, R.; Kakehi, M.; Murata, K.; Yamaguchi, T.; Okuzono, T.; et al. Development of a Bioanalytical Method for an Antisense Therapeutic Using High-Resolution Mass Spectrometry. Bioanalysis 2020, 12, 1739–1756. [Google Scholar] [CrossRef]
- Dillen, L.; Sips, L.; Greway, T.; Verhaeghe, T. Quantitative Analysis of Imetelstat in Plasma with LC–MS/MS Using Solid-Phase or Hybridization Extraction. Bioanalysis 2017, 9, 1859–1872. [Google Scholar] [CrossRef] [PubMed]
- Anand, P.; Koleto, M.; Kandula, D.R.; Xiong, L.; MacNeill, R. Novel Hydrophilic-Phase Extraction, HILIC and High-Resolution MS Quantification of an RNA Oligonucleotide in Plasma. Bioanalysis 2022, 14, 47–62. [Google Scholar] [CrossRef] [PubMed]
- Beaucage, S.L.; Caruthers, M.H. Deoxynucleoside Phosphoramidites—A New Class of Key Intermediates for Deoxypolynucleotide Synthesis. Tetrahedron Lett. 1981, 22, 1859–1862. [Google Scholar] [CrossRef]

| Extraction from | 7 µg/mL 1 | 25 µg/mL 1 | 7 µg/mL 2 | 25 µg/mL 2 |
|---|---|---|---|---|
| H2O | 7.34 µg/mL 1 | 24.46 µg/mL 1 | 7.57 µg/mL 2 | 24.46 µg/mL 2 |
| Δ(H2O) | 4% 1 | 2% 1 | 7% 2 | 2% 2 |
| bovine plasma | 7.72 µg/mL 1 | 25.28 µg/mL 1 | 7.96 µg/mL 2 | 26.05 µg/mL 2 |
| Δ(bovine plasma) | 10% 1 | 1% 1 | 12% 2 | 4% 2 |
| Isobaric Pair 1 | Isobaric Pair 2 1 |
|---|---|
| A*A*A*T*G*G*T*G*T*G*G*A*C*C*C | AAATGGTGTGGACCC |
| A*A*A*T*C*G*T*G*T*G*G*A*C*C*G | AAATCGTGTGGACCG |
Disclaimer/Publisher’s Note: The statements, opinions and data contained in all publications are solely those of the individual author(s) and contributor(s) and not of MDPI and/or the editor(s). MDPI and/or the editor(s) disclaim responsibility for any injury to people or property resulting from any ideas, methods, instructions or products referred to in the content. |
© 2023 by the authors. Licensee MDPI, Basel, Switzerland. This article is an open access article distributed under the terms and conditions of the Creative Commons Attribution (CC BY) license (https://creativecommons.org/licenses/by/4.0/).
Share and Cite
Gawlig, C.; Hanci, G.; Rühl, M. Quantification of Oligonucleotides Using Tandem Mass Spectrometry with Isobaric Internal Standards. Int. J. Mol. Sci. 2023, 24, 14691. https://doi.org/10.3390/ijms241914691
Gawlig C, Hanci G, Rühl M. Quantification of Oligonucleotides Using Tandem Mass Spectrometry with Isobaric Internal Standards. International Journal of Molecular Sciences. 2023; 24(19):14691. https://doi.org/10.3390/ijms241914691
Chicago/Turabian StyleGawlig, Christopher, Güngör Hanci, and Michael Rühl. 2023. "Quantification of Oligonucleotides Using Tandem Mass Spectrometry with Isobaric Internal Standards" International Journal of Molecular Sciences 24, no. 19: 14691. https://doi.org/10.3390/ijms241914691
APA StyleGawlig, C., Hanci, G., & Rühl, M. (2023). Quantification of Oligonucleotides Using Tandem Mass Spectrometry with Isobaric Internal Standards. International Journal of Molecular Sciences, 24(19), 14691. https://doi.org/10.3390/ijms241914691