
Resveratrol and 3,3′-Diindolylmethane Differentially Regulate Aryl Hydrocarbon Receptor and Estrogen Receptor Alpha Activity through Multiple Transcriptomic Targets in MCF-7 Human Breast Cancer Cells


Abstract
:1. Introduction
2. Results
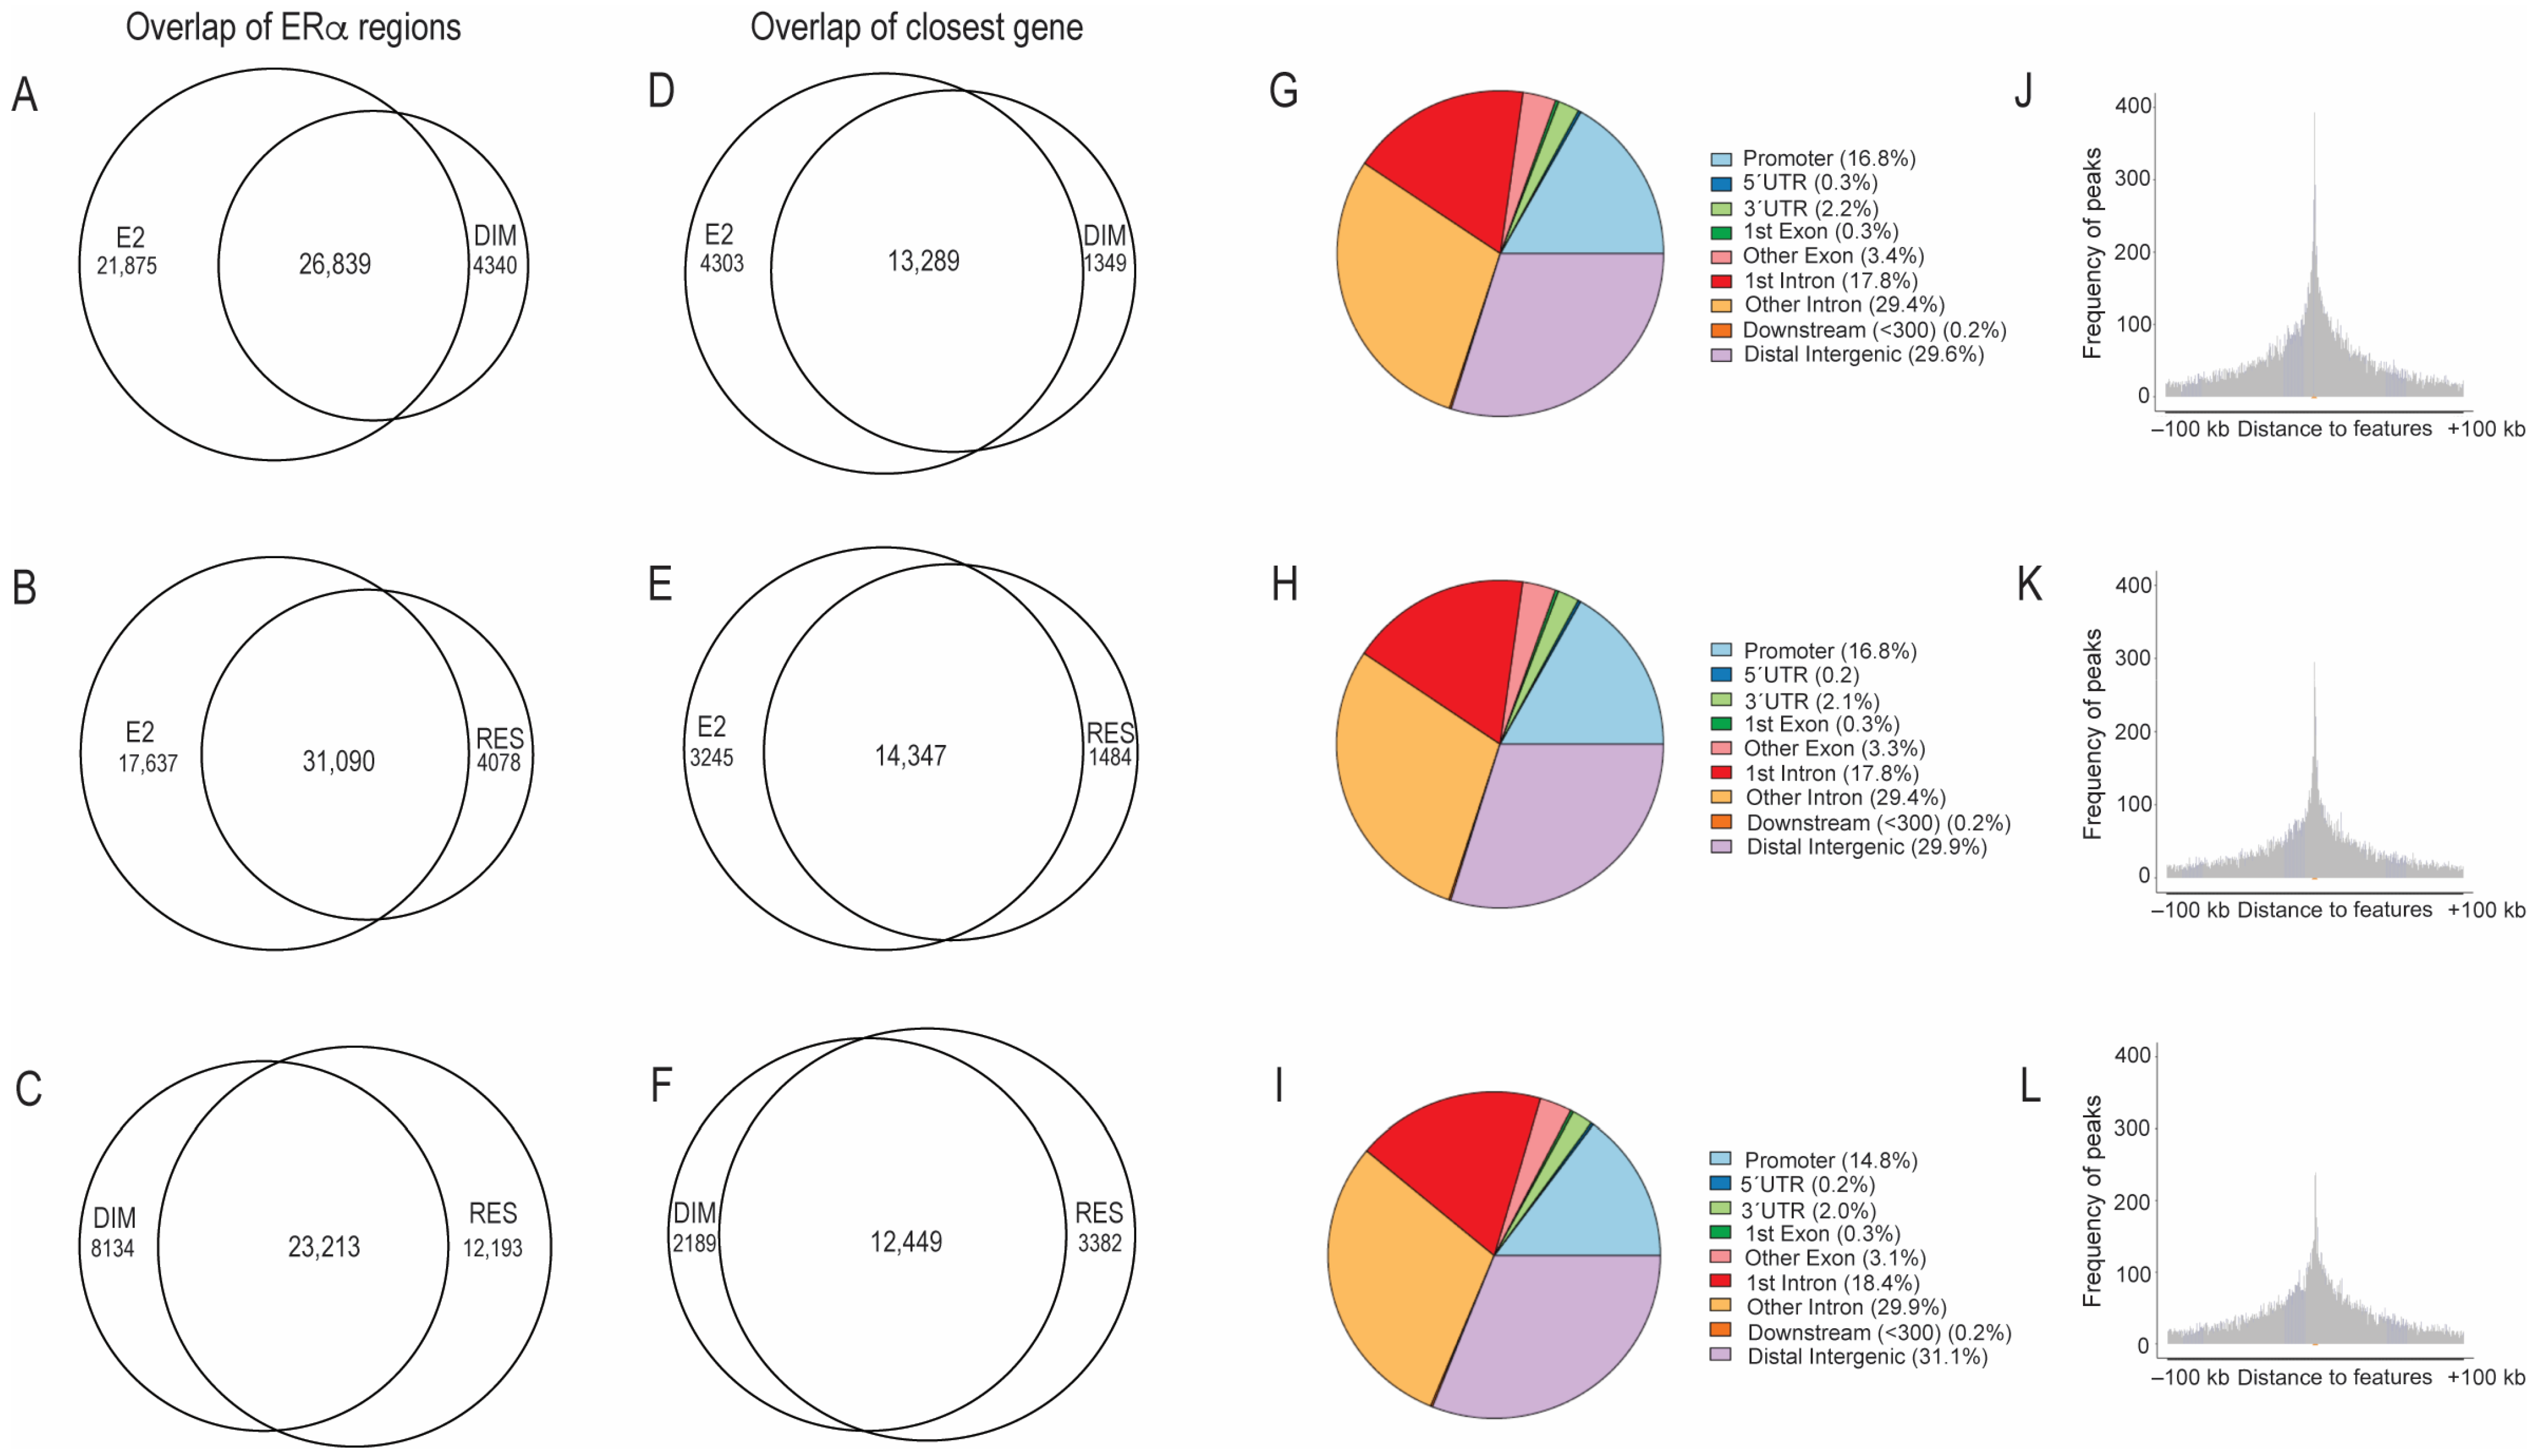
2.1. Comparison of ERα-Binding Profiles after Treatment with E2, RES, and DIM
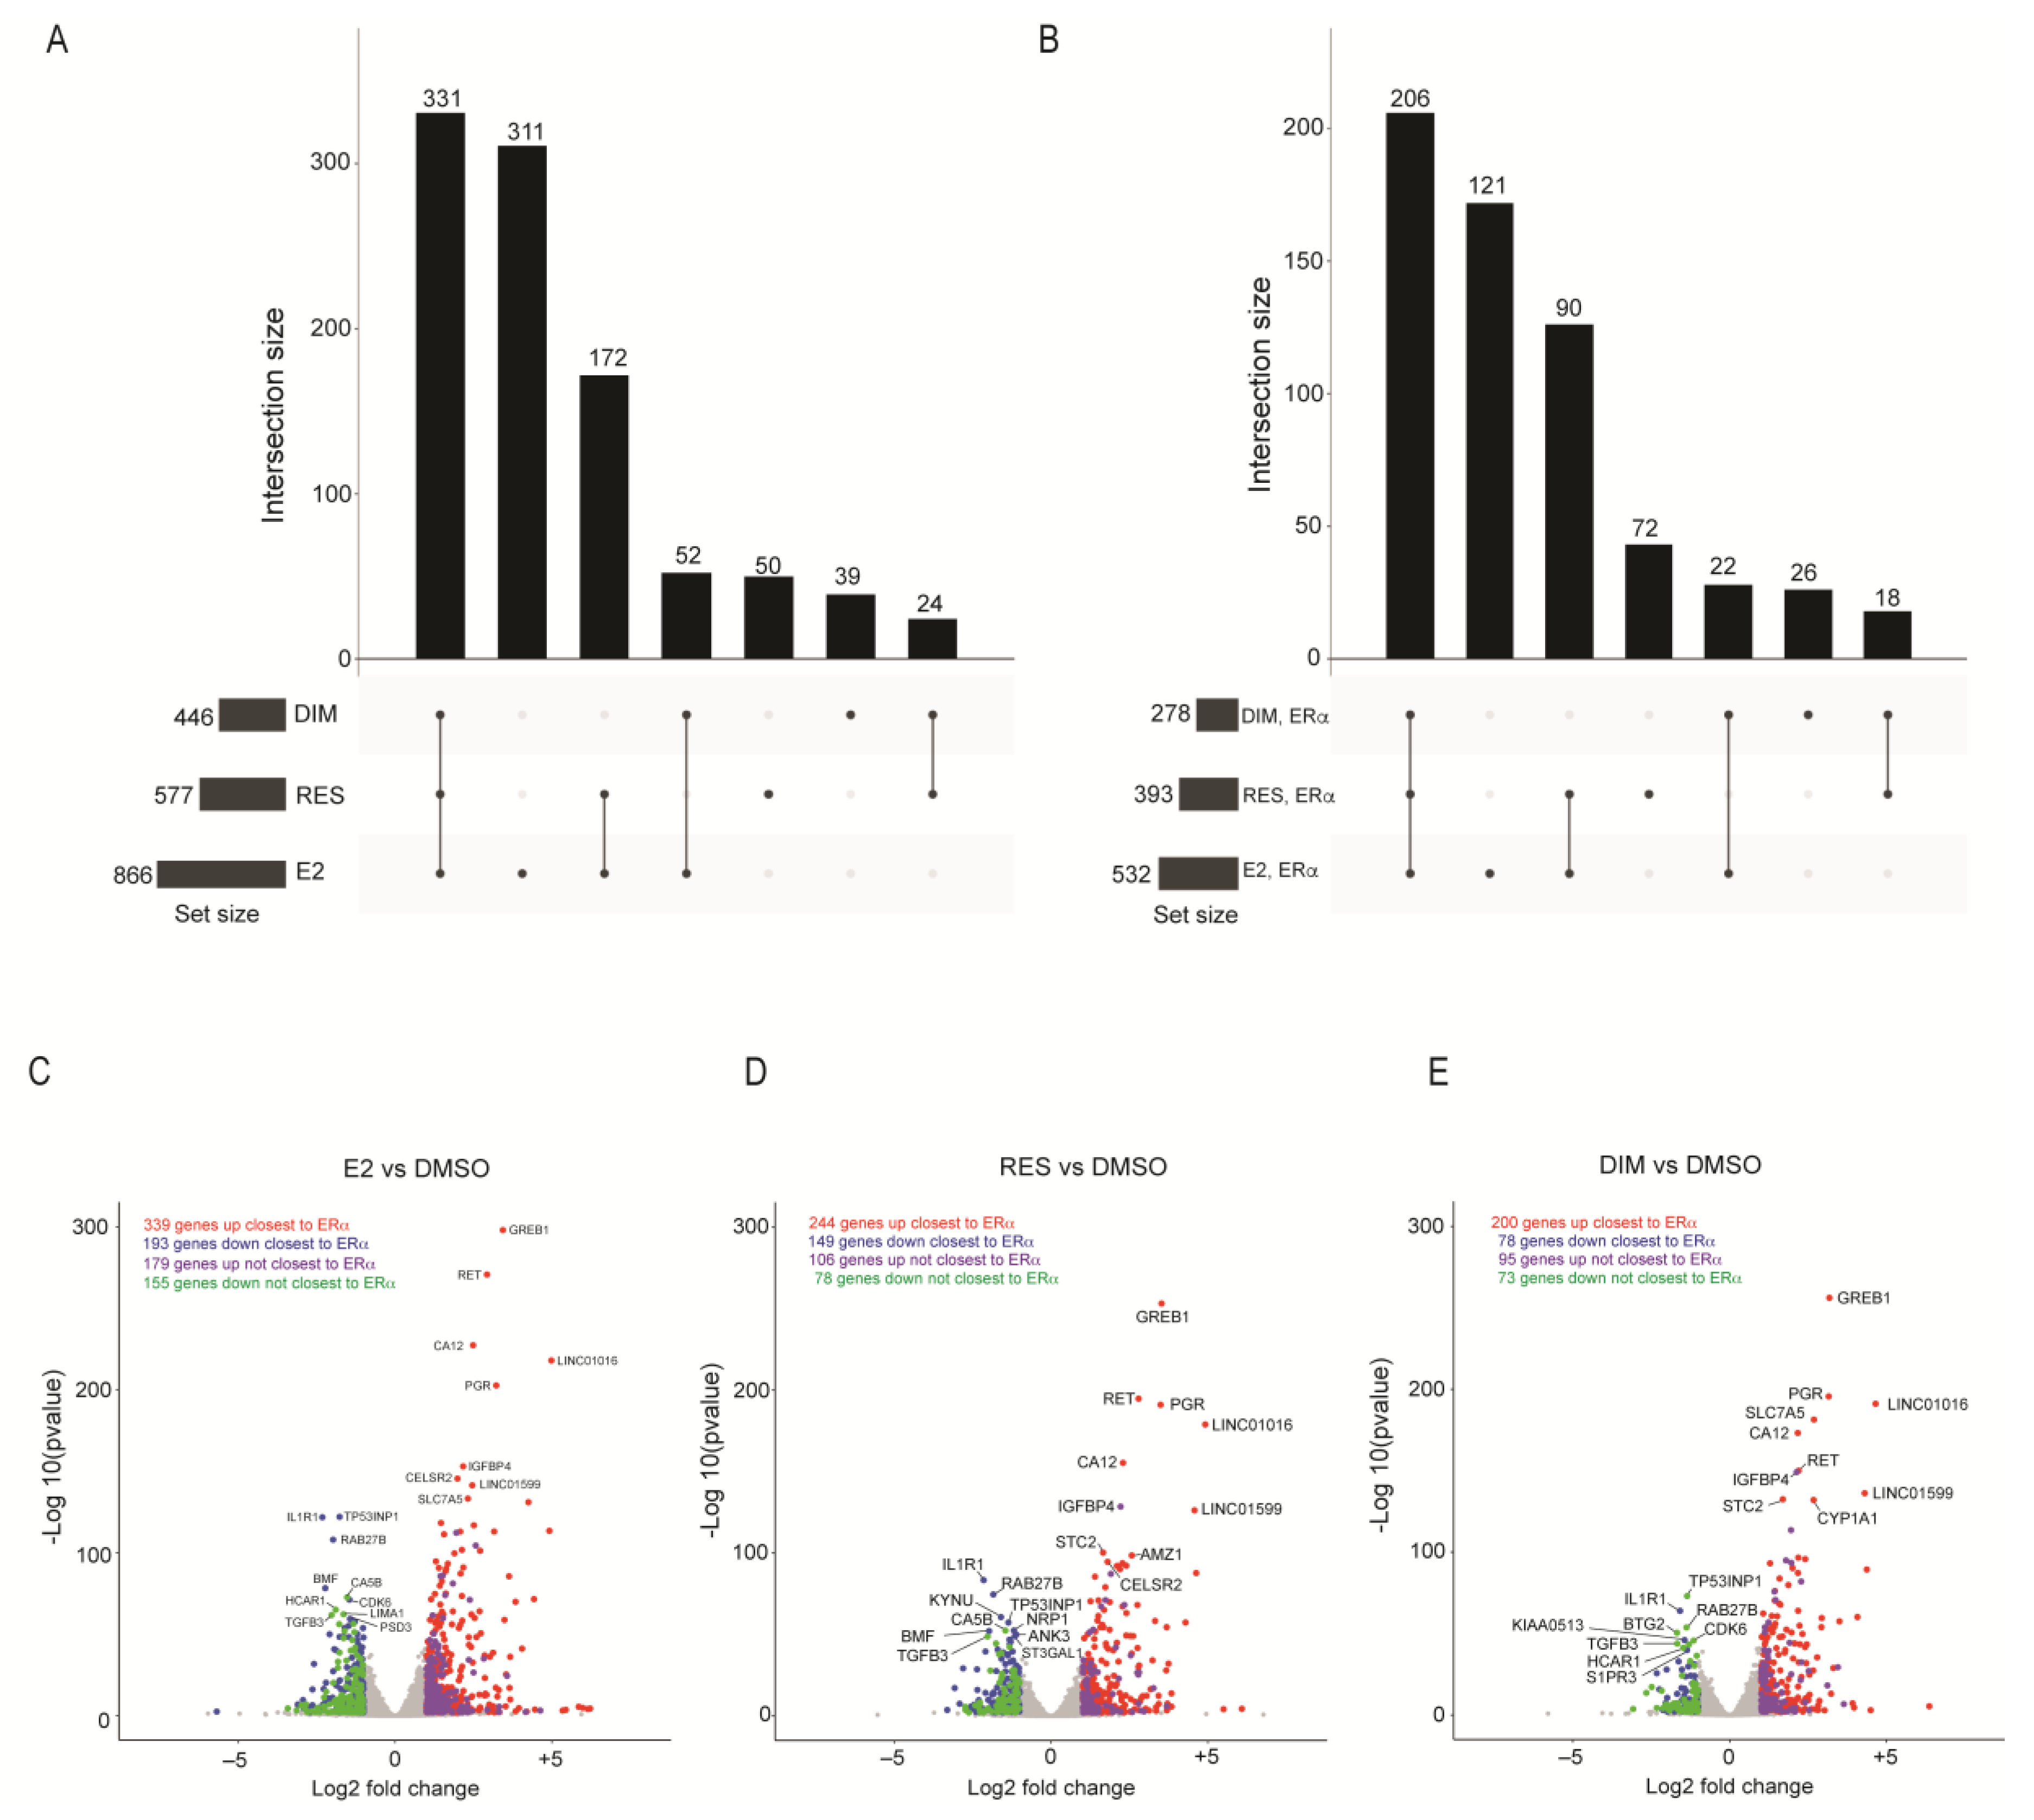
2.2. Transcriptomic Changes after E2, RES, or DIM Regulated by ERα
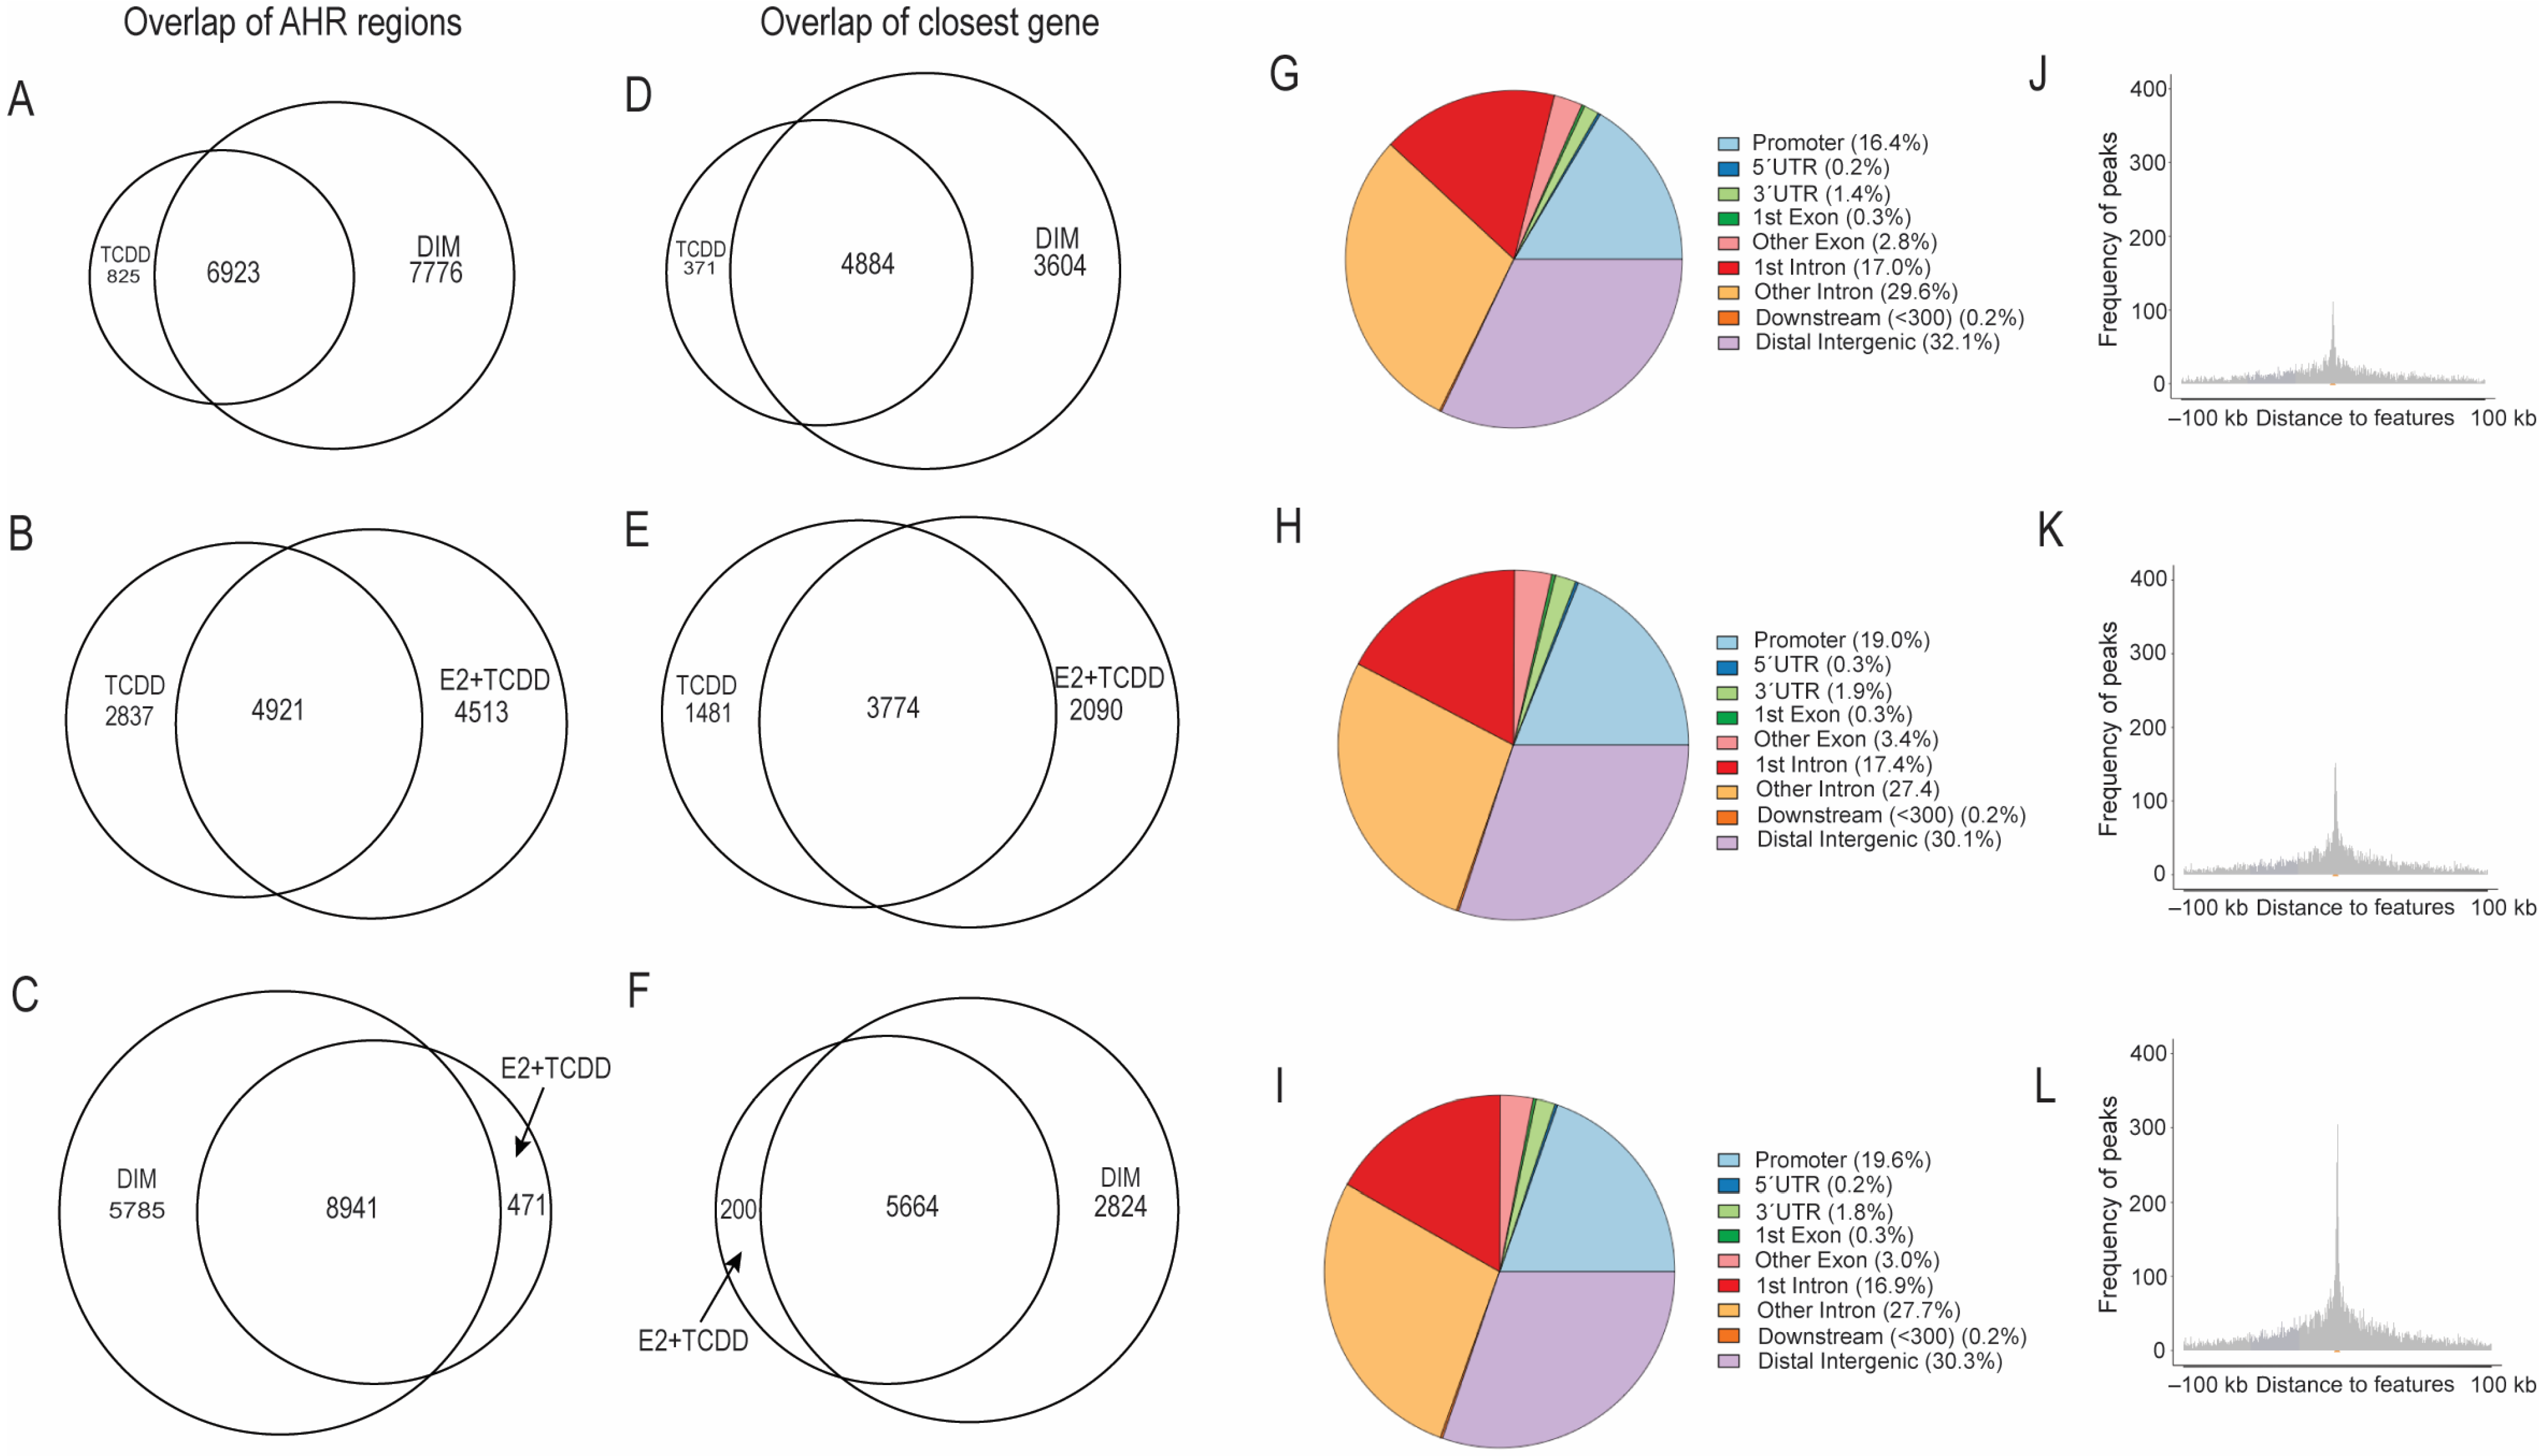
2.3. Comparison of AHR-Binding Profiles after Treatment with TCDD, E2+TCDD, RES, or DIM
2.4. Motif Analysis Using AHR Ligand-Enriched Sites after Treatment with TCDD, E2+TCDD, or DIM
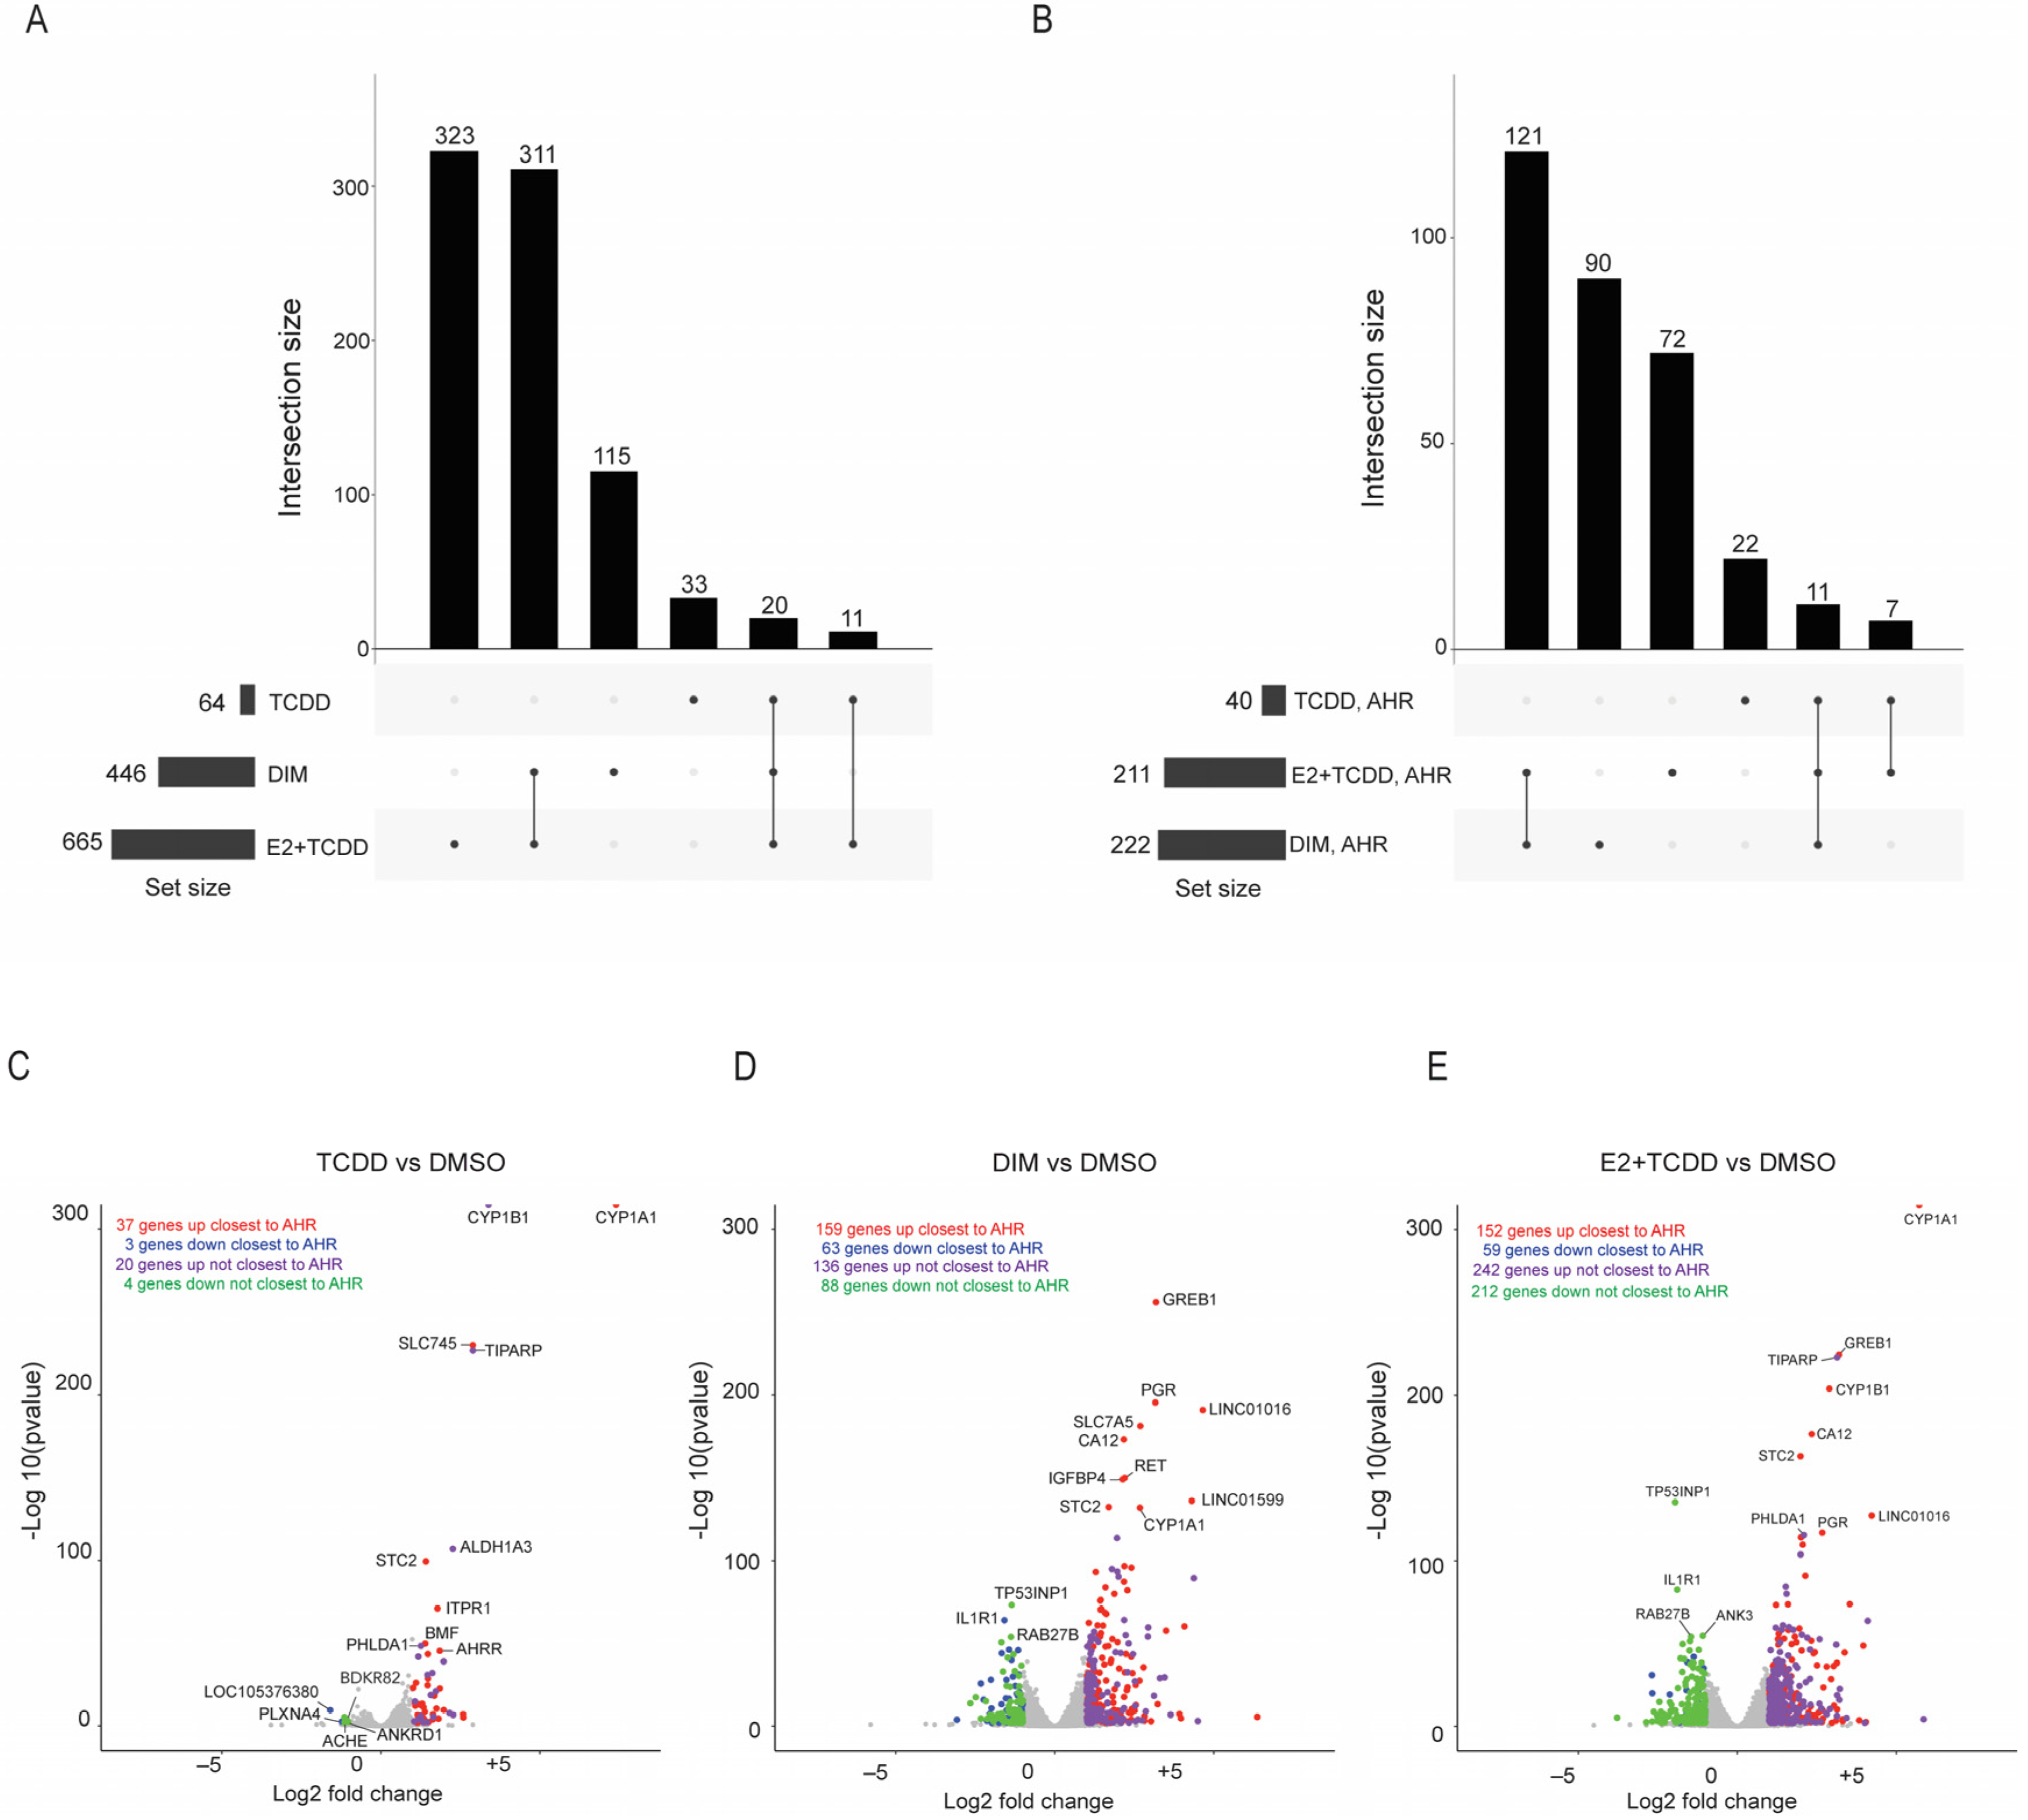
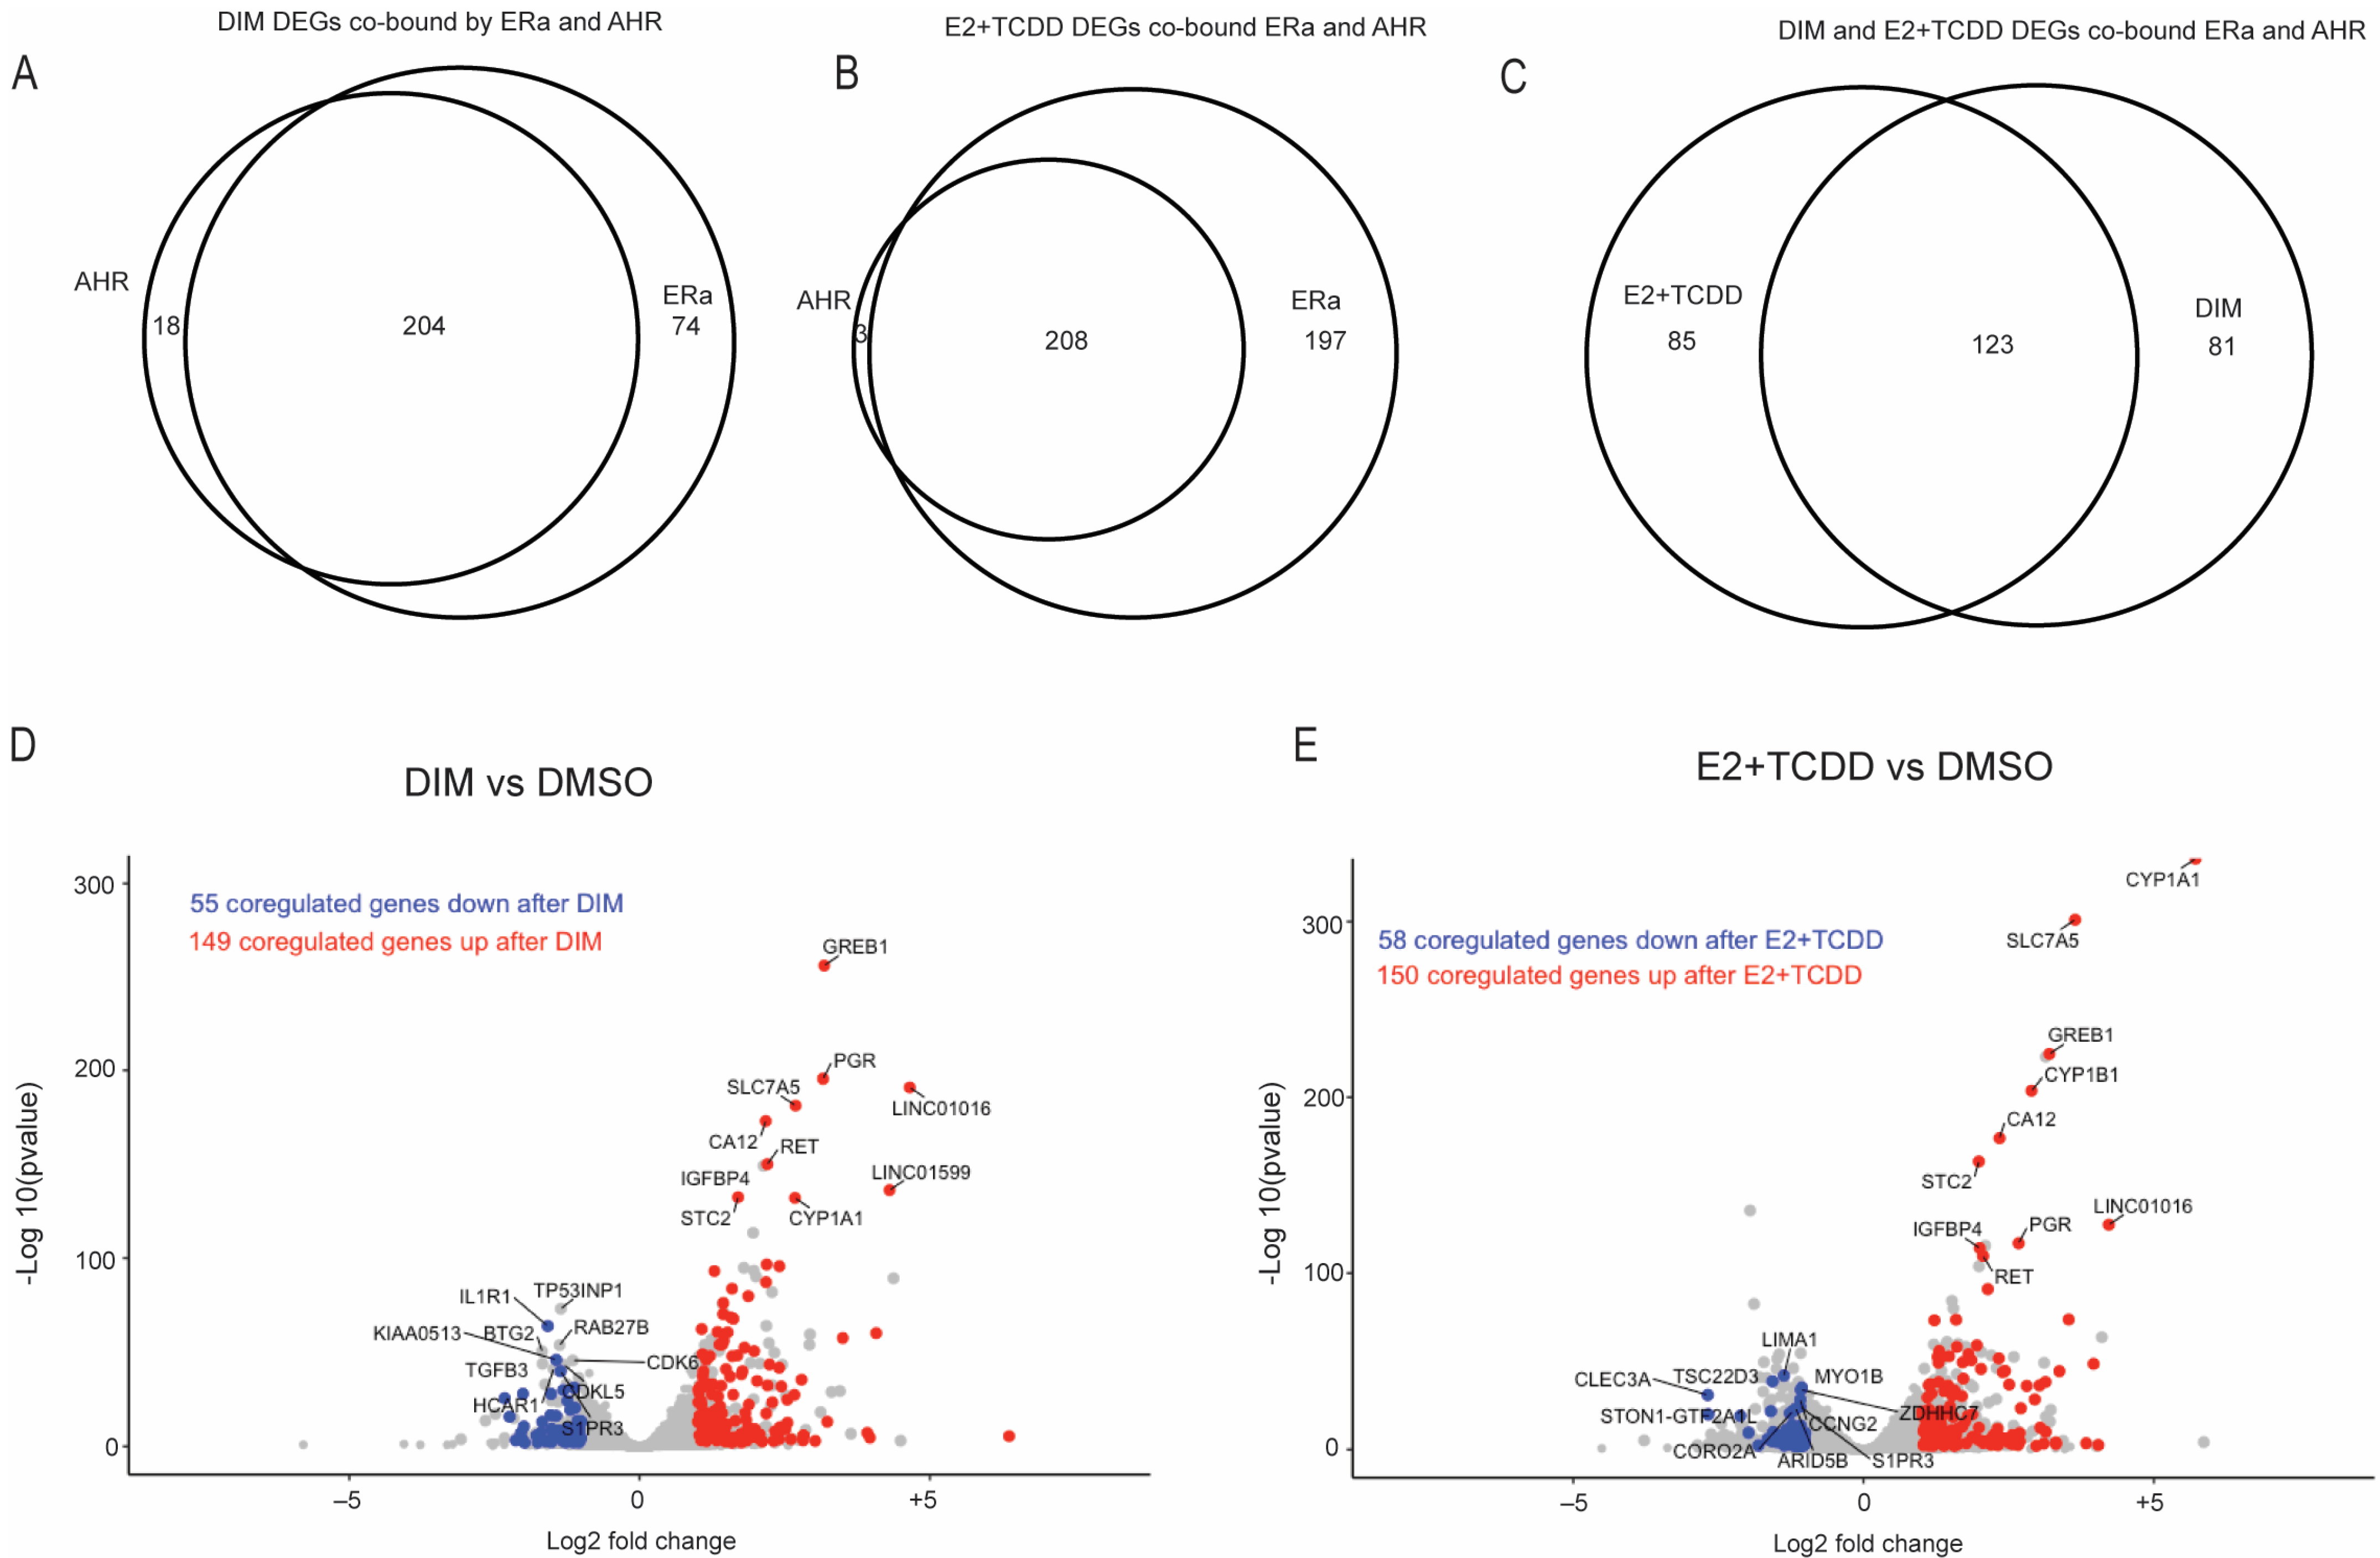
2.5. Comparison of Gene Expression Changes Induced after AHR Activation Compared to Coactivation of AHR and ERα via E2+TCDD and DIM
3. Discussion
4. Materials and Methods
4.1. Chemicals and Antibodies
4.2. Cell Culture
4.3. ChIP-Sequencing and Data Analysis
4.4. RNA Sequencing and Data Analysis
4.5. Enrichment Analysis for Differentially Expressed Genes
5. Conclusions
Supplementary Materials
Author Contributions
Funding
Institutional Review Board Statement
Informed Consent Statement
Data Availability Statement
Acknowledgments
Conflicts of Interest
References
- Ferlay, J.; Soerjomataram, I.; Dikshit, R.; Eser, S.; Mathers, C.; Rebelo, M.; Parkin, D.M.; Forman, D.; Bray, F. Cancer incidence and mortality worldwide: Sources, methods and major patterns in GLOBOCAN 2012. Int. J. Cancer 2015, 136, E359–E386. [Google Scholar] [CrossRef] [PubMed]
- Matthews, J.; Gustafsson, J.A. Estrogen signaling: A subtle balance between ERalpha and ERbeta. Mol. Interv. 2003, 3, 281–292. [Google Scholar] [CrossRef] [PubMed]
- Nilsson, S.; Gustafsson, J.A. Estrogen receptor transcription and transactivation: Basic aspects of estrogen action. Breast Cancer Res. 2000, 2, 360–366. [Google Scholar] [CrossRef] [PubMed]
- Hankinson, O. The aryl hydrocarbon receptor complex. Annu. Rev. Pharmacol. Toxicol. 1995, 35, 307–340. [Google Scholar] [CrossRef] [PubMed]
- Nebert, D.W.; Dalton, T.P.; Okey, A.B.; Gonzalez, F.J. Role of aryl hydrocarbon receptor-mediated induction of the CYP1 enzymes in environmental toxicity and cancer. J. Biol. Chem. 2004, 279, 23847–23850. [Google Scholar] [CrossRef] [PubMed]
- Ma, Q. Induction and superinduction of 2,3,7,8-tetrachlorodibenzo-rho-dioxin-inducible poly(ADP-ribose) polymerase: Role of the aryl hydrocarbon receptor/aryl hydrocarbon receptor nuclear translocator transcription activation domains and a labile transcription repressor. Arch. Biochem. Biophys. 2002, 404, 309–316. [Google Scholar] [PubMed]
- Safe, S.; Wormke, M. Inhibitory aryl hydrocarbon receptor-estrogen receptor alpha cross-talk and mechanisms of action. Chem. Res. Toxicol. 2003, 16, 807–816. [Google Scholar] [CrossRef]
- Matthews, J.; Wihlen, B.; Thomsen, J.; Gustafsson, J.A. Aryl hydrocarbon receptor-mediated transcription: Ligand-dependent recruitment of estrogen receptor alpha to 2,3,7,8-tetrachlorodibenzo-p-dioxin-responsive promoters. Mol. Cell Biol. 2005, 25, 5317–5328. [Google Scholar] [CrossRef]
- Kolluri, S.K.; Jin, U.H.; Safe, S. Role of the aryl hydrocarbon receptor in carcinogenesis and potential as an anti-cancer drug target. Arch. Toxicol. 2017, 91, 2497–2513. [Google Scholar] [CrossRef]
- Saito, R.; Miki, Y.; Hata, S.; Takagi, K.; Iida, S.; Oba, Y.; Ono, K.; Ishida, T.; Suzuki, T.; Ohuchi, N.; et al. Aryl hydrocarbon receptor in breast cancer-a newly defined prognostic marker. Horm. Cancer 2014, 5, 11–21. [Google Scholar] [CrossRef]
- Ahmed, S.; Valen, E.; Sandelin, A.; Matthews, J. Dioxin increases the interaction between aryl hydrocarbon receptor and estrogen receptor alpha at human promoters. Toxicol. Sci. 2009, 111, 254–266. [Google Scholar] [CrossRef] [PubMed]
- Matthews, J.; Gustafsson, J.A. Estrogen receptor and aryl hydrocarbon receptor signaling pathways. Nucl. Recept. Signal 2006, 4, e016. [Google Scholar] [CrossRef] [PubMed]
- Salehi, B.; Mishra, A.P.; Nigam, M.; Sener, B.; Kilic, M.; Sharifi-Rad, M.; Fokou, P.V.T.; Martins, N.; Sharifi-Rad, J. Resveratrol: A Double-Edged Sword in Health Benefits. Biomedicines 2018, 6, 91. [Google Scholar] [CrossRef] [PubMed]
- Athar, M.; Back, J.H.; Tang, X.; Kim, K.H.; Kopelovich, L.; Bickers, D.R.; Kim, A.L. Resveratrol: A review of preclinical studies for human cancer prevention. Toxicol. Appl. Pharmacol. 2007, 224, 274–283. [Google Scholar] [CrossRef] [PubMed]
- Mikstacka, R.; Baer-Dubowska, W.; Wieczorek, M.; Sobiak, S. Thiomethylstilbenes as inhibitors of CYP1A1, CYP1A2 and CYP1B1 activities. Mol. Nutr. Food Res. 2008, 52 (Suppl. S1), S77–S83. [Google Scholar] [CrossRef] [PubMed]
- Berman, A.Y.; Motechin, R.A.; Wiesenfeld, M.Y.; Holz, M.K. The therapeutic potential of resveratrol: A review of clinical trials. NPJ Precis. Oncol. 2017, 1, 35. [Google Scholar] [CrossRef] [PubMed]
- Ciolino, H.P.; Yeh, G.C. Inhibition of aryl hydrocarbon-induced cytochrome P-450 1A1 enzyme activity and CYP1A1 expression by resveratrol. Mol. Pharmacol. 1999, 56, 760–767. [Google Scholar] [PubMed]
- Macpherson, L.; Matthews, J. Inhibition of aryl hydrocarbon receptor-dependent transcription by resveratrol or kaempferol is independent of estrogen receptor alpha expression in human breast cancer cells. Cancer Lett. 2010, 299, 119–129. [Google Scholar] [CrossRef]
- Gehm, B.D.; McAndrews, J.M.; Chien, P.Y.; Jameson, J.L. Resveratrol, a polyphenolic compound found in grapes and wine, is an agonist for the estrogen receptor. Proc. Natl. Acad. Sci. USA 1997, 94, 14138–14143. [Google Scholar] [CrossRef]
- Levenson, A.S.; Gehm, B.D.; Pearce, S.T.; Horiguchi, J.; Simons, L.A.; Ward, J.E., 3rd; Jameson, J.L.; Jordan, V.C. Resveratrol acts as an estrogen receptor (ER) agonist in breast cancer cells stably transfected with ER alpha. Int. J. Cancer 2003, 104, 587–596. [Google Scholar] [CrossRef]
- Chottanapund, S.; Van Duursen, M.B.; Navasumrit, P.; Hunsonti, P.; Timtavorn, S.; Ruchirawat, M.; Van den Berg, M. Anti-aromatase effect of resveratrol and melatonin on hormonal positive breast cancer cells co-cultured with breast adipose fibroblasts. Toxicol. Vitr. 2014, 28, 1215–1221. [Google Scholar] [CrossRef] [PubMed]
- Bjeldanes, L.F.; Kim, J.Y.; Grose, K.R.; Bartholomew, J.C.; Bradfield, C.A. Aromatic hydrocarbon responsiveness-receptor agonists generated from indole-3-carbinol in vitro and in vivo: Comparisons with 2,3,7,8-tetrachlorodibenzo-p-dioxin. Proc. Natl. Acad. Sci. USA 1991, 88, 9543–9547. [Google Scholar] [CrossRef]
- Choi, H.J.; Lim, D.Y.; Park, J.H. Induction of G1 and G2/M cell cycle arrests by the dietary compound 3,3’-diindolylmethane in HT-29 human colon cancer cells. BMC Gastroenterol. 2009, 9, 39. [Google Scholar] [CrossRef]
- Hong, C.; Kim, H.A.; Firestone, G.L.; Bjeldanes, L.F. 3,3’-Diindolylmethane (DIM) induces a G(1) cell cycle arrest in human breast cancer cells that is accompanied by Sp1-mediated activation of p21(WAF1/CIP1) expression. Carcinogenesis 2002, 23, 1297–1305. [Google Scholar] [CrossRef] [PubMed]
- Licznerska, B.E.; Szaefer, H.; Murias, M.; Bartoszek, A.; Baer-Dubowska, W. Modulation of CYP19 expression by cabbage juices and their active components: Indole-3-carbinol and 3,3’-diindolylmethene in human breast epithelial cell lines. Eur. J. Nutr. 2013, 52, 1483–1492. [Google Scholar] [CrossRef] [PubMed]
- Yin, X.F.; Chen, J.; Mao, W.; Wang, Y.H.; Chen, M.H. A selective aryl hydrocarbon receptor modulator 3,3’-Diindolylmethane inhibits gastric cancer cell growth. J. Exp. Clin. Cancer Res. 2012, 31, 46. [Google Scholar] [CrossRef] [PubMed]
- Lo, R.; Matthews, J. The aryl hydrocarbon receptor and estrogen receptor alpha differentially modulate nuclear factor erythroid-2-related factor 2 transactivation in MCF-7 breast cancer cells. Toxicol. Appl. Pharmacol. 2013, 270, 139–148. [Google Scholar] [CrossRef] [PubMed]
- Carroll, J.S.; Liu, X.S.; Brodsky, A.S.; Li, W.; Meyer, C.A.; Szary, A.J.; Eeckhoute, J.; Shao, W.; Hestermann, E.V.; Geistlinger, T.R.; et al. Chromosome-wide mapping of estrogen receptor binding reveals long-range regulation requiring the forkhead protein FoxA1. Cell 2005, 122, 33–43. [Google Scholar] [CrossRef]
- Nwachukwu, J.C.; Srinivasan, S.; Bruno, N.E.; Parent, A.A.; Hughes, T.S.; Pollock, J.A.; Gjyshi, O.; Cavett, V.; Nowak, J.; Garcia-Ordonez, R.D.; et al. Resveratrol modulates the inflammatory response via an estrogen receptor-signal integration network. eLife 2014, 3, e02057. [Google Scholar] [CrossRef]
- Sun, R.X.; Chong, L.C.; Simmons, T.T.; Houlahan, K.E.; Prokopec, S.D.; Watson, J.D.; Moffat, I.D.; Lensu, S.; Linden, J.; P’ng, C.; et al. Cross-species transcriptomic analysis elucidates constitutive aryl hydrocarbon receptor activity. BMC Genom. 2014, 15, 1053. [Google Scholar] [CrossRef]
- Tucci, P.; Brown, I.; Bewick, G.S.; Pertwee, R.G.; Marini, P. The Plant Derived 3-3’-Diindolylmethane (DIM) Behaves as CB(2) Receptor Agonist in Prostate Cancer Cellular Models. Int. J. Mol. Sci. 2023, 24, 3620. [Google Scholar] [CrossRef] [PubMed]
- Beedanagari, S.R.; Bebenek, I.; Bui, P.; Hankinson, O. Resveratrol inhibits dioxin-induced expression of human CYP1A1 and CYP1B1 by inhibiting recruitment of the aryl hydrocarbon receptor complex and RNA polymerase II to the regulatory regions of the corresponding genes. Toxicol. Sci. 2009, 110, 61–67. [Google Scholar] [CrossRef]
- Honari, M.; Shafabakhsh, R.; Reiter, R.J.; Mirzaei, H.; Asemi, Z. Resveratrol is a promising agent for colorectal cancer prevention and treatment: Focus on molecular mechanisms. Cancer Cell Int. 2019, 19, 180. [Google Scholar] [CrossRef] [PubMed]
- Mgbonyebi, O.P.; Russo, J.; Russo, I.H. Antiproliferative effect of synthetic resveratrol on human breast epithelial cells. Int. J. Oncol. 1998, 12, 865–869. [Google Scholar] [CrossRef] [PubMed]
- Mohammadi-Bardbori, A.; Bengtsson, J.; Rannug, U.; Rannug, A.; Wincent, E. Quercetin, resveratrol, and curcumin are indirect activators of the aryl hydrocarbon receptor (AHR). Chem. Res. Toxicol. 2012, 25, 1878–1884. [Google Scholar] [CrossRef] [PubMed]
- Thomson, C.A.; Ho, E.; Strom, M.B. Chemopreventive properties of 3,3’-diindolylmethane in breast cancer: Evidence from experimental and human studies. Nutr. Rev. 2016, 74, 432–443. [Google Scholar] [CrossRef]
- Banerjee, S.; Kong, D.; Wang, Z.; Bao, B.; Hillman, G.G.; Sarkar, F.H. Attenuation of multi-targeted proliferation-linked signaling by 3,3’-diindolylmethane (DIM): From bench to clinic. Mutat. Res. 2011, 728, 47–66. [Google Scholar] [CrossRef] [PubMed]
- Li, J.J.; Sun, Z.J.; Yuan, Y.M.; Yin, F.F.; Bian, Y.G.; Long, L.Y.; Zhang, X.L.; Xie, D. EphB3 Stimulates Cell Migration and Metastasis in a Kinase-dependent Manner through Vav2-Rho GTPase Axis in Papillary Thyroid Cancer. J. Biol. Chem. 2017, 292, 1112–1121. [Google Scholar] [CrossRef]
- Huang, C.; Yi, H.; Zhou, Y.; Zhang, Q.; Yao, X. Pan-Cancer Analysis Reveals SH3TC2 as an Oncogene for Colorectal Cancer and Promotes Tumorigenesis via the MAPK Pathway. Cancers 2022, 14, 3735. [Google Scholar] [CrossRef]
- Li, K.M.; Todorovic, R.; Devanesan, P.; Higginbotham, S.; Kofeler, H.; Ramanathan, R.; Gross, M.L.; Rogan, E.G.; Cavalieri, E.L. Metabolism and DNA binding studies of 4-hydroxyestradiol and estradiol-3,4-quinone in vitro and in female ACI rat mammary gland in vivo. Carcinogenesis 2004, 25, 289–297. [Google Scholar] [CrossRef]
- Cavalieri, E.; Chakravarti, D.; Guttenplan, J.; Hart, E.; Ingle, J.; Jankowiak, R.; Muti, P.; Rogan, E.; Russo, J.; Santen, R.; et al. Catechol estrogen quinones as initiators of breast and other human cancers: Implications for biomarkers of susceptibility and cancer prevention. Biochim. Biophys. Acta 2006, 1766, 63–78. [Google Scholar] [CrossRef] [PubMed]
- Parkin, D.R.; Malejka-Giganti, D. Differences in the hepatic P450-dependent metabolism of estrogen and tamoxifen in response to treatment of rats with 3,3’-diindolylmethane and its parent compound indole-3-carbinol. Cancer Detect. Prev. 2004, 28, 72–79. [Google Scholar] [CrossRef] [PubMed]
- Langmead, B.; Salzberg, S.L. Fast gapped-read alignment with Bowtie 2. Nat. Methods 2012, 9, 357–359. [Google Scholar] [CrossRef] [PubMed]
- Li, H.; Handsaker, B.; Wysoker, A.; Fennell, T.; Ruan, J.; Homer, N.; Marth, G.; Abecasis, G.; Durbin, R.; 1000 Genome Project Data Processing Subgroup. The Sequence Alignment/Map format and SAMtools. Bioinformatics 2009, 25, 2078–2079. [Google Scholar] [CrossRef] [PubMed]
- Zhang, Y.; Liu, T.; Meyer, C.A.; Eeckhoute, J.; Johnson, D.S.; Bernstein, B.E.; Nusbaum, C.; Myers, R.M.; Brown, M.; Li, W.; et al. Model-based analysis of ChIP-Seq (MACS). Genome Biol. 2008, 9, R137. [Google Scholar] [CrossRef] [PubMed]
- Quinlan, A.R.; Hall, I.M. BEDTools: A flexible suite of utilities for comparing genomic features. Bioinformatics 2010, 26, 841–842. [Google Scholar] [CrossRef] [PubMed]
- Zhu, L.J.; Gazin, C.; Lawson, N.D.; Pages, H.; Lin, S.M.; Lapointe, D.S.; Green, M.R. ChIPpeakAnno: A Bioconductor package to annotate ChIP-seq and ChIP-chip data. BMC Bioinform. 2010, 11, 237. [Google Scholar] [CrossRef]
- Heinz, S.; Benner, C.; Spann, N.; Bertolino, E.; Lin, Y.C.; Laslo, P.; Cheng, J.X.; Murre, C.; Singh, H.; Glass, C.K. Simple combinations of lineage-determining transcription factors prime cis-regulatory elements required for macrophage and B cell identities. Mol. Cell 2010, 38, 576–589. [Google Scholar] [CrossRef]
- Bryne, J.C.; Valen, E.; Tang, M.H.; Marstrand, T.; Winther, O.; da Piedade, I.; Krogh, A.; Lenhard, B.; Sandelin, A. JASPAR, the open access database of transcription factor-binding profiles: New content and tools in the 2008 update. Nucleic Acids Res. 2008, 36, D102–D106. [Google Scholar] [CrossRef]
- Kim, D.; Paggi, J.M.; Park, C.; Bennett, C.; Salzberg, S.L. Graph-based genome alignment and genotyping with HISAT2 and HISAT-genotype. Nat. Biotechnol. 2019, 37, 907–915. [Google Scholar] [CrossRef]
- Anders, S.; Pyl, P.T.; Huber, W. HTSeq–A Python framework to work with high-throughput sequencing data. Bioinformatics 2015, 31, 166–169. [Google Scholar] [CrossRef]
- Love, M.I.; Huber, W.; Anders, S. Moderated estimation of fold change and dispersion for RNA-seq data with DESeq2. Genome Biol. 2014, 15, 550. [Google Scholar] [CrossRef]
- Yu, G.; Wang, L.G.; Han, Y.; He, Q.Y. clusterProfiler: An R package for comparing biological themes among gene clusters. OMICS J. Integr. Biol. 2012, 16, 284–287. [Google Scholar] [CrossRef]
- Liberzon, A.; Birger, C.; Thorvaldsdottir, H.; Ghandi, M.; Mesirov, J.P.; Tamayo, P. The Molecular Signatures Database (MSigDB) hallmark gene set collection. Cell Syst. 2015, 1, 417–425. [Google Scholar] [CrossRef]


| E2-Induced ERα-Bound Regions | DIM-Induced ERα-Bound Regions | RES-Induced ERα-Bound Regions | |
|---|---|---|---|
| Rank | Motif (JASPAR Eval) | Motif (JASPAR Eval) | Motif (JASPAR Eval) |
| 1 |  (ERE, 10−224) |  (ERE, 10−155) |  (ERE, 10−225) |
| 2 |  (NR1A1, 10−92) |  (AHRE, 10−110) |  (NR1A2, 10−105) |
| 3 |  (NR2F2, 10−81) |  (NR1A2, 10−69) |  (NR2F2, 10−77) |
| 4 |  (NR2F6, 10−60) |  (NR2F2, 10−57) |  (NR2F6, 10−68) |
| 5 |  (ESRRG, 10−52) |  (NR2F6, 10−39) |  (ESRRB, 10−58) |
| TCDD-Induced AHR-Bound Regions | DIM-Induced AHR-Bound Regions | E2+TCDD-Induced AHR-Bound Regions | |
|---|---|---|---|
| Rank | Motif (JASPAR Match, Eval) | Motif (JASPAR Match, Eval) | Motif (JASPAR Match, Eval) |
| 1 |  (AHRE, 10−320) |  (ERE, 10−160) |  (ERE, 10−199) |
| 2 |  (MCF7-FOXA1, 10−80) |  (AHRE, 10−159) |  (NR1A2, 10−84) |
| 3 |  (LNCAP-FOXA1, 10−77) |  (FRA1, 10−56) |  (NR1A2, 10−70) |
| 4 |  (FOXM1, 10−72) |  (FOSL2, 10−51) |  (NR2F2, 10−45) |
| 5 |  (FOXA2, 10−67) |  (FRA2, 10−51) | 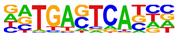 (FOSL2, 10−41) |
| AHR and ERα Overlapping Regions after E2+TCDD | AHR and ERα Overlapping Regions after DIM | |
|---|---|---|
| Rank | Motif (JASPAR Best Match, Eval) | Motif (JASPAR Best Match, Eval) |
| 1 |  (AHRE, 10−44) |  (AHRE, 10−64) |
| 2 | 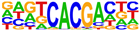 (Npas4, 10−16] |  (HIF1B, 10−17) |
| 3 |  (ERE, 10−13) |  (ERE, 10−15) |
| 4 |  (AP-2gamma (AP2)/TFAP2C, 10−12) |  (Npas4, 10−15) |
| 5 |  (HIF1B, 10−10) |  (AP-2gamma(AP2)/TFAP2C, 10−12) |
| Enrichment Term | Adj. p Value for E2+TCDD | Adj. p Value for DIM |
|---|---|---|
| External encapsulating structure | 0.00561 | 0.00126 |
| Microvillus membrane | 0.00763 | 0.00126 |
| Glycosaminoglycan binding | 0.00716 | 0.00120 |
| Skeletal system development | 0.00132 | 0.00120 |
| Endochondral bone morphogenesis | 0.00762 | 0.00483 |
| Tissue morphogenesis | 0.00467 | 0.00483 |
| Microvillus | 0.00680 | 0.00734 |
| Excretion | 0.00833 | 0.00775 |
| Response to corticosteroid | 0.00845 | 0.00775 |
Disclaimer/Publisher’s Note: The statements, opinions and data contained in all publications are solely those of the individual author(s) and contributor(s) and not of MDPI and/or the editor(s). MDPI and/or the editor(s) disclaim responsibility for any injury to people or property resulting from any ideas, methods, instructions or products referred to in the content. |
© 2023 by the authors. Licensee MDPI, Basel, Switzerland. This article is an open access article distributed under the terms and conditions of the Creative Commons Attribution (CC BY) license (https://creativecommons.org/licenses/by/4.0/).
Share and Cite
Das, S.; Somisetty, V.S.; Ulven, S.M.; Matthews, J. Resveratrol and 3,3′-Diindolylmethane Differentially Regulate Aryl Hydrocarbon Receptor and Estrogen Receptor Alpha Activity through Multiple Transcriptomic Targets in MCF-7 Human Breast Cancer Cells. Int. J. Mol. Sci. 2023, 24, 14578. https://doi.org/10.3390/ijms241914578
Das S, Somisetty VS, Ulven SM, Matthews J. Resveratrol and 3,3′-Diindolylmethane Differentially Regulate Aryl Hydrocarbon Receptor and Estrogen Receptor Alpha Activity through Multiple Transcriptomic Targets in MCF-7 Human Breast Cancer Cells. International Journal of Molecular Sciences. 2023; 24(19):14578. https://doi.org/10.3390/ijms241914578
Chicago/Turabian StyleDas, Siddhartha, Venkata S. Somisetty, Stine M. Ulven, and Jason Matthews. 2023. "Resveratrol and 3,3′-Diindolylmethane Differentially Regulate Aryl Hydrocarbon Receptor and Estrogen Receptor Alpha Activity through Multiple Transcriptomic Targets in MCF-7 Human Breast Cancer Cells" International Journal of Molecular Sciences 24, no. 19: 14578. https://doi.org/10.3390/ijms241914578
APA StyleDas, S., Somisetty, V. S., Ulven, S. M., & Matthews, J. (2023). Resveratrol and 3,3′-Diindolylmethane Differentially Regulate Aryl Hydrocarbon Receptor and Estrogen Receptor Alpha Activity through Multiple Transcriptomic Targets in MCF-7 Human Breast Cancer Cells. International Journal of Molecular Sciences, 24(19), 14578. https://doi.org/10.3390/ijms241914578